geomicrobiology journal quantitative 3-dimensional image
TRANSCRIPT

PLEASE SCROLL DOWN FOR ARTICLE
This article was downloaded by: [Rodenacker, Karsten][Helmholtz-Zentrum Muenchen]On: 1 March 2011Access details: Access Details: [subscription number 929139696]Publisher Taylor & FrancisInforma Ltd Registered in England and Wales Registered Number: 1072954 Registered office: Mortimer House, 37-41 Mortimer Street, London W1T 3JH, UK
Geomicrobiology JournalPublication details, including instructions for authors and subscription information:http://www.informaworld.com/smpp/title~content=t713722957
Quantitative 3-dimensional Image Analysis of Mineral SurfaceModifications—Chemical, Mechanical and BiologicalA. A. Gorbushinaab; A. Kempecd; K. Rodenackere; U. Jüttinge; W. Altermannf; R. W. Starkg; W. M.Heckld; W. E. Krumbeinb
a Freie Universität Berlin, and Department IV “Materials and Environment”, Federal Institute forMaterials Research and Testing (BAM), Berlin, Germany b AG Geomicrobiology, ICBM, Carl-von-Ossietzky Universität Oldenburg, Oldenburg, Germany c Science PR, München, Germany d Departmentof Earth & Environmental Sciences, Ludwig-Maximilians-Universität, München, Germany e HelmholtzZentrum München, German Research Center for Environmental Health (GmbH), Institute ofBiomathematics and Biometry, Neuherberg, Germany f Department of Geology, University of Pretoria,Pretoria, South Africa g Physics of Surfaces, Technische Universität Darmstadt, Darmstadt, Germany
Online publication date: 24 February 2011
To cite this Article Gorbushina, A. A. , Kempe, A. , Rodenacker, K. , Jütting, U. , Altermann, W. , Stark, R. W. , Heckl, W.M. and Krumbein, W. E.(2011) 'Quantitative 3-dimensional Image Analysis of Mineral Surface Modifications—Chemical,Mechanical and Biological', Geomicrobiology Journal, 28: 2, 172 — 184To link to this Article: DOI: 10.1080/01490451.2010.490077URL: http://dx.doi.org/10.1080/01490451.2010.490077
Full terms and conditions of use: http://www.informaworld.com/terms-and-conditions-of-access.pdf
This article may be used for research, teaching and private study purposes. Any substantial orsystematic reproduction, re-distribution, re-selling, loan or sub-licensing, systematic supply ordistribution in any form to anyone is expressly forbidden.
The publisher does not give any warranty express or implied or make any representation that the contentswill be complete or accurate or up to date. The accuracy of any instructions, formulae and drug dosesshould be independently verified with primary sources. The publisher shall not be liable for any loss,actions, claims, proceedings, demand or costs or damages whatsoever or howsoever caused arising directlyor indirectly in connection with or arising out of the use of this material.

Geomicrobiology Journal, 28:172–184, 2011Copyright © Taylor & Francis Group, LLCISSN: 0149-0451 print / 1521-0529 onlineDOI: 10.1080/01490451.2010.490077
Quantitative 3-dimensional Image Analysis of MineralSurface Modifications—Chemical, Mechanicaland Biological
A. A. Gorbushina,1,2 A. Kempe,3,4 K. Rodenacker,5 U. Jutting,5 W. Altermann,6
R. W. Stark,7 W. M. Heckl,4 and W. E. Krumbein2
1Freie Universitat Berlin, and Department IV “Materials and Environment”, Federal Institute forMaterials Research and Testing (BAM), Berlin, Germany2AG Geomicrobiology, ICBM, Carl-von-Ossietzky Universitat Oldenburg, Oldenburg, Germany3Science PR, Munchen, Germany4Department of Earth & Environmental Sciences, Ludwig-Maximilians-Universitat, Munchen, Germany5Helmholtz Zentrum Munchen, German Research Center for Environmental Health (GmbH), Institute ofBiomathematics and Biometry, Neuherberg, Germany6Department of Geology, University of Pretoria, Pretoria, South Africa7Physics of Surfaces, Technische Universitat Darmstadt, Darmstadt, Germany
Three principally different mechanisms contribute to the wear-down process of mineral aggregates in sedimentary environments:(1) mechanical abrasion by forces of wind and water and by floatingor saltating neighbouring grains, (2) chemical attack and dissolu-tion by fluids, and (3) physical bioerosion and chemical biocorro-sion. It is however, difficult to attribute the specific surface changesto specific environments and processes. Quartz sand grains fromsubaerial and subaquatic environments were analysed by atomicforce microscopy (AFM) for traces of natural and experimentalaeolian, aquatic and biological wear-down processes. Quantitativetopographical parameters of surface alterations were extractedfrom topography data by non-linear methods derived from digitalimage analysis. These parameters were examined by multivariatestatistic, yielding three well-distinguishable groups. Morphologi-cal surface alterations dominated by subaerial, subaquatic and bybiological impact could be differentiated. The method may also beused for the detection of aeolian, subaquatic, and biological modi-fication of sedimentary grains and rock surfaces in extraterrestrialenvironments, and for assessment of environmental damage onmonuments and buildings.
Keywords sediment grain corrosion, chemical grain pitting, biolo-logical grain pitting, aquatic grain corrosion, biopitting,weathering, surface analysis, nano-structure of grain andmineral surfaces
Received 1 August 2009; accepted 25 March 2010.The authors acknowledge support by DFG grants Kr 333/30-1,
Go 897/2-1,2 and BMBF grant 03G0709A.Address correspondence to A. A. Gorbushina, Free University of
Berlin and Federal Institute for Materials Research and Testing (BAM),Department IV Materials and Environment, Unter den Eichen 87, D-12205 Berlin, Germany. E-mail: [email protected]
INTRODUCTIONRock, mineral grains and idiomorphic crystal surfaces ex-
posed to atmosphere and climate are subject to biologically,chemically and physically induced morphological changes.Characteristic surface structures are generated this way, depend-ing on rock or mineral type, depositional setting, climatic con-ditions, exposure time, and the associated microbial colonisa-tion. The most characteristic and morphologically well definedare those structures produced through mechanical abrasion, byforces of wind, water or ice and by bulk sediment transportprocesses (Kuenen and Perdok 1962; Krinsley and Doornkamp1973 and references therein). The second characteristic but lesswell-defined process is that of purely chemical aggression ofwatery solutions on mineral surfaces resulting in crystallograph-ically oriented dissolution (Marshall 1987, e.g., and referencestherein) and possibly subsequent healing-precipitation patterns(compare Tietz 2006).
Among the emerging surface morphotypes (microrelief ormicromorphology) well-defined characteristic structures areproduced by epilithic and endolithic subaerial or subaquatic mi-crobial biofilms and networks (biodyction). Crater-shaped bio-pittings, bioerosion fronts, biochipping and exfoliation are themost prominent biogenic structures recorded on desert rocks andbuilding surfaces. Biopitting, however, occurs also in subaquaticsystems, on siliciclastic sedimentary grains (Brasier et al. 2006);on volcanic grains and lava (Furnes et al. 1999) and on carbon-ate or phosphate grains and rocks (Flugel 2004; Zhang and Pratt2008) and other minerals (Benzerara et al. 2005). It has beentraced throughout the entire geologic record of sedimentationand life, e.g., cortoidal clasts in Archean carbonates (Altermann
172
Downloaded By: [Rodenacker, Karsten][Helmholtz-Zentrum Muenchen] At: 12:51 1 March 2011

IMAGE ANALYSIS OF MINERAL SURFACE MODIFICATIONS 173
FIG. 1. (A) Cherty quartzite of the Ediacara Formation with about 20 microcolonies of black yeast etching biopits into the hard rock. Smooth surfaces exhibitpolishing through wind. (B) Enlarged surface area showing smooth rock, biofilm slime cover (EPS), colonies covered with EPS and dust particles and one colonyshowing individual cells of black yeast. (C) Two adjacent black yeast colonies with particles attached to EPS deeply incised into the rock. (D) Ediacara quartziteafter maceration with Eau de Javelle which eliminated almost all organic material of the rock boring black yeast.
and Herbig 1991), biocorroded pillow rims and hyloclastites(Furnes et al. 2004) or Archean cortoidal quartz grains (Brasieret al. 2006). Structures that modify the original relief of grains,minerals and rocks can thus be classified as biogenic or abio-genic structures.
Some examples of biopitting are illustrated in Figures 1 and 2,using SEM images of Ediacara rock samples and North Sea sandgrains. Biogeomorphogenetic changes of rock and soil surfaceswere described initially in the last century. Krumbein (1969)and Krumbein and Jens (1981) pioneered this work depictingmicrobial erosion and biopitting in the Negev desert (Israel).Danin and Garty (1983) described further examples of biopittingin the Negev desert. More recently the biocorrosion structuresgained importance as possibly traceable, fossilized leftovers of
ancient life on Earth, Mars and other planetary bodies, withinthe reach of robotic missions.
They were multiply and controversially discussed from re-cent and ancient terrestrial deposits and from different points ofview (e.g., Krumbein 2008; Altermann et al. 2009). The impor-tance of the role of microbiota and microbial mats in siliciclasticdeposits, influencing preservation of grain size and morphologyand of sedimentary structures, were recently emphasised byBrehm et al. (2005) and by Schieber et al. (2007 and referencestherein).
To the best of our knowledge, the term biogeomorphogen-esis was first used by the group of Viles and Goudie at Ox-ford (Viles 1988; Viles and Goudie 2000) to describe morpho-genetic surface changes caused by microbiota in the aquatic
Downloaded By: [Rodenacker, Karsten][Helmholtz-Zentrum Muenchen] At: 12:51 1 March 2011

174 A. A. GORBUSHINA ET AL.
FIG. 2. (A) North sea quartz grain with biofilm and cell network. (B) North sea quartz grain showing individual cells etching round and smooth structures. (C)Biopit produced on North Sea sand grain after maceration of the grain with Eau de Javelle. Clearly visible smooth bioetching and triangular cutting traces by grainto grain collisions. (D) Unetched sample with cell creating biopit. Above the cell an empty pit where a previous growth was washed out cut away by grain to graincontact. Triangular collision traces on surface visible.
and terrestrial environments. Krumbein and Gorbushina (1995),Gorbushina and Krumbein (2000) and Fuxing et al. (1993) haveapplied this concept to many different environments, partiallyheaded under the terms “Biokarst” and “Biopatina” (Krumbein2003). Staley et al. (1982) were the first to describe the morpho-genetic importance of black microcolonial fungi on rock sur-faces in the Mohave Desert. Gorbushina and Krumbein (2000)and Carter et al. (2001) simultaneously suggested that such in-vestigations of the biomorphogenetic potential of microbiotamay help to detect life or life remnants also in extraterrestrialenvironments. It is assumed, that traces of extinct living formson planets such as Mars, can probably be derived by the mod-elling of rock-surface changes initiated and created by e.g.,
endolithic microbial communities (Krumbein 2008; Altermann2009).
The main features approached in the present work are bio-pittings, as compared to pitting by wind and wave generatedgrain-to-grain collisions (Krumbein 1969; Krumbein and Jens1981; Krumbein et al. 1991, 1998; Gehrmann et al. 1988a;Gehrmann 1992; Gehrmann and Krumbein 1994; Steringer andKrumbein 1995, 1997; Eppard et al. 1996; Dornieden et al. 1997,2000; Gorbushina et al. 1993; Gorbushina and Krumbein 2000;Gorbushina et al. 1996, 2001; Kempe et al. 2004). Abiogeniccorrosion and mineral and grain surface modification has beenused much more widely then biopitting structures in the past, forpalaeoenvironment and palaeogeographic reconstruction (e.g.,
Downloaded By: [Rodenacker, Karsten][Helmholtz-Zentrum Muenchen] At: 12:51 1 March 2011

IMAGE ANALYSIS OF MINERAL SURFACE MODIFICATIONS 175
Fortuin 1984; Altermann 1986); and has been meticulously in-vestigated in nature and in laboratory experiments since at leastmid 20th century (e.g., Callieux 1952; Kuenen 1959a, 1959b;Krinsley and Doornkamp 1973; Whalley and Krinsley 1974,and references therein).
The term “pitting” as a synonym for smaller or larger crater-shaped cavities forming in many rocks and mineral grains is de-rived from “pit mining." The definition according to geologicalnomenclature is: “small indentation or depression left on a rocksurface as a result of some corrosive or eroding process such asetching or differential solution" (Bates and Jackson 1990). Wehave identified and defined biopitting as the sole source of thesecrater shaped cavities in many places, publications leading backto the Book of Moses (Levithicus), quoted by Krumbein andJens (1981). Krumbein (1969); Gehrmann et al. (1988a, 1988b)and others have now fully elaborated the processes of biologi-cal micro-, meso- and macropitting, as being caused mainly byendolithic and epilithic lichens and free living specialised mi-croorganisms (e.g., Geodermatophilus, Chroococcidiopsis andblack yeast-like rock fungi). Danin et al. (1982); Danin andGarty (1983) have substantially added to the knowledge on bio-pitting. On limestone and marbles biopitting, chipping, crack-ing and fissuring are frequently seen, of which the corrosionby biopitting dominates. Gehrmann et al. (1988a, 1988b) haveclassified these characteristic holes and cavities into three sizegroups namely (1) micro-, (2) meso- and (3) macropitting of therock or mineral grain surface.
Of these, both, micropits and mesopits were identified, uponmaceration, as produced by the activities of epilithic and en-dolithic lichen. The specific pitting pattern indicated by the pen-etration of bundles of hyphae (mesopits) as well as by individualhyphae (micropits) is clearly visible on the rock surface. Whenthe pits fuse, they may produce a kind of of alveolarization struc-ture on the surface, but of a significantly different morphologythen individual meso- or micropits (Krumbein 1969). In viewof the general importance of this biogenic process patterns atentative classification is given here:
1. Micropitting. In this case etching figures are observed thatcorrespond closely to the pencil etching described by min-eralogists. This type of pitting is discussed as chemical orbiological and describes deep vertical holes within miner-als, which resemble deep pencil incisions in soft material.The holes are very deep and disregard any crystal lattice ormineral cleavage structure (Civan 2006). They are caused byindividual cells and trichomes or mycelia of bacteria or fungiand are only visible under the scanning electron microscope.The diameter of these micropits is between 0.5 and 20 µm.The depths can reach several micrometers and even hundredsof micrometers in special cases.
2. Mesopitting. In this case chiefly etching figures of the fruit-ing bodies of endolithic lichens are dealt with. In some cases,also the “nap-shaped” grooves of cyanobacteria and/or algaeunderneath a crustose lichen film can form mesopits. They
form little pockets which, upon further biocorrosion or chem-ical weathering have the shapes of half-ellipsoids or lensoidalcavities. Fungal hyphae can be associated with this pittingtype as well. The diameter of the craters is usually between20–800 µm.
3. Macropitting. These are the typical pits and scars clearly vis-ible on many rocks, in various climates but especially in thespray zone of waves or in dew exposed desert environmentsand most importantly on many statues and marble monu-ments all around the Mediterranean but also on a smallerscale in e.g., Potsdam and other northern areas. A schematicmodel of pit formation has been published earlier (Krum-bein 1987). Here, we are dealing with the not yet sufficientlyanalysed fusion of several pits in which fractal physical pat-terns may also play an important role. Some of the macropitsare also derived from deeply incising epilithic lichen of ill-defined taxonomy. The macropits usually range in diameterfrom ∼1 mm to maximally 2 cm and depths between 1 and5 mm.
From the point of view of evolutionary biology and for exobi-ological considerations, the understanding of ancient, fossilisedbiopitting recorded from different types of rocks is important.Stroncik and Schmincke (2002, and references therein) brieflyreviewed microbial pitting in volcanic glass, related to palag-onitization, and mentioned that at the glass alteration interfacedue to glass palagonitization, tubular structures may be inter-preted as produced by endolithic microbial activity. Such pit-ting observed in ancient rocks, back to the Archean, consistof microtubules of up to 200 µm in length and up to 10 µmin diameter. However, in experiments, lithophilic or endolithicbacteria dissolving rock surfaces as a result of their metabolicprocess, in the search for nutrients and electron donors, pro-duce typical pitting of µm size, usually of shallow, irregular,saucer shaped morphology (e.g., Thorseth et al. 1995; Einen etal. 2004). The observed 1–9 µm diameter and up to 200 µmlong tubes in e.g., pillow rims and submarine volcanic rocks(hayloclastites, palagonite) (Furnes et al. 2004) are not an en-ergetically effective constellation for rock surface colonisa-tion, as bacterial colonies utilising the mineral substrate as thesource of food, should prefer to spread along a surface ratherthan “burrow” deep and narrow tubes into the rock, where theexchange with the environment would be ruled by capillaryphysics.
It has been suggested that such microtubules may repre-sent degassing and alteration (magma-water reaction) struc-tures in volcanic rocks, later occupied by microbial consortia(Altermann 2007). The problem of microbially produced mi-crotubules in ancient rocks and mineral grains seems thus notyet resolved.
Summarizing, biopitting is regarded as a biological pro-cess producing chemically and physically typical morphotypes,which are related to subaquatic or subaerial biofilm, madeof consortia of bacteria, cyanobacteria, free living fungi, and
Downloaded By: [Rodenacker, Karsten][Helmholtz-Zentrum Muenchen] At: 12:51 1 March 2011

176 A. A. GORBUSHINA ET AL.
lichens. It remains however difficult to differentiate biopittingand the various other surface alteration processes. Usually, mi-croscope images of the grain surface are used to infer thedominating process. So far, image interpretation is based on theexperience and knowledge of the scientist. To obtain additionalinformation on a more objective basis, statistical parameters arerequired that characterize the grain surface and its surface mor-phology. Such a statistical tool should allow one to discriminategrains from distinct environments.
To this end, we suggest a digital processing image approachbased on non-linear transformations. Input data are the three-dimensional relief as measured with an atomic force microscope(AFM). From this surface map we derive statistical parameters,which allow us to discriminate characteristic surface morpholo-gies. The work discussed here aims at differentiating betweenaeolian-physical, aquatic-physical, chemical and biogenic le-sions, produced on sand grains exposed to wind, water, and tobiological agents. Such a statistical data analysis procedure canhelp to derive a set of criteria to differentiate between the pro-cesses of mineral surface modifications. The main goal of thestudy was to apply statistically sound techniques to differentiatebetween images of biogenic and abiogenic surface changes inthe natural sedimentary environment.
MATERIAL AND METHODS
Sample LocationsSpanish Coast. Samples were taken from the playa area
between Zahora and Los Canos de Meca, Gibraltar, Spain. Theprominent outcropping rock in this area is a cross bedded ma-rine quartz sand-stone containing a fossil mollusc fauna. Sanddetritus from the rock forms a beach area, several hundred me-ters in width, that is structured in a subtidal (1), an intertidal (2)and a supratidal (3) zone. The subtidal zone is submersed at alltimes, thus only subject to aqueous erosion. The dominant typeof deposition is wave-ripple and current-ripple cross bedding. Inthe supratidal zone however, a seasonal lagoon is formed duringwinter time, that receives the directly precipitated rain fall andwater drained from the nearest surroundings. In how far salineand phreatic groundwater contribute to the lagoon formation isnot known.
The intertidal zone is regularly flooded at high tide and ex-posed to wind at low tide. In the intertidal zone sand grains aredeposited in a mixture of aeolian ripples and dunes and marineripple cross beds regularly superimposed but also eroding eachother. This complicated system is crosscut by fluvial channelsthat carry water from inland brackish pools to the waterlineand vice versa. The supratidal zone is subject only to aeolianinfluence and is occupied by aeolian sand dunes and coarserinterdune lag deposits. Occasional storm flooding of the lowareas during high tides however can not be ruled out. Sampleswere taken (1) from below the low tide waterline in the subtidalzone, called subaquatic, (2) from cross-bedded loose sand inthe intertidal zone, far from any channel structure, and (3) from
FIG. 3. Gibraltar beach area with 3 deposition zones (Lat: 36.1857N; Lon:6.0205W): (x1) subtidal/subaquatic, (x2) intertidal, (x3) supratidal/subaerial.Scalebar 100 m.
the top of a sand dune in the supratidal zone, called subaerial(Figure 3).
German North Sea coast. Samples were taken from the in-tertidal flats of the Wadden Sea between Wilhelmshaven andMellum (Krumbein et al. 1994, 2003). Microbial biofilm andmats cover extended areas in this shallow marine intertidal sys-tem. Due to the tidal cycle the water cover of the biofilm systemsusually is less than 6 hours twice a day. Fine, sand of a grain sizebetween 150 and 350 µm was selected for laboratory incubationin order to accelerate biofilm growth and potential microbial at-tack on sand grains (Brehm et al. 2005). Grains, which wereincubated with biofilm material, were compared to those keptunder sterile conditions under seawater cover. Data from this ex-periment are listed under Wadden, North Sea in Tables 1 and 3.
Specimen PreparationFrom each sample, grains with a shape that exhibited some
smooth spots at the micrometer scale and a shiny appearanceunder a low-power binocular were selected. The reason for this
TABLE 1Gathered digital image data from AFM with totally examined
area
TotalResolution Area
Code Type Location Images [nm/pixel] [µm2]
1 subaquatic Gibraltar 49 58.65 196002 intertidal Gibraltar 72 = 45 + 27 58.65 288003 subaerial Gibraltar 68 58.65 272004 Wadden North Sea 62 58.65/39.1 24800
Downloaded By: [Rodenacker, Karsten][Helmholtz-Zentrum Muenchen] At: 12:51 1 March 2011

IMAGE ANALYSIS OF MINERAL SURFACE MODIFICATIONS 177
selection that bears some danger of missing the most typical sur-faces, especially of mechanically abraded grains, was the effortto avoid highly rough surfaces that are difficult to access withan AFM (Kempe 2003). Previous investigations have shownhowever, that such risk can be minimised by careful selection(Kempe et al. 2004). Grains were glued with their roughest sideonto a copper wire, 10 mm long and 0.5 mm in diameter, withPattex gel superglue (Henkel, Dusseldorf, Germany) for solder-ing on a 1 cm x 1 cm copper sheath that was mounted on thescanning stage with a vacuum pump.
Sand grains were submersed for 5 min in 10% H2O2 solu-tion, one day after mounting, to remove all organic material.The specimens were rinsed with distilled water and cleaned inan ultrasonic bath for 5 min, then dried with a nitrogen gun.Specimens were stored in a exsiccator. Bending the wire pro-vided a freely accessible smooth side for topography imaging byAFM. Areas of interest were selected and rotated to the topmostposition. In the case of the Gibraltar samples smooth sides-, inthe case of the North Sea samples colonised areas were selected.The orientation of the specimen was kept constant after that toensure reproducibility.
Three-dimensional Imaging of Sand Grain TopographyFor each specimen the selected areas of interest and orien-
tation were realigned with help of the optical photograph. TheAFM-instrument is equipped with an integrated dissecting mi-croscope. With the aid of this tool representative “mechanical”and “biogenic smooth” lesions were selected for AFM imaging.Several AFM images were obtained on different spots withinthe area. Images were taken using a Veeco Atomic Force Mi-croscope Dimension (Veeco, Mannheim, Germany), equippedwith a tube-piezo scanner with a maximum planar range of100 µm in each of the planar (x, y) directions and a maximumvertical (z) range of 6.5 µm. The images were acquired util-ising the intermittent contact mode in air (using NCHRW-reexcoated and SSS-NCH cantilevers from Nanosensors, Neuchatel,Switzerland).
The choice of imaging condition, which was selected fromvarious tested AFM modes, produced the clearest images andcaused the least destruction of the cantilevers at the tappingmode. For each grain, square images with a 60 µm scan rangewere taken. The resolution was set to 1024 measure points perline. Since sand grains have relatively rough surfaces for AFMscanners, the scanning speed was limited to 10 µm/s, and thesize of the studied area was 60 × 60 µm2 or less, in 90% ofall specimens. The reason for this limitation is caused by thecurvature of the grain surface, the maximum amount of verticalextent of the relief increased as the analysed area increased.Scanning speeds faster than 10 µm/s would result in heightjumps of the cantilever and lateral distortions at steep relief fea-tures. The scanned images represent 3 dimensional, topographicmaps with a resolution of 58.5 and 39.1 nm/pixel. For analysis,the scanned images were tiled to 20 µm sized images. Each tiledimage was subjected to a first-order plane set correction (SPIP,Vers. 3, Imagemetrology, Horsholm, Denmark).
RESULTS
OverviewOnly a small but representative selection of the three micro-scopic techniques (LM, SEM, AFM) is depicted in Figures1 and 2. More and very characteristic structural and morpho-genetic implications may be derived from the literature givenin the introduction. As for the mechanical erosion patterns onmineral grain surfaces, it has to be noted, that crystal cleavagecharacteristics, even down to the Angstrom level of crystal lat-tices, show clear geometries and sharp angles either in relationto the crystal faces and classes or in relation to physical impactcomparable to cracks by bullets on walls of houses under warfire, hits by hammer and chisel or rapid and forceful grain tograin collision in wave motion or desert wind.
This is clearly visible in Figures 2c and 2d. Biopitting onthe other hand has either a specific jigsaw pattern or verysmooth borders often irrespective of and independent from thecrystal lattice and grain hardness. These very smooth alter-ation traces are clearly distinguishable from physical impactas seen in Figures 1 and 2. Very smooth and often wavy in-dentations near and around microorganisms or places wheremicroorganisms lived, are characteristic of chemical biopit-ting. Physical biopitting produces rather jigsaw like zigzagpatterns.
These microbially produced smooth, wavy or zigzagging pat-terns, at or near microbial attachment and penetration sites,reach orders of magnitude below the size of the microorganismproducing them. The visible traces (in SEM and AFM) reachlevels between 100 and 250 nm (Brehm et al. 2005). In thefollowing the focus is mainly on classification results and math-ematical approaches to nano- and microscale morphogeneticfeatures of surfaces which are not or rarely visually discrimi-natable. In order to quantify these morphological observationsand to develop objective criteria we discuss a mathematical pro-cedure to classify surface alterations from topographic AFMdata.
A typical microscope image based on topographic AFMdata is outlined in three different representations in Figure 4.The quantitative characterisation of such data is either object-oriented or synthetic. The first measures properties of beforehand defined and recognisable objects such as holes, mountains,saddles, the other models the surface by typically regular struc-tures under different scales. According to the large differencesof surface structures in occurrence and size of the samples, wehave applied only synthetic measurements and focus on struc-tures of 100 – 1000 nm spatial size only.
From visual observation of the samples, structures less than1µm in diameter cannot be defined or recognised as objects(see Figure 4). Typically synthetic measurements are appliedto residues of smoothing operations, so to say, an overlaidvariability. With other words, the image is dissociated into asmooth and a variable compartment similar to signal decom-position. From the latter quantitative features were extractedonly.
Downloaded By: [Rodenacker, Karsten][Helmholtz-Zentrum Muenchen] At: 12:51 1 March 2011

178 A. A. GORBUSHINA ET AL.
FIG. 4. AFM height map represented as intensity (A) with brightness showing height, pseudospatial or embossed (B) and rendered (C) images (C prepared withImageJ, (Rasband 2009) and ImageJ3D).
Image AnalysisTo extract this variable compartment, the variations, from
the surface, we applied non-linear transformations for a bettercontrol of sensitivity and to avoid edge effects, as follows. Letf be the original AFM height map:
• non-linear Gaussian (nlg) (Aurich and Weule 1995;Winkler et al. 1999)
fnlg = f − nlg(f, σx ; σy ; σz)
with standard deviation σx = σy = σ z = 120 nm ofsmoothing Gaussian in x; y; z and
• mean opening-closing (mathematical morphology)(Serra 1982; Rodenacker and Bengtsson 2003)
fOF = f − 1/2(f Br + fBr )
with Br equal to a spherical structural element of radius r =1000nm, opBr the closing (opBr = (op ⊕Br )�Br ) and opBr theopening operation (opBr = (op �Br ) ⊕Br ) for any operand op.The kernel sizes for smoothing, standard deviations σx;y;z fornlg and radius r for opening and closing were chosen related tothe considerations above.
The operation non-linear Gaussian is illustrated in Figure5 in intensity and in embossed versions. The height map is
Downloaded By: [Rodenacker, Karsten][Helmholtz-Zentrum Muenchen] At: 12:51 1 March 2011
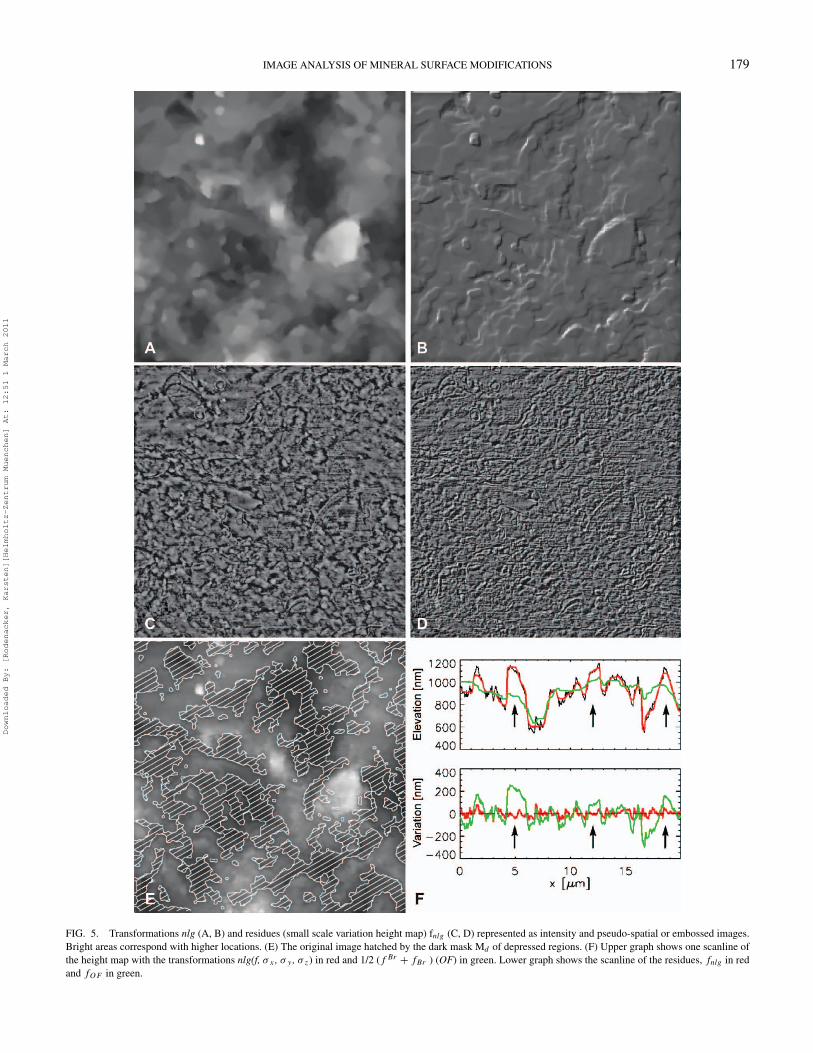
IMAGE ANALYSIS OF MINERAL SURFACE MODIFICATIONS 179
FIG. 5. Transformations nlg (A, B) and residues (small scale variation height map) fnlg (C, D) represented as intensity and pseudo-spatial or embossed images.Bright areas correspond with higher locations. (E) The original image hatched by the dark mask Md of depressed regions. (F) Upper graph shows one scanline ofthe height map with the transformations nlg(f, σx , σy , σz) in red and 1/2 (f Br + fBr ) (OF) in green. Lower graph shows the scanline of the residues, fnlg in redand fOF in green.
Downloaded By: [Rodenacker, Karsten][Helmholtz-Zentrum Muenchen] At: 12:51 1 March 2011

180 A. A. GORBUSHINA ET AL.
nlg (A, B) smoothed. The residues (C, D) show only small-scale variations and the absence of larger, deeper or higherstructures recognisable in Figure 4. In Figure 5F, one scan line isdisplayed with the respective transformations and residues. Thedifferent sizes of the smoothing kernels for nlg and morphologyare clearly visible (arrows). The upper graph shows one scanlineof the height map with the transformations nlg (f; σx; σy; σ z) inred and 1/2 (f Br + fBr ) (OF) in green. The lower graph showsthe scan line of the residues, fnlg in red and fOF in green.
FeaturesThe residue images fnlg and fOF are analysed by first-order
statistics for the whole region as well as for a partition of theimage into positive and negative altitudes called dark (Md =fOF < 0) and bright areas (Mb = fOF ≥0) (Rodenacker andBengtsson 2003). The dark area is outlined in Figure 5E hatched.This distinction allows the separate analysis of surface structurein sinks (valleys) and tops (mountains). Finally the residue ofnlg-transformation fnlg is analysed by local fractal analysis fFD
and multi-fractal dimension fMF (Sarkar and Chaudhuri, 1994).For each pixel a local fractal dimension is calculated.
From the three images original f , nlg residue fnlg andopening-closing residue fOF , the measures listed in Table 2were performed. Means (m1) and standard deviations (SD) (m2)from all points inside the area considered have dimension [nm].Features from dark and bright areas allow the differentiation ofsurface changes in valleys, depressed regions, the dark areas,and on mountains, the bright areas. Features from fnlg quantifythe very fine scale variations and features from fOF can reflectthe slightly larger variations. Compared to Kempe et al. (2004),where lineal structures were examined (object-oriented), onlyisotropic variability was measured in the here presented inves-tigations.
ClassificationFrom each of the 251 topological AFM images 16 features
were extracted. The data were grouped into 4 classes accord-ing to their sample location (supervised training approach). Bymeans of a stepwise linear discrimination analysis (LDA) the
TABLE 2List of extracted features with their abbreviated names
Name Description
m1, m2 mean, SD of fnlg (whole area)m1d, m2d mean, SD of fnlg (dark area, depressed regions)m1b, m2b mean, SD of fnlg (bright area, prominent regions)m1f, m2f mean, SD of fOF (whole area)m1fr, m2fr mean, SD of local fractal dimension (FD)m1mf, m2mf mean, SD of local multi-FDmo1d, mo2d mean, SD of AFM height map f (bright area)mo1b, mo2b mean, SD of AFM height map f (dark area)
most relevant features were selected to discriminate the definedclasses. All classification results were jack-knifed (hold one outprocedure) (procedures stepdisc, discrim, candisc, SAS V9.1.3,SAS Institute Inc., Carry, US). All statistical evaluations weredone at 95% confidence level.
The 4-class scheme (subaquatic, intertidal, subaerial, Wad-den) leads to unsatisfactory results. The subaquatic and intertidalsamples were not distinguishable from each other and the totalclassification result was unacceptable. Hence, the assumption ofsimilarity of the intertidal and the Wadden samples as partiallywatered specimen group could not be verified. Moreover, thedistance between the sample locations at the Spanish coast is sosmall that an exchange of sand grains by wind and/or water andoverprint of different processes could not be excluded. Hence, itwas assumed that intertidal specimens display a mixture of grainpatterns of subaquatic and subaerial origin. We have thus traineda 2-class classifier with the subaquatic and subaerial specimensonly. The selected features were m1b, m1d, m2mf and m2b,listed in decreasing importance. For feature descriptions, seeTable 2.
This classifier was applied to the intertidal specimens re-sulting in a distinction of 45 cases as subaquatic and 27 casesas subaerial. The statistical quality of this classification witha mean probability of 94% + 0.05 (range 73.7–100.0) forthe subaquatic specimens is nearly perfect. The mean valueof subaerial is 83.7% + 0.13 (range 54.6–99.6) was reason-able which strengthens our assumption that intertidal specimensconsist of two clusters similar to the subaquatic and subaerialspecimen groups. Hence, the classified subgroups of intertidalorigin were merged with the subaquatic and subaerial groupsrespectively (see Tables 1 and 3) named as subaquatic+ andsubaerial+.
The classification result in the 3-class case (subaquatic+,subaerial+, Wadden) is shown in Table 4. The most discrim-inative feature is m2b, the standard deviation of the higher(brighter) areas in fnlg , followed by the mean m1b of the sameand m1d, the mean of the prominent areas in fnlg . Seeminglythe most prominent regions of the surface (unhachted regionsin Figure 5E) are subject to the changes found as discrimi-natable. Only surface structures in the range of 120 nm (nlg
TABLE 3Analyzed (grouped) digital image data consisting of originalsubaquatic, subaerial and Wadden data combined with the
classified intertidal data (see Table 1)
TotalResolution Area
Code Type Location Images [nm/pixel] [µm2]
1 subaquatic+ Gibraltar 49 + 45 = 94 58.5 376003 subaerial+ Gibraltar 68 + 27 = 95 58.5 380004 Wadden North Sea 62 58.65/39.1 24800
Downloaded By: [Rodenacker, Karsten][Helmholtz-Zentrum Muenchen] At: 12:51 1 March 2011

IMAGE ANALYSIS OF MINERAL SURFACE MODIFICATIONS 181
TABLE 4Number of observations and percent classified into respective
classes (1 = subaquatic+, 3 = subaerial+, 4 = Wadden)
From Class 1 3 4 Total %
1 65 1 28 94 69.153 0 77 18 95 81.104 16 5 41 62 66.10
Total 251 72.90
transformation) showed differences. The overall classificationrate was 72.9%. The data points are plotted via the first andsecond canonical variables in Figure 6.
The latter represents the best view into the feature spaceunder all linear combinations of the measured features for dis-crimination of the three classes. It can be recognised that class3 (blue, subaerial+) can be discriminated best from the others.Class 1 (red, subaquatic+) and 4 (green) show a large overlap.The features and hence the scanned surfaces are more frequentsimilar to each other than to class 3. Assuming wind and hencegrain-to-grain interaction in the subaerial samples, and waterinfluence for the other groups let suspect that the main differ-ence in alterations on grain surfaces is water related. The size ofmagnitude of surface changes found important for discrimina-tion is nearly one less than the etch marks (Kempe et al. 2004)reflecting mechanical influences.
FIG. 6. Classification into the classes 1 (red, subaquatic+, Gibraltar), 3 (blue,subaerial+, Gibraltar) and 4 (green, Wadden, North Sea) with circles of variance1 and discrimination function.
DISCUSSIONMuch effort is needed in order to differentiate between indi-
vidual morphologies and morphotypes created on rock surfacesand mineral grain surfaces by different media and processes.The materials presented here are a first approach to quantita-tively measure and characterise wear down features of rock andmineral surfaces based on topographic AFM data. The ultimategoal is to create a database for differentiating between biogenicand abiogenic morphogenetic processes and the morphologi-cal patterns created by their course of action on the nanoscale.Whether these changes of mineral surfaces are biofilm productsor mere physical/chemical products is of high importance formany environments and technical methods.
Using mainly sand grains exposed to different erosive andcorrosive forces and pathways we mathematically characterisedthe deformations created by the individual processes. SEM-microphotographs serve as a general orientation, while AFM-micrographs were used for measurements and computing on thenano- to microscale. The analysis proves, that it ultimately willbe possible to assign certain sets of profiles and surface mor-phologies to biological, chemical or physical impact on mineralsurfaces. Of course, it should also be investigated at a laterstage, whether the recognised patterns depend on the corrod-ing medium alone or to some degree also on the mineralogy. Itcould be speculated that biological and physical processes leavetheir overlapping imprints at various proportions, in relationshipto the chemical and physical properties, crystallographic-lattice,and nutrient properties of particular minerals. Once this technol-ogy is further elaborated, it may be possible to analyse surfacesections of extraterrestrial rocks and minerals, even in outcrops,for ancient or extant biopitting activities as contrasted by imageanalyses to merely chemical or physical factors.
An essential feature for the separation of morphological al-terations under subaerial versus subaquatic conditions are thechanges in elevated surface areas (Figure 5E) and especiallythe positive changes in Figure 5. Consequently, however, thechanges in Figure 5D can only be attributed to the non-hatchedareas of Figure 5E. A general assumption is, that physical con-tact of grain to grain, must be more marked (sharp edges, tri-angular breaks) than the action of water (and other solvents)or of biological forces (chemical and physical). The empiricalfindings of Gehrmann (1992) and Krumbein (1969) correspondwell with this assumption as further elaborated by Sterflingerand Krumbein (1997). However, physical, i.e. mechanical ac-tion executed by biofilms (Dornieden et al. 2000) and combinedphysical and chemical action as documented by Brehm et al.(2005) may bridge the gap partially.
So far, only chemical action of microorganisms in biocorro-sion of mineral and rock material has been considered. Physicalor mechanical action of microorganisms was not expected to oc-cur. This smoothening or soft action is documented by our mea-surements on 100 nm scale. However, larger scale variationsof micromorphology as documented by Brehm et al. (2005),where even grain diminution and grain partitioning creating
Downloaded By: [Rodenacker, Karsten][Helmholtz-Zentrum Muenchen] At: 12:51 1 March 2011

182 A. A. GORBUSHINA ET AL.
smaller grain size distributions as compared to sterile controlswas demonstrated, so far remain outside our approach. On thenanometer scale, however, the results give concrete and en-couraging evidence of a standardised discrimination potentialregarding physical and chemical actions of microorganisms ascompared to pure physical and chemical actions of environmen-tal physics and chemistry. Life shapes differently as comparedto inanimate causes and products.
It is perhaps possible within the fractal (i.e., scale invari-ant) range to mathematically differentiate between the impactof non-living physical (sand grain and sand grain collision) orchemical (etching of crystal surfaces along the crystal lattice)attack and shaping of surfaces through microbial physical orchemical influences. These may perhaps be compared to theantique Greek and Roman sculpturing of statues where the im-pression of the elegant curvature of human body is geniallyachieved by artists. Smoothness and impact of living cells ortheir metabolic products certainly differ from meteorologicallyderived brutal impacts. Our data allow such differentiation atleast in the scale between 100 and 500 nanometers.
Nanotechnologies in material sciences and mineral explo-ration demand for careful optical and mathematical treatment ofmicromorphologies. The analytical technology of precise mea-surement and discrimination between biogenic and purely phys-ical/chemically produced transects across mineral grain surfacesis only in its infancy. It may however evolve into a powerfultool for industrial analysis of corrosion and biocorrosion andgeneral for interpretation of terrestrial and extraterrestrial geo-morphogenetic patterns versus biogeomorphogenetic ones. Thelatter will certainly give deeper insight into terrestrial geochem-ical and biogeochemical processes as well as to unravelling thehistory of sedimentary rocks. Moreover it can also serve as atool for extraterrestrial discriminants helping to define bordersand detect traces of life (Horneck et al. 2008; Krumbein 2008;Altermann 2009).
CONCLUSIONSIn this work we discuss a mathematical procedure to classify
surface alterations of rocks and mineral grains based on topo-graphic data obtained with an atomic force microscope. In a step-by-step approach from general imaging via light microscopy(LM), scanning electron microscopy (SEM) and finally, precisethree-dimensional atomic force microscopy (AFM) quantitativedata of the surface morphology is obtained. For classification,we suggest a set of image analytical methods to characterizemorphogenetic patterns on aquatic and terrestrial rock and min-eral surfaces. With this approach physical/chemical (etching andcollision) abrasion patterns can be differentiated from biologi-cal erosion and corrosion (grain diminution, biopitting). Thus,it is well possible to differentiate between surface changes dom-inated by subaerial, subaquatic and by biological impact. Themathematical approach might equally be used for the detectionof aeolian, subaquatic, and biological modification of sedimen-
tary grains and rock surfaces in terrestrial and extraterrestrialenvironments and for the investigations of environmental dam-age to sculptures, monuments and architectural constructions.
REFERENCESAltermann W. 1986. The Upper Paleozoic pebbly mudstone facies of Peninsular
Thailand and Western Malaysia—Continental margin deposits of Paleoeura-sia. Geol Rdsch 75(2):79–89.
Altermann, W. 2007. The early Earth’s record of enigmatic cyanobacteria andsupposed extremophilic bacteria at 3.8 to 2.5 Ga. In. J Seckbach (Ed), Algaeand Cyanobacteria in Extreme Environments. Cellular Origin, Life in ExtremeHabitats and Astrobiology (COLE) 11, Dordrecht: Springer Verlag. P 759–778.
Altermann W. 2009. Introduction to from fossils to astrobiology—A roadmapto a fata morgana? In J. Seckbach and M. Walsh (eds.), From Fossils toAstrobiology, volume 12 of COLE, pp. xv–xxvii. Springer: Dordrecht.
Altermann W, Bohmer C, Gitter F, Heimann F, Heller I, Lauchli B, Putz C. 2009.Defining biominerals and organominerals. direct and indirect indicators oflife. Discussion. Sediment Geol 213:150–151.
Altermann W, Herbig H-G. 1991. Tidal at deposits of the lower ProterozoicCampbell Group along the southwestern margin of the Kaapvaal craton,Northern Cape Province, South Africa. J Afr Earth Sci 13:415–435.
Aurich V, Weule J. 1995. Non-linear Gaussian filters performing edge preservingdiffusion. In Proc. 17. DAGM-Symposium. Springer, Bielefeld, 10: 538–545.
Bates RL, Jackson JA. (eds) 1990. Glossary of Geology. New York: AmericanGeological Institute, Virginia, 788p.
Benzerara K, Hyun Yoon T, Menguy N, Tyliszczak T, Brown G. 2005. Nanoscaleenvironments associated with bioweathering of a Mg-Fe pyroxene. In Pro-ceedings of the National Academy of Sciences of the United States of America(PNAS) 102:979–982.
Brasier M, McLoughlin N, Green O, Wacey D. 2006. A fresh look at thefossil evidence for early Archean cellular life. Phil Trans Roy Soc 361(B):887–902.
Brehm U, Gorbushina AA, Mottershead D. 2005. The role of microorganismsand biofilms in the breakdown and dissolution of quartz and glass. Palaeo-geogr Palaeoclimat Palaeoecol 219:117–129.
Cailleux A. 1952. Morphoskopische Analyse der Geschiebe und Sandkornerund ihre Bedeutung fur die Palaoklimatologie. Geol Rundsch 40:11–19.
Carter NEA, Naylor LA, Viles HA. 2001. Biogeomorphology revisited: presentand future pathways for understanding the relationships between organismsand the landscape. In: R. G. Society (ed.), Royal Geographical Society/Institute of British Geographers Annual Conference, Abstracts. Plymouth. P116.
Civan F. 2006. Pitting during crystal dissolution: Modeling and analysis. Ency-clopedia of Surface and Colloid Science. Taylor and Francis, New York.
Danin G, Garty J. 1983. Distribution of cyanobacteria and lichens on hillsides ofthe Negev highlands and their impact on biogenic weathering. Z GeomorphNF 27:423–444.
Danin G, Gerson R, Marton K, Garty J. 1982. Patterns of limestone and dolomiteweathering by lichens and blue-green algae and their palaeoclimatic signifi-cance. Palaeogeogr Palaeoclimatol Palaeoecol 37:221–233.
Dornieden T, Gorbushina AA, Krumbein WE. 1997. Anderungen der physikalis-chen Eigenschaften von Marmor durch Pilzbewuchs. Int J Restor BuildingsMonuments 3:441–456.
Dornieden T, Gorbushina AA, Krumbein WE. 2000. Patina- physical and chem-ical interactions of sub-aerial biofilms with objects of art. In: O. Ciferri, G.Mastromei, and P. Tiano (eds.), Of Microbes and Art. The role of microbialcommunities in the degradation and protection of cultural heritage. Kluwer,Dordrecht. P 105–119.
Einen J, Krober C, Ovreas L, Thorseth I, Torsvis T. 2004. Biodegradationof basaltic glass—An experimental approach. In International Workshop inGeomicrobiology “A Reserach Area in Progress,” Program and Abstract Vol.,Univ. Aarhus, Denmark. P 55.
Downloaded By: [Rodenacker, Karsten][Helmholtz-Zentrum Muenchen] At: 12:51 1 March 2011

IMAGE ANALYSIS OF MINERAL SURFACE MODIFICATIONS 183
Eppard, M., Krumbein, W. E., Koch, C., Rhiel, E., Staley, J., and Stackebrandt,E. 1996. Morphological, physiological and molecular biolocal investigationon new isolates similar to the genus geodermatopilus (actinomycetes). ArchMicrobiol 166:12–22.
Flugel E. 2004. Microfacies of carbonate rocks: analysis, interpretation andapplication. Springer, Berlin, Heidelberg, New York. 976 pp.
Fortuin AR. 1984. Late Ordovician glaciomarine deposits (Orea shale) in theSierra de Albarracin, Spain. Palaeogeography Palaeoclimat Palaeoecol (3-Papaeo) 48:245–261.
Furnes H, Banerjee N, Muehlenbachs K, Staudigel H, de Wit MJ. 2004. Earlylife recorded in Archean pillow lavas. Science 304:578–581.
Furnes H, Muehlenbachs K, Tumyr O, Torsvik T, Thorseth IH. 1999. Depth ofactive bio-alteration in the ocean crust: Costa Rica Rift (hole 504b). TerraNova 11:228–233.
Fuxing W, Junfa CJH, Jing JLHJW. 1993. Biocarst. Geol. Publ. House, Beijing.Gehrmann CK. 1992. Endolithic lichens and the corrosion of carbonate rocks -
a study of biopitting. Int J Mycol Lichenol 5:37–48.Gehrmann CK, Krumbein WE. 1994. Interactions between epilithic and en-
dolithic lichens and carbonate rocks. In HF Ott and F Zezza (eds.), Proc. 3rdInt. Conf. on the conservation of monuments in the Mediterranean Basin,Soperintendanza ai Beni Artistici e Storice, Venice. P 311–316.
Gehrmann CK, Krumbein WE, Petersen K. 1988a. Lichen weathering activitieson mineral and rock surfaces. Studia Geobotanica 8:33–45.
Gehrmann CK, Petersen K, Krumbein WE. 1988b. Silicole and calcicolelichens on Jewish tombstones–Interactions with the environment and bio-corrosion. In Vith International Congress on Deterioration and Conservationof Stone, 12.-14.09.1988, pp. 33-38, Nicolas Copernicus University, Torun,Poland.
Gorbushina AA, Boettcher M, Brumsack H-J, Krumbein WE, Vendrell-SazM. 2001. Biogenic forsterite and opal as a product of biodeterioration andlichen stromatolite formation in table mountain systems (tepuis) of Venezuela.Geomicrobiol J 18:1–17.
Gorbushina AA, Krumbein WE. 2000. Subaerial microbial mats and their effectson soil and rock. In RE Riding and SM Awramik (eds.), Microbial Sediments.Springer, Berlin. P 161–170.
Gorbushina AA, Krumbein WE, Panina L, Soukharjevsk S, Wollenzien U. 1993.On the role of black fungi in colour change and biodeterioration of antiquemarbles. Geomicrobiol J 11:205–221.
Gorbushina AA, Krumbein WE, Vlasov D. 1996. Biocarst cycles on monumentsurfaces. In R. Pancella (ed.), Preservation and restoration of cultural heritage.Proceedings of the 1995 LPC Congress, EPFL, Lausanne. P 319–322.
Hoffland E, Kuyper TW, Wallander H, Plassard C, Gorbushina AA, Hasel-wandter K, Holmstrom S, Landeweert R, Lundstrom US, Rosling A, SenR, Smits MM, van Hees PAW, van Breemen N. (2004) The role of fungi inweathering. Front Ecol Environ 2(5):258–264.
Horneck G, Stoffler D, Ott S, Hornemann U, Cockell C, Moeller R, Meyer C,de Vera J, Fritz J, Schade S, Artemieva NA. 2008. Microbial rock inhabi-tants survive hypervelocity impacts on Mars-like host planets: First phase oflithopanspermia experimentally tested. Astrobiology 8:17–44.
Kempe, A. 2003. Entwicklung einer neuen Praparationsmethode und Un-tersuchung verkieselter Mikrofossilien des Prakambriums mit Hilfe derRasterkraft- und Elektronenmikroskopie. PhD thesis, LMU Munchen:Fakultat fur Geowissenschaften.
Kempe A, Jamitzky F, Altermann W, Baisch B, Markert T, Heckl M. 2004.Discrimination of aqueous and aeolian paleoenvironments by atomic forcemicroscopy—A database for the characterization of martian sediments. As-trobiology 4:51–64.
Krinsley D, Doornkamp JC. 1973. Atlas of Quartz Sand Surface Textures.Cambridge University Press, Cambridge, UK.
Krumbein WE. 1969. Uber den Einfluss der Mikroflora auf die exogene Dy-namik (Verwitterung und Krustenbildung). Geol Rdsch 58:333–363.
Krumbein WE. 1987. Die Entdeckung inselbildender Mikroorganismen. In: GGerdes, WE Krumbein, and H-E Reineck (eds.), Mellum - Portrait einer Insel.Kramer, Frankfurt am Main.
Krumbein WE. 2003. Patina and cultural heritage - a geomicrobiologist’s per-spective. In: R. Kozlowski (ed.), Proceedings of the Vth EC ConferenceCultural Heritage Research: A Pan-European Challenge, Krakow. EC andISC. P 39–47.
Krumbein WE. 2008. Biogenerated rocks and rock structures. Space Sci Rev135:81–94.
Krumbein WE, Gorbushina AA. 1995. On the interaction of water repellenttreatments of building surfaces with organic pollution, micro organisms andmicrobial communities. In: F Wittmann, T Siemes, L Verhoef (eds), Surfacetreatment of building materials with water repellent agents. Delft Universityof Technology, Delft. P 29-1–29-10.
Krumbein WE, Gorbushina AA, Palinska KA, Sterflinger K. 1998. The para-doxon of glass. stability and decay; biological deterioration and transfor-mation; conservation and restoration. In: R Lefevre and I Pallot-Froissard(eds.), Les Materiaux Vitreux: Verre et Vitraux. Edipuglia, Bari. P 107–124.
Krumbein WE, Jens K. 1981. Biogenic rock varnishes of the Negev desert (Is-rael) an ecological study of iron and manganese transformation by cyanobac-teria and fungi. Oecologia 50:25–38.
Krumbein WE, Paterson DM, Zavarzin GA (Eds.), GAZ. 2003. Fossil andRecent Biofilms—A natural history of Life on Earth. Kluwer AcademicPublishers, Dordrecht.
Krumbein WE, Paterson DM, Stal LJE. 1994. Biostabilization of Sediments.BIS-Verlag, Oldenburg, 529p.
Krumbein WE, Urzi CE, Gehrmann C. 1991. On the biocorrosion and biodete-rioration of antique and mediaeval glass. Geomicrobiol J 9:139–160.
Kuenen Ph.H. 1959a. Experimental abrasion 3. Fluviatile action on sand: Am JSci 257:172–190.
Kuenen Ph.H. 1959b. Sand—Its origin, transportation and accumulation. Geol.Soc. S. Africa, Alexandre du Toit memorial Lecture, no 6, 33p.
Kuenen PhH. Perdok WG. 1962. Experimental abrasion 5. Frosting and defrost-ing of quartz grains. J. Geol 70:648–658.
Marshall JR. (edit.) 1987. Clastic Particles: Scanning Electron Microscopy andShape Analysis of Sedimentary and Volcanic Clasts. Van Nostrand-Reinhold,New York, 347pp.
Rasband WS. 1997–2009. ImageJ, U. S. National Institutes of Health, Bethesda,Maryland, USA.
Rodenacker K, Bengtsson E. 2003. A feature set for cytometry on digitizedmicroscopic images. Anal Cell Pathol 25:1–36.
Sarkar N, Chaudhuri BB. 1994. An efficient differential boxcounting approachto compute fractal dimensions of images. IEEE Trans Syst Man Cybernetics24:115–120.
Schieber J, Bose P, Eriksson PG, Banerjee S, Sarkar S, Altermann W, CatuneanuOE. 2007. Atlas of microbial mat features preserved within the siliciclasticrock record, vol. 2 Atlases in Geosciences. Elsevier. 311pp.
Serra J. 1982. Image analysis and mathematical morphology. Academic PressInc., London.
Staley JT, Palmer F, Adams JB. 1982. Microcolonial fungi, common inhabitantson desert rocks? Science 215:1093–1095.
Sterflinger K, Krumbein WE. 1995. Multiple stress factors affecting growth ofrock inhabiting black fungi. Botan Acta 108:490–496.
Sterflinger K, Krumbein WE. 1997. Dematiaceous fungi as the main agent ofbiopitting on mediterranean marbles and limestones. Geomicrobiol J 22:219–231.
Stroncik NA, Schmincke HU. 2002. Palagonite—A review. Int J Earth Sci (Geol.Rundsch.) 91:680–697.
Thorseth IH, Furnes H, Tumyr O. 1995. Textural and chemical effects of bacte-rial activity on basaltic glass: an experimental approach. Chem Geol 119:139–160.
Tietz G. 2006. Losung oder neuerliches Wachstum auf Quarzkornern: ein In-dikator chemischer Verwitterung unter tropischen Klimabedingungen. ZblGeol Palaont Teil 1–1. 151–171.
Viles HA. 1988. Cyanobacterial and other biological influence on terrestriallimestone weathering on Aldabra. Proc Biol Soc Wash 8:23–31.
Downloaded By: [Rodenacker, Karsten][Helmholtz-Zentrum Muenchen] At: 12:51 1 March 2011

184 A. A. GORBUSHINA ET AL.
Viles HA, Goudie A. 2000. Weathering, geomorphology and climatic variabilityin the central Namib desert. In: SJ McLaren and DR Kniveton (eds.), Linkingclimate change to land surface change. Kluwer, Dordrecht. P 65–82.
Whalley WB, Krinsley DH. 1974. A scanning electron microscope study ofsurface textures of quartz grains from glacial environments. Sedimentology21:87–105.
Winkler G, Aurich V, Hahn KR, Martin A, Rodenacker K. 1999. Noise reductionin images: Some recent edge-preserving methods. Pattern Recognition andImage Analysis: Advan Math Theory Applications 9:749–766.
Zhang X-G, Pratt BR. 2008. Microborings in early cambrian phosphaticand phospatized fossils. Paleogeogr Paleoclimatol Paleoecol 267:185–195.
Downloaded By: [Rodenacker, Karsten][Helmholtz-Zentrum Muenchen] At: 12:51 1 March 2011