zero-emission long-haul trucking technologies€¦ · •the same catenary that powers bus trolley...
TRANSCRIPT
Hengbing Zhao
Lew Fulton
STEPS Presentation
May 23, 2017
Zero-Emission Long-Haul
Trucking Technologies

Purpose of this Study
To review zero emission trucking technologies and compare them in terms of the capital and O&M costs for long-haul freight applications.
The zero-emission technologies considered are:
• In-road dynamic inductive charging
• Catenary electric
• Hydrogen fuel cells
4

Class 8 Truck Inputs (33,000 lbs – 80,000 lbs)
5
Component Model Characteristics
Aero Drag Coefficient (Cd) 0.6
Frontal Area (A: m2) 10
Tire Rolling Resistance (eta) 0.0065
Curb Weight Including Empty
Trailer (kg)
15,700
Gross Vehicle Weight Rating (kg) 25,400 kg *
Transmission 10 Speed efficiency 98%
Axle Efficiency 98%
Electrical Accessories 4 kW
Motor Efficiency 94%
Inverter Efficiency 99%
Average mileages 500 miles/day
90,000 miles/year
* 70% of the rated load of 36,280 kg

Dynamic Inductive Charging - Schematic
7
Dynamic charging schematic (source: England Highway Agency)
• A transmission substation steps down high transmission voltage and provides power to several traction substations
• A traction substation powers several inverters (power transmitters).
• An inverter provides power to several road segments with the primary coils embedded and also controls power on and off.

KAIST the Online Electric Vehicle (OLEV)
• The bus uses five 20 kW receivers to receive 100 kW electricity at an 85% maximum power transmission efficiency rate while maintaining a 17cm air gap between the underbody of the vehicle and the road surface. (80% efficiency at a 26-cm air gap).
8

Catenary System - Status
• Overhead catenary electric power supply is a mature and well understood technology.
• The same catenary that powers bus trolley lines and light rail transit trains, is used to provide power that is picked up by pantographs mounted on top of specially-equipped trucks.
• There are two major ongoing electric truck demonstrations for the overhead catenary system
- Sweden’s eHighway
- California eHighway
10
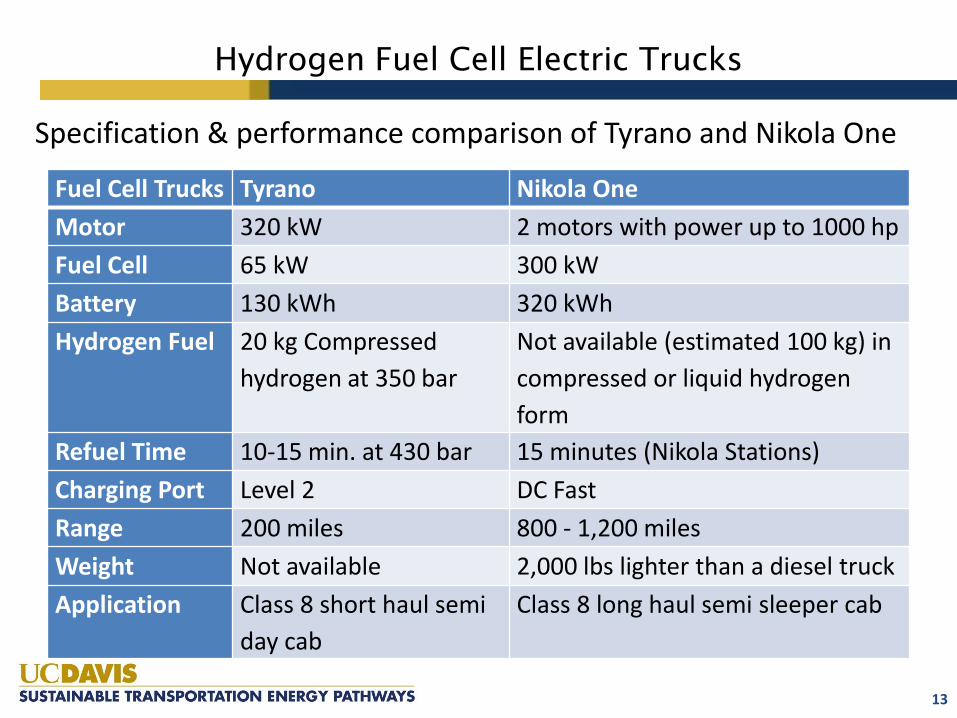
Hydrogen Fuel Cell Electric Trucks
Fuel Cell Trucks Tyrano Nikola One
Motor 320 kW 2 motors with power up to 1000 hp
Fuel Cell 65 kW 300 kW
Battery 130 kWh 320 kWh
Hydrogen Fuel 20 kg Compressed
hydrogen at 350 bar
Not available (estimated 100 kg) in
compressed or liquid hydrogen
form
Refuel Time 10-15 min. at 430 bar 15 minutes (Nikola Stations)
Charging Port Level 2 DC Fast
Range 200 miles 800 - 1,200 miles
Weight Not available 2,000 lbs lighter than a diesel truck
Application Class 8 short haul semi
day cab
Class 8 long haul semi sleeper cab
13
Specification & performance comparison of Tyrano and Nikola One

Layout of hydrogen fueling stations
Hydrogen Highway
Length of Hydrogen Highway
H2 Station 1 H2 Station mH2 Station 2
H2 Station Interval
14
According to Caltrans 2015 annual average daily truck traffic data, the major freight corridors in California carry several thousand trucks with 5+ axles per day. A daily traffic flow of 5,000 Class 8 freight trucks with an average speed of 65 mph is considered in analyzing average infrastructure power demand and daily energy consumption.

Comparison of Truck Configuration and Power Demand
and Energy Consumption
18
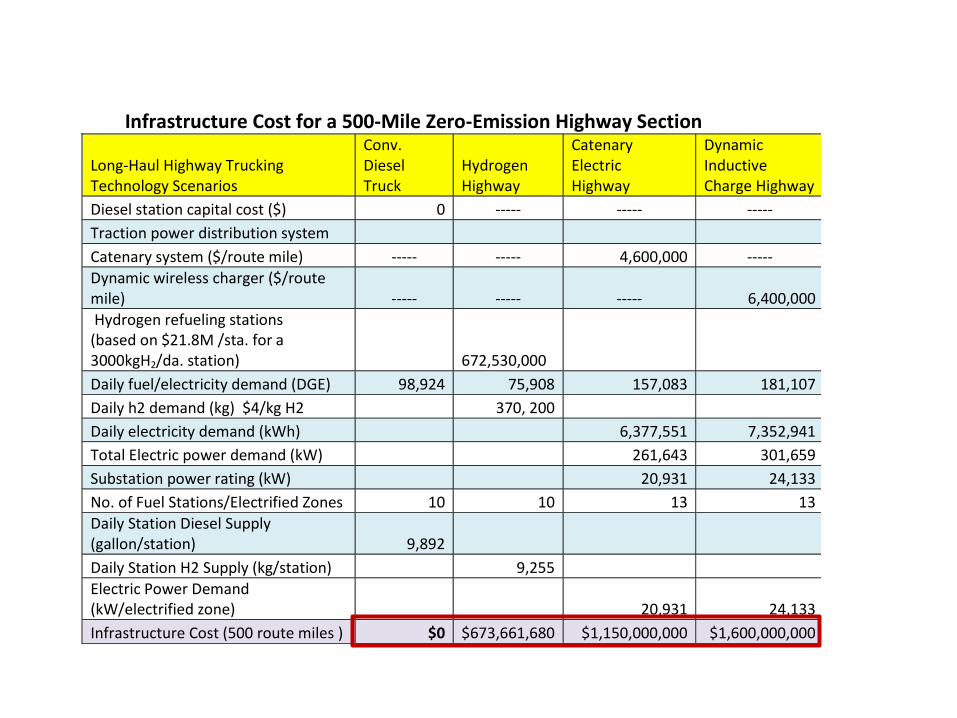
Infrastructure Cost for a 500-Mile Zero-Emission Highway Section
Long-Haul Highway Trucking Technology Scenarios
Conv. Diesel Truck
Hydrogen Highway
Catenary Electric Highway
Dynamic Inductive Charge Highway
Diesel station capital cost ($) 0 ----- ----- -----
Traction power distribution system
Catenary system ($/route mile) ----- ----- 4,600,000 -----
Dynamic wireless charger ($/route mile) ----- ----- ----- 6,400,000
Hydrogen refueling stations (based on $21.8M /sta. for a 3000kgH2/da. station) 672,530,000
Daily fuel/electricity demand (DGE) 98,924 75,908 157,083 181,107
Daily h2 demand (kg) $4/kg H2 370, 200
Daily electricity demand (kWh) 6,377,551 7,352,941
Total Electric power demand (kW) 261,643 301,659
Substation power rating (kW) 20,931 24,133
No. of Fuel Stations/Electrified Zones 10 10 13 13
Daily Station Diesel Supply (gallon/station) 9,892
Daily Station H2 Supply (kg/station) 9,255
Electric Power Demand (kW/electrified zone) 20,931 24,133
Infrastructure Cost (500 route miles ) $0 $673,661,680 $1,150,000,000 $1,600,000,000

Comparison of Infrastructure Capital Cost
20
$0
$500,000,000
$1,000,000,000
$1,500,000,000
$2,000,000,000
$2,500,000,000
$3,000,000,000
$3,500,000,000
20% 30% 40% 50% 60% 70% 80% 90% 100%
Roadway Electrification Coverage
Infrastructure Capital Cost
Diesel Station H2 Station
Catenary Electric Dynamic Inductive Charging
Infrastructure capital costs vary with road electrification coverage
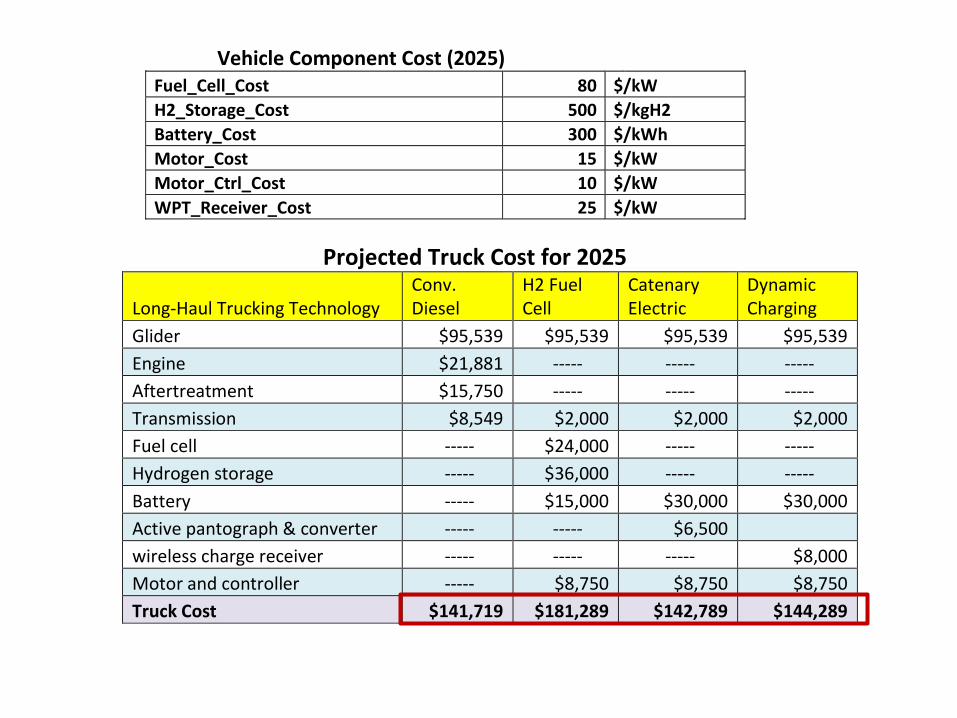
Projected Truck Cost for 2025
Long-Haul Trucking Technology Conv. Diesel
H2 Fuel Cell
Catenary Electric
Dynamic Charging
Glider $95,539 $95,539 $95,539 $95,539
Engine $21,881 ----- ----- -----
Aftertreatment $15,750 ----- ----- -----
Transmission $8,549 $2,000 $2,000 $2,000
Fuel cell ----- $24,000 ----- -----
Hydrogen storage ----- $36,000 ----- -----
Battery ----- $15,000 $30,000 $30,000
Active pantograph & converter ----- ----- $6,500
wireless charge receiver ----- ----- ----- $8,000
Motor and controller ----- $8,750 $8,750 $8,750
Truck Cost $141,719 $181,289 $142,789 $144,289
Vehicle Component Cost (2025) Fuel_Cell_Cost 80 $/kW
H2_Storage_Cost 500 $/kgH2
Battery_Cost 300 $/kWh
Motor_Cost 15 $/kW
Motor_Ctrl_Cost 10 $/kW
WPT_Receiver_Cost 25 $/kW


23
Conclusions
• Electrified highway truck costs are lower than fuel
cells, but infrastructure costs are much higher
• Highway electrification costs are not substantially
different for catenaries or inductive charging, and
either/both types of costs could come down relative
the assumptions used here.
• For fuel cells, the economics depends on lowering
the cost of hydrogen storage onboard the vehicle
and demonstrating the required durability of heavy-
duty fuel cells.
Thank You!
24