zambia public expenditure review agriculture per dissemination workshop taj pamodzi hotel, lusaka...
TRANSCRIPT
Zambia Zambia Public Expenditure ReviewPublic Expenditure Review
AgricultureAgriculture
PER Dissemination WorkshopPER Dissemination WorkshopTaj Pamodzi Hotel, LusakaTaj Pamodzi Hotel, Lusaka
December 02, 2010December 02, 2010
Public Expenditure Review in Public Expenditure Review in AgricultureAgriculture
Scope was to assist GoZ to critically Scope was to assist GoZ to critically review its operations and the use of review its operations and the use of public resources:public resources:
• Identify opportunities to support fast and Identify opportunities to support fast and equitable growth in the Agricultural equitable growth in the Agricultural sectorsector
• Improve the effectiveness, quality, and Improve the effectiveness, quality, and equity in delivery of Agricultural services equity in delivery of Agricultural services to the people of Zambiato the people of Zambia
Not an audit of expendituresNot an audit of expenditures
Agriculture in ZambiaAgriculture in Zambia Abundantly endowed with minerals, Abundantly endowed with minerals,
land, and waterland, and water About 70 percent of the Zambian labor About 70 percent of the Zambian labor
force employed in agriculture. force employed in agriculture. Primary source of income for the poor Primary source of income for the poor
(productivity and profitability closely (productivity and profitability closely associated with poverty incidence) associated with poverty incidence)
Contributes about 20% of GDPContributes about 20% of GDP Despite the recent bumper maize Despite the recent bumper maize
harvest, sector has underperformed harvest, sector has underperformed over the past decade; average growth over the past decade; average growth (1.3%/yr lagged behind population (1.3%/yr lagged behind population growth of 3%/yrgrowth of 3%/yr

Agriculture in Zambia ctd.Agriculture in Zambia ctd. Underutilization of potential cultivable Underutilization of potential cultivable
area (+/- 16 million ha)area (+/- 16 million ha)
Rain-fed maize still dominates Zambia’s Rain-fed maize still dominates Zambia’s agricultureagriculture
Disproportionate priority towards maize Disproportionate priority towards maize and fertilizer subsidy schemes.and fertilizer subsidy schemes.
Irrigation is an integral part of the Irrigation is an integral part of the agenda to bring Zambia’s underutilized agenda to bring Zambia’s underutilized land into production. land into production.

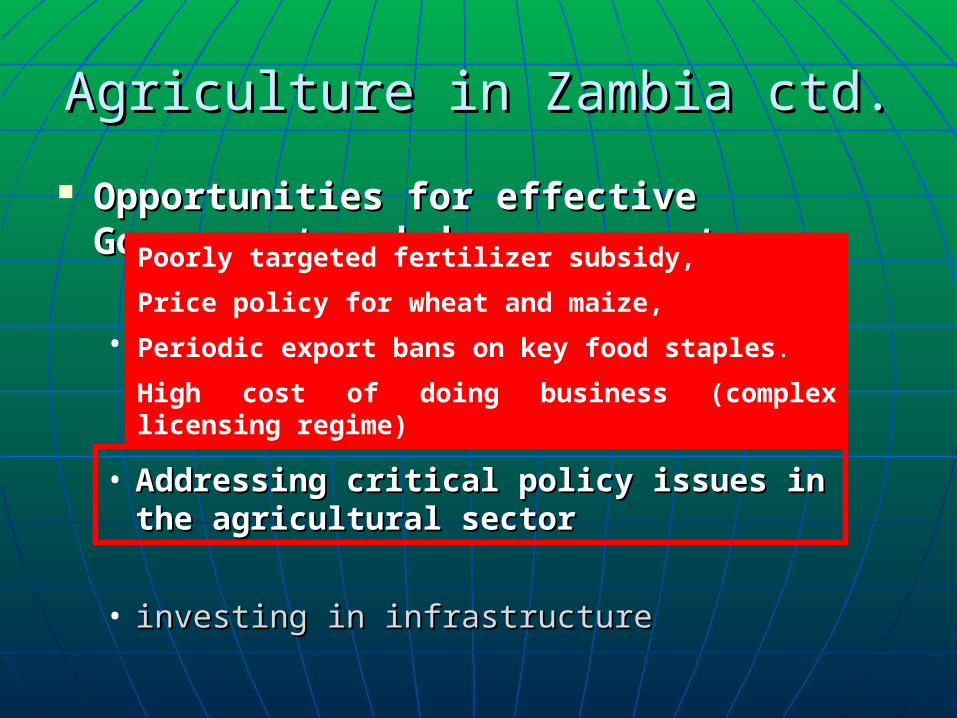
Agriculture in Zambia ctd.Agriculture in Zambia ctd.
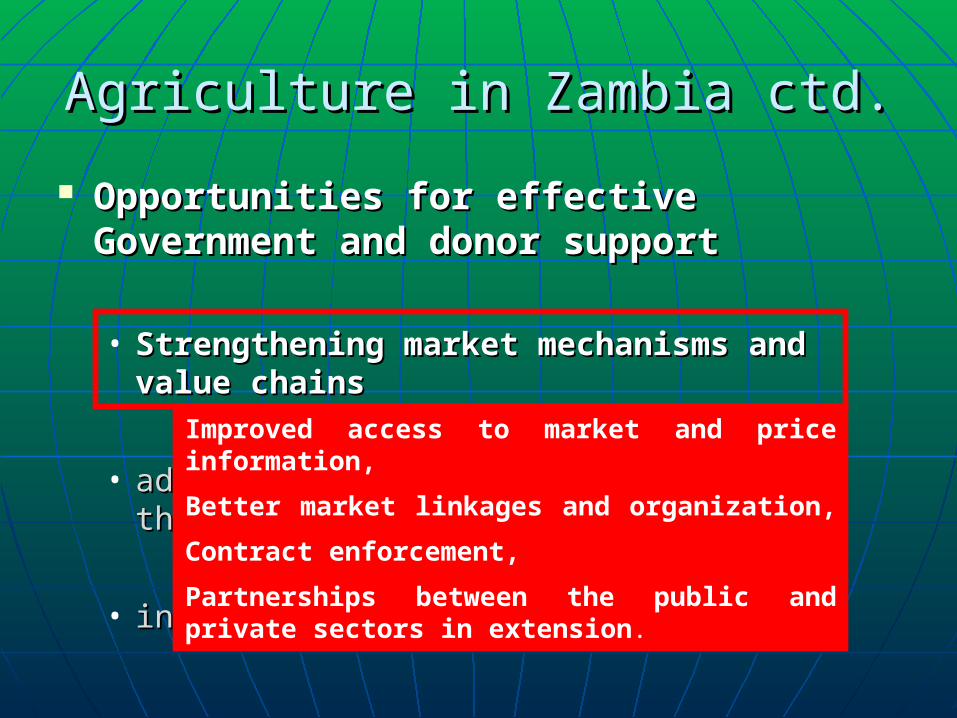
Opportunities for effective Opportunities for effective Government and donor support Government and donor support
• Strengthening market mechanisms and Strengthening market mechanisms and value chainsvalue chains
• Addressing critical policy issues in the Addressing critical policy issues in the agricultural sectoragricultural sector
• Investing in infrastructureInvesting in infrastructure
Agriculture in Zambia ctd.Agriculture in Zambia ctd.
Opportunities for effective Opportunities for effective Government and donor support Government and donor support
• Strengthening market mechanisms and Strengthening market mechanisms and value chainsvalue chains
• addressing critical policy issues in the addressing critical policy issues in the agricultural sectoragricultural sector
• investing in infrastructureinvesting in infrastructure
Improved access to market and price information,
Better market linkages and organization,
Contract enforcement,
Partnerships between the public and private sectors in extension.
Agriculture in Zambia ctd.Agriculture in Zambia ctd.
Opportunities for effective Opportunities for effective Government and donor support Government and donor support
• strengthening market mechanisms and strengthening market mechanisms and value chainsvalue chains
• Addressing critical policy issues in the Addressing critical policy issues in the agricultural sectoragricultural sector
• investing in infrastructureinvesting in infrastructure
Poorly targeted fertilizer subsidy,
Price policy for wheat and maize,
Periodic export bans on key food staples.
High cost of doing business (complex licensing regime)
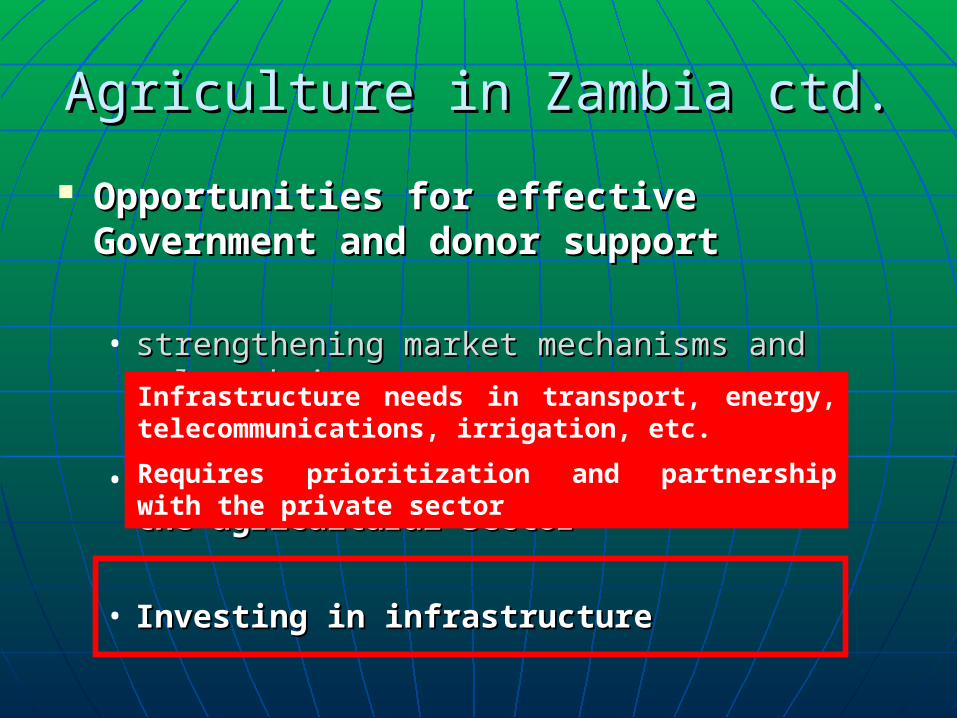
Agriculture in Zambia ctd.Agriculture in Zambia ctd.
Opportunities for effective Opportunities for effective Government and donor support Government and donor support
• strengthening market mechanisms and value strengthening market mechanisms and value chainschains
• addressing critical policy issues in the addressing critical policy issues in the agricultural sectoragricultural sector
• Investing in infrastructureInvesting in infrastructure
Infrastructure needs in transport, energy, telecommunications, irrigation, etc.
Requires prioritization and partnership with the private sector

Agriculture in Zambia ctd.Agriculture in Zambia ctd.
New developmentsNew developments
• Fertilizer voucher program PilotFertilizer voucher program Pilot
• Reintroduction of the Agriculture Reintroduction of the Agriculture Marketing BillMarketing Bill

Agriculture in Zambia ctd.Agriculture in Zambia ctd.
New developmentsNew developments
• Fertilizer voucher program PilotFertilizer voucher program Pilot
• Reintroduction of the Agriculture Marketing BillReintroduction of the Agriculture Marketing Bill
Expected to increase private sector involvement in fertilizer distribution
Should result in a gradual reduction of public fertilizer expenditure
Implementation has been delayed, however

Agriculture in Zambia ctd.Agriculture in Zambia ctd.
New developmentsNew developments
• Fertilizer voucher program PilotFertilizer voucher program Pilot
• Reintroduction of the Agriculture Reintroduction of the Agriculture Marketing BillMarketing Bill
Designed to enhance smallholder farmers’ access to markets and to include warehouse receipting
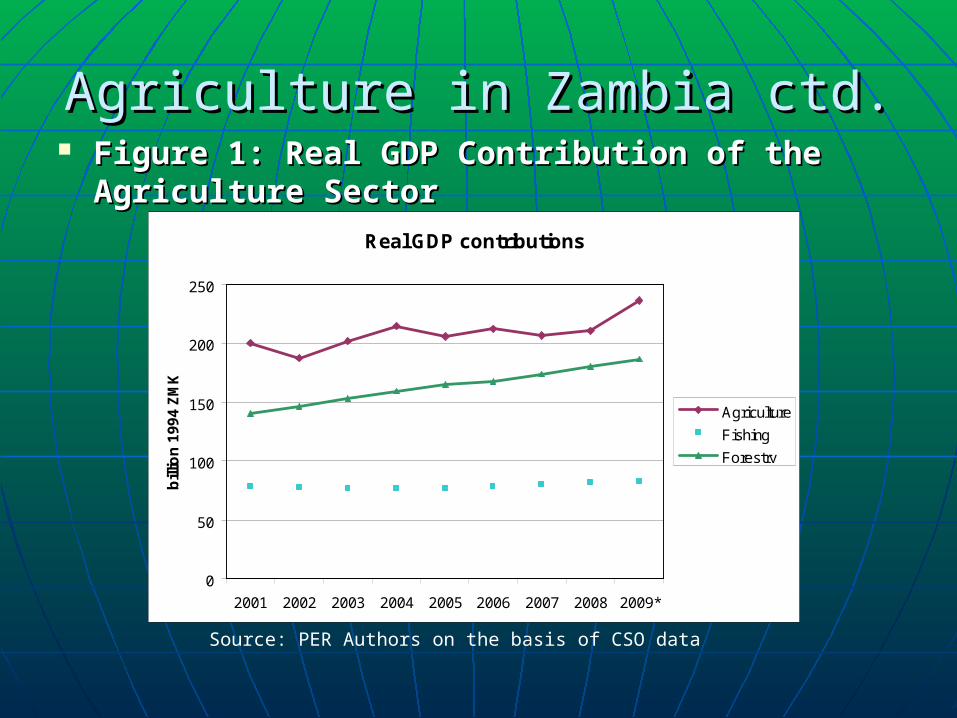
Agriculture in Zambia ctd.Agriculture in Zambia ctd. Figure 1: Real GDP Contribution of the Figure 1: Real GDP Contribution of the
Agriculture SectorAgriculture SectorReal GDP contributions
0
50
100
150
200
250
2001 2002 2003 2004 2005 2006 2007 2008 2009*
bill
ion
19
94
ZM
K
Agriculture
Fishing
Forestry
Source: PER Authors on the basis of CSO data

Agriculture in Zambia ctd.Agriculture in Zambia ctd. Figure 2: Maize production trendsFigure 2: Maize production trends
Source: PER Authors on the basis of crop forecast data provided by MACO.
Note: Line = three-year moving average
Maize production
0
200
400
600
800
1,000
1,200
1,400
1,600
1,800
2,000
Thou
sand
MT
Maize Productivity (t/ha)
0.0
0.5
1.0
1.5
2.0
2.5
3.0
t/ha

Agriculture in Zambia ctd.Agriculture in Zambia ctd. Limitations of statistics on Limitations of statistics on
agricultural productionagricultural production• Post-harvest data have not been available Post-harvest data have not been available
since 2004 (lack of funding for data since 2004 (lack of funding for data cleaning and processing)cleaning and processing)
• CSO estimates based on pre-harvest CSO estimates based on pre-harvest surveys administered by MACO through surveys administered by MACO through its Early Warning Systemits Early Warning System
• Focus almost exclusively on staple crops Focus almost exclusively on staple crops • Livestock “production” is estimated on Livestock “production” is estimated on
the basis of animal stocks rather than the basis of animal stocks rather than slaughters slaughters
• Chicken production not taken into accountChicken production not taken into account
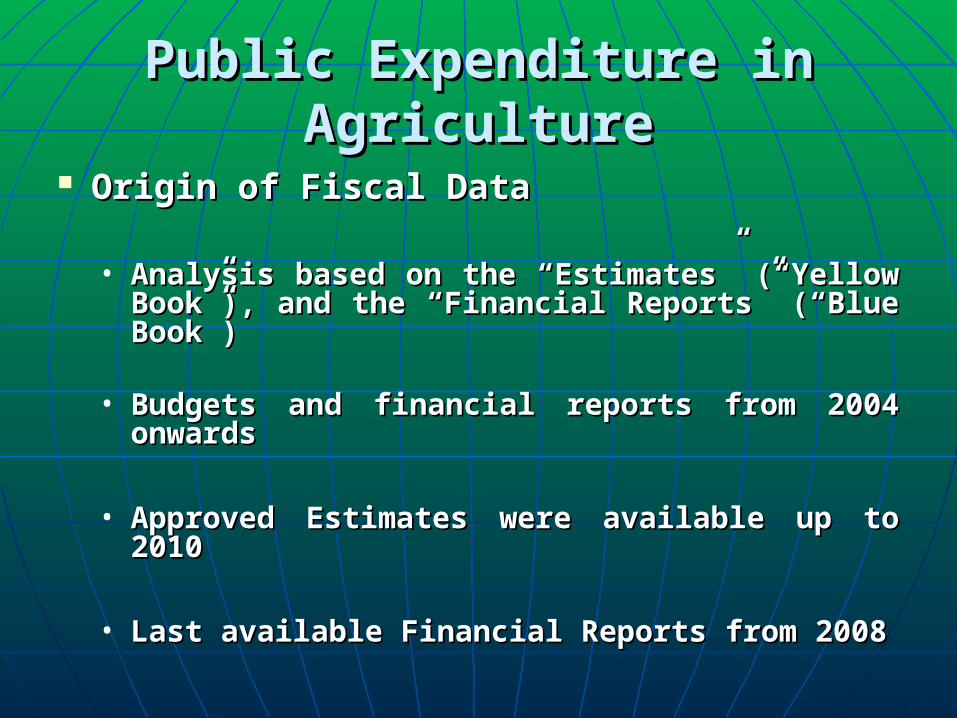
Public Expenditure in AgriculturePublic Expenditure in Agriculture
Origin of Fiscal DataOrigin of Fiscal Data
• Analysis based on the “Estimates” Analysis based on the “Estimates” (“Yellow Book”), and the “Financial (“Yellow Book”), and the “Financial Reports” (“Blue Book”) Reports” (“Blue Book”)
• Budgets and financial reports from 2004 Budgets and financial reports from 2004 onwardsonwards
• Approved Estimates were available up to Approved Estimates were available up to 20102010
• Last available Financial Reports from Last available Financial Reports from 20082008
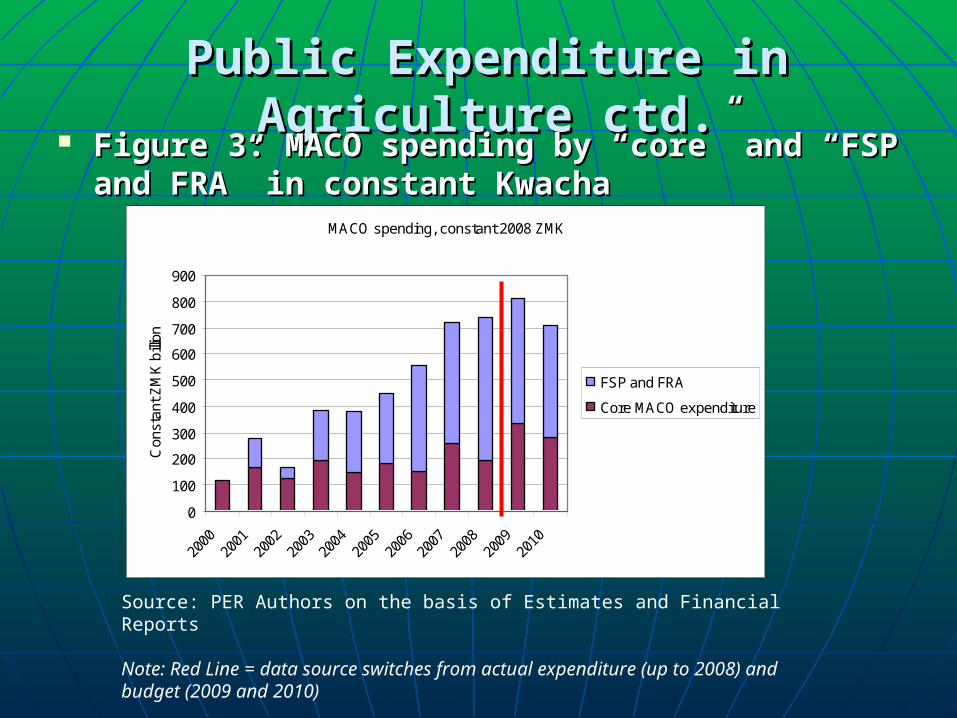
Public Expenditure in Agriculture ctd.Public Expenditure in Agriculture ctd. Figure 3: MACO spending by “core” and Figure 3: MACO spending by “core” and
“FSP and FRA” in constant Kwacha“FSP and FRA” in constant KwachaMACO spending, constant 2008 ZMK
0
100
200
300
400
500
600
700
800
900
2000
2001
2002
2003
2004
2005
2006
2007
2008
2009
2010
Con
stan
t ZM
K b
illion
FSP and FRA
Core MACO expenditure
Source: PER Authors on the basis of Estimates and Financial Reports
Note: Red Line = data source switches from actual expenditure (up to 2008) and budget (2009 and 2010)
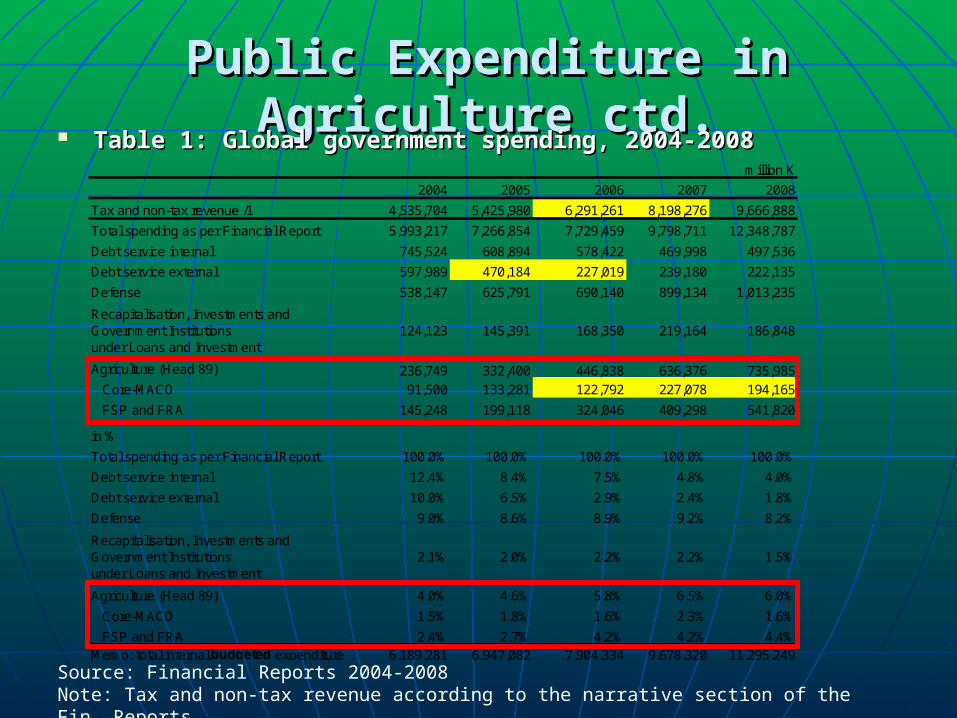
Public Expenditure in Agriculture ctd.Public Expenditure in Agriculture ctd. Table 1: Global government spending, 2004-2008Table 1: Global government spending, 2004-2008
million K
2004 2005 2006 2007 2008
Tax and non-tax revenue /1 4,535,704 5,425,980 6,291,261 8,198,276 9,666,888
Total spending as per Financial Report 5,993,217 7,266,854 7,729,459 9,798,711 12,348,787
Debt service internal 745,524 608,894 578,422 469,998 497,536
Debt service external 597,989 470,184 227,019 239,180 222,135
Defense 538,147 625,791 690,140 899,134 1,013,235
Recapitalisation, Investments and Government Institutions under Loans and Investment
124,123 145,391 168,350 219,164 186,848
Agriculture (Head 89) 236,749 332,400 446,838 636,376 735,985
Core-MACO 91,500 133,281 122,792 227,078 194,165
FSP and FRA 145,248 199,118 324,046 409,298 541,820
in %
Total spending as per Financial Report 100.0% 100.0% 100.0% 100.0% 100.0%
Debt service internal 12.4% 8.4% 7.5% 4.8% 4.0%
Debt service external 10.0% 6.5% 2.9% 2.4% 1.8%
Defense 9.0% 8.6% 8.9% 9.2% 8.2%
Recapitalisation, Investments and Government Institutions under Loans and Investment
2.1% 2.0% 2.2% 2.2% 1.5%
Agriculture (Head 89) 4.0% 4.6% 5.8% 6.5% 6.0%
Core-MACO 1.5% 1.8% 1.6% 2.3% 1.6%
FSP and FRA 2.4% 2.7% 4.2% 4.2% 4.4%Memo: total internal budgeted expenditure 6,189,281 6,947,082 7,904,334 9,678,320 11,295,249
Source: Financial Reports 2004-2008 Note: Tax and non-tax revenue according to the narrative section of the Fin. Reports
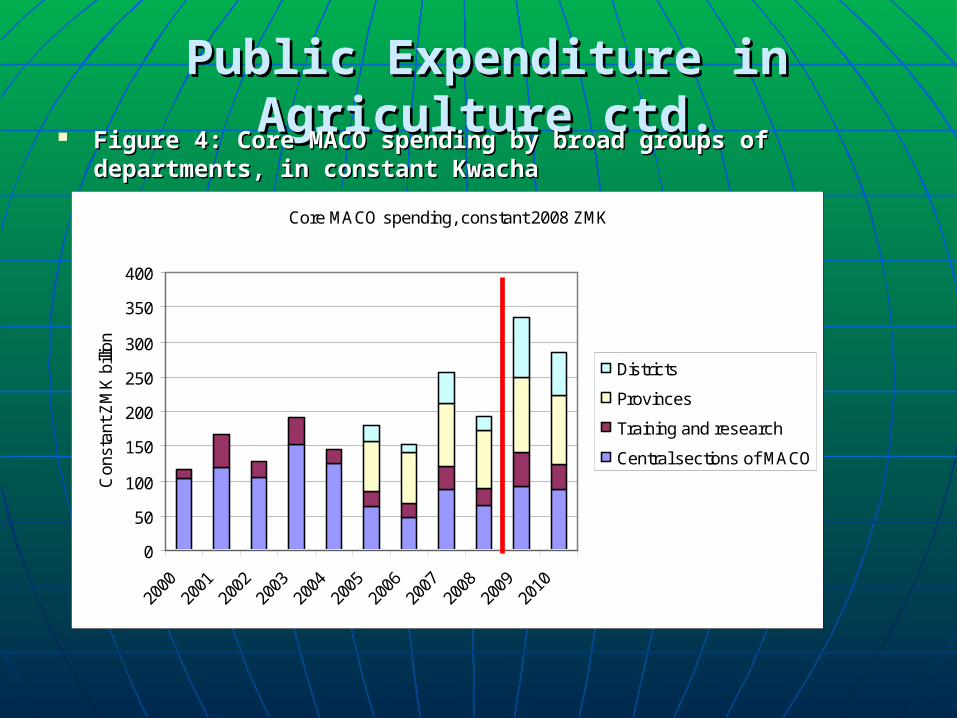
Public Expenditure in Agriculture ctd.Public Expenditure in Agriculture ctd. Figure 4: Core MACO spending by broad groups of Figure 4: Core MACO spending by broad groups of
departments, in constant Kwachadepartments, in constant Kwacha
Core MACO spending, constant 2008 ZMK
0
50
100
150
200
250
300
350
400
2000
2001
2002
2003
2004
2005
2006
2007
2008
2009
2010
Con
stan
t ZM
K b
illion
Districts
Provinces
Training and research
Central sections of MACO
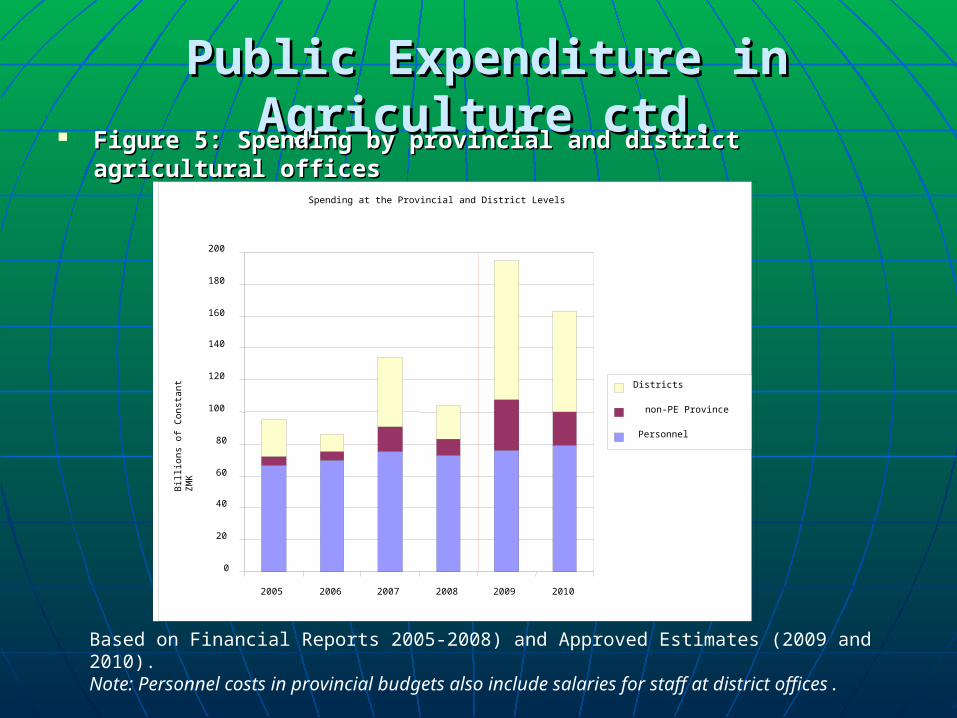
Public Expenditure in Agriculture ctd.Public Expenditure in Agriculture ctd. Figure 5: Spending by provincial and district agricultural Figure 5: Spending by provincial and district agricultural
officesofficesSpending at the Provincial and District Levels
0
20
40
60
80
100
120
140
160
180
200
2005 2006 2007 2008 2009 2010
Bill
ions
of C
onst
ant Z
MK
Districts
non-PE Province
Personnel
Based on Financial Reports 2005-2008) and Approved Estimates (2009 and 2010).Note: Personnel costs in provincial budgets also include salaries for staff at district offices.

Public Expenditure in Agriculture ctd.Public Expenditure in Agriculture ctd. Table 2: Spending and execution rates by provincial and Table 2: Spending and execution rates by provincial and
district agricultural officesdistrict agricultural offices
Source: Financial Reports and Budget figures. Staff level in 2008 from Cardno Agrisystems Ltd 2009 (Participatory Review).
constant million Kwacha2005 2006 2007 2008 2009 2010
Actual Actual Actual Actual Budget BudgetTotal spending Province and District level
95,431 86,233 133,885 103,981 194,648 162,601
Provinces 72,301 75,140 90,705 82,649 108,125 99,974Personnel 66,292 69,981 75,491 72,941 75,830 79,159non-PE Province 6,009 5,159 15,214 9,707 32,295 20,815
Districts 23,130 11,093 43,180 21,332 86,524 62,627Non-PE total 29,139 16,252 58,394 31,040 118,819 83,441
Non-PE as % of total province and district spending
30.5% 18.8% 43.6% 29.9% 61.0% 51.3%
Non-PE total assuming 60% execution for 2009 and 2010
29,139 16,252 58,394 31,040 71,291 50,065
No of provincial and district-level staff Nov 2008 5,109District spending per staff 4.5 2.2 8.5 4.2 16.9 12.3CPI, 2008=100 73.7 80.4 88.9 100.0 113.4 124.7

Public Expenditure in Agriculture ctd.Public Expenditure in Agriculture ctd. Figure 6: Direct technology spending relative to MACO core Figure 6: Direct technology spending relative to MACO core
spendingspending
Direct technology spending relative to other MACO expenditure
0%
5%
10%
15%
20%
25%
2002 2003 2004 2005 2006 2007 2008 2009 2010
% o
f cor
e M
AC
O s
pend
ing
Training Institutes
Research stations
ZARI
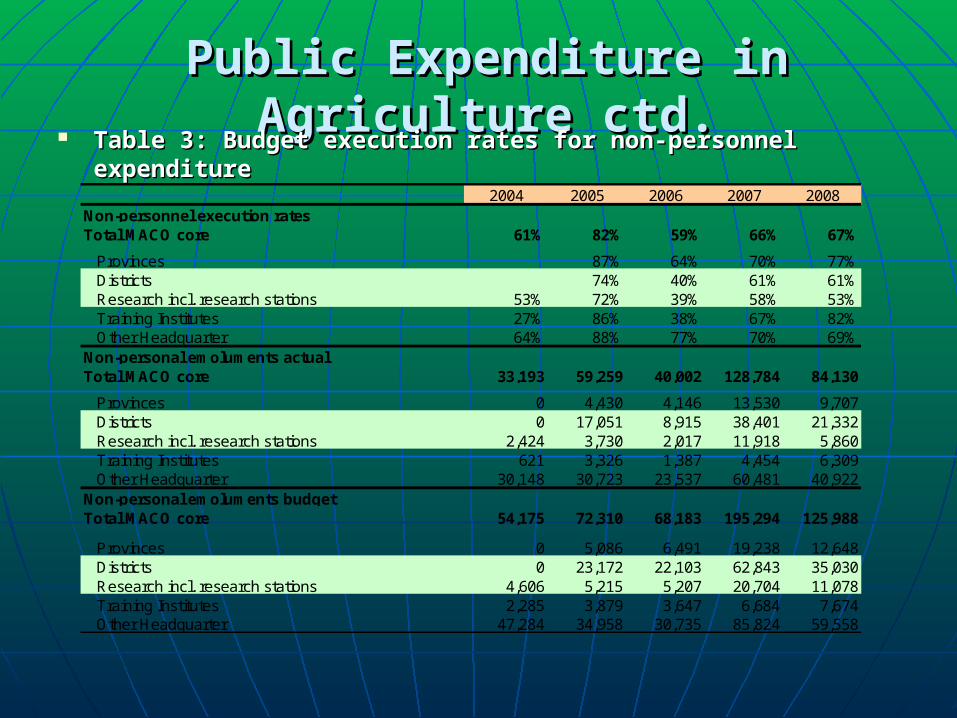
Public Expenditure in Agriculture ctd.Public Expenditure in Agriculture ctd. Table 3: Budget execution rates for non-personnel Table 3: Budget execution rates for non-personnel
expenditureexpenditure2004 2005 2006 2007 2008
Non-personnel execution ratesTotal MACO core 61% 82% 59% 66% 67%
Provinces 87% 64% 70% 77%Districts 74% 40% 61% 61%Research incl. research stations 53% 72% 39% 58% 53%Training Institutes 27% 86% 38% 67% 82%Other Headquarter 64% 88% 77% 70% 69%
Non-personal emoluments actualTotal MACO core 33,193 59,259 40,002 128,784 84,130
Provinces 0 4,430 4,146 13,530 9,707Districts 0 17,051 8,915 38,401 21,332Research incl. research stations 2,424 3,730 2,017 11,918 5,860Training Institutes 621 3,326 1,387 4,454 6,309Other Headquarter 30,148 30,723 23,537 60,481 40,922
Non-personal emoluments budgetTotal MACO core 54,175 72,310 68,183 195,294 125,988
Provinces 0 5,086 6,491 19,238 12,648Districts 0 23,172 22,103 62,843 35,030Research incl. research stations 4,606 5,215 5,207 20,704 11,078Training Institutes 2,285 3,879 3,647 6,684 7,674Other Headquarter 47,284 34,958 30,735 85,824 59,558
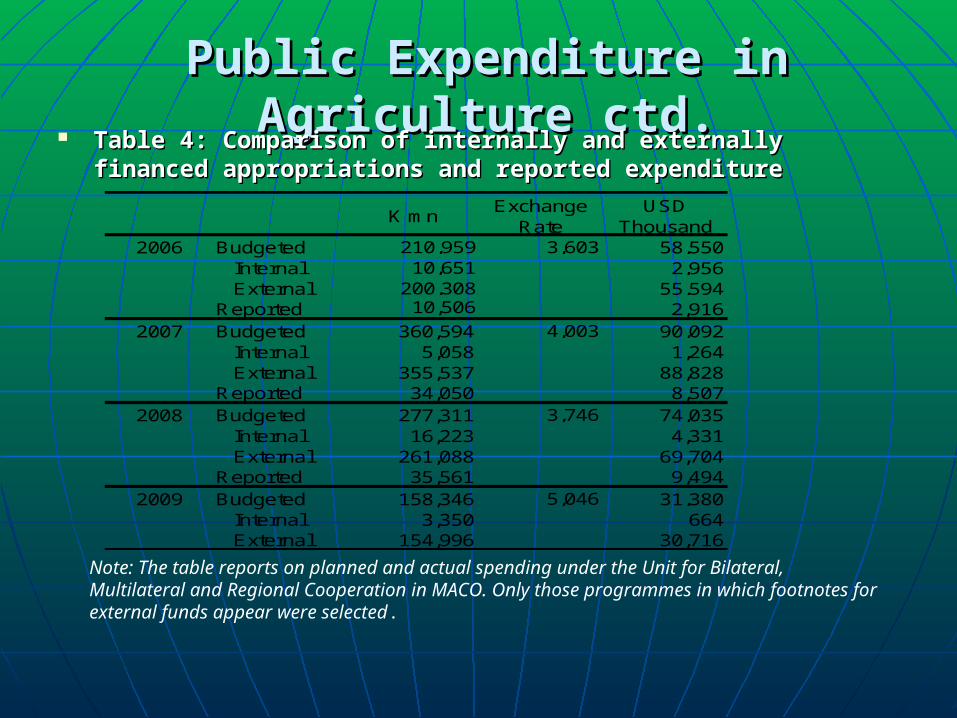
Public Expenditure in Agriculture ctd.Public Expenditure in Agriculture ctd. Table 4: Comparison of internally and externally financed Table 4: Comparison of internally and externally financed
appropriations and reported expenditureappropriations and reported expenditure
K mnExchange
RateUSD
Thousand2006 Budgeted 210,959 3,603 58,550
Internal 10,651 2,956External 200,308 55,594
Reported 10,506 2,9162007 Budgeted 360,594 4,003 90,092
Internal 5,058 1,264External 355,537 88,828
Reported 34,050 8,5072008 Budgeted 277,311 3,746 74,035
Internal 16,223 4,331External 261,088 69,704
Reported 35,561 9,4942009 Budgeted 158,346 5,046 31,380
Internal 3,350 664External 154,996 30,716
Note: The table reports on planned and actual spending under the Unit for Bilateral, Multilateral and Regional Cooperation in MACO. Only those programmes in which footnotes for external funds appear were selected.

Public Expenditure in Agriculture ctd.Public Expenditure in Agriculture ctd. Donor ContributionsDonor Contributions
• Focus on extension and farming systemsFocus on extension and farming systems
• International cooperation projects with International cooperation projects with ZARIZARI
• Donor funded projects poorly reflected in Donor funded projects poorly reflected in budgets ad financial reportsbudgets ad financial reports

Public Expenditure in Agriculture ctd.Public Expenditure in Agriculture ctd. ConclusionsConclusions
• Overall agricultural spending appears Overall agricultural spending appears sufficient, but sufficient, but majority of these resources majority of these resources goes to large-scale subsidy programs. goes to large-scale subsidy programs. Need Need to consider retargeting expenditures to consider retargeting expenditures towards core agricultural servicestowards core agricultural services
• CSO has adequate resources to collect data, CSO has adequate resources to collect data, but not to process thembut not to process them
• Need to reduce annual and in-year variability Need to reduce annual and in-year variability of agency budgets, uncertainty leads to of agency budgets, uncertainty leads to weak budget executionweak budget execution
Gender and Public Expenditure in Gender and Public Expenditure in AgricultureAgriculture
The Importance of Gender in the The Importance of Gender in the Agricultural SectorAgricultural Sector
• Females make up about 70 percent of the Females make up about 70 percent of the agricultural workforceagricultural workforce
• Gender mainstreaming is essential to the long-Gender mainstreaming is essential to the long-term growth of agricultural productivity and term growth of agricultural productivity and sector revenue, and inseparable from the sector revenue, and inseparable from the alleviation of rural povertyalleviation of rural poverty..
• Women, especially in rural areas, are still Women, especially in rural areas, are still constrained by a lack of access to inputs, constrained by a lack of access to inputs, productive resources, and public services.productive resources, and public services.

Gender and Public Expenditure in Gender and Public Expenditure in Agriculture ctd.Agriculture ctd.
Laudable GoZ efforts to incorporate a Laudable GoZ efforts to incorporate a strong gender element into development strong gender element into development programming, not limited to agriculture programming, not limited to agriculture (FNDP 2006-2010, National Gender Policy, (FNDP 2006-2010, National Gender Policy, signatory to several international signatory to several international declarations, conventions, etc.)declarations, conventions, etc.)
But…But… Economic empowerment of women and the Economic empowerment of women and the
mainstreaming of gender into agricultural mainstreaming of gender into agricultural policies and programs remain inadequate in policies and programs remain inadequate in scope and ineffective in execution. scope and ineffective in execution.
Gender and Public Expenditure in Gender and Public Expenditure in Agriculture ctd.Agriculture ctd.
Gender in Development Division (GIDD) of Gender in Development Division (GIDD) of the Cabinet Officethe Cabinet Office
Gender Focal Points in Line MinistriesGender Focal Points in Line Ministries
Gender Sub-committeesGender Sub-committees
Mandate to coordinate, monitor, and evaluate the implementation of the National Gender Policy in order to achieve gender-reflective goals in overall development policy
In 2008, GIDD had an approved budget for gender training of Gender Focal Points and members of the Gender Sub-committees of almost ZMK122 million but only ZMK 300,000 was actually disbursed...

Gender and Public Expenditure in Gender and Public Expenditure in Agriculture ctd.Agriculture ctd.
Gender in Development Division (GIDD) of the Gender in Development Division (GIDD) of the Cabinet OfficeCabinet Office
Gender Focal Points in Line MinistriesGender Focal Points in Line Ministries
Gender Sub-committeesGender Sub-committees
Specific duties of the Gender Focal Points (GFPs) are often unknown to agency staff
GFPs are rarely consulted on new initiatives
Interagency collaboration between GFPs, though mandated by the GIDD, is extremely limited.

Gender and Public Expenditure in Gender and Public Expenditure in Agriculture ctd.Agriculture ctd.
Gender in Development Division (GIDD) of the Gender in Development Division (GIDD) of the Cabinet OfficeCabinet Office
Gender Focal Points in Line MinistriesGender Focal Points in Line Ministries
Gender Sub-committeesGender Sub-committees
Function as a link between the GIDD and the various ministries as well as local and regional authorities.
Reporting and oversight system does not function well, collaboration with GIDD has been limited

Gender and Public Expenditure in Gender and Public Expenditure in Agriculture ctd.Agriculture ctd.
Limited, irregular and occasionally irreconcilable Limited, irregular and occasionally irreconcilable data on the role of gender in agricultural data on the role of gender in agricultural productivityproductivity
Failure to collect, process and publish reliable, Failure to collect, process and publish reliable, high-quality gender-disaggregated data on key high-quality gender-disaggregated data on key sector indicatorssector indicators
Gender and Public Expenditure in Gender and Public Expenditure in Agriculture ctd.Agriculture ctd.
Weak budget execution of gender specific Weak budget execution of gender specific programming and data collectionprogramming and data collection
“ “In 2008 MoFNP had an approved budget of over In 2008 MoFNP had an approved budget of over ZMK35 million for the collection of gender statistics, ZMK35 million for the collection of gender statistics, but actual expenditure was only ZMK1.8 million.”but actual expenditure was only ZMK1.8 million.”

Gender and Public Expenditure in Gender and Public Expenditure in Agriculture ctd.Agriculture ctd.
ConclusionsConclusions• Mainstreaming gender into the budgetary Mainstreaming gender into the budgetary
process is critical to achieving the government’s process is critical to achieving the government’s stated objectives for the agricultural sectorstated objectives for the agricultural sector
• Need to consider reorganization of the MACO and Need to consider reorganization of the MACO and MoFNP budget processes to reflect the MoFNP budget processes to reflect the appropriate prioritization of gender-specific appropriate prioritization of gender-specific programming, including data collection and programming, including data collection and analysis. analysis.

Thank you!Thank you!