you ve got a friend in me: how social networks and mobile
TRANSCRIPT

Haenssgen et al. (paper prepared for DSA 2019) Page 1
You’ve Got a Friend in Me: How Social Networks and Mobile Phones Facilitate Healthcare 1
Access Among Marginalised Groups in Rural Thailand and Lao PDR 2
3
Marco J HAENSSGEN a, b, f, * 4
Giacomo ZANELLO c, d, g 5
Nutcha CHAROENBOON e, h 6
a. Global Sustainable Development, School of Cross-Faculty Studies, University of Warwick, Gibbet 7
Hill Road, Coventry CV4 7AL, UK 8
b. Institute of Advanced Study, Milburn House, Milburn Hill Road, University of Warwick Science 9
Park, Coventry CV4 7HS, UK 10
c. School of Agriculture, Policy and Development, University of Reading, Reading RG6 6BZ, UK 11
d. Leverhulme Centre for Integrative Research on Agriculture and Health, London International 12
Development Centre, 36 Gordon Square, London WC1H 0PD, UK 13
e. Mahidol Oxford Tropical Medicine Research Unit, Faculty of Tropical Medicine, Mahidol 14
University, 3/F, 60th Anniversary Chalermprakiat Building, 420/6 Rajvithi Road, Bangkok 10400, 15
Thailand 16
f. email: [email protected], phone: +44 (0) 7771805068 17
g. email: [email protected] 18
h. email: [email protected] 19
*. Corresponding author 20
Haenssgen et al. (paper prepared for DSA 2019) Page 2
Abstract 21
The seeming “ubiquity” of mobile phones has spawned a wave of interventions that use mobiles as 22
platforms for health service delivery (mHealth). Operating in more than 100 countries, mHealth 23
interventions commonly aspire to make healthcare more inclusive and efficient. Yet, mobile phone 24
diffusion also stimulates locally emerging forms of health-related phone use that could create new 25
digital inequalities among marginalised groups or compete with mHealth and other technology-based 26
development interventions. 27
We aim to inform this subject by asking, “How do mobile phone use and social support networks 28
influence rural treatment-seeking behaviours among marginalised groups?” We hypothesise that (1) 29
resource constraints drive marginalised groups towards informal healthcare access, and that (2) mobile 30
phone use and social support networks facilitate access to formal healthcare with a bias towards private 31
doctors. Analysing representative survey data from 2,141 Thai and Lao villagers with descriptive 32
statistics and multilevel regression models, we demonstrate that: (a) health-related phone use is 33
concentrated among less marginalised groups, while social support networks are distributed more 34
equitably; (b) marginalised villagers are more likely to utilise informal healthcare providers; and (c) 35
mobile phones and social support networks are linked to increased yet delayed formal healthcare 36
access that is directed towards public healthcare. 37
We conclude that mobile phone diffusion has a mildly positive association with rural healthcare access 38
especially in the more resource-constrained Lao health system, and it does not (yet) appear to crowd 39
out social support. However encouraging, this is problematic news for mHealth and technology-based 40
development interventions. The potential behavioural consequences of “informal mHealth” reinforce 41
the notion that mobile phones are a non-neutral platform for mHealth and development interventions. 42
The long-term implications require more research, but the literature suggests that increasing phone-43
aided healthcare facilitation could undermine local social support networks and leave already 44
marginalised rural dwellers in yet more precarious circumstances. 45
Haenssgen et al. (paper prepared for DSA 2019) Page 3
Keywords 46
Marginalisation; technology diffusion; social support; mobile phones; healthcare; Thailand; Laos; 47
rural areas; mHealth; survey 48
1 Introduction 49
“We must make sure that innovation and technology helps to reduce the inequities in our world, 50
instead of becoming another reason people are left behind [sic].” 51
Dr Tedros Adhanom Ghebreyesus, Director-General, World Health Organization (WHO, 2019:v) 52
53
In light of common claims about the “ubiquity” of mobile phones around the globe and especially in 54
low- and middle-income countries (LMICs), mobile phones and smartphone apps have received 55
extensive attention as tools to revolutionise healthcare and contribute to the achievement of universal 56
healthcare coverage. Notions like the “tremendous impact on emerging markets” (Manjunath et al., 57
2011:4) and the “potential to transform the face of health service delivery across the globe” (WHO, 58
2011:1) through “harnessing this technology for improving the health of populations” (Krishna et al., 59
2009:239) have shaped narratives and practice for nearly a decade. In line with the technological 60
enthusiasm, the WHO (2016) report that 109 countries in 2016 operated at least one government-61
sanctioned phone-based health service delivery and surveillance programme (also referred to as 62
mHealth; typically emergency hotlines and call centres). 63
The narratives are now gradually moving away from hyper-optimistic claims about the potential of 64
mobile technology. Recently published guidelines by the World Health Organization (WHO) state for 65
example that health interventions based on digital technology like mobile phones “should not exclude 66
or jeopardize the provision of quality non-digital services in places where there is no access to the 67
digital technologies or they are not acceptable or affordable for target communities” (WHO, 2019:xi). 68
Haenssgen et al. (paper prepared for DSA 2019) Page 4
Similarly, in the context of access to healthcare and education in LMICs, the Pathways for Prosperity 69
Commission on Technology and Inclusive Development (2019:37) notes, among others, that, “If the 70
same social norms that prohibit girls from walking longer distances to attend secondary school also 71
limit their access to mobile technology (which could offer an alternative education medium), 72
inequalities will not merely remain but may even be exacerbated.” Also the often-cited problem of 73
rapid and uncoordinated mHealth pilot studies (“pilotitis”) especially in LMICs appears to be waning 74
as programmes mature and countries integrate them better into their national health policies and digital 75
strategies (Labrique et al., 2013; WHO, 2016). 76
Despite the growing nuance in the rhetoric and practice on mHealth, and notwithstanding the growing 77
evidence base (Labrique et al., 2013), a major problem in understanding the role of mHealth remains: 78
We know worryingly little about the role of mobile phones themselves as platforms for health service 79
delivery in LMICs. Existing mHealth evaluations rather focus on impacts brought about by adding a 80
service onto the platform, assuming that the platform is neutral or otherwise beneficial. However, 81
emerging yet nascent social research on the role of health-related mobile phone use suggests that a 82
large spectrum of “informal mHealth” emerges indigenously with the diffusion of mobile technology 83
(Hampshire et al., 2015). mHealth research does not normally investigate how external intervention 84
would fit into (or duplicate, or disrupt) this fluid landscape of people’s healthcare solutions, nor what 85
consequences emerging phone-aided health behaviours entail. Some of the uses could indeed be 86
inequitable (e.g. over-utilising scarce healthcare resources that are then unavailable to digitally 87
excluded groups) or outright harmful (consuming e.g. misleading health information), in which case 88
mHealth could reproduce existing inequalities, create new forms of exclusion, or just undo harms 89
created by informal health-related uses. 90
Our research question therefore is, “How do mobile phone use and social support networks influence 91
rural treatment-seeking behaviours among marginalised groups?” In the spirit of the opening quote, 92
we frame our analysis within the concept of marginalisation to explore whether mobile phone diffusion 93
Haenssgen et al. (paper prepared for DSA 2019) Page 5
opens or closes opportunities among excluded groups. In addition, to expand our understanding of 94
landscapes of solutions with which newly diffused mobile phones may interact, we will also examine 95
the relative importance of social support networks in people’s healthcare choices. Our study builds on 96
a programme of work initiated in India and China, which we extended to the contexts of Thailand and 97
Lao PDR. We focus specifically on rural areas where healthcare access tends to be more constrained 98
than in cities. 99
Through this analysis, we aim to contribute to the narrow knowledge base on the healthcare 100
consequences of mobile phone diffusion to add further nuance to the discourse in the field of mHealth. 101
Our research interest in marginalisation and the relationship between technology diffusion and social 102
support networks contributes also to the policy-relevant literature on the social implications of 103
technology diffusion (e.g. Aker & Mbiti, 2010; Unwin, 2009a). In particular, our analysis demonstrates 104
that marginalisation was indeed associated with lower rates of formal healthcare access, especially in 105
the more resource-constrained context of rural Lao PDR. Although mobile phones were distributed 106
less equitably than health-related social support, both mobile phones and social support were linked to 107
disproportionate uptake of public healthcare among marginalised groups. However, in line with 108
previous findings, we also detected a consistent association between these facilitators and the delay 109
until patients accessed public and private healthcare providers. 110
In the next section, we develop our research hypotheses through a review the literature on 111
marginalisation as a multidimensional concept; through the inter-relationships between healthcare 112
access, marginalisation, social support, and technology; and through our previous work in this area. 113
Haenssgen et al. (paper prepared for DSA 2019) Page 6
2 Background 114
2.1 Poverty and Marginalisation 115
While historically the income-centric definition of poverty had been pervasive (evident e.g. in the 116
‘bottom of the pyramid’ approach to poverty alleviation, Peredo et al., 2018), the contemporary 117
consensus in development research and practice is that poverty is a multidimensional concept (Alkire 118
& Foster, 2011; Rahnema, 2010; World Bank, 2018a). Marginalisation and marginality are closely 119
related to multidimensional poverty, sometimes used as explanatory frameworks, and sometimes as 120
synonyms, for multidimensional poverty.1 The main difference between marginality and 121
marginalisation is that, if marginality is regarded as “the position of people on the edges, preventing 122
their access to resources and opportunities, freedom of choices, and the development of personal 123
capabilities;” then marginalisation can be considered to be the process in which people are pushed 124
towards these “social, political, economic, ecological, and biophysical” edges of society (Sahli, 1981; 125
von Braun & Gatzweiler, 2014:3). For the purposes of this paper, however, we treat marginalisation 126
and marginality synonymously as a state of affairs (unless otherwise indicated as a process). Our 127
conception of marginalisation comprises multiple dimensions of disadvantage that situate people at 128
economic, social, and spatial margins of society, with a particular emphasis on structural (i.e. non-129
individual) forms of exclusion, like discrimination or remoteness of location (von Braun & Gatzweiler, 130
2014). 131
In practice, the operationalisation and measurement of multidimensional poverty and its structural 132
determinants vary considerably – both in terms of indicators and the levels on which they apply 133
(Abebaw & Admassie, 2014; Ahmed et al., 2014; Alkire & Foster, 2011; Azeem et al., 2018; Berman 134
1 Similarly, close links and overlaps exist between marginalisation and the concepts of deprivation, vulnerability, and
sustainable livelihoods.
Haenssgen et al. (paper prepared for DSA 2019) Page 7
& Phillips, 2000; Kumar, 2014; Pattanaik & Xu, 2018; Steinert et al., 2018; Sumner & Mallett, 2013). 135
Among recent contributions to this field are for example Samuel et al. (2018), who discuss the role of 136
social isolation as an often-neglected facet of multidimensional poverty, exemplifying their arguments 137
with cases of South Africa and Mozambique. Another example is Graw and Husmann (2014). 138
Speaking to measurement on different levels, the authors assess marginalisation through indicators on 139
the national level through per-capita income and political stability, and on the sub-national level 140
through the prevalence of stunting and the travel time to the nearest city (alongside a soil quality 141
indicator to approximate ecosystem conditions). Espinoza-Delgado and Klasen (2018) further argue 142
that multidimensional poverty analyses typically focus on the household as a unit of analysis, while 143
assessments of intra-household inequality and gender-sensitive research require an individual-level 144
analysis. Moreover, in the context of Uganda, Datzberger (2018) provides an example of how the 145
various dimensions of marginalisation interact, as structural factors spanning social, economic, and 146
political dimensions (e.g. social aspirations, labour market conditions, corruption) prevented poor 147
people in Uganda to benefit from educational reforms (similar to the notion of fractal poverty traps; 148
Barrett & Swallow, 2006). 149
As described further in Section 3, we operationalised marginalisation in this study through five 150
indicators along three dimensions: social marginalisation (education and belonging to a minority group 151
in a village), economic marginalisation (household assets), and spatial marginalisation (remoteness 152
and travel time to nearest town). We consider healthcare access as our outcome variable and mobile 153
phone use and social support networks as determinants of primary interest. We are conscious of the 154
fact that marginalisation dimensions should ideally be grounded in the local context (Rahnema, 2010), 155
and that they extend potentially much further than the three dimensions we focus on here – in principle, 156
factors like healthcare access, use of technology, and access to social support networks can reasonably 157
fall under the definition of marginalisation (Abebaw & Admassie, 2014; Samuel et al., 2018; van Dijk, 158
Haenssgen et al. (paper prepared for DSA 2019) Page 8
2005; von Braun & Gatzweiler, 2014). We therefore review the interrelationship of these factors in the 159
following parts of this section. 160
2.2 Healthcare Access and its Links to Marginalisation, Social Support Networks, and 161
Technology 162
Access to healthcare is a prominent subject in public health and medical anthropology. This concept 163
considers the actual or potential utilisation of available services as part of a spectrum that variously 164
includes healthcare needs and demand, treatment-seeking processes, access to and utilisation of 165
healthcare (incl. barriers to access), and the ensuing health outcomes and other socio-economic 166
consequences (Andersen, 1995; Bigdeli et al., 2012; Chuma et al., 2010; Gulliford et al., 2002; 167
Levesque et al., 2013). Empirical research in public health and medical anthropology has established 168
a long list of factors influencing healthcare access, including, for example, the nature, severity, and 169
stage of a patient’s illness and their socio-economic background and health beliefs; trust in and 170
perceptions of the health provider quality; or societal perceptions of the health condition (Beals, 1976; 171
Kroeger, 1983; Nyamongo, 2002; Shaikh et al., 2008; Ward et al., 1997). Marginalisation and 172
multidimensional poverty in their various interpretations have become a theme in healthcare access 173
research as well (Barbosa & Cookson, 2019; Dupas, 2011; Obrist et al., 2007; Ribera & Hausmann-174
Muela, 2011). 175
One of the growing topics in healthcare access research is the role of social networks (Chuang & 176
Schechter, 2015; Perkins et al., 2015). For example, Neely and Ponshunmugam (2019) demonstrate in 177
a South African case study how rural dwellers’ healthcare access is not only a function of their distance 178
to health facilities as a form of spatial marginalisation, but also of a lack of healthcare resources, 179
transport conditions, and historically and politically shaped kinship networks. Another example is 180
Herberholz and Phuntsho (2018), who analyse survey data from Bhutan and document that healthcare 181
choices especially in rural areas are affected by social capital (measured as the number of close social 182

Haenssgen et al. (paper prepared for DSA 2019) Page 9
network ties and the ability to trust and borrow money from them). Similar to the study by Pescosolido 183
et al. (1998) on mental health and social networks in Puerto Rico, the authors find for instance that 184
rural Bhutanese dwellers with extensive social networks have lower utilisation of higher-tier formal 185
healthcare providers. However – like most research in this area (Pitkin Derose & Varda, 2009) – 186
associations between social capital and treatment-seeking behaviour are only indirect (i.e. no direct 187
measure of social network utilisation during an illness) and the direction of the documented impacts is 188
mixed. The nature of social network influences among marginalised groups in LMICs remains thus 189
inconclusive and requires further research. 190
Another field of growing interest is the role of information and communication technology (ICT) in 191
healthcare access in LMICs. We focus here on mobile phones as a type of ICT that is diffusing rapidly 192
around the globe (teledensity now exceeds 100 mobile subscriptions per 100 people in both developed 193
and developing countries according to ITU, 2019b), and which has experienced the fasted growth 194
within ICT and development (ICTD) research (Gomez et al., 2012). Medical research contributions to 195
this field have expanded rapidly into the terrain of how best to utilise phones as platforms for health 196
service delivery and for promoting healthy behaviour especially among marginalised populations 197
(Aranda-Jan et al., 2014; Free et al., 2013a; Free et al., 2013b; Lee et al., 2016; Mbuagbaw et al., 198
2015; van Heerden et al., 2012).2 A similar emphasis on the instrumental use of ICT for development 199
exists in the social sciences (Aker & Mbiti, 2010; Unwin, 2009b). However, social research also 200
considers the broader development implications of technology diffusion (Donner, 2009; Gagliardone, 201
2015; Jensen, 2007), and it is becoming increasingly theorised and critical with research that 202
interrogates persistent inequalities and the social role of mobile phones in general as well as in 203
healthcare in particular (De´ et al., 2018; Gomez et al., 2012; Heeks & Wall, 2018; Jeffrey & Doron, 204
2 These sources are indicative of a large body of literature, comprising more than 100 systematic reviews and reviews of
reviews.
Haenssgen et al. (paper prepared for DSA 2019) Page 10
2013; Kleine, 2013; Lupton, 2014; Sein et al., 2019). For the purposes of this paper, two important 205
gaps in the ICTD literature relating to the social consequences of technology diffusion are worth 206
discussing further. 207
The first gap is the relationship between social networks and the spread of mobile phones.3 A small 208
but growing number of studies indicate that the increasing use of mobile phones changes social 209
network structures away from local friendship connections towards kinship networks (Miritello et al., 210
2013; Saramäki et al., 2014). An example of such research is Garretson et al. (2018), who provide 211
indicative (yet inconclusive) evidence from high-income groups in urban Kenya that social interaction 212
had become increasingly mediated by mobile phones, whereby the authors attribute the gradual 213
friendship-to-family network shift to the coinciding rapid diffusion of mobile phones. Further evidence 214
is provided through a recent analysis in Tanzania by Riley (2018), which demonstrates how mobile 215
money services facilitate the transfer of remittances especially during crises and thereby help rural 216
households to cushion the impact of rainfall shocks – but without spill-overs to other households in 217
the same community. The study argues that the financial facilitation enabled by the mobile phone 218
service could strengthen household-centric family networks at the expense of community-level support 219
networks (Riley, 2018). More generally, the yet sparse research in this area suggests that mobile phone 220
diffusion could affect social support networks in subtle ways by increasing the attention on one’s 221
closest contacts (Ling, 2008), which could create new divisions and inequalities among the rural poor. 222
The second gap is the impact of mobile phone diffusion on healthcare access outside of specific health 223
interventions. This nascent literature addresses the local emergence of phone-aided healthcare access 224
and its consequences on behaviour, equity, and health outcomes. One of the first large-scale 225
3 We focus here primarily on the impact of mobile technology diffusion on social networks. For arguments regarding the
role of the social context in shaping mobile phone diffusion, see e.g. Hahn and Kibora (2008); for arguments in the context
of specific ICTD interventions, see e.g. Renken and Heeks (2018).
Haenssgen et al. (paper prepared for DSA 2019) Page 11
assessments of such emerging mobile phone use is Khatun et al. (2014), who report that 1.9% of 2,581 226
surveyed patients in Bangladesh contacted a health provider through a phone (most interactions take 227
place face-to-face). A larger extent of health-related mobile phone use is observed by Hampshire et al. 228
(2015), who surveyed 4,626 youths aged 8 to 25 years across Ghana, Malawi, and South Africa, finding 229
that around one-third of their respondents used a mobile phone for their own or someone else’s illness 230
in the 12 month-period before their survey. These phones were used, among others, to contact family 231
members for help or to find information online. However, like most studies in this area, the authors do 232
not provide evidence on the consequences of this emerging mobile phone use.4 233
Our own research in this area has involved systematic assessments of the healthcare consequences of 234
this informal health-related mobile phone use in rural India and rural China. In Haenssgen and Ariana 235
(2017b), we analyse cross-sectional survey data from 800 villagers across both countries, detect a wide 236
range of informal uses among 20% of the field site population in China and 7.5% in India, and find 237
that these uses are linked to increased healthcare utilisation but also more delays to care – especially 238
among more privileged segments of the rural population. Haenssgen (2018) expands this work with 239
panel data from rural India. The study finds evidence consistent with the claim that the rural health 240
system adapted to rapid mobile phone diffusion between 2005 and 2012 and increasingly excluded 241
poor households without mobile phones from healthcare access. 242
In summary, marginalisation and multidimensional poverty link to the study of healthcare access, 243
especially in the context of barriers to formal healthcare utilisation. The areas of social network and 244
technological impacts on healthcare access are growing fast but continue to be inconclusive and 245
patchy. Especially the role of social and digital exclusion – their interactions as well as their individual 246
4 A follow-up publication documents the informal health-related use of mobile phones among community health workers,
suggesting that this bridged gaps in access to healthcare but could also put the health workers at a disadvantage, e.g.
financially (Hampshire et al., 2017).

Haenssgen et al. (paper prepared for DSA 2019) Page 12
impact on healthcare access in LMICs – continues to be under-researched despite their importance for 247
understanding the socio-technological change that we are witnessing around the world. This study 248
aims to fill this gap by building on prior research on informal health-related mobile phone use and 249
expanding the analysis towards the role of social support networks. In the following sub-section, we 250
will develop and explain the research hypotheses that guided our analysis. 251
2.3 Hypotheses 252
What would we expect to happen in rural contexts where mobile phones are becoming increasingly 253
prevalent? Based on our review of the relationship between marginalisation, social networks, 254
technology diffusion, and healthcare utilisation, we explain in this section our two hypotheses.5 255
Firstly, not everyone in rural areas of LMICs is poor and marginalised. More privileged groups have 256
a broader array of solutions (e.g. vehicles, money, social and professional networks, phones) that 257
facilitate their access to healthcare. Marginalised groups lack this diversity of means, which impedes 258
their utilisation especially of formal (public and private) healthcare providers. We therefore 259
hypothesise in the first instance that marginalised groups are more likely to depend on informal 260
healthcare providers like local traditional healers or grocery stores that sell non-prescription 261
medication over-the-counter. More specifically, we hypothesise that this pattern of healthcare access 262
5 The two main hypotheses in this paper relate to the following hypotheses of the larger research project (Haenssgen et al.,
2018b):
H1. Marginalised groups have fewer means to access formal treatment, which increases their likelihood to rely on over-
the-counter medicines including antibiotics as an alternative solution.
H2. Technology use increases access to formal healthcare providers but is directed towards those who are more inclined to
prescribe antibiotics.
Haenssgen et al. (paper prepared for DSA 2019) Page 13
is manifest in utilisation rates as well as the time it takes marginalised groups to reach a formal 263
healthcare provider: 264
265
H1. Marginalised groups have fewer means to access formal treatment, driving them towards 266
increased informal healthcare access. 267
H1a) Marginalisation links positively to informal healthcare access and negatively to formal 268
healthcare access. 269
H1b) Marginalised groups experience longer delays to formal healthcare access. 270
271
Secondly, the rapid spread of mobile phones across LMICs influences the manifestation and patterns 272
of marginalisation in rural areas, but the process of diffusion tends to evolve along, and reproduce, 273
socio-economic gradients. Health-related mobile phone use helps individuals to overcome access 274
constraints, opening a broader set of treatment options and sources of information – provided they are 275
not among the most marginalised groups. We argue that a similar effect arises from local social support 276
networks, which, however, are distributed more equitably and provide facilitation for a larger group 277
of marginalised people. All this does not mean that facilitated healthcare access (be it through mobile 278
phones or social networks) is automatically more beneficial for individuals. Rather, our previous 279
research and the literature lead us to hypothesise that the conspicuous performance of private 280
healthcare providers and the signal of quality associated with user fees can drive health behaviours 281
towards private rather than public health services (Dupas, 2011; Leventhal et al., 2008), whereby 282
increased service uptake need not necessarily be economically efficient nor medically desirable: 283
284
H2. Social support and phone use help marginalised groups overcome constraints in accessing 285
formal healthcare, but facilitation is directed towards private providers. 286
Haenssgen et al. (paper prepared for DSA 2019) Page 14
H2a) Facilitators like social support and phone use entail more and faster access to formal healthcare 287
providers. 288
H2b) Private healthcare access increases disproportionately when marginalised groups involve social 289
support and mobile phones. 290
H2c) Social support and phone use are less influential among non-marginalised groups. 291
292
We describe the methodology to test these hypotheses in the following section. 293
3 Material and Methods 294
3.1 Research Design and Data Collection 295
This paper arose from a broader social research project in the field of antimicrobial resistance 296
(Haenssgen et al., 2018b), for which we selected Southeast Asia as a high-risk region (Ashley et al., 297
2014; Chereau et al., 2017). We chose the cases of Chiang Rai in Thailand and Salavan in Lao PDR 298
because both sites had diverse ethnic groups (more than ten in each site), varied geographies (plateaus 299
and mountainous areas), and they were among the poorest provinces in their respective countries 300
(Coulombe et al., 2016; National Statistical Office, 2016). At the same time, Thailand as a middle-301
income country had a larger economy, more formalised healthcare provision, and better health 302
outcomes than Lao PDR as a low-income country (World Bank, 2018b) – which provided 303
opportunities for comparative analyses. We focused specifically on rural settings, where formal and 304
informal health systems experience greater infrastructural, human resource, financial, and regulatory 305
constraints, and where economic, social, and spatial marginalisation are more widespread. Among the 306
rural population, we considered specifically adults (aged 18 years and above). The total rural adult 307
population in Chiang Rai was 522,000; the rural adult population in Salavan was 190,000 (Lao 308
Statistics Bureau, 2015, 2016; National Statistical Office, 2012). 309
Haenssgen et al. (paper prepared for DSA 2019) Page 15
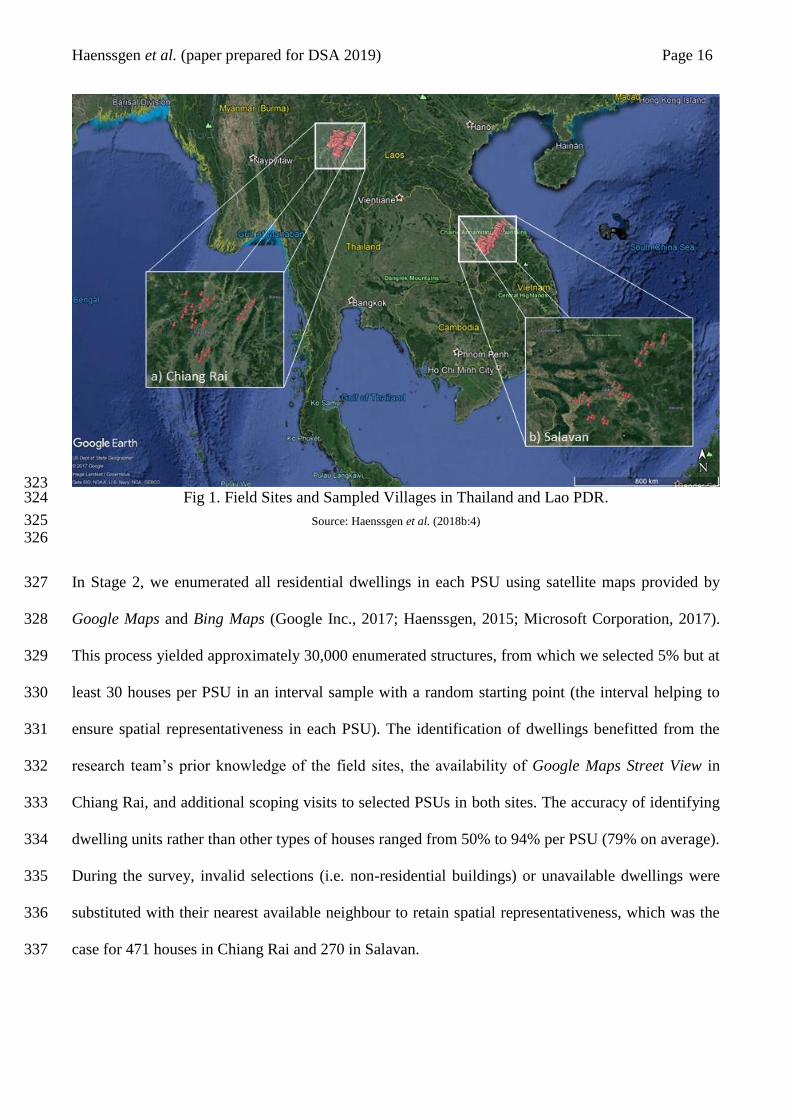
We collected cross-sectional survey data between November 2017 and May 2018 in a three-stage 310
stratified cluster random survey design.6 Stage 1 comprised the random selection of six primary 311
sampling units (PSUs) in five purposively sampled districts in each site (Fig. 1 illustrates the PSUs in 312
each site). The PSUs were selected from a geo-coded list of 3,100 villages (National Geospatial-313
Intelligence Agency, 2017), and we substituted selections that did not correspond to actual villages or 314
that were not visible on satellite maps with a random replacement from the sampling frame (64 315
replacements in total, mostly concentrated in two districts in Salavan where the quality of the geo-316
coded list was more variable). The PSU sample was stratified by the median distance to the nearest 317
urban area in each district (i.e. 50% of the PSU sample were above the median distance). To ensure 318
sufficient representation, one PSU could contain more than one administrative village; if the first-319
chosen village contained less than 600 houses, then adjacent villages would be included. The 30 PSUs 320
therefore corresponded to 69 administrative villages in Chiang Rai and 65 in Salavan. 321
322
6 The research was reviewed and approved by the University of Oxford Tropical Research Ethics Committee (Ref.
OxTREC 528-17), the Mae Fah Luang University Research Ethics Committee on Human Research in Thailand (Ref. REH
60099), and the National Ethics Committee for Health Research in Lao PDR (Ref. NEHCR 074). We received permission
to access the study villages from local security authorities and villages leaders, obtained informed verbal consent from all
study participants, and compensated the survey respondents with small financial token of appreciation equivalent to GBP
1.00.
Haenssgen et al. (paper prepared for DSA 2019) Page 16
323 Fig 1. Field Sites and Sampled Villages in Thailand and Lao PDR. 324
Source: Haenssgen et al. (2018b:4) 325 326
In Stage 2, we enumerated all residential dwellings in each PSU using satellite maps provided by 327
Google Maps and Bing Maps (Google Inc., 2017; Haenssgen, 2015; Microsoft Corporation, 2017). 328
This process yielded approximately 30,000 enumerated structures, from which we selected 5% but at 329
least 30 houses per PSU in an interval sample with a random starting point (the interval helping to 330
ensure spatial representativeness in each PSU). The identification of dwellings benefitted from the 331
research team’s prior knowledge of the field sites, the availability of Google Maps Street View in 332
Chiang Rai, and additional scoping visits to selected PSUs in both sites. The accuracy of identifying 333
dwelling units rather than other types of houses ranged from 50% to 94% per PSU (79% on average). 334
During the survey, invalid selections (i.e. non-residential buildings) or unavailable dwellings were 335
substituted with their nearest available neighbour to retain spatial representativeness, which was the 336
case for 471 houses in Chiang Rai and 270 in Salavan. 337

Haenssgen et al. (paper prepared for DSA 2019) Page 17
In the final Stage 3, all household members in the selected dwellings were enumerated in the field, and 338
one adult respondent was selected for every five eligible household members. A household was defined 339
as a residential unit that shares a kitchen; eligible members were those who had typically resided in 340
this household for at least six months prior to the survey and who were available for an interview. The 341
field team performed up to two visits to each sampled house, and they were encouraged to make 342
appointments or locate the selected household member in or around the village (or in nearby urban 343
areas, if feasible) if they were unavailable at the first visit. Household members who declined the 344
invitation to participate in the survey were substituted with a randomly selected replacement from the 345
same household (7 in Chiang Rai, 12 in Salavan). The randomisation was implemented through tablets 346
running the survey software SurveyCTO (Dobility Inc., 2017). 347
The total sample selected through this three-stage process included 1158 villagers in Chiang Rai and 348
983 in Salavan. The surveys were implemented by locally recruited field teams that comprised six to 349
eight field investigators plus two survey supervisors. Survey training involved five days of full-time 350
classroom and field training for the field investigators, and an additional five days for survey 351
supervisors. The survey supervisors monitored the recruitment and data collection process, a project 352
research officer conducted additional spot-checks and provided ongoing refresher training for the 353
survey team; and the principal investigator monitored the data collection process and data quality 354
remotely via SurveyCTO monitoring tools. In less than 20 instances, incomplete or corrupted data 355
required field investigators and survey supervisors to revisit a respondent. 356
Our survey instrument was a 45-minute health behaviour questionnaire administered face-to-face in 357
Thai and Lao. The questionnaire was based on earlier qualitative research on health behaviour in 358
Southeast Asia, and its development was supported through field testing and cognitive interviewing 359
(cognitive interviews not reported here; Willis, 2015). Language difficulties arose due to the ethnic 360
diversity in the field in 228 instances, which were resolved by recruiting local translators within the 361
villages. Treatment-seeking behaviour was recorded if a respondent or a child under their supervision 362
Haenssgen et al. (paper prepared for DSA 2019) Page 18
experienced an acute illness or accident-related injury in the two months prior to the survey. We 363
recorded 608 such illness episodes in Chiang Rai and 356 in Salavan. 364
3.2 Variables and Data 365
The questionnaire covered demographic and socio-economic information, knowledge and attitudes 366
about local healthcare providers and antibiotics, and treatment-seeking behaviour (enclosed in the 367
supplemental material). The main variables of interest in this study related to marginalisation, 368
treatment-seeking behaviour, and its determinants (see Table 1 for summary statistics; a detailed 369
description of each variable used in this paper is provided in Appendix Table A1). 370
Our operationalisation of marginalisation had three dimensions and five indicators. The first dimension 371
was “social marginalisation,” which we assessed through two indicators. The first indicator was 372
education, where we defined a person to be marginalised if s/he had received no formal education at 373
all (as opposed to at least one completed year of schooling). The second indicator was ethnicity, 374
specifically whether the ethnic group of the respondent represented less than 20% of the population in 375
the village. The logic of this dimension was that an individual belonging to an ethnic minority group 376
might have been more likely to face impediments in accessing healthcare if this group was also a 377
minority in the same village. The second dimension was “economic marginalisation,” which we 378
defined as individuals belonging to the bottom household wealth quintile in their respective site (i.e. 379
Chiang Rai or Salavan). The third dimension was “spatial marginalisation,” which we assessed with 380
two indicators on the village level. The first indicator was travel time, which indicated situations of 381
marginalisation if it exceeded more than 30 minutes by car to the nearest town. The second indicator 382
was a semi-quantitative assessment of village remoteness by the survey team (peri-urban, rural, 383
remote), whereby we assessed “remote” villages as marginalised. 384
385
Haenssgen et al. (paper prepared for DSA 2019) Page 19
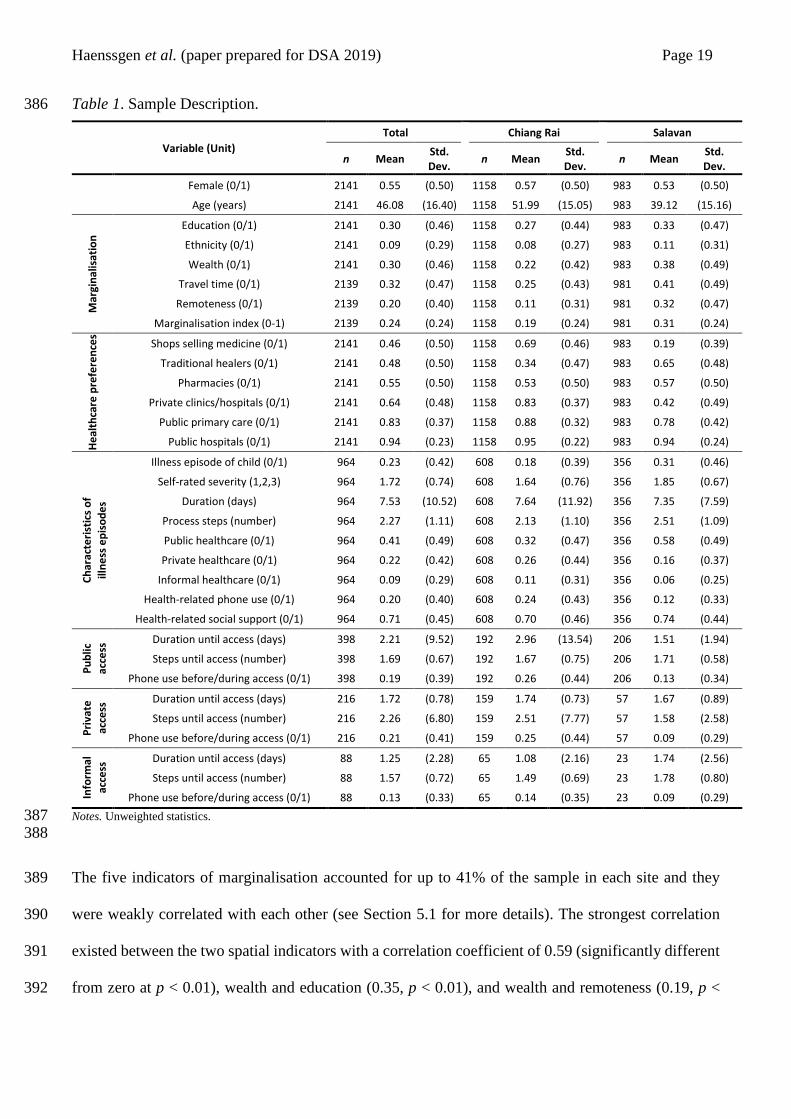
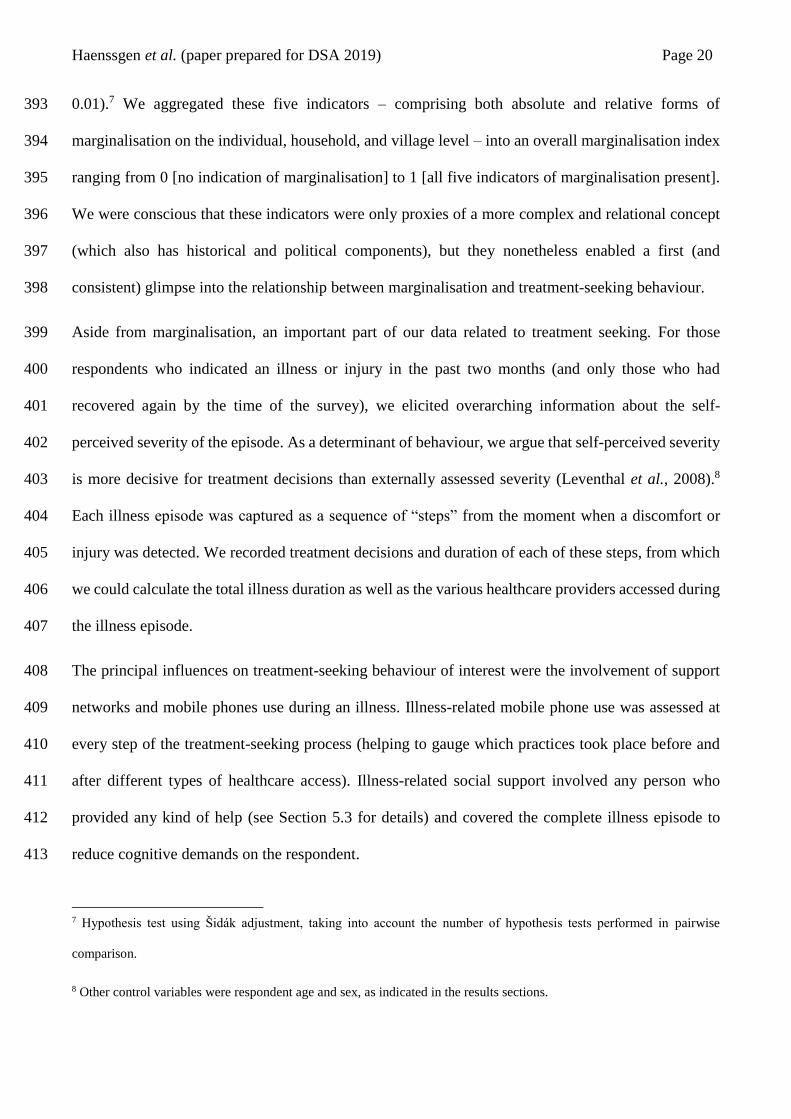
Table 1. Sample Description. 386
Variable (Unit)
Total Chiang Rai Salavan
n Mean Std. Dev.
n Mean Std. Dev.
n Mean Std. Dev.
Female (0/1) 2141 0.55 (0.50) 1158 0.57 (0.50) 983 0.53 (0.50)
Age (years) 2141 46.08 (16.40) 1158 51.99 (15.05) 983 39.12 (15.16)
Mar
gin
alis
atio
n Education (0/1) 2141 0.30 (0.46) 1158 0.27 (0.44) 983 0.33 (0.47)
Ethnicity (0/1) 2141 0.09 (0.29) 1158 0.08 (0.27) 983 0.11 (0.31)
Wealth (0/1) 2141 0.30 (0.46) 1158 0.22 (0.42) 983 0.38 (0.49)
Travel time (0/1) 2139 0.32 (0.47) 1158 0.25 (0.43) 981 0.41 (0.49)
Remoteness (0/1) 2139 0.20 (0.40) 1158 0.11 (0.31) 981 0.32 (0.47)
Marginalisation index (0-1) 2139 0.24 (0.24) 1158 0.19 (0.24) 981 0.31 (0.24)
He
alth
care
pre
fere
nce
s
Shops selling medicine (0/1) 2141 0.46 (0.50) 1158 0.69 (0.46) 983 0.19 (0.39)
Traditional healers (0/1) 2141 0.48 (0.50) 1158 0.34 (0.47) 983 0.65 (0.48)
Pharmacies (0/1) 2141 0.55 (0.50) 1158 0.53 (0.50) 983 0.57 (0.50)
Private clinics/hospitals (0/1) 2141 0.64 (0.48) 1158 0.83 (0.37) 983 0.42 (0.49)
Public primary care (0/1) 2141 0.83 (0.37) 1158 0.88 (0.32) 983 0.78 (0.42)
Public hospitals (0/1) 2141 0.94 (0.23) 1158 0.95 (0.22) 983 0.94 (0.24)
Ch
arac
teri
stic
s o
f
illn
ess
ep
iso
de
s
Illness episode of child (0/1) 964 0.23 (0.42) 608 0.18 (0.39) 356 0.31 (0.46)
Self-rated severity (1,2,3) 964 1.72 (0.74) 608 1.64 (0.76) 356 1.85 (0.67)
Duration (days) 964 7.53 (10.52) 608 7.64 (11.92) 356 7.35 (7.59)
Process steps (number) 964 2.27 (1.11) 608 2.13 (1.10) 356 2.51 (1.09)
Public healthcare (0/1) 964 0.41 (0.49) 608 0.32 (0.47) 356 0.58 (0.49)
Private healthcare (0/1) 964 0.22 (0.42) 608 0.26 (0.44) 356 0.16 (0.37)
Informal healthcare (0/1) 964 0.09 (0.29) 608 0.11 (0.31) 356 0.06 (0.25)
Health-related phone use (0/1) 964 0.20 (0.40) 608 0.24 (0.43) 356 0.12 (0.33)
Health-related social support (0/1) 964 0.71 (0.45) 608 0.70 (0.46) 356 0.74 (0.44)
Pu
blic
acce
ss Duration until access (days) 398 2.21 (9.52) 192 2.96 (13.54) 206 1.51 (1.94)
Steps until access (number) 398 1.69 (0.67) 192 1.67 (0.75) 206 1.71 (0.58)
Phone use before/during access (0/1) 398 0.19 (0.39) 192 0.26 (0.44) 206 0.13 (0.34)
Pri
vate
acce
ss Duration until access (days) 216 1.72 (0.78) 159 1.74 (0.73) 57 1.67 (0.89)
Steps until access (number) 216 2.26 (6.80) 159 2.51 (7.77) 57 1.58 (2.58)
Phone use before/during access (0/1) 216 0.21 (0.41) 159 0.25 (0.44) 57 0.09 (0.29)
Info
rmal
acce
ss Duration until access (days) 88 1.25 (2.28) 65 1.08 (2.16) 23 1.74 (2.56)
Steps until access (number) 88 1.57 (0.72) 65 1.49 (0.69) 23 1.78 (0.80)
Phone use before/during access (0/1) 88 0.13 (0.33) 65 0.14 (0.35) 23 0.09 (0.29)
Notes. Unweighted statistics. 387 388
The five indicators of marginalisation accounted for up to 41% of the sample in each site and they 389
were weakly correlated with each other (see Section 5.1 for more details). The strongest correlation 390
existed between the two spatial indicators with a correlation coefficient of 0.59 (significantly different 391
from zero at p < 0.01), wealth and education (0.35, p < 0.01), and wealth and remoteness (0.19, p < 392
Haenssgen et al. (paper prepared for DSA 2019) Page 20
0.01).7 We aggregated these five indicators – comprising both absolute and relative forms of 393
marginalisation on the individual, household, and village level – into an overall marginalisation index 394
ranging from 0 [no indication of marginalisation] to 1 [all five indicators of marginalisation present]. 395
We were conscious that these indicators were only proxies of a more complex and relational concept 396
(which also has historical and political components), but they nonetheless enabled a first (and 397
consistent) glimpse into the relationship between marginalisation and treatment-seeking behaviour. 398
Aside from marginalisation, an important part of our data related to treatment seeking. For those 399
respondents who indicated an illness or injury in the past two months (and only those who had 400
recovered again by the time of the survey), we elicited overarching information about the self-401
perceived severity of the episode. As a determinant of behaviour, we argue that self-perceived severity 402
is more decisive for treatment decisions than externally assessed severity (Leventhal et al., 2008).8 403
Each illness episode was captured as a sequence of “steps” from the moment when a discomfort or 404
injury was detected. We recorded treatment decisions and duration of each of these steps, from which 405
we could calculate the total illness duration as well as the various healthcare providers accessed during 406
the illness episode. 407
The principal influences on treatment-seeking behaviour of interest were the involvement of support 408
networks and mobile phones use during an illness. Illness-related mobile phone use was assessed at 409
every step of the treatment-seeking process (helping to gauge which practices took place before and 410
after different types of healthcare access). Illness-related social support involved any person who 411
provided any kind of help (see Section 5.3 for details) and covered the complete illness episode to 412
reduce cognitive demands on the respondent. 413
7 Hypothesis test using Šidák adjustment, taking into account the number of hypothesis tests performed in pairwise
comparison.
8 Other control variables were respondent age and sex, as indicated in the results sections.
Haenssgen et al. (paper prepared for DSA 2019) Page 21
3.3 Analysis 414
We followed the empirical strategy of Haenssgen and Ariana (2017a) and Haenssgen and Ariana 415
(2017b). In brief, we first contextualised the research with a description of the case study using macro-416
level secondary data and literature. We then carried out a descriptive statistical analysis of our survey 417
data to document living conditions, patterns of marginalisation, treatment-seeking behaviour, and the 418
various ways in which people use mobile phones and activate their social support networks during an 419
illness. All descriptive statistics were weighted using census data to be representative for the rural 420
populations of Chiang Rai and Salavan (Heeringa et al., 2010). As part of the descriptive statistical 421
analysis, we examined whether people with health-related mobile phones use and social support were 422
less marginalised than people who did not experience such support, testing for statistical differences 423
with Pearson X2 tests for binary indicators of marginalisation and two-sided t-tests for the total 424
marginalisation index. 425
To test our research hypotheses, we estimated healthcare access models for public, private, and 426
informal healthcare. Owing to the different health system conditions in our field sites, we stratified the 427
analysis along the sub-samples of Chiang Rai and Salavan before analysing the pooled sample. Models 428
that estimated the probability of healthcare access drew on the sample of all respondents, whereas 429
models estimating the delay to access were situated on the illness-level and only used the sub-sample 430
of responses that accessed the respective type of care (e.g. the delay to public healthcare could not be 431
estimated for respondents who did not access any public provider). 432
We estimated multi-level regression models of healthcare access because of the hierarchical structure 433
of our data (i.e. illness episodes nested in individuals, nested in villages, nested in districts, nested in 434
sites). Owing to the nature of the dependent variables, we estimated multilevel logistic regression 435
models for the probability of accessing healthcare, and multilevel negative binomial models for the 436
Haenssgen et al. (paper prepared for DSA 2019) Page 22
duration until healthcare access.9 We estimated 3-level models for the respective site samples 437
(individual, village, and district level), and 4-level models for the pooled sample (as before, plus site 438
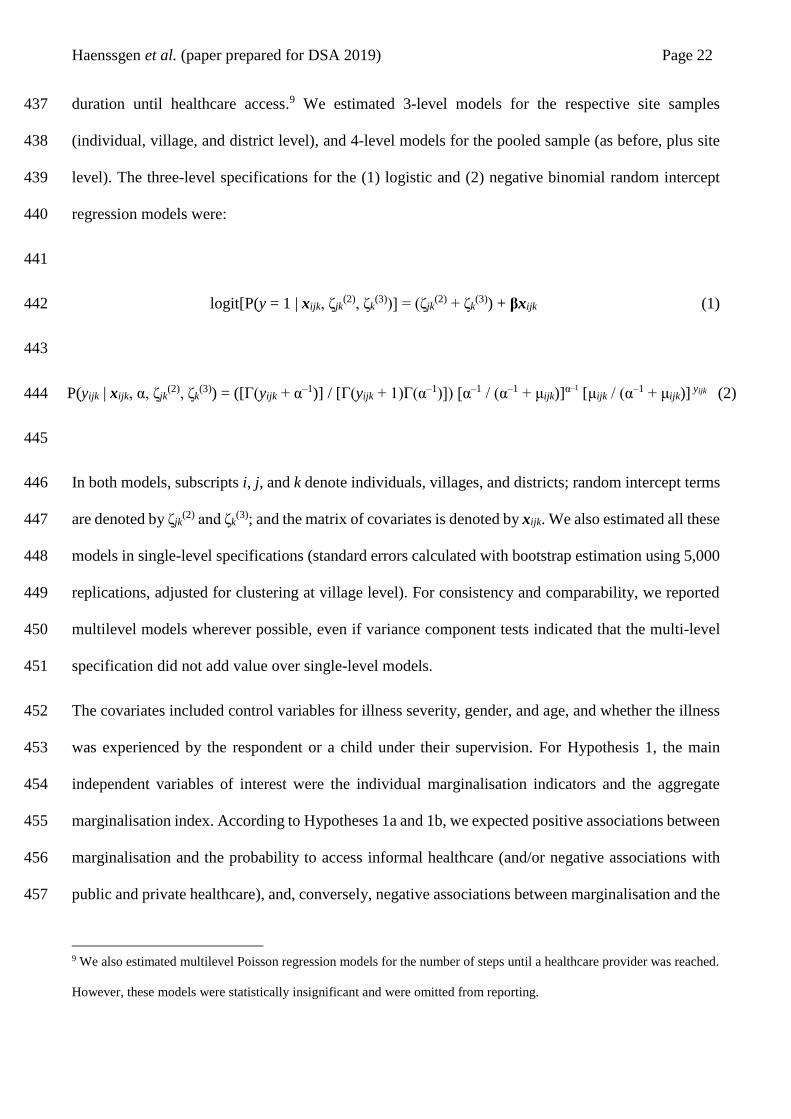
level). The three-level specifications for the (1) logistic and (2) negative binomial random intercept 439
regression models were: 440
441
logit[P(y = 1 | xijk, ζjk(2), ζk
(3))] = (ζjk(2) + ζk
(3)) + βxijk (1) 442
443
P(yijk | xijk, α, ζjk(2), ζk
(3)) = ([Γ(yijk + α–1)] / [Γ(yijk + 1)Γ(α–1)]) [α–1 / (α–1 + μijk)]α–1
[μijk / (α–1 + μijk)]
yijk (2) 444
445
In both models, subscripts i, j, and k denote individuals, villages, and districts; random intercept terms 446
are denoted by ζjk(2) and ζk
(3); and the matrix of covariates is denoted by xijk. We also estimated all these 447
models in single-level specifications (standard errors calculated with bootstrap estimation using 5,000 448
replications, adjusted for clustering at village level). For consistency and comparability, we reported 449
multilevel models wherever possible, even if variance component tests indicated that the multi-level 450
specification did not add value over single-level models. 451
The covariates included control variables for illness severity, gender, and age, and whether the illness 452
was experienced by the respondent or a child under their supervision. For Hypothesis 1, the main 453
independent variables of interest were the individual marginalisation indicators and the aggregate 454
marginalisation index. According to Hypotheses 1a and 1b, we expected positive associations between 455
marginalisation and the probability to access informal healthcare (and/or negative associations with 456
public and private healthcare), and, conversely, negative associations between marginalisation and the 457
9 We also estimated multilevel Poisson regression models for the number of steps until a healthcare provider was reached.
However, these models were statistically insignificant and were omitted from reporting.

Haenssgen et al. (paper prepared for DSA 2019) Page 23
delay until informal healthcare providers were reached (and/or positive associations with public and 458
private healthcare). 459
For Hypothesis 2, we limited the analysis of marginalisation to the aggregate index to limit complexity 460
and considered health-related mobile phone use and social support as main variables of interest. 461
Positive associations between these variables and public/private healthcare access (and negative 462
associations for access delays) would be consistent with Hypothesis 2a irrespective of the degree of 463
marginalisation of the patient. However, Hypotheses 2b and 2c required us to gauge the role of mobile 464
phones and social support in relation to marginalisation. We were therefore especially interested in the 465
interactions between marginalisation on the one hand, and health-related mobile phone use 466
(PHONxMARG) and social support (SUPPxMARG) on the other hand. Positive interaction terms 467
would thereby indicate that a combined effect of being marginalised and using phones for health-468
related issues is associated with a higher probability of access or a longer access delay. 469
4 Case Context 470
4.1 Development Context 471
In preparation for the analysis, this section provides a brief macro overview of the development and 472
health system context of Thailand and Lao PDR, and the relative position of Chiang Rai and Salavan 473
therein. Table 2 compares main development and health indicators between the two countries (the 474
World Bank averages for LMICs are included to put these figures in perspective). Latest available data 475
from the World Bank showed relatively higher socio-economic indicators in Thailand. Extreme 476
poverty at USD $1.90/day (in purchasing power parity) in Thailand had been near zero for more than 477
a decade and 8% lived below USD $5.50/day (i.e. the standard poverty line in upper-middle-income 478
countries), while Lao PDR reported 23% and 85%, respectively. These differences were also visible 479
in other indicators, as Lao PDR exhibited relatively lower rates of literacy and access to basic sanitation 480
Haenssgen et al. (paper prepared for DSA 2019) Page 24
despite gradual improvements. According to data from the International Telecommunication Union 481
(ITU), mobile subscription teledensity in Thailand was also more than three times higher than in Lao 482
PDR. However, the low teledensity reported by ITU for Lao PDR contrasted with 2015 data from 483
Coulombe et al. (2016), who estimated that, for example, 85% of the population in Salavan province 484
owned a mobile phone (ranging from 84% to 98% per province). However, as far as the World Bank 485
data are concerned, Thailand’s development indicators were above the LMIC average, whereas Lao 486
PDR’s indicators tended to rank below. 487
488
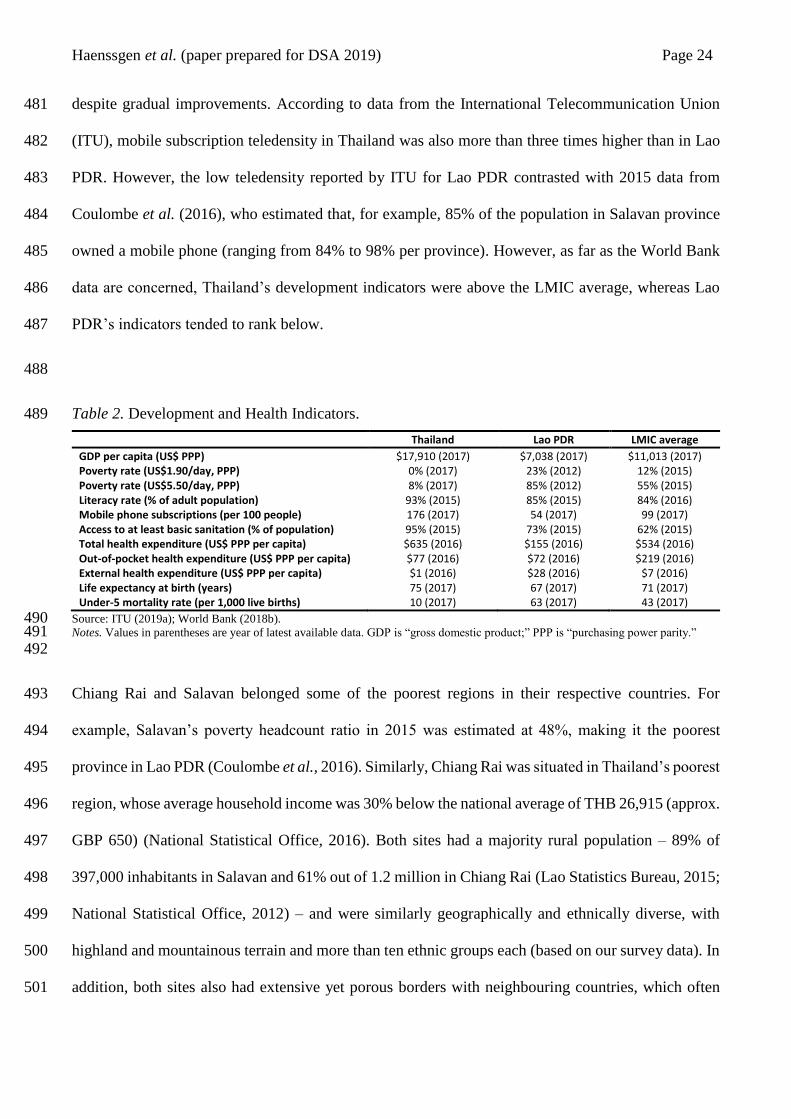
Table 2. Development and Health Indicators. 489
Thailand Lao PDR LMIC average
GDP per capita (US$ PPP) $17,910 (2017) $7,038 (2017) $11,013 (2017) Poverty rate (US$1.90/day, PPP) 0% (2017) 23% (2012) 12% (2015) Poverty rate (US$5.50/day, PPP) 8% (2017) 85% (2012) 55% (2015) Literacy rate (% of adult population) 93% (2015) 85% (2015) 84% (2016) Mobile phone subscriptions (per 100 people) 176 (2017) 54 (2017) 99 (2017) Access to at least basic sanitation (% of population) 95% (2015) 73% (2015) 62% (2015) Total health expenditure (US$ PPP per capita) $635 (2016) $155 (2016) $534 (2016) Out-of-pocket health expenditure (US$ PPP per capita) $77 (2016) $72 (2016) $219 (2016) External health expenditure (US$ PPP per capita) $1 (2016) $28 (2016) $7 (2016) Life expectancy at birth (years) 75 (2017) 67 (2017) 71 (2017) Under-5 mortality rate (per 1,000 live births) 10 (2017) 63 (2017) 43 (2017)
Source: ITU (2019a); World Bank (2018b). 490 Notes. Values in parentheses are year of latest available data. GDP is “gross domestic product;” PPP is “purchasing power parity.” 491 492
Chiang Rai and Salavan belonged some of the poorest regions in their respective countries. For 493
example, Salavan’s poverty headcount ratio in 2015 was estimated at 48%, making it the poorest 494
province in Lao PDR (Coulombe et al., 2016). Similarly, Chiang Rai was situated in Thailand’s poorest 495
region, whose average household income was 30% below the national average of THB 26,915 (approx. 496
GBP 650) (National Statistical Office, 2016). Both sites had a majority rural population – 89% of 497
397,000 inhabitants in Salavan and 61% out of 1.2 million in Chiang Rai (Lao Statistics Bureau, 2015; 498
National Statistical Office, 2012) – and were similarly geographically and ethnically diverse, with 499
highland and mountainous terrain and more than ten ethnic groups each (based on our survey data). In 500
addition, both sites also had extensive yet porous borders with neighbouring countries, which often 501
Haenssgen et al. (paper prepared for DSA 2019) Page 25
involved cross-border medical treatment especially from Lao PDR to Thailand (Apidechkul et al., 502
2016; Bochaton, 2015; High, 2009; Sakboon, 2007). 503
4.2 Health System Context 504
The structure of the public health service delivery in Thailand and Lao PDR is comparable on paper, 505
but the differences in practice are considerable. Both systems have a hospital at the provincial level to 506
oversee health services (in our case, Chiang Rai Prachanukroh Hospital and Salavan Provincial 507
Hospital). Service delivery on the district level is coordinated by the District Health Office (covering 508
50,000 people on average in Thailand and 30,000–70,000 people in Lao PDR), on the sub-district level 509
by primary care units (covering on average 5,000 people in Thailand and 7,000 people in Lao PDR), 510
and on the village level through village health volunteers (Akkhavong et al., 2014; Jongudomsuk et 511
al., 2015). However, the macro data presented in Table 2 indicated more extensive funding and more 512
favourable health outcomes in Thailand compared to Lao PDR. Thai per capita health expenditure was 513
more than four times higher than Lao PDR’s, the latter of which comprised 46% out-of-pocket 514
expenditure from households and 17% external expenditure (Thailand: 12% and 0%, respectively). 515
These figures reflected on health outcomes, whereby the estimated life expectancy at birth was eight 516
years higher and the under-five mortality rate was 53 deaths per 1,000 live births lower than in Lao 517
PDR. 518
Thailand has been able to achieve progress with ambitious universal healthcare policies especially 519
from 2002 onwards, which involved the establishment of public primary care units in every sub-district 520
and a reduction of out-of-pocket expenditure (Jongudomsuk et al., 2015; Rieger et al., 2017). But 521
effective coverage has remained patchy especially among informal workers, and people have 522
continued to depend at least partially on social support to cover healthcare expenditure (Neelsen et al., 523
2019). A further complication was that low-cost or free health services were only free for Thai citizens. 524
Support schemes for indigenous, stateless, or indigenous groups such as those in Chiang Rai existed 525

Haenssgen et al. (paper prepared for DSA 2019) Page 26
but have been changing regularly and were difficult to navigate, and interactions between public 526
healthcare providers and these groups often faced social and linguistic frictions (Haenssgen et al., 527
2018a; Sakboon, 2007). The modernisation and pharmaceuticalisation trends in the Thai health system 528
have also gradually (though yet incompletely) shifted healthcare provision from traditional healing to 529
public healthcare, complemented by an extensive private healthcare sector (Bennett & 530
Tangcharoensathien, 1994; Chuengsatiansup et al., 2000; Jongudomsuk et al., 2015). 531
Despite a gradual process towards decentralisation, formalisation, and inclusion, the Lao health system 532
had remained chronically under-funded and under-staffed (Akkhavong et al., 2014; Ministry of Health, 533
2013; Qian et al., 2016). These general problems were accentuated yet further in Salavan, which 534
exhibited on of the lowest healthcare worker density in Lao PDR (Sa-angchai et al., 2016). Market-535
based since 1995, the financing model of the Lao healthcare system had fuelled out-of-pocket 536
expenditure, while social protection schemes to improve inclusion and service coverage had made only 537
slow progress (Akkhavong et al., 2014). Part of the financing and service gaps had been covered (or, 538
some might argue, perpetuated) through external support like clinics run by non-governmental 539
organisations, but also by the common model of public healthcare workers running private clinics after 540
or during their official working hours (aside from growing numbers of untrained medical practitioners 541
and informal medicine vendors, Akkhavong et al., 2014). Continuing gaps in formal healthcare 542
provision had also provided continued space for traditional medicine. For instance, Sydara et al. (2005) 543
found that 77% of their survey respondents in Champasak (Salavan’s neighbouring province) used 544
traditional medicine either in isolation or in combination with modern medicines. However, as in 545
Chiang Rai, the role of traditional appeared to be declining – a recent study by Mayxay et al. (2013) 546
documented that only 1.4% of patients with respiratory infections across rural and urban Lao PDR 547
consulted a traditional healer in the first instance (esp. in situations where no other healthcare provider 548
was available). Furthermore, where healthcare delivery gaps persisted in rural border areas, another 549
avenue not present in Chiang Rai was cross-border treatment seeking. However, the costs and social 550
Haenssgen et al. (paper prepared for DSA 2019) Page 27
relationships that were required for cross-border treatment made it a less tangible option for the most 551
marginalised of the rural population (Bochaton, 2015). 552
In short, despite their diverse social and geographic environments and comparable public health 553
services structure, Chiang Rai and Salavan had contrasting economic and infrastructural contexts but 554
also exhibited different degrees of fragmentation and inclusion in their pluralistic health systems. 555
These differences were partly reflected in the relatively better health outcomes of Thailand, but 556
marginalised groups in both Chiang Rai and Salavan remained prone to exclusion from formal 557
healthcare services. 558
5 Descriptive Statistical Analysis: Healthcare, Marginalisation, and Treatment-Seeking 559
Behaviour 560
5.1 Living Conditions and Patterns of Marginalisation 561
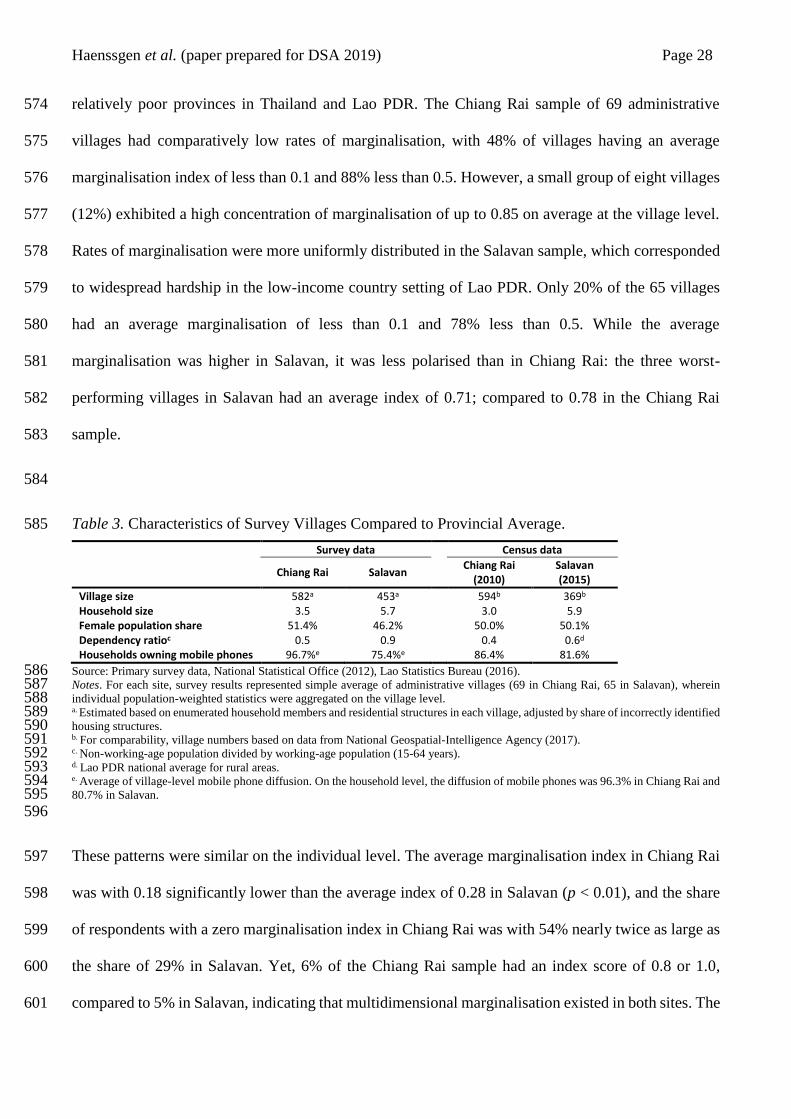
The village characteristics within the study sites are summarised in Table 3, including census data 562
from 2010 (Chiang Rai) and 2015 (Salavan) for comparison. An average village in the Chiang Rai 563
sample had an estimated population of 582 inhabitants, whereas Salavan villages were relatively 564
smaller with 453 inhabitants. The Chiang Rai villages in the sample also tended to have smaller 565
households, a higher share of female dwellers, and a lower share of people in working age compared 566
to Salavan. Mobile phones were owned by the majority of households in the study sites, whereby the 567
survey data indicated a household ownership rate of 97% per village in rural Chiang Rai and 75% per 568
village in Salavan. 569
The most common dimension of marginalisation in Chiang Rai was education with 25% of the rural 570
population, whereas 44% of the rural Salavan population fell into the category of spatial 571
marginalisation in terms of travel time to the nearest city. The average degree of marginalisation in the 572
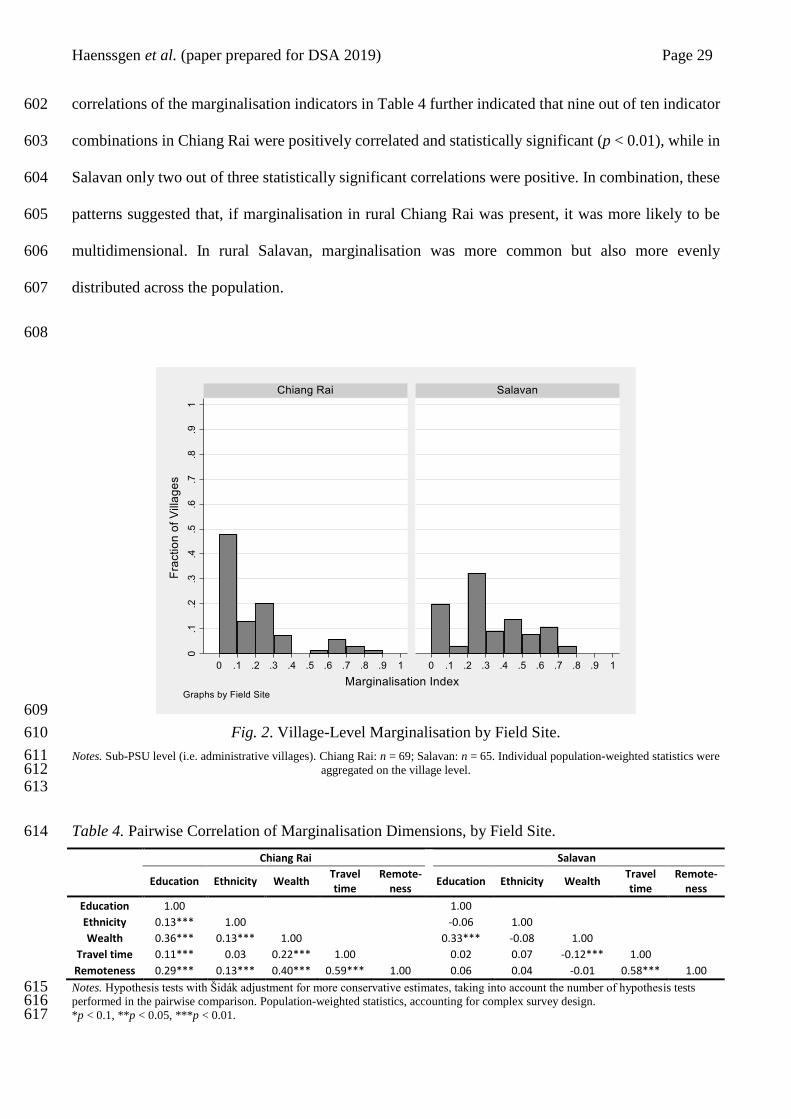
survey villages is depicted in Fig. 2, which reflected the conditions of Chiang Rai and Salavan as 573
Haenssgen et al. (paper prepared for DSA 2019) Page 28
relatively poor provinces in Thailand and Lao PDR. The Chiang Rai sample of 69 administrative 574
villages had comparatively low rates of marginalisation, with 48% of villages having an average 575
marginalisation index of less than 0.1 and 88% less than 0.5. However, a small group of eight villages 576
(12%) exhibited a high concentration of marginalisation of up to 0.85 on average at the village level. 577
Rates of marginalisation were more uniformly distributed in the Salavan sample, which corresponded 578
to widespread hardship in the low-income country setting of Lao PDR. Only 20% of the 65 villages 579
had an average marginalisation of less than 0.1 and 78% less than 0.5. While the average 580
marginalisation was higher in Salavan, it was less polarised than in Chiang Rai: the three worst-581
performing villages in Salavan had an average index of 0.71; compared to 0.78 in the Chiang Rai 582
sample. 583
584
Table 3. Characteristics of Survey Villages Compared to Provincial Average. 585
Survey data Census data
Chiang Rai Salavan Chiang Rai
(2010) Salavan (2015)
Village size 582a 453a 594b 369b Household size 3.5 5.7 3.0 5.9 Female population share 51.4% 46.2% 50.0% 50.1% Dependency ratioc 0.5 0.9 0.4 0.6d Households owning mobile phones 96.7%e 75.4%e 86.4% 81.6%
Source: Primary survey data, National Statistical Office (2012), Lao Statistics Bureau (2016). 586 Notes. For each site, survey results represented simple average of administrative villages (69 in Chiang Rai, 65 in Salavan), wherein 587 individual population-weighted statistics were aggregated on the village level. 588 a. Estimated based on enumerated household members and residential structures in each village, adjusted by share of incorrectly identified 589 housing structures. 590 b. For comparability, village numbers based on data from National Geospatial-Intelligence Agency (2017). 591 c. Non-working-age population divided by working-age population (15-64 years). 592 d. Lao PDR national average for rural areas. 593 e. Average of village-level mobile phone diffusion. On the household level, the diffusion of mobile phones was 96.3% in Chiang Rai and 594 80.7% in Salavan. 595 596
These patterns were similar on the individual level. The average marginalisation index in Chiang Rai 597
was with 0.18 significantly lower than the average index of 0.28 in Salavan (p < 0.01), and the share 598
of respondents with a zero marginalisation index in Chiang Rai was with 54% nearly twice as large as 599
the share of 29% in Salavan. Yet, 6% of the Chiang Rai sample had an index score of 0.8 or 1.0, 600
compared to 5% in Salavan, indicating that multidimensional marginalisation existed in both sites. The 601
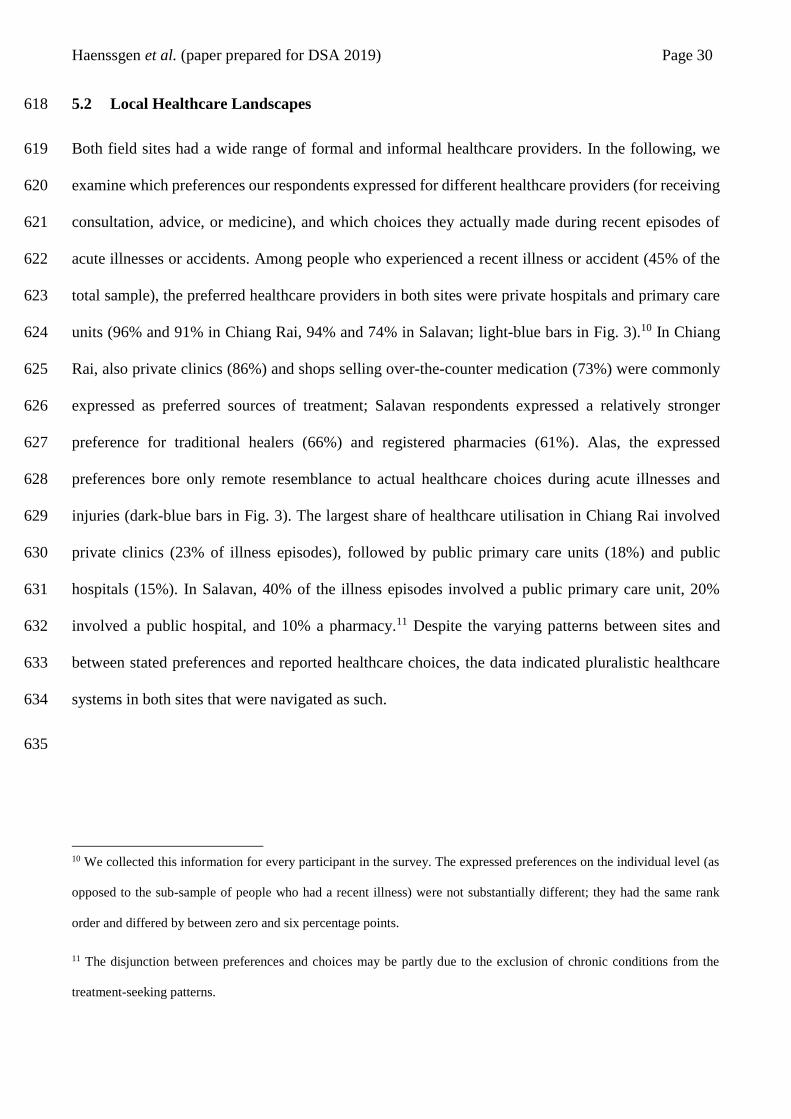
Haenssgen et al. (paper prepared for DSA 2019) Page 29
correlations of the marginalisation indicators in Table 4 further indicated that nine out of ten indicator 602
combinations in Chiang Rai were positively correlated and statistically significant (p < 0.01), while in 603
Salavan only two out of three statistically significant correlations were positive. In combination, these 604
patterns suggested that, if marginalisation in rural Chiang Rai was present, it was more likely to be 605
multidimensional. In rural Salavan, marginalisation was more common but also more evenly 606
distributed across the population. 607
608
609
Fig. 2. Village-Level Marginalisation by Field Site. 610
Notes. Sub-PSU level (i.e. administrative villages). Chiang Rai: n = 69; Salavan: n = 65. Individual population-weighted statistics were 611 aggregated on the village level. 612
613
Table 4. Pairwise Correlation of Marginalisation Dimensions, by Field Site. 614
Chiang Rai Salavan
Education Ethnicity Wealth Travel time
Remote-ness
Education Ethnicity Wealth Travel time
Remote-ness
Education 1.00 1.00
Ethnicity 0.13*** 1.00 -0.06 1.00
Wealth 0.36*** 0.13*** 1.00 0.33*** -0.08 1.00
Travel time 0.11*** 0.03 0.22*** 1.00 0.02 0.07 -0.12*** 1.00
Remoteness 0.29*** 0.13*** 0.40*** 0.59*** 1.00 0.06 0.04 -0.01 0.58*** 1.00
Notes. Hypothesis tests with Šidák adjustment for more conservative estimates, taking into account the number of hypothesis tests 615 performed in the pairwise comparison. Population-weighted statistics, accounting for complex survey design. 616 *p < 0.1, **p < 0.05, ***p < 0.01. 617
Haenssgen et al. (paper prepared for DSA 2019) Page 30
5.2 Local Healthcare Landscapes 618
Both field sites had a wide range of formal and informal healthcare providers. In the following, we 619
examine which preferences our respondents expressed for different healthcare providers (for receiving 620
consultation, advice, or medicine), and which choices they actually made during recent episodes of 621
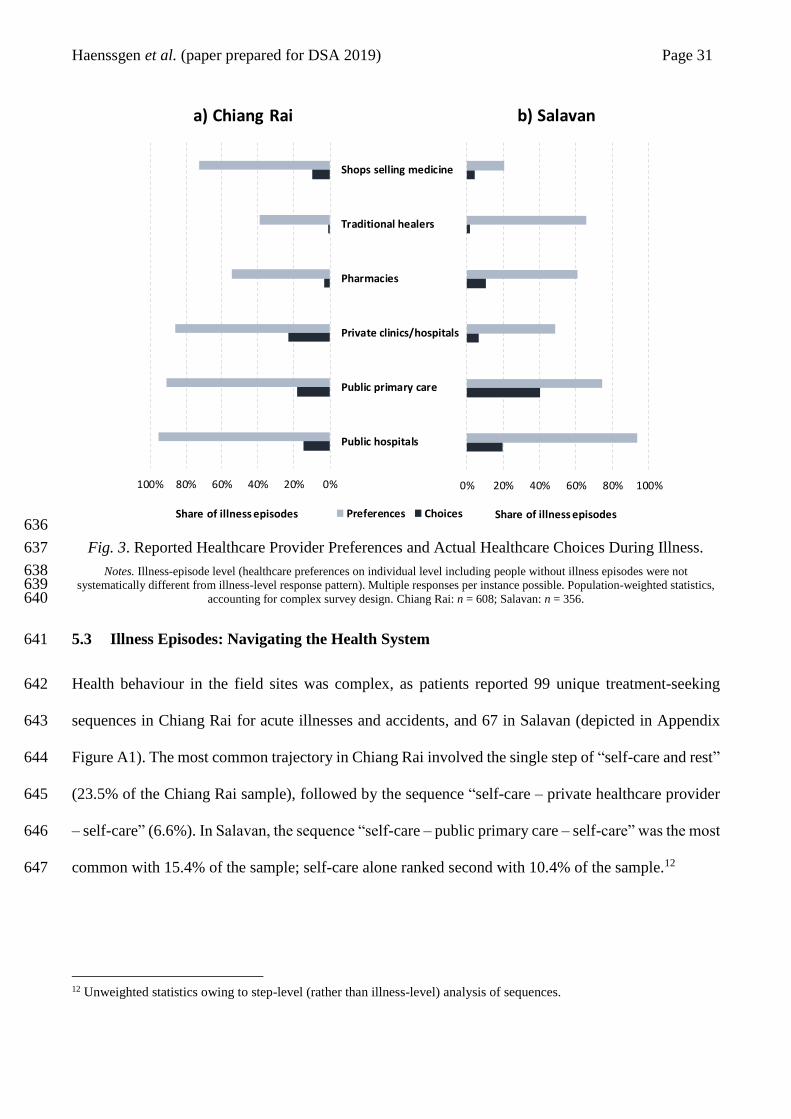
acute illnesses or accidents. Among people who experienced a recent illness or accident (45% of the 622
total sample), the preferred healthcare providers in both sites were private hospitals and primary care 623
units (96% and 91% in Chiang Rai, 94% and 74% in Salavan; light-blue bars in Fig. 3).10 In Chiang 624
Rai, also private clinics (86%) and shops selling over-the-counter medication (73%) were commonly 625
expressed as preferred sources of treatment; Salavan respondents expressed a relatively stronger 626
preference for traditional healers (66%) and registered pharmacies (61%). Alas, the expressed 627
preferences bore only remote resemblance to actual healthcare choices during acute illnesses and 628
injuries (dark-blue bars in Fig. 3). The largest share of healthcare utilisation in Chiang Rai involved 629
private clinics (23% of illness episodes), followed by public primary care units (18%) and public 630
hospitals (15%). In Salavan, 40% of the illness episodes involved a public primary care unit, 20% 631
involved a public hospital, and 10% a pharmacy.11 Despite the varying patterns between sites and 632
between stated preferences and reported healthcare choices, the data indicated pluralistic healthcare 633
systems in both sites that were navigated as such. 634
635
10 We collected this information for every participant in the survey. The expressed preferences on the individual level (as
opposed to the sub-sample of people who had a recent illness) were not substantially different; they had the same rank
order and differed by between zero and six percentage points.
11 The disjunction between preferences and choices may be partly due to the exclusion of chronic conditions from the
treatment-seeking patterns.
Haenssgen et al. (paper prepared for DSA 2019) Page 31
636
Fig. 3. Reported Healthcare Provider Preferences and Actual Healthcare Choices During Illness. 637
Notes. Illness-episode level (healthcare preferences on individual level including people without illness episodes were not 638 systematically different from illness-level response pattern). Multiple responses per instance possible. Population-weighted statistics, 639
accounting for complex survey design. Chiang Rai: n = 608; Salavan: n = 356. 640
5.3 Illness Episodes: Navigating the Health System 641
Health behaviour in the field sites was complex, as patients reported 99 unique treatment-seeking 642
sequences in Chiang Rai for acute illnesses and accidents, and 67 in Salavan (depicted in Appendix 643
Figure A1). The most common trajectory in Chiang Rai involved the single step of “self-care and rest” 644
(23.5% of the Chiang Rai sample), followed by the sequence “self-care – private healthcare provider 645
– self-care” (6.6%). In Salavan, the sequence “self-care – public primary care – self-care” was the most 646
common with 15.4% of the sample; self-care alone ranked second with 10.4% of the sample.12 647
12 Unweighted statistics owing to step-level (rather than illness-level) analysis of sequences.
0%20%40%60%80%100%
Shops selling medicine
Traditional healers
Pharmacies
Private clinics/hospitals
Public primary care
Public hospitals
a) Chiang Rai
Preferences ChoicesShare of illness episodes
0% 20% 40% 60% 80% 100%
b) Salavan
Share of illness episodes
Haenssgen et al. (paper prepared for DSA 2019) Page 32
Social support networks and mobile phones intersected these treatment-seeking processes regularly. 648
With 69% of all treatment-seeking processes in Chiang Rai and 70% Salavan, the activation of social 649
support networks was similarly common in both sites. These networks involved especially household 650
members and relatives (91% of social support cases in Chiang Rai, 97% in Salavan), while social 651
contacts outside the extended family were only activated in 10% of all cases in both sites. The main 652
reasons for support networks to be involved (left panel in Fig. 4) were the provision of healthcare or 653
attending to the patient. Other common tasks were bringing food and supplies for the patients (esp. in 654
Chiang Rai, e.g. if patients were hospitalised), helping with transport and household chores, or bringing 655
medicine to the patient. One in four contacts in Chiang Rai and one in three in Salavan also specifically 656
offered health-related advice. In the context of Salavan, where marginalisation was more widespread 657
and health expenditure occurred more often out-of-pocket, social contacts also provided money 658
relatively frequently (26% of all cases). 659
Health-related mobile phone use was less frequent than the involvement of social support, taking place 660
in 26% of all illness episodes in Chiang Rai and in 15% in Salavan (34% and 28% if general 661
conversations about health were included in the indicator). The right panel in Fig. 4 shows the range 662
of health-related purposes to which mobile phones were being put (by the patients themselves or 663
somebody else on their behalf). These purposes related primarily to advice and diagnosis (e.g. by 664
calling a family member or looking symptoms up on the Internet) and to reassuring and updating family 665
members about the progression of the illness. Less common purposes included calls to summon 666
providers to the patients, transport arrangements, and appointments with healthcare providers. Lao 667
patients also reported that phones were used to arrange for supplies like money or medicine to be 668
brought to the patient, or to inform employers and schools of absence and to request sick leave. As far 669
as mobile phone functions are concerned, phone calls were used in more than 90% of all cases of 670
health-related mobile phone use in both sites, followed by mobile data in 28% of cases in Chiang Rai 671
and 12% in Salavan. Only a small minority of cases involved text messages or other functions like 672

Haenssgen et al. (paper prepared for DSA 2019) Page 33
reminders. A further observation during our field research was that villagers in Salavan typically left 673
their mobile phones at home when they left their house for agricultural work, thereby rendering it 674
essentially akin to a fixed-line phone. 675
676
677
Fig. 4. Functions of Health-related Phone Use and Support Networks. 678
Notes. Population-weighted statistics, accounting for complex survey design. Multiple responses per instance possible. 679 a. Illness-episode level, including only instances in which other people were involved during the illness. Chiang Rai: n = 426; Salavan: 680
n = 262. 681 b. Illness-step level, including only instances in which health-related mobile phone use occurred (excluding non-health-related phone 682
use and general conversations about health on the phone). Chiang Rai: n = 218; Salavan: n = 60. 683 684
These data demonstrate that social support networks were more commonly involved in treatment-685
seeking processes than health-related phone use. Although they appeared to fulfil slightly different 686
purposes, the spectrum of uses to which social support and mobile phones were put suggested that they 687
0%
10%
20%
30%
40%
50%
60%
70%
80%
90%
100%
Pro
vid
es h
ealt
hca
re/a
tten
d
Pro
vid
es f
oo
d
Off
ers
tra
nsp
ort
/len
d v
ehic
le
He
lps
wit
h ch
ildre
n/h
ou
sew
ork
Pro
vid
es m
edic
ine
Pro
vid
es a
dvi
ce
He
lps
wit
h w
ork
Len
ds/
gra
nts
mo
ney
Co
nta
cts
fam
ily/f
rie
nds
Oth
er
Ad
vice
/Dia
gno
sis
Re
assu
re/u
pd
ate
fam
ily/f
rie
nds
Cal
l fo
r tr
eatm
en
t
Arr
ange
tra
nsp
ort
Ap
poin
tmen
t
Mo
ney
/sup
plie
s/m
ed
icin
e/h
elp
at
hom
e
Exch
ange
info
wit
h p
rovi
der
Trea
tme
nt
rem
ind
er
Info
rm e
mp
loye
r/si
ck le
ave
Shar
e o
f p
ho
ne
use
/ s
up
po
rt i
nst
ance
s
Chiang Rai Salavan
Health-related phone usebHealth-related social supporta
Haenssgen et al. (paper prepared for DSA 2019) Page 34
played a facilitating role in people’s treatment-seeking processes. Were more privileged rural groups 688
also more likely to experience facilitation from social support networks and through mobile phones? 689
Fig. 5 examines if this is the case by comparing the five marginalisation indicators and the overall 690
index between people who did and who did not report health-related mobile phone use and social 691
support. Negative values (bars pointing to the right) indicate that phones/contacts were associated with 692
less marginalised groups; positive values (bars pointing to the left) indicate higher degrees of 693
marginalisation for health-related phone use and social support. The figure demonstrates that the 694
relatively small group of health-related phone users was systematically less marginalised than non-695
users; the difference of which was statistically significant across several indicators in Salavan. In 696
contrast, although health-related social support networks were activated widely, people who did not 697
realise this option were not clearly more or less marginalised (in Chiang Rai, they were significantly 698
less marginalised according to the education indicator, p < 0.1). These data suggest that mobile phones 699
were more likely to be used among privileged groups, whereas social support had a more egalitarian 700
character. However, as Table 5 indicates, only a minority of cases in both field sites involved mobile 701
phones without additional social support networks, which suggested that an inequitable distribution of 702
mobile phones could only have a limited impact. The next section examines in detail how social 703
networks and mobile phones were linked to treatment-seeking patterns. 704
705
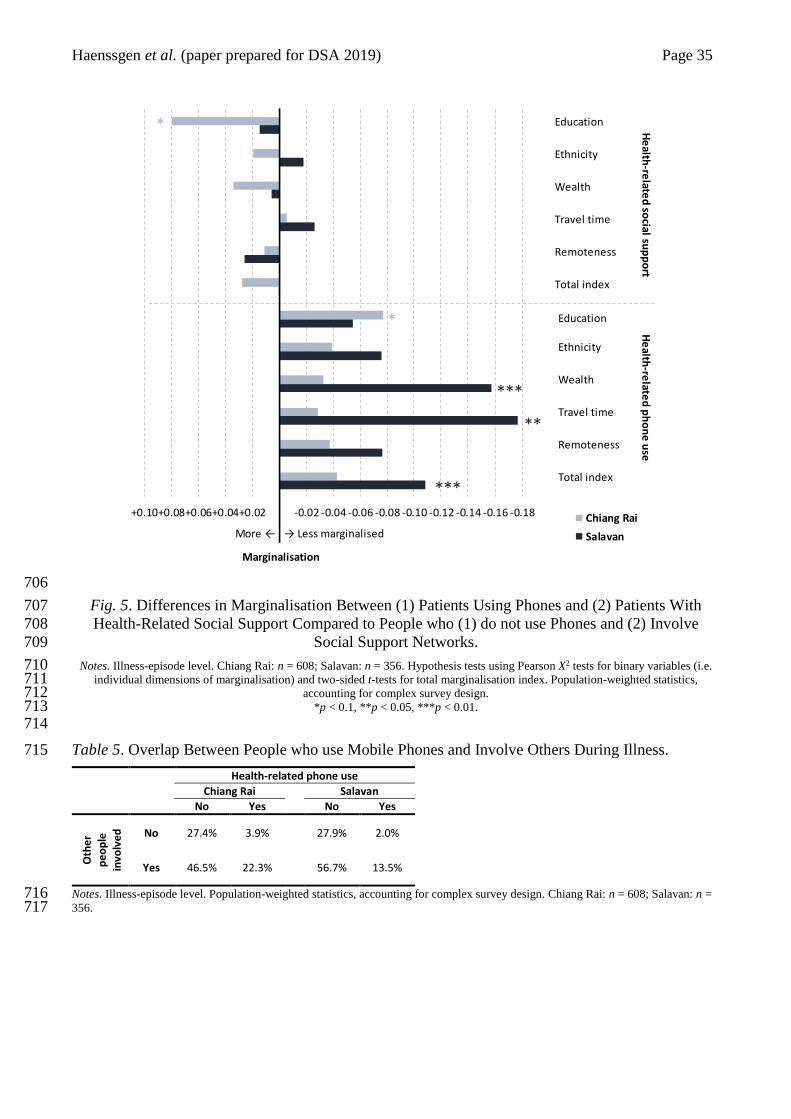
Haenssgen et al. (paper prepared for DSA 2019) Page 35
706
Fig. 5. Differences in Marginalisation Between (1) Patients Using Phones and (2) Patients With 707
Health-Related Social Support Compared to People who (1) do not use Phones and (2) Involve 708
Social Support Networks. 709
Notes. Illness-episode level. Chiang Rai: n = 608; Salavan: n = 356. Hypothesis tests using Pearson X2 tests for binary variables (i.e. 710 individual dimensions of marginalisation) and two-sided t-tests for total marginalisation index. Population-weighted statistics, 711
accounting for complex survey design. 712 *p < 0.1, **p < 0.05, ***p < 0.01. 713
714
Table 5. Overlap Between People who use Mobile Phones and Involve Others During Illness. 715
Health-related phone use
Chiang Rai Salavan No Yes No Yes
Oth
er
pe
op
le
invo
lve
d
No 27.4% 3.9% 27.9% 2.0%
Yes 46.5% 22.3% 56.7% 13.5%
Notes. Illness-episode level. Population-weighted statistics, accounting for complex survey design. Chiang Rai: n = 608; Salavan: n = 716 356. 717
-0.18-0.16-0.14-0.12-0.10-0.08-0.06-0.04-0.02+0.02+0.04+0.06+0.08+0.10
Marginalisation
Chiang Rai
Salavan
Education
Ethnicity
Wealth
Travel time
Remoteness
Total index
He
alth-re
lated
social su
pp
ort
Education
Ethnicity
Wealth
Travel time
Remoteness
Total index
He
alth-re
lated
ph
on
e u
se
More ← → Less marginalised
***
***
*
**
*

Haenssgen et al. (paper prepared for DSA 2019) Page 36
6 Regression Analysis: Determinants of Healthcare Access and Delays 718
6.1 Marginalisation 719
We first considered the role of marginalisation and its individual dimensions as determinants of 720
healthcare access and the duration until healthcare providers were reached. In Table 6, we present the 721
regression results for access to healthcare; in Table 7 for the duration until patients reached the various 722
healthcare providers. For both tables, we present multi-level models, or single-level regression models 723
in case the multi-level regressions did not converge.13 Overall, we found that marginalisation was 724
systematically associated with healthcare access, suggesting that more marginalised groups tended to 725
access more informal and less private healthcare. However, we did not identify a systematic statistical 726
relationship between marginalisation and public healthcare access or the duration until any kind of 727
care had been accessed. 728
729
13 The significance of the associations described in this and the following section were only weakly sensitive to the multi-
or single-level model specifications. The conclusions of this analysis do not vary substantively if either specification was
chosen.
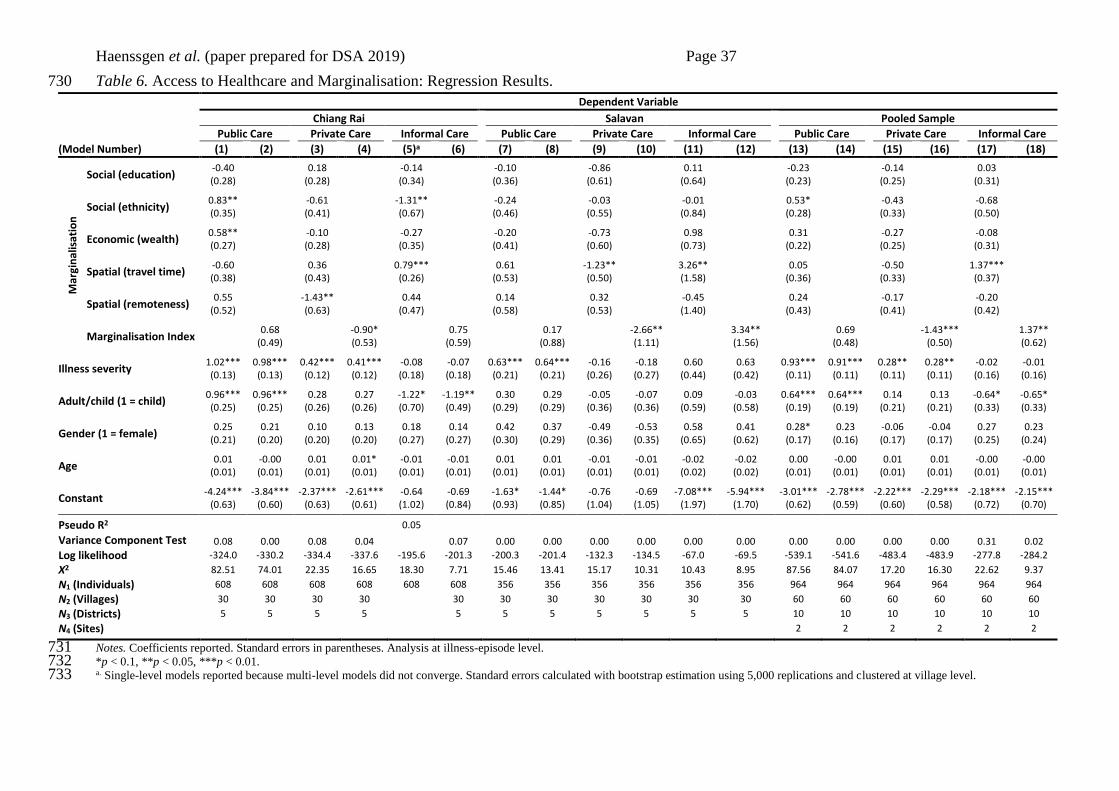
Haenssgen et al. (paper prepared for DSA 2019) Page 37
Table 6. Access to Healthcare and Marginalisation: Regression Results. 730
Dependent Variable
Chiang Rai Salavan Pooled Sample
Public Care Private Care Informal Care Public Care Private Care Informal Care Public Care Private Care Informal Care
(Model Number) (1) (2) (3) (4) (5)a (6) (7) (8) (9) (10) (11) (12) (13) (14) (15) (16) (17) (18)
Mar
gin
alis
atio
n
Social (education) -0.40 0.18 -0.14 -0.10 -0.86 0.11 -0.23 -0.14 0.03 (0.28) (0.28) (0.34) (0.36) (0.61) (0.64) (0.23) (0.25) (0.31)
Social (ethnicity) 0.83** -0.61 -1.31** -0.24 -0.03 -0.01 0.53* -0.43 -0.68 (0.35) (0.41) (0.67) (0.46) (0.55) (0.84) (0.28) (0.33) (0.50)
Economic (wealth) 0.58** -0.10 -0.27 -0.20 -0.73 0.98 0.31 -0.27 -0.08 (0.27) (0.28) (0.35) (0.41) (0.60) (0.73) (0.22) (0.25) (0.31)
Spatial (travel time) -0.60 0.36 0.79*** 0.61 -1.23** 3.26** 0.05 -0.50 1.37*** (0.38) (0.43) (0.26) (0.53) (0.50) (1.58) (0.36) (0.33) (0.37)
Spatial (remoteness) 0.55 -1.43** 0.44 0.14 0.32 -0.45 0.24 -0.17 -0.20
(0.52) (0.63) (0.47) (0.58) (0.53) (1.40) (0.43) (0.41) (0.42)
Marginalisation Index 0.68 -0.90* 0.75 0.17 -2.66** 3.34** 0.69 -1.43*** 1.37** (0.49) (0.53) (0.59) (0.88) (1.11) (1.56) (0.48) (0.50) (0.62)
Illness severity 1.02*** 0.98*** 0.42*** 0.41*** -0.08 -0.07 0.63*** 0.64*** -0.16 -0.18 0.60 0.63 0.93*** 0.91*** 0.28** 0.28** -0.02 -0.01 (0.13) (0.13) (0.12) (0.12) (0.18) (0.18) (0.21) (0.21) (0.26) (0.27) (0.44) (0.42) (0.11) (0.11) (0.11) (0.11) (0.16) (0.16)
Adult/child (1 = child) 0.96*** 0.96*** 0.28 0.27 -1.22* -1.19** 0.30 0.29 -0.05 -0.07 0.09 -0.03 0.64*** 0.64*** 0.14 0.13 -0.64* -0.65* (0.25) (0.25) (0.26) (0.26) (0.70) (0.49) (0.29) (0.29) (0.36) (0.36) (0.59) (0.58) (0.19) (0.19) (0.21) (0.21) (0.33) (0.33)
Gender (1 = female) 0.25 0.21 0.10 0.13 0.18 0.14 0.42 0.37 -0.49 -0.53 0.58 0.41 0.28* 0.23 -0.06 -0.04 0.27 0.23
(0.21) (0.20) (0.20) (0.20) (0.27) (0.27) (0.30) (0.29) (0.36) (0.35) (0.65) (0.62) (0.17) (0.16) (0.17) (0.17) (0.25) (0.24)
Age 0.01 -0.00 0.01 0.01* -0.01 -0.01 0.01 0.01 -0.01 -0.01 -0.02 -0.02 0.00 -0.00 0.01 0.01 -0.00 -0.00
(0.01) (0.01) (0.01) (0.01) (0.01) (0.01) (0.01) (0.01) (0.01) (0.01) (0.02) (0.02) (0.01) (0.01) (0.01) (0.01) (0.01) (0.01)
Constant -4.24*** -3.84*** -2.37*** -2.61*** -0.64 -0.69 -1.63* -1.44* -0.76 -0.69 -7.08*** -5.94*** -3.01*** -2.78*** -2.22*** -2.29*** -2.18*** -2.15***
(0.63) (0.60) (0.63) (0.61) (1.02) (0.84) (0.93) (0.85) (1.04) (1.05) (1.97) (1.70) (0.62) (0.59) (0.60) (0.58) (0.72) (0.70)
Pseudo R2 0.05
Variance Component Test 0.08 0.00 0.08 0.04 0.07 0.00 0.00 0.00 0.00 0.00 0.00 0.00 0.00 0.00 0.00 0.31 0.02
Log likelihood -324.0 -330.2 -334.4 -337.6 -195.6 -201.3 -200.3 -201.4 -132.3 -134.5 -67.0 -69.5 -539.1 -541.6 -483.4 -483.9 -277.8 -284.2
Χ2 82.51 74.01 22.35 16.65 18.30 7.71 15.46 13.41 15.17 10.31 10.43 8.95 87.56 84.07 17.20 16.30 22.62 9.37
N1 (Individuals) 608 608 608 608 608 608 356 356 356 356 356 356 964 964 964 964 964 964
N2 (Villages) 30 30 30 30 30 30 30 30 30 30 30 60 60 60 60 60 60
N3 (Districts) 5 5 5 5 5 5 5 5 5 5 5 10 10 10 10 10 10
N4 (Sites) 2 2 2 2 2 2
Notes. Coefficients reported. Standard errors in parentheses. Analysis at illness-episode level. 731 *p < 0.1, **p < 0.05, ***p < 0.01. 732 a. Single-level models reported because multi-level models did not converge. Standard errors calculated with bootstrap estimation using 5,000 replications and clustered at village level. 733
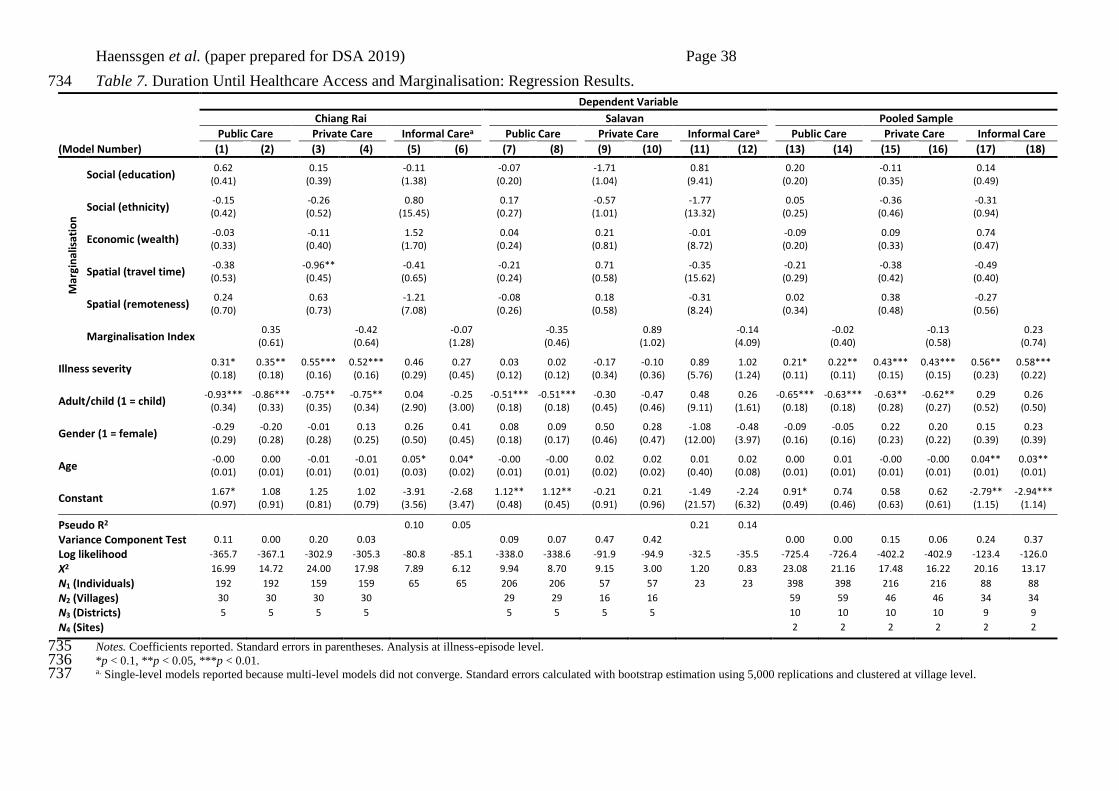
Haenssgen et al. (paper prepared for DSA 2019) Page 38
Table 7. Duration Until Healthcare Access and Marginalisation: Regression Results. 734
Dependent Variable
Chiang Rai Salavan Pooled Sample
Public Care Private Care Informal Carea Public Care Private Care Informal Carea Public Care Private Care Informal Care
(Model Number) (1) (2) (3) (4) (5) (6) (7) (8) (9) (10) (11) (12) (13) (14) (15) (16) (17) (18)
Mar
gin
alis
atio
n
Social (education) 0.62 0.15 -0.11 -0.07 -1.71 0.81 0.20 -0.11 0.14
(0.41) (0.39) (1.38) (0.20) (1.04) (9.41) (0.20) (0.35) (0.49)
Social (ethnicity) -0.15 -0.26 0.80 0.17 -0.57 -1.77 0.05 -0.36 -0.31 (0.42) (0.52) (15.45) (0.27) (1.01) (13.32) (0.25) (0.46) (0.94)
Economic (wealth) -0.03 -0.11 1.52 0.04 0.21 -0.01 -0.09 0.09 0.74 (0.33) (0.40) (1.70) (0.24) (0.81) (8.72) (0.20) (0.33) (0.47)
Spatial (travel time) -0.38 -0.96** -0.41 -0.21 0.71 -0.35 -0.21 -0.38 -0.49 (0.53) (0.45) (0.65) (0.24) (0.58) (15.62) (0.29) (0.42) (0.40)
Spatial (remoteness) 0.24 0.63 -1.21 -0.08 0.18 -0.31 0.02 0.38 -0.27
(0.70) (0.73) (7.08) (0.26) (0.58) (8.24) (0.34) (0.48) (0.56)
Marginalisation Index 0.35 -0.42 -0.07 -0.35 0.89 -0.14 -0.02 -0.13 0.23 (0.61) (0.64) (1.28) (0.46) (1.02) (4.09) (0.40) (0.58) (0.74)
Illness severity 0.31* 0.35** 0.55*** 0.52*** 0.46 0.27 0.03 0.02 -0.17 -0.10 0.89 1.02 0.21* 0.22** 0.43*** 0.43*** 0.56** 0.58*** (0.18) (0.18) (0.16) (0.16) (0.29) (0.45) (0.12) (0.12) (0.34) (0.36) (5.76) (1.24) (0.11) (0.11) (0.15) (0.15) (0.23) (0.22)
Adult/child (1 = child) -0.93*** -0.86*** -0.75** -0.75** 0.04 -0.25 -0.51*** -0.51*** -0.30 -0.47 0.48 0.26 -0.65*** -0.63*** -0.63** -0.62** 0.29 0.26
(0.34) (0.33) (0.35) (0.34) (2.90) (3.00) (0.18) (0.18) (0.45) (0.46) (9.11) (1.61) (0.18) (0.18) (0.28) (0.27) (0.52) (0.50)
Gender (1 = female) -0.29 -0.20 -0.01 0.13 0.26 0.41 0.08 0.09 0.50 0.28 -1.08 -0.48 -0.09 -0.05 0.22 0.20 0.15 0.23 (0.29) (0.28) (0.28) (0.25) (0.50) (0.45) (0.18) (0.17) (0.46) (0.47) (12.00) (3.97) (0.16) (0.16) (0.23) (0.22) (0.39) (0.39)
Age -0.00 0.00 -0.01 -0.01 0.05* 0.04* -0.00 -0.00 0.02 0.02 0.01 0.02 0.00 0.01 -0.00 -0.00 0.04** 0.03** (0.01) (0.01) (0.01) (0.01) (0.03) (0.02) (0.01) (0.01) (0.02) (0.02) (0.40) (0.08) (0.01) (0.01) (0.01) (0.01) (0.01) (0.01)
Constant 1.67* 1.08 1.25 1.02 -3.91 -2.68 1.12** 1.12** -0.21 0.21 -1.49 -2.24 0.91* 0.74 0.58 0.62 -2.79** -2.94*** (0.97) (0.91) (0.81) (0.79) (3.56) (3.47) (0.48) (0.45) (0.91) (0.96) (21.57) (6.32) (0.49) (0.46) (0.63) (0.61) (1.15) (1.14)
Pseudo R2 0.10 0.05 0.21 0.14
Variance Component Test 0.11 0.00 0.20 0.03 0.09 0.07 0.47 0.42 0.00 0.00 0.15 0.06 0.24 0.37
Log likelihood -365.7 -367.1 -302.9 -305.3 -80.8 -85.1 -338.0 -338.6 -91.9 -94.9 -32.5 -35.5 -725.4 -726.4 -402.2 -402.9 -123.4 -126.0
Χ2 16.99 14.72 24.00 17.98 7.89 6.12 9.94 8.70 9.15 3.00 1.20 0.83 23.08 21.16 17.48 16.22 20.16 13.17
N1 (Individuals) 192 192 159 159 65 65 206 206 57 57 23 23 398 398 216 216 88 88
N2 (Villages) 30 30 30 30 29 29 16 16 59 59 46 46 34 34
N3 (Districts) 5 5 5 5 5 5 5 5 10 10 10 10 9 9
N4 (Sites) 2 2 2 2 2 2
Notes. Coefficients reported. Standard errors in parentheses. Analysis at illness-episode level. 735 *p < 0.1, **p < 0.05, ***p < 0.01. 736 a. Single-level models reported because multi-level models did not converge. Standard errors calculated with bootstrap estimation using 5,000 replications and clustered at village level. 737
Haenssgen et al. (paper prepared for DSA 2019) Page 39
The regression results in Table 6 suggest that, marginalisation linked to most forms of healthcare 738
access, with the exception of public healthcare access in Salavan (where neither the coefficients of the 739
individual dimensions nor of the overall index were statistically significant). Although one or more of 740
the individual dimensions were associated with healthcare access, no systematic pattern emerged. 741
Among the perhaps surprising results in this regard was that the wealth dimension was only statistically 742
significant for public healthcare access in Chiang Rai (p < 0.05, Model 1; perhaps due to the binary 743
nature of the wealth indicator), and that the ethnicity dimension was negatively associated with 744
informal healthcare access in Chiang Rai (p < 0.05; Model 5; possibly as informal healthcare access 745
may have been more restricted for minority groups in their own village). When aggregated into the 746
overall index, the links between marginalisation and healthcare access were more limited. In the site 747
sub-samples, marginalisation had a significant positive association with private healthcare access in 748
Chiang Rai (p < 0.1; Model 4), and, in Salavan, a negative association with private healthcare access 749
and a positive association with informal healthcare access (p < 0.05; Models 10 and 12). In the pooled 750
sample, marginalisation was again linked negatively to private and positively to informal healthcare 751
access (p < 0.01 and p < 0.05; Models 16 and 18). 752
To illustrate the link between marginalisation and healthcare access, consider that at sample means, 753
the predicted probability of a patient in Chiang Rai accessing private healthcare was 2.9 percentage 754
points lower if they exhibited three instead of two dimensions of the marginalisation index (20.4% vs. 755
23.3%). In Salavan, the same patient would have a 3.5 percentage point lower predicted probability of 756
private healthcare access (6.8% vs. 10.3%), but a 4.0 percentage point higher rate of informal access 757
(12.5% vs. 8.5%). The inverse relationship between informal healthcare in Salavan and private 758
healthcare access in Chiang Rai and Salavan as a function of marginalisation is depicted in Fig. 6, and 759
appeared to be driven especially by spatial dimensions of marginalisation (see Table 6). Free public 760
healthcare in both field sites appeared to be less sensitive at least to our multidimensional specification 761
of marginalisation. 762

Haenssgen et al. (paper prepared for DSA 2019) Page 40
763
764
Fig. 6. Predicted Access to Private and Informal Healthcare as a Function of Marginalisation, Chiang 765
Rai and Salavan. 766
Notes. Illness-episode level. Panel a: n = 608; Panels b1 and b2: n = 356. Predicted results of Models 4, 10, and 12 in Table 6. Error 767 bars indicating 95% confidence interval. 768
769
Among the other control variables, the self-perceived severity of the illness/accident and whether the 770
episode was experienced by a child or adult emerged repeatedly as statistically significant predictors. 771
Severity was positively associated with public and private healthcare access in Chiang Rai and in the 772
pooled sample, and with public healthcare access in Salavan. The adult/child dummy was only 773
statistically significant in the Chiang Rai sample and the pooled sample, where being a child was linked 774
to more public and less informal healthcare access. Age and gender of the respondent (i.e. the patient 775
or caregiver of an ill child) were not related to healthcare access. 776
In contrast, Table 7 indicates that marginalisation was not systematically associated with the time 777
elapsed until patients accessed public, private, or informal healthcare providers – neither in its 778
individual dimensions nor as overall index. Among the control variables, especially illness episodes 779
of children were associated with shorter delays until reaching public (p < 0.01) and private healthcare 780
(p < 0.05) in Chiang Rai and the pooled sample, and public healthcare in Salavan (p < 0.01). In Chiang 781
Rai and the pooled sample, higher age was also associated with longer delays until accessing informal 782
healthcare (p < 0.1 in Chiang Rai; p < 0.05 in pooled sample), albeit not for other forms of healthcare 783
Haenssgen et al. (paper prepared for DSA 2019) Page 41
access. Contrary to intuition, the severity of illnesses was not linked to shorter durations to healthcare 784
access in any model, and it exhibited statistically significant positive associations with public and 785
private healthcare access in Chiang Rai and all forms of healthcare access in the pooled sample.14 786
6.2 Health-Related Phone Use and Social Support 787
As the final step in our analysis, this section presents the regression models linking mobile phone use 788
and social support to rural treatment-seeking behaviour. Following the structure of the preceding 789
section, the main results are again presented in separate tables for access to healthcare (Table 8) and 790
duration until patients reached the various healthcare providers (Table 9). For both tables, we limited 791
the presentation of the models to either the either the basic models with the marginalisation index, 792
health-related phone use, and social support as independent variables, or the interaction models if the 793
PHONxMARG and SUPPxMARG interaction terms were statistically significant at least at the 10-794
percent level (see Appendix Tables A2 and A3 for the complete set of models). For simplicity, we 795
omitted from reporting the control variables (age, gender, illness severity, dummy for adult/child 796
illness) and the constant term; the full specifications including coefficients for control variables are 797
presented in the supplemental material. 798
799
14 A possible interpretation is that more severe cases involved bed-ridden patients treated at home and the prospect of more
expensive treatment. Later analysis in the next section will also link mobile phone use systematically to delayed access,
but note that the correlation between the severity and health-related mobile phone use was weak, with correlation
coefficients of 0.17 in Chiang Rai and 0.07 in Salavan.
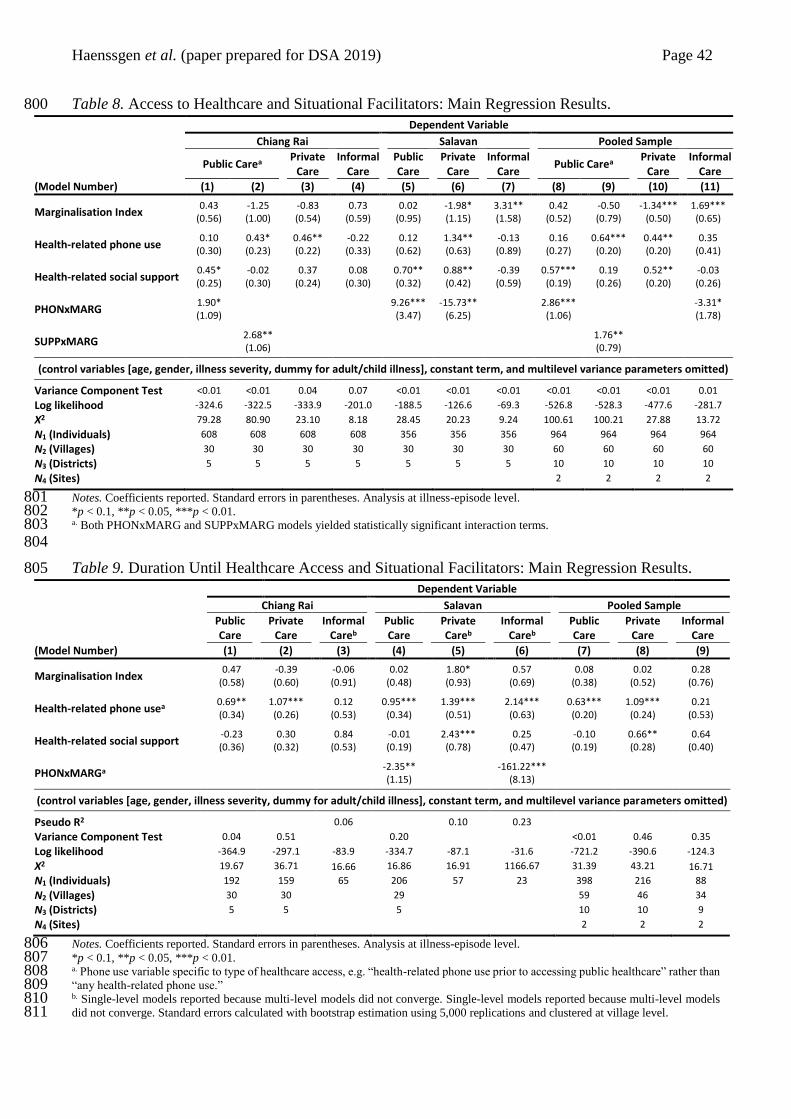
Haenssgen et al. (paper prepared for DSA 2019) Page 42
Table 8. Access to Healthcare and Situational Facilitators: Main Regression Results. 800
Dependent Variable
Chiang Rai Salavan Pooled Sample
Public Carea
Private Care
Informal Care
Public Care
Private Care
Informal Care
Public Carea Private
Care Informal
Care
(Model Number) (1) (2) (3) (4) (5) (6) (7) (8) (9) (10) (11)
Marginalisation Index 0.43 -1.25 -0.83 0.73 0.02 -1.98* 3.31** 0.42 -0.50 -1.34*** 1.69***
(0.56) (1.00) (0.54) (0.59) (0.95) (1.15) (1.58) (0.52) (0.79) (0.50) (0.65)
Health-related phone use 0.10 0.43* 0.46** -0.22 0.12 1.34** -0.13 0.16 0.64*** 0.44** 0.35
(0.30) (0.23) (0.22) (0.33) (0.62) (0.63) (0.89) (0.27) (0.20) (0.20) (0.41)
Health-related social support 0.45* -0.02 0.37 0.08 0.70** 0.88** -0.39 0.57*** 0.19 0.52** -0.03 (0.25) (0.30) (0.24) (0.30) (0.32) (0.42) (0.59) (0.19) (0.26) (0.20) (0.26)
PHONxMARG 1.90* 9.26*** -15.73** 2.86*** -3.31* (1.09) (3.47) (6.25) (1.06) (1.78)
SUPPxMARG 2.68** 1.76** (1.06) (0.79)
(control variables [age, gender, illness severity, dummy for adult/child illness], constant term, and multilevel variance parameters omitted)
Variance Component Test <0.01 <0.01 0.04 0.07 <0.01 <0.01 <0.01 <0.01 <0.01 <0.01 0.01
Log likelihood -324.6 -322.5 -333.9 -201.0 -188.5 -126.6 -69.3 -526.8 -528.3 -477.6 -281.7
Χ2 79.28 80.90 23.10 8.18 28.45 20.23 9.24 100.61 100.21 27.88 13.72
N1 (Individuals) 608 608 608 608 356 356 356 964 964 964 964
N2 (Villages) 30 30 30 30 30 30 30 60 60 60 60
N3 (Districts) 5 5 5 5 5 5 5 10 10 10 10
N4 (Sites) 2 2 2 2
Notes. Coefficients reported. Standard errors in parentheses. Analysis at illness-episode level. 801 *p < 0.1, **p < 0.05, ***p < 0.01. 802 a. Both PHONxMARG and SUPPxMARG models yielded statistically significant interaction terms. 803 804
Table 9. Duration Until Healthcare Access and Situational Facilitators: Main Regression Results. 805
Dependent Variable
Chiang Rai Salavan Pooled Sample
Public Care
Private Care
Informal Careb
Public Care
Private Careb
Informal Careb
Public Care
Private Care
Informal Care
(Model Number) (1) (2) (3) (4) (5) (6) (7) (8) (9)
Marginalisation Index 0.47 -0.39 -0.06 0.02 1.80* 0.57 0.08 0.02 0.28
(0.58) (0.60) (0.91) (0.48) (0.93) (0.69) (0.38) (0.52) (0.76)
Health-related phone usea 0.69** 1.07*** 0.12 0.95*** 1.39*** 2.14*** 0.63*** 1.09*** 0.21 (0.34) (0.26) (0.53) (0.34) (0.51) (0.63) (0.20) (0.24) (0.53)
Health-related social support -0.23 0.30 0.84 -0.01 2.43*** 0.25 -0.10 0.66** 0.64 (0.36) (0.32) (0.53) (0.19) (0.78) (0.47) (0.19) (0.28) (0.40)
PHONxMARGa -2.35** -161.22*** (1.15) (8.13)
(control variables [age, gender, illness severity, dummy for adult/child illness], constant term, and multilevel variance parameters omitted)
Pseudo R2 0.06 0.10 0.23
Variance Component Test 0.04 0.51 0.20 <0.01 0.46 0.35
Log likelihood -364.9 -297.1 -83.9 -334.7 -87.1 -31.6 -721.2 -390.6 -124.3
Χ2 19.67 36.71 16.66 16.86 16.91 1166.67 31.39 43.21 16.71
N1 (Individuals) 192 159 65 206 57 23 398 216 88
N2 (Villages) 30 30 29 59 46 34
N3 (Districts) 5 5 5 10 10 9
N4 (Sites) 2 2 2
Notes. Coefficients reported. Standard errors in parentheses. Analysis at illness-episode level. 806 *p < 0.1, **p < 0.05, ***p < 0.01. 807 a. Phone use variable specific to type of healthcare access, e.g. “health-related phone use prior to accessing public healthcare” rather than 808 “any health-related phone use.” 809 b. Single-level models reported because multi-level models did not converge. Single-level models reported because multi-level models 810 did not converge. Standard errors calculated with bootstrap estimation using 5,000 replications and clustered at village level. 811

Haenssgen et al. (paper prepared for DSA 2019) Page 43
812
Table 8 documents the main results of the multi-level regression models of access to healthcare. 813
Overall, the results indicated that, with the inclusion of mobile phones and social support, the 814
marginalisation index retained a statistically significant association (independently or as part of an 815
interaction term) with public healthcare access in Chiang Rai, and with all forms of healthcare access 816
in Salavan as well as in the pooled sample. Furthermore, mobile phones or social support were 817
significantly linked with public and private healthcare access in both individual samples and to all 818
types of healthcare access in the pooled sample. 819
The specific results for health-related mobile phone use and social support permitted the following 820
observations. In Chiang Rai, Salavan, and the pooled sample, mobile phone use was positively 821
associated with public healthcare access through the interaction terms (p < 0.1, Model 1; p < 0.01, 822
Models 5 and 8). The positive interaction coefficients suggested that public healthcare utilisation was 823
higher among marginalised individuals if they also used a mobile phone. Social support had a similar 824
relationship with public healthcare access in Chiang Rai and the pooled sample (p < 0.05, Models 2 825
and 9), whereas the association between social support and public healthcare access in the Salavan 826
sample was positive and statistically significant (p < 0.05, Model 5) but independent of the 827
marginalisation index. For private healthcare, mobile phone use and social support did not interact 828
with marginalisation in Chiang Rai and the pooled sample but where independently related to higher 829
private healthcare access in the pooled sample (p < 0.05, Model 10). Health-related phone use also had 830
a positive and statistically significant association with private healthcare access in Chiang Rai (p < 831
0.05, Model 3). However, the PHONxMARG interaction was statistically significant (p < 0.05, Model 832
6) and negative for private healthcare access in Salavan, suggesting that more marginalised groups had 833
utilised private providers at a lower rate if they also used mobile phones. Informal healthcare access 834
was only linked to health-related mobile phone use in the pooled sample (Model 11), where the 835
Haenssgen et al. (paper prepared for DSA 2019) Page 44
interaction term was negative and statistically significant (p < 0.1) – suggesting that phone users had 836
less informal healthcare access with increasing marginalisation. 837
We illustrate these relationships in Figs. 7 and 8. Fig. 7 depicts the interaction between marginalisation 838
and health-related mobile phone use in the Salavan sub-sample, including the predicted access to 839
public (Panel a) and private healthcare providers (Panel b) as a function of the marginalisation index 840
(predictions at sample means). Light-grey markers represent health-related phone use and dark-grey 841
markers represent healthcare episodes without phone use. The predicted values shown in the graphs 842
indicated near-universal public and near-absent private healthcare access for people with two or more 843
dimensions of marginalisation (i.e. a marginalisation index score of 0.4 or higher). Fig. 8 draws on the 844
pooled sample results to provide further illustration, showing the relationship between marginalisation 845
and health-related phone use (Row a) and health-related social support (Row b) for public (Column 846
1), private (Column 2), and informal healthcare access (Column 3). As in the previous figure, light-847
grey markers indicate health-related phone use (Row a) or social support (Row b). The predicted rates 848
of healthcare access using the pooled sample suggested that mobile phone use and social support 849
related to marginalisation in similar ways (with the exception of informal healthcare access, where 850
access among marginalised phone users was predicted to be lower than among non-users). 851
In Table 9, we focus again on the duration until healthcare access. We present single-level regression 852
results for Models 3, 5, and 6, which did not converge owing to small sample sizes. Although the 853
previous section indicated no direct relationship between marginalisation and the duration until 854
healthcare access, when health-related mobile phone use and social support were added to the models, 855
especially phone use emerged as a predictor of the duration until healthcare access. Independently of 856
marginalisation, phone use was statistically significant and positive for public and private healthcare 857
in Chiang Rai (p < 0.05, Model 1; p < 0.01, Model 2) and in the pooled sample (p < 0.01, Models 7 858
and 8). This indicated that people using mobile phones for health-related purposes also experienced 859
longer delays until they accessed public and private care. Moreover, the PHONxMARG interaction 860
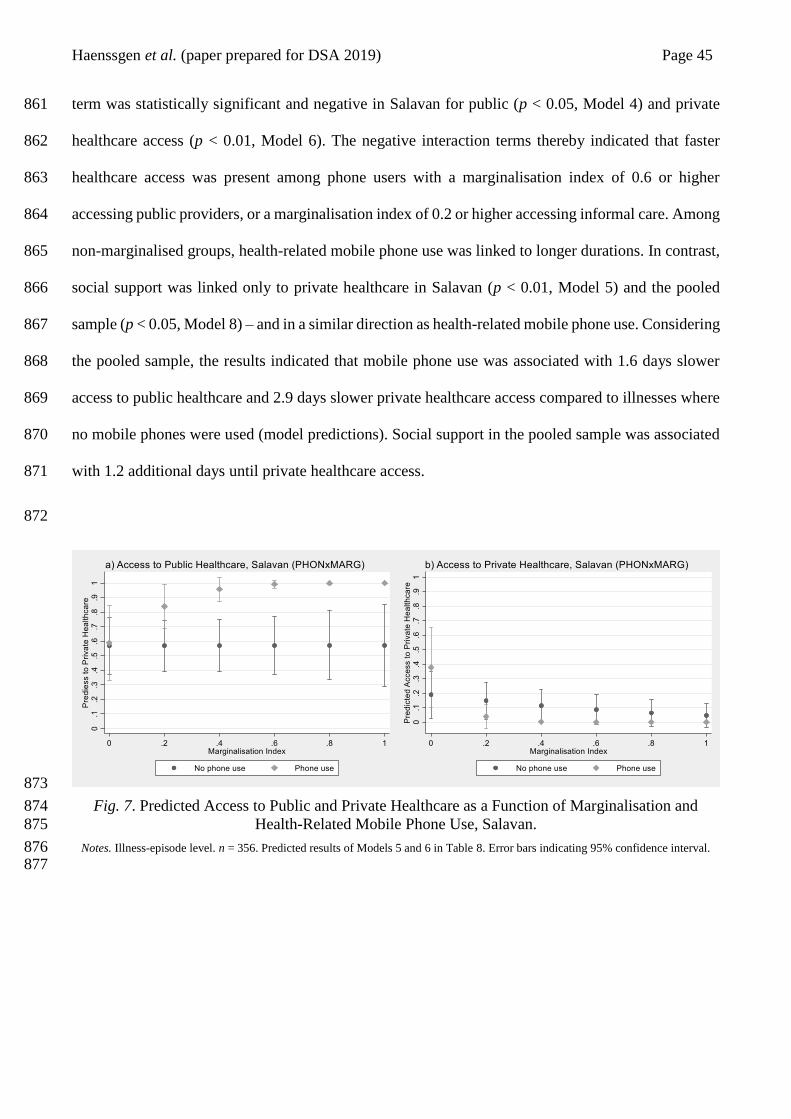
Haenssgen et al. (paper prepared for DSA 2019) Page 45
term was statistically significant and negative in Salavan for public (p < 0.05, Model 4) and private 861
healthcare access (p < 0.01, Model 6). The negative interaction terms thereby indicated that faster 862
healthcare access was present among phone users with a marginalisation index of 0.6 or higher 863
accessing public providers, or a marginalisation index of 0.2 or higher accessing informal care. Among 864
non-marginalised groups, health-related mobile phone use was linked to longer durations. In contrast, 865
social support was linked only to private healthcare in Salavan (p < 0.01, Model 5) and the pooled 866
sample (p < 0.05, Model 8) – and in a similar direction as health-related mobile phone use. Considering 867
the pooled sample, the results indicated that mobile phone use was associated with 1.6 days slower 868
access to public healthcare and 2.9 days slower private healthcare access compared to illnesses where 869
no mobile phones were used (model predictions). Social support in the pooled sample was associated 870
with 1.2 additional days until private healthcare access. 871
872
873
Fig. 7. Predicted Access to Public and Private Healthcare as a Function of Marginalisation and 874
Health-Related Mobile Phone Use, Salavan. 875
Notes. Illness-episode level. n = 356. Predicted results of Models 5 and 6 in Table 8. Error bars indicating 95% confidence interval. 876 877

Haenssgen et al. (paper prepared for DSA 2019) Page 46
878
Fig. 8. Predicted Access to Healthcare as a Function of Marginalisation, Health-Related Mobile 879
Phone Use, and Social Support; Pooled Sample. 880
Notes. Illness-episode level. n = 964. Predicted results of Models 8, 9, 10, and 11 in Table 8. Error bars indicating 95% confidence 881 interval. 882
a. Results are not statistically significant at p < 0.1 and is included for illustration only. 883 884
7 Discussion 885
7.1 Limitations 886
Our interpretations and conclusions are subject to two main sets of limitations. The first set related to 887
the survey sample. On the one hand, our representative samples spoke specifically to the living 888
conditions of the rural populations during the dry post-monsoon season, when accessibility especially 889
to remote and mountain villages was easier and safer. Together with harvest cycles, seasonal 890
outmigration, and changing epidemiological patterns (Greer et al., 2018; Haenssgen et al., 2018a), this 891
a
Haenssgen et al. (paper prepared for DSA 2019) Page 47
could mean that marginalisation and constraints in healthcare access manifested themselves differently 892
during other seasons and that our results may be relatively conservative. On this basis, we could 893
speculate that the monsoon season introduces more constraints and risks, thereby amplifying the role 894
of health-related social support and mobile phone use. On the other hand, as a rural survey in Chiang 895
Rai and Salavan, we could not make claims about health behaviours in urban areas or other regions of 896
the world. 897
Secondly, the static analysis of cross-sectional data could shed only very little light on causal 898
relationships and on the evolving and bi-directional link between marginalisation and health behaviour. 899
From a static perspective, we could argue for instance that longer healthcare episodes may prompt 900
patients to use a mobile phone in order to find more viable healthcare solutions. However, most of the 901
incidences of health-related phone uses occurred early in the process: 48% of all health-related mobile 902
phone use took place in the first illness step; 77% in the first two steps.15 Over the long term, the 903
relationship between healthcare access, mobile technology diffusion, social networks, and 904
marginalisation could be recursive: If mobile phones and social support helped people manage their 905
health better, then they might be less subject to catastrophic health expenditure and health outcomes 906
and less likely to experience a process of marginalisation, which would in turn affect their relationship 907
to health-related social support and mobile phone use. The current data only enabled a glimpse at this 908
network of relationships, underlining the need for more extensive research on the multidimensional 909
implications of mobile phone diffusion and social support. 910
15 These patterns followed the more general distribution of steps in the treatment-seeking process. Across all illness
episodes in the sample, health-related mobile phone as a share of each step was relatively constant with between 11% and
15% of each step (between Steps 1 and 6, after which no phone occurs any longer).
Haenssgen et al. (paper prepared for DSA 2019) Page 48
7.2 Main Findings 911
We summarise our findings in Table 10. Our results provided support for Hypothesis H1a that 912
marginalisation linked positively to informal healthcare access and negatively to formal healthcare 913
access, in particular private healthcare providers. We did not find evidence in support of Hypothesis 914
H1b that marginalised groups experienced longer delays to formal healthcare access. The evidence is 915
therefore moderately consistent with the overarching Hypothesis H1 that marginalised groups had 916
fewer means to access formal treatment, driving them towards increased informal healthcare access. 917
The evidence relating to Hypothesis H2 was more mixed. Hypothesis H2a stated that facilitators like 918
social support and phone use entailed more and faster access to formal healthcare providers. The 919
evidence presented in this paper was consistent with this hypothesis insofar as that, broadly speaking, 920
mobile phone use was associated with more access to formal healthcare and less access to informal 921
healthcare. Social support, too, was linked positively to public and private healthcare access, but no 922
association with informal healthcare access emerged. However, we observed little indication that these 923
factors contributed to faster access. Hypothesis H2b posited that private healthcare access increased 924
disproportionately when marginalised groups mobilised social support and mobile phones. Our data 925
suggested that marginalised groups had instead relatively more access to public healthcare if they were 926
aided by phones and social support, and the evidence in Salavan even hinted at substitution away from 927
private towards public healthcare. Although mobile phone use appeared to coincide with increased 928
private healthcare access more generally, this relationship was similar for marginalised and non-929
marginalised groups. Finally, according to Hypothesis H2c, social support and phone use should have 930
been less influential among non-marginalised groups, for which we find partial support in our data. In 931
terms of healthcare utilisation, especially the rate of public healthcare access was higher among 932
marginalised phone users and people receiving social support, whereas private healthcare access was 933
more likely to be independent of either factor. In the low-income context of rural Salavan, mobile 934
phone use was also associated with faster treatment-seeking among marginalised groups. We can 935
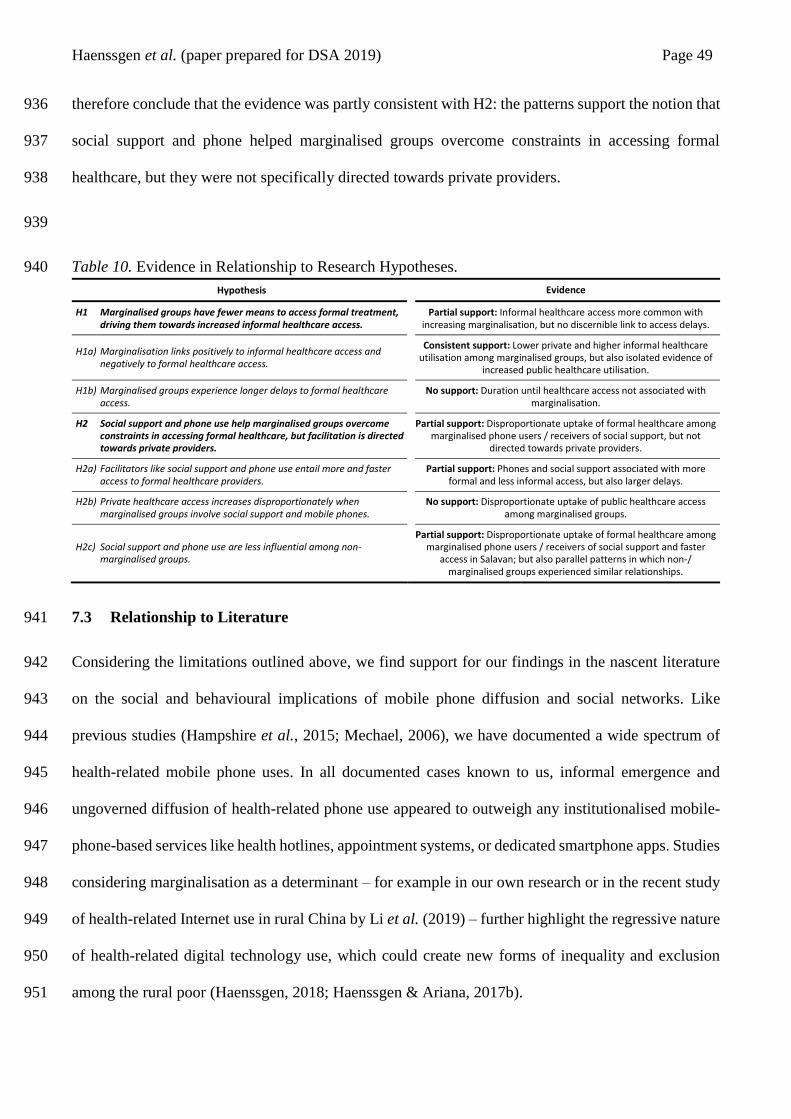
Haenssgen et al. (paper prepared for DSA 2019) Page 49
therefore conclude that the evidence was partly consistent with H2: the patterns support the notion that 936
social support and phone helped marginalised groups overcome constraints in accessing formal 937
healthcare, but they were not specifically directed towards private providers. 938
939
Table 10. Evidence in Relationship to Research Hypotheses. 940
Hypothesis Evidence
H1 Marginalised groups have fewer means to access formal treatment, driving them towards increased informal healthcare access.
Partial support: Informal healthcare access more common with increasing marginalisation, but no discernible link to access delays.
H1a) Marginalisation links positively to informal healthcare access and negatively to formal healthcare access.
Consistent support: Lower private and higher informal healthcare utilisation among marginalised groups, but also isolated evidence of
increased public healthcare utilisation.
H1b) Marginalised groups experience longer delays to formal healthcare access.
No support: Duration until healthcare access not associated with marginalisation.
H2 Social support and phone use help marginalised groups overcome constraints in accessing formal healthcare, but facilitation is directed towards private providers.
Partial support: Disproportionate uptake of formal healthcare among marginalised phone users / receivers of social support, but not
directed towards private providers.
H2a) Facilitators like social support and phone use entail more and faster access to formal healthcare providers.
Partial support: Phones and social support associated with more formal and less informal access, but also larger delays.
H2b) Private healthcare access increases disproportionately when marginalised groups involve social support and mobile phones.
No support: Disproportionate uptake of public healthcare access among marginalised groups.
H2c) Social support and phone use are less influential among non-marginalised groups.
Partial support: Disproportionate uptake of formal healthcare among marginalised phone users / receivers of social support and faster
access in Salavan; but also parallel patterns in which non-/ marginalised groups experienced similar relationships.
7.3 Relationship to Literature 941
Considering the limitations outlined above, we find support for our findings in the nascent literature 942
on the social and behavioural implications of mobile phone diffusion and social networks. Like 943
previous studies (Hampshire et al., 2015; Mechael, 2006), we have documented a wide spectrum of 944
health-related mobile phone uses. In all documented cases known to us, informal emergence and 945
ungoverned diffusion of health-related phone use appeared to outweigh any institutionalised mobile-946
phone-based services like health hotlines, appointment systems, or dedicated smartphone apps. Studies 947
considering marginalisation as a determinant – for example in our own research or in the recent study 948
of health-related Internet use in rural China by Li et al. (2019) – further highlight the regressive nature 949
of health-related digital technology use, which could create new forms of inequality and exclusion 950
among the rural poor (Haenssgen, 2018; Haenssgen & Ariana, 2017b). 951

Haenssgen et al. (paper prepared for DSA 2019) Page 50
Our documented patterns of delayed access with health-related phone use were counter-intuitive 952
especially in light of transaction cost arguments (Dammert et al., 2014; Higgs et al., 2014), but they 953
could be explained with consistent claims that mobile phones provide a sense of safety among their 954
users (i.e. knowing that there is always an escape in case of emergency, see e.g. Gagliardone, 2015; 955
Ling, 2012; Souter et al., 2005). Altered risk perceptions could then potentially entail a form of 956
“behavioural disinhibition” or risk compensation among patients, which could manifest itself in 957
delayed access to healthcare (Hedlund, 2000). Behavioural experiments that variously alter patients’ 958
risk perceptions would offer an opportunity to investigate this hypothesis further. 959
Our study also diverged from our previous research. While health-related phone use was more common 960
among privileged groups, our data suggested that especially marginalised groups experienced 961
disproportionately higher formal healthcare utilisation if their behaviour was phone aided. We further 962
anticipated that health-related mobile phone use would crowd out local social support networks despite 963
their potential complementarities (Riley, 2018), rendering healthcare access increasingly difficult for 964
the extremely marginalised (i.e. multidimensionally poor). Our data indicated instead a notable overlap 965
and similar directions between mobiles and social support, suggesting that any such transition had not 966
yet taken place. Trends could not be detected within our cross-sectional analysis and would rather 967
require a longitudinal micro-level panel data set (covering e.g. a period of five years) that considers 968
changes and inter-relationships of treatment seeking, technology use, social network composition, and 969
multidimensional poverty. In addition to analysing ego-networks of social support, future research 970
could furthermore explore how social network position and the distribution of health-related behaviour 971
within a community shaped individuals’ healthcare access. 972
8 Conclusion 973
Speaking to the practice of mHealth and to the development literature on the diffusion of digital 974
technologies, this article asked, “How do mobile phone use and social support networks influence rural 975
Haenssgen et al. (paper prepared for DSA 2019) Page 51
treatment-seeking behaviours among marginalised groups?” We framed our research within the theme 976
of marginalisation, using representative health behaviour survey data from the relatively resource-977
constrained contexts of rural Chiang Rai and Salavan. We hypothesised that marginalised groups are 978
driven into informal healthcare utilisation, and that health-related phone use and social support help 979
overcome some of the underlying constraints yet with a bias towards private healthcare providers. Our 980
analysis provided partial support for these hypotheses, whereby the disproportionate uptake of public 981
healthcare among marginalised groups with social and mobile phone support was especially notable. 982
Counterintuitive, though in line with our earlier findings from India and China (Haenssgen & Ariana, 983
2017b) was the consistent link between health-related phone use and delayed access to healthcare. 984
Some of the differences between the Chiang Rai and Salavan could be explained by their health system 985
composition. If our argument holds (and we require more extensive and longitudinal research of this 986
kind to establish our claims firmly), then marginalised groups tended to utilise private healthcare 987
providers to a lesser extent in both sites. In Chiang Rai’s relatively more affluent context and more 988
inclusive healthcare system, phone use acted in the same direction as the privilege of not being 989
marginalised. In Salavan, contrary to our expectations, mobile phone use was linked to a seeming 990
substitution of private healthcare access to public healthcare. If we assumed a causal relationship, then 991
this could suggest that reduced access barriers enabled Salavan villagers to act on their preferences for 992
public over private services – even though both kinds of providers involved user fees. However, in 993
both cases, social support especially from family and friends had similar though weaker associations 994
with healthcare access as health-related mobile phone use, but social support was distributed more 995
equitably than phone use in the rural populations. 996
Although these findings might seem encouraging overall, the relatively widespread health-related 997
mobile phone use and its behavioural consequences are – in our assessment – not necessarily good 998
news for mHealth practitioners. While widespread use indicates a degree of technological readiness 999
(Hampshire et al., 2015; Khatun et al., 2015), we argue that it is also evidence that the “vessels” of 1000
Haenssgen et al. (paper prepared for DSA 2019) Page 52
technological solutions to healthcare are no longer empty (Polgar, 1963). New solutions are likely to 1001
stand in competition with existing ones. Given the growing evidence base on “informal mHealth,” 1002
researchers and practitioners can no longer assume that digital healthcare solutions are implemented 1003
in a vacuum. We therefore recommend that mHealth interventions targeting the general population 1004
should always be preceded by a people-centric analysis of existing solutions to solve the problem in 1005
question as part of feasibility studies and subsequent evaluations. 1006
Our study therefore contributes in particular to the empirical understanding of emerging health-related 1007
phone use in context and complements the recent WHO guidance on digital interventions for health 1008
system strengthening (WHO, 2019). By shedding light on the local adaptation of diffusing technology 1009
and its social consequences, we also contribute to the broader body of work on ICT and development. 1010
And yet, our research raised more questions than it asked. The perhaps most important point is whether 1011
the opportunity to use mobile phones for healthcare access excludes marginalised non-users in the long 1012
term. Based on the existing literature (Riley, 2018), we would assume that phone-facilitated support 1013
crowds out community-level social support, leaving already marginalised rural dwellers in yet more 1014
precarious circumstances. Another question is whether and how the existing patterns of informal 1015
health-related phone use and social support shape the implementation process and success of formal 1016
mHealth interventions. Lastly, open questions how technology diffusion shapes human behaviour and 1017
development. Neighbouring fields like “mEd” (the use of mobile phones to improve educational 1018
attainment) may experience similar complications as the ones raised in our study, which promises a 1019
lively research agenda in the years ahead. 1020
Haenssgen et al. (paper prepared for DSA 2019) Page 53
References 1021
Abebaw, D., & Admassie, A. (2014). Correlates of extreme poverty in rural Ethiopia. In J. von Braun 1022
& F. W. Gatzweiler (Eds.), Marginality: addressing the nexus of poverty, exclusion and 1023
ecology (pp. 117-131). Dordrecht: Springer Netherlands. 1024
Ahmed, A. U., Hill, R. V., & Naeem, F. (2014). The poorest: Who and where they are? In J. von Braun 1025
& F. W. Gatzweiler (Eds.), Marginality: addressing the nexus of poverty, exclusion and 1026
ecology (pp. 85-99). Dordrecht: Springer Netherlands. 1027
Aker, J. C., & Mbiti, I. M. (2010). Mobile phones and economic development in Africa. The Journal 1028
of Economic Perspectives, 24(3), 207-232. doi: 10.2307/20799163 1029
Akkhavong, K., Paphassarang, C., Phoxay, C., Vonglokham, M., Phommavong, C., & Pholsena, S. 1030
(2014). Lao People’s Democratic Republic: health system review [Health Systems in 1031
Transition, Vol. 4, Issue no. 1]. Geneva: World Health Organization Regional Office for the 1032
Western Pacific. 1033
Alkire, S., & Foster, J. (2011). Counting and multidimensional poverty measurement. Journal of 1034
Public Economics, 95(7–8), 476-487. doi: 10.1016/j.jpubeco.2010.11.006 1035
Andersen, R. M. (1995). Revisiting the behavioral model and access to medical care: Does it matter? 1036
Journal of Health and Social Behavior, 36(1), 1-10. doi: 10.2307/2137284 1037
Apidechkul, T., Laingoen, O., & Suwannaporn, S. (2016). Inequity in accessing health care service in 1038
Thailand in 2015: a case study of the hill tribe people in Mae Fah Luang district, Chiang Rai, 1039
Thailand. Journal of Health Research, 30(1), 67-71. doi: 10.14456/jhr.2016.10 1040
Aranda-Jan, C. B., Mohutsiwa-Dibe, N., & Loukanova, S. (2014). Systematic review on what works, 1041
what does not work and why of implementation of mobile health (mHealth) projects in Africa. 1042
BMC Public Health, 14, 188. doi: 10.1186/1471-2458-14-188 1043
Ashley, E. A., Dhorda, M., Fairhurst, R. M., Amaratunga, C., Lim, P., Suon, S., et al. (2014). Spread 1044
of artemisinin resistance in plasmodium falciparum Malaria. New England Journal of 1045
Medicine, 371(5), 411-423. doi: 10.1056/NEJMoa1314981 1046
Azeem, M. M., Mugera, A. W., & Schilizzi, S. (2018). Vulnerability to multi-dimensional poverty: an 1047
empirical comparison of alternative measurement approaches. The Journal of Development 1048
Studies, 54(9), 1612-1636. doi: 10.1080/00220388.2017.1344646 1049
Barbosa, E. C., & Cookson, R. (2019). Multiple inequity in health care: an example from Brazil. Social 1050
Science & Medicine, 228, 1-8. doi: 10.1016/j.socscimed.2019.02.034 1051
Barrett, C. B., & Swallow, B. M. (2006). Fractal poverty traps. World Development, 34(1), 1-15. doi: 1052
10.1016/j.worlddev.2005.06.008 1053
Beals, A. R. (1976). Strategies of resort to curers in South Asia. In C. M. Leslie (Ed.), Asian medical 1054
systems: a comparative study (pp. 184-200). Berkeley: University of California Press. 1055
Bennett, S., & Tangcharoensathien, V. (1994). A shrinking state? Politics, economics and private 1056
health care in Thailand. Public Administration and Development, 14(1), 1-17. doi: 1057
10.1002/pad.4230140101 1058
Haenssgen et al. (paper prepared for DSA 2019) Page 54
Berman, Y., & Phillips, D. (2000). Indicators of social quality and social exclusion at national and 1059
community level. Social Indicators Research, 50(3), 329-350. doi: 10.1023/a:1007074127144 1060
Bigdeli, M., Jacobs, B., Tomson, G., Laing, R., Ghaffar, A., Dujardin, B., et al. (2012). Access to 1061
medicines from a health system perspective. Health Policy and Planning, 28(7), 692-704. doi: 1062
10.1093/heapol/czs108 1063
Bochaton, A. (2015). Cross-border mobility and social networks: Laotians seeking medical treatment 1064
along the Thai border. Social Science & Medicine, 124, 364-373. doi: 1065
10.1016/j.socscimed.2014.10.022 1066
Chereau, F., Opatowski, L., Tourdjman, M., & Vong, S. (2017). Risk assessment for antibiotic 1067
resistance in South East Asia. BMJ, 358(Suppl1). doi: 10.1136/bmj.j3393 1068
Chuang, Y., & Schechter, L. (2015). Social networks in developing countries. Annual Review of 1069
Resource Economics, 7(4), 4.1-4.22. doi: 10.1146/annurev-resource-100814-125123 1070
Chuengsatiansup, K., Sringernyuang, L., & Paonil, W. (2000). Community drug use in Thailand: a 1071
situational review. Bangkok: Task Force on Situation Review of Community Drug Use in 1072
Thailand. 1073
Chuma, J., Okungu, V., & Molyneux, C. (2010). Barriers to prompt and effective malaria treatment 1074
among the poorest population in Kenya. Malaria Journal, 9(144). doi: 10.1186/1475-2875-9-1075
144 1076
Coulombe, H., Epprecht, M., Pimhidzai, O., & Sisoulath, V. (2016). Where are the poor? Lao PDR 1077
2015 census-based poverty map: province and district level results. Vientiane: Ministry of 1078
Planning and Investment. 1079
Dammert, A. C., Galdo, J. C., & Galdo, V. (2014). Preventing dengue through mobile phones: 1080
evidence from a field experiment in Peru. Journal of Health Economics, 35, 147-161. doi: 1081
10.1016/j.jhealeco.2014.02.002 1082
Datzberger, S. (2018). Why education is not helping the poor. Findings from Uganda. World 1083
Development, 110, 124-139. doi: 10.1016/j.worlddev.2018.05.022 1084
De´, R., Pal, A., Sethi, R., Reddy, S. K., & Chitre, C. (2018). ICT4D research: a call for a strong critical 1085
approach. Information Technology for Development, 24(1), 63-94. doi: 1086
10.1080/02681102.2017.1286284 1087
Dobility Inc. (2017). SurveyCTO. Cambridge, MA: Dobility Inc. 1088
Donner, J. (2009). Blurring livelihoods and lives: the social uses of mobile phones and socioeconomic 1089
development. Innovations: Technology, Governance, Globalization, 4(1), 91-101. doi: 1090
10.1162/itgg.2009.4.1.91 1091
Dupas, P. (2011). Health behavior in developing countries. Annual Review of Economics, 3(1), 425-1092
449. doi: 10.1146/annurev-economics-111809-125029 1093
Espinoza-Delgado, J., & Klasen, S. (2018). Gender and multidimensional poverty in Nicaragua: an 1094
individual based approach. World Development, 110, 466-491. doi: 1095
10.1016/j.worlddev.2018.06.016 1096
Haenssgen et al. (paper prepared for DSA 2019) Page 55
Free, C., Phillips, G., Galli, L., Watson, L., Felix, L., Edwards, P., et al. (2013a). The effectiveness of 1097
mobile-health technology-based health behaviour change or disease management interventions 1098
for health care consumers: a systematic review. PLoS Medicine, 10(1), e1001362. doi: 1099
10.1371/journal.pmed.1001362 1100
Free, C., Phillips, G., Watson, L., Galli, L., Felix, L., Edwards, P., et al. (2013b). The effectiveness of 1101
mobile-health technologies to improve health care service delivery processes: a systematic 1102
review and meta-analysis. PLoS Medicine, 10(1), e1001363. doi: 1103
10.1371/journal.pmed.1001363 1104
Gagliardone, I. (2015). ‘Can you hear me?’ Mobile-radio interactions and governance in Africa. New 1105
Media & Society, 18(9), 2080-2095. doi: 10.1177/1461444815581148 1106
Garretson, O., Fan, J., Mbatia, P. N., Miller, P., & Shrum, W. (2018). When family replaced friendship: 1107
mobile communication and network change in Kenya. Sociological Forum, 33(4), 900-922. 1108
doi: 10.1111/socf.12452 1109
Gomez, R., Baron, L. F., & Fiore-Silfvast, B. (2012). The changing field of ICTD: content analysis of 1110
research published in selected journals and conferences, 2000--2010. Paper presented at the 1111
Proceedings of the Fifth International Conference on Information and Communication 1112
Technologies and Development, Atlanta, Georgia, USA. 1113
http://delivery.acm.org/10.1145/2170000/2160682/p65-1114
gomez.pdf?ip=129.67.117.236&id=2160682&acc=ACTIVE%20SERVICE&key=BF07A2E1115
E685417C5%2EF2FAECDC86A918EB%2E4D4702B0C3E38B35%2E4D4702B0C3E38B31116
5&CFID=529628244&CFTOKEN=96446614&__acm__=1437483929_7c64a2d93e6cf609e1117
964000b5c7fc337 1118
Google Inc. (2017). Google Maps. Retrieved June 17, 2017, from http://maps.google.com 1119
Graw, V., & Husmann, C. (2014). Mapping marginality hotspots. In J. von Braun & F. W. Gatzweiler 1120
(Eds.), Marginality: addressing the nexus of poverty, exclusion and ecology (pp. 69-83). 1121
Dordrecht: Springer Netherlands. 1122
Greer, R. C., Intralawan, D., Mukaka, M., Wannapinij, P., Day, N. P. J., Nedsuwan, S., et al. (2018). 1123
Retrospective review of the management of acute infections and the indications for antibiotic 1124
prescription in primary care in northern Thailand. BMJ Open, 8(e022250). doi: 1125
10.1136/bmjopen-2018-022250 1126
Gulliford, M., Figueroa-Munoz, J., Morgan, M., Hughes, D., Gibson, B., Beech, R., et al. (2002). What 1127
does 'access to health care' mean? Journal of Health Services Research & Policy, 7(3), 186-1128
188. doi: 10.1258/135581902760082517 1129
Haenssgen, M. J. (2015). Satellite-aided survey sampling and implementation in low- and middle-1130
income contexts: a low-cost/low-tech alternative. Emerging Themes in Epidemiology, 12(20). 1131
doi: 10.1186/s12982-015-0041-8 1132
Haenssgen, M. J. (2018). The struggle for digital inclusion: phones, healthcare, and marginalisation in 1133
rural India. World Development, 104, 358-374. doi: 10.1016/j.worlddev.2017.12.023 1134
Haenssgen, M. J. (2019). Manifestations, drivers, and frictions of mobile phone use in low- and 1135
middle-income settings: a mixed methods analysis of rural India and China. The Journal of 1136
Development Studies, 55(8), 1834-1858. doi: 10.1080/00220388.2018.1453605 1137
Haenssgen et al. (paper prepared for DSA 2019) Page 56
Haenssgen, M. J., & Ariana, P. (2017a). Healthcare access: a sequence-sensitive approach. SSM - 1138
Population Health, 3, 37-47. doi: 10.1016/j.ssmph.2016.11.008 1139
Haenssgen, M. J., & Ariana, P. (2017b). The social implications of technology diffusion: uncovering 1140
the unintended consequences of people’s health-related mobile phone use in rural India and 1141
China. World Development, 94, 286-304. doi: 10.1016/j.worlddev.2017.01.014 1142
Haenssgen, M. J., Charoenboon, N., Althaus, T., Greer, R. C., Intralawan, D., & Lubell, Y. (2018a). 1143
The social role of C-reactive protein point-of-care testing to guide antibiotic prescription in 1144
Northern Thailand. Social Science & Medicine, 202, 1-12. doi: 1145
10.1016/j.socscimed.2018.02.018 1146
Haenssgen, M. J., Charoenboon, N., Zanello, G., Mayxay, M., Reed-Tsochas, F., Jones, C. O. H., et 1147
al. (2018b). Antibiotics and activity spaces: protocol of an exploratory study of behaviour, 1148
marginalisation, and knowledge diffusion. BMJ Global Health, 3(e000621). doi: 1149
10.1136/bmjgh-2017-000621 1150
Hahn, H. P., & Kibora, L. (2008). The domestication of the mobile phone: oral society and new ICT 1151
in Burkina Faso. The Journal of Modern African Studies, 46(1), 87-109. doi: 1152
doi:10.1017/S0022278X07003084 1153
Hampshire, K., Porter, G., Mariwah, S., Munthali, A., Robson, E., Owusu, S. A., et al. (2017). Who 1154
bears the cost of ‘informal mhealth’? Health-workers’ mobile phone practices and associated 1155
political-moral economies of care in Ghana and Malawi. Health Policy and Planning, 32(1), 1156
34-42. doi: 10.1093/heapol/czw095 1157
Hampshire, K., Porter, G., Owusu, S. A., Mariwah, S., Abane, A., Robson, E., et al. (2015). Informal 1158
m-health: How are young people using mobile phones to bridge healthcare gaps in Sub-Saharan 1159
Africa? Social Science & Medicine, 142, 90-99. doi: 10.1016/j.socscimed.2015.07.033 1160
Hedlund, J. (2000). Risky business: safety regulations, risk compensation, and individual behavior. 1161
Injury Prevention, 6(2), 82-89. doi: 10.1136/ip.6.2.82 1162
Heeks, R., & Wall, P. J. (2018). Critical realism and ICT4D research. The Electronic Journal of 1163
Information Systems in Developing Countries, 84(e12051). doi: 10.1002/isd2.12051 1164
Heeringa, S., West, B. T., & Berglund, P. A. (2010). Applied survey data analysis. Boca Raton, FL: 1165
Chapman & Hall/CRC. 1166
Herberholz, C., & Phuntsho, S. (2018). Social capital, outpatient care utilization and choice between 1167
different levels of health facilities in rural and urban areas of Bhutan. Social Science & 1168
Medicine, 211, 102-113. doi: 10.1016/j.socscimed.2018.06.010 1169
Higgs, E. S., Goldberg, A. B., Labrique, A. B., Cook, S. H., Schmid, C., Cole, C. F., et al. (2014). 1170
Understanding the role of mHealth and other media interventions for behavior change to 1171
enhance child survival and development in low- and middle-income countries: an evidence 1172
review. Journal of Health Communication, 19(sup1), 164-189. doi: 1173
10.1080/10810730.2014.929763 1174
High, H. (2009). Dreaming beyond borders: the Thai/Lao borderlands and the mobility of the marginal. 1175
In M. Gainsborough (Ed.), On the borders of state power: frontiers in the Greater Mekong sub-1176
region (pp. 75-100). Abingdon: Routledge. 1177

Haenssgen et al. (paper prepared for DSA 2019) Page 57
ITU. (2019a). Country ICT data: Mobile-cellular subscriptions. Retrieved May 13, 2019, from 1178
International Telecommunication Union Web site: https://www.itu.int/en/ITU-1179
D/Statistics/Documents/statistics/2018/Mobile_cellular_2000-2017_Dec2018.xls 1180
ITU. (2019b). Key ICT indicators for developed and developing countries and the world (totals and 1181
penetration rates). Retrieved May 21, 2019, from International Telecommunication Union 1182
Web site: https://www.itu.int/en/ITU-D/Statistics/Documents/statistics/2018/ITU_Key_2005-1183
2018_ICT_data_with%20LDCs_rev27Nov2018.xls 1184
Jeffrey, R., & Doron, A. (2013). The great Indian phone book: how the cheap cell phone changes 1185
business, politics, and daily life. London: Hurst. 1186
Jensen, R. (2007). The digital provide: information (technology), market performance, and welfare in 1187
the South Indian fisheries sector. Quarterly Journal of Economics, 122(3), 879-924. 1188
Jongudomsuk, P., Srithamrongsawat, S., Patcharanarumol, W., Limwattananon, S., Pannarunothai, S., 1189
Vapatanavong, P., et al. (2015). The Kingdom of Thailand health system review. In V. 1190
Tangcharoensathien (Ed.), Health Systems in Transition (Vol. 5, No. 5). Manila: Asia Pacific 1191
Observatory on Health Systems and Policies. 1192
Khatun, F., Hanifi, S. M., Iqbal, M., Rasheed, S., Rahman, M. S., Ahmed, T., et al. (2014). Prospects 1193
of mHealth services in Bangladesh: recent evidence from Chakaria. PLoS One, 9(11), e111413. 1194
doi: 10.1371/journal.pone.0111413 1195
Khatun, F., Heywood, A. E., Ray, P. K., Hanifi, S. M. A., Bhuiya, A., & Liaw, S.-T. (2015). 1196
Determinants of readiness to adopt mHealth in a rural community of Bangladesh. International 1197
Journal of Medical Informatics, 84(10), 847-856. doi: 10.1016/j.ijmedinf.2015.06.008 1198
Kleine, D. (2013). Technologies of choice? ICTs, development, and the capabilities approach. 1199
Cambridge, MA: MIT Press. 1200
Krishna, S., Boren, S. A., & Balas, E. A. (2009). Healthcare via cell phones: a systematic review. 1201
Telemedicine and E-Health, 15(3), 231-240. doi: 10.1089/tmj.2008.0099 1202
Kroeger, A. (1983). Anthropological and socio-medical health care research in developing countries. 1203
Social Science & Medicine, 17(3), 147-161. doi: 10.1016/0277-9536(83)90248-4 1204
Kumar, M. (2014). Examining the circle of attachment trauma, shame, and marginalization: the 1205
unheard voices of young Kutchi Girls. In J. von Braun & F. W. Gatzweiler (Eds.), Marginality: 1206
addressing the nexus of poverty, exclusion and ecology (pp. 133-147). Dordrecht: Springer 1207
Netherlands. 1208
Labrique, A., Vasudevan, L., Chang, L. W., & Mehl, G. (2013). H_pe for mHealth: more “y” or “o” 1209
on the horizon? International Journal of Medical Informatics, 82(5), 467-469. doi: 1210
10.1016/j.ijmedinf.2012.11.016 1211
Lao Statistics Bureau. (2015). Lao population and housing census 2015: provisional report. Vientiane: 1212
Ministry of Planning and Investment. 1213
Lao Statistics Bureau. (2016). Results of population and housing census 2015. Vientiane: Ministry of 1214
Planning and Investment. 1215

Haenssgen et al. (paper prepared for DSA 2019) Page 58
Lee, S. H., Nurmatov, U. B., Nwaru, B. I., Mukherjee, M., Grant, L., & Pagliari, C. (2016). 1216
Effectiveness of mHealth interventions for maternal, newborn and child health in low- and 1217
middle-income countries: Systematic review and meta-analysis. Journal of Global Health, 1218
6(1), 010401-010401. doi: 10.7189/jogh.06.010401 1219
Leventhal, H., Weinman, J., Leventhal, E. A., & Phillips, L. A. (2008). Health psychology: the search 1220
for pathways between behavior and health. Annual Review of Psychology, 59(1), 477-505. doi: 1221
10.1146/annurev.psych.59.103006.093643 1222
Levesque, J.-F., Harris, M., & Russell, G. (2013). Patient-centred access to health care: conceptualising 1223
access at the interface of health systems and populations. International Journal for Equity in 1224
Health, 12(18). 1225
Li, H., Xu, J., Li, L., & Meng, Q. (2019). Health-related Internet use in hard-to-reach populations: 1226
empirical findings from a survey in a remote and mountainous province in China. J Med 1227
Internet Res, 21(5), e12693. doi: 10.2196/12693 1228
Ling, R. S. (2008). New tech, new ties: how mobile communication is reshaping social cohesion. 1229
Cambridge, MA: MIT Press. 1230
Ling, R. S. (2012). Taken for grantedness: the embedding of mobile communication into society. 1231
Cambridge, MA: MIT Press. 1232
Lupton, D. (2014). Critical perspectives on digital health technologies. Sociology Compass, 8(12), 1233
1344-1359. doi: 10.1111/soc4.12226 1234
Manjunath, G., Revathi, M. M., & Dixit, S. (2011). Rural healthcare on lowend phones. HP 1235
Laboratories Technical Report(63). 1236
Mayxay, M., Hansana, V., Sengphilom, B., Oulay, L., Thammavongsa, V., Somphet, V., et al. (2013). 1237
Respiratory illness healthcare-seeking behavior assessment in the Lao People’s Democratic 1238
Republic (Laos). BMC Public Health, 13(1), 444. doi: 10.1186/1471-2458-13-444 1239
Mbuagbaw, L., Mursleen, S., Lytvyn, L., Smieja, M., Dolovich, L., & Thabane, L. (2015). Mobile 1240
phone text messaging interventions for HIV and other chronic diseases: An overview of 1241
systematic reviews and framework for evidence transfer. BMC Health Services Research, 1242
15(33). doi: 10.1186/s12913-014-0654-6 1243
Mechael, P. (2006). Exploring health-related uses of mobile phones: an Egyptian case study. 1244
(Unpublished PhD thesis), London School of Hygiene and Tropical Medicine, London. 1245
Microsoft Corporation. (2017). Bing Maps. Retrieved July 17, 2017, from www.bing.com/maps 1246
Ministry of Health. (2013). Health sector reform: strategy and framework till 2025. Vientiane: The 1247
Lao People’s Democratic Republic. 1248
Miritello, G., Moro, E., Lara, R., Martínez-López, R., Belchamber, J., Roberts, S. G. B., et al. (2013). 1249
Time as a limited resource: communication strategy in mobile phone networks. Social 1250
Networks, 35(1), 89-95. doi: 10.1016/j.socnet.2013.01.003 1251
National Geospatial-Intelligence Agency. (2017). Country Files (GNS). Retrieved 17 July 2017, from 1252
http://geonames.nga.mil/gns/html/namefiles.html 1253
Haenssgen et al. (paper prepared for DSA 2019) Page 59
National Statistical Office. (2012). The 2010 population and housing census: Changwat Chiang Rai. 1254
Bangkok: National Statistical Office. 1255
National Statistical Office. (2016). The 2015 Household Socio-Economic Survey. Bangkok: Ministry 1256
of Information and Communication Technology Retrieved from 1257
http://web.nso.go.th/en/survey/house_seco/socio_15_Whole%20Kingdom.htm. 1258
Neelsen, S., Limwattananon, S., O'Donnell, O., & van Doorslaer, E. (2019). Universal health coverage: 1259
A (social insurance) job half done? World Development, 113, 246-258. doi: 1260
10.1016/j.worlddev.2018.09.004 1261
Neely, A. H., & Ponshunmugam, A. (2019). A qualitative approach to examining health care access 1262
in rural South Africa. Social Science & Medicine, 230, 214-221. doi: 1263
10.1016/j.socscimed.2019.04.025 1264
Nyamongo, I. K. (2002). Health care switching behaviour of malaria patients in a Kenyan rural 1265
community. Social Science & Medicine, 54(3), 377-386. doi: 10.1016/S0277-9536(01)00036-1266
3 1267
Obrist, B., Iteba, N., Lengeler, C., Makemba, A., Mshana, C., Nathan, R., et al. (2007). Access to 1268
health care in contexts of livelihood insecurity: a framework for analysis and action. PLoS Med, 1269
4(10), e308. doi: 10.1371/journal.pmed.0040308 1270
Pathways for Prosperity Commission on Technology and Inclusive Development. (2019). Positive 1271
disruption: health and education in a digital age. Oxford: University of Oxford. 1272
Pattanaik, P. K., & Xu, Y. (2018). On measuring multidimensional deprivation. Journal of Economic 1273
Literature, 56(2), 657-672. doi: 10.1257/jel.20161454 1274
Peredo, A. M., Montgomery, N., & McLean, M. (2018). The BoP business paradigm: what it promotes 1275
and what it conceals. Oxford Development Studies, 46(3), 411-429. doi: 1276
10.1080/13600818.2017.1399998 1277
Perkins, J. M., Subramanian, S. V., & Christakis, N. A. (2015). Social networks and health: a 1278
systematic review of sociocentric network studies in low- and middle-income countries. Social 1279
Science & Medicine, 125, 60-78. doi: https://doi.org/10.1016/j.socscimed.2014.08.019 1280
Pescosolido, B. A., Wright, E. R., Alegría, M., & Vera, M. (1998). Social networks and patterns of use 1281
among the poor with mental health problems in Puerto Rico. Medical Care, 36(7), 1057-1072. 1282
doi: 10.2307/3767365 1283
Pitkin Derose, K., & Varda, D. M. (2009). Social capital and health care access: a systematic review. 1284
Medical Care Research and Review, 66(3), 272-306. doi: 10.1177/1077558708330428 1285
Polgar, S. (1963). Health action in cross-cultural perspective. In H. E. Freeman, S. Levine & L. G. 1286
Reeder (Eds.), Handbook of Medical Sociology (Vol. 1, pp. 397-419). Englewood Cliffs, NJ: 1287
Prentice-Hall. 1288
Qian, Y., Yan, F., Wang, W., Clancy, S., Akkhavong, K., Vonglokham, M., et al. (2016). Challenges 1289
for strengthening the health workforce in the Lao People’s Democratic Republic: perspectives 1290
from key stakeholders. Human Resources for Health, 14(72). doi: 10.1186/s12960-016-0167-1291
y 1292
Haenssgen et al. (paper prepared for DSA 2019) Page 60
Rahnema, M. (2010). Poverty. In W. Sachs (Ed.), The development dictionary: a guide to knowledge 1293
as power (2nd ed.). London: Zed. 1294
Renken, J., & Heeks, R. (2018). Social network analysis and ICT4D research: principles, relevance, 1295
and practice. The Electronic Journal of Information Systems in Developing Countries, 84(4), 1296
e12036. doi: 10.1002/isd2.12036 1297
Ribera, J. M., & Hausmann-Muela, S. (2011). The straw that breaks the camel's back: redirecting 1298
health-seeking behavior studies on malaria and vulnerability. Medical Anthropology Quarterly, 1299
25(1), 103-121. doi: 10.1111/j.1548-1387.2010.01139.x 1300
Rieger, M., Wagner, N., & Bedi, A. S. (2017). Universal health coverage at the macro level: Synthetic 1301
control evidence from Thailand. Social Science & Medicine, 172, 46-55. doi: 1302
https://doi.org/10.1016/j.socscimed.2016.11.022 1303
Riley, E. (2018). Mobile money and risk sharing against village shocks. Journal of Development 1304
Economics, 135, 43-58. doi: 10.1016/j.jdeveco.2018.06.015 1305
Sa-angchai, P., Phienphommalinh, S., Yimsamran, S., Kaewkungwal, J., Kijsanayotin, B., & 1306
Soonthornworasiri, N. (2016). Geographical distribution of health workforces in Lao PDR. The 1307
Southeast Asian Journal of Tropical Medicine and Public Health, 47(4), 868-879. 1308
Sahli, Z. (1981). The phenomenon of marginalisation in underdeveloped rural communities. Third 1309
World Quarterly, 3(3), 489-498. doi: 10.1080/01436598108419576 1310
Sakboon, M. (2007). The borders within: the Akha at the frontiers of national integration. Paper 1311
presented at the Critical Transitions in the Mekong Region Conference, 29-31 January 2007, 1312
Chiang Mai. 1313
Samuel, K., Alkire, S., Zavaleta, D., Mills, C., & Hammock, J. (2018). Social isolation and its 1314
relationship to multidimensional poverty. Oxford Development Studies, 46(1), 83-97. doi: 1315
10.1080/13600818.2017.1311852 1316
Saramäki, J., Leicht, E. A., López, E., Roberts, S. G. B., Reed-Tsochas, F., & Dunbar, R. I. M. (2014). 1317
Persistence of social signatures in human communication. Proceedings of the National 1318
Academy of Sciences, 111(3), 942-947. doi: 10.1073/pnas.1308540110 1319
Sein, M. K., Thapa, D., Hatakka, M., & Sæbø, Ø. (2019). A holistic perspective on the theoretical 1320
foundations for ICT4D research. Information Technology for Development, 25(1), 7-25. doi: 1321
10.1080/02681102.2018.1503589 1322
Shaikh, B. T., Haran, D., & Hatcher, J. (2008). Where do they go, whom do they consult, and why? 1323
Health-seeking behaviors in the northern areas of Pakistan. Qualitative Health Research, 18(6), 1324
747-755. doi: 10.1177/1049732308317220 1325
Souter, D., Scott, N., Garforth, C., Jain, R., Mascarenhas, O., & McKemey, K. (2005). The economic 1326
impact of telecommunications on rural livelihoods and poverty reduction: a study of rural 1327
communities in India (Gujarat), Mozambique and Tanzania. London: UK Department for 1328
International Development. 1329

Haenssgen et al. (paper prepared for DSA 2019) Page 61
Steinert, J. I., Cluver, L. D., Melendez-Torres, G. J., & Vollmer, S. (2018). One size fits all? The 1330
validity of a composite poverty index across urban and rural households in South Africa. Social 1331
Indicators Research, 136(1), 51-72. doi: 10.1007/s11205-016-1540-x 1332
Sumner, A., & Mallett, R. (2013). Capturing multidimensionality: What does a human wellbeing 1333
conceptual framework add to the analysis of vulnerability? Social Indicators Research, 113(2), 1334
671-690. doi: 10.1007/s11205-013-0295-x 1335
Sydara, K., Gneunphonsavath, S., Wahlström, R., Freudenthal, S., Houamboun, K., Tomson, G., et al. 1336
(2005). Use of traditional medicine in Lao PDR. Complementary Therapies in Medicine, 13(3), 1337
199-205. doi: 10.1016/j.ctim.2005.05.004 1338
Unwin, P. T. H. (2009a). ICT4D: information and communication technology for development. 1339
Cambridge: Cambridge University Press. 1340
Unwin, T. (2009b). Introduction. In T. Unwin (Ed.), ICT4D: information and communication 1341
technology for development (pp. 1-6). Cambridge: Cambridge University Press. 1342
van Dijk, J. (2005). The deepening divide: inequality in the information society. Thousand Oaks, CA: 1343
Sage. 1344
van Heerden, A., Tomlinson, M., & Swartz, L. (2012). Point of care in your pocket: a research agenda 1345
for the field of m-health. Bulletin of the World Health Organization, 90(5), 393-394. 1346
von Braun, J., & Gatzweiler, F. W. (2014). Marginality—an overview and implications for policy. In 1347
J. von Braun & F. W. Gatzweiler (Eds.), Marginality: addressing the nexus of poverty, 1348
exclusion and ecology (pp. 1-23). Dordrecht: Springer Netherlands. 1349
Ward, H., Mertens, T. E., & Thomas, C. (1997). Health seeking behaviour and the control of sexually 1350
transmitted disease. Health Policy and Planning, 12(1), 19-28. 1351
WHO. (2011). mHealth: new horizons for health through mobile technologies. Geneva: World Health 1352
Organization. 1353
WHO. (2016). Global diffusion of ehealth: making universal health coverage achievable: report of 1354
the third global survey on eHealth. Geneva: World Health Organization. 1355
WHO. (2019). WHO Guideline: recommendations on digital interventions for health system 1356
strengthening. Geneva: World Health Organization Retrieved from 1357
https://www.who.int/reproductivehealth/publications/digital-interventions-health-system-1358
strengthening/en/. 1359
Willis, G. B. (2015). The practice of cross-cultural cognitive interviewing. Public Opinion Quarterly, 1360
79(S1), 359-395. doi: 10.1093/poq/nfu092 1361
World Bank. (2018a). Poverty and shared prosperity 2018: piecing together the poverty puzzle. 1362
Washington, DC: World Bank. 1363
World Bank. (2018b). World databank. Retrieved October 4, 2018, from 1364
http://databank.worldbank.org/data/home.aspx 1365

Haenssgen et al. (paper prepared for DSA 2019) Page 62
Appendix 1366
Table A1. Variable Description. 1367
Variable Description
Female Binary variable: Sex of respondent (R); [1] if female.
Age Continuous variable: Age in years.
Mar
gin
alis
atio
n
Education Binary variable: [1] if R reported not having completed at least one year of formal education.
Ethnicity Binary variable: [1] if R ethnic group reported by R represented less than 20% of the
population in R’s respective village.
Wealth Binary variable: [1] if R falls into the bottom wealth quintile of the rural provincial population. Calculated separately per field site, based on average of 17 household assets and amenities.
Travel time Binary variable: [1] if travel time between R’s village and nearest town exceeded more than
30 minutes by car (based on Google Maps and survey team travel to village)
Remoteness Binary variable: [1] village was classified as “remote” in a semi-quantitative assessment
comprising categories “peri-urban,” “rural,” and “remote.” (Consensus assessment among survey team members)
Marginalisation index Continuous variable: Sum of all five individual marginalisation indicators, normalised to scale
from [0] to [1].
He
alth
care
pre
fere
nce
s
Shops selling medicine
Binary variable for each type of healthcare provider: [1] if R reported considering the respective type of healthcare provider for consultation/treatment, advice, medicines, or
other form of health service provision (e.g. check-ups).
Traditional healers
Pharmacies
Private clinics/hospitals
Public primary care
Public hospitals
Ch
arac
teri
stic
s o
f
illn
ess
ep
iso
de
s
Illness episode of child Binary variable: [1] if illness episode was experienced by child under R’s supervision.
Self-rated severity Ordinal variable: [1] if illness is reported as “mild;” [2] as “moderate;” [3] as “severe.”
Duration Continuous variable: Total duration of illness episode in days, calculated as sum of duration of
individual steps in illness episode. (note: minimum unit per step is one day)
Process steps Continuous variable: Total number of discrete healthcare steps in illness episode.
Public healthcare Binary variable: [1] if R reported accessing health centre or hospital during illness episode.
Private healthcare Binary variable: [1] if R reported accessing private clinic, hospital, or pharmacy.
Informal healthcare Binary variable: [1] if R reported accessing grocery store or traditional healer (excluding self-
care and care from family and friends).
Health-related phone use Binary variable: [1] if R reported any phone use related to the illness (excl. general
conversations), carried out by R or any other person at any step.
Health-related social support Binary variable: [1] if R reported that any of R’s personal contacts was involved in the illness
by providing advice or help.
Pu
blic
acc
ess
Duration until access Continuous variable: Duration in days until R accessed public healthcare provider.
Steps until access Continuous variable: Number of discrete healthcare steps until R accessed public healthcare
provider.
Phone use before/during access Binary variable: [1] if R reported health-related phone use in steps before or while accessing
public healthcare provider.
Pri
vate
acc
ess
Duration until access Continuous variable: Duration in days until R accessed private healthcare provider.
Steps until access Continuous variable: Number of discrete healthcare steps until R accessed private healthcare
provider.
Phone use before/during access Binary variable: [1] if R reported health-related phone use in steps before or while accessing
private healthcare provider.
Info
rmal
acc
ess
Duration until access Continuous variable: Duration in days until R accessed informal healthcare provider.
Steps until access Continuous variable: Number of discrete healthcare steps until R accessed informal
healthcare provider.
Phone use before/during access Binary variable: [1] if R reported health-related phone use in steps before or while accessing
informal healthcare provider.
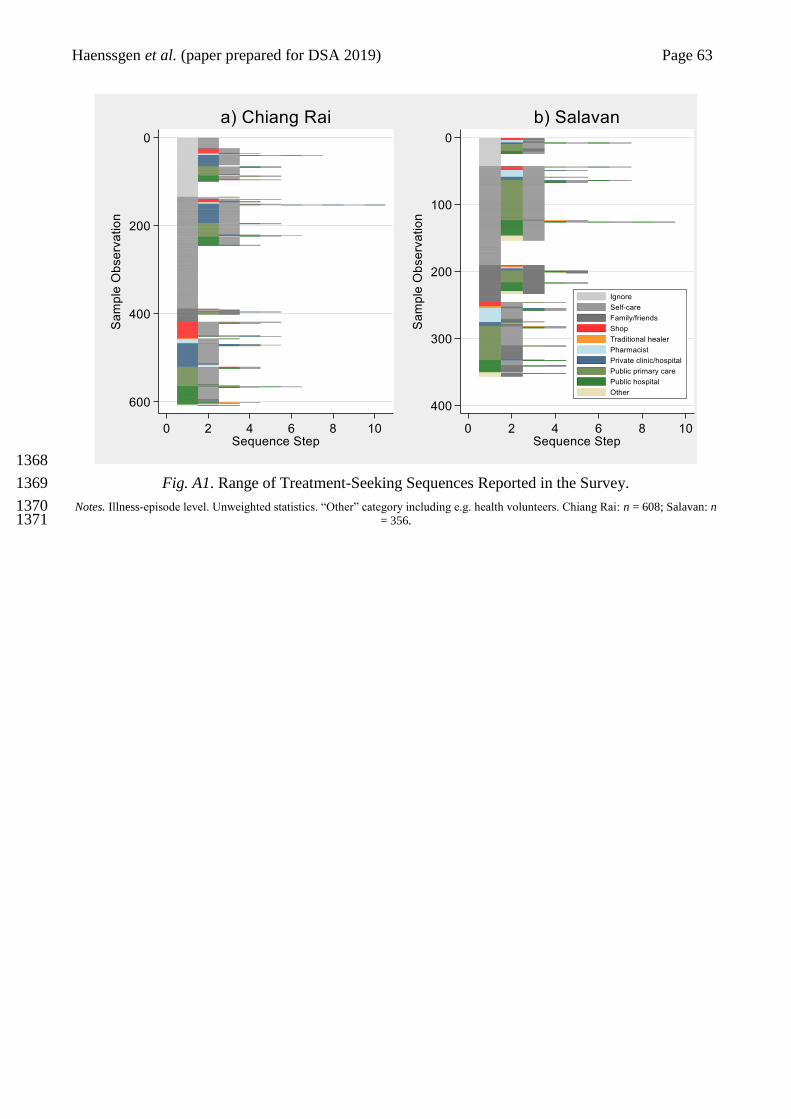
Haenssgen et al. (paper prepared for DSA 2019) Page 63
1368
Fig. A1. Range of Treatment-Seeking Sequences Reported in the Survey. 1369
Notes. Illness-episode level. Unweighted statistics. “Other” category including e.g. health volunteers. Chiang Rai: n = 608; Salavan: n 1370 = 356. 1371
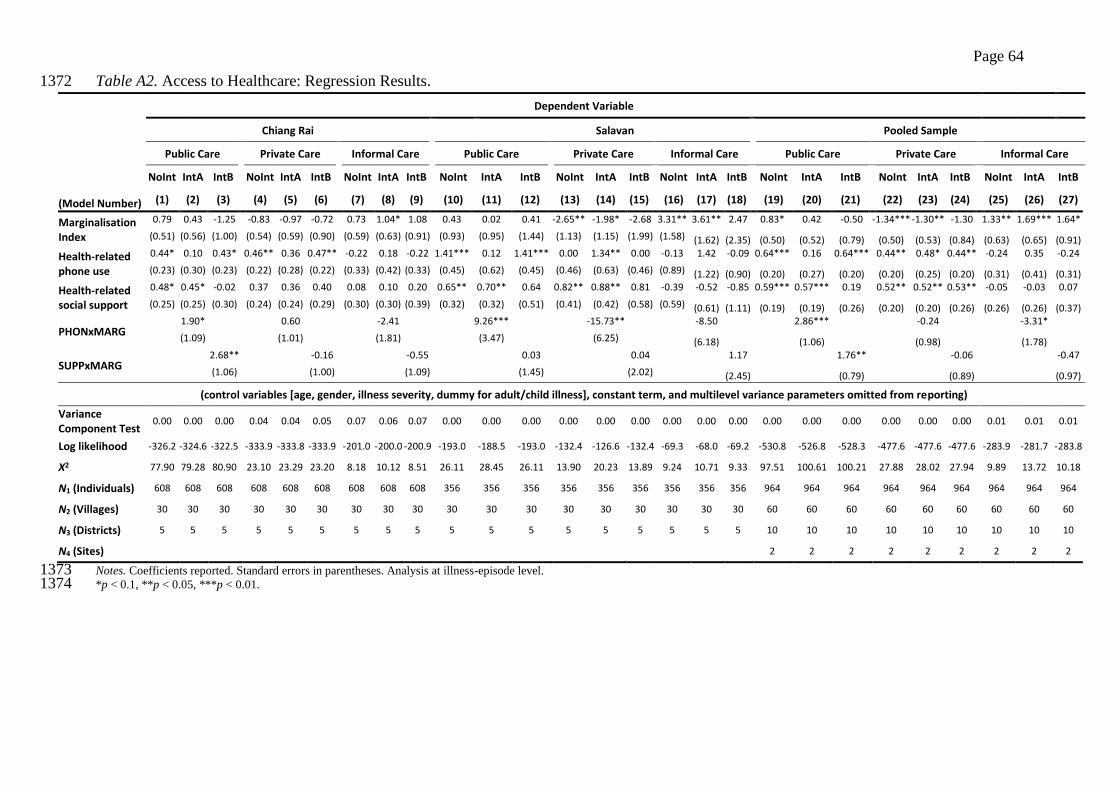
Page 64
Table A2. Access to Healthcare: Regression Results. 1372
Dependent Variable
Chiang Rai Salavan Pooled Sample
Public Care Private Care Informal Care Public Care Private Care Informal Care Public Care Private Care Informal Care
NoInt IntA IntB NoInt IntA IntB NoInt IntA IntB NoInt IntA IntB NoInt IntA IntB NoInt IntA IntB NoInt IntA IntB NoInt IntA IntB NoInt IntA IntB
(Model Number) (1) (2) (3) (4) (5) (6) (7) (8) (9) (10) (11) (12) (13) (14) (15) (16) (17) (18) (19) (20) (21) (22) (23) (24) (25) (26) (27)
Marginalisation Index
0.79 0.43 -1.25 -0.83 -0.97 -0.72 0.73 1.04* 1.08 0.43 0.02 0.41 -2.65** -1.98* -2.68 3.31** 3.61** 2.47 0.83* 0.42 -0.50 -1.34*** -1.30** -1.30 1.33** 1.69*** 1.64*
(0.51) (0.56) (1.00) (0.54) (0.59) (0.90) (0.59) (0.63) (0.91) (0.93) (0.95) (1.44) (1.13) (1.15) (1.99) (1.58) (1.62) (2.35) (0.50) (0.52) (0.79) (0.50) (0.53) (0.84) (0.63) (0.65) (0.91)
Health-related phone use
0.44* 0.10 0.43* 0.46** 0.36 0.47** -0.22 0.18 -0.22 1.41*** 0.12 1.41*** 0.00 1.34** 0.00 -0.13 1.42 -0.09 0.64*** 0.16 0.64*** 0.44** 0.48* 0.44** -0.24 0.35 -0.24
(0.23) (0.30) (0.23) (0.22) (0.28) (0.22) (0.33) (0.42) (0.33) (0.45) (0.62) (0.45) (0.46) (0.63) (0.46) (0.89) (1.22) (0.90) (0.20) (0.27) (0.20) (0.20) (0.25) (0.20) (0.31) (0.41) (0.31)
Health-related social support
0.48* 0.45* -0.02 0.37 0.36 0.40 0.08 0.10 0.20 0.65** 0.70** 0.64 0.82** 0.88** 0.81 -0.39 -0.52 -0.85 0.59*** 0.57*** 0.19 0.52** 0.52** 0.53** -0.05 -0.03 0.07
(0.25) (0.25) (0.30) (0.24) (0.24) (0.29) (0.30) (0.30) (0.39) (0.32) (0.32) (0.51) (0.41) (0.42) (0.58) (0.59) (0.61) (1.11) (0.19) (0.19) (0.26) (0.20) (0.20) (0.26) (0.26) (0.26) (0.37)
PHONxMARG 1.90*
0.60
-2.41
9.26***
-15.73**
-8.50
2.86***
-0.24
-3.31*
(1.09)
(1.01)
(1.81)
(3.47)
(6.25)
(6.18) (1.06) (0.98) (1.78)
SUPPxMARG 2.68**
-0.16
-0.55
0.03
0.04
1.17
1.76**
-0.06 -0.47
(1.06)
(1.00)
(1.09)
(1.45)
(2.02)
(2.45) (0.79) (0.89) (0.97)
(control variables [age, gender, illness severity, dummy for adult/child illness], constant term, and multilevel variance parameters omitted from reporting)
Variance Component Test
0.00 0.00 0.00 0.04 0.04 0.05 0.07 0.06 0.07 0.00 0.00 0.00 0.00 0.00 0.00 0.00 0.00 0.00 0.00 0.00 0.00 0.00 0.00 0.00 0.01 0.01 0.01
Log likelihood -326.2 -324.6 -322.5 -333.9 -333.8 -333.9 -201.0 -200.0 -200.9 -193.0 -188.5 -193.0 -132.4 -126.6 -132.4 -69.3 -68.0 -69.2 -530.8 -526.8 -528.3 -477.6 -477.6 -477.6 -283.9 -281.7 -283.8
Χ2 77.90 79.28 80.90 23.10 23.29 23.20 8.18 10.12 8.51 26.11 28.45 26.11 13.90 20.23 13.89 9.24 10.71 9.33 97.51 100.61 100.21 27.88 28.02 27.94 9.89 13.72 10.18
N1 (Individuals) 608 608 608 608 608 608 608 608 608 356 356 356 356 356 356 356 356 356 964 964 964 964 964 964 964 964 964
N2 (Villages) 30 30 30 30 30 30 30 30 30 30 30 30 30 30 30 30 30 30 60 60 60 60 60 60 60 60 60
N3 (Districts) 5 5 5 5 5 5 5 5 5 5 5 5 5 5 5 5 5 5 10 10 10 10 10 10 10 10 10
N4 (Sites) 2 2 2 2 2 2 2 2 2
Notes. Coefficients reported. Standard errors in parentheses. Analysis at illness-episode level. 1373 *p < 0.1, **p < 0.05, ***p < 0.01. 1374
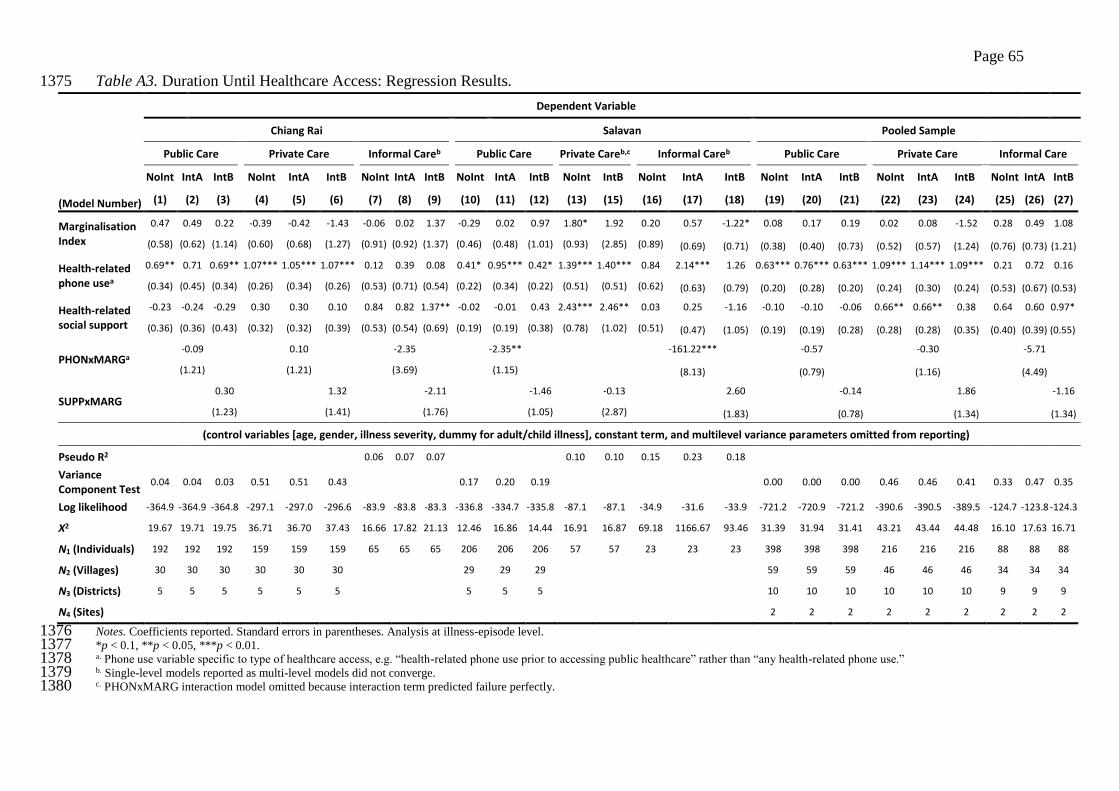
Page 65
Table A3. Duration Until Healthcare Access: Regression Results. 1375
Dependent Variable
Chiang Rai Salavan Pooled Sample
Public Care Private Care Informal Careb Public Care Private Careb,c Informal Careb Public Care Private Care Informal Care
NoInt IntA IntB NoInt IntA IntB NoInt IntA IntB NoInt IntA IntB NoInt IntB NoInt IntA IntB NoInt IntA IntB NoInt IntA IntB NoInt IntA IntB
(Model Number) (1) (2) (3) (4) (5) (6) (7) (8) (9) (10) (11) (12) (13) (15) (16) (17) (18) (19) (20) (21) (22) (23) (24) (25) (26) (27)
Marginalisation Index
0.47 0.49 0.22 -0.39 -0.42 -1.43 -0.06 0.02 1.37 -0.29 0.02 0.97 1.80* 1.92 0.20 0.57 -1.22* 0.08 0.17 0.19 0.02 0.08 -1.52 0.28 0.49 1.08
(0.58) (0.62) (1.14) (0.60) (0.68) (1.27) (0.91) (0.92) (1.37) (0.46) (0.48) (1.01) (0.93) (2.85) (0.89) (0.69) (0.71) (0.38) (0.40) (0.73) (0.52) (0.57) (1.24) (0.76) (0.73) (1.21)
Health-related phone usea
0.69** 0.71 0.69** 1.07*** 1.05*** 1.07*** 0.12 0.39 0.08 0.41* 0.95*** 0.42* 1.39*** 1.40*** 0.84 2.14*** 1.26 0.63*** 0.76*** 0.63*** 1.09*** 1.14*** 1.09*** 0.21 0.72 0.16
(0.34) (0.45) (0.34) (0.26) (0.34) (0.26) (0.53) (0.71) (0.54) (0.22) (0.34) (0.22) (0.51) (0.51) (0.62) (0.63) (0.79) (0.20) (0.28) (0.20) (0.24) (0.30) (0.24) (0.53) (0.67) (0.53)
Health-related social support
-0.23 -0.24 -0.29 0.30 0.30 0.10 0.84 0.82 1.37** -0.02 -0.01 0.43 2.43*** 2.46** 0.03 0.25 -1.16 -0.10 -0.10 -0.06 0.66** 0.66** 0.38 0.64 0.60 0.97*
(0.36) (0.36) (0.43) (0.32) (0.32) (0.39) (0.53) (0.54) (0.69) (0.19) (0.19) (0.38) (0.78) (1.02) (0.51) (0.47) (1.05) (0.19) (0.19) (0.28) (0.28) (0.28) (0.35) (0.40) (0.39) (0.55)
PHONxMARGa -0.09 0.10 -2.35 -2.35** -161.22*** -0.57 -0.30 -5.71
(1.21) (1.21) (3.69) (1.15) (8.13) (0.79) (1.16) (4.49)
SUPPxMARG 0.30 1.32 -2.11 -1.46 -0.13 2.60 -0.14 1.86 -1.16
(1.23) (1.41) (1.76) (1.05) (2.87) (1.83) (0.78) (1.34) (1.34)
(control variables [age, gender, illness severity, dummy for adult/child illness], constant term, and multilevel variance parameters omitted from reporting)
Pseudo R2 0.06 0.07 0.07 0.10 0.10 0.15 0.23 0.18
Variance Component Test
0.04 0.04 0.03 0.51 0.51 0.43 0.17 0.20 0.19 0.00 0.00 0.00 0.46 0.46 0.41 0.33 0.47 0.35
Log likelihood -364.9 -364.9 -364.8 -297.1 -297.0 -296.6 -83.9 -83.8 -83.3 -336.8 -334.7 -335.8 -87.1 -87.1 -34.9 -31.6 -33.9 -721.2 -720.9 -721.2 -390.6 -390.5 -389.5 -124.7 -123.8 -124.3
Χ2 19.67 19.71 19.75 36.71 36.70 37.43 16.66 17.82 21.13 12.46 16.86 14.44 16.91 16.87 69.18 1166.67 93.46 31.39 31.94 31.41 43.21 43.44 44.48 16.10 17.63 16.71
N1 (Individuals) 192 192 192 159 159 159 65 65 65 206 206 206 57 57 23 23 23 398 398 398 216 216 216 88 88 88
N2 (Villages) 30 30 30 30 30 30 29 29 29 59 59 59 46 46 46 34 34 34
N3 (Districts) 5 5 5 5 5 5 5 5 5 10 10 10 10 10 10 9 9 9
N4 (Sites) 2 2 2 2 2 2 2 2 2
Notes. Coefficients reported. Standard errors in parentheses. Analysis at illness-episode level. 1376 *p < 0.1, **p < 0.05, ***p < 0.01. 1377 a. Phone use variable specific to type of healthcare access, e.g. “health-related phone use prior to accessing public healthcare” rather than “any health-related phone use.” 1378 b. Single-level models reported as multi-level models did not converge. 1379 c. PHONxMARG interaction model omitted because interaction term predicted failure perfectly. 1380
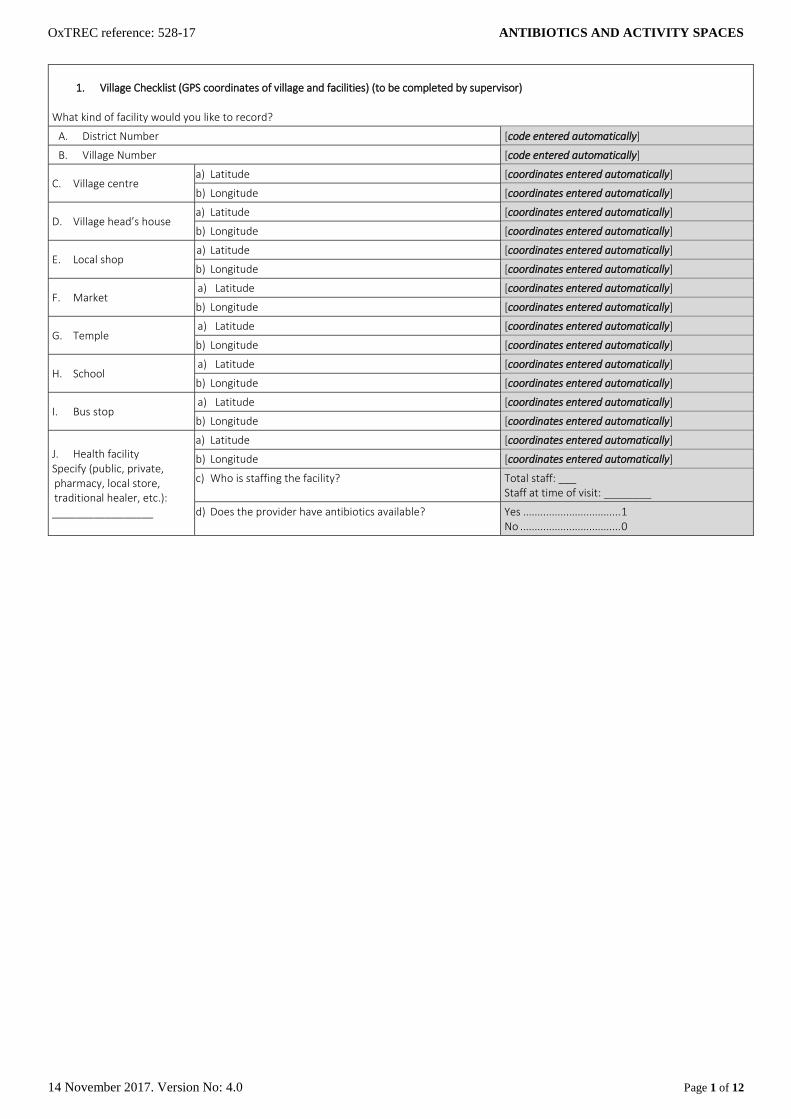
OxTREC reference: 528-17 ANTIBIOTICS AND ACTIVITY SPACES
14 November 2017. Version No: 4.0 Page 1 of 12
1. Village Checklist (GPS coordinates of village and facilities) (to be completed by supervisor) What kind of facility would you like to record?
A. District Number [code entered automatically]
B. Village Number [code entered automatically]
C. Village centre a) Latitude [coordinates entered automatically]
b) Longitude [coordinates entered automatically]
D. Village head’s house a) Latitude [coordinates entered automatically]
b) Longitude [coordinates entered automatically]
E. Local shop a) Latitude [coordinates entered automatically]
b) Longitude [coordinates entered automatically]
F. Market a) Latitude [coordinates entered automatically]
b) Longitude [coordinates entered automatically]
G. Temple a) Latitude [coordinates entered automatically]
b) Longitude [coordinates entered automatically]
H. School a) Latitude [coordinates entered automatically]
b) Longitude [coordinates entered automatically]
I. Bus stop a) Latitude [coordinates entered automatically]
b) Longitude [coordinates entered automatically]
J. Health facility Specify (public, private, pharmacy, local store, traditional healer, etc.): _________________
a) Latitude [coordinates entered automatically]
b) Longitude [coordinates entered automatically]
c) Who is staffing the facility? Total staff: ___ Staff at time of visit: ________
d) Does the provider have antibiotics available? Yes .................................. 1 No ................................... 0
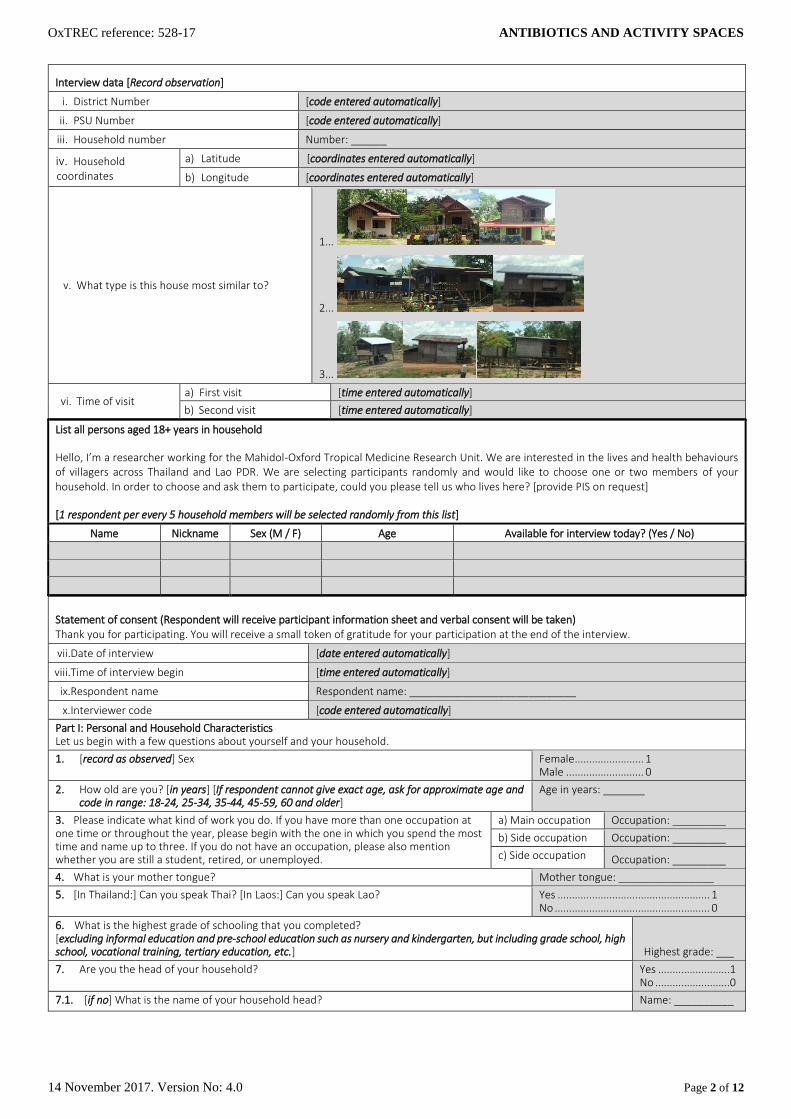
OxTREC reference: 528-17 ANTIBIOTICS AND ACTIVITY SPACES
14 November 2017. Version No: 4.0 Page 2 of 12
Interview data [Record observation]
i. District Number [code entered automatically]
ii. PSU Number [code entered automatically]
iii. Household number Number: ______
iv. Household coordinates
a) Latitude [coordinates entered automatically]
b) Longitude [coordinates entered automatically]
v. What type is this house most similar to?
1...
2...
3...
vi. Time of visit a) First visit [time entered automatically]
b) Second visit [time entered automatically]
List all persons aged 18+ years in household
Hello, I’m a researcher working for the Mahidol-Oxford Tropical Medicine Research Unit. We are interested in the lives and health behaviours of villagers across Thailand and Lao PDR. We are selecting participants randomly and would like to choose one or two members of your household. In order to choose and ask them to participate, could you please tell us who lives here? [provide PIS on request]
[1 respondent per every 5 household members will be selected randomly from this list]
Name Nickname Sex (M / F) Age Available for interview today? (Yes / No)
Statement of consent (Respondent will receive participant information sheet and verbal consent will be taken) Thank you for participating. You will receive a small token of gratitude for your participation at the end of the interview.
vii.Date of interview [date entered automatically]
viii.Time of interview begin [time entered automatically]
ix.Respondent name Respondent name: ____________________________
x.Interviewer code [code entered automatically]
Part I: Personal and Household Characteristics Let us begin with a few questions about yourself and your household.
1. [record as observed] Sex Female ........................ 1 Male ........................... 0
2. How old are you? [in years] [If respondent cannot give exact age, ask for approximate age and code in range: 18-24, 25-34, 35-44, 45-59, 60 and older]
Age in years: _______
3. Please indicate what kind of work you do. If you have more than one occupation at one time or throughout the year, please begin with the one in which you spend the most time and name up to three. If you do not have an occupation, please also mention whether you are still a student, retired, or unemployed.
a) Main occupation Occupation: _________
b) Side occupation Occupation: _________
c) Side occupation Occupation: _________
4. What is your mother tongue? Mother tongue: ________________
5. [In Thailand:] Can you speak Thai? [In Laos:] Can you speak Lao? Yes ..................................................... 1 No ...................................................... 0
6. What is the highest grade of schooling that you completed? [excluding informal education and pre-school education such as nursery and kindergarten, but including grade school, high school, vocational training, tertiary education, etc.] Highest grade: ___
7. Are you the head of your household? Yes .........................1 No ..........................0
7.1. [if no] What is the name of your household head? Name: __________
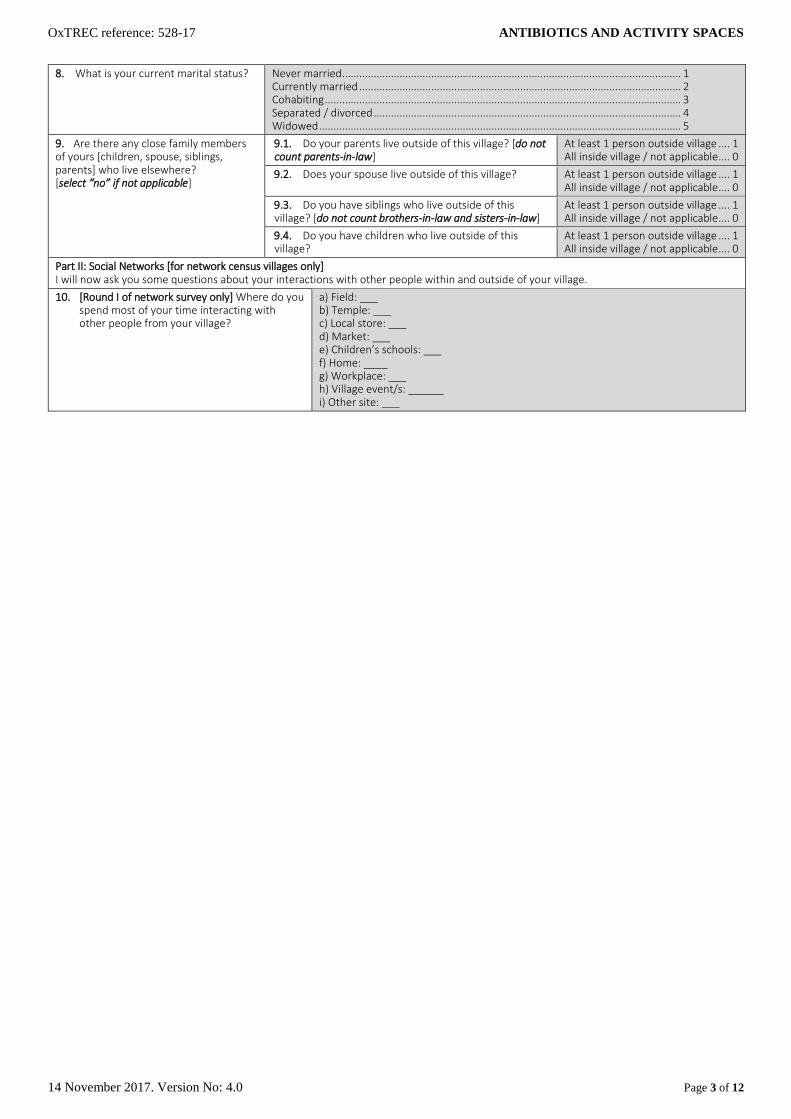
OxTREC reference: 528-17 ANTIBIOTICS AND ACTIVITY SPACES
14 November 2017. Version No: 4.0 Page 3 of 12
8. What is your current marital status? Never married ...................................................................................................................... 1 Currently married ................................................................................................................ 2 Cohabiting ............................................................................................................................ 3 Separated / divorced ........................................................................................................... 4 Widowed .............................................................................................................................. 5
9. Are there any close family members of yours [children, spouse, siblings, parents] who live elsewhere? [select “no” if not applicable]
9.1. Do your parents live outside of this village? [do not count parents-in-law]
At least 1 person outside village .... 1 All inside village / not applicable .... 0
9.2. Does your spouse live outside of this village? At least 1 person outside village .... 1 All inside village / not applicable .... 0
9.3. Do you have siblings who live outside of this village? [do not count brothers-in-law and sisters-in-law]
At least 1 person outside village .... 1 All inside village / not applicable .... 0
9.4. Do you have children who live outside of this village?
At least 1 person outside village .... 1 All inside village / not applicable .... 0
Part II: Social Networks [for network census villages only] I will now ask you some questions about your interactions with other people within and outside of your village.
10. [Round I of network survey only] Where do you spend most of your time interacting with other people from your village?
a) Field: ___ b) Temple: ___ c) Local store: ___ d) Market: ___ e) Children’s schools: ___ f) Home: ____ g) Workplace: ___ h) Village event/s: ______ i) Other site: ___
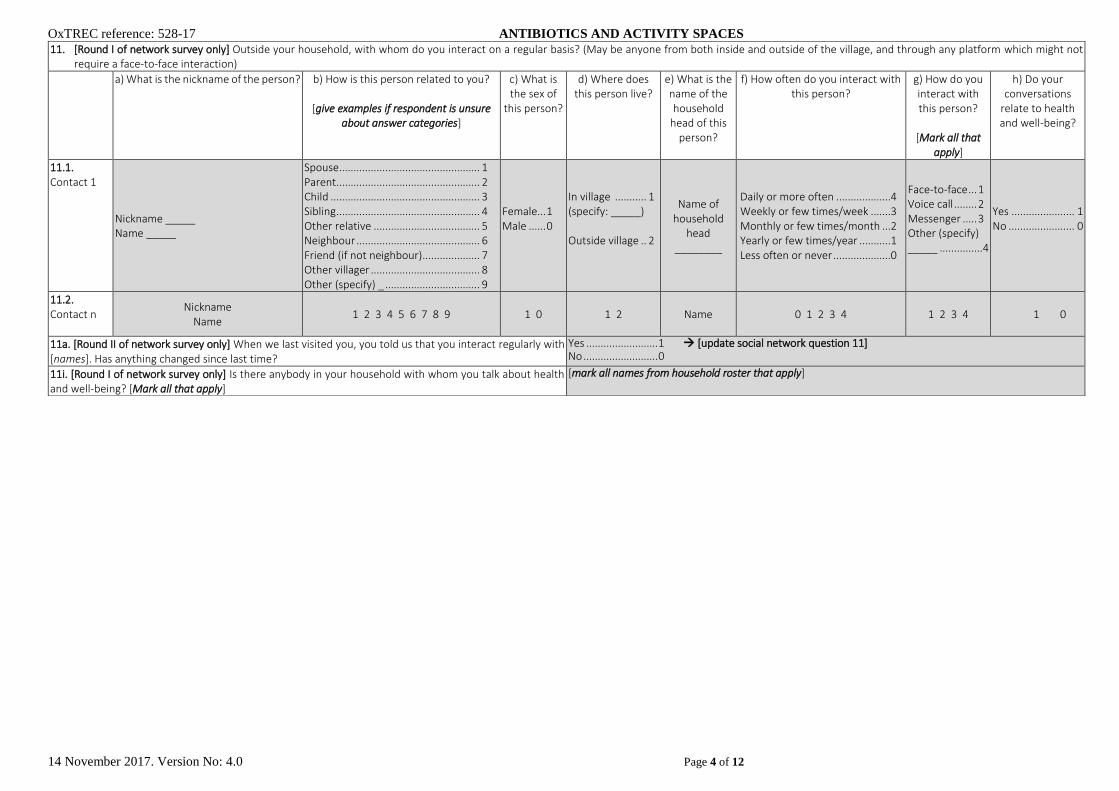
OxTREC reference: 528-17 ANTIBIOTICS AND ACTIVITY SPACES
14 November 2017. Version No: 4.0 Page 4 of 12
11. [Round I of network survey only] Outside your household, with whom do you interact on a regular basis? (May be anyone from both inside and outside of the village, and through any platform which might not require a face-to-face interaction)
a) What is the nickname of the person?
b) How is this person related to you?
[give examples if respondent is unsure about answer categories]
c) What is the sex of
this person?
d) Where does this person live?
e) What is the name of the household
head of this person?
f) How often do you interact with this person?
g) How do you interact with this person?
[Mark all that
apply]
h) Do your conversations
relate to health and well-being?
11.1. Contact 1
Nickname _____ Name _____
Spouse ................................................. 1 Parent.................................................. 2 Child .................................................... 3 Sibling .................................................. 4 Other relative ..................................... 5 Neighbour ........................................... 6 Friend (if not neighbour) .................... 7 Other villager ...................................... 8 Other (specify) _ ................................. 9
Female... 1 Male ...... 0
In village ........... 1 (specify: _____) Outside village .. 2
Name of household
head ________
Daily or more often ...................4 Weekly or few times/week .......3 Monthly or few times/month ...2 Yearly or few times/year ...........1 Less often or never ....................0
Face-to-face ... 1 Voice call ........ 2 Messenger ..... 3 Other (specify) _____ ............... 4
Yes ...................... 1 No ....................... 0
11.2. Contact n
Nickname Name
1 2 3 4 5 6 7 8 9 1 0 1 2 Name 0 1 2 3 4 1 2 3 4 1 0
11a. [Round II of network survey only] When we last visited you, you told us that you interact regularly with [names]. Has anything changed since last time?
Yes ......................... 1 [update social network question 11] No .......................... 0
11i. [Round I of network survey only] Is there anybody in your household with whom you talk about health and well-being? [Mark all that apply]
[mark all names from household roster that apply]

OxTREC reference: 528-17 ANTIBIOTICS AND ACTIVITY SPACES
14 November 2017. Version No: 4.0 Page 5 of 12
[For network survey village respondents in Round 2] 12. An education activity has recently taken place in your village.
12.1. Did you participate in any of the activities? Yes .................................................................................................................................. 1 Yes, but not throughout ................................................................................................ 2 No ................................................................................................................................... 3 Don't know / prefer not to say ..................................................................................... 4
12.2. Did you talk with anybody about the activity in your village? [“Talking” can involve any conversation including asking for information, informing about the educational activity, or discussing it (regardless of actual attendance)]
a) Nickname 1: ______ b) Full name 1: ______ c) Relationship 1: 1 2 3 4 5 6 7 a) Nickname n: ______ b) Full name n: ______ c) Relationship n: 1 2 3 4 5 6 7
[Relationship codes] Household member ............................................................................................................................ 1 Family member outside HH ................................................................................................................ 2 Other relative ...................................................................................................................................... 3 Neighbour ............................................................................................................................................ 4 Friend other than neighbour .............................................................................................................. 5 Other villager ....................................................................................................................................... 6 Other (specify) _ ................................................................................................................................. 7
[If respondent indicates conversation in Q 12.2] 12.3. What subjects did you talk about in respect to the
activity? [mark all that apply]
Going to doctor when sick ................................................................................................ 1 Anti-inflammatories/antibiotics ....................................................................................... 2 Germs ................................................................................................................................. 3 Using medicines correctly ................................................................................................. 4 Activity in general .............................................................................................................. 5 Games/awards ................................................................................................................... 6 Song/Story/Play ................................................................................................................. 7 Money/compensation ....................................................................................................... 8 Other (specify) ____ .......................................................................................................... 9
Part III: Healthcare Seeking Thank you for this. Now we come to a part where I will ask you some questions about health and health providers around here.
13. I would now like to ask you about the sources of health advice and medicine or other treatment that are available to you. Please think about all the places where you can go to get advice, treatment, or drugs if you (or your children) are sick. Do you consider the following providers when you (or your children) feel unwell? [Mark all that apply]
13.1. Drug dispensary, other local store selling medicine
Consultation ............................................................................................................... 1 Medical advice............................................................................................................ 2 Access to medicine..................................................................................................... 3 Other reason(s) .......................................................................................................... 4 Don’t consider this provider ...................................................................................... 98 Don’t know such a provider ...................................................................................... 99
13.2. Traditional healer Consultation ............................................................................................................... 1 Medical advice............................................................................................................ 2 Access to medicine..................................................................................................... 3 Other reason(s) .......................................................................................................... 4 Don’t consider this provider ...................................................................................... 98 Don’t know such a provider ...................................................................................... 99
13.3. Pharmacist Consultation ............................................................................................................... 1 Medical advice............................................................................................................ 2 Access to medicine..................................................................................................... 3 Other reason(s) .......................................................................................................... 4 Don’t consider this provider ...................................................................................... 98 Don’t know such a provider ...................................................................................... 99
13.4. Private clinic Consultation ............................................................................................................... 1 Medical advice............................................................................................................ 2 Access to medicine..................................................................................................... 3 Other reason(s) .......................................................................................................... 4 Don’t consider this provider ...................................................................................... 98 Don’t know such a provider ...................................................................................... 99
13.5. Private hospital Consultation ............................................................................................................... 1 Medical advice............................................................................................................ 2 Access to medicine..................................................................................................... 3 Other reason(s) .......................................................................................................... 4 Don’t consider this provider ...................................................................................... 98 Don’t know such a provider ...................................................................................... 99
13.6. Health volunteer Consultation ............................................................................................................... 1 Medical advice............................................................................................................ 2 Access to medicine..................................................................................................... 3 Other reason(s) .......................................................................................................... 4 Don’t consider this provider ...................................................................................... 98 Don’t know such a provider ...................................................................................... 99
13.7. Public primary care unit
Consultation ............................................................................................................... 1 Medical advice............................................................................................................ 2 Access to medicine..................................................................................................... 3 Other reason(s) .......................................................................................................... 4 Don’t consider this provider ...................................................................................... 98 Don’t know such a provider ...................................................................................... 99
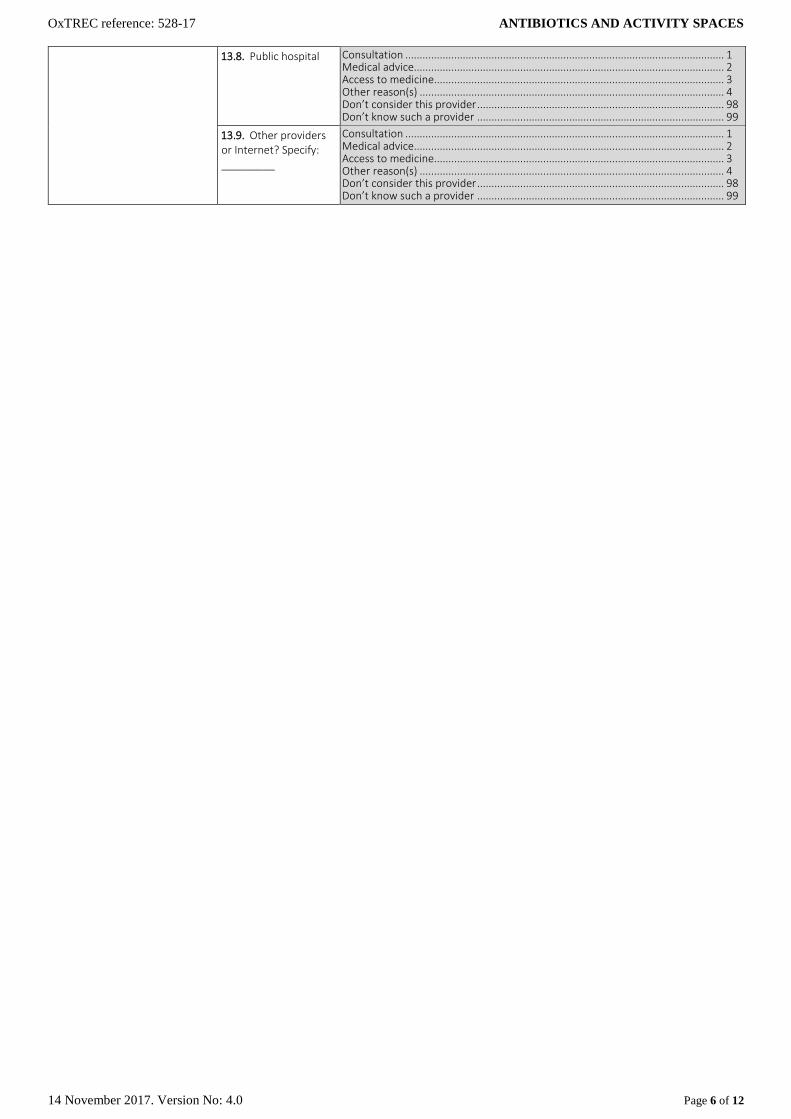
OxTREC reference: 528-17 ANTIBIOTICS AND ACTIVITY SPACES
14 November 2017. Version No: 4.0 Page 6 of 12
13.8. Public hospital Consultation ............................................................................................................... 1 Medical advice............................................................................................................ 2 Access to medicine..................................................................................................... 3 Other reason(s) .......................................................................................................... 4 Don’t consider this provider ...................................................................................... 98 Don’t know such a provider ...................................................................................... 99
13.9. Other providers or Internet? Specify: _________
Consultation ............................................................................................................... 1 Medical advice............................................................................................................ 2 Access to medicine..................................................................................................... 3 Other reason(s) .......................................................................................................... 4 Don’t consider this provider ...................................................................................... 98 Don’t know such a provider ...................................................................................... 99
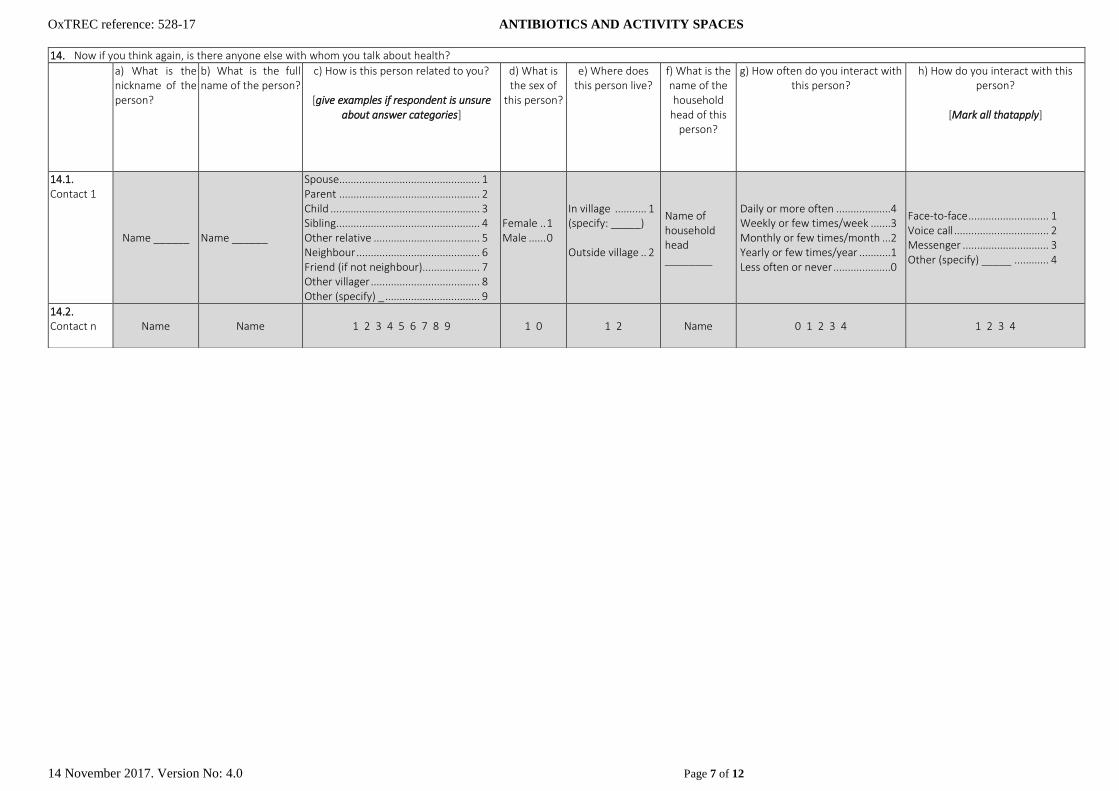
OxTREC reference: 528-17 ANTIBIOTICS AND ACTIVITY SPACES
14 November 2017. Version No: 4.0 Page 7 of 12
14. Now if you think again, is there anyone else with whom you talk about health?
a) What is the nickname of the person?
b) What is the full name of the person?
c) How is this person related to you?
[give examples if respondent is unsure about answer categories]
d) What is the sex of
this person?
e) Where does this person live?
f) What is the name of the household
head of this person?
g) How often do you interact with this person?
h) How do you interact with this person?
[Mark all thatapply]
14.1. Contact 1
Name ______ Name ______
Spouse................................................. 1 Parent ................................................. 2 Child .................................................... 3 Sibling .................................................. 4 Other relative ..................................... 5 Neighbour ........................................... 6 Friend (if not neighbour).................... 7 Other villager ...................................... 8 Other (specify) _ ................................. 9
Female .. 1 Male ...... 0
In village ........... 1 (specify: _____) Outside village .. 2
Name of household head ________
Daily or more often ...................4 Weekly or few times/week .......3 Monthly or few times/month ...2 Yearly or few times/year ...........1 Less often or never ....................0
Face-to-face ............................ 1 Voice call ................................. 2 Messenger .............................. 3 Other (specify) _____ ............ 4
14.2. Contact n
Name Name 1 2 3 4 5 6 7 8 9 1 0 1 2 Name 0 1 2 3 4 1 2 3 4

OxTREC reference: 528-17 ANTIBIOTICS AND ACTIVITY SPACES
14 November 2017. Version No: 4.0 Page 8 of 12
15. Did you or a child in your household have an acute illness (not a chronic, long-term condition that comes again and again) or an accident in the last two months? If yes, I will ask you about these illnesses one-by-one. [if no, continue with Question 19]
No........................ 0 [Q 16] Yes ....................... 1
[if yes:] 15.a [Confirm if this episode is for respondent or child]
Respondent .......................................................... 1 [Q 15.1] Child ...................................................................... 2
15.b How old is the child? Age in years: _______
15.c Is the child female or male Female ...................................... 1 Male .......................................... 0
15.1. Can you please describe the symptoms or problem in your own words?
Description of condition: __________________________________________
15.2. Did [you / the child] receive a diagnosis of the illness from any medical provide, friend, or internet source? If so, can you please describe the diagnosis of the illness if you received any and where [you / the child] received it? [note: the diagnosis might be given by any medical provider including untrained and informal. Record all diagnoses if more than one.]
a) Diagnosis 1: ___________ b) Medical provider 1: 1 2 3 4 5 6 7 8 a) Diagnosis n: ___________ b) Medical provider n: 1 2 3 4 5 6 7 8
[Response codes] Drug dispensary, other local store selling medicine ..........................................................1 Traditional healer..................................................................................................................2 Pharmacist ............................................................................................................................3 Private clinic ..........................................................................................................................4 Private hospital .....................................................................................................................5 Primary care unit ..................................................................................................................6 Public hospital .......................................................................................................................7 Other providers or Internet? Specify: ________................................................................ 8
15.3. When did [you / the child] experience the accident/discomfort (for the first time) Onset: ___ days / ______ weeks / _____ months ago
15.4. Would you describe the illness/accident as “mild,” “moderate,” or “severe”? Mild .....................................................1 Moderate ............................................2 Severe .................................................3
15.5. Can you please explain the stages of the treatment? I will ask you step-by-step what you did, starting from the moment [you / the child] first experienced a discomfort.
15.5.1. Step 1 (detection) Step n
a) What kind of help or treatment did you get at this stage? [if unsure, specify]
Ignored /did nothing .................................................................................................................................................1 Self-care (sleep, rest, medicine at home) ................................................................................................................2 Care from family and friends (full-time) ...................................................................................................................3 Treated/consulted at a traditional healer ................................................................................................................4 Treated/cons. at a pharmacist ..................................................................................................................................5 Treated/cons. at shop selling drugs ..........................................................................................................................6 Treated/cons. at priv. clinic/hospital ........................................................................................................................7 Treated/cons. at primary care unit ...........................................................................................................................8 Treated/cons. at a gvt. Hospital ................................................................................................................................9 Other (specify) _____ ................................................................................................................................................10
1 2 3 4 5 6 7 8 9
10
b) Where did this activity take place? At home ..................................................................................................................... 1 Less than 10 min. from home................................................................................... 2 10 to 29 min. ............................................................................................................. 3 30 to 59 min. ............................................................................................................. 4 60 to 119 min. ........................................................................................................... 5 2 hours or more from home ..................................................................................... 6
1 2 3 4 5 6
c) How did [you / the child] get to the place of the activity? [select “at home” according to prior responses]
At home ..................................................................................................................... 1 Walk ........................................................................................................................... 2 Own bicycle ............................................................................................................... 3 Own motorcycle / Three-wheeler ............................................................................ 4 Own car / four-wheeler ............................................................................................ 5 Taxi or other hired ride ............................................................................................. 6 Public transport ......................................................................................................... 7 Other (specify) ___ ................................................................................................... 8
1 2 3 4 5 6 7 8
d) How long did this stage last? [let respondent choose category; if <1 day, code “1” day]
Duration: ___ days
___ weeks ___ months
___ days ___ weeks __ months
e) Can you please name or describe all the medicines that you received or were prescribed during this step? [include medicine stored at home if “self-care at home”] [continue for all medicines received, then complete Questions g to k for each medicine individually]
Medicine 1: Name/description: _____ Medicine n: Name/description: _____
Medicine 1
Medicine
n
f) For how long did [you / the child] take the medicine? [let respondent choose category; if more than one repeated episode, indicate total duration] [for each medicine individually]
Duration: ___ days
___ weeks ___ months
___ days ___ weeks __ months

OxTREC reference: 528-17 ANTIBIOTICS AND ACTIVITY SPACES
14 November 2017. Version No: 4.0 Page 9 of 12
g) How often per day did [you / the child] take the medicine? [calculate into daily use according to respondent’s chosen frequency] [for each medicine individually]
Frequency: ___ times daily ___ times
daily
h) What dosage did [you / the child] normally take? [let respondent choose category according to type of medicine] [for each medicine individually]
Dosage ___ tablets / capsules
___ drops (for liquid medicine) ___ spoons (for liquid medicine)
____ shots/injections (for intravenous medicine) per time administered
___ tablets ___ drops
___ spoons ___ shots
i) Did [you / the child] take the medicine exactly as it was recommended to you by the person who prescribed/sold them [for each medicine individually]
Yes ....................................................................................... 1 No ........................................................................................ 0 Did not receive advice ........................................................ 9 Don’t know ....................................................................... 99
1 2 9
99
j) Did [you / the child] finish the medicine? [for each medicine individually]
Yes ............................ 1 No ............................. 0
1 0
k) Did you or anybody else use a mobile phone during this stage in connection with your condition? [if no, go to next step]
Yes ............................ 1 No ............................. 0 [next step]
1 0
l) What was the purpose of using the mobile phone? [Mark all that apply]
Ask for advice ............................................................................................................................. 1 Call for treatment ...................................................................................................................... 2 Arrange transport ...................................................................................................................... 3 Appointment .............................................................................................................................. 4 Reassure family/friends ............................................................................................................. 5 Ask for money/supplies ............................................................................................................. 6 Provider contacting me for information ................................................................................... 7 Treatment reminder .................................................................................................................. 8 Other (specify) _ ........................................................................................................................ 9
1 2 3 4 5 6 7 8 9
m) Which mobile phone functions did you or anybody else use? [Mark all that apply]
Call .............................................................................................................................................. 1 SMS ............................................................................................................................................. 2 Internet, messenger .................................................................................................................. 3 Alarm, calendar, reminder, etc. ................................................................................................ 4 Other (specify) _ ........................................................................................................................ 5
1 2 3 4 5
15.6. [Have you / has the child] now recovered from the illness/accident?
Yes ............................ 1 No ............................. 0
15.7. Was anybody of your personal relationships involved in providing advice or help during the illness? [record up to ten names]
Yes ............................ 1 No ............................. 0
[For district survey] 15.7.b How are these people related to
you? [Mark all that apply]
Spouse ....................................... 1 Parent........................................ 2 Child .......................................... 3 Sibling ........................................ 4 Other relative ........................... 5 Neighbour ................................. 6 Friend (if not neighbour) .......... 7 Other villager ............................ 8 Other (specify) _ ....................... 9
15.7.c What kind of support did they provide? [Mark all that apply]
Providing healthcare/attending.............................................................................................. 11 Providing advice ...................................................................................................................... 12 Providing medicine .................................................................................................................. 13 Lending/granting money ......................................................................................................... 21 Transportation/Lending vehicle ............................................................................................. 22 Contacting family/friends ....................................................................................................... 23 Providing food ......................................................................................................................... 31 Helping with children/housework .......................................................................................... 32 Helping with jobs/agriculture work (feeding animals/tending crops/covering shifts, etc.) 33 Other (specify) _ ...................................................................................................................... 99
[For network survey]
a) What is the name of the
person?
b) How is this person related to you?
c) What kind of support was provided? [mark all that apply]
15.7.1. Contact 1
Name: _______
Spouse ....................... 1 Parent........................ 2 Child .......................... 3 Sibling ........................ 4 Other relative ........... 5 Neighbour ................. 6 Friend (if not neighbour) ................ 7 Other villager ............ 8 Other (specify) _ ....... 9
Providing healthcare/attending.............................................................................................. 11 Providing advice ...................................................................................................................... 12 Providing medicine .................................................................................................................. 13 Lending/granting money ......................................................................................................... 21 Transportation/Lending vehicle ............................................................................................. 22 Contacting family/friends ....................................................................................................... 23 Providing food ......................................................................................................................... 31 Helping with children/housework .......................................................................................... 32 Helping with jobs/agriculture work (feeding animals/tending crops/covering shifts, etc.) 33 Other (specify) _ ...................................................................................................................... 99
15.7.2. Contact n
Name 1 2 3 4 5 6 7 8 9 11 12 13 21 22 23 31 32 33 99

OxTREC reference: 528-17 ANTIBIOTICS AND ACTIVITY SPACES
14 November 2017. Version No: 4.0 Page 10 of 12
15.8. Did you have another acute illness (not a chronic, long-term condition that comes again and again) or an accident in the last two months?
[if yes, complete another sheet for Question 15]
Yes ............................ 1 [Q 15] No ............................. 0
16. I would now like to ask you your opinion about medicine. There are no right or wrong answers, I only want to understand what you think. Consider the following medicines:
16.1. Have you seen these medicines before? Yes ..................... 1 No ..................... 0 [Q 16.4]
16.2. What do you call this medicine? Antibiotics ทา่นเรยีกยานี้วา่อะไร....................................................................................................... 11 Anti-inflammatory ยาแกอ้กัเสบ .................................................................................................... 12 Germ killer ยาฆา่เชือ้ ................................................................................................................... 13 Amoxy / Amoxicillin อะมอ็กซี/่อะมอ็กซีซ่ลิลนิ ................................................................................... 14 Sore throat medicine ยาแกเ้จบ็คอ ............................................................................................... 15 Cough medicine ยาแกไ้อ ............................................................................................................ 16 Pain reliever ยาแกป้วด ................................................................................................................ 17 Fever reliever ยาแกไ้ข ้................................................................................................................ 18 Other (specify: ____) อื่นๆ (โปรดระบุ) .......................................................................................... 98 Germ preventer / antibiotic ຢາຕ້ານເຊ ້ ອ .............................................................................. 21 Amok ຢາຕ້ານເຊ ້ ອ .................................................................................................................. 22 Ampi ຍາແອມປ ້ ...................................................................................................................... 23 Tetra ຍາເຕຕ້າ ........................................................................................................................ 24 Gulolam ກູໂລລາມ ................................................................................................................... 25 Sepasin ເຊພາຊິ ນ .................................................................................................................... 26 Other (specify: __) ................................................................................................................... 99
16.3. What symptoms or illnesses would you use this medicine for?
Fever ........................................................................................................................................ 1 Cough ....................................................................................................................................... 2 Sore throat ............................................................................................................................... 3 Inflammation ........................................................................................................................... 4 Cold, flu, runny nose ............................................................................................................... 5 Diarrhoea ................................................................................................................................. 6 Headache ................................................................................................................................. 7 Stomach ache .......................................................................................................................... 8 Muscle pain, other aches ........................................................................................................ 9 Skin diseases, rashes, lumps ................................................................................................... 10 Wounds .................................................................................................................................... 11 Urinary tract infections ........................................................................................................... 12 Every kind of sickness.............................................................................................................. 13 Whatever the doctor suggests ............................................................................................... 14 Don’t know / prefer not to say ............................................................................................... 98 Other (specify: __) ................................................................................................................... 99
16.4. Is there any situation for which you would buy this medicine?
Desirable attitude/knowledge ................................................................................................ 1 Undesirable attitude/knowledge ........................................................................................... 0 No attitude / refuse to answer (respondent is aware, but doesn’t reveal attitude) ........... 97 Answer does not apply to question (respondent may be aware/unaware; satisficing)...... 98 Not aware of this medicine (awkward, cannot answer but does not try to satisfy) ........... 99
16.5. Do you prefer other remedies such as herbs or cough syrup to this medicine for [sore throat]?
Desirable attitude/knowledge ................................................................................................ 1 Undesirable attitude/knowledge ........................................................................................... 0 No attitude / refuse to answer (respondent is aware, but doesn’t reveal attitude) ........... 97 Answer does not apply to question (respondent may be aware/unaware; satisficing)...... 98 Not aware of this medicine (awkward, cannot answer but does not try to satisfy) ........... 99
16.6. If you were prescribed this medicine by a doctor and did not finish the course, would you keep it for future use?
Desirable attitude/knowledge ................................................................................................ 1 Undesirable attitude/knowledge ........................................................................................... 0 No attitude / refuse to answer (respondent is aware, but doesn’t reveal attitude) ........... 97 Answer does not apply to question (respondent may be aware/unaware; satisficing)...... 98 Not aware of this medicine (awkward, cannot answer but does not try to satisfy) ........... 99
16.7. Have you heard about drug resistance? (16.7a using alternative term “lueng yah” in Lao)
Yes ................................ 1 No ................................. 2
16.8. What do you think is drug resistance? (16.8a using alternative term “lueng yah” in Lao)
Bacteria are resistant to medicine ..................................................................................................................... 1 Antibiotics become less effective if used wrongly/too much ........................................................................... 2 Medicine in general becomes less effective if used wrongly/too much .......................................................... 3 Being stubborn to take medicine ....................................................................................................................... 4 Being addicted to medicine ................................................................................................................................ 5 Drug allergy ......................................................................................................................................................... 6 Lueng yah (drug resistance) ............................................................................................................................... 7 Answer does not relate to drug resistance ........................................................................................................ 8 Other (specify) ..................................................................................................................................................... 98 “Don’t know” ....................................................................................................................................................... 99
16.9. Can your drug resistance ("due yah") spread to other people, for example if you sneeze on them?
Desirable attitude/knowledge ................................................................................................ 1 Undesirable attitude/knowledge ........................................................................................... 0 No attitude / refuse to answer (respondent is aware, but doesn’t reveal attitude) ........... 97 Answer does not apply to question (respondent may be aware/unaware; satisficing)...... 98 Not aware of this medicine (awkward, cannot answer but does not try to satisfy) ........... 99
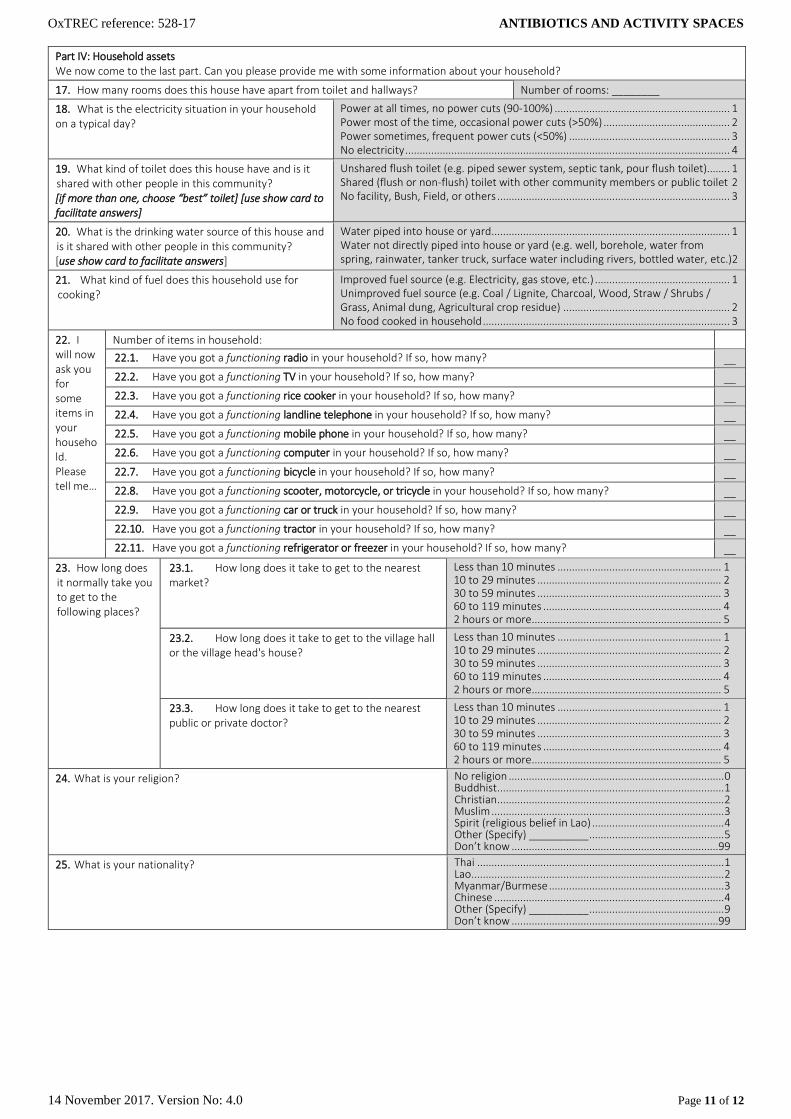
OxTREC reference: 528-17 ANTIBIOTICS AND ACTIVITY SPACES
14 November 2017. Version No: 4.0 Page 11 of 12
Part IV: Household assets We now come to the last part. Can you please provide me with some information about your household?
17. How many rooms does this house have apart from toilet and hallways? Number of rooms: ________
18. What is the electricity situation in your household on a typical day?
Power at all times, no power cuts (90-100%) ............................................................. 1 Power most of the time, occasional power cuts (>50%) ............................................ 2 Power sometimes, frequent power cuts (<50%) ........................................................ 3 No electricity ................................................................................................................. 4
19. What kind of toilet does this house have and is it shared with other people in this community? [if more than one, choose “best” toilet] [use show card to facilitate answers]
Unshared flush toilet (e.g. piped sewer system, septic tank, pour flush toilet) ........ 1 Shared (flush or non-flush) toilet with other community members or public toilet 2 No facility, Bush, Field, or others ................................................................................. 3
20. What is the drinking water source of this house and is it shared with other people in this community? [use show card to facilitate answers]
Water piped into house or yard ................................................................................... 1 Water not directly piped into house or yard (e.g. well, borehole, water from spring, rainwater, tanker truck, surface water including rivers, bottled water, etc.)2
21. What kind of fuel does this household use for cooking?
Improved fuel source (e.g. Electricity, gas stove, etc.) ............................................... 1 Unimproved fuel source (e.g. Coal / Lignite, Charcoal, Wood, Straw / Shrubs / Grass, Animal dung, Agricultural crop residue) .......................................................... 2 No food cooked in household ...................................................................................... 3
22. I will now ask you for some items in your household. Please tell me…
Number of items in household:
22.1. Have you got a functioning radio in your household? If so, how many? __
22.2. Have you got a functioning TV in your household? If so, how many? __
22.3. Have you got a functioning rice cooker in your household? If so, how many? __
22.4. Have you got a functioning landline telephone in your household? If so, how many? __
22.5. Have you got a functioning mobile phone in your household? If so, how many? __
22.6. Have you got a functioning computer in your household? If so, how many? __
22.7. Have you got a functioning bicycle in your household? If so, how many? __
22.8. Have you got a functioning scooter, motorcycle, or tricycle in your household? If so, how many? __
22.9. Have you got a functioning car or truck in your household? If so, how many? __
22.10. Have you got a functioning tractor in your household? If so, how many? __
22.11. Have you got a functioning refrigerator or freezer in your household? If so, how many? __
23. How long does it normally take you to get to the following places?
23.1. How long does it take to get to the nearest market?
Less than 10 minutes ......................................................... 1 10 to 29 minutes ................................................................ 2 30 to 59 minutes ................................................................ 3 60 to 119 minutes .............................................................. 4 2 hours or more .................................................................. 5
23.2. How long does it take to get to the village hall or the village head's house?
Less than 10 minutes ......................................................... 1 10 to 29 minutes ................................................................ 2 30 to 59 minutes ................................................................ 3 60 to 119 minutes .............................................................. 4 2 hours or more .................................................................. 5
23.3. How long does it take to get to the nearest public or private doctor?
Less than 10 minutes ......................................................... 1 10 to 29 minutes ................................................................ 2 30 to 59 minutes ................................................................ 3 60 to 119 minutes .............................................................. 4 2 hours or more .................................................................. 5
24. What is your religion? No religion ........................................................................... 0 Buddhist ............................................................................... 1 Christian ............................................................................... 2 Muslim ................................................................................. 3 Spirit (religious belief in Lao) .............................................. 4 Other (Specify) __________ ............................................... 5 Don’t know ........................................................................99
25. What is your nationality? Thai ...................................................................................... 1 Lao........................................................................................ 2 Myanmar/Burmese ............................................................. 3 Chinese ................................................................................ 4 Other (Specify) __________ ............................................... 9 Don’t know ........................................................................99
OxTREC reference: 528-17 ANTIBIOTICS AND ACTIVITY SPACES
14 November 2017. Version No: 4.0 Page 12 of 12
26. What is your ethnic background? Thai ...................................................................................... 1 Tai Yai ................................................................................... 2 Akha (E-Koh) ........................................................................ 3 Pakakeryor (Karen) .............................................................. 4 Lahu (Muser) ....................................................................... 5 Lisu (Lisaw) .......................................................................... 6 Hmong (Meaw) ................................................................... 7 Mien (Yao) ........................................................................... 8 Burmese ............................................................................... 9 Yunnan (Jin Haw) ...............................................................10 Tai Lue (Tai) .......................................................................11
Lao......................................................................................21 Kathuic ...............................................................................22 Bahnaric Khmer .................................................................23 Tai Thai...............................................................................24
Other (Specify) ________ .................................................30 Don’t know ........................................................................99
xi. Interview end time [time entered automatically]
Thank you very much for participating in this survey. [give gift to respondent]
Part V: Interviewer observations [to be completed by interviewer after interview]
xii. Was the interview completed?
Yes ....................................................................................................... 1 Yes, with difficulties ........................................................................... 2 No ....................................................................................................... 3
xiii. Was someone else present during the interview? [mark all that apply]
Survey supervisor .................................................................................. 1 Other household or family member .................................................... 2 Medical practitioner .............................................................................. 3 Government officer ............................................................................... 4 Other (specify) ____.............................................................................. 5 No one ................................................................................................... 0
xiv. What is your evaluation of the accuracy and trustworthiness of the informant's answers?
Very good .......................................................... 1 Satisfactory ........................................................ 2 Doubtful ............................................................. 3 Very low ............................................................. 4
xv. Were there any unusual circumstances during the interview? Please describe: ____________________________________
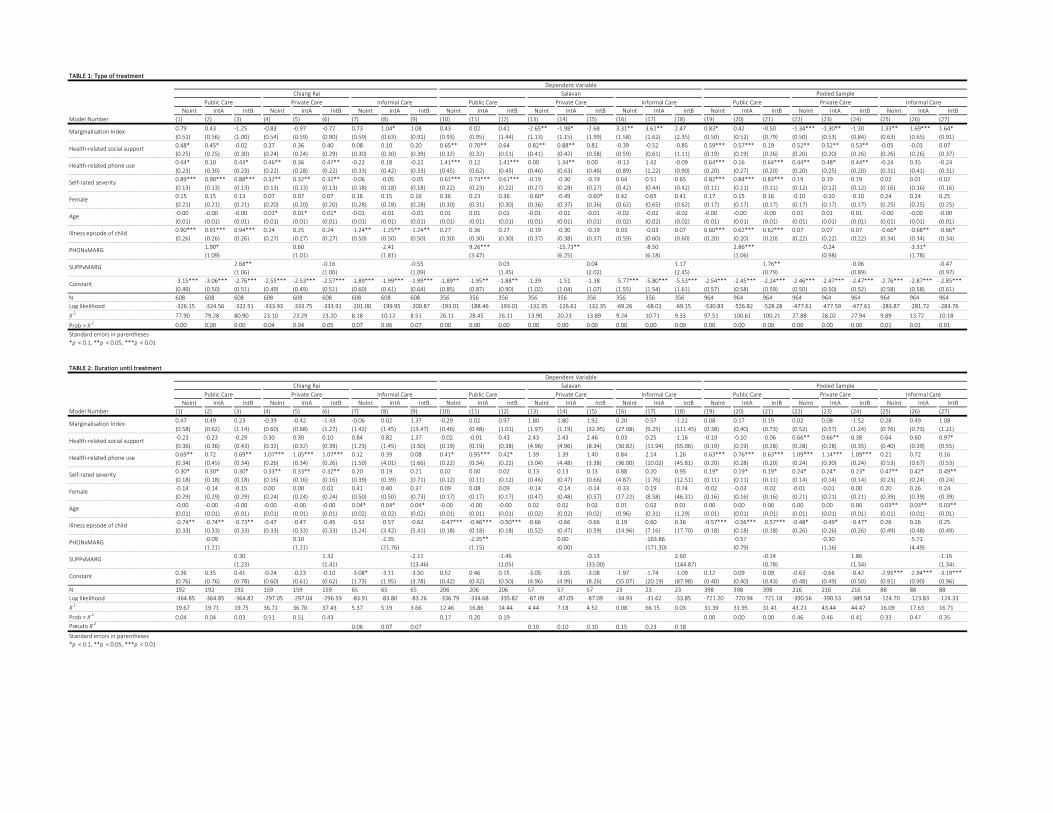
TABLE 1: Type of treatment
NoInt IntA IntB NoInt IntA IntB NoInt IntA IntB NoInt IntA IntB NoInt IntA IntB NoInt IntA IntB NoInt IntA IntB NoInt IntA IntB NoInt IntA IntB
Model Number (1) (2) (3) (4) (5) (6) (7) (8) (9) (10) (11) (12) (13) (14) (15) (16) (17) (18) (19) (20) (21) (22) (23) (24) (25) (26) (27)
0.79 0.43 -1.25 -0.83 -0.97 -0.72 0.73 1.04* 1.08 0.43 0.02 0.41 -2.65** -1.98* -2.68 3.31** 3.61** 2.47 0.83* 0.42 -0.50 -1.34*** -1.30** -1.30 1.33** 1.69*** 1.64*
(0.51) (0.56) (1.00) (0.54) (0.59) (0.90) (0.59) (0.63) (0.91) (0.93) (0.95) (1.44) (1.13) (1.15) (1.99) (1.58) (1.62) (2.35) (0.50) (0.52) (0.79) (0.50) (0.53) (0.84) (0.63) (0.65) (0.91)
0.48* 0.45* -0.02 0.37 0.36 0.40 0.08 0.10 0.20 0.65** 0.70** 0.64 0.82** 0.88** 0.81 -0.39 -0.52 -0.85 0.59*** 0.57*** 0.19 0.52** 0.52** 0.53** -0.05 -0.03 0.07
(0.25) (0.25) (0.30) (0.24) (0.24) (0.29) (0.30) (0.30) (0.39) (0.32) (0.32) (0.51) (0.41) (0.42) (0.58) (0.59) (0.61) (1.11) (0.19) (0.19) (0.26) (0.20) (0.20) (0.26) (0.26) (0.26) (0.37)
0.44* 0.10 0.43* 0.46** 0.36 0.47** -0.22 0.18 -0.22 1.41*** 0.12 1.41*** 0.00 1.34** 0.00 -0.13 1.42 -0.09 0.64*** 0.16 0.64*** 0.44** 0.48* 0.44** -0.24 0.35 -0.24
(0.23) (0.30) (0.23) (0.22) (0.28) (0.22) (0.33) (0.42) (0.33) (0.45) (0.62) (0.45) (0.46) (0.63) (0.46) (0.89) (1.22) (0.90) (0.20) (0.27) (0.20) (0.20) (0.25) (0.20) (0.31) (0.41) (0.31)
0.89*** 0.90*** 0.88*** 0.32** 0.32** 0.32** -0.06 -0.05 -0.05 0.61*** 0.73*** 0.61*** -0.19 -0.30 -0.19 0.64 0.51 0.65 0.82*** 0.84*** 0.83*** 0.19 0.19 0.19 0.02 0.01 0.02
(0.13) (0.13) (0.13) (0.13) (0.13) (0.13) (0.18) (0.18) (0.18) (0.22) (0.23) (0.22) (0.27) (0.28) (0.27) (0.42) (0.44) (0.42) (0.11) (0.11) (0.11) (0.12) (0.12) (0.12) (0.16) (0.16) (0.16)
0.15 0.15 0.13 0.07 0.07 0.07 0.16 0.15 0.16 0.36 0.23 0.36 -0.60* -0.49 -0.60* 0.42 0.65 0.41 0.17 0.15 0.16 -0.10 -0.10 -0.10 0.24 0.24 0.25
(0.21) (0.21) (0.21) (0.20) (0.20) (0.20) (0.28) (0.28) (0.28) (0.30) (0.31) (0.30) (0.36) (0.37) (0.36) (0.62) (0.65) (0.62) (0.17) (0.17) (0.17) (0.17) (0.17) (0.17) (0.25) (0.25) (0.25)
-0.00 -0.00 -0.00 0.01* 0.01* 0.01* -0.01 -0.01 -0.01 0.01 0.01 0.01 -0.01 -0.01 -0.01 -0.02 -0.02 -0.02 -0.00 -0.00 -0.00 0.01 0.01 0.01 -0.00 -0.00 -0.00
(0.01) (0.01) (0.01) (0.01) (0.01) (0.01) (0.01) (0.01) (0.01) (0.01) (0.01) (0.01) (0.01) (0.01) (0.01) (0.02) (0.02) (0.02) (0.01) (0.01) (0.01) (0.01) (0.01) (0.01) (0.01) (0.01) (0.01)
0.90*** 0.91*** 0.94*** 0.24 0.25 0.24 -1.24** -1.25** -1.24** 0.27 0.36 0.27 -0.19 -0.30 -0.19 0.03 -0.03 0.07 0.60*** 0.62*** 0.62*** 0.07 0.07 0.07 -0.66* -0.68** -0.66*
(0.26) (0.26) (0.26) (0.27) (0.27) (0.27) (0.50) (0.50) (0.50) (0.30) (0.30) (0.30) (0.37) (0.38) (0.37) (0.59) (0.60) (0.60) (0.20) (0.20) (0.20) (0.22) (0.22) (0.22) (0.34) (0.34) (0.34)
1.90* 0.60 -2.41 9.26*** -15.73** -8.50 2.86*** -0.24 -3.31*
(1.09) (1.01) (1.81) (3.47) (6.25) (6.18) (1.06) (0.98) (1.78)
2.68** -0.16 -0.55 0.03 0.04 1.17 1.76** -0.06 -0.47
(1.06) (1.00) (1.09) (1.45) (2.02) (2.45) (0.79) (0.89) (0.97)
-3.15*** -3.06*** -2.76*** -2.55*** -2.53*** -2.57*** -1.89*** -1.99*** -1.99*** -1.89** -1.95** -1.88** -1.39 -1.51 -1.38 -5.77*** -5.80*** -5.53*** -2.54*** -2.45*** -2.24*** -2.46*** -2.47*** -2.47*** -2.76*** -2.87*** -2.85***
(0.49) (0.50) (0.51) (0.49) (0.49) (0.51) (0.60) (0.61) (0.64) (0.85) (0.87) (0.90) (1.02) (1.04) (1.07) (1.55) (1.54) (1.61) (0.57) (0.58) (0.59) (0.50) (0.50) (0.52) (0.58) (0.58) (0.61)
N 608 608 608 608 608 608 608 608 608 356 356 356 356 356 356 356 356 356 964 964 964 964 964 964 964 964 964
Log likelihood -326.15 -324.56 -322.51 -333.93 -333.75 -333.91 -201.00 -199.95 -200.87 -193.01 -188.46 -193.01 -132.35 -126.61 -132.35 -69.26 -68.01 -69.15 -530.83 -526.82 -528.28 -477.61 -477.59 -477.61 -283.87 -281.72 -283.76
Χ2
77.90 79.28 80.90 23.10 23.29 23.20 8.18 10.12 8.51 26.11 28.45 26.11 13.90 20.23 13.89 9.24 10.71 9.33 97.51 100.61 100.21 27.88 28.02 27.94 9.89 13.72 10.18
Prob > Χ2 0.00 0.00 0.00 0.04 0.04 0.05 0.07 0.06 0.07 0.00 0.00 0.00 0.00 0.00 0.00 0.00 0.00 0.00 0.00 0.00 0.00 0.00 0.00 0.00 0.01 0.01 0.01
Standard errors in parentheses
*p < 0.1, **p < 0.05, ***p < 0.01
TABLE 2: Duration until treatment
NoInt IntA IntB NoInt IntA IntB NoInt IntA IntB NoInt IntA IntB NoInt IntA IntB NoInt IntA IntB NoInt IntA IntB NoInt IntA IntB NoInt IntA IntB
Model Number (1) (2) (3) (4) (5) (6) (7) (8) (9) (10) (11) (12) (13) (14) (15) (16) (17) (18) (19) (20) (21) (22) (23) (24) (25) (26) (27)
0.47 0.49 0.23 -0.39 -0.42 -1.43 -0.06 0.02 1.37 -0.29 0.02 0.97 1.80 1.80 1.92 0.20 0.57 -1.22 0.08 0.17 0.19 0.02 0.08 -1.52 0.28 0.49 1.08
(0.58) (0.62) (1.14) (0.60) (0.68) (1.27) (1.42) (1.45) (13.47) (0.46) (0.48) (1.01) (1.97) (1.19) (32.95) (27.08) (9.25) (111.45) (0.38) (0.40) (0.73) (0.52) (0.57) (1.24) (0.76) (0.73) (1.21)
-0.23 -0.23 -0.29 0.30 0.30 0.10 0.84 0.82 1.37 -0.02 -0.01 0.43 2.43 2.43 2.46 0.03 0.25 -1.16 -0.10 -0.10 -0.06 0.66** 0.66** 0.38 0.64 0.60 0.97*
(0.36) (0.36) (0.43) (0.32) (0.32) (0.39) (1.23) (1.45) (3.50) (0.19) (0.19) (0.38) (4.96) (4.96) (8.34) (30.82) (11.94) (55.06) (0.19) (0.19) (0.28) (0.28) (0.28) (0.35) (0.40) (0.39) (0.55)
0.69** 0.72 0.69** 1.07*** 1.05*** 1.07*** 0.12 0.39 0.08 0.41* 0.95*** 0.42* 1.39 1.39 1.40 0.84 2.14 1.26 0.63*** 0.76*** 0.63*** 1.09*** 1.14*** 1.09*** 0.21 0.72 0.16
(0.34) (0.45) (0.34) (0.26) (0.34) (0.26) (1.50) (4.01) (1.66) (0.22) (0.34) (0.22) (3.04) (4.48) (3.38) (36.00) (10.02) (45.81) (0.20) (0.28) (0.20) (0.24) (0.30) (0.24) (0.53) (0.67) (0.53)
0.30* 0.30* 0.30* 0.33** 0.33** 0.32** 0.20 0.19 0.21 0.02 0.00 0.02 0.13 0.13 0.13 0.88 0.20 0.95 0.19* 0.19* 0.19* 0.24* 0.24* 0.23* 0.47** 0.42* 0.49**
(0.18) (0.18) (0.18) (0.16) (0.16) (0.16) (0.39) (0.39) (0.71) (0.12) (0.11) (0.12) (0.46) (0.47) (0.66) (4.87) (1.76) (12.51) (0.11) (0.11) (0.11) (0.14) (0.14) (0.14) (0.23) (0.24) (0.24)
-0.14 -0.14 -0.15 0.00 0.00 0.02 0.41 0.40 0.37 0.09 0.08 0.09 -0.14 -0.14 -0.14 -0.33 0.19 -0.74 -0.02 -0.03 -0.02 -0.01 -0.01 0.00 0.20 0.26 0.24
(0.29) (0.29) (0.29) (0.24) (0.24) (0.24) (0.50) (0.50) (0.73) (0.17) (0.17) (0.17) (0.47) (0.48) (0.57) (17.22) (8.58) (46.31) (0.16) (0.16) (0.16) (0.21) (0.21) (0.21) (0.39) (0.39) (0.39)
-0.00 -0.00 -0.00 -0.00 -0.00 -0.00 0.04* 0.04* 0.04* -0.00 -0.00 -0.00 0.02 0.02 0.02 0.01 0.02 0.01 0.00 0.00 0.00 0.00 0.00 0.00 0.03** 0.03** 0.03**
(0.01) (0.01) (0.01) (0.01) (0.01) (0.01) (0.02) (0.02) (0.02) (0.01) (0.01) (0.01) (0.02) (0.02) (0.02) (0.96) (0.31) (1.29) (0.01) (0.01) (0.01) (0.01) (0.01) (0.01) (0.01) (0.01) (0.01)
-0.74** -0.74** -0.73** -0.47 -0.47 -0.45 -0.52 -0.57 -0.62 -0.47*** -0.46*** -0.50*** -0.66 -0.66 -0.66 0.19 0.60 0.36 -0.57*** -0.56*** -0.57*** -0.48* -0.49* -0.47* 0.26 0.26 0.25
(0.33) (0.33) (0.33) (0.33) (0.33) (0.33) (3.24) (3.42) (5.41) (0.18) (0.18) (0.18) (0.52) (0.47) (0.59) (14.96) (7.16) (17.70) (0.18) (0.18) (0.18) (0.26) (0.26) (0.26) (0.49) (0.48) (0.49)
-0.09 0.10 -2.35 -2.35** 0.00 -163.86 -0.57 -0.30 -5.71
(1.21) (1.21) (21.76) (1.15) (0.00) (171.30) (0.79) (1.16) (4.49)
0.30 1.32 -2.11 -1.46 -0.13 2.60 -0.14 1.86 -1.16
(1.23) (1.41) (13.46) (1.05) (33.00) (144.87) (0.78) (1.34) (1.34)
0.36 0.35 0.41 -0.24 -0.23 -0.10 -3.08* -3.11 -3.50 0.52 0.46 0.15 -3.05 -3.05 -3.08 -1.97 -1.74 -1.09 0.12 0.09 0.09 -0.63 -0.66 -0.42 -2.95*** -2.94*** -3.19***
(0.76) (0.76) (0.78) (0.60) (0.61) (0.62) (1.73) (1.95) (3.78) (0.42) (0.42) (0.50) (4.96) (4.99) (8.26) (55.07) (20.19) (87.98) (0.40) (0.40) (0.43) (0.48) (0.49) (0.50) (0.91) (0.90) (0.96)
N 192 192 192 159 159 159 65 65 65 206 206 206 57 57 57 23 23 23 398 398 398 216 216 216 88 88 88
Log likelihood -364.85 -364.85 -364.82 -297.05 -297.04 -296.59 -83.91 -83.80 -83.26 -336.79 -334.68 -335.82 -87.09 -87.09 -87.09 -34.93 -31.62 -33.85 -721.20 -720.94 -721.18 -390.56 -390.53 -389.54 -124.70 -123.83 -124.33
Χ 219.67 19.71 19.75 36.71 36.70 37.43 5.37 5.19 3.66 12.46 16.86 14.44 4.44 7.18 4.52 0.08 66.15 0.03 31.39 31.95 31.41 43.21 43.44 44.47 16.09 17.63 16.71
Prob > Χ 20.04 0.04 0.03 0.51 0.51 0.43 0.17 0.20 0.19 0.00 0.00 0.00 0.46 0.46 0.41 0.33 0.47 0.35
Pseudo R2
0.06 0.07 0.07 0.10 0.10 0.10 0.15 0.23 0.18
Standard errors in parentheses
*p < 0.1, **p < 0.05, ***p < 0.01
Informal CareInformal Care Public Care Private Care Informal Care Public Care Private Care
PHONxMARG
SUPPxMARG
Constant
Marginalisation Index
Dependent Variable
Chiang Rai Salavan Pooled Sample
Public Care Private Care
Health-related social support
Health-related phone use
Self-rated severity
Female
Age
Illness episode of child
Age
Illness episode of child
PHONxMARG
SUPPxMARG
Constant
Dependent Variable
Marginalisation Index
Health-related social support
Health-related phone use
Self-rated severity
Chiang Rai Salavan Pooled Sample
Female
Informal Care Public Care Private Care Informal CarePrivate CarePublic Care Private Care Informal Care Public Care
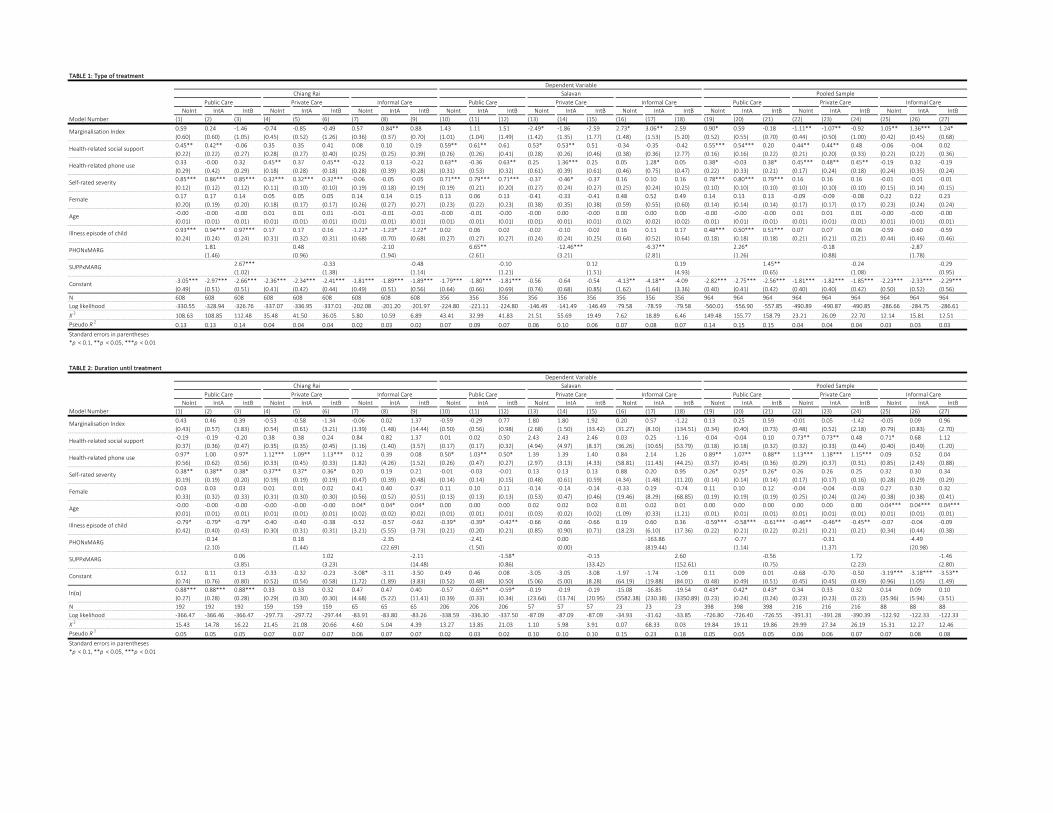
TABLE 1: Type of treatment
NoInt IntA IntB NoInt IntA IntB NoInt IntA IntB NoInt IntA IntB NoInt IntA IntB NoInt IntA IntB NoInt IntA IntB NoInt IntA IntB NoInt IntA IntB
Model Number (1) (2) (3) (4) (5) (6) (7) (8) (9) (10) (11) (12) (13) (14) (15) (16) (17) (18) (19) (20) (21) (22) (23) (24) (25) (26) (27)
0.59 0.24 -1.46 -0.74 -0.85 -0.49 0.57 0.84** 0.88 1.43 1.11 1.51 -2.49* -1.86 -2.59 2.73* 3.06** 2.59 0.90* 0.59 -0.18 -1.11** -1.07** -0.92 1.05** 1.36*** 1.24*
(0.60) (0.60) (1.05) (0.45) (0.52) (1.26) (0.36) (0.37) (0.70) (1.01) (1.04) (1.49) (1.42) (1.35) (1.77) (1.48) (1.53) (5.20) (0.52) (0.55) (0.70) (0.44) (0.50) (1.00) (0.42) (0.45) (0.68)
0.45** 0.42** -0.06 0.35 0.35 0.41 0.08 0.10 0.19 0.59** 0.61** 0.61 0.53* 0.53** 0.51 -0.34 -0.35 -0.42 0.55*** 0.54*** 0.20 0.44** 0.44** 0.48 -0.06 -0.04 0.02
(0.22) (0.22) (0.27) (0.28) (0.27) (0.40) (0.25) (0.25) (0.39) (0.26) (0.26) (0.41) (0.28) (0.26) (0.46) (0.38) (0.36) (2.77) (0.16) (0.16) (0.22) (0.21) (0.20) (0.33) (0.22) (0.22) (0.36)
0.33 -0.00 0.32 0.45** 0.37 0.45** -0.22 0.13 -0.22 0.63** -0.36 0.63** 0.25 1.36*** 0.25 0.05 1.28* 0.05 0.38* -0.03 0.38* 0.45*** 0.48** 0.45** -0.19 0.32 -0.19
(0.29) (0.42) (0.29) (0.18) (0.28) (0.18) (0.28) (0.39) (0.28) (0.31) (0.53) (0.32) (0.61) (0.39) (0.61) (0.46) (0.75) (0.47) (0.22) (0.33) (0.21) (0.17) (0.24) (0.18) (0.24) (0.35) (0.24)
0.85*** 0.86*** 0.85*** 0.32*** 0.32*** 0.32*** -0.06 -0.05 -0.05 0.71*** 0.79*** 0.71*** -0.37 -0.46* -0.37 0.16 0.10 0.16 0.78*** 0.80*** 0.79*** 0.16 0.16 0.16 -0.01 -0.01 -0.01
(0.12) (0.12) (0.12) (0.11) (0.10) (0.10) (0.19) (0.18) (0.19) (0.19) (0.21) (0.20) (0.27) (0.24) (0.27) (0.25) (0.24) (0.25) (0.10) (0.10) (0.10) (0.10) (0.10) (0.10) (0.15) (0.14) (0.15)
0.17 0.17 0.14 0.05 0.05 0.05 0.14 0.14 0.15 0.13 0.06 0.13 -0.41 -0.33 -0.41 0.48 0.52 0.49 0.14 0.13 0.13 -0.09 -0.09 -0.08 0.22 0.22 0.23
(0.20) (0.19) (0.20) (0.18) (0.17) (0.17) (0.26) (0.27) (0.27) (0.23) (0.22) (0.23) (0.38) (0.35) (0.38) (0.59) (0.55) (0.60) (0.14) (0.14) (0.14) (0.17) (0.17) (0.17) (0.23) (0.24) (0.24)
-0.00 -0.00 -0.00 0.01 0.01 0.01 -0.01 -0.01 -0.01 -0.00 -0.01 -0.00 -0.00 0.00 -0.00 0.00 0.00 0.00 -0.00 -0.00 -0.00 0.01 0.01 0.01 -0.00 -0.00 -0.00
(0.01) (0.01) (0.01) (0.01) (0.01) (0.01) (0.01) (0.01) (0.01) (0.01) (0.01) (0.01) (0.01) (0.01) (0.01) (0.02) (0.02) (0.02) (0.01) (0.01) (0.01) (0.01) (0.01) (0.01) (0.01) (0.01) (0.01)
0.93*** 0.94*** 0.97*** 0.17 0.17 0.16 -1.22* -1.23* -1.22* 0.02 0.06 0.02 -0.02 -0.10 -0.02 0.16 0.11 0.17 0.48*** 0.50*** 0.51*** 0.07 0.07 0.06 -0.59 -0.60 -0.59
(0.24) (0.24) (0.24) (0.31) (0.32) (0.31) (0.68) (0.70) (0.68) (0.27) (0.27) (0.27) (0.24) (0.24) (0.25) (0.64) (0.52) (0.64) (0.18) (0.18) (0.18) (0.21) (0.21) (0.21) (0.44) (0.46) (0.46)
1.81 0.48 -2.10 6.65** -12.46*** -6.37** 2.26* -0.18 -2.87
(1.46) (0.96) (1.94) (2.61) (3.21) (2.81) (1.26) (0.88) (1.78)
2.67*** -0.33 -0.48 -0.10 0.12 0.19 1.45** -0.24 -0.29
(1.02) (1.38) (1.14) (1.21) (1.51) (4.93) (0.65) (1.08) (0.95)
-3.05*** -2.97*** -2.66*** -2.36*** -2.34*** -2.41*** -1.81*** -1.89*** -1.89*** -1.79*** -1.80*** -1.81*** -0.56 -0.64 -0.54 -4.13** -4.18** -4.09 -2.82*** -2.75*** -2.56*** -1.81*** -1.82*** -1.85*** -2.23*** -2.33*** -2.29***
(0.49) (0.51) (0.51) (0.41) (0.42) (0.44) (0.49) (0.51) (0.56) (0.64) (0.66) (0.69) (0.74) (0.68) (0.85) (1.62) (1.64) (3.36) (0.40) (0.41) (0.42) (0.40) (0.40) (0.42) (0.50) (0.52) (0.56)
N 608 608 608 608 608 608 608 608 608 356 356 356 356 356 356 356 356 356 964 964 964 964 964 964 964 964 964
Log likelihood -330.55 -328.94 -326.76 -337.07 -336.95 -337.01 -202.08 -201.20 -201.97 -224.80 -221.11 -224.80 -146.49 -141.49 -146.49 -79.58 -78.59 -79.58 -560.01 -556.90 -557.85 -490.89 -490.87 -490.85 -286.66 -284.75 -286.61
Χ2
108.63 108.85 112.48 35.48 41.50 36.05 5.80 10.59 6.89 43.41 32.99 41.83 21.51 55.69 19.49 7.62 18.89 6.46 149.48 155.77 158.79 23.21 26.09 22.70 12.14 15.81 12.51
Pseudo R2
0.13 0.13 0.14 0.04 0.04 0.04 0.02 0.03 0.02 0.07 0.09 0.07 0.06 0.10 0.06 0.07 0.08 0.07 0.14 0.15 0.15 0.04 0.04 0.04 0.03 0.03 0.03
Standard errors in parentheses
*p < 0.1, **p < 0.05, ***p < 0.01
TABLE 2: Duration until treatment
NoInt IntA IntB NoInt IntA IntB NoInt IntA IntB NoInt IntA IntB NoInt IntA IntB NoInt IntA IntB NoInt IntA IntB NoInt IntA IntB NoInt IntA IntB
Model Number (1) (2) (3) (4) (5) (6) (7) (8) (9) (10) (11) (12) (13) (14) (15) (16) (17) (18) (19) (20) (21) (22) (23) (24) (25) (26) (27)
0.43 0.46 0.39 -0.53 -0.58 -1.34 -0.06 0.02 1.37 -0.59 -0.29 0.77 1.80 1.80 1.92 0.20 0.57 -1.22 0.13 0.25 0.59 -0.01 0.05 -1.42 -0.05 0.09 0.96
(0.43) (0.57) (3.83) (0.54) (0.61) (3.21) (1.39) (1.48) (14.44) (0.50) (0.56) (0.98) (2.68) (1.50) (33.42) (31.27) (8.10) (134.51) (0.34) (0.40) (0.73) (0.48) (0.52) (2.18) (0.79) (0.83) (2.70)
-0.19 -0.19 -0.20 0.38 0.38 0.24 0.84 0.82 1.37 0.01 0.02 0.50 2.43 2.43 2.46 0.03 0.25 -1.16 -0.04 -0.04 0.10 0.73** 0.73** 0.48 0.71* 0.68 1.12
(0.37) (0.36) (0.47) (0.35) (0.35) (0.45) (1.16) (1.40) (3.57) (0.17) (0.17) (0.32) (4.94) (4.97) (8.37) (36.26) (10.65) (53.79) (0.18) (0.18) (0.32) (0.32) (0.33) (0.44) (0.40) (0.49) (1.20)
0.97* 1.00 0.97* 1.12*** 1.09** 1.13*** 0.12 0.39 0.08 0.50* 1.03** 0.50* 1.39 1.39 1.40 0.84 2.14 1.26 0.89** 1.07** 0.88** 1.13*** 1.18*** 1.15*** 0.09 0.52 0.04
(0.56) (0.62) (0.56) (0.33) (0.45) (0.33) (1.82) (4.26) (1.52) (0.26) (0.47) (0.27) (2.97) (3.13) (4.33) (58.81) (11.43) (44.25) (0.37) (0.45) (0.36) (0.29) (0.37) (0.31) (0.85) (2.43) (0.88)
0.38** 0.38** 0.38* 0.37** 0.37* 0.36* 0.20 0.19 0.21 -0.01 -0.03 -0.01 0.13 0.13 0.13 0.88 0.20 0.95 0.26* 0.25* 0.26* 0.26 0.26 0.25 0.32 0.30 0.34
(0.19) (0.19) (0.20) (0.19) (0.19) (0.19) (0.47) (0.39) (0.48) (0.14) (0.14) (0.15) (0.48) (0.61) (0.59) (4.34) (1.48) (11.20) (0.14) (0.14) (0.14) (0.17) (0.17) (0.16) (0.28) (0.29) (0.29)
0.03 0.03 0.03 0.01 0.01 0.02 0.41 0.40 0.37 0.11 0.10 0.11 -0.14 -0.14 -0.14 -0.33 0.19 -0.74 0.11 0.10 0.12 -0.04 -0.04 -0.03 0.27 0.30 0.32
(0.33) (0.32) (0.33) (0.31) (0.30) (0.30) (0.56) (0.52) (0.51) (0.13) (0.13) (0.13) (0.53) (0.47) (0.46) (19.46) (8.29) (68.85) (0.19) (0.19) (0.19) (0.25) (0.24) (0.24) (0.38) (0.38) (0.41)
-0.00 -0.00 -0.00 -0.00 -0.00 -0.00 0.04* 0.04* 0.04* 0.00 0.00 0.00 0.02 0.02 0.02 0.01 0.02 0.01 0.00 0.00 0.00 0.00 0.00 0.00 0.04*** 0.04*** 0.04***
(0.01) (0.01) (0.01) (0.01) (0.01) (0.01) (0.02) (0.02) (0.02) (0.01) (0.01) (0.01) (0.03) (0.02) (0.02) (1.09) (0.33) (1.21) (0.01) (0.01) (0.01) (0.01) (0.01) (0.01) (0.01) (0.01) (0.01)
-0.79* -0.79* -0.79* -0.40 -0.40 -0.38 -0.52 -0.57 -0.62 -0.39* -0.39* -0.42** -0.66 -0.66 -0.66 0.19 0.60 0.36 -0.59*** -0.58*** -0.61*** -0.46** -0.46** -0.45** -0.07 -0.04 -0.09
(0.42) (0.40) (0.43) (0.30) (0.31) (0.31) (3.21) (5.55) (3.73) (0.21) (0.20) (0.21) (0.85) (0.90) (0.71) (18.23) (6.10) (17.36) (0.22) (0.21) (0.22) (0.21) (0.21) (0.21) (0.34) (0.44) (0.38)
-0.14 0.18 -2.35 -2.41 0.00 -163.86 -0.77 -0.31 -4.49
(2.10) (1.44) (22.69) (1.50) (0.00) (819.44) (1.14) (1.37) (20.98)
0.06 1.02 -2.11 -1.58* -0.13 2.60 -0.56 1.72 -1.46
(3.85) (3.23) (14.48) (0.86) (33.42) (152.61) (0.75) (2.23) (2.80)
0.12 0.11 0.13 -0.33 -0.32 -0.23 -3.08* -3.11 -3.50 0.49 0.46 0.08 -3.05 -3.05 -3.08 -1.97 -1.74 -1.09 0.11 0.09 0.01 -0.68 -0.70 -0.50 -3.19*** -3.18*** -3.53**
(0.74) (0.76) (0.80) (0.52) (0.54) (0.58) (1.72) (1.89) (3.83) (0.52) (0.48) (0.50) (5.06) (5.00) (8.28) (64.19) (19.88) (84.01) (0.48) (0.49) (0.51) (0.45) (0.45) (0.49) (0.96) (1.05) (1.49)
0.88*** 0.88*** 0.88*** 0.33 0.33 0.32 0.47 0.47 0.40 -0.57 -0.65** -0.59* -0.19 -0.19 -0.19 -15.08 -16.85 -19.54 0.43* 0.42* 0.43* 0.34 0.33 0.32 0.14 0.09 0.10
(0.27) (0.28) (0.28) (0.29) (0.30) (0.30) (4.68) (5.22) (11.41) (0.39) (0.33) (0.34) (23.64) (13.74) (20.95) (5582.38) (230.38) (3350.89) (0.23) (0.24) (0.24) (0.23) (0.23) (0.23) (35.96) (5.94) (3.51)
N 192 192 192 159 159 159 65 65 65 206 206 206 57 57 57 23 23 23 398 398 398 216 216 216 88 88 88
Log likelihood -366.47 -366.46 -366.47 -297.73 -297.72 -297.44 -83.91 -83.80 -83.26 -338.59 -336.30 -337.50 -87.09 -87.09 -87.09 -34.93 -31.62 -33.85 -726.80 -726.40 -726.55 -391.31 -391.28 -390.39 -122.92 -122.33 -122.33
Χ2
15.43 14.78 16.22 21.45 21.08 20.66 4.60 5.04 4.39 13.27 13.85 21.03 1.10 5.98 3.91 0.07 68.33 0.03 19.84 19.11 19.86 29.99 27.34 26.19 15.31 12.27 12.46
Pseudo R 20.05 0.05 0.05 0.07 0.07 0.07 0.06 0.07 0.07 0.02 0.03 0.02 0.10 0.10 0.10 0.15 0.23 0.18 0.05 0.05 0.05 0.06 0.06 0.07 0.07 0.08 0.08
Standard errors in parentheses
*p < 0.1, **p < 0.05, ***p < 0.01
Marginalisation Index
Health-related social support
Private Care Informal Care
Marginalisation Index
Health-related social support
Health-related phone use
Self-rated severity
Female
Age
Illness episode of child
PHONxMARG
SUPPxMARG
Constant
Private Care Informal Care
Dependent Variable
Chiang Rai Salavan Pooled Sample
Public Care Private Care Informal Care Public Care Private Care Informal Care
PHONxMARG
SUPPxMARG
Constant
ln(α)
Public Care
Dependent Variable
Chiang Rai Salavan Pooled Sample
Public Care Private Care Informal Care Public Care Private Care Informal Care Public Care
Health-related phone use
Self-rated severity
Female
Age
Illness episode of child