yeasts from greenhouse grapes show less phenotypic and ... · june 2016 volume 2 jemi+ 15 yeasts...
TRANSCRIPT

June 2016 Volume 2 JEMI+ 15
Yeasts from Greenhouse Grapes Show Less Phenotypic and Genetic Diversity than Yeasts from Vineyard Grapes when Isolated from Grape Crush Cultured in Liquid Media
Brittany Goldhawke, Manjot Kahlon, Jeremy Lotto, and Christoph M. Deeg
Department of Microbiology and Immunology, University of British Columbia
SUPPLEMENTAL MATERIAL
S. FIG. 1A. Spot assay plates of greenhouse isolates 1-5 (top to bottom). 3µl of 10-1, 10-2, 10-3, 10-4 dilutions (right to left) spotted onto YPD agar, 30% Dextrose-YPD agar, 40% Dextrose agar (left to right) in duplicate, grown at 30°C for 24 hours. Growth at 10-1, 10-2, 10-3, and 10-4 is denoted “1”, “2”, “3”, and “4” respectively. No growth denoted as “0” (S.TABLE.1, FIG.2).
S. FIG. 1B. Spot assay plates of greenhouse isolates 6-10 (top to bottom). 3µl of 10-1, 10-2, 10-3, 10-4 dilutions (right to left) spotted onto YPD agar, 30% Dextrose-YPD agar, 40% Dextrose agar (left to right) in duplicate, grown at 30°C for 24 hours. Growth at 10-1, 10-2, 10-3, and 10-4 is denoted “1”, “2”, “3”, and “4” respectively. No growth denoted as “0” (S.TABLE.1, FIG.2).
The Journal of Experimental
Microbiology & Immunology+
Vol 2:15-25

June 2016 Volume 2 JEMI+ 16
S. FIG. 1C. Spot assay plates of greenhouse isolates 11-15 (top to bottom). 3µl of 10-1, 10-2, 10-3, 10-4 dilutions (right to left) spotted onto YPD agar, 30% Dextrose-YPD agar, 40% Dextrose agar (left to right) in duplicate, grown at 30°C for 24 hours. Growth at 10-1, 10-2, 10-3, and 10-4 is denoted “1”, “2”, “3”, and “4” respectively. No growth denoted as “0” (S.TABLE.1, FIG.2).
S. FIG. 1D. Spot assay plates of greenhouse isolates 16-20 (top to bottom). 3µl of 10-1, 10-2, 10-3, 10-4 dilutions (right to left) spotted onto YPD agar, 30% Dextrose-YPD agar, 40% Dextrose agar (left to right) in duplicate, grown at 30°C for 24 hours. Growth at 10-1, 10-2, 10-3, and 10-4 is denoted “1”, “2”, “3”, and “4” respectively. No growth denoted as “0” (S.TABLE.1, FIG.2).
S. FIG. 2A. Spot assay plates of vineyard isolates 1-5 (top to bottom). 3µl of 10-1, 10-2, 10-3, 10-4 dilutions (right to left) spotted onto YPD agar, 30% Dextrose-YPD agar, 40% Dextrose agar (left to right) in duplicate, grown at 30°C for 24 hours. Growth at 10-1, 10-2, 10-3, and 10-4 is denoted “1”, “2”, “3”, and “4” respectively. No growth denoted as “0” (S.TABLE.2, FIG.2).
S. FIG. 2B. Spot assay plates of vineyard isolates 6-10 (top to bottom). 3µl of 10-1, 10-2, 10-3, 10-4 dilutions (right to left) spotted onto YPD agar, 30% Dextrose-YPD agar, 40% Dextrose agar (left to right) in duplicate, grown at 30°C for 24 hours. Growth at 10-1, 10-2, 10-3, and 10-4 is denoted “1”, “2”, “3”, and “4” respectively. No growth denoted as “0” (S.TABLE.2, FIG.2).

June 2016 Volume 2 JEMI+ 17
S. FIG. 2C. Spot assay plates of vineyard isolates 11-15 (top to bottom). 3µl of 10-1, 10-2, 10-3, 10-4 dilutions (right to left) spotted onto YPD agar, 30% Dextrose-YPD agar, 40% Dextrose agar (left to right) in duplicate, grown at 30°C for 24 hours. Growth at 10-1, 10-2, 10-3, and 10-4 is denoted “1”, “2”, “3”, and “4” respectively. No growth denoted as “0” (S.TABLE.2, FIG.2).
S. FIG. 2D. Spot assay plates of vineyard isolates 16-20 (top to bottom). 3µl of 10-1, 10-2, 10-3, 10-4 dilutions (right to left) spotted onto YPD agar, 30% Dextrose-YPD agar, 40% Dextrose agar (left to right) in duplicate, grown at 30°C for 24 hours. Growth at 10-1, 10-2, 10-3, and 10-4 is denoted “1”, “2, “3”, and “4” respectively. No growth denoted as “0” (S.TABLE.2, FIG.2)
S. FIG. 3A. Spot assay plates of greenhouse isolates 1-5 (top to bottom). 3µl of 10-1, 10-2, 10-3, 10-4 dilutions (right to left) spotted onto YPD agar, 8% ethanol-YPD agar, 12% ethanol-YPD agar (left to right) in duplicate, grown at 30°C for 24 hours. Growth at 10-1, 10-2, 10-3, and 10-4 is denoted “1”, “2”, “3”, and “4” respectively. No growth denoted as “0” (S.TABLE.1, FIG.2)
S. FIG. 3B. Spot assay plates of greenhouse isolates 6-10 (top to bottom). 3µl of 10-1, 10-2, 10-3, 10-4 dilutions (right to left) spotted onto YPD agar, 8% ethanol-YPD agar, 12% ethanol-YPD agar (left to right) in duplicate, grown at 30°C for 24 hours. Growth at 10-1, 10-2, 10-3, 10-4 is denoted “1”, “2”, “3”, “4” respectively .No growth denoted as “0” (S.TABLE.1, FIG.2)

June 2016 Volume 2 JEMI+ 18
S. FIG. 3C. Spot assay plates of greenhouse isolates 11-15 (top to bottom). 3µl of 10-1, 10-2, 10-3, 10-4 dilutions (right to left) spotted onto YPD agar, 8% ethanol-YPD agar, 12% ethanol-YPD agar (left to right) in duplicate, grown at 30°C for 24 hours. Growth at 10-1, 10-2, 10-3, and 10-4 is denoted “1”, “2”, “3”, and “4” respectively. No growth denoted as “0” (S.TABLE.1, FIG.2)
S. FIG. 3D. Spot assay plates of greenhouse isolates 16-20 (top to bottom). 3µl of 10-1, 10-2, 10-3, 10-4 dilutions (right to left) spotted onto YPD agar, 8% ethanol-YPD agar, 12% ethanol-YPD agar (left to right) in duplicate, grown at 30°C for 24 hours. Growth at 10-1, 10-2, 10-3, and 10-4 is denoted “1”, “2”, “3”, “4” respectively No growth denoted as “0” (S.TABLE.1, FIG.2)
S. FIG. 4A. Spot assay plates of vineyard isolates 1-5 (top to bottom). 3µl of 10-1, 10-2, 10-3, 10-4 dilutions (right to left) spotted onto YPD agar, 8% ethanol-YPD agar, 12% ethanol-YPD agar (left to right) in duplicate, grown at 30°C for 24 hours. Growth at 10-1, 10-2, 10-3, and 10-4 is denoted “1”, “2”, “3”, and “4” respectively. No growth denoted as “0” (S.TABLE.2, FIG.2)
S. FIG. 4B. Spot assay plates of vineyard isolates 6-10 (top to bottom). 3µl of 10-1, 10-2, 10-3, 10-4 dilutions (right to left) spotted onto YPD agar, 8% ethanol-YPD agar, 12% ethanol-YPD agar (left to right) in duplicate, grown at 30°C for 24 hours. Growth at 10-1, 10-2, 10-3, and 10-4 is denoted “1”, “2”, “3”, and “4” respectively. No growth denoted as “0” (S.TABLE2, FIG.2)

June 2016 Volume 2 JEMI+ 19
S. FIG. 4C. Spot assay plates of vineyard isolates 11-15 (top to bottom). 3µl of 10-1, 10-2, 10-3, 10-4 dilutions (right to left) spotted onto YPD agar, 8% ethanol-YPD agar, 12% ethanol-YPD agar (left to right) in duplicate, grown at 30°C for 24 hours. Growth at 10-1, 10-2, 10-3, and 10-4 is denoted “1”, “2”, “3”, and “4” respectively. No growth denoted as “0” (S.TABLE.2, FIG.2)
S. FIG. 4D. Spot assay plates of vineyard isolates 16-20 (top to bottom). 3µl of 10-1, 10-2, 10-3, 10-4 dilutions (right to left) spotted onto YPD agar, 8% ethanol-YPD agar, 12% ethanol-YPD agar (left to right) in duplicate, grown at 30°C for 24 hours. Growth at 10-1, 10-2, 10-3, and 10-4 is denoted “1”, “2”, “3”, and “4” respectively. No growth denoted as “0” (S.TABLE.2, FIG.2)

June 2016 Volume 2 JEMI+ 20
S.TABLE 1 Growth response of greenhouse isolates in dextrose and ethanol YPD media
8% * ethanol
12% * ethanol
30%* glucose
40%* glucose
G1 0 0 4 4
G2 0 0 4 4
G3 0 0 4 4
G4 0 0 4 4
G5 0 0 4 4
G6 0 0 4 4
G7 0 0 4 4
G8 0 0 4 4
G9 0 0 4 4
G10 0 0 4 4
G11 0 0 4 3
G12 0 0 4 3
G13 0 0 4 3
G14 0 0 4 3
G15 0 0 3 3
G16 0 0 4 3
G17 0 0 4 3
G18 0 0 4 3
G19 0 0 4 3
G20 0 0 3 2
*8%, 12%, 30%, 40% was the final concentration of ethanol or dextrose
in YPD media
Growth at 10-1, 10-2, 10-3, and 10-4 is denoted “1”, “2”, “3”, and “4” respectively.
No growth denoted as “0” (S.FIG.1-4, FIG.2)

June 2016 Volume 2 JEMI+ 21
*8%, 12%, 30%, 40% was the final concentration of ethanol or dextrose in YPD media Growth at 10-1, 10-2, 10-3, and 10-4 is denoted “1”, “2”, “3”, and “4” respectively.
No growth denoted as “0” (S.FIG.1-4, FIG.2)
S.TABLE 2 Growth response of vineyard isolates in dextrose and ethanol
8% * ethanol
12%* ethanol
30%* dextrose
40%* dextrose
V1 1 0 4 3
V2 2 0 4 4
V3 1 0 4 3
V4 2 0 4 3
V5 1 0 4 3
V6 0 0 3 3
V7 0 0 4 3
V8 0 0 4 3
V9 0 0 4 4
V10 0 0 4 4
V11 1 0 4 3
V12 1 0 4 3
V13 0 0 4 3
V14 1 0 4 3
V15 0 0 4 3
V16 0 0 4 3
V17 0 0 4 4
V18 0 0 4 3
V19 0 0 4 3
V20 0 0 4 4
June 2016 Volume 2 JEMI+ 22
A.

June 2016 Volume 2 JEMI+ 23
B.

June 2016 Volume 2 JEMI+ 24
C.
D.
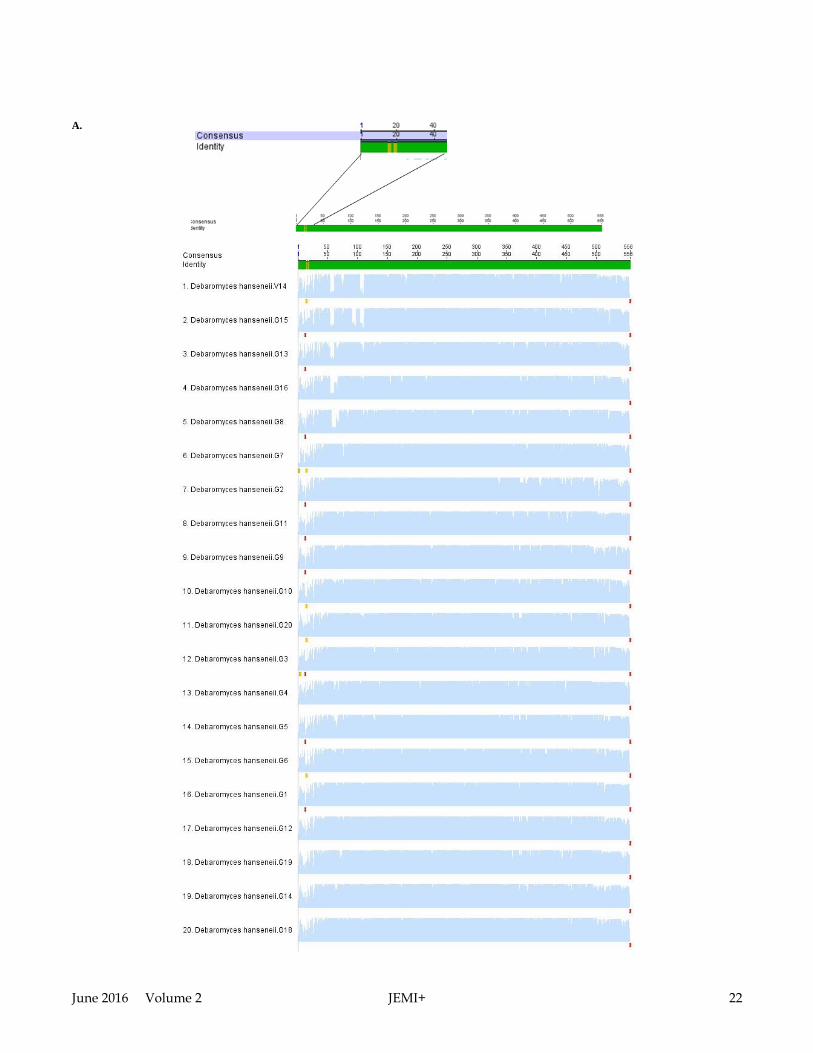
S.FIG 5. Geneious 9.0.4 trimmed chromatograms and MUSCLE multiple alignment of sequences. Mean pairwise identity over all pairs in the
column is provided. Green indicates 100% identity, green-brown indicates 30%-100%, and red indicates below 30% identity (A) D. hanseneii isolates G1-
G20, and V14. Length: 556, Sequences: 20, Identical Sites: 552 (99.3%), Pairwise % Identity: 99.9%. (B) H.uvarum isolates V1, 3, 5-8, 10, 13, 15-17, 19-
20. Length: 506, Sequences: 15, Identical Sites: 494 (97.6%), Pairwise % Identity: 99.1%. (C) Metschnikowia sp. isolates V9, 11, 18. Length: 465,
Sequences: 3, Identical Sites: 465 (100.0%), Pairwise % Identity: 100.0%. (D) M.fructicola isolates V2, V4. Length: 450, Sequences: 2, Identical Sites: 449
(99.8%), Pairwise % Identity: 99.8%.

June 2016 Volume 2 JEMI+ 25
S.FIG 6. Geneious 9.0.5 trimmed chromatograms and MUSCLE multiple alignment of 5 sequences chosen with a high HQ%, used with RAxML to
construct the phylogenetic tree in FIG.4. Mean pairwise identity over all pairs in the column is provided. Green indicates 100% identity, green-brown
indicates 30%-100%, and red indicates below 30%. D. hanseneii isolate G14, H.uvarum isolates V10. Metschnikowia isolate V11, M.fructicola isolate V4.
Length: 578, Sequences: 5, Identical Sites: 328 (58.2%), Pairwise % Identity: 71.5%