year-end report 2016 - fortnox · fortnox year-end report 2016 fortnox ab ... sales and order...
TRANSCRIPT
Fortnox AB (publ) Corporate Identity Number: 556469-6291Fortnox Year-End Report 2016 1
Year-End Report 2016 2016
Summary of the Fortnox Group for the full year 2016 (compared with the corresponding period during the previous
year)
» Net sales for the Group increased by 46.0 percent to SEK 189.3 million (129.7).
» Operating profit amounted to SEK 41.9 million (24.5), corresponding to an operating margin of 22.1 percent (18.9).
» The Parent Company reported an operating margin of 24.8 percent (23.2). The subsidiary Nox Finans reported a break-even financial performance in 2016
» Operating profit includes non-recurring expenses of SEK 3.2 million related directly to Visma's bid. Excluding these non-recurring ex-penses, the operating margin for the Group amounts to 23.8 percent (18.9) and for the Parent Company to 26.7 percent (23.8)
» Profit after tax was SEK 32.6 million (19.0). » Earnings per share were SEK 0.56 (0.33). » The Board of Directors proposes that the dividend be increased to
SEK 0.20 (0.16).
Summary of the Fortnox Group for the period October-Decem-ber 2016 (compared with the corresponding period during the previous year)
» Net sales for the Group increased by 37.7 percent to SEK 53.6 million (38.9).
» Operating profit amounted to SEK 12.5 million (9.1), corresponding to an operating margin of 23.4 percent (23.5). The Parent Company's operating margin totalled 26.3 percent (28.3).
» Profit after tax was SEK 10.0 million (7.0). » Earnings per share were SEK 0.17 (0.12). » Net sales and operating profit include royalty payments received
from Briox AB amounting to SEK 1.0 million (3.0). Excluding the roy-alty payments from Briox, net sales in the Group increased by 46.4 percent (37.1) ans the operating margin rose to 21.9 percent (17.1).
2 Fortnox AB (publ) Corporate Identity Number: 556469-6291 Fortnox Year-End Report 2016
With 155,000 customers, Fortnox is Sweden's leading supplier of online ERP systems for small companies, associations, schools and ac-counting firms. Fortnox offers a comprehensive range of internet-based programmes providing solutions for book-keeping, invoicing, sales support, time reporting and payroll administration, among other things. Our customers are able to access their programmes and information from any computer with an internet connection. Multiple users can be logged in simultaneously and can collaborate and share information. Customers no longer need to worry about installation, updating and back-up. The use of the programmes is attained through a licence for which the customer pays a monthly fee per user and programme module. Fortnox, founded in 2001, has 169 employees in the Group and is based in Växjö. The share is listed for trade on the NGM Nordic MTF exchange. Please visit www.fortnox.se for further information.

Fortnox AB (publ) Corporate Identity Number: 556469-6291Fortnox Year-End Report 2016 3
As new CEO of Fortnox, I have the pleasure of beginning by presenting the Company's best ever financial results.
The uptake of new customers in 2016 remained very positive. We gained 40,000 new customers during the year, a new record. Over-all, more than 155,000 customers now manage their book-keeping, invoicing and other administrative affairs in Fortnox's cloud-based pro-grammes. We thereby further strengthened our position as the leading supplier of online ERP systems for small companies and organisations.
A crucial factor in our success is our unique network of office partners. Today, Fortnox has partnership agreements in place with all of the large accountancy and auditing firms in Sweden. 2016 saw the addition of our partnership with E&Y, while our collaboration with LRF Konsult was also enhanced. As of now, more than 14,400 accountancy consult-ants are affiliated and work continuously with our programmes. This represents an extremely significant channel for recruiting even greater numbers of new customers.
In total, sales increased to just over SEK 189 million in 2016. This is a 100% rise over a mere two years, a fantastic achievement. I have previously worked in growth companies in IT and telecommunications and know what it takes to stay at the top.
During the fourth quarter, sales increased by over 46 percent, adjusted for the royalty payments received from Briox AB (formerly FINT AB) in December 2015 and December 2016. The comparable growth for the fourth quarter of 2015 was 37 percent.
Adjusted for the income from Briox, operating profit for the quarter improved by close to 90 percent. The subsidiary Nox Finans also expe-rienced positive development. Even though the operations remain in the start-up phase, the company broke even in 2016.
Fortnox therefore achieved the Group's financial targets by a good
margin, those being an average annual growth of a minimum 25 percent and an operating margin of a minimum 20 percent.
2016 was an eventful year in other respects too. At the Annual General Meeting in June, a largely entirely new Board of Directors was appoint-ed. I, myself, am new to the role of CEO, having begun in mid-Novem-ber. In the near future, Joachim Lindow is due to to assume the role of CEO for our subsidiary Nox Finans, which offers the market's most in-telligent financing solutions for small companies. Joachim Lindow has extensive experience of the banking and finance sector, most recently as Country Manager for Sweden at Ikano Bank.
With many new faces in management boasting years of experience of digitalisation and financial operations, a record-breaking order book and stable finances, we are well equipped to face any coming challenges.
Growth retains its position as our highest priority. We will grow through both recruitment and new customers, as well as via additional sales to existing customers. There are still many companies who have not yet taken the step to manage their book-keeping in the cloud. For others, a lot of work is still required before their administrative flow is fully digitalised.
Fortnox works according to its motto "Small companies' best friend". We will accordingly continue to invest time and resources into improv-ing our existing services while simultaneously concentrating on the development of new services and new functionality.
Lastly, I would like to express my gratitude to our customers, partners, employees and shareholders for their contributions to our successes in 2016, and to welcome you to a new, exciting year.
New record-breaking year for FortnoxComments from the Chief Executive Officer
4 Fortnox AB (publ) Corporate Identity Number: 556469-6291 Fortnox Year-End Report 2016
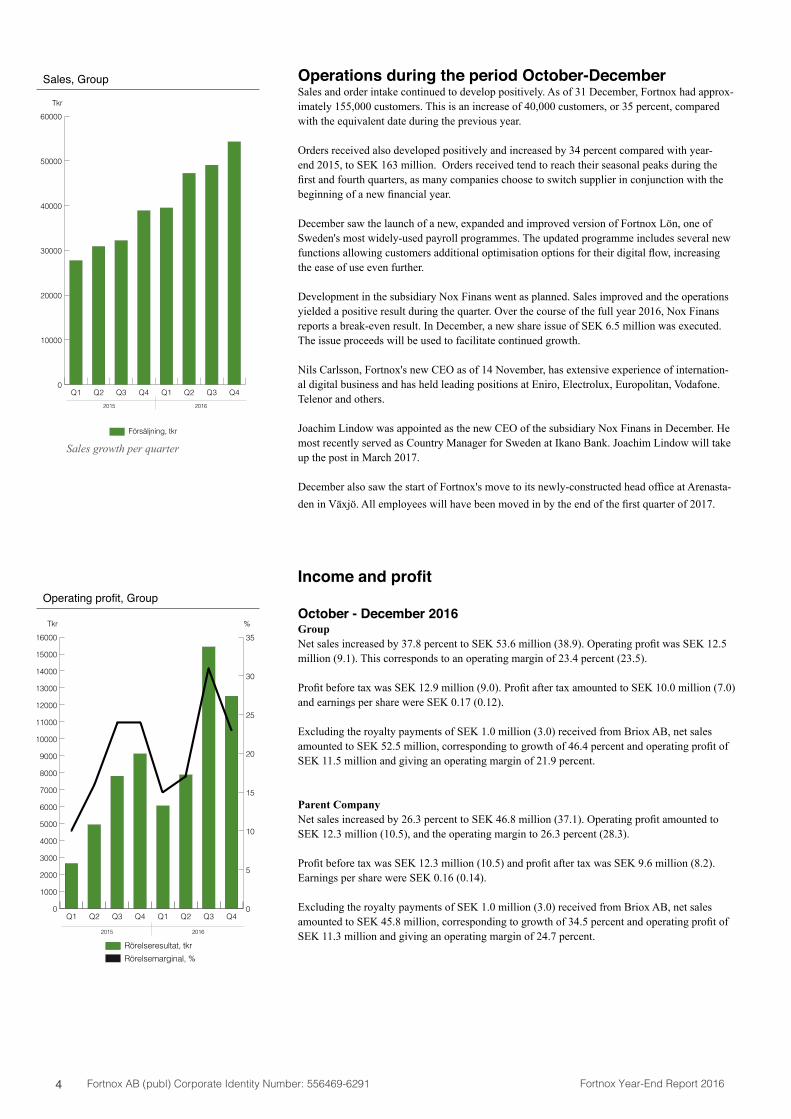
Operations during the period October-DecemberSales and order intake continued to develop positively. As of 31 December, Fortnox had approx-imately 155,000 customers. This is an increase of 40,000 customers, or 35 percent, compared with the equivalent date during the previous year.
Orders received also developed positively and increased by 34 percent compared with year-end 2015, to SEK 163 million. Orders received tend to reach their seasonal peaks during the first and fourth quarters, as many companies choose to switch supplier in conjunction with the beginning of a new financial year.
December saw the launch of a new, expanded and improved version of Fortnox Lön, one of Sweden's most widely-used payroll programmes. The updated programme includes several new functions allowing customers additional optimisation options for their digital flow, increasing the ease of use even further. Development in the subsidiary Nox Finans went as planned. Sales improved and the operations yielded a positive result during the quarter. Over the course of the full year 2016, Nox Finans reports a break-even result. In December, a new share issue of SEK 6.5 million was executed. The issue proceeds will be used to facilitate continued growth.
Nils Carlsson, Fortnox's new CEO as of 14 November, has extensive experience of internation-al digital business and has held leading positions at Eniro, Electrolux, Europolitan, Vodafone. Telenor and others.
Joachim Lindow was appointed as the new CEO of the subsidiary Nox Finans in December. He most recently served as Country Manager for Sweden at Ikano Bank. Joachim Lindow will take up the post in March 2017.
December also saw the start of Fortnox's move to its newly-constructed head office at Arenasta-den in Växjö. All employees will have been moved in by the end of the first quarter of 2017.
Income and profit
October - December 2016GroupNet sales increased by 37.8 percent to SEK 53.6 million (38.9). Operating profit was SEK 12.5 million (9.1). This corresponds to an operating margin of 23.4 percent (23.5).
Profit before tax was SEK 12.9 million (9.0). Profit after tax amounted to SEK 10.0 million (7.0) and earnings per share were SEK 0.17 (0.12).
Excluding the royalty payments of SEK 1.0 million (3.0) received from Briox AB, net sales amounted to SEK 52.5 million, corresponding to growth of 46.4 percent and operating profit of SEK 11.5 million and giving an operating margin of 21.9 percent.
Parent CompanyNet sales increased by 26.3 percent to SEK 46.8 million (37.1). Operating profit amounted to SEK 12.3 million (10.5), and the operating margin to 26.3 percent (28.3).
Profit before tax was SEK 12.3 million (10.5) and profit after tax was SEK 9.6 million (8.2). Earnings per share were SEK 0.16 (0.14).
Excluding the royalty payments of SEK 1.0 million (3.0) received from Briox AB, net sales amounted to SEK 45.8 million, corresponding to growth of 34.5 percent and operating profit of SEK 11.3 million and giving an operating margin of 24.7 percent.
0
2000
4000
6000
8000
10000
12000
14000Kvartal 4
Kvartal 3
Kvartal 2
Kvartal 1
201120102009200820072006
tkr
Kvartal 1 Kvartal 2 Kvartal 3 Kvartal 4
Kvartal 1
Kvartal 2
Kvartal 3
Kvartal 4
0
2000
4000
6000
8000
10000
12000
14000Kvartal 4
Kvartal 3
Kvartal 2
Kvartal 1
201120102009200820072006
tkr
Kvartal 1 Kvartal 2 Kvartal 3 Kvartal 4
Kvartal 1
Kvartal 2
Kvartal 3
Kvartal 4
Kvartal 1 Kvartal 2 Kvartal 3 Kvartal 4
0
1000
2000
3000
4000
5000
6000
7000
8000
9000
10000
11000
12000
13000
14000
15000
16000
Kvartal 4
Kvartal 3
Kvartal 2
Kvartal 1
2012201120102009200820072006
0
2000
4000
6000
8000
10000
12000
14000
16000Kvartal 4
Kvartal 3
Kvartal 2
Kvartal 1
2012201120102009200820072006
0
2000
4000
6000
8000
10000
12000
14000
16000
Kvartal 4
Kvartal 3
Kvartal 2
Kvartal 1
2012201120102009200820072006
0,0
0,2
0,4
0,6
0,8
1,0
Kvartal 1 Kvartal 2 Kvartal 3 Kvartal 4
Kvartal 1Kvartal 2 Kvartal 3 Kvartal 4
Kvartal 1Kvartal 2 Kvartal 3 Kvartal 4
Kvartal 1Kvartal 2 Kvartal 3 Kvartal 4
tkr
0
10
20
30
40
50
60
70
80
2013-03-31*2012-12-312011-12-312010-12-312009-12-312008-12-312007-12-312006-12-31
-20 000
-10 000
0
10 000
20 000
30 000
40 000
50 000
60 000
70 000
0
1,00
2,00
3,00
4,00
5,00
6,00
7,00
8,00
2013-03-312012-12-312011-12-312010-12-312009-12-312008-12-312007-12-31
Mkr Aktiekurs i kronor
Nettoomsättning
Resultat efter �nansnetto
Aktiekurs
Försäljning, tkr
Tusental
0
2 000
4 000
6 000
8 000
10 000
12 000
14 000
16 000
18 000
20 000
22 000
Kvartal 4
Kvartal 3
Kvartal 2
Kvartal 1
2013201220112010200920082007
0
10000
20000
30000
40000
50000
600002011
Q4Q3Q2Q1Q4Q3Q2Q1
Omsättning Kocernen
Tkr
0
20
40
60
80
100
1202011
Q4Q3Q2Q1Q4Q3Q2Q1
Antal anställda
Rörelseresultat, tkrRörelsemarginal, %
0
1000
2000
3000
4000
5000
6000
7000
8000
9000
10000
11000
12000
13000
14000
15000
160002011
Q4Q3Q2Q1Q4Q3Q2Q10
5
10
15
20
25
30
352011
Rörelseresultat
Tkr %
94
108
124
68
77
84 8588
20148
9
10
11
12
13
14
152011
Q3Q2Q1Q4Q3Q2Q1Q4
Antal anställda
2015 2016 2013 2014
2015 2016
Kr
0
30
60
90
120
150 2011
Q4Q3Q2Q1Q4Q3Q2Q1
Sales growth per quarter
Sales, Group
0
2000
4000
6000
8000
10000
12000
14000Kvartal 4
Kvartal 3
Kvartal 2
Kvartal 1
201120102009200820072006
tkr
Kvartal 1 Kvartal 2 Kvartal 3 Kvartal 4
Kvartal 1
Kvartal 2
Kvartal 3
Kvartal 4
0
2000
4000
6000
8000
10000
12000
14000Kvartal 4
Kvartal 3
Kvartal 2
Kvartal 1
201120102009200820072006
tkr
Kvartal 1 Kvartal 2 Kvartal 3 Kvartal 4
Kvartal 1
Kvartal 2
Kvartal 3
Kvartal 4
Kvartal 1 Kvartal 2 Kvartal 3 Kvartal 4
0
1000
2000
3000
4000
5000
6000
7000
8000
9000
10000
11000
12000
13000
14000
15000
16000
Kvartal 4
Kvartal 3
Kvartal 2
Kvartal 1
2012201120102009200820072006
0
2000
4000
6000
8000
10000
12000
14000
16000Kvartal 4
Kvartal 3
Kvartal 2
Kvartal 1
2012201120102009200820072006
0
2000
4000
6000
8000
10000
12000
14000
16000
Kvartal 4
Kvartal 3
Kvartal 2
Kvartal 1
2012201120102009200820072006
0,0
0,2
0,4
0,6
0,8
1,0
Kvartal 1 Kvartal 2 Kvartal 3 Kvartal 4
Kvartal 1Kvartal 2 Kvartal 3 Kvartal 4
Kvartal 1Kvartal 2 Kvartal 3 Kvartal 4
Kvartal 1Kvartal 2 Kvartal 3 Kvartal 4
tkr
0
10
20
30
40
50
60
70
80
2013-03-31*2012-12-312011-12-312010-12-312009-12-312008-12-312007-12-312006-12-31
-20 000
-10 000
0
10 000
20 000
30 000
40 000
50 000
60 000
70 000
0
1,00
2,00
3,00
4,00
5,00
6,00
7,00
8,00
2013-03-312012-12-312011-12-312010-12-312009-12-312008-12-312007-12-31
Mkr Aktiekurs i kronor
Nettoomsättning
Resultat efter �nansnetto
Aktiekurs
Försäljning, tkr
Tusental
0
2 000
4 000
6 000
8 000
10 000
12 000
14 000
16 000
18 000
20 000
22 000
Kvartal 4
Kvartal 3
Kvartal 2
Kvartal 1
2013201220112010200920082007
0
10000
20000
30000
40000
50000
600002011
Q4Q3Q2Q1Q4Q3Q2Q1
Omsättning Kocernen
Tkr
0
20
40
60
80
100
1202011
Q4Q3Q2Q1Q4Q3Q2Q1
Antal anställda
Rörelseresultat, tkrRörelsemarginal, %
0
1000
2000
3000
4000
5000
6000
7000
8000
9000
10000
11000
12000
13000
14000
15000
160002011
Q4Q3Q2Q1Q4Q3Q2Q10
5
10
15
20
25
30
352011
Rörelseresultat
Tkr %
94
108
124
68
77
84 8588
20148
9
10
11
12
13
14
152011
Q3Q2Q1Q4Q3Q2Q1Q4
Antal anställda
2015 2016 2013 2014
2015 2016
Kr
0
30
60
90
120
150 2011
Q4Q3Q2Q1Q4Q3Q2Q1
Operating profit, Group
Fortnox AB (publ) Corporate Identity Number: 556469-6291Fortnox Year-End Report 2016 5
January - December 2016GroupNet sales during the period amounted to SEK 189.3 million (129.7), an increase of 46.0 percent. Operating profit was SEK 41.9 million (24.5). This corresponds to an operating margin of 22.1 percent (18.9). Profit was negatively impacted by non-recurring expenses totalling SEK 3.2 mil-lion, attributable to financial and legal consultancy fees associated with Visma's public takeover bid. The profit recorded in December includes royalty payments of SEK 1.0 million (3.0) received from Briox AB. Excluding these one-time transactions, operating profit was SEK 44.1 million and the operating margin was 23.3 percent.
Profit before tax was SEK 41.9 million (24.5). Profit after tax amounted to SEK 32.6 million (19.0) and earnings per share were SEK 0.56 (0.33).
Parent CompanyNet sales increased by 34.2 percent to SEK 168.9 million (125.8). Operating profit amounted to SEK 41.9 million (29.2), and the operating margin to 24.8 percent (23.2). Profit was negatively impacted by non-recurring expenses totalling SEK 3.2 million, attributable to financial and legal consultancy fees associated with Visma's public takeover bid. The profit recorded in December includes royalty payments of SEK 1.0 million (3.0) received from Briox AB. Excluding these one-time transactions, operating profit was SEK 44.1 million and the operating margin was 26.3 percent.
Profit before tax was SEK 41.8 million (29.2) and profit after tax was SEK 32.6 million (22.7). Earnings per share were SEK 0.56 (0.39).
Cash flow and financial positionThe Group's cash flow from operating activities for 2016 was SEK 48.7 million (54.0). The Group's liquid resources at the end of the period amounted to SEK 60.3 million (45.8). Liquid resources include customer deposits in the subsidiary Nox Finans amounting to SEK 14.9 million (11.6). An amount of SEK 10 million of these liquid resources is pledged as security for utilised credit in Nox Finans. Current liabilities at the end of the period amounted to SEK 97.8 million (73.1). The Group has no non-current liabilities. The equity/assets ratio was 37 percent (33).
In December, a new share issue of SEK 6.5 million was executed in Nox Finans. Fortnox's partici-pating interest in Nox Finans is equivalent to 92.4 percent.
Investments and returnsThe Group's investments during the period amounted to SEK 30.9 million (29.8), of which capital-ised development costs constituted SEK 22.0 mi8llion (27.6). These capitalised development costs include internally-generated costs for development work of SEK 13.3 million (15.2). Depreciation and amortisation during the period totalled SEK 10.2 million (5.0).
EquityAt the end of the quarter, equity in the Group amounted to SEK 58.7 million (36.9). Share capital was SEK 1,168,345 (1,168,345), divided between 58,417,259 shares with a quotient value of SEK 0.02.
EmployeesThe number of employees in the Group at the end of the period was 169, compared with 139 on the corresponding date during the previous year. In addition, the Company engages consultants for individual projects.
6 Fortnox AB (publ) Corporate Identity Number: 556469-6291 Fortnox Year-End Report 2016
The Fortnox shareFortnox AB is traded on the NGM Nordic MTF exchange. The Fortnox share was listed at SEK 29.90 on 30 December. This corresponds to a market value of approximately SEK 1,747.0 million. During 2016, the share has traded at a highest listed price of SEK 31.79 on 24 November, while the lowest price of SEK 15.30 was listed on 28 June.
Ten largest shareholders as at 31 December 2016.Shareholder Number %
FIRST KRAFT AB 12,220,659 20.92%
SWEDBANK ROBUR NY TEKNIK BTI 3,017,000 5.16%
FÖRSÄKRINGSAKTIEBOLAGET, AVANZA PENSION 2,383,092 4.08%
NORDNET PENSIONSFÖRSÄKRING AB 2,156,458 3.69%
BENGTSSON, PEDER KLAS-AKE 2,018,000 3.45%
RBC INVESTOR SERVICES BANK SA, LUX AIF CLIENTS 2,014,974 3.45%
CBNY-NORGES BANK 1,730,000 2.96%
BERGSTRÖM, BIRGER 1,495,000 2.56%
SPILTAN AKTIEFOND SVERIGE 1,125,648 1.93%
NETFONDS ASA, NQI 1,096,718 1.88%
Other shareholders 29,159,710 49.9%
Total 58,417,259 100.0%
ProspectsFortnox is confident that there continues to be a substantial growth potential for the Company's services and products. This applies both to existing and potential customers. The digitalisation and automation of ever more work tasks and functions in society is beneficial for Fortnox.This development is accelerated by Fortnox's office partners, who apply various initiatives to en-courage their customers to transfer their administration to the cloud. By the year 2020, cloud-based services are expected to account for 95-100 percent of the accountancy sector's IT solutions.
Financial calendarAnnual General Meeting 28 March 2017Interim Report for the period January – March 27 April 2017Interim Report for the period April – June 18 August 2017Interim Report for the period July – September 18 October 2017
Significant events after the end of the report periodNo significant events have taken place after the end of the report period.
NBThis information is information that Fortnox AB is obliged to make public pursuant to the EU Mar-ket Abuse Regulation and Securities Market Act. The information was submitted for publication, through the agency of the contact person set out below, at 08:30 CET on 9 February 2017.
The report has not been subject to review by the Company's auditors.Växjö, 9 February 2017Fortnox AB (publ)
Nils Carlsson
For further information, please contact:Nils Carlsson, Chief Executive Officer
Fortnox AB (publ) Corporate Identity Number: 556469-6291Fortnox Year-End Report 2016 7
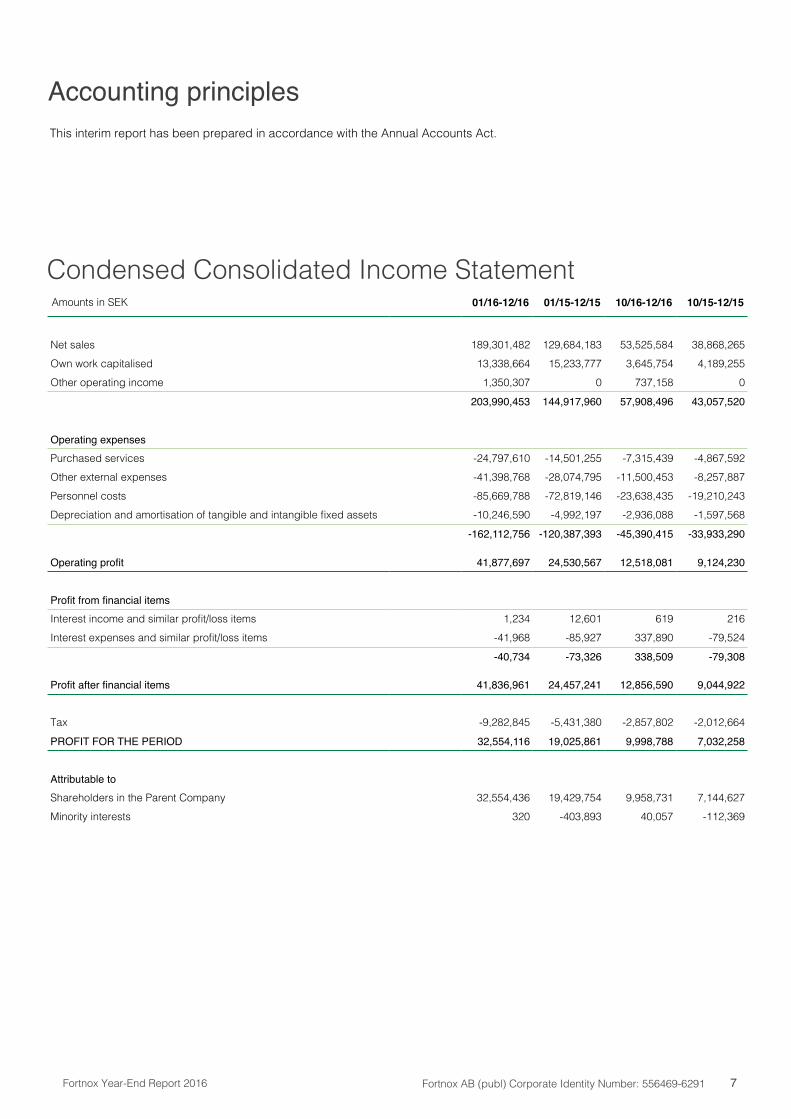
Condensed Consolidated Income Statement
Accounting principlesThis interim report has been prepared in accordance with the Annual Accounts Act.
Amounts in SEK 01/16-12/16 01/15-12/15 10/16-12/16 10/15-12/15
Net sales 189,301,482 129,684,183 53,525,584 38,868,265Own work capitalised 13,338,664 15,233,777 3,645,754 4,189,255Other operating income 1,350,307 0 737,158 0
203,990,453 144,917,960 57,908,496 43,057,520
Operating expensesPurchased services -24,797,610 -14,501,255 -7,315,439 -4,867,592Other external expenses -41,398,768 -28,074,795 -11,500,453 -8,257,887Personnel costs -85,669,788 -72,819,146 -23,638,435 -19,210,243Depreciation and amortisation of tangible and intangible fixed assets -10,246,590 -4,992,197 -2,936,088 -1,597,568
-162,112,756 -120,387,393 -45,390,415 -33,933,290
Operating profit 41,877,697 24,530,567 12,518,081 9,124,230
Profit from financial itemsInterest income and similar profit/loss items 1,234 12,601 619 216Interest expenses and similar profit/loss items -41,968 -85,927 337,890 -79,524
-40,734 -73,326 338,509 -79,308
Profit after financial items 41,836,961 24,457,241 12,856,590 9,044,922
Tax -9,282,845 -5,431,380 -2,857,802 -2,012,664
PROFIT FOR THE PERIOD 32,554,116 19,025,861 9,998,788 7,032,258
Attributable toShareholders in the Parent Company 32,554,436 19,429,754 9,958,731 7,144,627Minority interests 320 -403,893 40,057 -112,369
8 Fortnox AB (publ) Corporate Identity Number: 556469-6291 Fortnox Year-End Report 2016
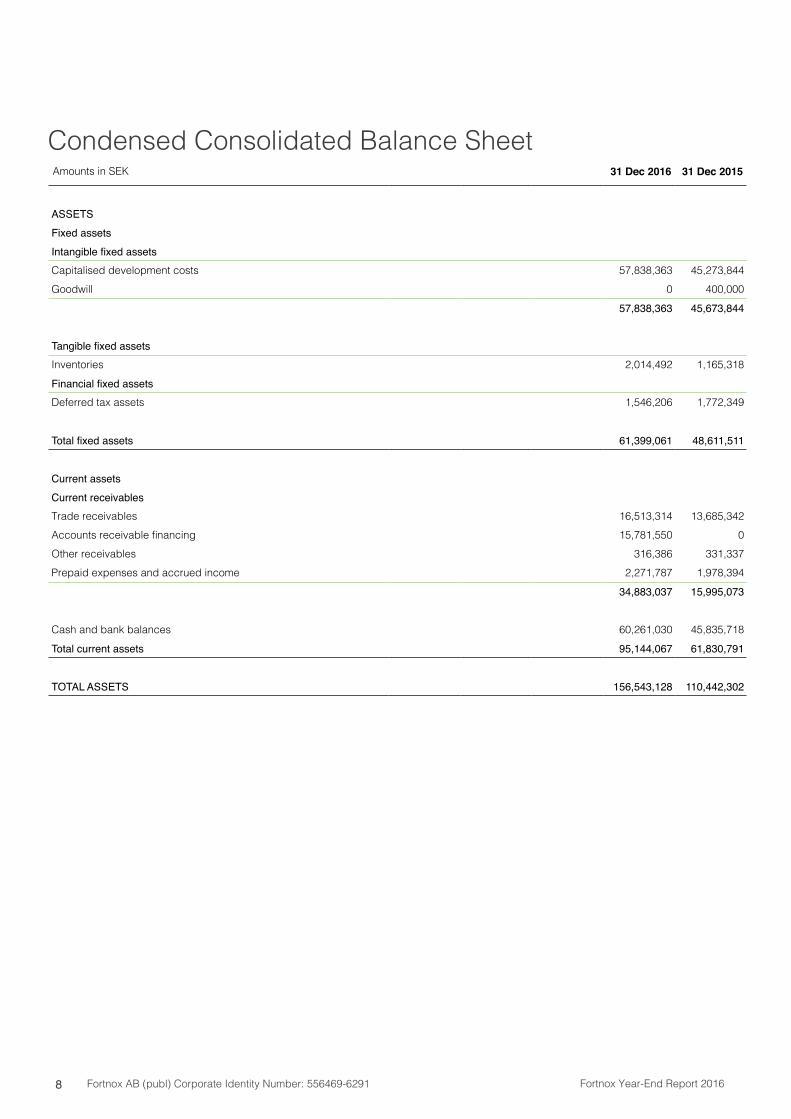
Condensed Consolidated Balance SheetAmounts in SEK 31 Dec 2016 31 Dec 2015
ASSETSFixed assetsIntangible fixed assetsCapitalised development costs 57,838,363 45,273,844Goodwill 0 400,000
57,838,363 45,673,844
Tangible fixed assetsInventories 2,014,492 1,165,318
Financial fixed assetsDeferred tax assets 1,546,206 1,772,349
Total fixed assets 61,399,061 48,611,511
Current assetsCurrent receivablesTrade receivables 16,513,314 13,685,342Accounts receivable financing 15,781,550 0Other receivables 316,386 331,337Prepaid expenses and accrued income 2,271,787 1,978,394
34,883,037 15,995,073
Cash and bank balances 60,261,030 45,835,718
Total current assets 95,144,067 61,830,791
TOTAL ASSETS 156,543,128 110,442,302
Fortnox AB (publ) Corporate Identity Number: 556469-6291Fortnox Year-End Report 2016 9
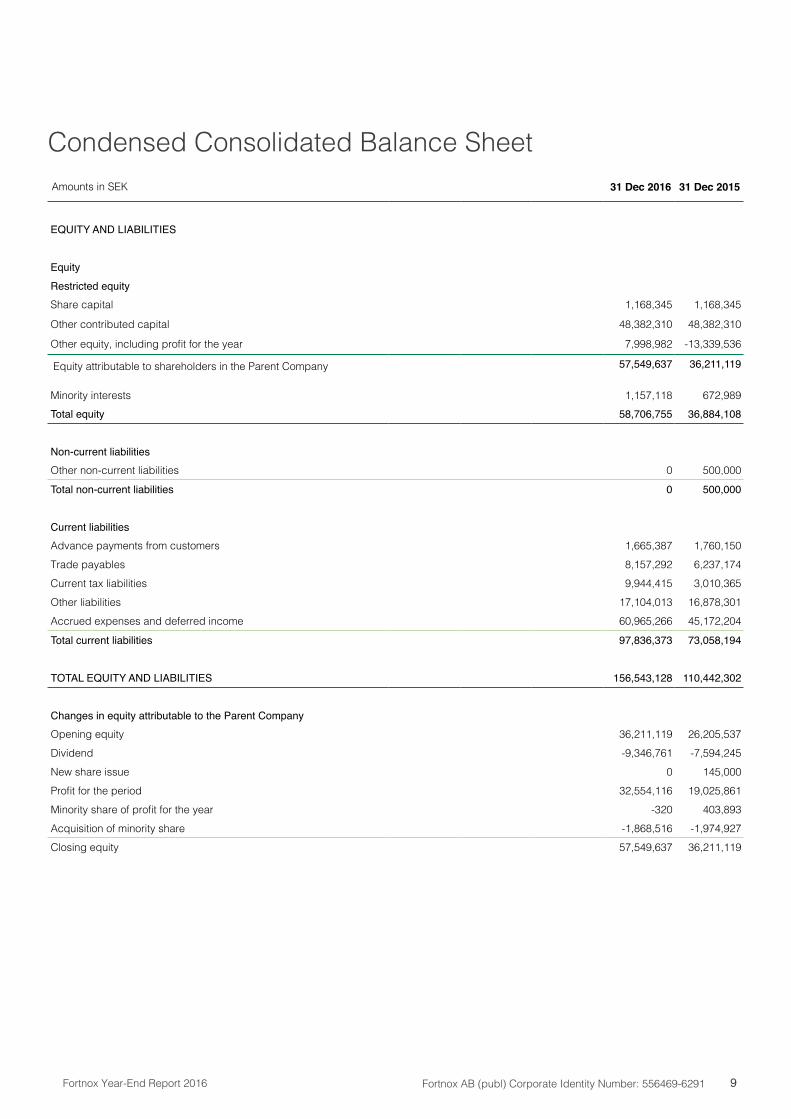
Amounts in SEK 31 Dec 2016 31 Dec 2015
EQUITY AND LIABILITIES
EquityRestricted equityShare capital 1,168,345 1,168,345
Other contributed capital 48,382,310 48,382,310
Other equity, including profit for the year 7,998,982 -13,339,536
Equity attributable to shareholders in the Parent Company 57,549,637 36,211,119
Minority interests 1,157,118 672,989Total equity 58,706,755 36,884,108
Non-current liabilitiesOther non-current liabilities 0 500,000
Total non-current liabilities 0 500,000
Current liabilitiesAdvance payments from customers 1,665,387 1,760,150Trade payables 8,157,292 6,237,174Current tax liabilities 9,944,415 3,010,365Other liabilities 17,104,013 16,878,301Accrued expenses and deferred income 60,965,266 45,172,204
Total current liabilities 97,836,373 73,058,194
TOTAL EQUITY AND LIABILITIES 156,543,128 110,442,302
Changes in equity attributable to the Parent CompanyOpening equity 36,211,119 26,205,537Dividend -9,346,761 -7,594,245New share issue 0 145,000Profit for the period 32,554,116 19,025,861Minority share of profit for the year -320 403,893Acquisition of minority share -1,868,516 -1,974,927Closing equity 57,549,637 36,211,119
Condensed Consolidated Balance Sheet
10 Fortnox AB (publ) Corporate Identity Number: 556469-6291 Fortnox Year-End Report 2016
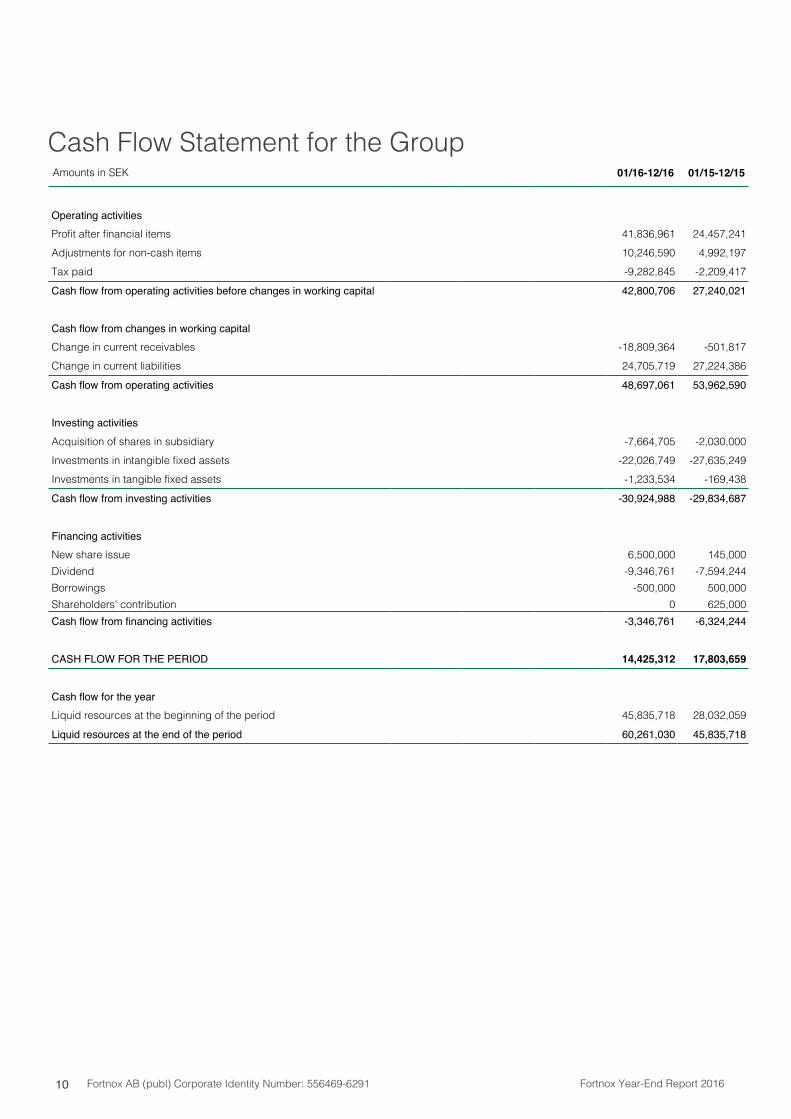
Cash Flow Statement for the GroupAmounts in SEK 01/16-12/16 01/15-12/15
Operating activitiesProfit after financial items 41,836,961 24,457,241Adjustments for non-cash items 10,246,590 4,992,197Tax paid -9,282,845 -2,209,417
Cash flow from operating activities before changes in working capital 42,800,706 27,240,021
Cash flow from changes in working capitalChange in current receivables -18,809,364 -501,817Change in current liabilities 24,705,719 27,224,386
Cash flow from operating activities 48,697,061 53,962,590
Investing activitiesAcquisition of shares in subsidiary -7,664,705 -2,030,000Investments in intangible fixed assets -22,026,749 -27,635,249Investments in tangible fixed assets -1,233,534 -169,438
Cash flow from investing activities -30,924,988 -29,834,687
Financing activitiesNew share issue 6,500,000 145,000Dividend -9,346,761 -7,594,244Borrowings -500,000 500,000Shareholders' contribution 0 625,000Cash flow from financing activities -3,346,761 -6,324,244
CASH FLOW FOR THE PERIOD 14,425,312 17,803,659
Cash flow for the yearLiquid resources at the beginning of the period 45,835,718 28,032,059
Liquid resources at the end of the period 60,261,030 45,835,718
Fortnox AB (publ) Corporate Identity Number: 556469-6291Fortnox Year-End Report 2016 11
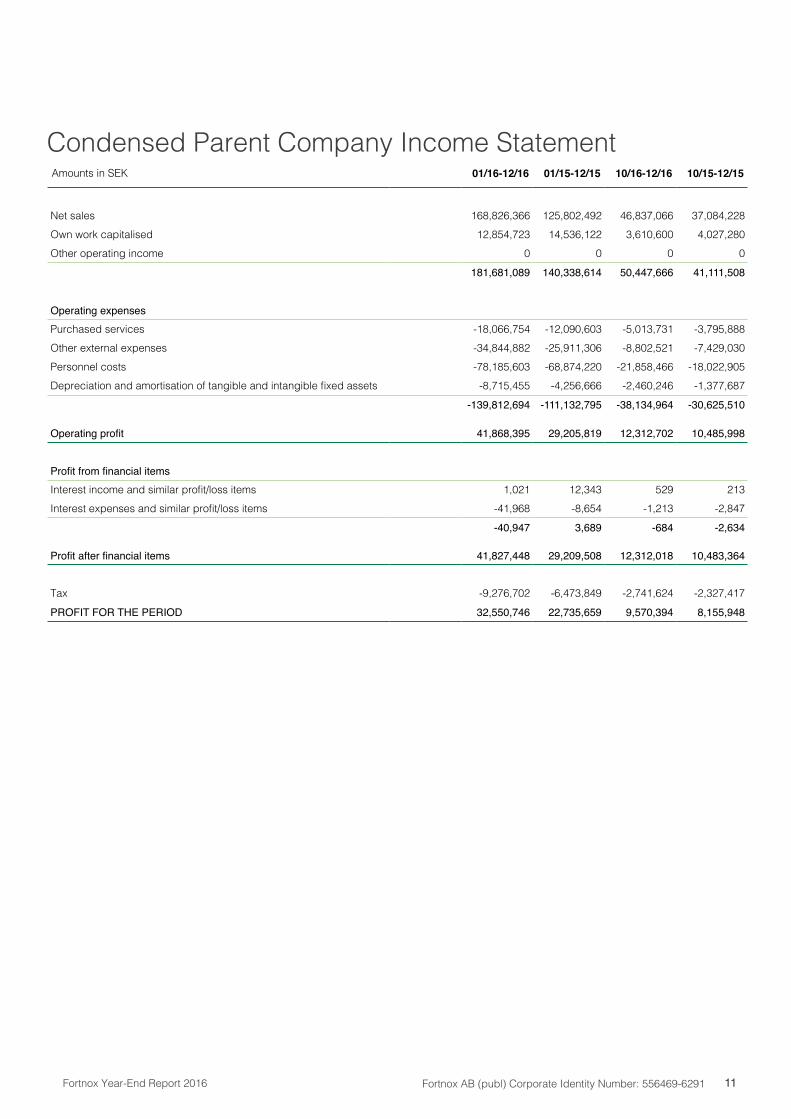
Condensed Parent Company Income StatementAmounts in SEK 01/16-12/16 01/15-12/15 10/16-12/16 10/15-12/15
Net sales 168,826,366 125,802,492 46,837,066 37,084,228Own work capitalised 12,854,723 14,536,122 3,610,600 4,027,280Other operating income 0 0 0 0
181,681,089 140,338,614 50,447,666 41,111,508
Operating expensesPurchased services -18,066,754 -12,090,603 -5,013,731 -3,795,888Other external expenses -34,844,882 -25,911,306 -8,802,521 -7,429,030Personnel costs -78,185,603 -68,874,220 -21,858,466 -18,022,905Depreciation and amortisation of tangible and intangible fixed assets -8,715,455 -4,256,666 -2,460,246 -1,377,687
-139,812,694 -111,132,795 -38,134,964 -30,625,510
Operating profit 41,868,395 29,205,819 12,312,702 10,485,998
Profit from financial itemsInterest income and similar profit/loss items 1,021 12,343 529 213Interest expenses and similar profit/loss items -41,968 -8,654 -1,213 -2,847
-40,947 3,689 -684 -2,634
Profit after financial items 41,827,448 29,209,508 12,312,018 10,483,364
Tax -9,276,702 -6,473,849 -2,741,624 -2,327,417
PROFIT FOR THE PERIOD 32,550,746 22,735,659 9,570,394 8,155,948
12 Fortnox AB (publ) Corporate Identity Number: 556469-6291 Fortnox Year-End Report 2016
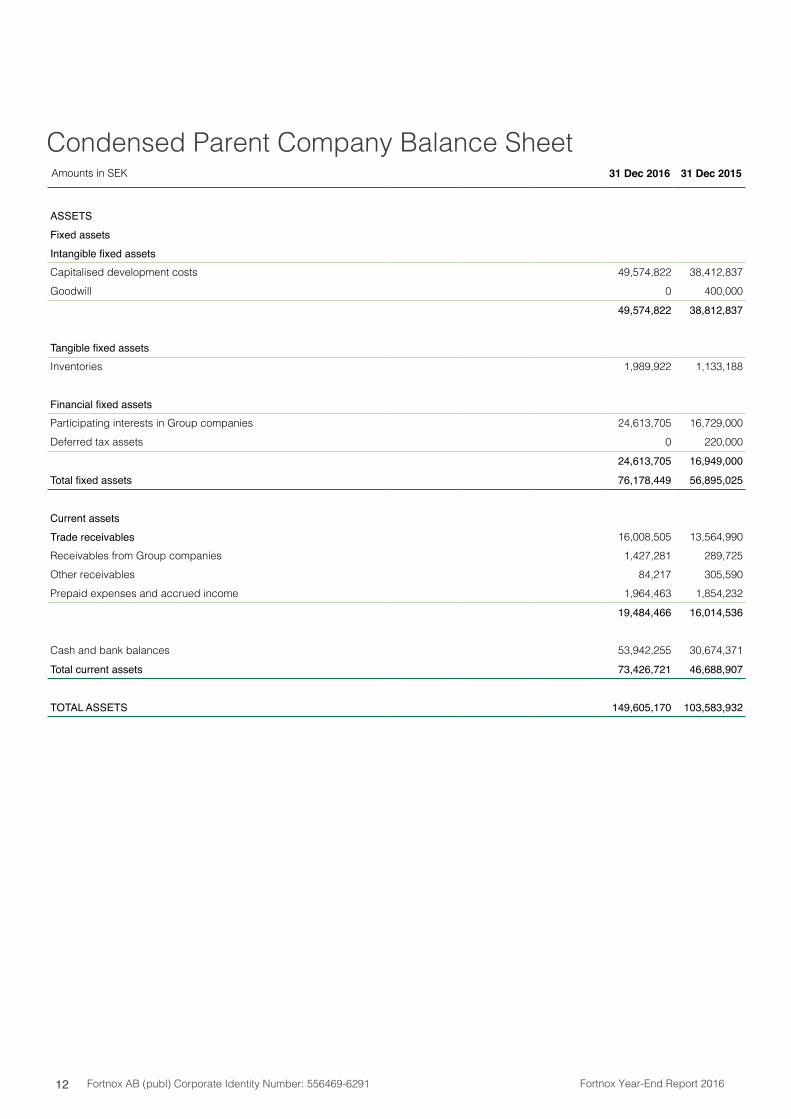
Condensed Parent Company Balance SheetAmounts in SEK 31 Dec 2016 31 Dec 2015
ASSETSFixed assetsIntangible fixed assetsCapitalised development costs 49,574,822 38,412,837Goodwill 0 400,000
49,574,822 38,812,837
Tangible fixed assetsInventories 1,989,922 1,133,188
Financial fixed assetsParticipating interests in Group companies 24,613,705 16,729,000Deferred tax assets 0 220,000
24,613,705 16,949,000
Total fixed assets 76,178,449 56,895,025
Current assetsTrade receivables 16,008,505 13,564,990Receivables from Group companies 1,427,281 289,725Other receivables 84,217 305,590Prepaid expenses and accrued income 1,964,463 1,854,232
19,484,466 16,014,536
Cash and bank balances 53,942,255 30,674,371
Total current assets 73,426,721 46,688,907
TOTAL ASSETS 149,605,170 103,583,932
Fortnox AB (publ) Corporate Identity Number: 556469-6291Fortnox Year-End Report 2016 13
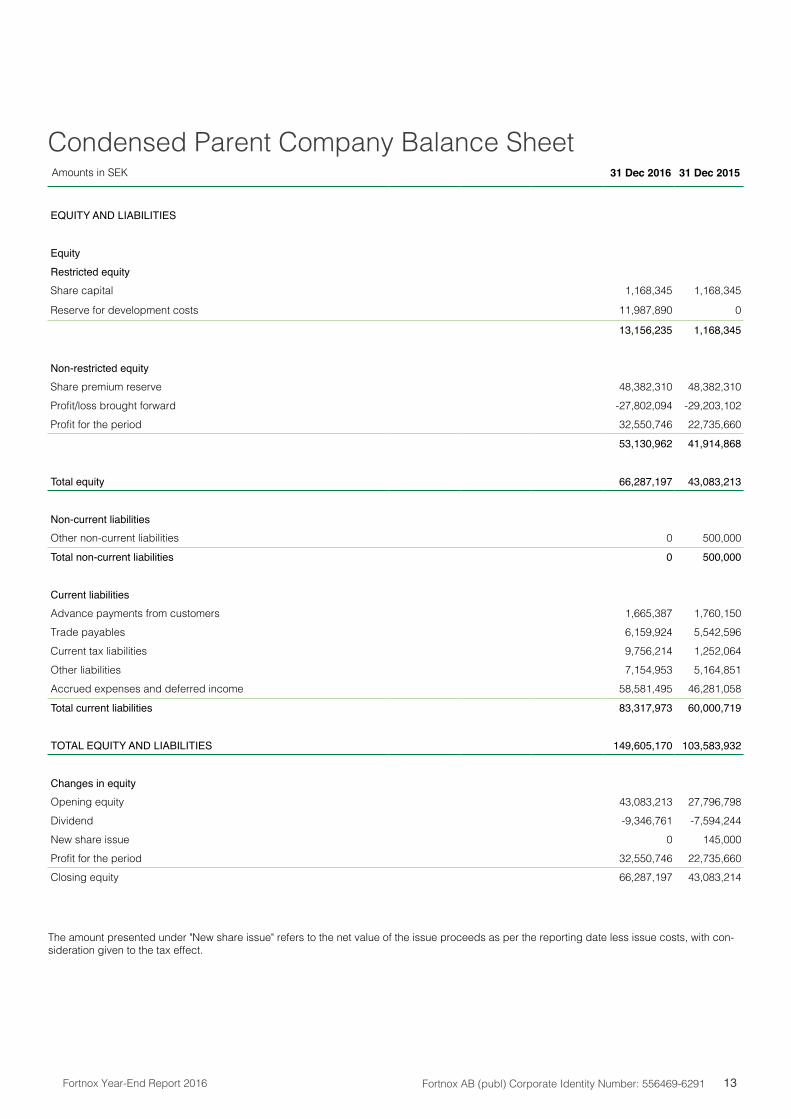
Condensed Parent Company Balance SheetAmounts in SEK 31 Dec 2016 31 Dec 2015
EQUITY AND LIABILITIES
EquityRestricted equityShare capital 1,168,345 1,168,345
Reserve for development costs 11,987,890 0
13,156,235 1,168,345
Non-restricted equityShare premium reserve 48,382,310 48,382,310Profit/loss brought forward -27,802,094 -29,203,102Profit for the period 32,550,746 22,735,660
53,130,962 41,914,868
Total equity 66,287,197 43,083,213
Non-current liabilitiesOther non-current liabilities 0 500,000
Total non-current liabilities 0 500,000
Current liabilitiesAdvance payments from customers 1,665,387 1,760,150Trade payables 6,159,924 5,542,596Current tax liabilities 9,756,214 1,252,064Other liabilities 7,154,953 5,164,851Accrued expenses and deferred income 58,581,495 46,281,058
Total current liabilities 83,317,973 60,000,719
TOTAL EQUITY AND LIABILITIES 149,605,170 103,583,932
Changes in equityOpening equity 43,083,213 27,796,798Dividend -9,346,761 -7,594,244New share issue 0 145,000Profit for the period 32,550,746 22,735,660Closing equity 66,287,197 43,083,214
The amount presented under "New share issue" refers to the net value of the issue proceeds as per the reporting date less issue costs, with con-sideration given to the tax effect.
14 Fortnox AB (publ) Corporate Identity Number: 556469-6291 Fortnox Year-End Report 2016
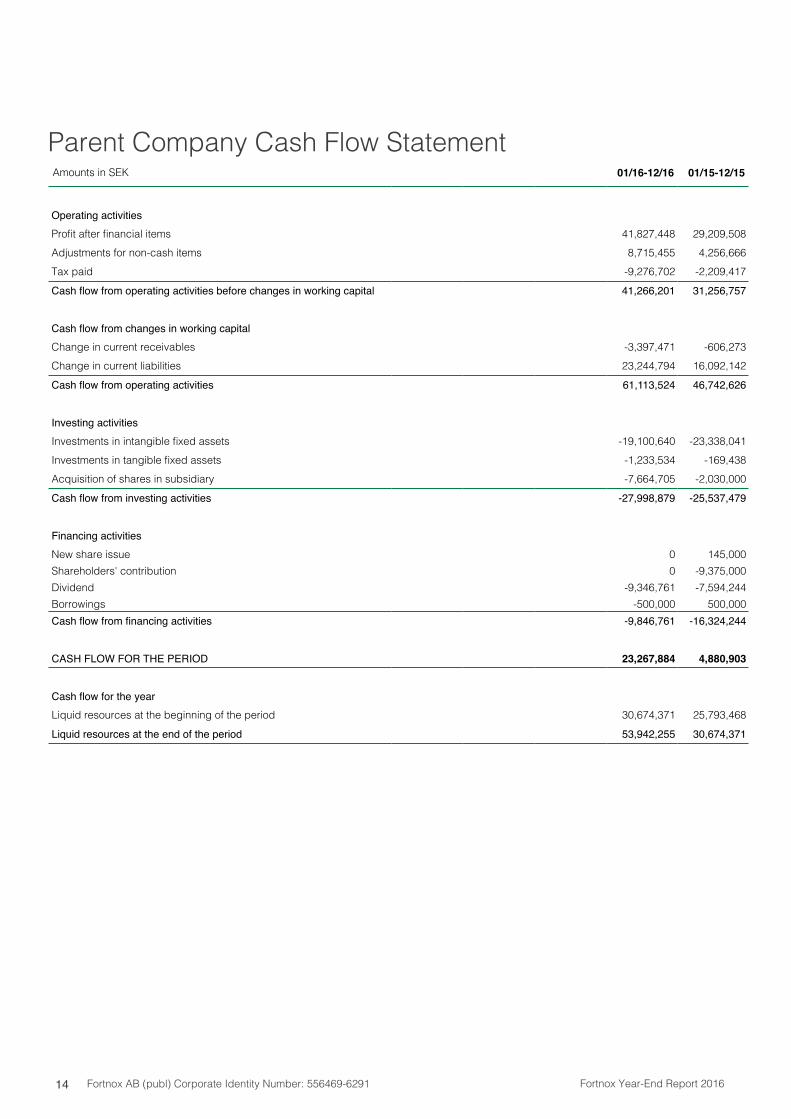
Parent Company Cash Flow StatementAmounts in SEK 01/16-12/16 01/15-12/15
Operating activitiesProfit after financial items 41,827,448 29,209,508Adjustments for non-cash items 8,715,455 4,256,666Tax paid -9,276,702 -2,209,417
Cash flow from operating activities before changes in working capital 41,266,201 31,256,757
Cash flow from changes in working capitalChange in current receivables -3,397,471 -606,273Change in current liabilities 23,244,794 16,092,142
Cash flow from operating activities 61,113,524 46,742,626
Investing activitiesInvestments in intangible fixed assets -19,100,640 -23,338,041Investments in tangible fixed assets -1,233,534 -169,438Acquisition of shares in subsidiary -7,664,705 -2,030,000
Cash flow from investing activities -27,998,879 -25,537,479
Financing activitiesNew share issue 0 145,000Shareholders' contribution 0 -9,375,000Dividend -9,346,761 -7,594,244Borrowings -500,000 500,000Cash flow from financing activities -9,846,761 -16,324,244
CASH FLOW FOR THE PERIOD 23,267,884 4,880,903
Cash flow for the yearLiquid resources at the beginning of the period 30,674,371 25,793,468
Liquid resources at the end of the period 53,942,255 30,674,371

Fortnox AB (publ) Corporate Identity Number: 556469-6291Fortnox Year-End Report 2016 15

16 Fortnox AB (publ) Corporate Identity Number: 556469-6291 Fortnox Year-End Report 2016
Fortnox AB (publ) Box 427 | SE-351 06 VäxjöTelephone: +46 470 78 50 00Telefax: +46 470 78 50 01Email: [email protected]: www.fortnox.seCorporate Identity Number 556469-6291
Facebook: www.fortnox.se/facebookTwitter: twitter.com/fortnoxabYoutube: www.youtube.com/fortnoxab