xenon detector status liquid xenon group. 1 outline detector setup operation performance problems...
TRANSCRIPT

Xenon Detector StatusXenon Detector Status
Liquid Xenon Group

2
OutlineOutline
• Detector Setup
• Operation
• Performance
• Problems and solutions

Detector SetupDetector Setup

4
PMT installation completedPMT installation completed
• All PMT successfully installed in Aug 2007 together with– LEDs– Alpha sources (plates and wires)– PT100 temperature sensors– Laser fibers– Surface level meter
• < 200~300um gap btw inner slab and wall
xenon

5
Sensors, LEDs, and alpha sourcesSensors, LEDs, and alpha sources
Two type of sources
•Plate 20 pieces
•Wire 5x5 wires
LED
3 different attenuation x 10
Pt100 Temp sensor
22 sensors in LXe
21 sensors on the wall
Capacitor-type surface level meter

6
Cabling and Al filler installationCabling and Al filler installation
• Filler volume– Lateral 7.5lx6x2 + 4.5lx2x2 = 108l (design) 108 –7.5(US) – 4.5(DS) = 96l
(reality)– Bottom 49l (design) 49 – 10 = 39l (reality)
7.5l
4.5l
7
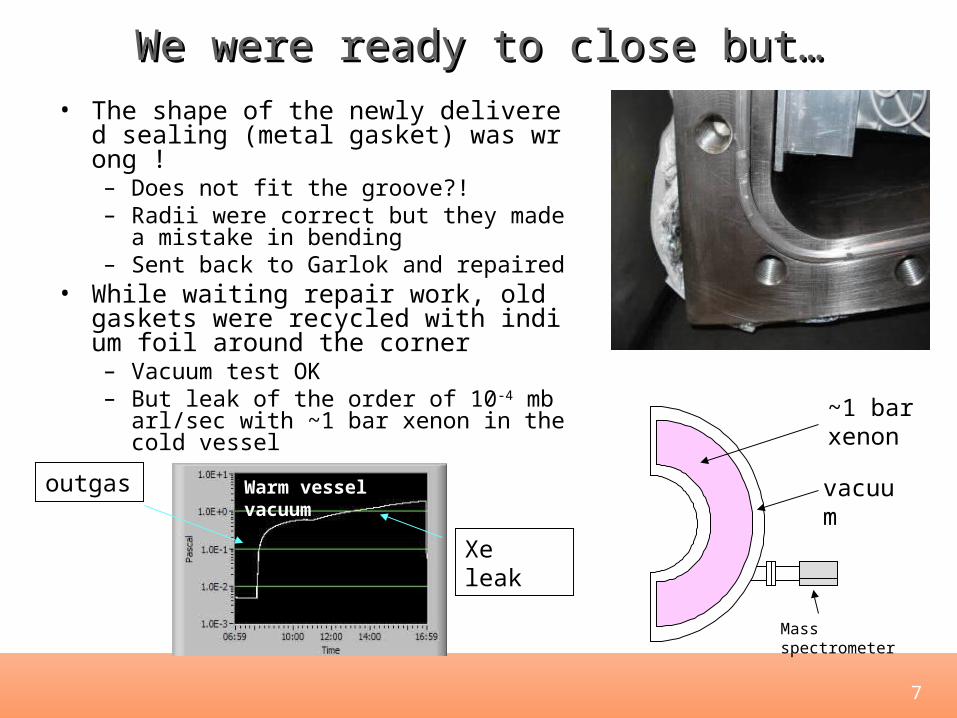
We were ready to close but…We were ready to close but…• The shape of the newly delivered sealin
g (metal gasket) was wrong !– Does not fit the groove?!– Radii were correct but they made a mist
ake in bending– Sent back to Garlok and repaired
• While waiting repair work, old gaskets were recycled with indium foil around the corner – Vacuum test OK– But leak of the order of 10-4 mbarl/sec wi
th ~1 bar xenon in the cold vessel
outgas
Xe leak
Warm vessel vacuum
~1 bar xenon
vacuum
Mass spectrometer

8
RGA of leaking xenonRGA of leaking xenon
• Doubly charged 132Xe (Xe++) is used to evaluate amount of xenon in the warm vessel
• Production cross section with 110keV electron is ~40% of Xe+ production
• Used as reference data for later use
10-4 mbarl/sec leak

9
Closing the coversClosing the covers
• Gaskets replaced with newly delivered ones on 5/Sep• Super-insulator on the cold vessel• 240 Nmm torque

10
Pressure/leak testPressure/leak test• Xenon gas (liquid) in the cold vessel• Mass spectrometer on the warm
vessel• RGA data with recycled gasket used
as a reference– Doubly charged 132Xe (Xe++) is used
to evaluate amount of xenon in the warm vessel
– Production cross section with 110keV electron is ~40% of Xe+ production
10-4 mbarl/sec leak

11
Estimation of xenon leak rateEstimation of xenon leak rate
y = 10.9x - 0.3403R2 = 0.9825
y = 0.1187x - 0.0083R2 = 0.9617
0.001
0.01
0.1
1
10
0.06 0.07 0.08 0.09 0.1 0.11 0.12 0.13 0.14 0.15 0.16Xenon Gas Pressure [MPa]
Peak
Ion
curr
ent a
t A=6
6 [x
10̂-1
0 A]
Recycled gasket10-4 mbarl/sec leakRoom temperature xenon gas
New gasket
Room temperature xenon gas
Better at low temperature

OperationOperation

13
Gas/liquid systemGas/liquid system
Gas-phase purifier
Liquid-phase purifier
Detector1000L dewar
High pressureStorage
Gas line
Liquid line

14
Evacuation and liquefactionEvacuation and liquefaction
• Evacuation started on 5/Sep– Thanks to cryo pump (AISIN)– 6.9x10⁻³ Pa in 3 days
• Cooling started on 10/Sep• Liquefaction started on 15/Sep
• Surface level was monitored with– Temperature sensors– Level meter (long and short)
0.133 MPa
0.11 MPa
Xenon gas
Cryo pump
15
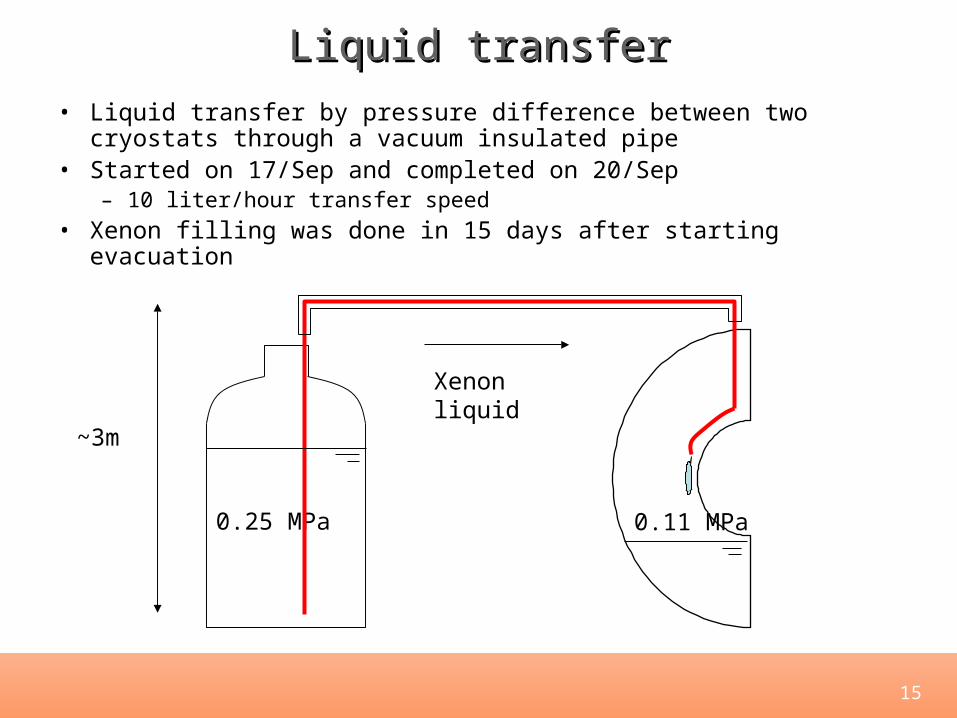
Liquid transferLiquid transfer
• Liquid transfer by pressure difference between two cryostats through a vacuum insulated pipe
• Started on 17/Sep and completed on 20/Sep– 10 liter/hour transfer speed
• Xenon filling was done in 15 days after starting evacuation
0.25 MPa
Xenon liquid
0.11 MPa
~3m

16
End of xenon fillingEnd of xenon filling
temperature
Level meter
• Additional 10 liter was transferred for assurance

17
How many liters of liquid xenon?How many liters of liquid xenon?
• Cryostat volume 1200 liter
• PMT and support 142 + 43 = 185 liter• Filler 135 liter
– Lateral 96 liter– Bottom 39 liter
• Cable 20~30 liter
• Additionally transferred amount of xenon~10 liter
• 1200 – 185 – 135 – 25 + 10 = 865 liter
• Consistent with remaining amount of xenon in the dewar

18
Slow ControlSlow Control
Detector, storage, dewar, purifiers
MEG Central DAQ System
(SCFE)
For shift crew use
Labview
megon00 PC in barrack
XEC PC 2
For expert use
Labview
XEC PC 1
XEC dedicated SCFENode cooperationAlarm to experts
Important controls are implemented in SCS nodes

19
Liquid circulationLiquid circulation• Circulate xenon in liquid phase
– Circulation pump• 100liter/h@3175rpm, p = 0.2MPa
– Molecular sieves• >24 g water absorption
Temperature Sensor
Purifier Cartridge
Molecular sieves, 13X 25g water
Freq. InverterOMRON
PT

20
Succeeded!Succeeded!
Circulation speed evaluation
• change of the surface level after closing the inlet valve
•3.6% / 30sec ~ 432% / h
•1% corresponds to 0.165 liter
0.165x 432%/h = 71 liter /hour
50.63Hz !
Circulation period

21
Liquid-phase purificationLiquid-phase purification
• Light yield for 17.6MeV saturated around 23/Nov (180h purification time)• Necessary to continue longer than we expected
– 5 hours purification was enough in the LP test (100L LXe)– Probably due to
• slower circulation speed (100L/h 70L/h)• Worse initial condition compared to the LP
• Needed longer time to prepare monitoring tools due to PMT HV feedthru problem (reported later)
• Noise from the pump (freq. inverter?) affected other detectors
205 h
2/Dec
180 h
23/Nov
70 h
14/Nov
C-W run
17.6MeV gamma

22
Absorption LengthAbsorption Length
• Ratio Ratio Data/MC Data/MC vs vs distance fitted with an distance fitted with an exponential curveexponential curve..
• Inner and Outer face Inner and Outer face PMTsPMTs
• Cosine of incidence Cosine of incidence angle angle < -0.2< -0.2
• Slope compatible with Slope compatible with zerozero (no absorption)(no absorption).. > 3 m @95 % C.L.> 3 m @95 % C.L.
n̂
PMTPMT
Alpha source
After 50 h purification, 4/Nov

PerformancePerformance
2D display, charge/time 2D hist, charge:PMT# 3D reconstructed position
Waveform 1D histograms Charge:event#

24
PMT CalibrationPMT Calibration
• PMT calibration– LED
• PMT gain– Flushing LEDs at different
intensities
– Npe~1/2
• Time offset calibration– Viewing one LED flushing
with many PMTs simultaneously
– Alpha• QE and absorption length e
valuation• Liquid and cold gas

25
Time offset determinationTime offset determination
• Possible method only in non-segmented detector like ours• c’ is obtained by using all data
Tj
li,j-li-1,j
1/c’ti –ti-1
jji
ij Dc
ltT
',
MeasuredFlashing
Time
Of
i-th
LED
Speed of LED light
Offset of j-th PMT
Different LEDs viewed by one PMT
RD run
(ultra low)
txe - tTC

26
C-W runC-W run
• Li at 14.6, 17.6 MeV• B at 4.4, 11.7 and 16.1 MeV• Details in Giovanni’s presentation

27
CEX run - Pi0 calibrationCEX run - Pi0 calibration
• CEX process– -p0n
• 0(28MeV/c) • 54.9 MeV < E() < 82.9 MeV
• LH2 target
0
54.9MeV 82.9MeV
1.3MeV for >170o
0.3MeV for >175o
170o
175o
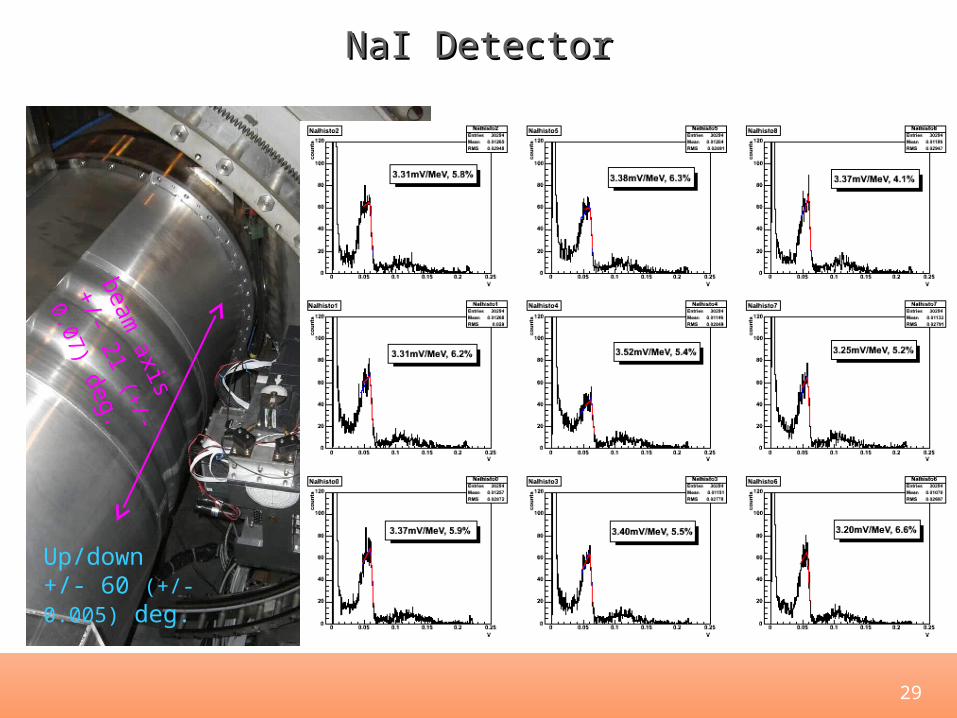
• NaI tagging counter– 3x3 crystals, APD readout
• Pb collimator panel in front of the Xe detector

28
LHLH22 Target Target
• Pressure test of cell 4.5 bar (abs)• Time to liquefy
– 80 min from start of LHe flow• Liquid stability
– 1.2 bar operating pressure (96% cell full)– 1.3% RMS, 6% max excursion
• Liquid Helium consumption– 2.4%/h– 42h auto
29
NaI DetectorNaI Detectorbe
am a
xis
+/- 2
1 (+
/- 0.
07)
deg.
Up/down+/- 60 (+/- 0.005) deg.

30
CEX run data analysis, preliminaryCEX run data analysis, preliminary
• Position cut– Cut shallow events (< 2cm)– Select only center events ( |u|,|v| < 5cm)
• Position correction• Pile-up rejection by light distribution• Select center event on NaI detector• Not applied QE correction
– If applied worsen resolution.• Pedestal has 2% spread
– Needs better baseline evaluation– Check hardware for 2008 run
up = 2.4%FWHM = 6.5%
pedestal
55MeV gamma

31
Time MeasurementTime Measurement• Using only 12 PMTs around the
center
T : weighted mean of inner PMT timing after subtracting photon propagation time
Effective velocity 10cm/ns
Practical resolution by tXe – tsci
280ps
115ps
Intrinsic resolution by T-B analsysis

32
Position MeasurementPosition Measurement
• Using collimator run data,

33
Physics runPhysics run
• RD run gamma energy– Data : Xe self trigger threshold=3.5V – MC : RD event generation + event
overlaps + trigger simulation• Vertical scale is scaled assuming,
– Mu stop = 5e6– Calorimeter acceptance = 0.1– Calorimeter detection efficiency = 0.6

Problems found in 2007Problems found in 2007andand
solutions for 2008 runsolutions for 2008 run

35
FeedthruFeedthru• We could not apply required voltage on all PMTs at the beginning • We found that this had been caused by spark in the feedthru• Needed to prepare “new ones” for 2007 run
– Commercial products or hand made?

36
How did we make new ones?How did we make new ones?
Production procedure
•Fix pins in the holes and fill with silica
•Bake in argon atmosphere
•Cool down
Metal body
Glass insulator
Air
Xe
Wataru’s Design
No need to change connector
Replacement can be done quickly
Body made of insulator (not metal)

37
InstallationInstallation• Oct. 10-12: LXe recovery to 1000L Dewar
• Oct. 13-14: GXe recovery
• Oct. 15-16: Mounting new flanges & testing
– With flushing dry nitrogen gas in the cryostat
• Oct 17-19: evacuation
• Gas filling ~0.13MPa– Successfully took gas alpha data at 800, 900, 1000V– LED data
• Liquid transfer started at almost same time– Until the detector is cooled we continued LED and alp
ha DAQ– 21, 22, 23/Oct transfer speed 15~20 liter/hour– Completed early morning of 24/Oct
• 2 weeks interruption of DAQ

38
PMT status after replacing feedthruPMT status after replacing feedthru
• Stable operation after replacing feedthru
• LED intensity optimization– Better gain evaluation than
before

39
As a bonus…As a bonus…• Xenon recovered through purifier
– Practice to transfer the liquid to the dewar– Water contamination suppressed
• Cryostat was warmed up to ~220K– 1st experience of temperature cycle– Test of the gasket– RGA: I = 3.8x10⁻¹³A 5.7x10⁻⁷ mbarl/sec
132Xe++

40
Future plan (currently ongoing)Future plan (currently ongoing)
• Replacement during winter shutdown– 48 pin x 6 x 4– Need to change
connectors– Used in the small
prototype and PMT test chamber
welding
ceramic
Kyocera Ultra High Vacuum Feedthrough

41
Heat loadHeat load• Pressure is slowly increasing under normal operating condition.• Refrigerator cooling power: 200W• Expected redundant cooling power: ~100W
– Calculation based on LP modeling– PMT:37W (Vmean = 775V)– Conduction:64W
• Cable (50), Chimney (4.8), SI(3.1), Support(6.3)
• Heat income through Cu cooling pipes was not taken into account– Cu heat conduction: 390 W/m/K
• 10mm diam 1mmt pipe, 20cm• 390 x 135 (K) x 2.83x10⁻⁵/0.2 (m) = 7.4W• 6 pipes 44.4W• Cf. Steel heat conduction ~20W/m/K
• There seems to be other heat leak…– Larger than 50W– Super-insulator?
PMTCableChimneyRadiationSupportCu pipe?
?
Pipes
PMTs
Cables

42
LN2 cooling pipeLN2 cooling pipe
• Cu pipe feedthru SUS pipe feedthru

43
Cooling PowerCooling Power
PC150 Cooling power at PSI - 24 Aug.,2007
0
40
80
120
160
200
240
60 80 100 120 140 160 180
Temperature (K)
Hea
ter P
ower
(W)
LYBOLDT6000 6.5kW at 50HzOrifice: 3577.5K 0W 123K 100W143K 150W 155K 180WVac: ~10-2 Pa
165K
0704KEKCW701
0708PSI

44
Blow up of low temperature valveBlow up of low temperature valve• Low temperature valves blew up
– A few liters of liquid xenon was lost• Purifier cryostat was opened
– Misleading valve design– No documentation on the manual
• Piping was modified and no valve is in use now
PT
O-ring
collar
Cup nutPlug or shaft
Wilson Seal
Wilson SealAir
xenon
bellows
Liquid xenon

45
PMT Signal SplitterPMT Signal Splitter
• Spark in feedthru’s destroyed protection zener diodes on PMT splitter boards– base-line shift at splitter output– Signal was out of range of WFD
• Fixed by replacing all zener diodes
DRS
Trigger
PMTsplitter

46
Light YieldLight YieldDiscrepancy between Discrepancy between and and data data
• Energy scale discrepancy btw alpha and gamma– Too small light yield from events (~1/2)– Not due to magnetic field
• Confirmed by taking C-W data w/o COBRA field
• Purity seems goodImprovement and plateau of light yield of both gammas and alphas
• Have a look on WF

47
triplet= 22 ns
recomb= 45 ns
WaveformsWaveforms
= 21 ns
= 34 ns
! Careful treatment of electronics time constant is necessary
Xe
Xe X
e
Xe
Xe
Xe X
e
Xe
ee
ee
ee
A
Q
Q/A
Before purification 02.025.1/
/
AQ
AQ
was 1.93+/-0.02 in LP test
Electronegative impurity?
Oxygen??

48
Electronegative Impurity RemovalElectronegative Impurity Removal
• O2 getter cartridge– Developed for LAr use at CERN– be mounted at the exit MEG liquid-phase p
urifier with by-pass valves– Preparing an oxygen purity monitor also– will be ready at an early stage of 2008 run

49
Current Status and ScheduleCurrent Status and Schedule
• Xenon recovered to the 1000 liter dewar– Gas analysis will be done on site
• Cryostat is opened now– All PMTs and cables are checked– Replacing feedthru is in progress– LN2 cooling pipe modification
• Cryostat will be moved back to PiE5 at the end of March– Evacuation, liquid transfer, purification– Ready on 19/April– Schedule at http://meg.web.psi.ch/subprojects/install/
xenon.html