x-ray phase-contrast microscopy and...
TRANSCRIPT
X-ray phase-contrast microscopy and microtomography
S.C. Mayo, T.J. Davis, T.E. Gureyev, P.R. Miller, D. Paganin, A. Pogany, A.W. Stevenson, S.W. Wilkins
CSIRO Manufacturing and Infrastructure Technology, Private Bag 33,Clayton South, VIC 3169, Australia [email protected]
Abstract: In-line phase contrast enables weakly absorbing specimens to be imaged successfully with x-rays, and greatly enhances the visibility of fine scale structure in more strongly absorbing specimens. This type of phase contrast requires a spatially coherent beam, a condition that can be met by a microfocus x-ray source. We have developed an x-ray microscope, based on such a source, which is capable of high resolution phase-contrast imaging and tomography. Phase retrieval enables quantitative information to be recovered from phase-contrast microscope images of homogeneous samples of known composition and density, and improves the quality of tomographic reconstructions.
©2003 Optical Society of America
OCIS codes: (340.7460) X-ray microscopy; (100.5070) Phase retrieval
References and links 1. U. Bonse and M. Hart, “An x-ray interferometer,” Appl. Phys. Lett. 6, 155-157 (1965). 2. M. Ando and S. Hosoya, “An attempt at x-ray phase-contrast microscopy,” in Proc. 6th Intern. Conf. On X-
ray Optics and Microanalysis, G. Shinoda, K. Kohra and T. Ichinokawa Eds. (Univ. of Tokyo Press, Tokyo, 1972) pp. 63-68.
3. A. Momose, T.Takeda and Y. Itai, “Phase-contrast x-ray computed tomography for observing biological specimens and organic materials,” Rev. Sci. Instr. 66, 1434-1436 (1995).
4. Y. Kohmura, H. Takano, Y. Suzuki and T. Ishikawa, “Shearing x-ray interferometer with an X-ray prism and its improvement,”, Proc. 7th Intern. Conf. on X-ray Microscopy, J. Susini, D. Joyeux, F. Polack, Eds. (EDP Sciences, Les Ulis) pp. 571-574.
5. C. David, B. Nöhammer, H.H. Solak and E. Ziegler, “Hard x-ray shearing interferometer,” Proc. 7th Intern. Conf. on X-ray Microscopy, J. Susini, D. Joyeux, F. Polack, Eds. (EDP Sciences, Les Ulis) pp 595-598.
6. T. Wilhein et al, “Differential interference contrast x-ray microscopy with twin zone plates at ESRF beamline ID21,” Proc. 7th Intern. Conf. on X-ray Microscopy, J. Susini, D. Joyeux, F. Polack, Eds. (EDP Sciences, Les Ulis) pp 535-541.
7. G. Schmahl, D. Rudolph, G. Schneider, P. Guttmann and B. Niemann, “Phase contrast x-ray microscopy studies,” Optik, 97, 181-182 (1994).
8. Y. Kohmura, A. Takeuchi, H. Takano, Y. Suzuki and T. Ishikawa, “Zernike phase-contrast x-ray microscope with an x-ray refractive lens,” Proc. 7th Intern. Con.f. on X-ray Microscopy, J. Susini, D. Joyeux, F. Polack, Eds. (EDP Sciences, Les Ulis) pp 603-606.
9. J. R. Palmer and G. R. Morrison, “Differential phase-contrast imaging in the scanning transmission x-ray microscope,” in OSA Proc. On Short Wavelength Coherent Radiation: Generation and Applications, P.H. Buckbaum and N.M. Ceglio, eds., Vol. 11 of OSA Proceedings Series (Optical Society of America, Washington, D.C., 1991), pp. 141-145.
10. M. Feser, C. Jacobsen, P. Rehak and G. DeGeronimo, “Scanning transmission x-ray microscopy with a segmented detector,” Proc. 7th Intern. Con.f. on X-ray Microscopy, J. Susini, D. Joyeux, F. Polack, Eds. (EDP Sciences, Les Ulis) pp 529-534.
11. R.W. Gerchberg and W.O. Saxton, “A practical algorithm for the determination of phase from images and diffraction plane pictures,” Optik, 35, 237-246 (1972).
12. J. Miao, P. Charalambous, J. Kirz and D. Sayre, “Extending the methodology of x-ray crystallography to allow imaging of micrometre-sized non-crystalline specimens,” Nature, 400, 342-344 (1992).
(C) 2003 OSA 22 September 2003 / Vol. 11, No. 19 / OPTICS EXPRESS 2289#2790 - $15.00 US Received July 24, 2003; Revised September 10, 2003

13. M.R. Howells, et al., “X-ray microscopy by phase-retrieval methods at the Advanced Light Source,” Proc. 7th Intern. Conf. on X-ray Microscopy, J. Susini, D. Joyeux, F. Polack, Eds. (EDP Sciences, Les Ulis) pp 557-561.
14. Gabor, D., “A new microscopic principle,” Nature 161, 777-778 (1948) 15. C. Jacobsen, M. Howells, J. Kirz and S. Rothman, “X-ray holographic microscopy using photoresists,” J.
Opt. Soc. Am. A 7, 1847-1861 (1990). 16. N. Watanabe et al., “Optical Holography in the hard x-ray domain,” Proc. 7th Intern. Con.f. on X-ray
Microscopy, J. Susini, D. Joyeux, F. Polack, Eds. (EDP Sciences, Les Ulis) pp 551-556. 17. A. Snigirev, I. Snigireva, V. Kohn, S. Kuznetsov and I. Schelokov, “On the possibilities of x-ray phase
contrast microimaging by coherent high-energy synchrotron radiation,” Rev.Sci.Inst. 66, 5486-5492 (1995) 18. K.A. Nugent, T.E. Gureyev, D.J. Cookson, D. Paganin, and Z. Barnea, “Quantitative phase imaging using
hard X rays,” Phys. Rev. Lett.77, 2961-2964 (1996) 19. S.W. Wilkins, T.E. Gureyev, D. Gao, A. Pogany and A.W. Stevenson, “Phase-contrast imaging using
polychromatic hard x-rays,” Nature 384, 335-338 (1996) 20. P. Cloetens, R. Barrett, J. Baruchel, J.-P. Guigay, and M. Schlenker, “Phase objects in synchrotron radiation
hard X-ray imaging,” J.Phys. D: Appl. Phys. 29, 133-146 (1996) 21. P. Cloetens, W. Ludwig, J. Baruchel, D. Van Dyck, J. Van Landuyt, J.-P. Guigay, and M. Schlenker,
“Holotomography: Quantitative phase tomography with micrometre resolution using hard synchrotron radiation X-rays,” Appl. Phys. Lett. 75, 2912-2914 (1999)
22. H. Yoshimura, D. Shoutsu, T. Horikoshi, H. Chiba, S. Kumagai, K. Takahashi and T. Mitsui, “Application of SEM-modified x-ray microscope to entomology and histology, and effects of x-ray coherence in imaging,” J. Elect. Micros. 49, 621-628 (2000)
23. V.E. Cosslett and W.C. Nixon, W, X-ray Microscopy, (Cambridge Univ. Press, London,1960) 24. S.C. Mayo et al., “Quantitative x-ray projection microscopy: phase-contrast and multi-spectral imaging,” J.
Microscopy 207, 79-96 (2002). 25. J.M. Cowley, Diffraction Physics, 3rd revised edition, (North-Holland, Amsterdam, 1995). 26. J.C.H. Spence, Experimental High-resolution Electron Microscopy. 2nd edition, (Oxford Univ. Press: New
York, 1988). 27. T.E. Gureyev, S. Mayo, S.W. Wilkins, D. Paganin, and A.W. Stevenson, “Quantitative in-line phase-
contrast imaging with multienergy X-rays,” Phys. Rev. Lett. 86 (25), 5827-5830 (2001) 28. D Paganin, S. C Mayo, T. E Gureyev, P. R Miller and S. W Wilkins, “Simultaneous phase and amplitude
extraction from a single defocused image of a homogeneous object,” J. Microscopy, 206, 33-40 (2002) 29. T.E. Gureyev, “Composite techniques for phase retrieval in the Fresnel region,” Opt. Commun. 220, 49-58
(2003). 30. L.A. Feldkamp, L.C. Davis and J.W. Kress, “Practical cone-beam algorithm,” J. Opt. Soc. Am. A 1, 612-
619 (1984). 31. A.V. Bronnikov, “Reconstruction formulas in phase-contrast tomography,” Opt. Commun. 171, 239-244
(1999)
1. Introduction
Recent years have seen a growing interest in various forms of x-ray phase-contrast imaging. Conventional x-ray imaging relies on absorption contrast which is only effective in absorbing samples. Absorption contrast is also poor at revealing small high spatial frequency features where they occur in the presence of larger lower frequency features. By comparison, phase-contrast is often particularly sensitive to high spatial frequency features, giving an alternative view of the sample. It also enables weakly absorbing or non-absorbing samples to be imaged effectively.
Phase shifts imposed on an x-ray wavefront by a sample can be transformed into contrast, and hence measured or reconstructed indirectly by a number of methods. One of the older methods uses crystal interferometers of the type developed by Bonse and Hart [1]. The use of this method for phase contrast imaging was pioneered by Ando and coworkers [2] and has produced excellent phase imaging and tomography results [3]. More recently other interferometric methods have been developed including shearing interferometers [4,5] and twin zone plates [6]. Zernike methods, analogous to those used in light optics have also been developed with both diffractive [7] and refractive optics [8].
(C) 2003 OSA 22 September 2003 / Vol. 11, No. 19 / OPTICS EXPRESS 2290#2790 - $15.00 US Received July 24, 2003; Revised September 10, 2003
Scanning x-ray microscopes can be used with a segmented detector to generate phase (and other) contrast images from observed deflections in the beam. This was first explored by Palmer and Morrison [9] and subsequently by Feser and coworkers [10].
A major class of methods for extracting both phase and absorption information employ mathematical phase-retrieval techniques. Typically these extract such information from holographic or diffraction images of the sample. For high resolution imaging, methods have been developed based on oversampling of far-field diffraction images combined with Gerchberg-Saxton phase retrieval [11,12,13].
Alternative approaches, more suited to larger samples, are based on Gabor [14] holography. These include synchrotron-based methods using a pinhole or a Fresnel zone plate focus as a secondary source[15,16]. A simpler method, requiring no additional optics, is in-line phase-contrast imaging where the wave is allowed to propagate beyond the sample sufficiently for Fresnel diffraction to occur. This was proposed in the mid 90’s [17] and is used at synchrotrons and with laboratory microfocus sources [18-22].
At its simplest, the in-line phase contrast approach can be used to produce edge-enhanced images of the sample which are often very useful in themselves. However, to obtain quantitative information about the sample, or to exploit the greater contrast available in the holographic imaging regime, the ability to perform phase retrieval on the images becomes increasingly important. Phase retrieval enables the phase shift imposed on the wave by the sample (e.g. in the object plane) to be recovered from the diffracted intensity distribution in the image plane or planes.
In recent years we have been exploring the potential of inline phase contrast imaging using laboratory sources. This paper describes one such instrument, dubbed the x-ray ultra-microscope (XuM), which uses a point-projection geometry for x-ray imaging. The XuM is an attachment to an electron microscope, exploiting the fine focus of the microscope to generate a microfocus x-ray source. The use of an SEM as an x-ray source has a history going back over 50 years to early work by Cosslett and Nixon [23]. Here, however, we exploit the small source that can be produced with a modern SEM, to produce a spatially coherent x-ray beam suitable for generating phase-contrast images. This enhances the information content of images, and, together with phase retrieval, enables the extraction of quantitative information. When combined with a modern CCD detector system the result is a practical and versatile instrument well suited to imaging a wide range of samples. The ease of data acquisition, together with the imaging geometry also lend themselves to tomographic data collection. The use of phase-retrieval to improve the results of tomographic reconstruction will be described.
2. The X-ray Ultra-Microscope (XuM)
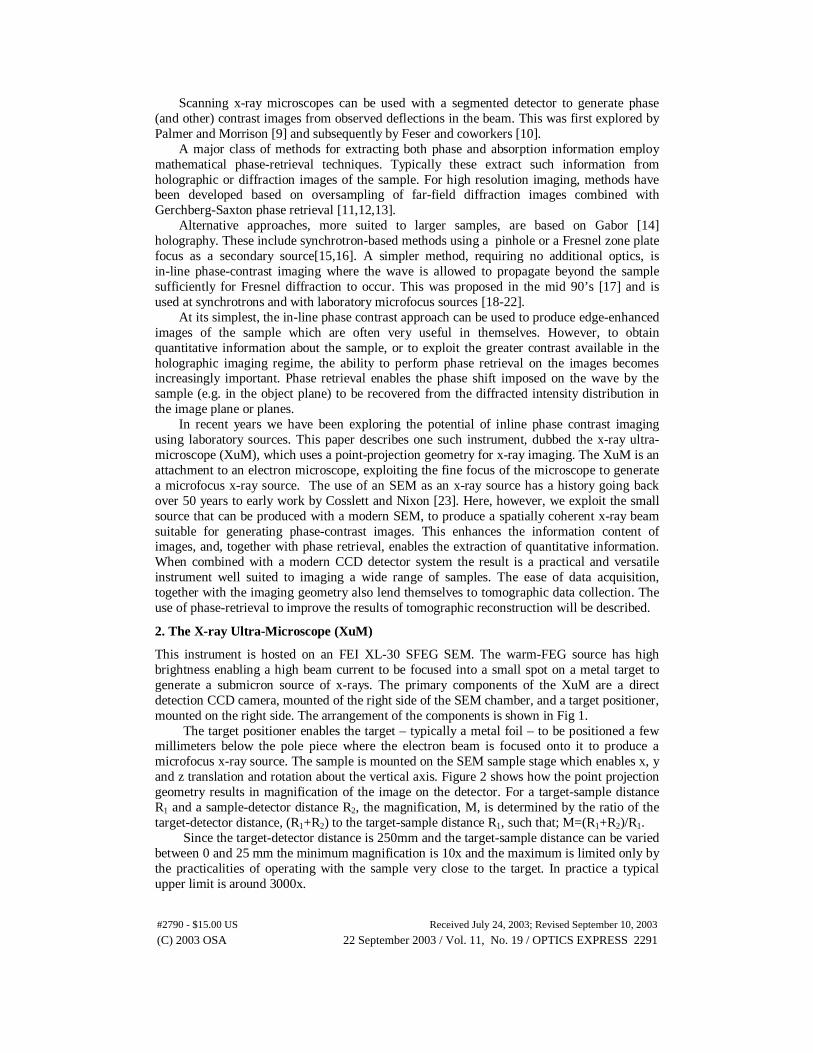
This instrument is hosted on an FEI XL-30 SFEG SEM. The warm-FEG source has high brightness enabling a high beam current to be focused into a small spot on a metal target to generate a submicron source of x-rays. The primary components of the XuM are a direct detection CCD camera, mounted of the right side of the SEM chamber, and a target positioner, mounted on the right side. The arrangement of the components is shown in Fig 1.
The target positioner enables the target – typically a metal foil – to be positioned a few millimeters below the pole piece where the electron beam is focused onto it to produce a microfocus x-ray source. The sample is mounted on the SEM sample stage which enables x, y and z translation and rotation about the vertical axis. Figure 2 shows how the point projection geometry results in magnification of the image on the detector. For a target-sample distance R1 and a sample-detector distance R2, the magnification, M, is determined by the ratio of the target-detector distance, (R1+R2) to the target-sample distance R1, such that; M=(R1+R2)/R1.
Since the target-detector distance is 250mm and the target-sample distance can be varied between 0 and 25 mm the minimum magnification is 10x and the maximum is limited only by the practicalities of operating with the sample very close to the target. In practice a typical upper limit is around 3000x.
(C) 2003 OSA 22 September 2003 / Vol. 11, No. 19 / OPTICS EXPRESS 2291#2790 - $15.00 US Received July 24, 2003; Revised September 10, 2003
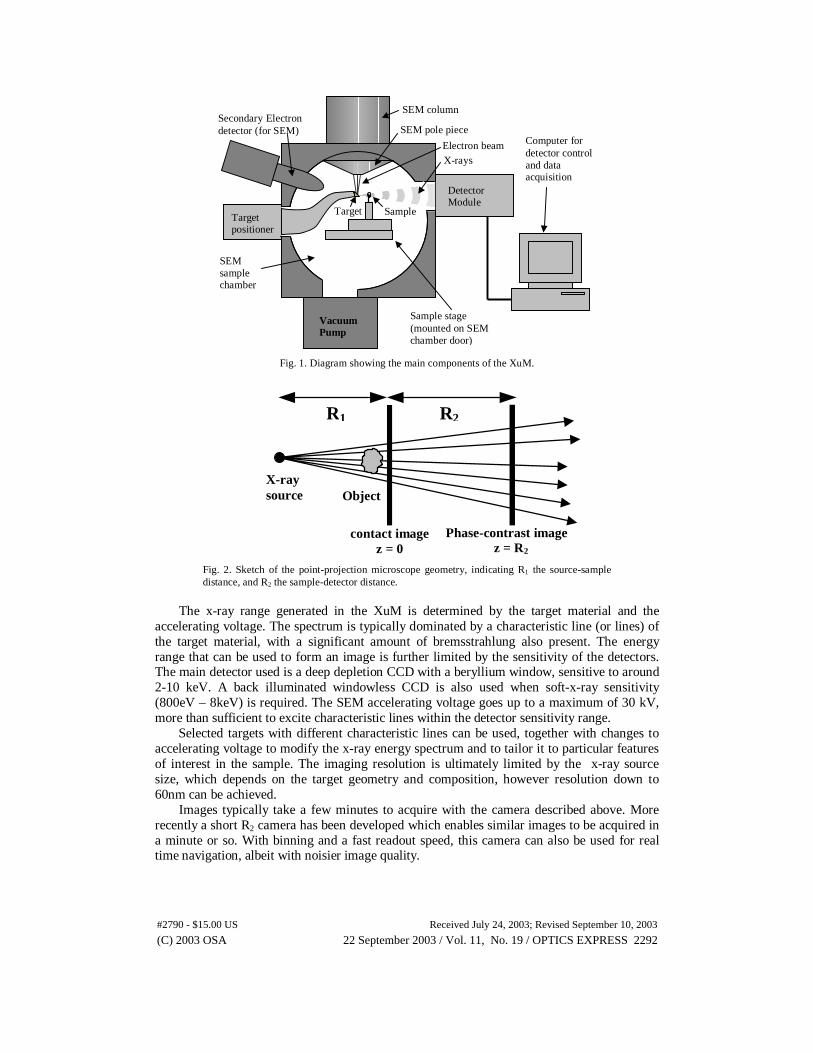
Fig. 1. Diagram showing the main components of the XuM.
Object X-ray source
Phase-contrast image z = R2
contact image z = 0
Fig. 2. Sketch of the point-projection microscope geometry, indicating R1 the source-sample distance, and R2 the sample-detector distance.
The x-ray range generated in the XuM is determined by the target material and the
accelerating voltage. The spectrum is typically dominated by a characteristic line (or lines) of the target material, with a significant amount of bremsstrahlung also present. The energy range that can be used to form an image is further limited by the sensitivity of the detectors. The main detector used is a deep depletion CCD with a beryllium window, sensitive to around 2-10 keV. A back illuminated windowless CCD is also used when soft-x-ray sensitivity (800eV – 8keV) is required. The SEM accelerating voltage goes up to a maximum of 30 kV, more than sufficient to excite characteristic lines within the detector sensitivity range.
Selected targets with different characteristic lines can be used, together with changes to accelerating voltage to modify the x-ray energy spectrum and to tailor it to particular features of interest in the sample. The imaging resolution is ultimately limited by the x-ray source size, which depends on the target geometry and composition, however resolution down to 60nm can be achieved.
Images typically take a few minutes to acquire with the camera described above. More recently a short R2 camera has been developed which enables similar images to be acquired in a minute or so. With binning and a fast readout speed, this camera can also be used for real time navigation, albeit with noisier image quality.
Sample stage (mounted on SEM chamber door)
Target positioner
Detector Module
Sample
Secondary Electron detector (for SEM) SEM pole piece
SEM sample chamber
SEM column
X-rays Electron beam
Target
Vacuum Pump
Computer for detector control and data acquisition
R1 R2
(C) 2003 OSA 22 September 2003 / Vol. 11, No. 19 / OPTICS EXPRESS 2292#2790 - $15.00 US Received July 24, 2003; Revised September 10, 2003

3. Phase contrast, phase retrieval and image processing
In its simplest form, in-line phase-contrast imaging provides images of samples in which edges and boundaries are enhanced by near-field Fresnel diffraction. For a sufficiently small source and a high resolution detector this type of contrast is in fact unavoidable, although the nature of the contrast is changed substantially by modifying the imaging conditions. This is in contrast to lens based x-ray microscopy systems which produce pure absorption images unless specifically modified to give phase contrast [7,8].
Such edge-enhanced images may often be sufficient in themselves for observing features of interest in the sample. If we consider a wavefront propagating along z, then for a pure phase object the near field image is (to a good approximation) the Laplacian (in x and y) of the phase shift imposed on the wavefront by the sample. For samples which also show absorption contrast the situation is a little more complicated, although the high spatial frequency features are still much enhanced by phase contrast. Subtle features involving small but abrupt changes in the sample’s projected density are typically very clearly visible, making the technique ideal for detecting cracks, voids and surface texture.
Figure 3 shows examples where the raw phase contrast image gives useful information about the sample. The first is of a dust mite, and clearly shows the grooves on its back despite the small size of these features compared to the overall thickness of the mite. These features would be very difficult to see in an image relying on conventional absorption contrast. The second image is of a 1mm diameter multilayer sphere composed of concentric shells of different materials. Phase contrast makes a crack in the outermost 30µm thick shell clearly visible.
Fig. 3. Left: Phase contrast images of a dust mite. The grooved texture of the mite’s back is clearly visible due to phase contrast, despite the small size of these grooves compared to the overall thickness of the mite (10 min. exposure, R1=1.9mm, R1+R2=250mm). Right: Part of a 1mm diameter multilayer composed of concentric shells of different thicknesses. showing a fine crack in the outer shell (10 min exposure, R1=3.6mm, R1+R2 = 250mm).
3.1 Contrast formation
While such near field images are often useful in their raw form, recovering quantitative information from phase contrast data requires a fuller understanding of the image formation process. Initially we consider the case of a plane wave, U0, of wavelength λ, propagating along the z direction and which encounters the sample at z = 0. The wave is modified by the sample such that the wave, U(x,y), on exiting the sample is given by
(C) 2003 OSA 22 September 2003 / Vol. 11, No. 19 / OPTICS EXPRESS 2293#2790 - $15.00 US Received July 24, 2003; Revised September 10, 2003

φ−µ= i
02
~
eUU , where ∫ δλπ−=φ dz)z,y,x(
2)y,x( , and dz)z,y,x(
4)y,x(~
∫βλπ−=µ ,
where β(x,y,z) and δ(x,y,z) are the absorption and phase-shifting components, respectively, of the sample’s spatially varying refractive index n, (n = 1 - δ - iβ). The intensity and phase of the wave is further modified by Fresnel diffraction as it propagates along z.
A full account of the imaging theory relevant to the XuM is given in [24]. For a weak object, however, the image plane intensity at a distance z from the object can be expressed in Fourier space by the following equation:
χ−χΦ+δ≅ cos)v,u(m2sin)v,u(2)v,u()v,u(Iz ,
where χ = πλz(u2+v2), and Iz(u,v), Φ, and m are the Fourier transforms of the image intensity
I(x,y), the object plane phase φ(x,y), and µ�(x,y)/2, respectively. The Dirac δ(u,v) represents the directly transmitted beam and the following two terms the phase and amplitude contrast. These latter terms can be interpreted as linear filters which determine the transmission of spatial frequencies from the object plane to the Fresnel diffraction pattern in the image plane.
Figure 4 shows the phase and absorption contrast functions represented in terms of the dimensionless coordinate u√(zλ), where u is the spatial frequency, and z the propagation distance (for a parallel beam). This coordinate effectively represents the imaging regime, with the near-field region being near the origin. The images in the lower part of the figure show how the appearance of the propagated image changes as this coordinate increases for the peak spatial frequency of the original image. In physical terms this implies either increasing propagation distance or increasing the wavelength.
In considering a spherical wave geometry such as found in the XuM, it can be shown [25] that the same equations can be used to describe the intensity in the image plane (allowing for image magnification). In this case however, the parallel beam propagation distance, z is replaced by an effective propagation distance zeff, such that
21
21eff RR
RRz
+= .
Since for the XuM typically, R1<<R2, the effective propagation distance is approximately equal to R1, the source-sample distance.
Note that the absorption contrast transfer function is at a maximum for u√(zλ) = 0 , which corresponds to a contact image (z = 0). The phase contrast transfer function is zero for a contact image and, for a fixed wavelength and spatial frequency, increases to its first maximum as propagation distance increases. As propagation distance increases further the contrast oscillates between positive and negative values according to the contrast transfer function. For an image containing many spatial frequencies, diffraction features begin to appear in imaging conditions where, χ > π (remembering that χ = πλz(u2+v2)) for the higher spatial frequencies (u,v) in the image as shown by the image sequence in Fig. 4.
The condition χ ≤ π corresponds to the ‘direct-imaging’ regime. The object is directly recognizable from the image at least in outline if not in full quantitative detail. χ = π (the first zero of the phase CTF), i.e. u2+v2 = 1/(λz), can be taken as a measure of the direct-imaging resolution; it corresponds to the ‘point resolution’ defined for electron microscopy [26].
The XuM is most often used in or close to the direct imaging regime, however, this is not always the case. Figure 5 shows an image of 9 µm latex spheres acquired with an x-ray spectrum dominated by the Cu L lines (930 eV). An alternative back-illuminated CCD detector, sensitive to x-rays below 1keV, was used to acquire this image. This image is clearly an intermediate field image showing numerous diffraction orders.
(C) 2003 OSA 22 September 2003 / Vol. 11, No. 19 / OPTICS EXPRESS 2294#2790 - $15.00 US Received July 24, 2003; Revised September 10, 2003

Fig. 4. Absorption and phase contrast transfer functions represented as a function of the dimensionless coordinate u√(zλ),where u is the spatial frequency, λ is the wavelength and z the propagation distance (for a parallel beam). The images of the face show the effect on a pure phase object of imaging conditions at the corresponding position on the x axis u√(λz) of the contrast transfer function, where in this case, u is the peak spatial frequency in the image.
3.2 Phase retrieval
The previous section showed how the image plane intensity can be determined by the phase and amplitude of the wavefront in the object plane. To obtain quantitative information about the sample, however, it is necessary to determine the properties of the object plane from the image plane intensity alone, since the phase in the image plane cannot be measured in the XuM. This is a manifestation of the phase problem which appears in many areas of imaging and diffraction science. Many different approaches can be used to solve this problem, and the method chosen often depends on the imaging regime in which data have been acquired. Gerchberg-Saxton [11] type iterative methods are often used for far-field images, and transport of intensity (TIE) approaches in the near-field (see Section 3.4.2 of Ref. [24]).
As seen in the contrast transfer functions, the contrast for certain spatial frequencies will be zero in any single intermediate field image. Hence, images acquired under different conditions (either by altering the propagation distance [21] or wavelength [27]) are often used to ensure all spatial frequencies are accurately retrieved. Although we have worked on multi-
1.0
0.5
-0.5
-1.0
0.5 1.5
Con
tras
t T
rans
fer
1.0 0.0 λ z u
Absorption CTF
Phase CTF
TIE
1st maximum in phase contrast
Near-field imaging regime
X-ray Ultra-Microscopy
Near-field phase-contrast regime – “direct imaging”
Intermediate-field phase contrast regime – “holographic”
(C) 2003 OSA 22 September 2003 / Vol. 11, No. 19 / OPTICS EXPRESS 2295#2790 - $15.00 US Received July 24, 2003; Revised September 10, 2003

image algorithms for phase retrieval, we have found it more convenient to be able to do phase retrieval from a single image.
Fig. 5. Diffraction dominated image of 9µm latex spheres acquired using a Cu target at 5keV accelerating voltage to excite the Cu L lines at ~930eV. This was acquired using a different detector to the usual XuM detector, which was sensitive to x-rays below 1keV, R1=1.4mm, R1+R2=250mm, 10 min exposure.
Paganin et al. have developed a single image phase-retrieval algorithm applicable to near-
field images of homogeneous samples of known composition and density acquired with monochromatic radiation [28]. It takes the TIE as its starting point:
)z,(Iz
2))z,()z,(I( ⊥⊥⊥⊥⊥ ∂
∂λπ−=φ∇•∇ rrr .
Here the rate of change in the intensity with propagation distance (along z) is defined in terms of the intensity I(r⊥ ,z), and phase φ(r⊥ ,z), where r⊥ is the vector in the x-y plane.
For a homogeneous sample the variation of phase and intensity in the object plane can both be expressed in terms of the variations of thickness of the sample T(r⊥ ) in the plane perpendicular to the propagation direction:
)(T0eI)0,(I ⊥µ−
⊥ = rr , and )(T2
)0,( ⊥⊥ δλπ−=φ rr ,
where the linear attenuation coefficient, µ = 4πβ/λ. For a near field image we can approximate ∂I(r⊥ ,z)/∂z in the TIE by the finite difference
between the object and image plane. By using this assumption, together with the expressions for image plane phase and intensity we can rewrite the TIE in terms of sample thickness as
0
2)(T22
I
)Rz,(Ie1
R ==
+∇
µδ
− ⊥µ−⊥
⊥rr ,
This equation can be conveniently solved for thickness and can be easily implemented with Fourier transforms. Once thickness is determined, phase and absorption can be readily calculated. Figure 6 shows an example of the use of this algorithm for phase retrieval of a puncture in a polymer film.
(C) 2003 OSA 22 September 2003 / Vol. 11, No. 19 / OPTICS EXPRESS 2296#2790 - $15.00 US Received July 24, 2003; Revised September 10, 2003
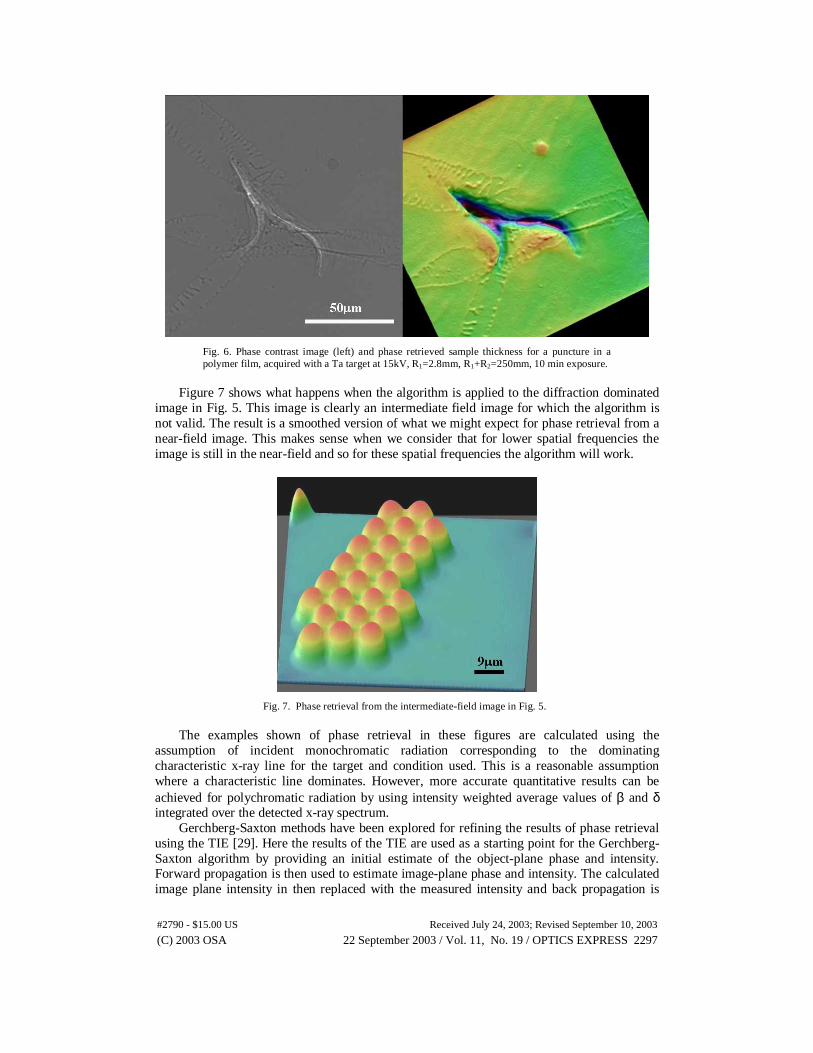
Fig. 6. Phase contrast image (left) and phase retrieved sample thickness for a puncture in a polymer film, acquired with a Ta target at 15kV, R1=2.8mm, R1+R2=250mm, 10 min exposure.
Figure 7 shows what happens when the algorithm is applied to the diffraction dominated
image in Fig. 5. This image is clearly an intermediate field image for which the algorithm is not valid. The result is a smoothed version of what we might expect for phase retrieval from a near-field image. This makes sense when we consider that for lower spatial frequencies the image is still in the near-field and so for these spatial frequencies the algorithm will work.
Fig. 7. Phase retrieval from the intermediate-field image in Fig. 5.
The examples shown of phase retrieval in these figures are calculated using the
assumption of incident monochromatic radiation corresponding to the dominating characteristic x-ray line for the target and condition used. This is a reasonable assumption where a characteristic line dominates. However, more accurate quantitative results can be achieved for polychromatic radiation by using intensity weighted average values of β and δ integrated over the detected x-ray spectrum.
Gerchberg-Saxton methods have been explored for refining the results of phase retrieval using the TIE [29]. Here the results of the TIE are used as a starting point for the Gerchberg-Saxton algorithm by providing an initial estimate of the object-plane phase and intensity. Forward propagation is then used to estimate image-plane phase and intensity. The calculated image plane intensity in then replaced with the measured intensity and back propagation is
(C) 2003 OSA 22 September 2003 / Vol. 11, No. 19 / OPTICS EXPRESS 2297#2790 - $15.00 US Received July 24, 2003; Revised September 10, 2003

used to get an improved estimate of phase and intensity in the object plane. A “homogeneous object” constraint can be used to modify these estimated values since both phase and intensity are mathematically related to object thickness. This cycle is then repeated, propagating back and forth between object and image planes applying constraints each time to iteratively improve the estimate of phase and intensity. This produces a sharper final phase retrieval (See Fig. 8)
3.3 Further image processing
When acquiring very high resolution data at high magnification, the size and shape of the x-ray source begins to affect the image resolution and appearance. At lower magnifications the resolution is limited by the phase-contrast image formation mechanism rather than the x-ray source size. However, to obtain the highest possible resolution the image must be acquired in the near-field regime, which in the XuM corresponds to high magnification. Under these conditions the source size limits resolution and the asymmetric shape of the source has a marked effect on the image.
The size and shape of the x-ray source are determined by the size of the electron focus, the geometry of the target and the interaction of the electrons with the target materials. The interaction of electrons with solids is reasonably well understood and can be modeled numerically. We have used this approach to simulate the intensity distribution of the XuM x-ray source for a range of targets and conditions. Deconvolution can then be used to remove the effect of the source size and shape from the image.
Fig. 8. Image sequence showing image-processing steps applied to image of a semiconductor test device, from left to right: raw image; deconvolution of source shape; single image phase retrieval; and, Gerchberg-Saxton refinement. R1 = 80µm, R1+R2 = 250mm, 20min exposure.
Figure 8 shows a sequence of image processing steps including deconvolution. The
leftmost image is the raw image of a semiconductor device, which shows a distinct asymmetry in the phase contrast fringes around the square features to the right of the image. The dark fringe is more clearly visible at the top of each square and the white fringe at the bottom, due to the asymmetry of the x-ray source. The next image shows the effect of deconvolution of the source intensity distribution from the image. The fringes around the squares are now much more symmetric and look much more like the classic phase contrast fringes we might expect from such a feature.
Subsequent images show the results of applying the TIE-based single-image phase retrieval algorithm followed by Gerchberg-Saxton refinement. Both “single image” variations of these algorithms are valid for a homogeneous sample, however they can also be applied to
Deconvolve TIE phase retrieval
Gerchberg-Saxton refinement
1µm
(C) 2003 OSA 22 September 2003 / Vol. 11, No. 19 / OPTICS EXPRESS 2298#2790 - $15.00 US Received July 24, 2003; Revised September 10, 2003
the special case of one material embedded in a parallel sided slab of another material, which is satisfied for much of this semiconductor device sample.
4. Microtomography
The geometry of the XuM is well suited to tomography, particularly since the SEM sample stage on which the sample is mounted incorporates a vertical rotation axis. This enables the acquisition of a tomographic dataset by acquiring a series of images with the sample rotated by a small angles between each successive image. The cone-beam geometry means that an appropriate cone-beam algorithm such as that of Feldkamp et al. [30] must be used for reconstruction of the data. This and other cone-beam algorithms are not exact for a circular orbit, however, for a narrow cone angle (e.g. the angle subtended by the source at the detector) good results can be achieved.
For a good quality reconstruction the sample must be rotated through a total of at least 180° plus the cone angle. Ideally, to reconstruct an image of size n x n pixels πn orientations are required over 360°. We have acquired datasets over this angular range with a step-size of 0.25° or 0.5° between images. Although images were acquired at 1300x1300 pixel resolution they were binned to lower resolution for tomographic reconstruction, due to the limited number of views acquired.
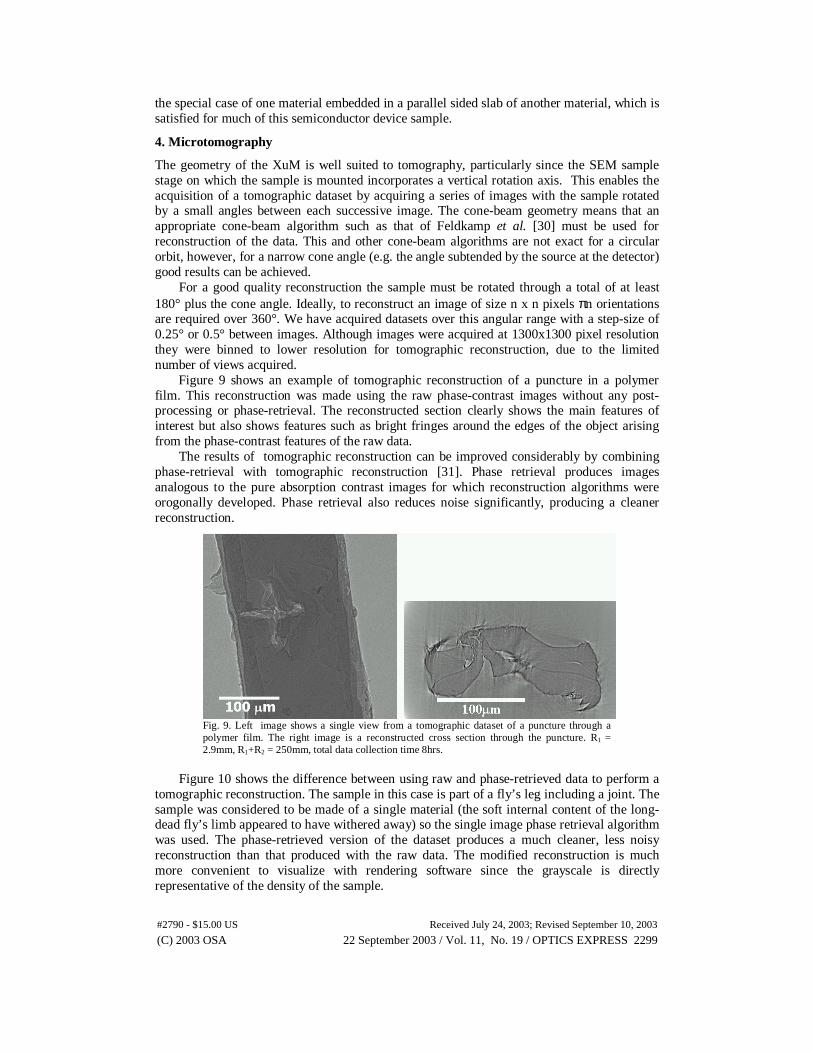
Figure 9 shows an example of tomographic reconstruction of a puncture in a polymer film. This reconstruction was made using the raw phase-contrast images without any post-processing or phase-retrieval. The reconstructed section clearly shows the main features of interest but also shows features such as bright fringes around the edges of the object arising from the phase-contrast features of the raw data.
The results of tomographic reconstruction can be improved considerably by combining phase-retrieval with tomographic reconstruction [31]. Phase retrieval produces images analogous to the pure absorption contrast images for which reconstruction algorithms were orogonally developed. Phase retrieval also reduces noise significantly, producing a cleaner reconstruction.
Fig. 9. Left image shows a single view from a tomographic dataset of a puncture through a polymer film. The right image is a reconstructed cross section through the puncture. R1 = 2.9mm, R1+R2 = 250mm, total data collection time 8hrs.
Figure 10 shows the difference between using raw and phase-retrieved data to perform a
tomographic reconstruction. The sample in this case is part of a fly’s leg including a joint. The sample was considered to be made of a single material (the soft internal content of the long-dead fly’s limb appeared to have withered away) so the single image phase retrieval algorithm was used. The phase-retrieved version of the dataset produces a much cleaner, less noisy reconstruction than that produced with the raw data. The modified reconstruction is much more convenient to visualize with rendering software since the grayscale is directly representative of the density of the sample.
(C) 2003 OSA 22 September 2003 / Vol. 11, No. 19 / OPTICS EXPRESS 2299#2790 - $15.00 US Received July 24, 2003; Revised September 10, 2003

Fig. 10. Upper images show a dataset view and a reconstructed cross section of part of a fly’s leg including a joint. Lower images show a phase retrieved version of the same view and a reconstructed section produced using the modified data (R1 = 6.9mm, R1+R2 = 250mm, total data collection time 10hrs).
Fig. 11. (1.5 MB movie) Movie of the reconstructed volume of the fly’s leg joint shown in Fig. 10.
A movie of a rendered version of this dataset is shown in Fig. 11. Details which show up
well in the phase-contrast raw image of the fly-leg—such as the grooves on the large spines
(C) 2003 OSA 22 September 2003 / Vol. 11, No. 19 / OPTICS EXPRESS 2300#2790 - $15.00 US Received July 24, 2003; Revised September 10, 2003

near the joint—are less apparent in the phase-retrieved image. Nonetheless the information is still there and contributes to the reconstruction For instance, the same grooves are clearly visible in the 3D rendered movie of the reconstructed volume.
Despite the fact that the single-image algorithm is strictly only valid for a homogeneous sample, it can still work surprisingly well to improve tomographic reconstructions for non-homogeneous objects. The single image phase retrieval algorithm uses the ratio of the phase shifting and absorption components of the refractive index as a critical parameter. If an incorrect value for this ratio is used the phase retrieved image will not be quantitative and may still show traces of diffraction fringes, or else be over smoothed. For a multi-component sample the ratio will only be correct for one of the components and features composed of other materials may show these artifacts.
Fig. 12. Upper: raw (left) and phase retrieved (right) images of a sliver of thin card. Lower: reconstructed cross section from phase retrieved data (R1 = 5.1mm, R1+R2 = 250mm, total data collection time 8hrs).
The extent to which such artifacts present a problem depends on the variation of this ratio
between different materials in the sample. However, in practice phase retrieval can still qualitatively improve the tomographic reconstruction of a non-homogeneous sample. Figure 12 shows an example of phase retrieval used in tomographic reconstruction with a paper sample containing dense filler material in addition to the paper fibers. The reconstructed data shows the two types of material clearly at different grayscales with no significant fringing or
(C) 2003 OSA 22 September 2003 / Vol. 11, No. 19 / OPTICS EXPRESS 2301#2790 - $15.00 US Received July 24, 2003; Revised September 10, 2003
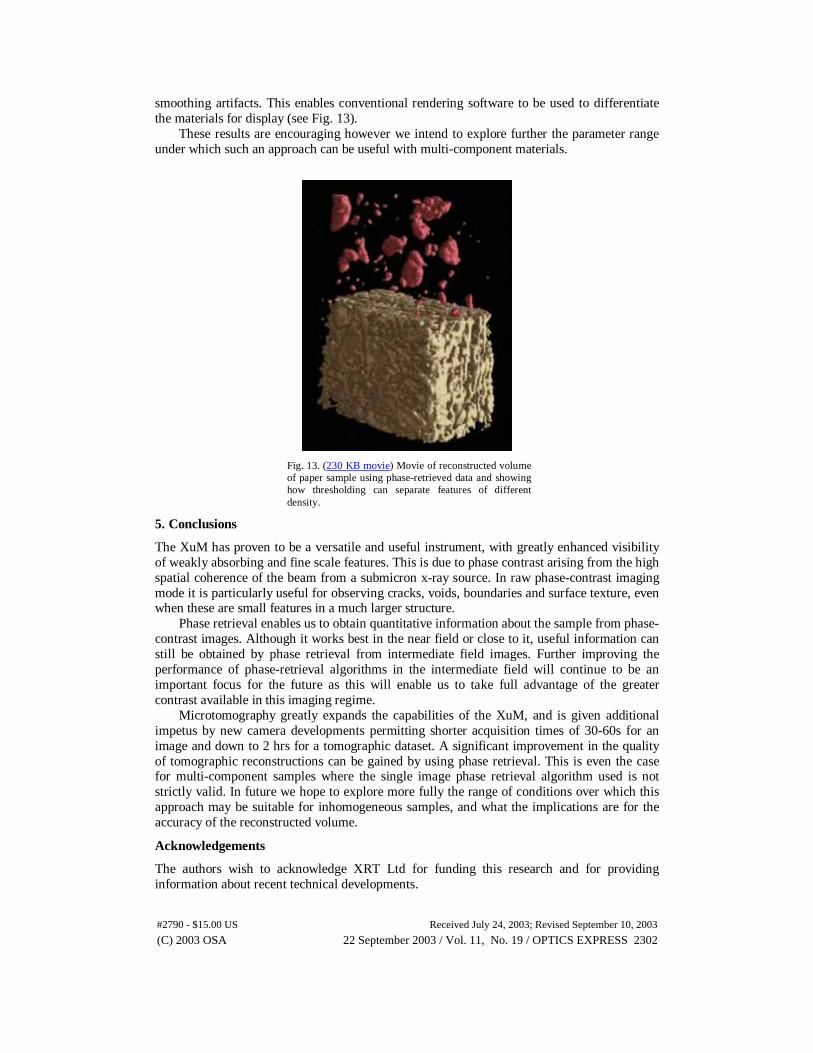
smoothing artifacts. This enables conventional rendering software to be used to differentiate the materials for display (see Fig. 13).
These results are encouraging however we intend to explore further the parameter range under which such an approach can be useful with multi-component materials.
Fig. 13. (230 KB movie) Movie of reconstructed volume of paper sample using phase-retrieved data and showing how thresholding can separate features of different density.
5. Conclusions
The XuM has proven to be a versatile and useful instrument, with greatly enhanced visibility of weakly absorbing and fine scale features. This is due to phase contrast arising from the high spatial coherence of the beam from a submicron x-ray source. In raw phase-contrast imaging mode it is particularly useful for observing cracks, voids, boundaries and surface texture, even when these are small features in a much larger structure.
Phase retrieval enables us to obtain quantitative information about the sample from phase-contrast images. Although it works best in the near field or close to it, useful information can still be obtained by phase retrieval from intermediate field images. Further improving the performance of phase-retrieval algorithms in the intermediate field will continue to be an important focus for the future as this will enable us to take full advantage of the greater contrast available in this imaging regime.
Microtomography greatly expands the capabilities of the XuM, and is given additional impetus by new camera developments permitting shorter acquisition times of 30-60s for an image and down to 2 hrs for a tomographic dataset. A significant improvement in the quality of tomographic reconstructions can be gained by using phase retrieval. This is even the case for multi-component samples where the single image phase retrieval algorithm used is not strictly valid. In future we hope to explore more fully the range of conditions over which this approach may be suitable for inhomogeneous samples, and what the implications are for the accuracy of the reconstructed volume.
Acknowledgements
The authors wish to acknowledge XRT Ltd for funding this research and for providing information about recent technical developments.
(C) 2003 OSA 22 September 2003 / Vol. 11, No. 19 / OPTICS EXPRESS 2302#2790 - $15.00 US Received July 24, 2003; Revised September 10, 2003