wyoming - wyoleg.gov · casper belenda wilson thermopolis legislative mandate to submit a final...
TRANSCRIPT

WYOMING State Board of Education Hathaway Building, 2nd Floor
2300 Capitol Avenue
Cheyenne, Wyoming 82002-0050 (307) 777-6213 • (307) 777-6234 FAX
GERALD REICHARDT Chair, Wheatland
RON MICHELI
Vice Chair, Fort Bridger
PETE GOSAR
Treasurer, Laramie
MATT GARLAND Gillette
SUE BELISH
Ranchester
KATHY COON Lusk
DANA MANN-TAVEGIA Osage
HUGH HAGEMAN
Fort Laramie
SCOTTY RATLIFF Riverton
WALT WILCOX Casper
BELENDA WILSON
Thermopolis
CINDY HILL State Superintendent
JOHN MASTERS
Board Liaison
CHELSIE BAILEY
Executive Assistant
MEMORANDUM TO: Dave Nelson, Legislative Service Office FROM: Paige Fenton Hughes, Coordinator DATE: October 15, 2012 SUBJECT: State Board of Education Reporting Requirements The Wyoming State Board of Education (SBE) is hereby submitting two reports in fulfillment of the requirements of the Wyoming Accountability in Education Act (WAEA). In accordance with WAEA, Sections 5 (a) and (b), the SBE contracted with Dr. Michael D. Beck to prepare for and conduct a professional judgment panel (PJP) to determine overall school-level performance ratings. Dr. Beck’s preliminary report (included with this memo) details the process used to implement, to the extent possible, the phase I pilot accountability model. It was not anticipated that Dr. Beck would be responsible for developing the accountability model itself. There were some delays in receiving data, and inconsistencies in the data received from the Wyoming Department of Education (WDE) were not resolved prior to the panel meeting. Nevertheless, Dr. Beck and his partner, Sheila Potter, facilitated a process of determining performance indicators for achievement, college/career readiness, growth, and equity. Finally, those indicators were used to determine overall school-level performance ratings. A memo to the WDE from Dr. Beck on October 8, 2012 outlined the work of the PJP and included the final recommendations of the panel that the WDE needs to calculate the final school-level performance ratings. Those final determinations were reviewed, as part of
Dr. Beck’s draft report, and approved for submission to the LSO by the SBE during their October 9, 2012 teleconference. Dr. Beck is still awaiting the final school-level performance ratings from the WDE. It is not possible for Dr. Beck to fully complete his report without those final school-level performance ratings; therefore, the SBE is unable to fully comply with the legislative mandate to submit a final report by October, 15, 2012. However, the final written report, which the SBE will submit after Dr. Beck receives the final school-level performance ratings from WDE, will include a full set of business rules, a more comprehensive discussion of the implications of including other data (COMPASS, 9th grade completion rates, for example) in the model, and a comprehensive discussion of the final school-level performance ratings. Dr. Beck is prepared to present his final report in person at the November meeting of the Select Committee on Statewide Education Accountability. In accordance with WAEA Section 5 (c), the SBE reviewed a proposal developed by the WDE regarding the structure of a multi-tiered system of

support, interventions, and consequences. This proposal was presented to the SBE at the September 26, 2012 SBE work session, and changes to the proposal were again reviewed with the SBE during the October 9, 2012 teleconference. The SBE also reviewed the comments provided by the Ad Hoc Committee of the Advisory Committee to the Select Committee on Statewide Education Accountability. The SBE understands its responsibility to provide a report to the Legislative Service Office on this topic by October 15, 2012. Since the Ad Hoc committee is studying the closely related issue of capacity building in districts, and because there were changes suggested and questions remaining after the October 9 discussion, the SBE has acknowledged receipt of this WDE proposal and submits it to the LSO with a recommendation for continued collaborative study. You can reach me at 307.349.4506 or at [email protected] if you have questions or if you require further information.

Preliminary Report to the
Legislative Service Office
on behalf of the
Wyoming State Board of Education
Results of the State Professional Judgment Panel Meetings &
Recommendations on the State School Accountability Program
by
Michael D. Beck
15 October 2012

Results of the State Professional Judgment Panel Meetings & Recommendations on the State School
Accountability Program
Abstract
The Wyoming Professional Judgment Panel (PJP) met for three days in early October in Casper, Wyoming. The meeting had four objectives:
1. To recommend school standards for four Performance Indicators identified as critical components of school accountability;
2. To use these established Performance Indicator standards in a “body of work” approach to set recommended standards for all Wyoming school buildings;
3. To discuss and, as possible, suggest “business rules” to be used in analyzing the component data for the Performance Indicators and the overall school accountability system; and,
4. To review draft plans for an appeals process to be implemented in conjunction with the school accountability system.
At the completion of the meetings, the PJP had met each of the above objectives. They carried out the process of setting school performance standards for each of the Performance Indicators (PIs), used these results to recommend school performance levels, and reviewed and commented on both system business rules and a draft of the system appeals process.
Recommendations of the PJP for both the PIs and the School Performance Levels have been submitted to the Wyoming Department of Education (WDE) so that WDE can implement these cutscores in a statewide database of school–level PIs. Upon WDE’s completion of these analyses and related quality-control efforts, the State Board of Education will have a school-by-school listing of the accountability levels recommended by the PJP for this pilot year.
Page 1

Data Preparation
All school-based data analyses for the sessions were prepared by the Wyoming Department of Education (WDE) staff based on requests by Michael Beck, the consultant who was charged with facilitating the PJP session. Due to the tight time constraints for planning and carrying out the data analyses and delays in the processing of the required data, several generally minor inconsistencies and irregularities remained in the data at the time of the PJP sessions. These will be clarified and corrected, as necessary, during the process of generating the pilot accountability ratings based on the PJP’s work. In the case of the Equity PI, the facilitator made adjustments in the data provided by WDE to fine-tune these calculations; these adjustments were conveyed to WDE prior to the generation of the pilot school rankings.
Meeting Activities
The PJP sessions were held on 2-4 October 2012 at the University of Wyoming Outreach Center in Casper. Sessions were facilitated by Michael Beck and Sheila Potter, consultants engaged by the Wyoming State Board of Education to plan and conduct the PJP activities. A total of 26 PJP members participated in the sessions (24 were present for all three days, one for only Days 1 and 2, and one for only Day 3). Appendix A lists all PJP members who attended the sessions. Several observers attended the sessions, although they did not participate actively in either the discussions or committee’s judgment processes. PowerPoint slides used by the facilitators to lead the sessions are available on request; these are not appended to this report to reduce the size of the document.
Appendix B presents an outline of the agenda for the three-day session; this agenda was followed closely, although several specific discussions were conducted at somewhat different points in the proceedings. Most particular among the variations from the original agenda was the inclusion, at PJP request, of an opportunity for a third round of committee judgments for the cutscores for the PIs (see below).
The facilitators have conducted similar committee sessions in over a score of states for comparable purposes. They considered the PJP participation to be frank, open, and highly engaged. An effort was made to solicit views from all PJP members, to encourage interaction among the panelists, and to welcome disparate viewpoints. Opportunities were provided throughout
Page 2

for PJP members to seek clarification of unclear information or concepts. It is the opinion of the facilitators that panelists understood their task clearly and were very engaged in the task.
General Methodology & Procedures
PJP procedures were essentially a “standard-setting” process in which panelists attempt to determine a reasonable minimum “cutscore” that describes achievement of pre-established level of performance. In the case of the PJP, the process was a two-stage activity. First, panelists determined levels of accomplishment for each of the PIs. Then, these PIs were considered in a “body of work” matrix in which panelists determined appropriate School Performance Levels for each possible combination of PI accomplishment.
Specifically, four PIs formed the foundation of the PJP deliberations:
ACHIEVEMENT: defined as the percent of students across grades and assessed content areas whose PAWS and PAWS-ALT scores were at the Proficient level (or higher). This index was composed of statewide test scores for Grades 3 through 8 and 11 for the content areas of Reading, Mathematics, and Science. Reading and Mathematics tests are administered at each of the above grades; Science tests are administered only at Grades 4, 8, and 11. Grade 11 PAWS and PAWS-ALT scores were included under this PI although this grade will be dropped from the state’s testing program in the 2012-13 school year. Fundamentally, the decision was based on the desire to include the Achievement PI for high schools and the facilitators’ view that ACT scores are more appropriately considered a “college and career readiness” metric than an achievement metric.
EQUITY: defined as the percent by which the proportion of students in the PAWS/PAWS-ALT performance level of Below Basic was reduced between 2010-11 and 2011-12. That is, by what percent was the school able to reduce the proportion of students whose PAWS scores were Below Basic? This metric can, of course, be negative – indicating that the school had a higher proportion of such students in the most-recent year compared with the prior year.
Page 3

COLLEGE & CAREER READINESS (or READINESS): This PI, which applied only to schools housing high-school students, was composed of two metrics: (1) the percent of students who received a high school diploma within four years of entry into the school, and (2) the percent of students whose composite scores on the ACT EXPLORE and ACT Grade 11 assessments met the ACT-determined College Readiness Benchmark. This latter index was based on the students’ scores across the four assessed ACT content areas – English, mathematics, reading, and science. The ACT College Readiness Benchmarks, explained elsewhere, are empirically determined probabilities that a student will be able to do acceptable college-level work.
GROWTH: defined as the “median growth percentile” in Reading and Mathematics across all students in the school. The arithmetical calculation of this index is discussed in detail in the report of the WDE consultant for determining this metric (see Domingue, 2012). However, essentially the Growth PI is determined by calculating each student’s change in achievement from year to year and comparing this change/growth to that shown by all other students in the state whose initial achievement was at the same level. If a student “grew” from year to year at the exact rate as did others whose pretest score was at the same level, he/she would receive a Growth Percentile of 50. Students who grew at a rate less than that of their pretest peers would receive Percentiles below 50; those whose Reading or Mathematics growth rate exceed those who began at the same level would receive Growth Percentiles above 50. These individual-student percentiles are then arrayed across all students in the school, and the school receives and overall Median Growth Percentile. This is the school’s Growth PI. So, for example, a student may receive a Growth Percentile of 75 in 2011-2012 in Reading, indicating the student is at the 75th percentile of performance when compared with all other Wyoming students in the same comparison group based on prior years' performance. Changes in each student’s Growth Percentile over time are one indication of how well the student is performing when compared with students across the state who have a similar achievement profile. The Median Growth Percentile (MGP) is the indicator of how well each school is performing based on how well students in the school are achieving on the PAWS Reading and Mathematics tests.
Note that all PI metrics were defined on a school level. That is, the PIs
Page 4
were calculated across all grades served by the school. For example, a school building serving students in Grades 3-5 would have an Achievement PI composed of PAWS and PAWS-ALT data for Reading and Mathematics in Grades 3, 4, and 5 and Science data for Grade 4. The school accountability ratings, based on the School Performance Levels determined by the PJP, were grounded on all of the schools in the state, regardless of grade composition. It is important to note, however, that because of the nature of the PIs, some schools do not have data for each PI. For example, a school housing students at Grades K-6 will not have a CCR/Readiness PI, as data for this PI are available only for high schools. Similarly, a school housing only Grades 9-12 will not have a Growth PI, as only one year of PAWS data are available for such schools, making a “growth” determination impossible.
PJP panelists individually made three independent rounds of judgments of the minimum cutscores for Meets the Target and Exceeds the Target for each of the 5 Indicators (4 PIs, with CCR having 2 parts). Following the first and second rounds of judgments, panelists were shown (anonymously) the comparable judgments made by their fellow panelists and extensive interaction among the panelists was encouraged. Panelists were encouraged to offer comments on why they made their judgments, ask questions about the process or the underlying data, and explore the implications of their recommendations. “Impact data,” describing the general statewide implications of the interim judgments were also provided following each round of judgments for each PI.
The initial plan for the meetings was for the PJP to carry out two rounds of these judgments, with the final round serving as their recommendation (not averaging or combining the two rounds). However, following extensive discussions of the second round of judgments and the statewide implications of these recommendations, several members of the panel requested the opportunity to conduct an additional round of judgments. No panelist disagreed with this request, so a third round was carried out. The majority of PJP members made minimal changes between their 2nd and 3rd/final round of recommendations (the median number of changes on the 8 PI categories was 2), although several members changed their judgments for multiple PIs. As Appendix C illustrates, the median PJP cutscore recommendation changed between the final two rounds minimally except for the Meets the Target cut for Growth, which increased from 40 to 50.
Page 5

PJP Results & Recommendations for the Performance Indicators (PIs)
Appendix C summarizes the three rounds of judgments in terms of the median recommendation by PI. As these summaries illustrate, the median PI recommendations changed across rounds of ratings. However, these changes were generally small. Over rounds, there was a slight tendency for PJP median recommended cutscores to increase, both for Meets the Target and Exceeds the Target.
To summarize the PI judgments of the PJP, they recommended: - for Achievement, that schools must have 75% of their students at or above Proficient on PAWS or PAWS-ALT in order to be classified as Meeting the Target, and 87% at or above Proficient to be classified as Exceeds the Target;
- for Equity, that schools must have reduced their proportion of Below Basic students between 2011 and 2012 by 6% to Meet the Target, and by 20% to be classified as Exceeding the Target;
- for CCR, that schools must graduate at least 85% of their high school students within four years OR must have at least 20% of their students achieve the ACT Composite Benchmark to Meet the Target, and must attain BOTH of these criteria to be classified as Exceeding the Target;
- for Growth, that schools must attain a median growth percentile of 50 to Meet the Target, and a median growth percentile of 60 to Exceed the Target.
Appendix D presents a graphic display by PI the final-round recommendations of the panel. These graphs show the separation of the Meets the Target and Exceeds the Target judgments. Appendix E presents frequency distributions by cutscore, by PI, by round of judgments, by PI along with summary data for each set of recommendations.
Page 6
PJP Results & Recommendations for the School Performance Levels
Panelists had the opportunity to discuss the final PI judgments prior to making their School Performance Level recommendations. As with the PIs, multiple rounds of judgments were involved in the process. In advance of making the School Performance Level judgments, the PJP discussed the operational meanings they would attach to the ratings – Exceeding Expectations, Meeting Expectations, Partially Meeting Expectations, and Not Meeting Expectations.
The activity of establishing standards for the School Performance Levels was essentially a “body of work” standard setting process, in which each panelist independently judged how a school with each possible combination of PI results should be classified. Panelists clearly understood that the process was an iterative one for which any individual panelist may disagree with his/her fellow judges as to the appropriate School Performance Level. Panelists independently made a determination for each possible PI outcome combination, with a total of 135 separate judgments being made. These initial judgments were summarized and presented to the panel, and selected combinations of PI outcomes on which there was significant panel divergence of opinion were discussed in the group. Following discussion, panelists made a revised, final set of recommendations. These final judgments are summarized in Appendix F. This appendix presents both the number of judges choosing each possible School Performance Level by PI standard, along with the median recommendation, indicated by the shaded boxes in Appendix F.
In Appendix F, it should be noted that the significant majority of Wyoming school buildings will have their accountability level determined by 3 of the 4 PIs. These include the 200+ buildings that do not house high school students; thus, no CCR data are available for these schools. Similarly, the performance levels of another 60+ schools will be determined by a different 3 of the 4 PIs; in those cases – schools that house only Grades 9-12 – no Growth PI data are available, as the Growth metric applies only to Grades 3 through 8. For only a small number (approximately 20) of Wyoming schools are data for all four of the PI metrics available. As noted in earlier WDE reports, schools that house only students below Grade 3 will have no School Performance Levels, as no statewide assessment data are available before Grade 3. Note in Appendix F that for very few of the 135 PI combinations did members of the PJP reach unanimous agreement on the most appropriate School Performance Level. This is both expected from, and a significant
Page 7
advantage of, a judgment-based standard-setting activity. Panelists individually, independently, and anonymously make determinations of the School Performance Level resulting from each combination of PIs. They use for making these judgments a shared understanding of the meaning of the PIs, the standards for those PIs, and the meaning of the School Performance Level labels. Panelists are free – encouraged – to “weight” the various PIs according to their personal views of the relative importance of these data in making their School Performance Level judgments Panelists clearly understood that the “PJP Recommendation” to be presented in this report to the Legislative Service Office would be the median of their judgments; such data are shown as the shaded boxes in Appendix F.
While there was certainly no PJP consensus in the judgments made about the full range of possible PI combinations, it is important to note that for nearly one-half of the judgments (63 of 135), at least 20 of the 25 panelists agreed on a single School Performance Level; in an additional 23 cases, there was in excess of 70% exact agreement (18 or more of the 25 judges) on the School Performance Level. These data are taken as a clear indication of panel convergence as to the most-appropriate classification of schools based on their attainment of the PIs.
Data in the final column of Appendix F indicate particular combinations of PI results that are “within error.” These indicated combinations are those for which the overall PJP recommendations as to School Performance Level were very close – within two judges. In these cases (12 of the 135 judgments), the median Performance Levels could have changed by a category had only one or two judges changed their recommendations in a particular direction. For example, on the first page of Appendix E, a combination of PIs shown is Achievement Below Target, Equity Meeting Target, and Growth Above/Exceeding Target. A total of 12 PJP members recommended that particular combination of PI results should result in a School Performance Level of “Meets Expectations;” the other 13 PJP members decided that the same combination of PI results “Partially Meets Expectations.” The median, of course, is Partially Meets Expectations. However, had one PJP member shifted his/her recommendation from Partially Meets to Meets Expectations, the median recommendation would have shifted. These “within error” indications are made not based on statistical significance analyses, merely on a judgmental decision that categories potentially affected by only one or two judges are “close.” It is important to note that these indications apply to fewer than 10% of all PJP recommendations.
Page 8

The data summarized in the above two paragraphs provide another indication of the soundness of the overall process. That is, a group of 25 disparately credentialed panelists independently assessed the relative importance of a large set of patterns of PI outcomes, weighting judgmentally the various patterns as they individually chose. Yet, even given these disparate viewpoints and perspectives, for the overwhelming proportion of PI outcomes, the panel reached very close agreement on the School Performance Levels most appropriately assigned to schools.
Pilot Results – Schools Falling into Each School Performance Level
On October 8, the PJP session facilitator provided to WDE the final cutscores for the PIs and the final PJP recommendations for School Performance Level for all outcomes in the matrix described above. WDE clarification questions were responded to on October 9. At the time this report was completed (October 15), WDE was still conducting analyses and quality-control procedures to determine the specific schools and related summary data that would describe the outcomes of the PJP recommendations. When these data are available, the Legislative Service Office and Wyoming State Board of Education will have the final data upon which to gauge the PJP recommendations and the impact of these recommendations on Wyoming schools during this pilot year.
It is anticipated that various interested parties – both policy groups and technical staff – will use the results of implementing the PJP recommendations in combination with other considerations to evaluate and consider small or more-significant revisions in the proposed accountability system or component data. The availability of these results several months in advance of “operational” implementation of the school accountability system provides an excellent opportunity for reflection, analysis, and – as indicated – adaptation of the implemented system before it is implemented in 2013.
Other PJP Session Activities: Appeals Process & Business Rules
In addition to carrying out the standard setting process outlined above, PJP members reviewed and reacted to a draft plan for an appeals process for the school accountability program. This draft plan was prepared by Paige Fenton Hughes, who facilitated the discussion of the draft appeals
Page 9
process. This draft process is presented, along with PJP comments and suggestions, in Appendix G.
Finally, panelists had an abbreviated opportunity to react to and suggest additional or revised elements of the “business rules” that guided their sessions. Business rules discussed with the PJP, along with their comments and suggestions on these, are presented in Appendix H.
Facilitator Evaluation of the Sessions
The facilitators have conducted similar sessions to these in over 20 states. We judge the quality of a session primarily on the basis of two elements:
1. Did the panelists have the opportunity to understand the process being used, to interact with their fellow judges in an open and honest manner, and to express their judgments freely and in an informed manner? and
2. Do the results of the process “make sense,” both internally and in terms of the constructs being judged?
In terms of both of these qualitative elements, the facilitators believe that the PJP provided the reflective, informed, knowledgeable, and candid reaction to the elements of the school accountability program that was desired at the time the committee was constituted. We are comfortable with the discussions that took place and with the recommendations that resulted from these deliberations. We recommend that the pilot year recommendations of the PJP be accepted and that a similar model of setting the school accountability standards be used when the operational system is established.
MDB – 10/12
Page 10

APPENDIX A:
Professional Judgment Panel Members Attending Meeting held October 2, 3, and 4, 2012, Casper, WY State Board of Education Sue Belish Walt Wilcox Kathy Coon Public School Teachers Paul Crips -- Carey Jr. High Leona Wunnenberg -- Jackson MS School Brent Daly --- Campbell County HS (attended Days 1 and 2) Kara Sweet -- Newcastle HS Michael Read -- Ft. Washakie HS Principal Elementary--Dr. Joseph Ingalls -- North Evanston Elementary JH/MS--Ken Griffith -- Guernsey-Sunrise HS--Darrin Peppard -- Rock Springs High School School District Superintendent Small District--Dr. Summer Stephens -- Weston # 7 Upton Medium District--M. Neil Terhune, Ed. D. -- Rawlins Large District--Donna Little-Kaumo --- Sweetwater #2 Green River Business & Community at-Large Robert Blaylock — Gillette (attended Day 3) Jill Bramlet -- Wheatland Parent Glen Kirkbride -- Burns Greg Legerski -- Pinedale School District Central Office John Metcalfe -- Lander Fremont #1 Mark Taylor -- Afton--Lincoln #2 Andrea Gilbert -- Buffalo--Johnson #1

Wyoming School District Board of Trustees Dr. Cristy Magagna-McBee -- Sweetwater #2 Linda S. Jennings -- Gillette Michael Hunsaker -- Lincoln #2 Wyoming Post-Secondary Institutions Kay Persichitte -- University of Wyoming Lona Tracy — Eastern Wyoming College

APPENDIX B:
AGENDA
Wyoming Professional Judgment Panel Meetings
Casper, WY --- 2 - 4 October 2012
DAY 1 (8:30 – 4:00)
A.M. - Orientation / Goals / Responsibilities
- What is “standard setting”? How this relates to PJP
- Overview of the 4 Performance Indicators (PIs)
Achievement, Equity, Readiness, and Growth
How each PI is operationally defined
How these lead to a School Accountability System
- Giving meaning to the Terminology of the standards
for PAWS, for the PIs, for the Accountability System
- Methodology used for setting standards for each PI
P.M. - Initial recommended standards for Achievement and Equity
- Initial recommended standards for Growth and Readiness
DAY 2 (8:30 – 4:00)
A.M. - Review of Day 1activities
- Summary of Initial Recommendations; state impact
- Discussion of Initial Recommendation among PJP
P.M. - Final recommendations for each PI
- Transforming PI standards into School Accountability

- Components of the system
- Melding PI standards into Accountability – “matrix”
- Making the Accountability Descriptors more concrete
DAY 3 (8:00 – 4:00)
A.M. - Review of final judgments of the panel on each PI
- Making School Performance Level judgments –
methodology & mechanics
- PJP Makes Initial Accountability Ratings for Schools
P.M. - Summary / Discussion of Initial Accountability Ratings
- Final School Performance Level recommendations
- Additional Issues: Reactions/suggestions on the PIs
Suggestions for an “appeals” process
Related “business rules” for the pilot
- Next steps in the process; Adjournment

Appendix C:
Summary of PJP Panel Members’ Recommendations by Round of Judgments by Performance Indicator
Performance Indicator Round 1 Median Round 2 Median Final Median
Target: Meets Exceeds Meets Exceeds Meets Exceeds
Achievement 75% 85% 75% 87% 75% 87%
Equity + 5% + 11% + 6% + 20% + 6% + 20%
CCR - % HS Graduates 80% 91% 85% * 85% *
ACT Benchmark 15% 25% 19% * 20% *
Growth (Mdn Percentile) 40 58 40 60 50 60
*During the PJP discussions of the Round 1 results, prior to making Round 2 judgments, panelists agreed to a process of jointly considering both elements of the CCR PI. This process is discussed in the body of the report. In order to Meet the Target, schools must reach one of the two CCR criteria; to Exceed the Target, schools much reach both CCR standards.

Appendix D:
Graphic Representation of Final Recommendations of PJP by Performance Indicator
0
5
10
15
20
'0-9 10-19 20-29 30-39 40-49 50-59 60-69 70-79 80-89 90-100
Final Recommendations - ACHIEVEMENT PI
Meets the Target Exceeds the Target
0
5
10
15
20
Final Recommendations - EQUITY PI
Meets the Target Exceeds the Target

Appendix D (cont.)
0
5
10
15
20
Final Recommendations - CCR / % H.S. GRADUATES PI
Meets the Target
0
2
4
6
8
10
12
14
Final Recommendations - CCR / % Students Meeting ACT
"Benchmark" PI
Meets the Target

Appendix D (cont.)
0
2
4
6
8
10
12
14
'1-10 11-20 21-30 31-40 41-50 51-60 61-70 71-80 81-90 91-100
Final Recommendations - GROWTH PI
Meets Target Exceeds Target

Appendix E:
Summary of Three Rounds of PJP Judgments of the
PI ACHIEVEMENT Metric
_____ Number of Judges by Round __________
% of Students with PAWS Round 1 Round 2 Round 3___
Scores at or above Proficient Meets Exceeds Meets Exceeds Meets Exceeds
0 – 9%
10 – 19%
20 – 29%
30 – 39%
40 – 49%
50 – 59% 1
60 – 69% 2
70 – 79% 17 1 15 15
80 – 89% 4 16 10 15 10 15
90 – 100% 6 10 10
Mean 73.8 83.2 76.0 87.6 76.1 87.3
Median 75 85 75 87 75 87

Appendix E (cont.)
Summary of Three Rounds of PJP Judgments of the
PI EQUITY Metric
Number of Judges by Round____________
% Reduction in the Proportion Round 1 Round 2 Round 3___
of Below-Basic Students Meets Exceeds Meets Exceeds Meets Exceeds
0 – 9% 19 7 17 1 17 1
10 – 19% 4 7 5 9 5 9
20 – 29% 1 9 2 9 2 9
30 – 39% 1 1 1 1
40 – 49% 1
50 – 59% 4 4
60 – 69% 1 1
70 – 79%
80 – 89%
90 – 100%
Mean 6.4 14.8 7.8 24.8 7.7 25.0
Median 5 11 6 20 6 20

Appendix E (cont.)
Summary of Three Rounds of PJP Judgments of the PI CCR - % HIGH SCHOOL GRADUATES Metric
Number of Judges by Round______
% of Students who Graduate Round 1 Round 2 Round 3
From H. S. in 4 Years Meets Exceeds Meets* Meets*
0 – 9%
10 – 19%
20 – 29%
30 – 39%
40 – 49%
50 – 59%
60 – 69% 1
70 – 79% 5 2 1
80 – 89% 14 6 17 18
90 – 100% 4 18 6 6
Mean 81.4 91.5 84.9 85.0
Median 80 91 85 85
* For Rounds 2 and the Final Recommendations, the PJP chose to recommend that Meet the Target would be defined as Meeting the Target of EITHER the % High School Graduates OR the % of Students who Reached the ACT Benchmark. To Exceed the Target, students had to Meet the Target in BOTH of the CCR Performance Indicators.

Appendix E (cont.)
Summary of Three Rounds of PJP Judgments of the
PI CCR – ACT BENCHMARK Metric
Number of Judges by Round___________
% of Students with ACT Round 1 Round 2 Round 3______
Scores Meeting Benchmark Meets Exceeds Meets* Meets* _____
0 – 9%
10 – 19% 15 1 13 12
20 – 29% 7 12 7 8
30 – 39% 1 7 4 4
40 – 49% 3 1 1
50 – 59%
60 – 69%
70 – 79% 1
80 – 89%
90 – 100% 1
Mean 19.5 30.3 20.2 20.1
Median 15 25 19 20
* For Rounds 2 and the Final Recommendations, the PJP chose to recommend that Meet the Target would be defined as Meeting the Target of EITHER the % High School Graduates OR the % of Students who Reached the ACT Benchmark. To Exceed the Target, students had to Meet the Target in BOTH of the CCR Performance Indicators.

Appendix E (cont.)
Summary of Three Rounds of PJP Judgments of the
PI GROWTH Metric
Number of Judges by Round____________
% of Students Growing as Round 1 Round 2 Round 3____
Much as their Peers Meets Exceeds Meets Exceeds Meets Exceeds
0 – 9%
10 – 19% 1
20 – 29% 2 1 1
30 – 39% 4 2 4 1 2
40 – 49% 13 1 10 2 7 2
50 – 59% 5 8 10 5 12 2
60 – 69% 11 16 3 20
70 – 79% 1 1
80 – 89% 1
90 – 100%
Mean 40.1 54.5 42.6 58.4 47.0 60.7
Median 40 58 40 60 50 60

Appendix F:
FINAL - PJP Judges' Recommended School Performance Levels
( No. judges = 25)
FINAL PANEL MEDIAN RECOMMENDATIONS ARE SHADED
DIRECTIONS: For each possible combination of school outcomes on the 4 Performance Indicators,
decide what overall School Performance Level you would assign to the school. Indicate your
judgment by marking X in the appropriate column for each row. Your judgments would apply to all
schools in Wyoming. Please judge each combination of PIs, even if such a combination seems unlikely.
Performance Indicator Standard ** School Performance Level Recommendation
Exceeding Meeting Partially Meeting Not Meeting Within
ACHIEVE EQUITY CCR GROWTH Expectations Expectations Expectations Expectations SKIPS "Error" *
(non-HS)
A A A 25
A A
M 24 1
A A B 20 5
A M
A 21 4
A M M 1 24
A M
B
15 10
A B A 22 3
A B
M
19 6
A B B 20 5
M A A 9 16
M A
M 2 23
M A B 16 9
M M
A 2 23
M M M 1 23 1
M M
B
10 15
M B A 21 4
M B
M
17 8
M B B 17 8
B A A 11 14 XX
B A M 9 16
B A
B
1 14 10
B M A 12 13 XX
B M
M
5 19 1
B M B 10 15
B B
A
16 9
B B M 9 16
B B B 25

(HS)
A A A 25
A A M 22 3
A A B
18 7
A M A 22 3
A M M 3 22
A M B 13 11 1 XX
A B A 3 19 3
A B M 22 3
A B B
19 6
Performance Indicator Standard ** School Performance Level Recommendation
Exeeding Meeting Partially Meeting Not Meeting Within
ACHIEVE EQUITY CCR GROWTH Expectations Expectations Expectations Expectations SKIPS "Error" *
M A A 17 8
M A M 2 23
M A B
9 16
M M A 4 21
M M M 1 24
M M B 7 18
M B A
23 2
M B M 19 6
M B B 1 19 5
B A A 1 18 6
B A M 14 10 1
B A B
2 13 10 XX
B M A 19 6
B M M 7 17 1
B M B 10 15
B B A
2 17 6
B B M 17 8
B B B 25
(K-12/7-12)
A A A A 25
A A A M 23 2
A A A B 5 17 3
A A M A 19 6
A A M M 3 22
A A M B
20 4 1
A A B A 18 7

A A B M
15 10
A A B B 3 21 1
A M A A 20 5
A M A M 7 18
A M A B 4 16 5
A M M A 4 21
A M M M 2 23
A M M B 1 17 7
A M B A
15 10
A M B M 14 11 XX
A M B B
1 23 1
A B A A 3 19 3
A B A M
19 6
A B A B 4 19 2
A B M A
21 4
A B M M 22 3
A B M B
2 21 2
A B B A 1 21 2
A B B M
1 19 4 1
A B B B 13 12 XX
M A A A 21 4
M A A M 4 21
M A A B 21 4
M A M A 2 23
M A M M 2 23
M A M B
18 7
M A B A 1 16 8
Performance Indicator Standard ** School Performance Level Recommendation
Exceeding Meeting Partially Meeting Not Meeting Within
ACHIEVE EQUITY CCR GROWTH Expectations Expectations Expectations Expectations SKIPS "Error" *
M A B M
15 10
M A B B 1 23 1
M M A A 2 23
M M A M 2 23
M M A B
18 7
M M M A 2 23
M M M M 1 24
M M M B 17 8
M M B A
15 9 1
M M B M 14 11 XX
M M B B
23 2
M B A A 21 3 1
M B A M
22 2 1

M B A B 10 15
M B M A
21 4
M B M M 21 4
M B M B
4 20 1
M B B A 1 22 2
M B B M
1 18 5 1
M B B B 12 13 XX
B A A A 22 3
B A A M
18 7
B A A B 3 22
B A M A
17 8
B A M M 15 10
B A M B
1 24
B A B A 1 20 4
B A B M
1 17 7
B A B B 9 16
B M A A
20 5
B M A M 13 12 XX
B M A B
1 22 2
B M M A 11 14 XX
B M M M
12 13 XX
B M M B 20 5
B M B A
1 18 6
B M B M 15 10
B M B B
9 16
B B A A 3 22
B B A M
2 22 1
B B A B 13 12 XX
B B M A
1 22 2
B B M M 22 3
B B M B
10 15
B B B A 9 16
B B B M
6 19
B B B B 25
* "Within Error" cells indicate those for which the School Performance Level median could have
shifted if 1 or 2 judges had changed their recommendations in a particular direction.
** For PIs: A = Above (Exeeds) Target, M = Meets Target; B = Below Target
Appendix G:
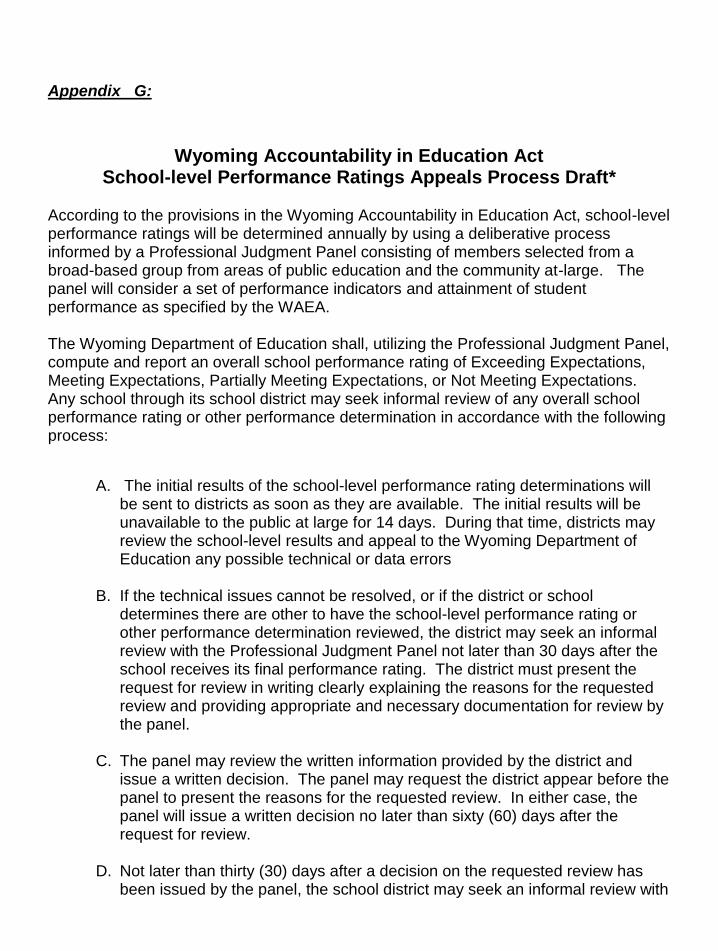
Wyoming Accountability in Education Act School-level Performance Ratings Appeals Process Draft*
According to the provisions in the Wyoming Accountability in Education Act, school-level performance ratings will be determined annually by using a deliberative process informed by a Professional Judgment Panel consisting of members selected from a broad-based group from areas of public education and the community at-large. The panel will consider a set of performance indicators and attainment of student performance as specified by the WAEA. The Wyoming Department of Education shall, utilizing the Professional Judgment Panel, compute and report an overall school performance rating of Exceeding Expectations, Meeting Expectations, Partially Meeting Expectations, or Not Meeting Expectations. Any school through its school district may seek informal review of any overall school performance rating or other performance determination in accordance with the following process:
A. The initial results of the school-level performance rating determinations will be sent to districts as soon as they are available. The initial results will be unavailable to the public at large for 14 days. During that time, districts may review the school-level results and appeal to the Wyoming Department of Education any possible technical or data errors
B. If the technical issues cannot be resolved, or if the district or school determines there are other to have the school-level performance rating or other performance determination reviewed, the district may seek an informal review with the Professional Judgment Panel not later than 30 days after the school receives its final performance rating. The district must present the request for review in writing clearly explaining the reasons for the requested review and providing appropriate and necessary documentation for review by the panel.
C. The panel may review the written information provided by the district and issue a written decision. The panel may request the district appear before the panel to present the reasons for the requested review. In either case, the panel will issue a written decision no later than sixty (60) days after the request for review.
D. Not later than thirty (30) days after a decision on the requested review has been issued by the panel, the school district may seek an informal review with

the Wyoming State Board of Education. The request for review must be submitted in writing clearly explaining the reasons for the requested review and providing all appropriate and necessary documentation and evidence.
E. The state board will review the written request for the school-level performance rating, and may make a written decision at that time. The state board may request the district present the reasons for the requested review along with all appropriate and necessary documentation to the board. In either case, the state board shall make a final determination as to the performance rating or other performance determination within sixty (60) days after the receipt of the written request for review.

Appendix H:
PJP School Accountability Business Rules Discussion Topics (PJP comments and reactions in blue)
General Discussion:
How to calculate the School Accountability? Should it be by predetermined weights or by “body of work” judgments? 3 or the 4 PIs are PAWS-based, and PAWS is going away. Issues?? What should be done about K-2 schools? Should there be a minimum “participation rate” in the assessments that yield a school performance level? The system today doesn’t have a “feeder” element. Should it? That is, who “owns” the student? The issue here is how to attach a student to a school (e.g., transfers, migrant students). How to deal with “minimum N” per PI or per school – what should these be? Minimum number of PI “scores” needed to yield a SPL? WY has very few (<10) schools that will have neither CCR nor Growth PIs, should these schools be rated on the basis of only 2 PIs. PAWS-ALT and PAWS-LEP – should they be included? If so, how? What else is needed??? Coomments by PJP:
Move away from reliance on only test scores and the PIs for school accountability. Include demonstrations of learning, portfolios, performance assessments.
The highest ACT score should be used for accountability, not simply the first ACT students take in Gr. 11. Don’t use COMPASS – a waste of time. May lead to equity issues because some LEAs will pay for retakes. In other districts, students will have to pay to replay.
Big issue on how schools housed on the same “campus” are considered for accountability. That is, in a small K-12 school, is this considered 1 school or 3 or . . . ? WDE response is that the determination is based on the state school funding categorization.

Appendix H (cont.):
Business Rules Discussion – Achievement Views on using PAWS Gr 11 here and ACT 11 under CCR? How to weight the relative contributions of PAWS scores (by Gr. and content). That is, should content areas be “weighted” somehow or essentially just count every set of data in the assessment program as is currently done? Minimum number of data points required for inclusion? The median number of sets of test data available for schools was 7 (of 17), but many schools have fewer – as few as 3. Is it acceptable to use a single year of data for this PI or should multiple years be included? Should PAWS Advanced levels of achievement be differentially weighted – not grouped with Proficient? Why should we strive for Advanced in the PIs if it makes no difference in the accountability model? Should each individual percent that comprises a PI be weighted by sample size? (E.g., Gr.4 Reading has 18 kids, Gr.5 Math has 22. Should the %s be weighted by these #s?) There should be a minimum sample size. As many get rewarded as punished by using small samples. Business Rules Discussion – Equity Does this metric address the topic of “equity”? What (other) data should be included as part of this PI – either alone or in combination? Title I, FRL program, ethnicity? Do you need something other than test scores? Should the PAWS-ELL results be included here (or in other PIs) somehow? What to do about schools with LOW %Below Basic percents? E.g. a school that has 0 in both years is counted for Pilot purposes as improving by 100%. While this may not be arithmetically correct, this prevents such schools as being considered “Below Target” on this PI. What to do with a school that goes from 0% to any non-zero amount? For Pilot purposes, we considered such schools as -1.00, but this doesn’t seem fair for

Appendix H (cont.):
schools that have only a minimum percent of such students in the second year. What makes better sense? Schools that keep kids out of Below Basic should be “Exceeds/Advanced.” Should this PI be based on Below Basic + Basic, since WY has so few kids Below Basic students on PAWS? Should movement from Basic to Proficient count as “Equity”? Business Rules Discussion – CCR Are you comfortable with the “combination” (compensatory for Meets Target and conjunctive for Exceeds Target) for combining the ACT and %HS Graduation numbers for Meet & Exceed Target? What (if any) other data are needed? Graduation Rate data – should 5-year, 4 ½-year data, GED results be included? If GED data are included, is it fair to attribute this to the student’s most-recent high school? What should be done with dual enrollment students? Include the Hathaway program data somehow. Use all 4 of the ACT Suite assessments when available? The legislation also includes “credits completed at the end of Gr. 9.” How should those data be included when they are available? For piloting, any school housing Gr. 12 students is considered a HS. Should schools that house, e.g. 7-9, have a HS/CCR component? Business Rules Discussion – Growth Minimum # data points needed? Use the maximum # years or same # years for all grades? That is, these data are based on the maximum number of years possible (e.g., Grades 3 and 4 data are used to project Gr. 5 growth data).

Appendix H (cont.):
Issues surrounding “recalibrating” these data annually – ensuring that schools as a whole/statewide never “improve” on this metric. If one school improves, another has to get worse as the data are essentially “local/state norm

25

Wyoming Accountability in Education Act
Progressive Multi-Tiered System of Support, Interventions and
Consequences Literacy and Numeracy Focus - Research-Based Practice
Wyoming Department of Education 2300 Capitol Avenue
2nd Floor Hathaway Building Cheyenne, WY 82002-0050
WDE DRAFT REVISED 10-02-2012

2
Index
State System of Support
Overview of the System of Support 3
Alignment to the WAEA Statute 7
Literacy and Numeracy Focus 11
Communications and Improvement Plans 15
Effective Practices Framework 19
School Effective Practices 20
Literacy Effective Practices 21
Numeracy Effective Practices 21
District Effective Practices 21
High Reliability Learning Organizations 22
Sharing Effective Practices 22
WDE Representatives 25
WDE Professional Development 27
Research-Based Resource Allocation 31
Interventions and Consequences 35
Accreditation 39
Future Direction 43

3
The purpose of the Wyoming System of Support is to promote effective practices at the classroom level to reach the goals and meet the statutory requirements of the Wyoming Accountability in Education Act (WAEA). These goals are to:
Become a national education leader among states;
Ensure all students leave Wyoming schools career or college ready;
Recognize student growth and increase the rate of that growth for all students;
Recognize student achievement and minimize achievement gaps;
Improve teacher, school and district leader quality;
Maximize efficiency of Wyoming education;
Increase credibility and support for Wyoming public schools.
In addition, the Wyoming System of Support will meet the support requirement of the federal Elementary and Secondary Education Act (ESEA). ESEA is commonly referred to as No Child Left Behind (NCLB). This requirement is stated as follows:
“Each State shall establish a statewide system of intensive and sustained support and improvement for local educational agencies and schools receiving funds under this part, in order to increase the opportunity for all students served by those agencies and schools to meet the State’s academic content standards and student academic achievement standards.”
The typical support model from other states is pictured to the left. The objective is to create a system of support that aligns all of the levels and ultimately impacts student achievement.
This model was adapted from the Idaho Statewide System of Support. While it an attractive graphic, the classroom or “instructional core” gets lost in all of the layers.
WDE DRAFT REVISED 9-24-2012
Typical State Support Model

4
WDE SUPPORT MODEL

5

6
7
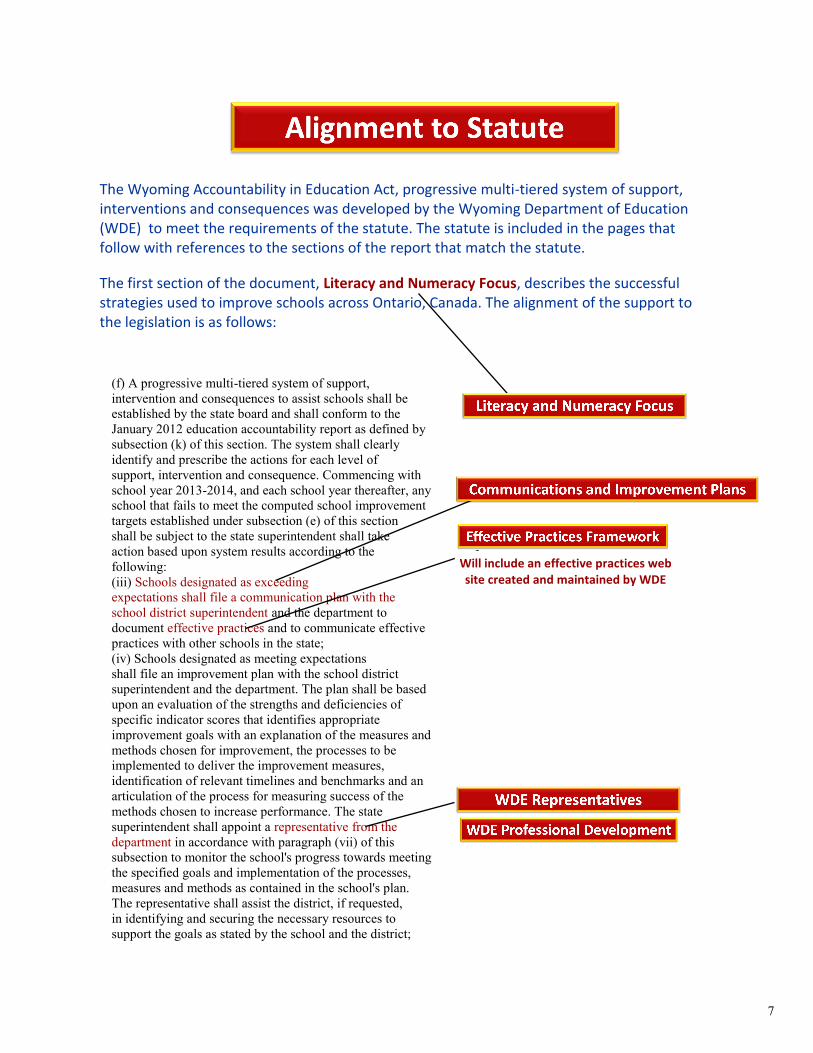
The Wyoming Accountability in Education Act, progressive multi-tiered system of support, interventions and consequences was developed by the Wyoming Department of Education (WDE) to meet the requirements of the statute. The statute is included in the pages that follow with references to the sections of the report that match the statute.
The first section of the document, Literacy and Numeracy Focus, describes the successful strategies used to improve schools across Ontario, Canada. The alignment of the support to the legislation is as follows:
(f) A progressive multi-tiered system of support,
intervention and consequences to assist schools shall be
established by the state board and shall conform to the
January 2012 education accountability report as defined by
subsection (k) of this section. The system shall clearly
identify and prescribe the actions for each level of
support, intervention and consequence. Commencing with
school year 2013-2014, and each school year thereafter, any
school that fails to meet the computed school improvement
targets established under subsection (e) of this section
shall be subject to the state superintendent shall take
action based upon system results according to the
following:
(iii) Schools designated as exceeding
expectations shall file a communication plan with the
school district superintendent and the department to
document effective practices and to communicate effective
practices with other schools in the state;
(iv) Schools designated as meeting expectations
shall file an improvement plan with the school district
superintendent and the department. The plan shall be based
upon an evaluation of the strengths and deficiencies of
specific indicator scores that identifies appropriate
improvement goals with an explanation of the measures and
methods chosen for improvement, the processes to be
implemented to deliver the improvement measures,
identification of relevant timelines and benchmarks and an
articulation of the process for measuring success of the
methods chosen to increase performance. The state
superintendent shall appoint a representative from the
department in accordance with paragraph (vii) of this
subsection to monitor the school's progress towards meeting
the specified goals and implementation of the processes,
measures and methods as contained in the school's plan.
The representative shall assist the district, if requested,
in identifying and securing the necessary resources to
support the goals as stated by the school and the district;
Will include an effective practices web site created and maintained by WDE
8
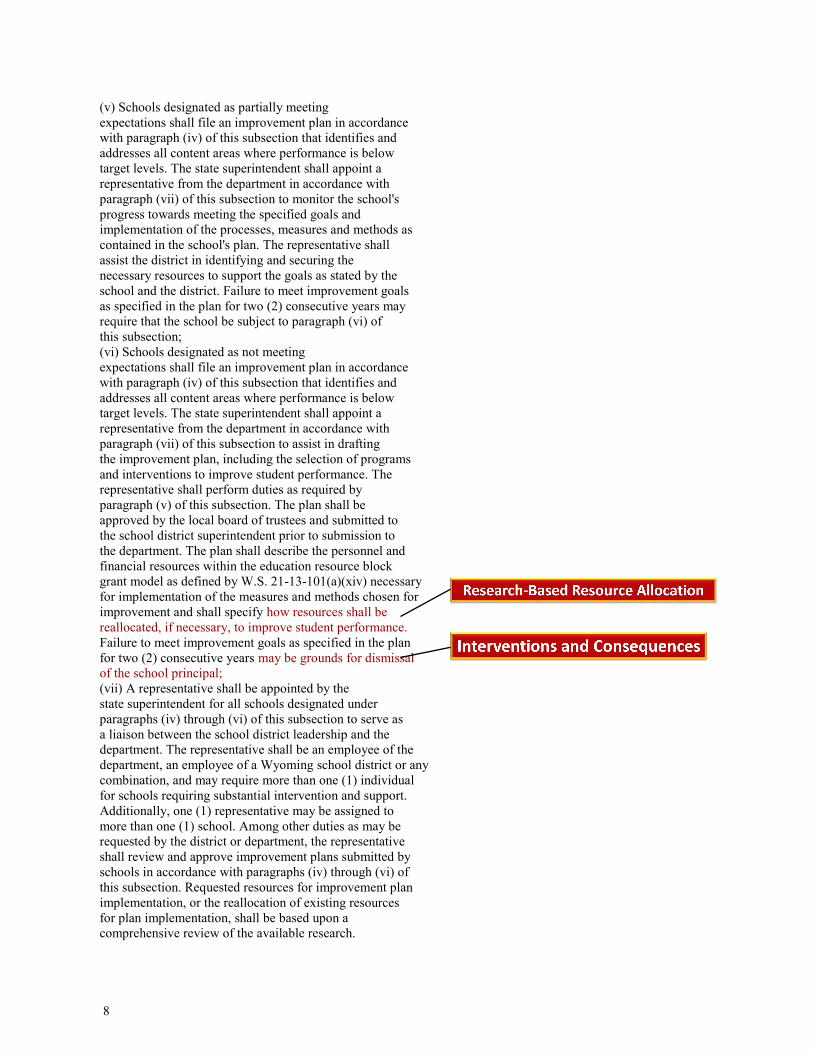
(v) Schools designated as partially meeting
expectations shall file an improvement plan in accordance
with paragraph (iv) of this subsection that identifies and
addresses all content areas where performance is below
target levels. The state superintendent shall appoint a
representative from the department in accordance with
paragraph (vii) of this subsection to monitor the school's
progress towards meeting the specified goals and
implementation of the processes, measures and methods as
contained in the school's plan. The representative shall
assist the district in identifying and securing the
necessary resources to support the goals as stated by the
school and the district. Failure to meet improvement goals
as specified in the plan for two (2) consecutive years may
require that the school be subject to paragraph (vi) of
this subsection;
(vi) Schools designated as not meeting
expectations shall file an improvement plan in accordance
with paragraph (iv) of this subsection that identifies and
addresses all content areas where performance is below
target levels. The state superintendent shall appoint a
representative from the department in accordance with
paragraph (vii) of this subsection to assist in drafting
the improvement plan, including the selection of programs
and interventions to improve student performance. The
representative shall perform duties as required by
paragraph (v) of this subsection. The plan shall be
approved by the local board of trustees and submitted to
the school district superintendent prior to submission to
the department. The plan shall describe the personnel and
financial resources within the education resource block
grant model as defined by W.S. 21-13-101(a)(xiv) necessary
for implementation of the measures and methods chosen for
improvement and shall specify how resources shall be
reallocated, if necessary, to improve student performance.
Failure to meet improvement goals as specified in the plan
for two (2) consecutive years may be grounds for dismissal
of the school principal;
(vii) A representative shall be appointed by the
state superintendent for all schools designated under
paragraphs (iv) through (vi) of this subsection to serve as
a liaison between the school district leadership and the
department. The representative shall be an employee of the
department, an employee of a Wyoming school district or any
combination, and may require more than one (1) individual
for schools requiring substantial intervention and support.
Additionally, one (1) representative may be assigned to
more than one (1) school. Among other duties as may be
requested by the district or department, the representative
shall review and approve improvement plans submitted by
schools in accordance with paragraphs (iv) through (vi) of
this subsection. Requested resources for improvement plan
implementation, or the reallocation of existing resources
for plan implementation, shall be based upon a
comprehensive review of the available research.

9
Justification for resource allocation or reallocation shall
be incorporated within the written improvement plan. The
representative shall possess expertise appropriate to
particular strategies incorporated within improvement plans
to enable necessary plan evaluation, and shall be
commensurate with the level of intervention, support and
consequences to be administered under this subsection. The
state superintendent shall annually report to the state
board on the progress of each school in meeting annual
goals and overall improvement targets, fully describing the
effectiveness and deficiencies of efforts to improve school
performance in performance categories prescribed by this
section;
(viii) To the extent permitted by law and rule
and regulation, plans submitted in compliance with
paragraphs (iii) through (vi) of this subsection shall
serve to comply with similar requirements administered by
the state superintendent and the department, and the state
board shall ensure the plans minimize submission of
duplicative information, material and the administrative
burdens placed upon schools. All plans submitted under
this subsection shall be made available for public
inspection through internet access as defined by W.S.
9-2-1035(a)(iii);
(iii)(ix) In addition to paragraph (ii) paragraphs
(iii) through (viii) of this subsection, the state board
shall administer this subsection as part of school district
accreditation required under W.S. 21-2-304(a)(ii), through
appropriate administrative action taken in accordance with
W.S. 21-2-304(b)(ii).
The methodology used by the WDE in development of this document was based on the support requirements for WAEA. However, the WDE believes the support methodology discussed in these documents will also meet the support requirements for NCLB. The NCLB support requirements are below:
SEC. 1117. SCHOOL SUPPORT AND RECOGNITION.
(a) SYSTEM FOR SUPPORT-
(1) IN GENERAL- Each State shall establish a statewide system of intensive and sustained support and improvement for local educational agencies and schools receiving funds under this part, in order to increase the opportunity for all students served by those agencies and schools to meet the State's academic content standards and student academic achievement standards.
(2) PRIORITIES- In carrying out this subsection, a State shall —
(A) first, provide support and assistance to local educational agencies with schools subject to corrective action under section 1116 and assist those schools, in accordance with section 1116(b)(11), for which a local educational agency has failed to carry out its responsibilities under paragraphs (7) and (8) of section 1116(b);
(B) second, provide support and assistance to other local educational agencies with schools identified as in need of improvement under section 1116(b); and
(C) third, provide support and assistance to other local educational agencies and schools participating under this part that need that support and assistance in order to achieve the purpose of this part.

10
(3) REGIONAL CENTERS- Such a statewide system shall, to the extent practicable, work with and receive support and assistance from the comprehensive regional technical assistance centers and the regional educational laboratories under section 941(h) of the Educational Research, Development, Dissemination, and Improvement Act of 1994, or other providers of technical assistance.
(4) STATEWIDE SYSTEM-
(A) In order to achieve the purpose described in paragraph (1), the statewide system shall include, at a minimum, the following approaches:
(i) Establishing school support teams in accordance with subparagraph (C) for assignment to, and working in, schools in the State that are described in paragraph (2).
(ii) Providing such support as the State educational agency determines necessary and available in order to ensure the effectiveness of such teams.
(iii) Designating and using distinguished teachers and principals who are chosen from schools served under this part that have been especially successful in improving academic achievement.
(iv) Devising additional approaches to providing the assistance described in paragraph (1), such as providing assistance through institutions of higher education and educational service agencies or other local consortia, and private providers of scientifically based technical assistance.
(B) PRIORITY- The State educational agency shall give priority to the approach described in clause (i) of subparagraph (A).
(5) SCHOOL SUPPORT TEAMS-
(A) COMPOSITION- Each school support team established under this section shall be composed of persons knowledgeable about scientifically based research and practice on teaching and learning and about successful schoolwide projects, school reform, and improving educational opportunities for low-achieving students, including —
(i) highly qualified or distinguished teachers and principals;
(ii) pupil services personnel;
(iii) parents;
(iv) representatives of institutions of higher education;
(v) representatives of regional educational laboratories or comprehensive regional technical assistance centers
(vi) representatives of outside consultant groups; or
(vii) other individuals as the State educational agency, in consultation with the local educational agency, may determine appropriate.
(B) FUNCTIONS- Each school support team assigned to a school under this section shall —
(i) review and analyze all facets of the school's operation, including the design and operation of the instructional program, and assist the school in developing recommendations for improving student performance in that school;
(ii) collaborate with parents and school staff and the local educational agency serving the school in the design, implementation, and monitoring of a plan that, if fully implemented, can reasonably be expected to improve student performance and help the school meet its goals for improvement, including adequate yearly progress under section 1111(b)(2)(B);
(iii) evaluate, at least semiannually, the effectiveness of school personnel assigned to the school, including identifying outstanding teachers and principals, and make findings and recommendations to the school, the local educational agency, and, where appropriate, the State educational agency; and
(iv) make additional recommendations as the school implements the plan described in clause (ii) to the local educational agency and the State educational agency concerning additional assistance that is needed by the school or the school support team.
(C) CONTINUATION OF ASSISTANCE- After one school year, from the beginning of the activities, such school support team, in consultation with the local educational agency, may recommend that the school support team continue to provide assistance to the school, or that the local educational agency or the State educational agency, as appropriate, take alternative actions with regard to the school.

11
School improvement is not a mystery. It requires a safe and orderly environment, high-yield instructional strategies, a coherent curriculum, ongoing assessment of student performance and students engaged in learning. If Wyoming schools are going to improve on standardized test scores in math, reading and writing, it seems apparent that literacy and numeracy should be the focus of schools. However, that focus is often lost among the various interests competing for the time and attention of leaders, teachers and students.
Students with high skills in reading, writing and math have the most options for college and careers. Meeting the Wyoming Accountability in Education Act (WAEA) goal #2 —Ensure all students leave Wyoming schools career or college ready —is dependent on skills in literacy and numeracy.
Literacy is the foundation for all other learning. Without literacy, students will find it impossible to learn in all subjects. Students who lack these basic skills, particularly in literacy, are more likely to become discouraged and drop out of school.
The Ontario, Canada school system moved from stagnation to world leadership since 2003 due to an education renewal strategy that included a province-wide focus on literacy and numeracy. The Ontario system provides an example of whole system reform that can be modeled by Wyoming.
Michael Fullan, Professor Emeritus of the Ontario Institute for Studies in Education at the University of Toronto, is a worldwide authority on education reform. Fullan advises policymakers and local leaders around the world. In collaboration with government leaders, Fullan designed the renewal strategy for the Ontario school system. The WDE leadership and staff has relied on Fullans’ written and video resources as well as one personal conversation in the development of this approach.
In What America Can Learn from Ontario’s Education Success, Fullan attributes Ontarios’ success to doing five things in concert – focusing, building relationships, being persistent, developing capacity and spreading quality implementation.
According to Fullan, the Ontario government and school system committed to long-term goals. The government established a two-way partnership and collaboration between stakeholders and provided significant autonomy to school districts to reach the goals.
Ongoing, non-judgmental systems of teacher capacity building were developed by establishing transparent results and practices, not through rewards and punishment. Finally, the Ministry of Education (State Department of Education) guided local school districts to develop a collaborative, professional environment and acted as a clearinghouse for
innovation and best practices.
Michael Fullan, International Education Reform Authority,
University of Toronto

12
What America Can Learn From
Ontario's Education Success By Michael Fullan
In the last decade, the Canadian province dramatically improved its education system to become one of the best in the world. Its innovative strategy can provide a blueprint for U.S. reform.
In 2006, Ontario Premier Dalton McGuinty plays a game of hopscotch with elementary school students in Toronto /Reuters
Ontario is Canada's largest province, home to over 13 million people and a public education system with roughly 2 million students, 120,000 educators, and 5,000 schools. As recently as 2002, this system was stagnant by virtually any measure of performance. In October 2003, a new provincial government (Canada has no federal agency or jurisdiction in education) was elected with a mandate and commitment to transform it.
Improvements began within a year, and now some eight years later its 900 high schools have shown an increase in graduation rates from 68 percent (2003-04) to 82 percent (2010-11), while reading, writing, and math results have gone up 15 percentage points across its 4,000 elementary schools since 2003. Morale of teachers and principals is stronger (fewer teachers leave the profession in the first few years), and achievement gaps have been substantially reduced for low-income students, the children of recent immigrants, and special education students (although not for "First Nation" students). In short, the entire system has dramatically improved.

13
These accomplishments have not gone unnoticed outside Canada. The McKinsey group, the Organization for Economic Co-operation and Development in Paris, the National Center on Education and the Economy in Washington, D.C., and Harvard's Program on Education Policy and Governance have all done recent case studies on Ontario's education system, concluding that it is one of the most improved and highest performing in the world. They especially admire the impressive, innovative strategy that got the results. So, what's the secret?
It's simple. Ontario public schools follow a model embraced by top-performing hospitals, businesses, and organizations worldwide. Specifically, they do five things in concert -- focus, build relationships, persist, develop capacity, and spread quality implementation.
In practice, this meant refocusing the way Ontario schools delivered education. Like many school systems, Ontario had too many "top" priorities. The Ministry of Education selected three--literacy, math, and high school graduation--with a commitment to raise the bar for all students and close achievement gaps between all groups. There are other goals, of course, but these three are non-negotiable and take precedence because they leverage so many other learning goals.
Focus and persistence ensure that these priorities are not going to be discarded along the way. The history of education innovations has generated a "this too shall pass" mindset among teachers. One of our colleagues calls this phenomenon "the law of innovation fatigue." Any attempt to create a high-leverage priority (like the three adopted by Ontario) requires that the education system as a whole commits to them long-term.
But priorities don't mean anything if you don't develop the relationships necessary to enact them. The provincial government set out to develop a strong sense of two-way partnerships and collaboration, especially between administrators and teachers, and in concert with teachers' unions. This required providing significant leeway to individual school districts to experiment with novel approaches to reaching the province's three main educational goals, and focusing significant reform efforts on investments in staffing and teacher development.
By focusing on teacher development, Ontario was also able to raise teacher accountability. Decades of experience have taught Canadian educators that you can't get greater accountability through direct measures of rewards and punishments. Instead, what Ontario did was to establish transparency of results and practice (anyone can find out what any school's results are, and what they are doing to get those results) while combining this with what we call non-judgmentalism. This latter policy means that if a teacher is struggling, administrators and peers will step in to help her get better. (There are, however, steps that can be taken if a situation consistently fails to improve.)

14
The final element of the strategy involves identifying and spreading quality practices. Most education systems are loosely coupled to say the least -- behind the classroom door, teachers are islands unto themselves. In such isolated systems, two problems emerge. The first is that good ideas do not get around; they remain trapped in individual classrooms or schools. The other problem is that poor teaching can remain entrenched, because good practices are not being disseminated. A big part of the Ontario strategy has been to break down the walls of the classroom, the school, and even the district by increasing communication, cataloging and sharing best practices, and fostering a culture of teamwork. To that end, the Ministry of Education guides local school districts in developing more collaborative professional environments, while also acting as a clearinghouse for innovation and best practices.
The net result of these five forces is an education system that has the characteristics of a high-performing organization: relentless focus, interactive pressure and support, a preoccupation with results and how to improve them, a culture of mutual commitment, and what we call collaborative competition, where there is no limit to what is being attempted. The fact that this strategy develops leaders at all levels -- leaders who focus on results, as they help develop other leaders -- means that sustainability is built into the whole enterprise. Ontario isn't perfect. But it proves that large-scale reform can be accomplished in school systems in fairly short periods of time.
This article available online at:
http://www.theatlantic.com/national/archive/2012/05/what-america-can-learn-from-ontarios-education-success/256654/
Copyright © 2012 by The Atlantic Monthly Group. All Rights Reserved.

15

16
REQUIRED ANNUALLY BASED ON SCHOOL PERFORMANCE LEVEL
Exceeding Expectations
Meeting Expectations
Partially Meeting Expectations
Not Meeting Expectations
State and Federal Assurances Professional Development Plan Communications Plan
State and Federal Assurances Professional Development Plan Implementation Plan
State and Federal Assurances Professional Development Plan Implementation Plan Effective Practices Framework Resource Allocation
State and Federal Assurances Professional Development Plan Implementation Plan Effective Practices Framework Resource Allocation
State and Federal Assurances
State Assurances are required annually of all schools. Federal Assurances are required annually of all Title 1 schools. A sample of what assurances look like is provided below:
Communications Plans
The WDE will create a Statewide System of Support web site that includes all of the practices from the Wyoming Effective Practices Framework. Each indicator will have a link to a separate page for effective practices submitted by districts and schools. The effective practices may be submitted via electronic print and video. Schools that are exceeding expectations will be asked to share effective practices in person through conferences and trainings and, in cases, with individualized support for low performing schools.
17
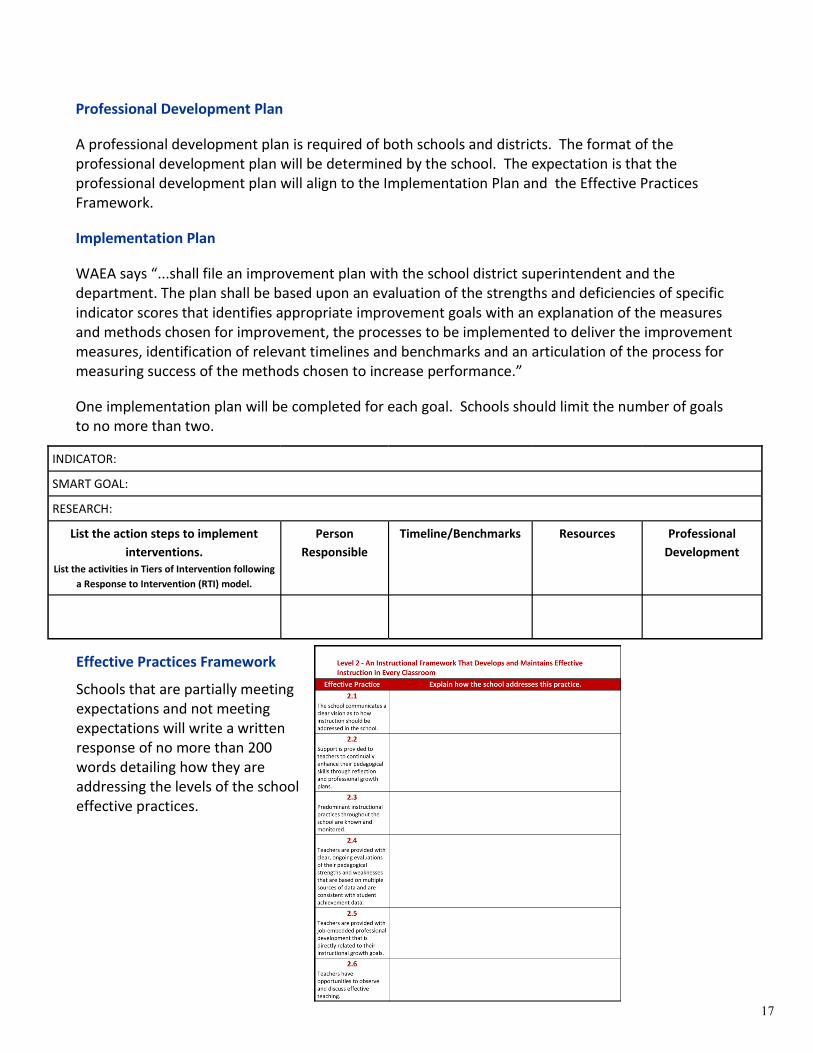
Professional Development Plan
A professional development plan is required of both schools and districts. The format of the professional development plan will be determined by the school. The expectation is that the professional development plan will align to the Implementation Plan and the Effective Practices Framework.
Implementation Plan
WAEA says “...shall file an improvement plan with the school district superintendent and the department. The plan shall be based upon an evaluation of the strengths and deficiencies of specific indicator scores that identifies appropriate improvement goals with an explanation of the measures and methods chosen for improvement, the processes to be implemented to deliver the improvement measures, identification of relevant timelines and benchmarks and an articulation of the process for measuring success of the methods chosen to increase performance.”
One implementation plan will be completed for each goal. Schools should limit the number of goals to no more than two.
INDICATOR:
SMART GOAL:
RESEARCH:
List the action steps to implement
interventions. List the activities in Tiers of Intervention following
a Response to Intervention (RTI) model.
Person
Responsible
Timeline/Benchmarks Resources Professional
Development
Effective Practices Framework
Schools that are partially meeting expectations and not meeting expectations will write a written response of no more than 200 words detailing how they are addressing the levels of the school effective practices.

18
Resource Reallocation
The results of 15 years of study and over 800 meta-analyses of research are included in John Hattie’s book Visible Learning. Hattie uses a measure called effect size (ES), which is a way of measuring the difference between two groups or the impact of a particular practice over time.
The average effect size for all research is 0.40. In order to have above average achievement, the school and the teachers must consistently implement strategies aligned to research with an effect size above 0.40.
Hattie’s influences on student achievement will form the foundation for resource reallocation. School expenditures on professional development and other expenditures on activities with an effect size of less than 0.40 will be suggested for reallocation to influences with a greater effect size. The research reference is:
Hattie, John. Visible Learning: A Synthesis of Over 800 Meta-Analyses Relating to Achievement. New York:
Routledge, 2009. Print.
WAEA requires representative assistance in identifying, securing and reallocating resources. In most cases, the higher influence factors are inexpensive. Consequently, the role of representatives will typically be resource reallocation. The methodology for resource reallocation is to align the programs and initiatives in the school to the influences on achievement. The financial and time resources devoted to low effect activities will be suggested for reallocation to higher influence activities.
For example, consider a low-performing school that has invested time and resources toward student learning styles and web-based learning, has implemented a social skills mentoring program and has a homework policy for elementary students.
Homework requires no funding, professional development or class time, and it may be important to parents. The school can do what it wants with homework. The other three would be considered for reallocation to higher effect practices.
Meeting Multiple Requirements
This document will serve to meet the plan requirements for No Child Left Behind, Accreditation, Professional Development and the Wyoming Accountability in Education Act.

19
Dr. Robert Marzano, director of Marzano Research Laboratory, Denver, CO, suggested the development of a statewide Wyoming effective practices framework. According to Marzano there are five levels of school effectiveness. Dr. Marzano has given the WDE permission to modify and use the school effective practices framework as the starting point for development of a statewide effective practices framework. The source document, Marzano Levels of School Effectiveness© August 2012, includes examples and evidence suggestions for each of the practices.
Support for districts is not required by the Wyoming Accountability in Education Act (WAEA). Support for LEAs (Districts) is a requirement for No Child Left Behind (NCLB). The WDE methodology includes a unified system of support for schools and districts that meets the requirements of both statutes. The district effective practices were suggested by Shelley Billig of REL Central, Denver, CO. These practices are from the Broad Prize Framework for School District Excellence. Examples of best practices nationwide are provided at wwwlbroadprize.org.
The literacy and numeracy effective practices are intended to be cross-curricular. They are allocated to schools and districts. The literacy and numeracy indicators were developed by WDE as a compilation of research-based practices.
The effective practices framework will provide the structure for sharing of effective practices through a web-site that is being developed by WDE. It is the hope of the WDE that districts will set up a similar web site with the same practices to facilitate sharing of practices by web links. The WDE will facilitate the sharing of effective practices in person, on site, through video and through electronic print.
The response to these effective practices will serve as the communication plan for schools that are exceeding expectations. This will include a detailed written document that articulates the specific processes used by the school. Other forms of media may be substituted. The hope is that the high performing schools and districts will share expertise around these practices.
Response to how the school is addressing the effective practice will be required for schools that are not meeting or partially meeting expectations. This will be a brief response as a component of the school improvement plan.
Schools that are exceeding or meeting expectations will be eligible to apply for the designation of High Reliability Learning Organization described on the last page of this document. Districts with the majority of schools meeting or exceeding expectations will be eligible to apply for the designation of High Reliability Learning Organization.
Dr. Robert Marzano, Marzano
Research Laboratory

20
Standards Referenced Reporting
SR.1 - Clear and measurable goals are established and focused on critical needs regarding improving achievement of individual students within the school.
SR.2 - Data are analyzed, interpreted, and used to regularly monitor progress toward achievement goals for individual students.
Student Mastery of Content
MC.1 - Students move on to the next level of the curriculum for any subject area only after they have demonstrated competence at the previous level.
MC.2 - The school schedule is designed to accommodate students moving at a pace appropriate to their backgrounds and needs.
MC.3 - Students who have demonstrated competency levels greater than those articulated in the system are afforded immediate opportunities to begin work on advanced content and/or career paths of interest.
Safe and Orderly Environment
S0.1 - The faculty and staff perceive the school environment as safe and orderly.
SO.2 - Students, parents, and the community perceive the school environment as safe and orderly.
SO.3 - Teachers have formal roles in the decision-making process regarding school initiatives.
SO.4 - Teacher teams and collaborative groups regularly interact to address common issues regarding curriculum, assessment, instruction, and the achievement of all students.
SO.5 - Teachers and staff have formal ways to provide input regarding the optimal functioning of the school.
SO.6 - Students, parents, and community have formal ways to provide input regarding the optimal functioning of the school.
SO.7 - The success of the whole school, as well as individuals within the school, is appropriately acknowledged
SO.8 - The fiscal, operational, and technological resources of the school are managed in a way that directly supports teachers.
Effective Instruction
EI.1 - The school communicates a clear vision as to how instruction should be addressed in the school.
EI.2 - Support is provided to teachers to continually enhance their pedagogical skills through reflection and professional growth plans.
EI.3 - Predominant instructional practices throughout the school are known and monitored.
EI.4 - Teachers are provided with clear, ongoing evaluations of their pedagogical strengths and weaknesses that are based on multiple sources of data and are consistent with student achievement data.
EI.5 - Teachers are provided with job-embedded professional development that is directly related to their instructional growth goals.
EI.6 - Teachers have opportunities to observe and discuss effective teaching.
Essential Curriculum
EC.1 - The school curriculum and accompanying assessments adhere to state and district standards.
EC.2 - The school curriculum is focused enough that it can be adequately addressed in the time available to teachers.
EC.3 - All students have the opportunity to learn the critical content of the curriculum.
EC.4 - Clear and measurable goals are established and focused on critical needs regarding improving overall student achievement at the school level.
EC.5 - Data are analyzed, interpreted, and used to regularly monitor progress toward school achievement goals.
EC.6 - Appropriate school-level and classroom-level programs and practices are in place to help students meet individual achievement goals when data indicate interventions are needed.
SCHOOL EFFECTIVE PRACTICES
School Indicators of Effective Practice from Marzano Levels of School Effectiveness © 2012
The Logic Model behind the Wyoming Statewide System of Support is that Effective Practices lead to desired results:
DESIRED RESULTS
EFFECTIVE PRACTICES
Clear goals, research-based effective practices, and evidence showing the effectiveness of these practices are necessary to improve education in Wyoming. Transparency and sharing of effective practices between schools and districts will result in the cumulative statewide progress envisioned by the proponents of the Wyoming Accountability in Education Act.
Schools and districts with schools that are partially meeting and not
meeting expectations should begin with literacy.

21
DISTRICT EFFECTIVE PRACTICES
Literacy Effective Practices
LIT.1 - The school maintains a balanced literacy approach based on a theoretical construct and quality instruction by knowledgeable teachers in reading, writing and language, rather than reliance on vendor-specific products and computer programs.
LIT.2 - The school maintains a three-tier Response to Intervention model that includes a balanced, research-based second/third chance reading approach for Tier III readers with focus on comprehension.
LIT.3 - Adequate time is devoted to literacy in all subjects and at all grade levels.
LIT.4 - Student literacy skills are frequently assessed with formative assessments used by classroom teachers to inform instruction. The school tracks data and knows the reading/writing level of all students using formative and summative assessments.
LIT.5 - Teachers in all subjects are skilled in recognizing the types of text and utilizing effective reading strategies for each type of text. Narrative, expository and functional texts are included and the essential learning is emphasized across subjects and grade levels.
LIT.6 - All teachers include reading of grade level appropriate text, vocabulary, writing and quality discussion as a standard practice in all classes. Teachers use comprehension strategies.
LIT.7 - All teachers in all grades and subject areas know the reading level of the materials they are using, whether the materials are textbooks, internet-based resources or other reading sources.
LIT.8 - All teachers know the reading levels of their students and match reading materials with individual students. Teachers can identify gaps that might require differentiated instruction.
LIT.9 - All teachers incorporate vocabulary instruction as a part of their content. Terms specific to a topic of discussion are gradually introduced and used to increase student comprehension and engagement.
LIT.10 - Students are provided examples of quality work and multiple opportunities for success. High quality work for all students is displayed prominently throughout the school.
LIT.11 - Representative samples of student work are scored collaboratively to ensure consistency in expectations between teachers and across grade levels.
Numeracy Effective Practices
NUM.1– All teachers have clearly defined the mathematical content within their subject area.
NUM.2—All teachers possess the mathematical knowledge and skills to teach the numeracy requirements of their subject area.
NUM.3 - All teachers reinforce and provide students the opportunity to apply mathematical knowledge and skills in their subject area.
NUM.4 - All teachers are versed in and use the language of mathematics as defined within the Common Core State Standards (CCSS), Standards of Mathematical Practice.
Teaching and Learning
Curriculum
TL1 - The district has a rigorous, relevant, written curriculum.
TL2 - The district curriculum is effectively aligned to state content standards.
TL3 - The district has standards-aligned instructional materials needed to implement the curriculum.
Instruction
TL4 - The district has a shared framework for instruction.
TL5 - The district implements evidence-based instruction as a standard practice.
TL6 - The district provides effective instructional support for all students.
Assessment
TL7 - The district provides a cohesive, comprehensive system for assessing and reporting student performance.
TL8 - The district routinely analyzes data and uses results for decision-making and instructional improvement.
TL9 - The district ensures that educators, students and parents know how to interpret and use data.
Support for Teaching and Learning
TL10 - The district provides multiple types of ongoing professional development to all educators, differentiated by grade/course level, subject, prior knowledge and/or educator needs.
TL11 - The content of district professional development is determined by an analysis of achievement-related data and is designed to improve teaching and learning to meet district and school goals.
TL12 - The district has a system for supporting and evaluating the effectiveness of professional development.
District Leadership
Instructional Leadership
DL1- District leaders and staff serve as models and guides for instructional effectiveness.
DL2 - The district supports effective instruction.
DL3 - District staff systematically monitor and evaluate the effectiveness of instruction and provide feedback for improvement.
District Governance
DL4 - The board works collaboratively, efficiently and effectively to fulfill their responsibilities for district governance and oversight.
DL5 - The board and district leaders work effectively with each other and with educational partners, including schools, unions, state-level associations and parent groups.
DL6 - The superintendent provides skillful leadership, focusing on providing a critical link between the district and schools, and the district and the community.
Strategic Planning
DL7 - The strategic plan is developed using a systematic planning process that engages relevant stakeholders.
DL8 - The district strategic plan serves as a guide for the district and its schools, specifying vision, mission, performance goals, objectives, and benchmarks and the policies and strategies to achieve each strategic objective.
DL9 - The strategic plan is effectively communicated, leads to understanding, support and action, and is evaluated for effectiveness.
Performance and Accountability Requirements
DL10 - The district provides and enforces a clear set of expectations for staff performance.
DL11 - The district meets all federal, state and local accountability expectations.
DL12 - The district holds schools accountable and supports schools
Operations and Support Systems
Allocation of Financial Resources
OS1 - The district is financially sound.
OS2 - The budget provides sufficient funding to ensure a quality educational program.
OS3 - The district uses its funds efficiently, and seeks additional external sources of funding to support strategic plan implementation.
Human Resource Systems Requirements
OS4 - The district has a human resource management system in place that is efficient and effective.
OS5 - The district has a system to recruit, hire, place and cultivate highly effective staff.
OS6 - The district has an effective support system for new staff.
Organizational Structure and Management Requirements
OS7 - The district has a system in place to provide safe and orderly environments for all staff and students.
OS8 - The district's organizational culture is characterized by positive, collegial working relationships.
OS9 - The organizational structure of the district is designed to support student achievement and district goals.
District Indicators of Effective Practice from www.broadprize.org Literacy and Numeracy Practices by WDE
This draft framework will be disseminated for educator input. The input will be incorporated into the final document by a committee of practitioners. The effective practice framework will enable the WDE, schools and districts sharing of effective practices. The standards of effective practice will be central to the development of the criteria for High Reliability Learning Organizations for Wyoming. The effective practices framework will be the responsibility of the WDE school improvement and accreditation section and will have a five year revision cycle.
LITERACY AND NUMERACY

22
The logic model behind any industry is that effective practices lead to desired results. Effective organizations have a set of core practices they do extremely well and with a high degree of accuracy and consistency that lead to the desired results.
High reliability organization (HRO) is a term used to describe organizations that exist in environments where the consequence of errors are high, but the occurrence of error is extremely low. An example is the airline industry where accidents are catastrophic and rarely happen.
Developing a sufficiently rigorous analysis of Wyoming school and district processes and performance where they would be designated as High Reliability Learning Organizations (HRLOs) would address WAEA goal #7 — Increase the credibility and support for Wyoming public schools.
A statewide committee made up of lawmakers, educators and stakeholders will be convened to determine the effective practices and evidence requirements using the first three Marzano Levels of School Effectiveness and the Broad Prize District Indicators as a starting point. This committee would establish an initial and ongoing review process for determining Wyoming’s HRLOs.
The evidence requirements will be consistent statewide. High reliability schools and districts will make their evidence publicly available through web access.
When the process for determination of HRLO is sufficiently developed that it meets the expectations of lawmakers, educators and stakeholders, the WDE will promote the use of Wyoming HRLOs as an alternative accreditation process. Schools and districts that cannot or choose not to meet HRLO requirements may continue to be accredited in the current manner.
The WDE will develop a web site to support schools and districts with graphic interfaces similar to those below. Each will link to the effective practices for schools and districts. This will provide a methodology for categorizing practices. The literacy and numeracy link will be the same for schools and districts. An example of best practice dissemination using this methodology can be viewed at www.broadprize.org.
Wyoming School Effective Practices
Wyoming School District Effective Practices

23
Page 11 of the Wyoming Accountability in Education Act (WAEA) says:
(vii) A representative shall be appointed by the state superintendent for all schools designated under paragraphs (iv) through (vi) of this subsection to serve as a liaison between the school district leadership and the department.
The representative shall be an employee of the department, an employee of a Wyoming school district or any combination, and may require more than one (1) individual
for schools requiring substantial intervention and support. Additionally, one (1) representative may be assigned to more than one (1) school.
Page 33 says:
(iii) Depending upon the level of expertise required, provides for appointment of a representative from the department or from a school district, or both, and may provide for appointment of a representative through contracted expertise;
(iv) In those schools requiring substantial intervention and support, establishes a support structure for that school comprised of distinguished educators possessing the necessary credentials, education and expertise to assist schools appropriately, who possess the necessary experience, education and expertise commensurate with the level of intervention, support and consequences to be administered;
No Child Left Behind, Section 1117 establishes the following support priorities:
(A) first, provide support and assistance to local educational agencies (districts) with schools subject to corrective action under section 1116 and assist those schools, in accordance with section 1116(b)(11), for which a local educational agency has failed to carry out its responsibilities under paragraphs (7) and (8) of section 1116(b);
(B) second, provide support and assistance to other local educational agencies with schools identified as in need of improvement under section 1116(b); and
(C) third, provide support and assistance to other local educational agencies and schools participating under this part that need that support and assistance in order to achieve the purpose of this part.

24
No Child Left Behind, Section 1117 establishes the following support methodologies:
(A) In order to achieve the purpose described in paragraph (1), the statewide system shall include, at a minimum, the following approaches:
(i) Establishing school support teams in accordance with subparagraph (C) for assignment to, and working in, schools in the State that are described in paragraph (2).
(ii) Providing such support as the State educational agency determines necessary and available in order to ensure the effectiveness of such teams.
(iii) Designating and using distinguished teachers and principals who are chosen from schools served under this part that have been especially successful in improving academic achievement.
(iv) Devising additional approaches to providing the assistance described in paragraph (1), such as providing assistance through institutions of higher education and educational service agencies or other local consortia, and private providers of scientifically based technical assistance.
(B) PRIORITY- The State educational agency shall give priority to the approach described in clause (i) of subparagraph (A).
Wyoming Department of Education (WDE) Liaisons
Both statutes define a requirement for liaisons between the WDE and districts, even though the type of support provided to districts is not clearly defined in either instance. The WDE has defined district effective practices and a methodology for sharing best practices between districts as the support to be provided to districts.
School Improvement Representatives
NCLB defines representatives as distinguished educators from Title 1 schools. WAEA does not specify the source of the distinguished educators. In both statutes the school representative requirement will be met by having one or more distinguished educators from the schools participate in professional development around the effective practices in school improvement and train the staff at the local level. These representatives will likely include instructional facilitators, the principal and/or other distinguished educators.
The combination of WDE employees serving as district liaisons and representatives appointed from the schools by the district is sufficient to address low-performing schools and meet the requirements of both statutes.
Increased focus, research-based resource allocation, the effective practices framework, professional development around literacy and numeracy, and sharing of effective practices statewide are the tools that will be available to every educator in Wyoming, including the schools identified as partially meeting and not meeting expectations.

25
WDE School Intervention Teams
The WDE was asked by Arapahoe k-8 for help improving student achievement in August 2011. The school and district leadership received the school’s 2011 state Proficiency Assessment for Wyoming Students (PAWS) reading scores and at least one grade was the lowest in Wyoming.
During the 2011-12 school year, WDE contracted with two Statewide System of Support (SSOS) coaches, full-time reading specialists and the school district contracted with approximately 15 tutors to conduct a one-on-one tutoring program for the school. Some WDE employees also served as part-time tutors during the fall of 2011. The methods used aligned predominately to the “Second/Third Chance” reading research referenced in the influences on student achievement document.
This collaborative effort between WDE and the district produced notable results. Students performing at 18% proficient/advanced in third grade in 2011 improved to over 58% with the same students in fourth grade in 2012. Most grades improved significantly as well.
The Fremont 38 experience demonstrates the effectiveness of focused attention on literacy with at-risk populations. However, to conduct large-scale intervention consistently, regional and statewide trainings and workshops using distinguished Wyoming educators to demonstrate practices for their peers is a more feasible approach.
The Ontario, Canada school system has made substantial gains since 2003 using a systematic approach developed by the Ontario government. Among other initiatives, the legislature created a Literacy and Numeracy Secretariat (LNS) within the Ministry of Education (State Department of Education). The LNS provided 100 full time reading and math teachers to serve 5000 schools. Reduced to the scale of Wyoming, one teacher for each 50 schools would constitute a literacy and numeracy staff of seven teachers.
The WDE has applied a similar methodology using contracted teachers to provide statewide instruction in literacy and numeracy. This approach allows the WDE to capitalize on current effective practices in increasing student achievement. While there is no request for increased funding by the WDE, creating a permanent literacy and numeracy division within the department is worth consideration by the Wyoming legislature.
Grade 2011 Percent Proficient and
Advanced
2012 Percent Proficient and
Advanced % Change
03 18.4 34.2 15.7
04 47.2 58.5 11.3
05 33.3 60.5 27.2
06 64.0 64.3 0.3
07 46.7 59.3 12.6
08 47.4 62.1 14.7

26
Page 11-12 of WAEA says:
“Among other duties as may be requested by the district or department, the representative shall review and approve improvement plans submitted by schools in accordance with paragraphs (iv) through (vi) of this subsection. Requested resources for improvement plan implementation, or the reallocation of existing resources for plan implementation, shall be based upon a comprehensive review of the available research. Justification for resource allocation or reallocation shall be incorporated within the written improvement plan. The representative shall possess expertise appropriate to particular strategies incorporated within improvement plans to enable necessary plan evaluation, and shall be commensurate with the level of intervention, support and consequences to be administered under this subsection.”
WDE Liaison and Representative Functions
The plan will include an implementation narrative, effective practices framework, research-based resource allocation, professional development plan and communications plan. It will meet the requirements of WAEA, NCLB and accreditation. Plans will be scored using a statewide peer review process. School representatives will monitor the implementation of the school improvement plan.
The WDE has access to substantial expertise through the Regional Education Laboratory REL Central from Denver, CO which consists of Marzano Research Laboratory, RMC Research Corporation (RMC) and Augenblick, Palaich, and Associates, Inc. Dr. Marzano has been instrumental in development of the WDE approach to the state system of support. The WDE receives regional education laboratory, comprehensive center and content center support provided by the U.S. Department of Education.
The list of influences on student achievement will provide consistency in the research base used statewide, in that only strategies with a high impact on student achievement will be recommended. Schools and districts will have the autonomy to choose the programs, providers and initiatives they wish to employ to increase student achievement as long as they are reflective of the higher effect-size influences on achievement and make sense from an instructional standpoint.
Hattie’s influences on student achievement form the foundation for resource reallocation. School expenditures on professional development and other expenditures on influences with an effect size of less than .40 will be suggested for reallocation to influences with a greater effect size.

27
The Wyoming Comprehensive Accountability Framework: Phase I suggests the following:
One approach, that could be done regionally or at the state level, would involve creating networks of schools and districts interested in working on a particular issue or challenge. The Body of Evidence (BOE) Activities Consortium serves as one stellar example of a network of districts that came together to produce an important set of products, but more importantly, to increase the learning of the participants by doing the work! (Marion, January 31, 2012)
Teachers, leaders and WDE staff that were involved in this project or teaching in the state at the time recognize the effectiveness of this approach to developing educator capacity and sharing effective practices. This type of networking and collaboration will form the foundation of support provided by the WDE.
This approach aligns closely with the research on effective professional development. The WDE summary of the research is that professional development is most likely to lead to increased student achievement when it is sustained and ongoing around specific topics, makes appropriate use of external expertise, engages teachers, challenges teacher conceptions about curriculum and which groups of students learn better than others, includes teachers talking to teachers, and has continued support of leadership. And, it is more effective when it includes a combination of high school and elementary teachers.
Networking through Professional Organizations
Historically, professional organizations were a source of extensive professional development and networking in Wyoming. These organizations provided opportunities for educators to share effective practices and collaborate with other professionals in their grade-level, subject area or position. This focus on sharing and collaboration through professional organizations has shifted to an emphasis on district and school-level strategies to meet state and federally mandated requirements.

28
Opportunities exist for professional collaboration among teachers of the same grade level and within subject areas in districts with the largest populations. However, teachers in rural communities are often the only teacher for a grade level or for a specific subject. Their primary opportunity for peer-to-peer interaction in the past was through professional organizations. However, these organizations have become ineffective in many cases in Wyoming as a capacity building mechanism. State-level professional organizations exist for nearly all education professionals in Wyoming. The WDE will support professional organizations through recognition of their importance, WDE attendance at meetings and assistance with planning professional development.
AdvancED School Improvement Conference
The AdvancED School Improvement Conference has a 20-year history of providing Wyoming educators with hands-on practical applications of best practices in the classroom. Presentations focus on improving student learning in all content areas, closing the achievement gap in student subgroups, and implementing cross-curricular improvement efforts.
Current WDE Professional Development
The WDE dramatically increased the amount of professional development provided by the agency in anticipation of and in response to the WAEA. Future professional development will be aligned to best practices in literacy and numeracy as well as the Effective Practices Framework. The professional development offered by the WDE in 2011-2012 was as follows:
Literacy and Numeracy Trainings and Workshops
Event Dates/Location Rationale & Methodology Audience Measure
3+8 = Reading Success Instructor Training
August 2011 in Cheyenne and Casper
In January 2011, Technical Assistance Committee (TAC) member, Jim Popham encouraged full implementation of instructionally supportive component of PAWS reading by the WDE
Ten Wyoming teachers interested in facilitating reading workshops across the state
PAWS
3+8 = Reading Success Workshops
August 2011 – November 2011 in Casper, Cody, Riverton, Pinedale, Evanston, Afton, Newcastle, Torrington, Rock Springs, Rawlins, Jackson, Sheridan, Gillette, Cheyenne, Buffalo, Laramie. Douglas. Wheatland
Teacher training in PAWS reading design; implementation of instructionally supportive components of PAWS reading; practice designing and scoring constructed responses
Open to all Wyoming teachers. Over 2000 Wyoming teachers participated in the 3+8 = Reading Success Workshops
PAWS
Special Education Literacy (SpLit) Workshops with online class as follow up
December 2011 – February 2012 in Casper, Riverton, Gillette. Rawlins, Rock Springs. Torrington, Cheyenne
Examination of schools in improvement for IEP student subgroup showed need to improve reading and writing processes
Open to all Wyoming special education and classroom teachers. Over 350 Wyoming teachers participated in the Special Education Literacy (SpLit) Workshops
PAWS
ACT Preparation and College Readiness Workshops
February 2012 – August 2012 in Casper, Riverton, Gillette, Rock Springs
Gear Up wanted to collaborate with ACT preparation training
High school content teachers in English, reading, social studies, science and math
ACT

29
Event Dates/Location Rationale & Methodology Audience Measure
Increasing Achievement of Under-Resourced Learners (Ruby Payne training) 3+8=Reading Success for Instructional Facilitators and Bridges
April 2012 training for teacher trainers May 2012 Conference in Casper
Gear Up wanted to collaborate with Instructional Facilitator training for Summer School
Instructional Facilitators and selected Bridges Summer School Teachers– delivered in Casper and then four on-site volunteer Summer School programs
PAWS and Criterion Referenced pre and post tests
WY Figures Common Core Math Workshops
May 2012 – present in Cheyenne, Ft. Washakie, Sheridan, Casper, Rock Springs, Jackson, Riverton, Laramie, Gillette, Wheatland, Rawlins
Teacher training on new Wyoming math standards (Common Core State Standards)
Open to all Wyoming math teachers
PAWS
Wyoming Writing Project Workshops
June 2012- August 2012 in Riverton, Newcastle, Cody, Laramie, Casper, Gillette
University of Wyoming wanted to collaborate with the Wyoming Writing Project federal grant
Open to all Wyoming teachers PAWS
Common Core Reading and English Language Arts Workshops with online class as follow up
October 2012– present in Torrington, Gillette, Green River, Casper, Laramie, Powell, Rawlins
Teacher training on new Wyoming English Language Arts standards (Common Core State Standards)
Open to all Wyoming elementary teachers and secondary English Language Arts teachers
PAWS
SpLit Plus with online class as follow up
October 2012 – present in Casper, Cheyenne, Riverton, Gillette
Special Education teachers from around the state asked for additional training similar to the SpLit training started in 2011
Open to all Wyoming special education and classroom teachers.
PAWS
ELL Literacy Assessment Success Workshops
January 2013 – February 2013 in Rawlins, Gillette, Rock Springs, Casper
ELL teachers began contacting the WDE asking for training similar to SpLit and 3+8, but with emphasis on English language learners
Open to all Wyoming ELL education and classroom teachers
PAWS ACCESS for ELLs
Conferences Event Date Rationale & Methodology Audience Measure
Wyoming Association of Career Technical Education (CTE) Conference
June 2011 To engage CTE instructors in understanding reading levels and strategies for intervention
50-75 Career Technical Education Teachers
Jerry Johns Basic Reading Inventory
2011 Leadership Symposium July 2011 Breakout sessions on 3+8 constructed responses, reading, and writing
Open to all Wyoming special education teachers
PAWS
WDE Summer Camp 2011 August 2011 in Casper Keynote Speakers: Popham, Allington, Mikaelson Breakout sessions on literacy; 3+8 Reading
Open to all Wyoming teachers and administrators
PAWS
WY DOC Conference September 2011 Literacy Members of the Wyoming Department of Corrections
GED PAWS
2nd Annual Native American Education Conference
October 2011 in Lander Breakout sessions on Balanced Literacy Framework
Open to all Wyoming teachers
School Improvement Grant Recipient Conference
April 2012 in Casper Topics discussed included Family Engagement, Turning Around Middle Schools, SIG Online Training Tool, Meaningful Extended Learning Time
Superintendents, principals, teachers of SIG schools
Indistar® is the tool used for SIG assessment
Special Programs RtI Conference
May 2012 District psychologists and special programs teachers met to discuss RtI
Special programs teachers PAWS
3rd Annual First People’s Center for Education
June 2012 in Sheridan Information on Math Recovery WDE staff PAWS
2012 Leadership Symposium June 2012 in Lander Breakout sessions on constructed responses, reading, and writing
Open to all Wyoming special education teachers
PAWS
9th Annual WYPEC Conference August 2012 in Casper Training in writing process Open to all Wyoming paraprofessionals
PAWS
WDE Summer Camp 2012 August 2012 in Casper Keynote Speakers: Paulsen, Schubert, Marzano Breakout sessions on formative assessment, Balanced Literacy Framework, 3+8 Reading overview Breakout sessions on math literacy
Open to all Wyoming teachers and administrators
PAWS
Literacy Summit October 2012 in Casper Keynote Speakers: Beers and Probst followed by breakout sessions
Open to all Wyoming teachers PAWS ACT
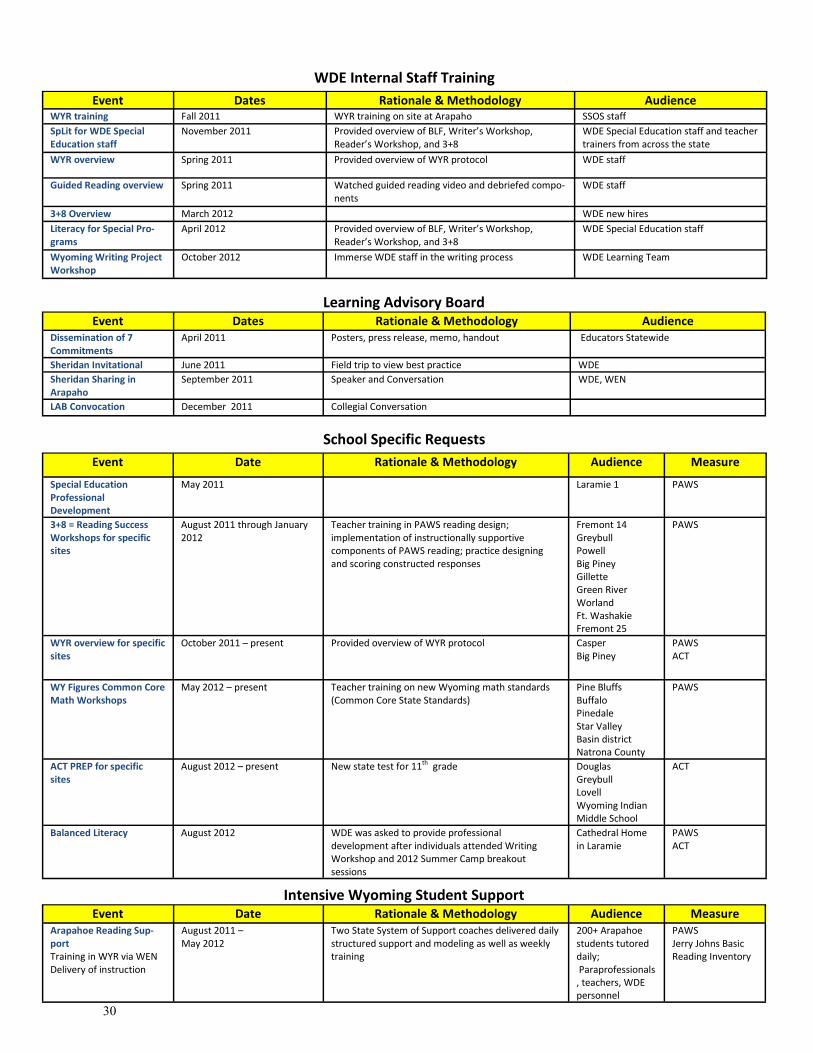
30
WDE Internal Staff Training
Event Dates Rationale & Methodology Audience WYR training Fall 2011 WYR training on site at Arapaho SSOS staff
SpLit for WDE Special Education staff
November 2011 Provided overview of BLF, Writer’s Workshop, Reader’s Workshop, and 3+8
WDE Special Education staff and teacher trainers from across the state
WYR overview Spring 2011 Provided overview of WYR protocol WDE staff
Guided Reading overview Spring 2011 Watched guided reading video and debriefed compo-nents
WDE staff
3+8 Overview March 2012 WDE new hires
Literacy for Special Pro-grams
April 2012 Provided overview of BLF, Writer’s Workshop, Reader’s Workshop, and 3+8
WDE Special Education staff
Wyoming Writing Project Workshop
October 2012 Immerse WDE staff in the writing process WDE Learning Team
Learning Advisory Board Event Dates Rationale & Methodology Audience
Dissemination of 7 Commitments
April 2011 Posters, press release, memo, handout Educators Statewide
Sheridan Invitational June 2011 Field trip to view best practice WDE
Sheridan Sharing in Arapaho
September 2011 Speaker and Conversation WDE, WEN
LAB Convocation December 2011 Collegial Conversation
School Specific Requests
Event Date Rationale & Methodology Audience Measure
Special Education Professional Development
May 2011 Laramie 1 PAWS
3+8 = Reading Success Workshops for specific sites
August 2011 through January 2012
Teacher training in PAWS reading design; implementation of instructionally supportive components of PAWS reading; practice designing and scoring constructed responses
Fremont 14 Greybull Powell Big Piney Gillette Green River Worland Ft. Washakie Fremont 25
PAWS
WYR overview for specific sites
October 2011 – present Provided overview of WYR protocol Casper Big Piney
PAWS ACT
WY Figures Common Core Math Workshops
May 2012 – present
Teacher training on new Wyoming math standards (Common Core State Standards)
Pine Bluffs Buffalo Pinedale Star Valley Basin district Natrona County
PAWS
ACT PREP for specific sites
August 2012 – present
New state test for 11th grade Douglas Greybull Lovell Wyoming Indian Middle School
ACT
Balanced Literacy August 2012 WDE was asked to provide professional development after individuals attended Writing Workshop and 2012 Summer Camp breakout sessions
Cathedral Home in Laramie
PAWS ACT
Intensive Wyoming Student Support Event Date Rationale & Methodology Audience Measure
Arapahoe Reading Sup-port Training in WYR via WEN Delivery of instruction
August 2011 – May 2012
Two State System of Support coaches delivered daily structured support and modeling as well as weekly training
200+ Arapahoe students tutored daily; Paraprofessionals, teachers, WDE personnel
PAWS Jerry Johns Basic Reading Inventory

31
If Wyoming is to reach the goals of the Wyoming Accountability in Education Act (WAEA), schools and districts must focus on doing what works best in education.
According to the 2002-2007 U.S. Department of Education, Strategic Plan - Goal 4:
Unlike medicine, agriculture and industrial production, the field of education operates largely on the basis of ideology and professional consensus. As such, it is subject to fads and is incapable of the cumulative progress that follows from the application of the scientific method and from the systematic collection and use of objective information in policy making. We will change education to make it an evidence-based field.
The winds are shifting, but no state has completely made the transition to evidence-based practice. Wyoming’s competitive advantage over the rest of the nation lies in the ability to mobilize resources and move quickly.
Wyoming can lead the nation by moving rapidly from discussion to consistent implementation of evidence-based practice!
The work of Dr. John Hattie, director of the Melbourne Research Center at the University of Melbourne, Australia, indicates that almost anything will increase student achievement and very few practices negatively impact student achievement. The question is not what works, but how well it works.
“By definition, it is not possible for everyone to be above the average.” - Jim Collins, Good to Great
According to Hattie, “Doing more average things won’t lead to above average achievement… greater than average achievement is a lot harder than simply making gains.” Data from the National Assessment of Education Progress (NAEP) indicate Wyoming is above the national average in student achievement. Clearly Wyoming schools are doing many things well. However, If Wyoming is to see statewide improvement, decisions at all levels must be made on the basis of accurate data and research. Wyoming schools must consistently implement and share effective practices in all subjects and at all grade levels.
The results of 15 years of study and over 800 meta-analyses of research are included in Hattie’s book Visible Learning. Hattie uses a measure called effect size (ES), which is a way of measuring the difference between two groups or the impact of a particular practice over time.
John Hattie, Director of the Melbourne Research Center,
Melbourne, Australia
Hattie, John. Visible Learning: A Synthesis of Over 800 Meta-Analyses Relating to
Achievement. New York: Routledge, 2009. Print.

32
The average effect size for all research is 0.40. In order to have above average achievement, the school and the teachers must consistently implement strategies aligned to research with an effect size above 0.40. Taken a step further, effect size can be calculated for schools, classes and individual students. According to Hattie, the average year growth should also measure 0.40 for all three.
Dr. Robert Marzano, director of Marzano Research Laboratory, Denver CO, recommends using the 0.40 effect size as a point of discussion and not an absolute cut point. He says it is important to remember that all positive influences lead to increased achievement. Unless the lower effect size practices are expensive, difficult to implement, or cut into valuable and limited teaching time, there is no reason to discontinue them.
One example is reduction of class size. Reducing class size alone leads to moderate increases in student achievement (ES 0.21), even if there is no improvement in instruction. However, the reasons for reducing class size are to increase feedback, enrichment, teacher-student relations and other high-influence activities. Decreasing class size makes far more difference if it is linked to improved instruction.
The WDE suggests carefully reading the research in Visible Learning, rather than drawing conclusions based solely on the title of the category. For example, student-centered teaching has an effect size of 0.54 and student control over learning has an effect size of 0.04. To be certain the practice implemented in the classroom is the first and not the second requires study and discussion.
Hattie’s influences on student achievement will form the foundation for resource reallocation. School expenditures on professional development and other expenditures on activities with an effect size of less than 0.40 will be suggested for reallocation to influences with a greater effect size.
0.40 is the average effect size
Almost all influences on
achievement are above 0.00
The higher the effect size, the greater the impact on student achievement

33
CURRICULA
READING PROGRAMS Repeated reading 0.67 Vocabulary instruction 0.67 Comprehension instruction 0.60 Visual-perception 0.55 Phonics instruction 0.54 Second/third chance 0.50 Writing instruction 0.44 Exposure to reading 0.42 Drama/arts 0.35 Sentence combining instruction 0.15 Whole language 0.06 MATH AND/OR SCIENCE PROGRAMS Science Instruction 0.42 Mathematics Instruction 0.40 Use of Calculators 0.27
OTHER CURRICULA Creativity programs on achievement 0.65 Tactile stimulation instruction 0.58 Outdoor/adventure instruction 0.52 Play instruction 0.50 Integrated curricula instruction 0.39 Social skills instruction 0.39 Career interventions 0.38 Bilingual instruction 0.37 Values/moral education instruction 0.24 Extra-curricular activities 0.19 Perceptual-motor instruction 0.08
TEACHER
TEACHER Teacher credibility 0.90 Microteaching 0.88 Teacher clarity 0.75 Teacher-student relationships 0.72 Not labeling students 0.61 Professional development 0.51 Quality of teaching 0.48 Teacher expectations 0.43 Teacher effects 0.32 Teacher verbal ability 0.22 Teacher education 0.12 Teacher subject matter knowledge 0.09
TEACHING APPROACH
SCHOOL-WIDE STRATEGIES Response to Intervention 1.07 Classroom discussion 0.82 Comprehensive interventions for learning disabled students 0.77 Student centered teaching 0.54 Comprehensive teaching reforms 0.22 Co-teaching/team teaching 0.19
TEACHING APPROACH (Continued)
TEACHING STRATEGIES Reciprocal Teaching 0.74 Teaching strategies 0.62 Problem-solving teaching 0.61 Cooperative vs. individualistic learning 0.59 Direct Instruction 0.59 Cooperative vs. competitive learning 0.54 Cooperative learning 0.42 Adjunct aids 0.37 Various teaching on creativity 0.34 Inductive teaching 0.33 Inquiry-based teaching 0.31 Competitive vs. individualistic learning 0.24 Problem-based learning 0.15
FEEDBACK Providing formative evaluation 0.90 Feedback 0.75 Questioning 0.48 Frequency/effects of testing 0.34 Teaching test taking and coaching 0.27 Teacher immediacy 0.16
SUCCESS CRITERIA Mastery learning 0.58 Worked examples 0.57 Keller's Master Learning 0.53
LEARNING INTENTIONS Concept mapping 0.60 Goals 0.50 Behavioral organizers/adjunct questions 0.41 Learning hierarchies 0.19
META-COGNITIVE SELF-REGULATED LEARNING Meta cognitive strategies (Higher Order Thinking or Critical Thinking 0.69 Self-verbalization/self-questioning 0.64 Study skill 0.63 Individualized instruction 0.22 Aptitude-treatment interactions 0.19 Matching style of learning 0.17 Student control over learning 0.04
USING TECHNOLOGIES Interactive video methods 0.52 Computer-assisted instruction 0.37 Simulations 0.33 Programmed instruction 0.23 Visual/audio-visual methods 0.22 Web-based learning 0.18
STUDENT PERSPECTIVES IN LEARNING Spaced vs. mass practice 0.71 Peer tutoring 0.55 Time on task 0.38 Mentoring 0.15
OUT OF SCHOOL LEARNING Homework 0.29
Home-schooling 0.16 Distance Education 0.11
INFLUENCES ON STUDENT ACHIEVEMENT - JOHN HATTIE, VISIBLE LEARNING

34
INFLUENCES ON STUDENT ACHIEVEMENT - JOHN HATTIE, VISIBLE LEARNING
SCHOOL
ATTRIBUTES OF SCHOOL School effects 0.48 Finances 0.23 Changing school calendars/timetables 0.09
CLASSROOM COMPOSITION EFFECTS Small group learning 0.49 Volunteer tutors 0.26 Mainstreaming 0.24 Class size 0.21 Within-class grouping 0.18 Ability grouping 0.12 Multi-grade/multi age classes 0.04 Open vs traditional 0.01 Retention -0.13
CLASSROOM INFLUENCES Classroom behavioral 0.68 Classroom cohesion 0.53 Peer influences 0.53 Classroom management 0.52 Decreasing disruptive behavior 0.34
CURRICULA FOR GIFTED STUDENTS Acceleration 0.68 Enrichment 0.39 Ability grouping for gifted 0.30
SCHOOL COMPOSITION EFFECTS School size 0.43 Principals/school leaders 0.39 Systems accountability 0.31 Out of school curricular experiences 0.09 Summer Vacation -0.02 Mobility -0.34
TYPES OF SCHOOLS Desegregation 0.28 Religious Schools 0.23 Summer school 0.23 Charter Schools 0.20
STUDENT
PRE-SCHOOL EXPERIENCES Early Intervention 0.47 Pre-school 0.45
PHYSICAL INFLUENCES Pre-term birth weight 0.53 Psychotherapy programs 0.38 Drugs 0.32 Ethnicity 0.32 Exercise/relaxation 0.28 Lack of Illness 0.25 School Counseling effects 0.18 Diet 0.12 Gender 0.12 Ethnic diversity of students 0.05
BACKGROUND
Self-report grades/Student expectations 1.44 Piagetian stages of development 1.28 Prior achievement 0.65 Creativity related to achievement 0.35
ATTITUDES AND DISPOSITION Concentration/persistence/engagement 0.48 Motivation 0.48 Self-Concept 0.47 Reducing Anxiety 0.40 Attitudes to math and science 0.35 Personality 0.18
HOME HOME
Home Environment 0.52 Socioeconomic Status 0.52 Parental Involvement 0.49 Home Visiting 0.29 Family Structure 0.18 Welfare Policies -0.12 Television -0.18
WAEA requires representative assistance in identifying, securing and reallocating resources. In most cases, the higher influence factors are inexpensive. Consequently, the role of representatives will typically be resource reallocation. The methodology for resource reallocation is to align the programs and initiatives in the school to the influences on achievement. The financial and time resources devoted to low effect activities will be suggested for reallocation to higher influence activities.
For example, consider a low-performing school that has invested time and resources toward student learning styles and web-based learning, has implemented a social skills mentoring program and has a homework policy for elementary students.
Homework requires no funding, professional development or class time, and it may be important to parents. The school can do what it wants with homework. The other three would be considered for reallocation to higher effect practices.

35
The rationale for the system of support is based on the school system in Ontario, Canada. Ontario has been steadily climbing in international comparisons for the past decade. Much can be learned from the strategies used in Ontario to renew the public school system. And, much can be learned from their mistakes in the 1990’s that led to the need to renew the public school system.
The 1990’s Ontario Education Strategy During the 1990’s the Ontario government:
Broadcast television ads portraying teachers as overpaid and underworked. Cut budgets and reduced staffing. Increased staffing workloads were
mandated by legislation. Reduced the number of school districts and limited local control. Implemented a teacher evaluation system with compulsory input from parents
and students. Promoted private schools through tax cuts and minimal regulations. Created the Accountability Office as the agency responsible for substantial
increases in testing. By the early 2000’s, graduation rates were falling, student scores had declined, teacher strikes were widespread and there was widespread dissatisfaction with the Ontario education system. A new government was elected whose platform was renewing the public education system.
The Current Ontario Education Strategy Key goals
Improve a broad range of student outcomes Reduce the gaps in achievement Increase public confidence in education
Main Strategies Improve teaching of literacy and numeracy across 4000 elementary schools;
75% of students to reach provincial standards from age 12 – up from 55%. Improve graduation rates across more than 800 high schools; 85% of students
to graduate within five years of starting ninth grade – up from 68%. Reduce class size in primary years to a maximum of 20 in at least 90 percent of
classes.
Reference: Levin, B. (2008). How to Change 5000 Schools: A Practical and Positive
Approach for Leading Change at Every Level. Eurospan. Pages 18-31

36
Based on the historical information from Ontario, the WDE believes increased transparency and evidence-based practice is preferable to rewards and consequences. While well intended, education reform experts warn against using consequences as a driver for education reform. A video entitled What Doesn't Work in School Reform by Michael Fullan, international education reform expert, discusses this topic. The video can be viewed at http://vimeo.com/41310303.
The major reasons schools struggle are an incoherent curriculum, lack of teacher expertise or lack of student engagement. The question is not which consequence to administer, but what intervention will change the direction of the school?
In Drive: The Surprising Truth About What Motivates Us, Daniel Pink writes about the research behind human motivation. Pink says rewards and consequences are effective incentives only for piece work and rote tasks. When the cognitive complexity of the task is increased, rewards and consequences lead to worse results. He contends people are motivated by autonomy, mastery or self-efficacy and purpose. Rewards and consequences lead to compliance, not commitment.
There is evidence to substantiate the need for autonomy in education. Based on international studies, “In countries where schools account for their results by posting achievement data publicly, schools that enjoy greater autonomy in resource allocation tend to show better student performance than those with less autonomy. In countries where there are no such accountability arrangements, schools with greater autonomy in resource allocation tend to perform worse” (OECD, 2011, p. 1).
The researchers go on to say “Autonomy and accountability go together: greater autonomy in decisions relating to curricula, assessments and resource allocation tend to be associated with better student performance, particularly when schools operate within a culture of accountability” (OECD, 2011, p. 4).
However, in The Tyranny of Choice, Renata Salecl makes the case that paralyzing anxiety and dissatisfaction result from limitless choices. She contends that consumerism leads to self-criticism and guilt rather than positive change. Salecl says the result of individualism and consumerism is that celebrity, not citizenship becomes the goal for many people.
It appears that autonomy, mastery and purpose are positive, but too many choices are not. Thus, at least in the case of low-performing schools, leaving all aspects of the education system to experimentation and “innovation” likely won’t lead to the school performance envisioned by the Wyoming legislature. Constantly shopping for an easy solution is likely a large part of the problem.
“American education has been littered
with failed fads and foolish ideas for the past century.” Diane Ravitch

37
Dianne Ravitch, former U.S. Assistant Secretary of Education, urges us to beware of what she refers to as the “the royal road to learning” which she describes as “the notion that some savant or organization has found an easy solution to the problems of American education.” She goes on to say, “I have tried to show in my work the persistence of our national infatuation with fads, movements and reforms, which invariably distract us from the steadiness of purpose needed to improve our schools” (NPR, 2011).
Increasing the focus and structure of low-performing schools along with implementing research-based practices will lead to increased student achievement. However, this will likely be seen as a consequence for schools that are used to an “anything goes” environment.
Increased Literacy Expectations
If students do not read well, it is unlikely they will do well on any portion of the achievement tests because they cannot comprehend the questions. The first intervention for students who are not proficient in any area is a screening to determine their reading ability and appropriate reading instruction. In low-performing schools that have made gains, curricular and instructional improvements in literacy along with improved relationships are almost always cited as factors that led to improvement.
Katy Haycock, Director of the Education Trust, raised concern about the literacy expectations of students in low performing schools some years ago when she said: "I'm astounded that kids in some middle schools are given more coloring assignments than writing and math work. Even in some high schools the kids are asked to do a lot of coloring. Read To Kill a Mockingbird, says the teacher, and when you're through, color a poster on it”.
Interventions for Schools
According to page 11 of the WAEA statute, failure to meet improvement goals as specified in the plan for two (2) consecutive years may be grounds for dismissal of the school principal. Hattie’s research, substantiated by Bill Gates at the 2012 Education of States (ECS) Conference, indicates that learning leaders are most effective in increasing achievement. An analysis to determine whether the principal is the “weak link in the chain” is necessary before dismissing the principal.
Gates contends that leaders don’t exist outside of the system. Blaming specific teachers or administrators for systemic problems is not a solution to the problem. In The Anxious Organization, Jeffrey Miller writes “blaming one person for systemic problems allows everyone to ignore the fact that the problem is systemic. They partake of the illusion that in assigning blame, they have identified the source of the problem and even gone halfway to solving it. Once the scapegoat has been found, all further thinking about the problem is suspended.”
Dianne Ravitch, former U.S. Assistant Secretary of Education

38
WORKS CITED: Haycock, K. (2001, Fall). GSE Term Paper. Retrieved from ALUMS Making a Difference: Kati Haycock,
Director of the Education Trust: http://gse.berkeley.edu/admin/publications/termpaper/fall01/haycock.html
Levin, B. (2008). How to Change 5000 Schools: A Practical and Positive Approach for Leading Change at Every Level. Eurospan.
Miller, J. A. (2008). The Anxious Organization, Second Edition. Facts on Demand Press. NPR. (2011, April 28). www.npr.org. Retrieved from Ravitch: Standardized Testing Undermines Teach-
ing: http://www.npr.org/2011/04/28/135142895/ravitch-standardized-testing-undermines-teaching
OECD. (2011, October). School autonomy and accountability: Are they related to student performance? Retrieved from PISA in Focus: http://www.oecd.org/dataoecd/17/43/48910490.pdf
Pink, D. H. (2009). Drive: The Surprising Truth about What Motivates Us. London, England: Riverhead Books (Penguin).
Salecl, R. (2011). The Tyranny of Choice. London, England: Profile Books.
The concern was stated recently by Linda Darling-Hammond, a Stanford University professor, who says states can’t “fire their way to Finland.” (Finland is often cited as one of the leading education systems in the world.)
Undoubtedly teacher and leader quality is incredibly important and must be a high priority for the entire education system. And, there are situations where replacing personnel is the best or only alternative. The teacher and administrator evaluation process developed through the Wyoming Accountability in Education Act will be valuable in these situations.
Resource Reallocation
The resource reallocation model includes moving time and financial resources away from low effect size practices to make funds and time available for activities that increase student achievement.
In almost every case, the first priority for low performing schools is to limit distractions and modify teacher schedules to make time for literacy and numeracy instruction. Teachers should focus first on improving the classroom environment, improving instruction and implementing more purposeful reading and writing in all subjects. Some teachers will view this change as a severe consequence.
Loss of Accreditation
If a school continues to perform at a low enough level for long enough, there is a point at which it should lose accreditation and funding. This is a decision of the State Board of Education.
39
W.S. 21-2-304. Duties of the state board of education
(a) The state board of education shall:
(ii) Through the evaluation and accreditation of school districts, implement and enforce the uniform standards for educational programs prescribed under W.S. 21-9-101 and 21-9-102 in the public schools of this state, including any educational institution receiving any state funds except for the University of Wyoming and Wyoming community colleges, and implement and enforce the statewide education accountability system pursuant to W.S. 21-2-204. The board shall ensure that educational programs offered by public schools in accordance with these standards provide students an opportunity to acquire sufficient knowledge and skills, at a minimum, to enter the University of Wyoming and Wyoming community colleges, to prepare students for the job market or postsecondary vocational and technical training and to achieve the general purposes of education that equips students for their role as a citizen and participant in the political system and to have the opportunity to compete both intellectually and economically in society. In addition, the board shall require school district adherence to the statewide education accountability system; [emphasis added]
The WDE interprets this as saying the accreditation system will evaluate:
Whether students in public schools and institutions have the opportunity to meet content and performance standards
Whether the district adheres to the statewide education accountability system Whether students are provided an opportunity to acquire sufficient knowledge
and skills for college, careers and citizenship
The Wyoming State Board of Education is tasked with accreditation. For many years accreditation was a function of the Wyoming Department of Education (WDE). This role has been transitioned to AdvancED®, a national accreditation organization, to provide accreditation for Wyoming districts and schools.
The input the WDE has received from principals and district superintendents related to accreditation fits into three categories. Some would like to eliminate accreditation and use a composite of the school performance levels as the accreditation score for the district. Some would like an alternative to AdvancED accreditation. The third group would like the support for WAEA closely aligned to AdvancED accreditation to eliminate redundancy.
With the passage of the Wyoming Accountability in Education Act (WAEA), Wyoming schools and districts have three systems of accountability. These are No Child Left Behind (NCLB), Accreditation and WAEA.

40
No Child Left Behind (NCLB) is primarily focused on the academic achievement of the disadvantaged and reports school scores on the basis of Adequate Yearly Progress (AYP). NCLB requires a school improvement plan annually from Title 1 schools. All schools, regardless of whether they receive federal funds through NCLB, are a part of the system for reporting of AYP.
WAEA will assign a single score to every school based on several measures. Schools that are meeting, partially meeting and not meeting expectations are required to submit a school improvement plan, presumably annually. As a component of WAEA, schools that are exceeding expectations will also report on effective practices annually.
AdvancED accreditation requires a school improvement plan every five years and analyzes both the processes and the student performance of schools and districts through an on-site visit called a Quality Assurance Review (QAR) every five years. The QAR teams assign an accreditation score to districts and schools.
Regardless of the desires of the legislature to have a single score for schools, the three systems of accountability will assign three scores. Thus, a likely scenario is that a school will be accredited, making AYP, and partially meeting expectations under WAEA (or any of a multitude of combinations).
The schools with the highest requirements under the current system are schools that are exceeding expectations under WAEA. They will be required to file an annual school improvement plan for NCLB and AdvancED, file an annual communications plan based on effective practices for WAEA and address the AdvancED Standards of Quality.
Using the AdvancED Standards of Quality for Districts and Schools as the framework for effective practices and school improvement would streamline the process. However, the critics of AdvancED accreditation say that the standards and indicators are too vague and high level to be of value in school improvement. There is also concern that the AdvancED® standards cannot be modified for Wyoming, thus are of limited value as a framework for effective practices that is specific to Wyoming. This is a particular concern if the state wishes to share effective practices in teaching literacy and numeracy, which ultimately must happen if scores are to improve.
Using the AdvancED Standards of Quality as the foundation for WAEA support does not address the wishes of those school and district stakeholders who would prefer an alternative method of accreditation.
In May 2012, the Wyoming Department of Education signed a two-year agreement with AdvancED to continue to provide accreditation while the various accreditation options are considered.
Content and Performance Standards Evaluation
Regardless of the accreditation methodology, an additional component of accreditation, should be an evaluation of the school program offering to ensure that all students have opportunity to meet the uniform standards for educational programs. This can be evaluated by WDE staff using existing data.
Statewide Accountability System
School performance level will be included in the determination of the overall district score through the use of student data in the accreditation score assignment.

41
Evaluation of student knowledge and skills
Determination of whether public schools and institutions provide students an opportunity to acquire sufficient knowledge and skills for college, careers and citizenship is accomplished through the accreditation process, standards evaluation and assurances.
In 2012, the AdvancED process was revised to include five standards, rather than the seven listed below. The Quality Assurance Review (QAR) teams use a four point scale for each area with one being the lowest and four the highest. The QAR results for the past five years are summarized as:
Wyoming assurances
Schools and districts provide assurance that all state statutes and requirements are met each year. WDE checks that assurances are completed and spot checks key assurances as part of the accreditation process. Schools and districts currently submit assurances each year to AdvancED through the ASSIST online tool. State Assurances and Title I Assurances (if appropriate) are included as part of the complete Improvement Report.
The assurance review includes an analysis of professional assignments for every district. All districts hosting the five year Quality Assurance Review (QAR) visits with AdvancED are monitored for assurance compliance using a checklist completed on site with the district. Corrective action is required for any assurance area not fully met. Results of the assurances are included in a report to the State Board as part of the accreditation recommendations.
Future Direction
The WDE believes a review of whether Wyoming wants to continue with the current accreditation methodology, define a multi-tiered accreditation model that exempts high performing schools and districts from accreditation or offers choice to districts in accreditation must take place before the system of support for WAEA can be aligned to the accreditation model.
The WDE supports providing choice in accreditation. One such choice methodology is proposed in the Standards of Effective Practice Framework under High Reliability Learning Organizations. This methodology would give schools that are meeting or exceeding the expectations and districts with majority of schools that are meeting or exceeding expectation an evidence-based system of accreditation that is separate from the AdvancED process. The option to eliminate accreditation for schools that are meeting or exceeding expectations and districts with the majority of schools meeting or exceeding expectations should be considered.
The WDE can align many aspects of the system of support to the AdvancED model. The AdvancED Standards for schools are included on the next page.
Vision and Purpose
Governance and
Leadership
Teaching and Learning
Documenting and Using
Results
Resources and Support
Systems
Stakeholder Communicati
ons and Relationships
Continuous Improvement
All WY Districts 3.25 3.1 3.0 3.05 3.2 3.15 2.9
All WY Schools 3.25 3.32 3.22 3.15 3.40 3.27 3.11

42
STANDARD 1: PURPOSE AND DIRECTION The school maintains and communicates a purpose and direction that commit to high expectations for learning as well as shared values and beliefs about teaching and learning. Indicator 1.1 - The school engages in a systematic, inclusive, and comprehensive process to review, revise, and communicate a school purpose for student success. Indicator 1.2 - The school leadership and staff commit to a culture that is based on shared values and beliefs about teaching and learning and supports challenging, equitable educational programs and learning experiences for all students that include achievement of learning, thinking, and life skills. Indicator 1.3 - The school’s leadership implements a continuous improvement process that provides clear direction for improving conditions that support student learning. STANDARD 2: GOVERNANCE AND LEADERSHIP The school operates under governance and leadership that promote and support student performance and school effectiveness. Indicator 2.1 - The governing body establishes policies and supports practices that ensure effective administration of the school. Indicator 2.2 - The governing body operates responsibly and functions effectively. Indicator 2.3 - The governing body ensures that the school leadership has the autonomy to meet goals for achievement and instruction and to manage day-to-day operations effectively. Indicator 2.4 - Leadership and staff foster a culture consistent with the school’s purpose and direction. Indicator 2.5 - Leadership engages stakeholders effectively in support of the school’s purpose and direction. Indicator 2.6 - Leadership and staff supervision and evaluation processes result in improved professional practice and student success. STANDARD 3 – TEACHING AND ASSESSING FOR LEARNING The school’s curriculum, instructional design, and assessment practices guide and ensure teacher effectiveness and student learning. Indicator 3.1 - The school’s curriculum provides equitable and challenging learning experiences that ensure all students have sufficient opportunities to develop learning, thinking, and life skills that lead to success at the next level. Indicator 3.2 - Curriculum, instruction, and assessment are monitored and adjusted systematically in response to data from multiple assessments of student learning and an examination of professional practice. Indicator 3.3 - Teachers engage students in their learning through instructional strategies that ensure achievement of learning expectations Indicator 3.4 - School leaders monitor and support the improvement of instructional practices of teachers to ensure student success. Indicator 3.5 - Teachers participate in collaborative learning communities to improve instruction and student learning. Indicator 3.6 - Teachers implement the school’s instructional process in support of student learning. Indicator 3.7 - Mentoring, coaching, and induction programs support instructional improvement consistent with the school’s values and beliefs about teaching and learning.
Indicator 3.8 - The school engages families in meaningful ways in their children’s education and keeps them informed of their children’s learning progress. Indicator 3.9 - The school has a formal structure whereby each student is well known by at least one adult advocate in the school who supports that student’s educational experience. Indicator 3.10 - Grading and reporting are based on clearly defined criteria that represent the attainment of content knowledge and skills and are consistent across grade levels and courses. Indicator 3.11 - All staff members participate in a continuous program of professional learning. Indicator 3.12 - The school provides and coordinates learning support services to meet the unique learning needs of students. STANDARD 4 - RESOURCES AND SUPPORT SYSTEMS The school has resources and provides services that support its purpose and direction to ensure success for all students. Indicator 4.1 - Qualified professional and support staff are sufficient in number to fulfill their roles and responsibilities necessary to support the school’s purpose, direction, and the educational program. Indicator 4.2 - Instructional time, material resources, and fiscal resources are sufficient to support the purpose and direction of the school. Indicator 4.3 - The school maintains facilities, services, and equipment to provide a safe, clean, and healthy environment for all students and staff. Indicator 4.4 - Students and school personnel use a range of media and information resources to support the school’s educational programs. Indicator 4.5 - The technology infrastructure supports the school’s teaching, learning, and operational needs. Indicator 4.6 - The school provides support services to meet the physical, social, and emotional needs of the student population being served. Indicator 4.7 - The school provides services that support the counseling, assessment, referral, educational, and career planning needs of all students. STANDARD 5 - USING RESULTS FOR CONTINUOUS IMPROVEMENT The school implements a comprehensive assessment system that generates a range of data about student learning and school effectiveness and uses the results to guide continuous improvement. Indicator 5.1 - The school establishes and maintains a clearly defined and comprehensive student assessment system. Indicator 5.2 - Professional and support staff continuously collect, analyze, and apply learning from a range of data sources, including comparison and trend data about student learning, instruction, program evaluation, and organizational conditions. Indicator 5.3 - Professional and support staff are trained in the evaluation, interpretation, and use of data. Indicator 5.4 - The school engages in a continuous process to determine verifiable improvement in student learning, including readiness for and success at the next level. Indicator 5.5 - Leadership monitors and communicates comprehensive information about student learning, conditions that support student learning, and the achievement of school improvement goals to stakeholders.
AdvancED® Standards for Quality Schools

43
The Wyoming Support and Capacity Subcommittee offers the following definition of capacity. “Capacity can be defined as the individual and collective ability to raise achievement, especially in the core subjects of reading, math, writing and science, of all students to levels demanded for college and career readiness.” The question of how to develop capacity is a topic of ongoing discussion.
Wyoming educators that have reviewed this document believe this methodology will increase student achievement with no additions to the legislation.
However, the annual Quality Counts report from Education Week Magazine will rate Wyoming low on Building and Supporting Capacity until the state formally addresses and implements statewide policies and processes in the following areas:
Supports for Beginning Teachers Professional Development School Leadership Class-Size Initiatives Student-Teacher Ratio School Facilities School Climate and Working Conditions
The Wyoming capacity subcommittee contends the following support priorities must be addressed to raise achievement.
Student engagement especially with various subgroups as the key enabler Human capital as professional capacity School learning climate as social capital Instructional guidance as program coherence Principal leadership as the catalyst for improvement and instructional analysis Central office support and transformation or how central office policies, practices
and structures support instruction and principal development Knowledge management and processes as large scale learning Supportive resources as enablers of learning Parent, school and community ties as social capital
Michael Fullan says the leading countries have improved their education systems by:
Focusing on a small number of clearly defined goals Improving the teaching profession Improving leadership Using data non-judgmentally to inform instruction Developing a culture of collaboration and transparent, shared practice

44
The WDE plan for support and capacity building has several benefits:
1. It will result in increased student achievement in Wyoming.
2. It meets the requirements of the Wyoming Accountability in Education Act.
3. It is inexpensive and sustainable.
It is the role of the Wyoming legislature to determine which, if any, additional support priorities on the previous page are included in legislation. In developing a system of support, the challenge for the Wyoming legislature lies in determining which type of support will address the reason individual legislators voted for increased education accountability. A system of support designed by poverty warriors might be quite different than the system developed by those who want reduced spending and less bureaucracy.
The education marketplace abounds with a confusing array of non-profit and for-profit corporations, institutes, think-tanks, foundations, consultants, vendors, trainings, conventions, mechanized teaching methods, commercial programs, proprietary processes and technology all competing for their share of education spending. Each offers “solutions” within the context of the product or service they sell.
Purchasing products and services is necessary in education. However, fixing failing schools has only recently become a multi-billion dollar industry across the United States. For-profit and non-profit school improvement companies and consultants are abundant, offering products and services to turn around, transform or take over failing schools, presumably because billions in federal spending has been targeted for that purpose. A recent Denver Post investigative series, Cashing in on School Failure, raised concern about the return on investment for spending on school improvement companies and consultants in Colorado and nationwide.
Wyoming will not be a national education leader by focusing on low performing schools and low achieving students. To reach the ambitious goals
of the Wyoming Accountability in Education Act, all Wyoming schools, teacher and students must make progress.
The Wyoming Department of Education does not discriminate on the basis of race, color, national origin, sex, age, or disability in
admission or access to, or treatment or employment in its educational programs or activities. Inquiries concerning Title VI, Title IX, Section
504, and the Americans with Disabilities Act may be referred to the Wyoming Department of Education, Office for Civil Rights Coordinator,
2nd floor, Hathaway Building, Cheyenne, Wyoming 82002 0050 or (307) 777-3544, or the Office for Civil Rights, Region VIII, U. S.
Department of Education, Federal Building, Suite 310, 1244 Speer Boulevard, Denver, CO 80204-3582, or (303) 844-5695 or TDD (303) 844
-3417. This publication will be provided in an alternative format upon request.