www.arcorealestate.com management presentation february, 2009 real estate market overview 2008...
TRANSCRIPT

www.arcorealestate.com
Management Presentation
February, 2009
Real estate market overview 2008Estonia

www.arcorealestate.com
• Founded in 1992• Integrated property developer, constructor and agent in the Baltic
countries undergoing a SEE expansion with presence already established in Ukraine and Bulgaria
• Employs ca. 400 people in 5 countries
• Since 21.06.2007 listed on Tallinn Stock Exchange. Ticker “ARC1T”
• Services: brokerage, valuation, facility management, property advisory, environmental and civil construction, real estate development, facility and property management
Arco Vara in profile

www.arcorealestate.com
Real Estate market in Estonia
Trends 2007 2008 Domination in investment Vendors' market Buyers' market Domination in leasing Landlord's market Tenants' market
Occupiers' behavior Keeping assets Intention/willingness for Sale-Lease-Back
Developers' behavior Keeping assets Exiting assets Debt financing Conservative Almost absent Yields Compressing->Stabilizing Rising Rents Growing->Stabilizing Decreasing Sales period 3-4 months 9-12 months
Source: Colliers international

www.arcorealestate.com
Residential: Transactions of apartments in Tallinn (source: National Land Board)

www.arcorealestate.com
Sale offers of private houses and sales in Tallinn, 2006-2008 (source: National Land Board, web database City24.ee)
www.arcorealestate.com
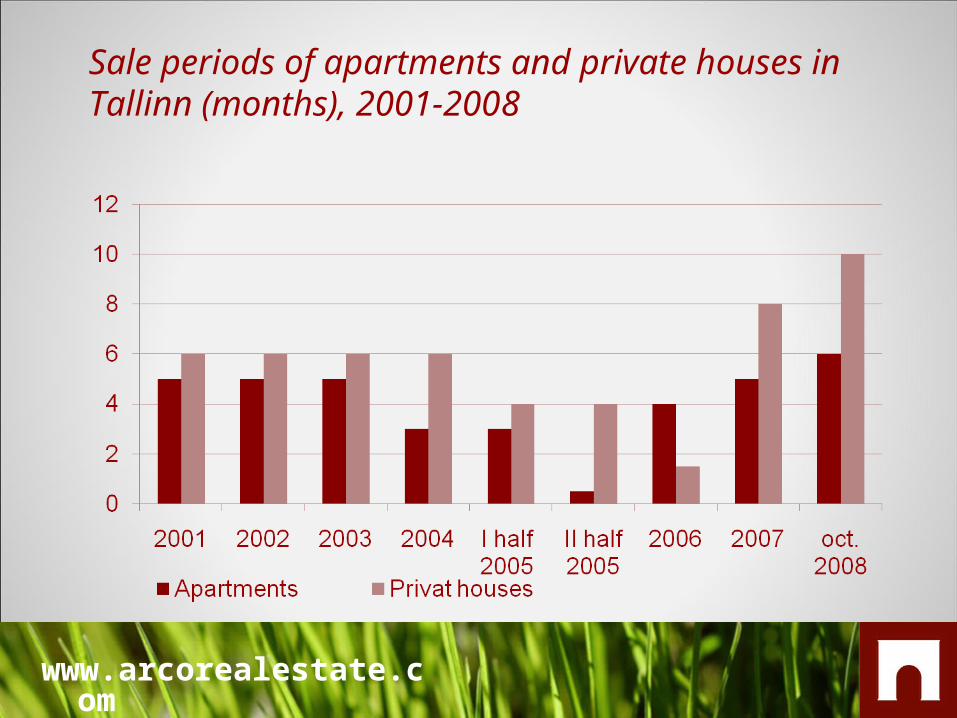
Sale periods of apartments and private houses in Tallinn (months), 2001-2008

www.arcorealestate.com
Changes in average transaction value in a year(apartments, EUR)

www.arcorealestate.com
New apartments 2003-21.10.2008, building permits, pieces

www.arcorealestate.com
Business premises: Average rental prices (net) of office spaces (EUR/m2/month), 2008
City A B
Tallinn 10-18 7-10
Tartu 11-16 5-11
Pärnu 7-12 4-6
Rakvere 6-16 5-7
Jõhvi, Narva 7-10 70-7
Haapsalu 9-13 6-10
Kuressaare 7 5
Viljandi 4-6 2.5-4

www.arcorealestate.com
Changes in the highest rental prices and in vacancy rates of office spaces in Tallinn
Average vacancy rate
The highest rental price

www.arcorealestate.com
Building permit of office buildings, 2005 - 2008 (I – III quarter), m2 (new buildings)
Building permit 2005-2008 (III Q)(county) 2005 2006 2007 2008 (I-III Q) Total
Harjumaa 51 788 141 662 234 941 79 017 507 408
Tartumaa 3 132 11 214 10 606 12 674 37 626
Pärnumaa 1 189 16 11 685 0 12 891
Lääne -Virumaa 1 954 160 0 5 821 7 934
Ida- Virumaa 0 1 770 15 275 5 763 22 809
www.arcorealestate.com
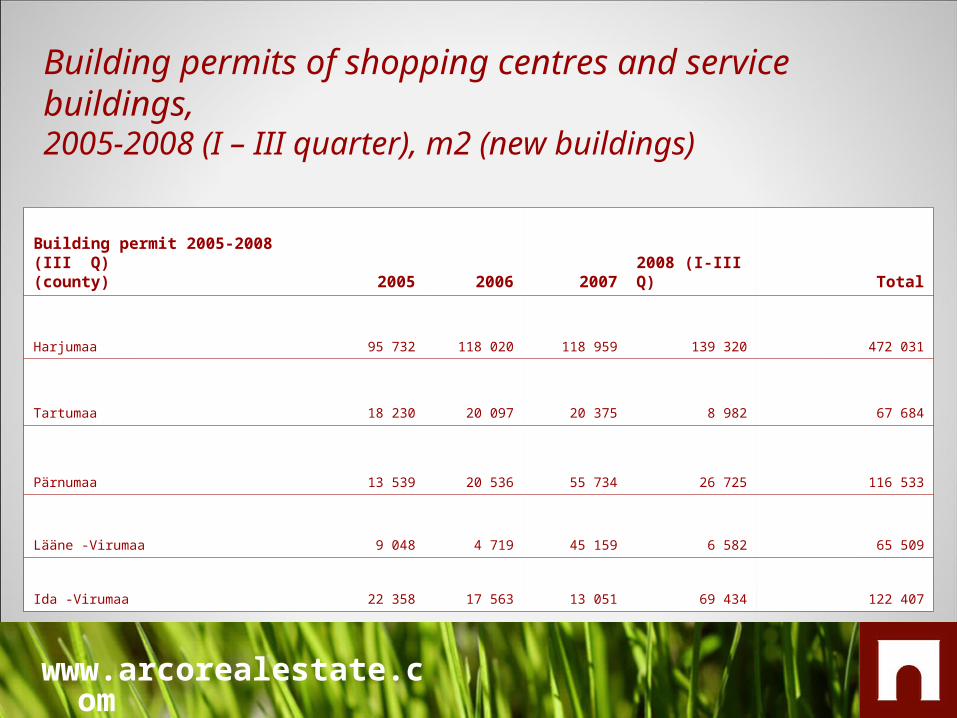
Building permits of shopping centres and service buildings, 2005-2008 (I – III quarter), m2 (new buildings)
Building permit 2005-2008 (III Q)(county) 2005 2006 2007 2008 (I-III Q) Total
Harjumaa 95 732 118 020 118 959 139 320 472 031
Tartumaa 18 230 20 097 20 375 8 982 67 684
Pärnumaa 13 539 20 536 55 734 26 725 116 533
Lääne -Virumaa 9 048 4 719 45 159 6 582 65 509
Ida -Virumaa 22 358 17 563 13 051 69 434 122 407

www.arcorealestate.com
Average rental prices (net) of industrial spaces (EUR/m2/month) 2008
City(city) Class A Class B and C
Tallinn4.4 – 6.4 1 - 5
Tartu 4.4 - 5 2.2 – 3.1
Pärnu 3.1 – 6.4 0.3 – 2.5
Rakvere - 1.6 - 4
Jõhvi, Narva 4-6 1.6 - 3.1
Haapsalu - 0.7 – 3.8
Viljandi 2.5-3.1 1.3-2

www.arcorealestate.com
Building permits of industrial spaces, 2005-2008 (I – III Q), m2 (new buildings)
Building permit, 2005-2008 (III Q)(county) 2005 2006 2007 2008 (I-III Q) Total
Harjumaa 145 237 189 559 214 346 112 839 661 981
Tartumaa 10 103 93 680 48 827 37 632 190 242
Pärnumaa 20 921 16 812 5 511 12 684 55 929
Lääne -Virumaa 10 231 20 169 5 001 3 737 39 137
Ida -Virumaa 1 446 4 354 2 664 7 970 16 433

www.arcorealestate.com
Thank You!
Management Presentation
February, 2009