wr2012 executive summary aug2016 - microsoft azure
TRANSCRIPT

WATER RESOURCES OF SOUTH AFRICA, 2012 STUDY (WR2012)
WR2012 Study Executive Summary
Report to the Water Research Commission
by
AK Bailey and WV Pitman Royal HaskoningDHV (Pty) Ltd
WRC Report No. TT 683/16
August 2016
Water Resources of South Africa 2012 (WR2012): Executive Summary
ii
Obtainable from Water Research Commission Private Bag X03 GEZINA, 0031 [email protected] or download from www.wrc.org.za
The publication of this report emanates from a project entitled Water Resources of South Africa, 2012 (WR2012) (WRC Project No. K5/2143/1).
This report forms part of a series of nine reports. The reports are:
1. WR2012 Executive Summary (WRC Report No. TT 683/16 – this report) 2. WR2012 User Guide (WRC Report No. TT 684/16) 3. WR2012 Book of Maps (WRC Report No. TT 685/16) 4. WR2012 Calibration Accuracy (WRC Report No TT 686/16t) 5. WR2012 SAMI Groundwater module: Verification Studies, Default Parameters and Calibration
Guide (WRC Report No. TT 687/16) 6. WR2012 SALMOD: Salinity Modelling of the Upper Vaal, Middle Vaal and Lower Vaal sub-Water
Management Areas (new Vaal Water Management Area) (WRC Report No. TT 688/16) 7. WRSM/Pitman User Manual (WRC Report No. TT 689/16) 8. WRSM/Pitman Theory Manual (WRC Report No. TT 690/16) 9. WRSM/Pitman Programmer’s Code Manual WRC Report No. TT 691/16)
DISCLAIMER
This report has been reviewed by the Water Research Commission (WRC) and approved for publication. Approval does not signify that the contents necessarily reflect the views and policies of the WRC, nor does mention of trade names or commercial products constitute endorsement or
recommendation for use.
ISBN 978-1-4312-0844-9 Printed in the Republic of South Africa © WATER RESEARCH COMMISSION
Water Resources of South Africa 2012 (WR2012): Executive Summary
iii
ACKNOWLEDGEMENTS
The authors would like to acknowledge:
The Water Research Commission for their commissioning and funding of this entire project. The Department of Water and Sanitation for their rainfall, streamflow, Reservoir Record and water quality data, some GIS maps and their participation on the Reference Group. The South African Weather Services (SAWS) for their rainfall data.
The following firms and their staff who provided major input:
Royal HaskoningDHV (Pty) Ltd: Mr Allan Bailey, Dr Marieke de Groen, Miss Kerry Grimmer (now WSP Group), Mr Sipho Dingiso, Miss Saieshni Thantony, Miss Sarah Collinge, Mr Niell du Plooy and consultant Dr Bill Pitman (all aspects of the study);
SRK Consulting (SA) (Pty) Ltd: Ms Ansu Louw, Miss Joyce Mathole and Ms Janet Fowler (Land use and GIS maps);
Umfula Wempilo Consulting cc: Dr Chris Herold (water quality); Alborak: Mr Grant Nyland (model development); GTIS: Mr Töbias Goebel (website), and WSM: Mr Karim Sami (groundwater).
The following persons who provided input into the coding of the WRSM/Pitman model:
Dr Bill Pitman; Mr Allan Bailey; Mr Grant Nyland; Mrs Riana Steyn and Mr Pieter Van Rooyen.
Other involvement as follows:
Many other organizations and individuals provided information and assistance and the contributions were of tremendous value.
Water Resources of South Africa 2012 (WR2012): Executive Summary
iv
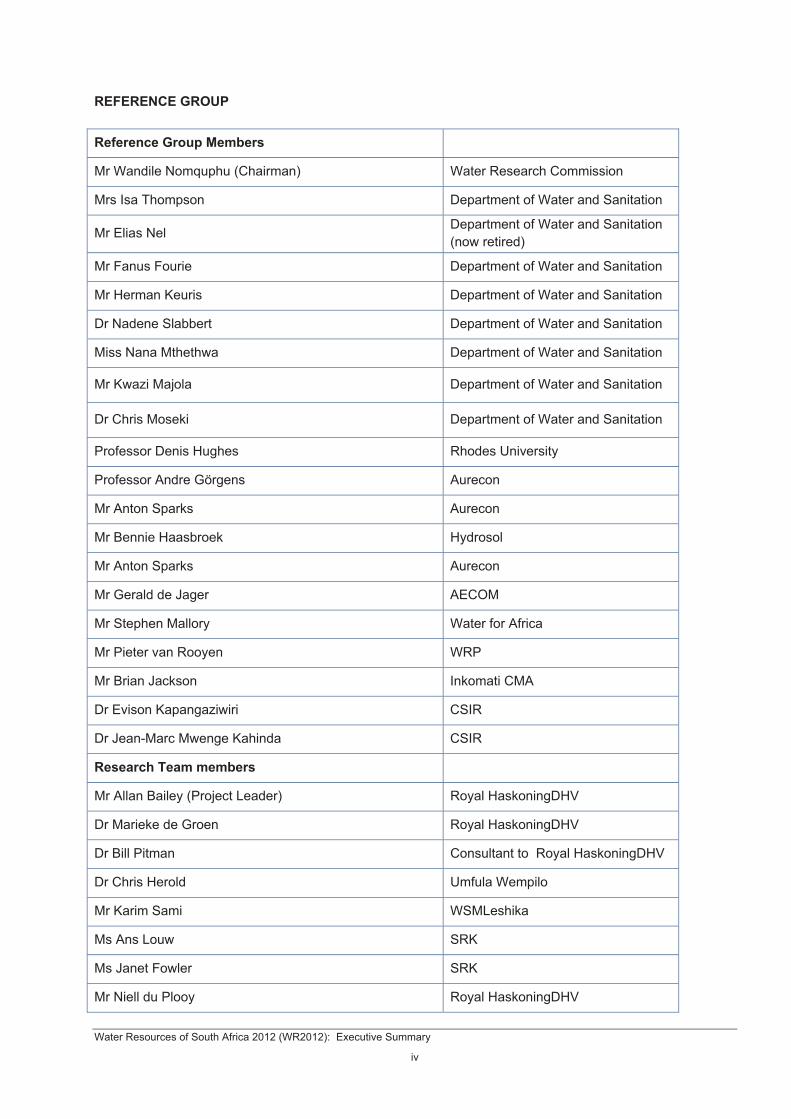
REFERENCE GROUP
Reference Group Members
Mr Wandile Nomquphu (Chairman) Water Research Commission
Mrs Isa Thompson Department of Water and Sanitation
Mr Elias Nel Department of Water and Sanitation (now retired)
Mr Fanus Fourie Department of Water and Sanitation
Mr Herman Keuris Department of Water and Sanitation
Dr Nadene Slabbert Department of Water and Sanitation
Miss Nana Mthethwa Department of Water and Sanitation
Mr Kwazi Majola Department of Water and Sanitation
Dr Chris Moseki Department of Water and Sanitation
Professor Denis Hughes Rhodes University
Professor Andre Görgens Aurecon
Mr Anton Sparks Aurecon
Mr Bennie Haasbroek Hydrosol
Mr Anton Sparks Aurecon
Mr Gerald de Jager AECOM
Mr Stephen Mallory Water for Africa
Mr Pieter van Rooyen WRP
Mr Brian Jackson Inkomati CMA
Dr Evison Kapangaziwiri CSIR
Dr Jean-Marc Mwenge Kahinda CSIR
Research Team members
Mr Allan Bailey (Project Leader) Royal HaskoningDHV
Dr Marieke de Groen Royal HaskoningDHV
Dr Bill Pitman Consultant to Royal HaskoningDHV
Dr Chris Herold Umfula Wempilo
Mr Karim Sami WSMLeshika
Ms Ans Louw SRK
Ms Janet Fowler SRK
Mr Niell du Plooy Royal HaskoningDHV
Water Resources of South Africa 2012 (WR2012): Executive Summary
v
Mr Töbias Gobel GTIS
Miss Saieshni Thantony Royal HaskoningDHV
Mr Grant Nyland Alborak
Miss Sarah Collinge Royal HaskoningDHV
Miss Kerry Grimmer WSP
Ms Riana Steyn Consultant
Miss Joyce Mathole SRK
Mr Sipho Dingiso Ex Royal HaskoningDHV

Water Resources of South Africa 2012 (WR2012): Executive Summary
vi
This page was deliberately left blank
Water Resources of South Africa 2012 (WR2012): Executive Summary
vii
PREFACE
This is one of a series of reports which contain the results of a revised appraisal of the Water Resources of South Africa, undertaken in terms of a contract between the Water Research Commission (WRC) and Royal HaskoningDHV.
This is the sixth such water resources appraisal, the first was completed in 1952 by Professor Desmond Midgley. Dr Bill Pitman has been involved in the last five (including this appraisal). With every appraisal, significant improvements are made in the methodology, use of the latest computer technology, level of catchment detail and resulting accuracy in the results. There are however, some data deterioration and data access issues which are beyond the control of the study team which are proving to be big challenges to anyone in the water resources field. In the previous study (WR2005), there were three main documents and a DVD. In this WR2012 study, there is a website which contains all the deliverables (www.waterresourceswr2012.co.za).
Highlights emanating from this WR2012 study are as follows:
the website has attracted over 950 users to date who could access completed information long before the study was completed. The website is a far more efficient way for the WR2012 project team to update and liaise with this large group of people;
rainfall and observed streamflow data has been updated and patched from September 2005 to September 2010. Also reservoir inflows, transfers and outflows based on reservoir records and water quality data for TDS and other water quality parameters have been updated to September 2010;
the present day development analysis was carried out for the first time. This means that the time series of rainfall as from 1920 to 2010, was used to generate flows as they would have been under present day development. This gives important information as to the effect of land use/water use on the study area and as to the functioning of current developments under different hydrological conditions. Eighty-four key points throughout the study area have been analysed in detail;
the daily time step version of the WRSM/Pitman model was developed; the naturalised mean annual runoff as a total leaving the study area was virtually the same as for
the previous study (WR2005) then determined at 49 210 million m³/annum and now at 49 251 million m³/annum. There were more significant differences per Water Management Area;
the number of streamflow gauges used in the WRSM/Pitman model set-ups for calibration was increased from 546 to just over 600. Some however were historic records only, as they have closed down. A calibration accuracy analysis was carried out and gauging stations were split into six categories to inform users about the usefulness of such a gauge for water resource analysis;
the study gives an analysis of the deterioration in rainfall recording, streamflow gauging and reservoir records, which will be a huge challenge for the future;
useful new tools and graphs have been added to WRSM/Pitman, such as additional massplot and cusum (cumulative sum) plots for rainfall and streamflow, multiple runoff module calibration, inclusion of a groundwater abstraction time series, addition of an observed storage plot for reservoirs, highlighting of routes with observed streamflow when plotting, etc.;
groundwater/surface water interaction verification studies have been done using the WRSM/Pitman model and Sami methodology and default parameters of the Sami method have been revised to improve on the groundwater surface water interaction;
monitoring of rainfall, streamflow and water quality has been analysed and recommendations have been given for improvement of the monitoring;
a salinity analysis using the SALMOD-model was done on the entire Vaal River catchment, the addition to WRSM/Pitman of the WQT Type 4 methodology for irrigation;

Water Resources of South Africa 2012 (WR2012): Executive Summary
viii
based on all the above-mentioned information, the 1 960 odd quaternaries were updated and a re-calibration was carried out on all gauging stations and
nine study and model reports.
While these highlights are a result of an extensive study, the Reference Group has a wish list of recommendations to build further on the current work, to make it even more useful and to have it remain relevant. Some exciting new possibilities for future appraisals are rendering GIS maps more intelligent, applications on cell phones for obtaining data (possibly rainfall in particular) and extending appraisals to other African countries. A K Bailey Dr W V Pitman
WR2012 Consortium

Water Resources of South Africa 2012 (WR2012): Executive Summary
ix
TABLE OF CONTENTS
PREFACE ....................................................................................................................................... vii 1 Background ............................................................................................................................ 1 2 Introduction ............................................................................................................................ 2 3 Aims and Objectives .............................................................................................................. 4 4 Analysis .................................................................................................................................. 5
4.1 Pitman Daily Time Step Model (part A) ......................................................................................... 5 4.2 Land/Water Use Spreadsheets ...................................................................................................... 6 4.3 Enhanced WRSM/Pitman model ................................................................................................... 7 4.4 Monitoring analysis of rainfall, observed streamflow and water quality stations ........................... 8 4.5 WR2012 and WRSM2000 Training Courses (part A) .................................................................... 9 4.6 Enhancements to Sami Groundwater Data ................................................................................... 9 4.7 Enhancements to WMAs 6, 7, 11 and 12 .................................................................................... 10 4.8 WRSM/Pitman model development with regard to the irrigation methodology Type 4 ............... 10 4.9 WRSM/Pitman daily time step model (part B) and degree of accuracy of about 600
streamflow gauging stations ........................................................................................................ 11 4.10 Water Quality Spreadsheets and WR90 Appendices .................................................................. 11 4.11 Graphical Enhancement of the WRSM/Pitman Graphs ............................................................... 12 4.12 Enhancements to Sami groundwater (Part B) and Inclusion of WRSM2000 Studies ................. 13 4.13 Simulated Present Day Analysis (Part A) .................................................................................... 14 4.14 Training and User Support (Part B) ............................................................................................. 21 4.15 Website Development .................................................................................................................. 21 4.16 Present Day Streamflow (part B) ................................................................................................. 24 4.17 Update GIS Maps, Reports having used WRSM/Pitman to analyse South Africa, Lesotho
and Swaziland and SALMOD water quality analysis on the Upper Vaal, Middle Vaal and Lower Vaal sub-WMAs ................................................................................................................ 24
5 Training and User Support .................................................................................................. 30 6 Using WR2012 ...................................................................................................................... 30 7 Current and Future Water Resources Challenges ............................................................ 30
7.1 Data Deterioration: Reservoir records/dam balances .................................................................. 30 7.2 Data Deterioration: Rainfall .......................................................................................................... 32 7.3 Data Deterioration: Observed Streamflow ................................................................................... 32
8 Project User Support ........................................................................................................... 33 9 Project documentation ........................................................................................................ 33
9.1 Project Website ............................................................................................................................ 33 9.2 Hard Copy Documents ................................................................................................................. 34
10 Capacity Building ................................................................................................................. 34 11 Conclusions and Recommendations ................................................................................. 35 12 References ............................................................................................................................ 36 Appendix A: Comparison of Naturalised MAR between WR90, WR2005, WR2012 Studies .. 38

Water Resources of South Africa 2012 (WR2012): Executive Summary
x
LIST OF TABLES
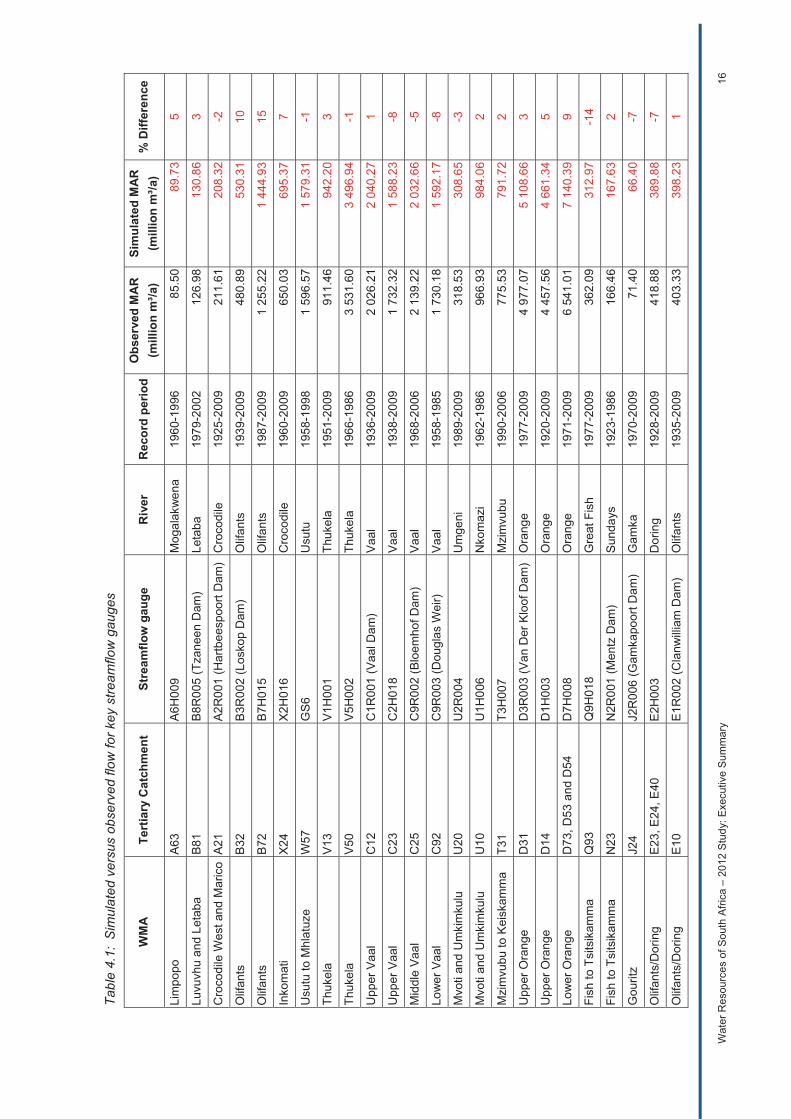
Table 4.1: Simulated versus observed flow for key streamflow gauges ................................... 16
Table 4.2: SALMOD output for water quality gauge C8H007 ................................................... 28
Table 4.3: Comparison of salinity results between the VRSAU study (using WQT) and WR2012 (using SALMOD) ....................................................................................... 29
LIST OF FIGURES
Figure 1.1: The history of country wide water resources appraisals for South Africa, Lesotho and Swaziland .............................................................................................. 1
Figure 4.1: Daily time step for a catchment in the Olifants WMA ................................................. 6
Figure 4.2: Simulated versus observed storage for Blyderivierspoort Dam ................................. 7
Figure 4.3: Groundwater plot for quaternary B72E ...................................................................... 9
Figure 4.4: Sources of data for WMAs ....................................................................................... 10
Figure 4.5: Annual hydrograph with zooming ............................................................................. 12
Figure 4.6: Mean monthly hydrograph with “Box Plot” and “Scatter” ......................................... 13
Figure 4.7: Schematic of present day and naturalised streamflow ............................................. 20
Figure 4.8: Website schematic ................................................................................................... 23
Figure 4.9: GIS Runoff map for the Thukela WMA ..................................................................... 26
Figure 4.10: SALMOD graphical output of flow, TDS and load for water quality gauge C8H007 .................................................................................................................... 27
Figure 7.1: Map showing major dams (greater than 1 million m³) and corresponding reservoir records ...................................................................................................... 31
Figure 7.2: Number of useful rainfall stations open over time .................................................... 32
Figure 7.3: Number of useful observed streamflow stations open over time ............................. 33

Water Resources of South Africa 2012 (WR2012): Executive Summary
xi
GLOSSARY OF ACRONYMS CUSUM Plot of rainfall less mean rainfall on a cumulative basis. Also for streamflow DRM Desktop Reserve Model DWS Department of Water and Sanitation EMC Ecological Management Class EWR Ecological Water Requirement GRAII Groundwater Resource Assessment Study IAP Invasive Alien Plants IFR Instream Flow Requirement MAP Mean Annual Precipitation MAR Mean Annual Runoff MASSPLOT Cumulative plot of rainfall or streamflow against time PATCHTAB Patching model for streamflow RQIS Resource Quality Information Services which is a directorate in the Water
Monitoring and Information chief directorate under the Planning and Information Branch of the Department of Water and Sanitation
SALMOD Salinity Model for Water Quality SAPWAT Unknown – name of the model SFR Streamflow Reduction Activity SPATSIM Spatial Simulation Framework of models TDS Total Dissolved Salts WMA Water Management Area WQS Sulphate version of the WQT model WQT Water Quality Model WRC Water Research Commission WRMF Water Resources Modelling Framework WRSM/Pitman Water Resources Simulation Model 2000 sometimes also referred to as the
Pitman model WRYM Water Resources Yield Model WR90 Water Resources of South Africa (1990) study WR2005 Water Resources of South Africa 2005 study WR2012 Water Resources of South Africa 2012 study (this study)

Water Resources of South Africa – 2012 Study: Executive Summary 1
1 BACKGROUND
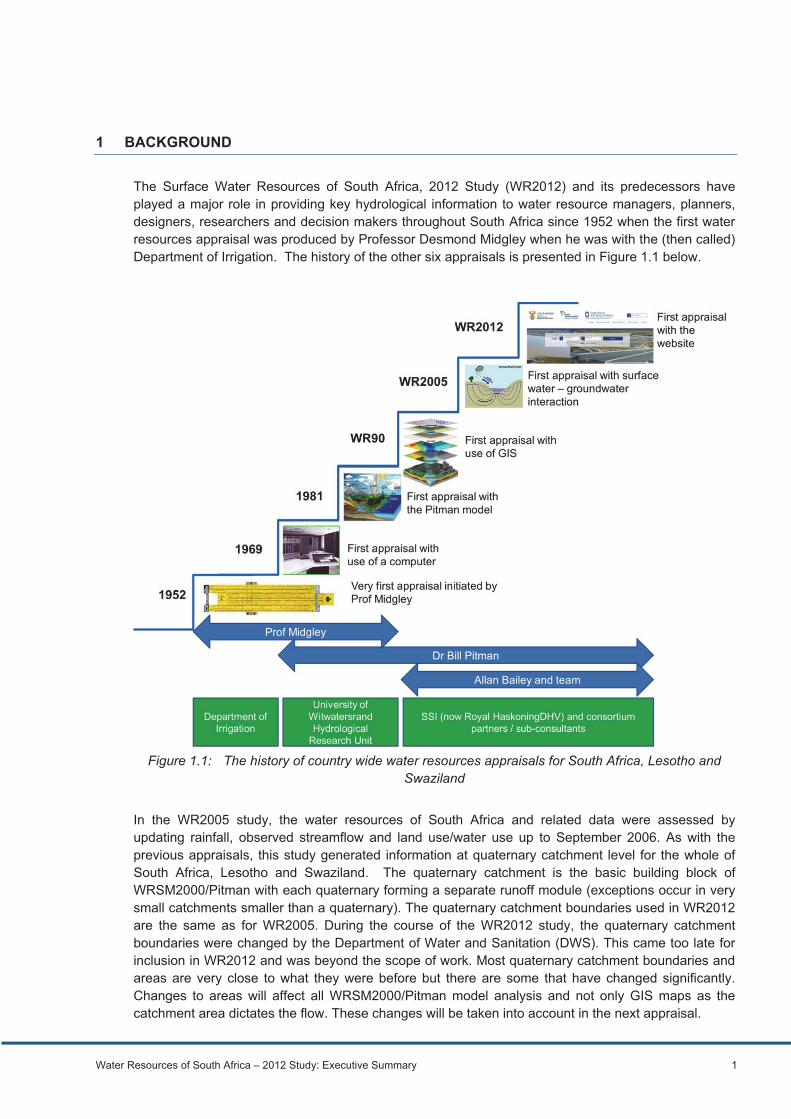
The Surface Water Resources of South Africa, 2012 Study (WR2012) and its predecessors have played a major role in providing key hydrological information to water resource managers, planners, designers, researchers and decision makers throughout South Africa since 1952 when the first water resources appraisal was produced by Professor Desmond Midgley when he was with the (then called) Department of Irrigation. The history of the other six appraisals is presented in Figure 1.1 below.
Figure 1.1: The history of country wide water resources appraisals for South Africa, Lesotho and Swaziland
In the WR2005 study, the water resources of South Africa and related data were assessed by updating rainfall, observed streamflow and land use/water use up to September 2006. As with the previous appraisals, this study generated information at quaternary catchment level for the whole of South Africa, Lesotho and Swaziland. The quaternary catchment is the basic building block of WRSM2000/Pitman with each quaternary forming a separate runoff module (exceptions occur in very small catchments smaller than a quaternary). The quaternary catchment boundaries used in WR2012 are the same as for WR2005. During the course of the WR2012 study, the quaternary catchment boundaries were changed by the Department of Water and Sanitation (DWS). This came too late for inclusion in WR2012 and was beyond the scope of work. Most quaternary catchment boundaries and areas are very close to what they were before but there are some that have changed significantly. Changes to areas will affect all WRSM2000/Pitman model analysis and not only GIS maps as the catchment area dictates the flow. These changes will be taken into account in the next appraisal.

Water Resources of South Africa – 2012 Study: Executive Summary 2
Likewise the 19 Water Management Areas (WMAs) were condensed into 9. This was mostly done by combining certain WMAS, for instance the Upper Orange WMA and Lower Orange WMA are now just the Orange WMA, however, there were some minor changes with some quaternary catchments which were exceptions. Again this change came too late for inclusion in WR2012 and was beyond the scope of work and reporting was based on the 19 WMAs that were defined at the start of the project. The consolidation of the WMAs will be dealt with in the next appraisal.
As the climate in this study area is so variable over time, the updating of these appraisals will remain important. However, this was not the only need for a WR2012 study. There have been a number of significant developments since the WR2005 study which increased the need for a new appraisal, as follows:
recent findings have been made as a result of improved research on land-use modelling techniques and improved estimates of water use by different water sectors;
developments in website technology have made it possible to provide all the WR2012 deliverables on a website. This makes it far easier for users to obtain the latest information and data and far easier for the WR2012 developers to update the information;
enhancement of the WQT irrigation Type 4 methodology with improved calculation of return flow has been implemented in the WRSM/Pitman model;
increased levels of catchment detail have been made possible by Google Earth technology and other sources of data;
improved computer technology resulted in improvement of WRSM/Pitman graphs and a daily time step for WRSM/Pitman in addition to the normal monthly time step and a number of
improved techniques, new graphs, etc.
In 2010 the Water Research Commission (WRC) produced a Terms of Reference and called for proposals to undertake a four-year project, called the Water Resources of South Africa, 2012 Study (WR2005), to conduct new innovative research and to build on WR2005. The new study was called WR2012 and was commissioned in 2012 by the WRC.
The WRSM/Pitman model is sometimes referred to as WRSM2000 (generally in South Africa) but also as the Pitman model (often in other African countries). We have therefore decided to call it WRSM/Pitman. This model name is regularly confused with WR2005 and/or WR2012 but they refer to the studies.
2 INTRODUCTION
The Water Research Commission, in its terms of reference for the WR2012 study, set out the rationale for the study and defined the aims, objectives and deliverables. It also addressed the focus of the study and laid out guidelines for the project team.
The WR2012 study has focussed on investigating water resources in an integrated perspective in line with the objectives of Integrated Catchment Management enshrined in the National Water Resources Strategy. This study has not merely resulted in an update of WR2005 data, but has re-evaluated, improved, produced new innovative work and developed new tools which are now available. Knowledge of various new developments and an analysis of trends that have emerged in the water sector in the past five years have guided the researchers in project implementation. Furthermore, the WR2012 study has taken into account difficulties experienced by water resource users and where possible have made improvements.
Water Resources of South Africa – 2012 Study: Executive Summary 3
The evaluation and improvement of existing tools, development of new tools and development of a website for WR2012, will allow for national water resources planning which is more accurate and more efficient and will allow for easier updating in the future. The emphasis in this study was in extending “what if” capability developed in WR2005 to the user who would then be in the advantageous position of being able to generate his/her own information and GIS maps by combining information. The website will greatly facilitate the rapid updating of data and availability of totally new information which became available as it was completed and not only at the end of the project as with WR2005.
Unlike WR2005 in which there were seven consulting firms involved, the core analysis for WR2012 has been done mainly by Royal HaskoningDHV and Dr Bill Pitman with involvement from others as given in section 12. This has facilitated greater consistency of analysis and addition of detail so that the whole country is on a par in this respect.
The primary deliverable was the WR2012 website which contains the database, programs, GIS maps, model set-ups for WRSM/Pitman, spreadsheets, time series datafiles, documents and nine reports.
In summary, the WR2012 study contains the following:
land use : improved level of detail on farm dams, major reservoirs and observed stream-flow gauges, particularly for Water Management Areas (WMAs) 6, 7, 11 and 12 but throughout the entire study area;
updating and patching of rainfall and observed streamflow data from September 2005 to September 2010. Updating of reservoir inflows, transfers and outflows based on reservoir records to September 2010 and patching thereof. Updating of water quality data for TDS and other water quality parameters to September 2010;
monitoring requirements pertaining to rainfall, observed stream-flow and water quality in every quaternary catchment;
land use details pertaining to abstractions and return flows, dams, afforestation and alien vegetation for every quaternary catchment;
WRSM/Pitman model daily time step (Pitman, 1976); WRSM/Pitman model enhancement pertaining to additional graphs, multiple module calibration
changes, groundwater enhancements general graphical enhancements such as zooming, panning, log scale, etc.; present day simulated streamflow with rainfall, observed stream-flow and land use up to
September 2010 and with land use set at 2010 development levels throughout. These streamflows have been analysed at 84 key points throughout the country;
WR2012 and WRSM/Pitman model training courses at a number of universities and other organizations;
enhancements to Sami groundwater data and verification studies; WRSM/Pitman model : addition of new WQT irrigation Type 4 methodology; water quality spreadsheet update for 10 years of data for every quaternary catchment; inclusion of the latest catchment studies where WRSM/Pitman has been used; updating of all WRSM/Pitman data sets for South Africa, Lesotho and Swaziland to September
2010; recalibration of every quaternary catchment based on updated and new data of about 600
observed streamflow records; statistical analysis of about 600 observed streamflow records; extension of the SALMOD water analysis to the entire Vaal catchment with data up to September
2010; updating of menu options to inspect patched observed streamflow, rainfall stations, catchment
rainfall, catchment rainfall groups, naturalised streamflow, present day streamflow and physical quaternary data;
updating of GIS maps;
Water Resources of South Africa – 2012 Study: Executive Summary 4
website development. All the menu options for the above have been included in a website and nine reports as follows:
WR2012 Executive Summary; WR2012 User Guide; WR2012 Book of Maps; WR2012 Calibration Accuracy; WR2012 SAMI Groundwater module: Verification Studies, Default Parameters and Calibration
Guide; WR2012 SALMOD: Salinity Modelling of the Upper Vaal, Middle Vaal and Lower Vaal sub-
Water Management Areas (new Vaal Water Management Area); WRSM/Pitman User Manual; WRSM/Pitman Theory Manual and WRSM/Pitman Programmer’s Code Manual.
Note that work covered in this report is dealt with very much as an overview. More detail can be found in the WR2012 User Guide.
3 AIMS AND OBJECTIVES
The broad aims and objectives of the WR2012 study as outlined in the terms of reference were to:
evaluate the previous WR2005 project and analyse user requests; determine the WR2012 project deliverables; develop WR2012 tools; support users in using the WR2012 products; document the project work and package products efficiently and cost effectively and build capacity in use of the deliverables.
Deliverables were defined as:
a website to be developed halfway through the project containing all WR2012 products; an updated WRSM/Pitman model and/or other tools; new products such as land/water use spreadsheets, monitoring analysis spreadsheets, present
day analysis and reservoir records; data collection, re-calibration and simulations of the whole of South Africa at quaternary scale; project reports and capacity development through training courses, involvement of young term members and user
support.
Accordingly, sixteen tasks were established by the project team in the proposal of May 2012. Some of these tasks were re-ordered to facilitate the website being included as a task in itself so that completed deliverables could be added to the website as soon as they were completed, thus enabling users to get maximum advantage from them. Accordingly the website was included as a separate task 16 and a revised list of 18 tasks were formulated as follows:
Task 1: Advance for initiating all tasks; Task 2: Pitman daily time step model (part A); Task 3: Land/water use spreadsheets (part A); Task 4: WRSM/Pitman model enhancement including additional graphs, user friendly features
and groundwater enhancements; Task 5: Monitoring analysis of rainfall, observed streamflow and water quality stations; Task 6: Training courses and support for WR2012 and WRSM/Pitman (part A);

Water Resources of South Africa – 2012 Study: Executive Summary 5
Task 7: Sami groundwater enhancements (part A); Task 8: Enhancement of land use details for WMAs 6, 7, 11 and 12; Task 9: WRSM/Pitman model enhancements: irrigation Type 4 method; Task 10: Pitman daily time step (part B) and degree of calibration accuracy of the ± 600
streamflow gauges; Task 11: Water quality spreadsheet updates and inclusion of WR90 graphs; Task 12: WRSM/Pitman model enhancement: Graphical enhancement of WRSM2000 graphs; Task 13: Sami groundwater (part B) and inclusion of WRSM/Pitman studies in the WRSM/Pitman
data sets; Task 14: Simulated present day analysis (part B) including updating of rainfall, observed
streamflow and land use to September 2010 and re-calibration at all streamflow gauges and major reservoirs;
Task 15: Training courses and User Support for WR2012 and WRSM/Pitman (part B); Task 16: Website development and loading of all products; Task 17: Simulated present day (part B); Task 18: Final reports, spreadsheets, GIS maps and SALMOD water quality analysis. WR2012
Executive Summary, WR2012 User Guide, WR2012 Book of Maps, WRSM/Pitman User Guide, WRSM/Pitman Theory Manual, WRSM/Pitman Computer Code Manual, Sami groundwater, Pitman analysis of about 600 streamflow stations and Salinity analysis using the SALMOD water quality model to update the Upper Vaal, Middle Vaal and Lower Vaal WMAs.
Note: During the course of the study, the 19 WMAs were consolidated into 9. WR2012 undertook to report on the 19 WMAs and the changes to 9 WMAs were beyond the scope of the study. Future appraisals will be based on 9 WMAs.
4 ANALYSIS
The work done in each of these 18 tasks and resulting output is described in the sections that follow. Note that Task 1 was not a work item but an advance, so the tasks start from Task 2. Being an Executive Summary, these tasks are given in broad overview. Further details are given in the WR2012 User Guide.
4.1 PITMAN DAILY TIME STEP MODEL (PART A)
A daily time step model was added to WRSM/Pitman based on the Pitman methodology initially developed in 1976 (Pitman, 1976). The methodology is included in the WRSM/Pitman Theory manual. It is a separate model to the monthly time step WRSM/Pitman but it also includes aspects pertaining to monthly rainfall.
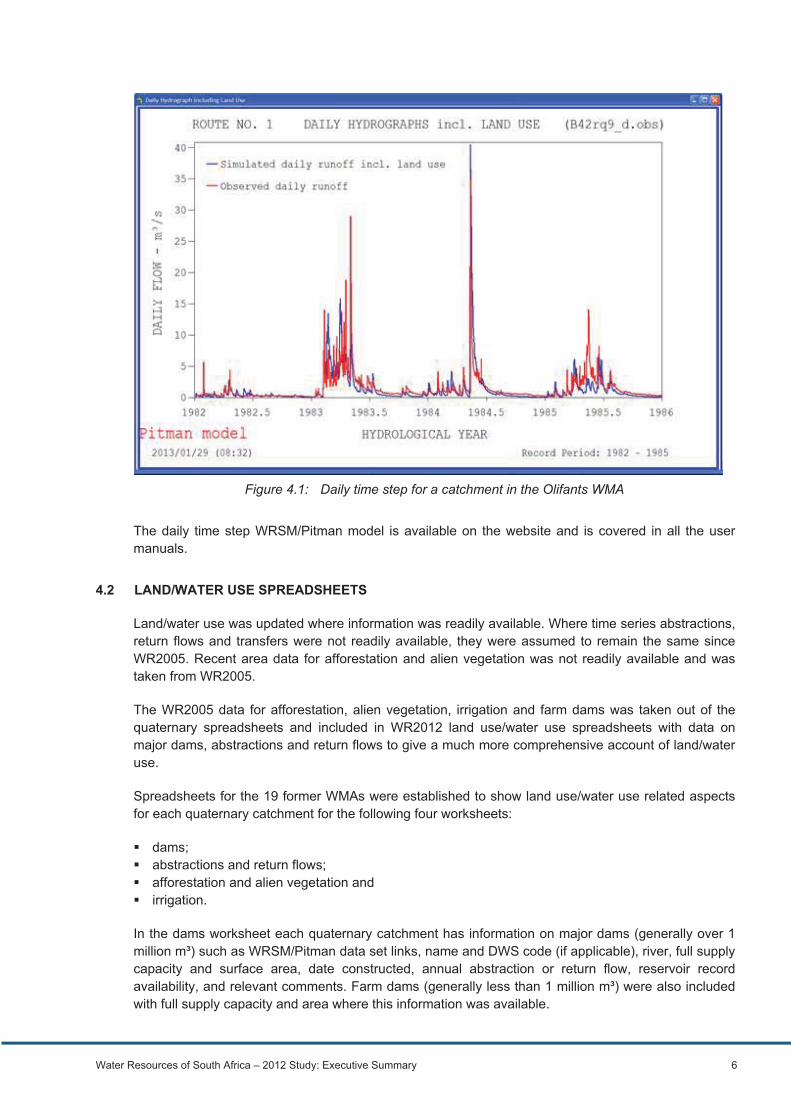
The daily time step can be run in either naturalised mode or including land use. Naturalised mode gives the daily outflows from the runoff modules. If land use is to be taken into account, the daily flows at a point in a network can be determined following a procedure described in the WRSM/Pitman User Manual. Daily flows are important for environmental flow considerations, operation of some dams, etc. Figure 4.1 shows a daily time step graph.
Water Resources of South Africa – 2012 Study: Executive Summary 6
Figure 4.1: Daily time step for a catchment in the Olifants WMA
The daily time step WRSM/Pitman model is available on the website and is covered in all the user manuals.
4.2 LAND/WATER USE SPREADSHEETS
Land/water use was updated where information was readily available. Where time series abstractions, return flows and transfers were not readily available, they were assumed to remain the same since WR2005. Recent area data for afforestation and alien vegetation was not readily available and was taken from WR2005.
The WR2005 data for afforestation, alien vegetation, irrigation and farm dams was taken out of the quaternary spreadsheets and included in WR2012 land use/water use spreadsheets with data on major dams, abstractions and return flows to give a much more comprehensive account of land/water use.
Spreadsheets for the 19 former WMAs were established to show land use/water use related aspects for each quaternary catchment for the following four worksheets:
dams; abstractions and return flows; afforestation and alien vegetation and irrigation.
In the dams worksheet each quaternary catchment has information on major dams (generally over 1 million m³) such as WRSM/Pitman data set links, name and DWS code (if applicable), river, full supply capacity and surface area, date constructed, annual abstraction or return flow, reservoir record availability, and relevant comments. Farm dams (generally less than 1 million m³) were also included with full supply capacity and area where this information was available.
Water Resources of South Africa – 2012 Study: Executive Summary 7
In the abstractions and return flows worksheet, WRSM/Pitman data set links were given, annual abstraction as at the 2009 hydrological year and comments were given for each quaternary catchment. Similarly for return flows.
In the afforestation and alien vegetation worksheet, links to the WRSM/Pitman data sets and areas for both were given along with the division into three types for both for each quaternary catchment.
In the irrigation worksheet, links to the WRSM/Pitman data sets and areas of irrigation were given for each quaternary catchment.
These spreadsheets are available on the website.
4.3 ENHANCED WRSM/PITMAN MODEL
In this task the aim was to add graphs for statistics on rainfall and naturalised flows, other user friendly features and groundwater enhancements.
There are four general enhancement categories for the WRSM/Pitman model as follows:
naturalised streamflow and catchment based rainfall data files – statistical graphs for both massplots and cusum plots. For naturalized flow there is also a firm yield plot;
WRSM2000 Multiple module calibration copy facility. When calibrating, it is now possible to perform changes to multiple runoff modules in one operation;
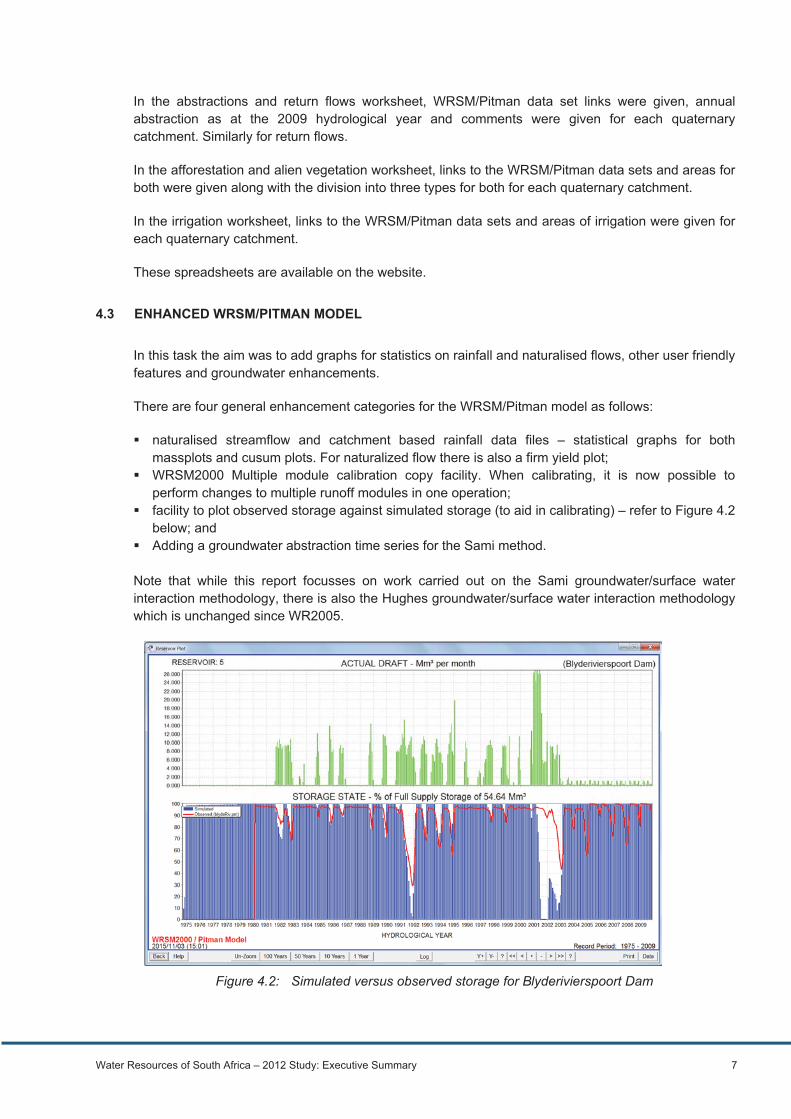
facility to plot observed storage against simulated storage (to aid in calibrating) – refer to Figure 4.2 below; and
Adding a groundwater abstraction time series for the Sami method.
Note that while this report focusses on work carried out on the Sami groundwater/surface water interaction methodology, there is also the Hughes groundwater/surface water interaction methodology which is unchanged since WR2005.
Figure 4.2: Simulated versus observed storage for Blyderivierspoort Dam
Water Resources of South Africa – 2012 Study: Executive Summary 8
The monthly time step model requires a key code to be set which is laptop/PC dependant and is the intellectual property of Royal HaskoningDHV. This key code is available from Mr Allan Bailey at the e-mail address [email protected]. For users who wish to make use of the WRSM/Pitman model for projects to generate profit there is a once-off administration fee. The model needs to be downloaded from the website as do the WRSM/Pitman data sets which cover the whole of South Africa, Lesotho and Swaziland.
The monthly time step WRSM/Pitman model is available on the website and is covered in the relevant manuals.
4.4 MONITORING ANALYSIS OF RAINFALL, OBSERVED STREAMFLOW AND WATER QUALITY STATIONS
This involved setting up worksheets with data and analysis for every quaternary catchment in South Africa, Lesotho and Swaziland for the following monitoring data:
rainfall; streamflow (river and reservoir gauging) and water quality.
In order to facilitate this work, rainfall, observed streamflow and water quality data was updated to September 2010. For rainfall, all useful individual stations were updated up to September 2010 using the WRMF model data from DWS and were patched where necessary. Based on the WR2005 catchments rainfall groups of individual stations, the catchment based rainfall files were determined from 1920 to 2009 (hydrological years) for all the hydrological zones. They were checked with massplots. The observed streamflow for all streamflow gauging stations and inflows to reservoirs were updated using the DWS website and DWS reservoir records to September 2010. Missing and/or unreliable values were patched using either an in-house program (PATCHTAB) where there were suitable stations for patching or by simulated flows. Water quality data was obtained from the RQIS also up to September 2010.
From experience gained in analysing and calibrating the entire country in this and previous appraisals, it has been determined what the countries lack in rainfall stations, observed streamflow stations and water quality stations. Rainfall monitoring involved documenting the number of stations currently open in each quaternary catchment along with the rainfall station identifier, the total number of stations whether open and closed, the number of stations used in the catchment based rainfall file (which could and generally does include stations outside of the quaternary catchment) and the name of the catchment based rainfall file used for that quaternary along with a recommendation. A considerable number of rainfall stations have closed down over the past 20 years so there are numerous recommendations to either re-open or establish new ones. Note that there were some additional rainfall stations used in WR2005 made in the current study, particularly in Lesotho.
Reservoir records are extremely useful in analysing dams and for calibration of streamflows as they give the complete water balance.
In the observed streamflow worksheet, details of streamflow gauges have been given for each quaternary catchment with a rating based on good/average/poor as well as the impact of land use. Comments and recommendations have been given where insufficient stations exist.
Chapter 7 provides more detail of the abovementioned issues.
Finally in the water quality worksheet, the analysis of water quality monitoring involved documenting the usable water quality gauging station names, station description, number of samples in the water

Water Resources of South Africa – 2012 Study: Executive Summary 9
quality database, start period of monitoring, end period of monitoring, median 50% TDS value, 95% TDS value (i.e. 95% of the samples are below this value) and comments and recommendations for each quaternary catchment by Dr Chris Herold.
These spreadsheets are available on the website.
4.5 WR2012 AND WRSM2000 TRAINING COURSES (PART A)
Mr Allan Bailey has conducted 2 day training courses at the following universities:
University of the Witwatersrand; University of North-West (in 2013 and 2015); University of Stellenbosch (in 2013 and 2015); University of Pretoria/SAICE Water Division (2015) and University of the Western Cape (in 2013 and 2015).
Other training courses have also been given to DWS and consulting engineering organizations.
The two day course developed under this task covers both how to use the WRSM/Pitman model as well as what information is available on the WR2012 website and how to make use of it. Ms Sarah Collinge has been trained to assist in giving the WRSM/Pitman course.
There has been a great deal of informal training by Mr Allan Bailey by means of e-mail and telephone requests for assistance on a wide variety of issues.
Mr Allan Bailey has given a number of presentations at the SANCIAHS, SANCOLD and WR2012 Launch symposiums.
4.6 ENHANCEMENTS TO SAMI GROUNDWATER DATA
Mr Karim Sami compiled a comprehensive report on groundwater verification studies carried out in various parts of the country. Of specific interest in this verification study was the updating of default groundwater parameters that are used in the Sami input screen of WRSM/Pitman. Every runoff module in every network has been updated with the latest set of these parameters. Figure 4.3 shows a typical groundwater plot that is obtainable from the WRSM/Pitman model.
Figure 4.3: Groundwater plot for quaternary B72E

Water Resources of South Africa – 2012 Study: Executive Summary 10
All the analysis are available in the report Sami, 2015.
4.7 ENHANCEMENTS TO WMAS 6, 7, 11 AND 12
A number of sources of data have been used to increase the level of detail particularly with regard to dams of small to intermediate size and streamflow gauging stations.
Google Earth in particular has been a major new source of information. The sources of data have been shown the schematic in Figure 4.4 below. WRSM/Pitman network systems and diagrams have been updated accordingly, particularly but not only in these four WMAs. Where possible abstractions and return flows have been updated and added.
Figure 4.4: Sources of data for WMAs
Particular attention was paid to WMAs 6, 7, 11 and 12 which required enhancement in detail.
These enhanced details have been built into the various WRSM/Pitman networks and are on the website under WRSM2000 Network Model Data.
4.8 WRSM/PITMAN MODEL DEVELOPMENT WITH REGARD TO THE IRRIGATION METHODOLOGY TYPE 4
The WQT Type 4 methodology is the latest irrigation methodology developed by Dr Chris Herold and being used in the WRYM, WRPM and WQT models. It was coded into the WRSM/Pitman model. A report is available on this methodology (Herold et al., 2015).
Water Resources of South Africa – 2012 Study: Executive Summary 11
4.9 WRSM/PITMAN DAILY TIME STEP MODEL (PART B) AND DEGREE OF ACCURACY OF ABOUT 600 STREAMFLOW GAUGING STATIONS
Daily Time Step (part B)
Two user friendly tools were added for formatting daily rainfall and daily observed streamflow based on the standard output. For rainfall the South African Weather Services output can be transformed into the form required by the daily time step version of the WRSM/Pitman model. Likewise for the DWS daily rainfall format, this can also be transformed into the form required by daily time step version of the WRSM/Pitman model.
Degree of accuracy/usefulness of the 600 streamflow stations
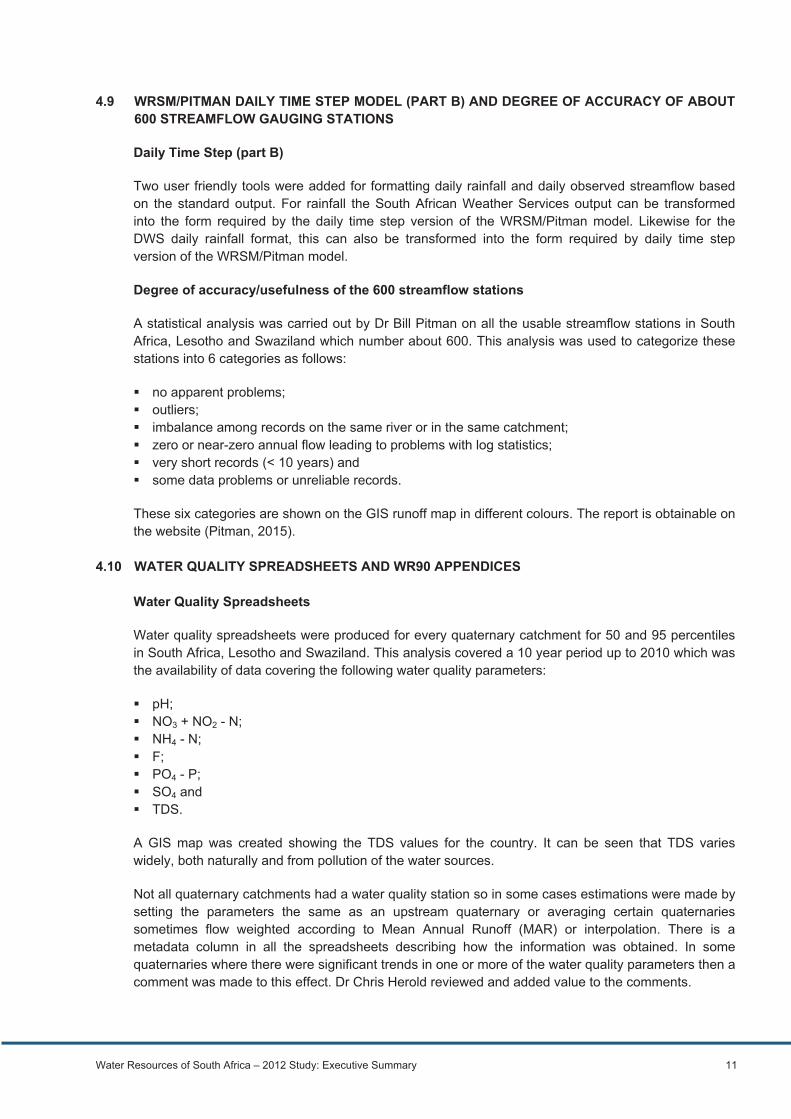
A statistical analysis was carried out by Dr Bill Pitman on all the usable streamflow stations in South Africa, Lesotho and Swaziland which number about 600. This analysis was used to categorize these stations into 6 categories as follows:
no apparent problems; outliers; imbalance among records on the same river or in the same catchment; zero or near-zero annual flow leading to problems with log statistics; very short records (< 10 years) and some data problems or unreliable records.
These six categories are shown on the GIS runoff map in different colours. The report is obtainable on the website (Pitman, 2015).
4.10 WATER QUALITY SPREADSHEETS AND WR90 APPENDICES Water Quality Spreadsheets
Water quality spreadsheets were produced for every quaternary catchment for 50 and 95 percentiles in South Africa, Lesotho and Swaziland. This analysis covered a 10 year period up to 2010 which was the availability of data covering the following water quality parameters:
pH; NO3 + NO2 - N; NH4 - N; F; PO4 - P; SO4 and TDS.
A GIS map was created showing the TDS values for the country. It can be seen that TDS varies widely, both naturally and from pollution of the water sources.
Not all quaternary catchments had a water quality station so in some cases estimations were made by setting the parameters the same as an upstream quaternary or averaging certain quaternaries sometimes flow weighted according to Mean Annual Runoff (MAR) or interpolation. There is a metadata column in all the spreadsheets describing how the information was obtained. In some quaternaries where there were significant trends in one or more of the water quality parameters then a comment was made to this effect. Dr Chris Herold reviewed and added value to the comments.
Water Resources of South Africa – 2012 Study: Executive Summary 12
WR90 Appendices
In the WR90 study (1989), hard copy output also included graphs of the following:
Appendix 10 : Deficient Flow – Duration Frequency and Appendix 11 : Storage – Draft Frequency.
These graphs have been included in WR2012 on request from DWS. They are available on the website.
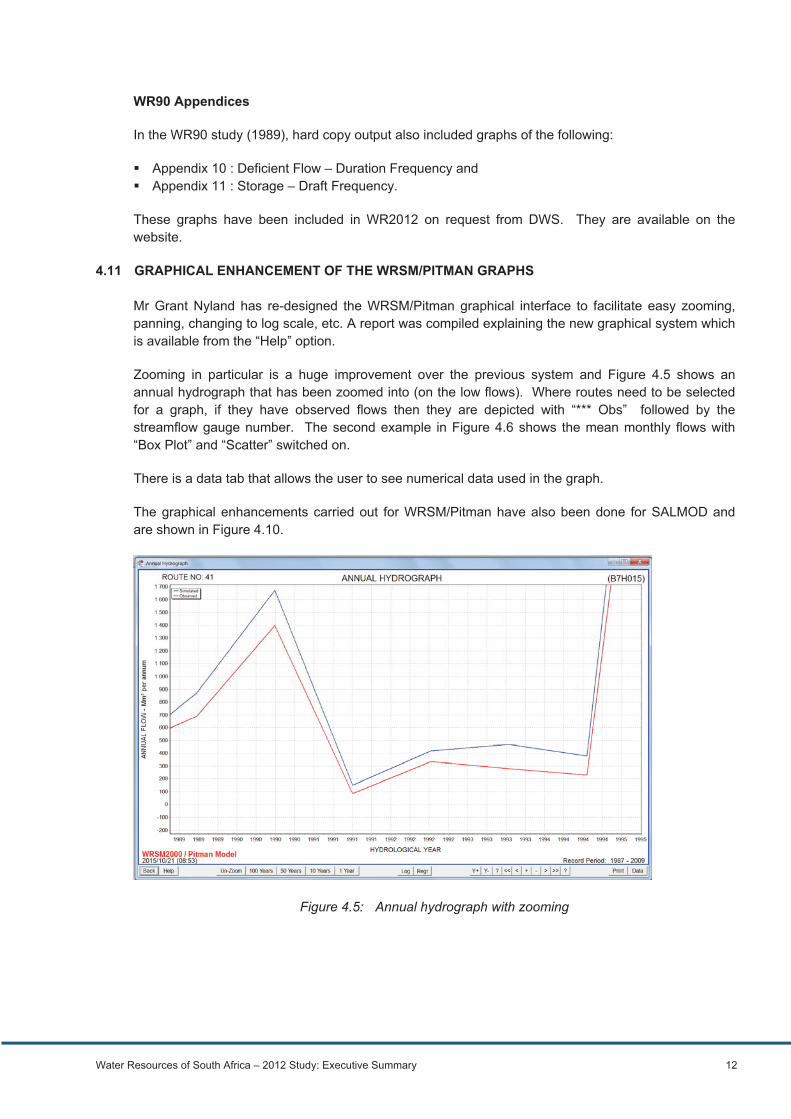
4.11 GRAPHICAL ENHANCEMENT OF THE WRSM/PITMAN GRAPHS Mr Grant Nyland has re-designed the WRSM/Pitman graphical interface to facilitate easy zooming, panning, changing to log scale, etc. A report was compiled explaining the new graphical system which is available from the “Help” option.
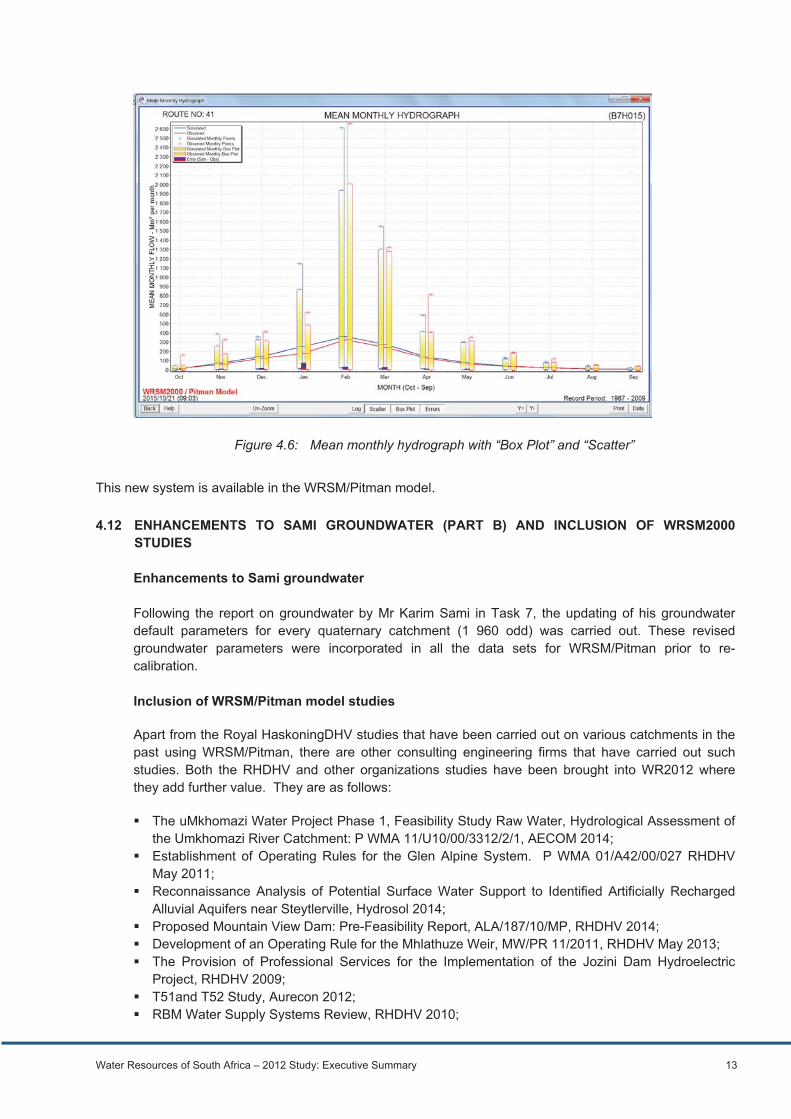
Zooming in particular is a huge improvement over the previous system and Figure 4.5 shows an annual hydrograph that has been zoomed into (on the low flows). Where routes need to be selected for a graph, if they have observed flows then they are depicted with “*** Obs” followed by the streamflow gauge number. The second example in Figure 4.6 shows the mean monthly flows with “Box Plot” and “Scatter” switched on.
There is a data tab that allows the user to see numerical data used in the graph.
The graphical enhancements carried out for WRSM/Pitman have also been done for SALMOD and are shown in Figure 4.10.
Figure 4.5: Annual hydrograph with zooming
Water Resources of South Africa – 2012 Study: Executive Summary 13
Figure 4.6: Mean monthly hydrograph with “Box Plot” and “Scatter”
This new system is available in the WRSM/Pitman model. 4.12 ENHANCEMENTS TO SAMI GROUNDWATER (PART B) AND INCLUSION OF WRSM2000
STUDIES Enhancements to Sami groundwater Following the report on groundwater by Mr Karim Sami in Task 7, the updating of his groundwater default parameters for every quaternary catchment (1 960 odd) was carried out. These revised groundwater parameters were incorporated in all the data sets for WRSM/Pitman prior to re-calibration. Inclusion of WRSM/Pitman model studies
Apart from the Royal HaskoningDHV studies that have been carried out on various catchments in the past using WRSM/Pitman, there are other consulting engineering firms that have carried out such studies. Both the RHDHV and other organizations studies have been brought into WR2012 where they add further value. They are as follows:
The uMkhomazi Water Project Phase 1, Feasibility Study Raw Water, Hydrological Assessment of the Umkhomazi River Catchment: P WMA 11/U10/00/3312/2/1, AECOM 2014;
Establishment of Operating Rules for the Glen Alpine System. P WMA 01/A42/00/027 RHDHV May 2011;
Reconnaissance Analysis of Potential Surface Water Support to Identified Artificially Recharged Alluvial Aquifers near Steytlerville, Hydrosol 2014;
Proposed Mountain View Dam: Pre-Feasibility Report, ALA/187/10/MP, RHDHV 2014; Development of an Operating Rule for the Mhlathuze Weir, MW/PR 11/2011, RHDHV May 2013; The Provision of Professional Services for the Implementation of the Jozini Dam Hydroelectric
Project, RHDHV 2009; T51and T52 Study, Aurecon 2012; RBM Water Supply Systems Review, RHDHV 2010;
Water Resources of South Africa – 2012 Study: Executive Summary 14
T20A Mabeleni Dam – Hydrological Analyses, RHDHV 2014 and Eastern Cape Small Hydro Pre-feasibility study, RHDHV 2014.
The latest Sami groundwater parameters and details from these studies have been included in the WRSM/Pitman data sets on the website.
4.13 SIMULATED PRESENT DAY ANALYSIS (PART A) Re-calibration of the Historical Analysis
In order to facilitate this task and to compare present day streamflow with historical streamflow, it was necessary to first carry out the historical analysis up to September 2010. This was done using updated rainfall, observed streamflow, reservoir inflow, outflow and transfers and land use.
The individual rainfall station records have been extended to September 2010. Missing and/or unreliable values have been patched. This patching process was carried out on the entire record period. The stationarity of each updated record was checked by a mass plot. The mean annual precipitation (MAP) was updated accordingly.
Some new stations have been added, particularly in Lesotho. Unfortunately quite a number have closed down even since the WR2005 study.
The catchment rainfall groups have been retained from WR2005 for consistency except where rainfall stations had to be added to fill in gaps in the latter years. These groups dictate which individual stations are used to combine to form the catchment based rainfall files (in percentage of MAP) which have generally been set up for each rainfall zone (group of quaternary catchments) and are used in all the modules in the WRSM2000/Pitman analysis (runoff, reservoir, channel, irrigation and mining modules). In some cases where there were very few or no stations in a quaternary catchment extending to September 2010, stations closest to the quaternary catchment in question were used.
Two new graphs have been added to the calculation of the catchment based rainfall file, namely:
the massplot and the CUSUM plot.
These additional plots assist in checking of catchment based rainfall files.
Symons pan evaporation (for catchments and open surface water) and A-pan evaporation has been taken from the WR2005 study. These are monthly values with different pan factors applied.
The WRSM/Pitman networks that were available from the WR2005 study were used and significant detail was added to them for the following:
observed streamflow gauges; farm dams; and some new reservoirs and water transfers.
Historical and naturalised streamflow has been updated to September 2010 by using the WRSM/Pitman model to analyse catchments with networks generally organised on a tertiary catchment basis. Missing and/or unreliable streamflows were patched using a variety of approaches most suitable for each record. These approaches included:
using an in-house regression model and gauging stations on the same river and using simulated values.
Water Resources of South Africa – 2012 Study: Executive Summary 15
A concerted effort was made to obtain all the reservoir records throughout the country so as to include all relevant data for the reservoirs. A new feature was added to the WRSM/Pitman model so that observed and simulated storage of a reservoir can be plotted graphically and compared as an aid to model calibration.
Network diagrams for the entire country are available to be viewed from within the WRSM/Pitman model. Every quaternary catchment has at least one runoff module except for some quaternary catchments in the Lower Orange and Berg WMAs where it made sense to combine some quaternary catchments because their impact on the water balance was small.
A re-calibration was done at every selected streamflow gauge and reservoir by comparing observed and simulated streamflow. In some cases previous calibrations were found to be still acceptable but in a lot of catchments adjustments were made to Pitman calibration parameters to bring simulated streamflow closer to that of observed values. This was done using calibration statistics at river gauging stations and reservoirs such as MAR, standard deviation and seasonal index and graphs for annual and monthly hydrographs, mean monthly streamflow, cumulative frequency, groundwater-surface water interface and wetland and reservoir storage.
The re-calibration of observed versus simulated flows were considered in conjunction with the comparison between naturalised flows for WR90, WR2005 and WR2012. The judgement for re-calibration had to consider the accuracy of the observed flows with regard to patching required, calibration parameters of adjacent catchments, reliability of WR90, WR2005 and WR2012 naturalised flows, etc. Generally if the observed flows were considered to be highly reliable, preference was given to the calibration rather than the comparison of naturalised flows.
The following aspects were considered for the re-calibration:
observed streamflow. If the discrepancy between simulated and observed was due to missing values in the observed, then the observed flows were patched either by correlation with another streamflow gauge on the same river or by simulated flows in the event of there being no suitable station to patch with;
rainfall. In some cases the years prior to 2005 had quite a good fit and the last five years (from 2004 to 2009 hydrological years) showed a deterioration. In these cases the rainfall data was checked and rainfall data was either patched or additional stations were added to improve the fit between flows;
land use. In some cases such as the Crocodile West and Marico WMA, there are numerous return flows some of which have been subject to a lot of growth over the past 5-10 years. Capacities of sewage treatment works were examined and in some cases the effluent return flows were increased to improve the calibration; and
calibration parameters. In some cases there were changes to calibration parameters as the best means to improve on the calibration. This was necessary due to the improved level of detail that has been added to WR2012 in terms of dams, land use, etc. as well as the additional five years of rainfall and observed streamflow data.
A full set of results comparing the observed and simulated flows at streamflow gauges is given for each WMA in the WR2012 User’s Guide. These were updated based on the WR2012 Study. Comparisons of observed and simulated streamflow for some of the more important streamflow gauges in each WMA are given in Table 4.1.
Wat
er R
esou
rces
of S
outh
Afri
ca –
201
2 S
tudy
: Exe
cutiv
e S
umm
ary
16
Tabl
e 4.
1: S
imul
ated
ver
sus
obse
rved
flow
for k
ey s
tream
flow
gau
ges
WM
A
Tert
iary
Cat
chm
ent
Stre
amflo
w g
auge
R
iver
R
ecor
d pe
riod
Obs
erve
d M
AR
(m
illio
n m
³/a)
Sim
ulat
ed M
AR
(m
illio
n m
³/a)
% D
iffer
ence
Lim
popo
A6
3 A6
H00
9
Mog
alak
wen
a
1960
-199
6 85
.50
89.7
35
Luvu
vhu
and
Leta
ba
B81
B8R
005
(Tza
neen
Dam
) Le
taba
19
79-2
002
126.
9813
0.86
3
Cro
codi
le W
est a
nd M
aric
o A
21
A2R
001
(Har
tbee
spoo
rt D
am)
Cro
codi
le
1925
-200
9 21
1.61
208.
32-2
Olif
ants
B
32
B3R
002
(Los
kop
Dam
) O
lifan
ts
1939
-200
9 48
0.89
530.
3110
Olif
ants
B7
2 B7
H01
5 O
lifan
ts
1987
-200
9 1
255.
221
444.
9315
Inko
mat
i X2
4 X2
H01
6 C
roco
dile
19
60-2
009
650.
0369
5.37
7
Usu
tu to
Mhl
atuz
e W
57
GS
6 U
sutu
19
58-1
998
1 59
6.57
1 57
9.31
-1
Thuk
ela
V13
V1H
001
Thuk
ela
1951
-200
9 91
1.46
942.
203
Thuk
ela
V50
V5H
002
Thuk
ela
1966
-198
6 3
531.
603
496.
94-1
Upp
er V
aal
C12
C
1R00
1 (V
aal D
am)
Vaal
19
36-2
009
2 02
6.21
2 04
0.27
1
Upp
er V
aal
C23
C
2H01
8 Va
al
1938
-200
9 1
732.
321
588.
23
-8
Mid
dle
Vaal
C
25
C9R
002
(Blo
emho
f Dam
) Va
al
1968
-200
6 2
139.
222
032.
66-5
Low
er V
aal
C92
C
9R00
3 (D
ougl
as W
eir)
Va
al
1958
-198
5 1
730.
181
592.
17
-8
Mvo
ti an
d U
mki
mku
lu
U20
U
2R00
4 U
mge
ni
1989
-200
9 31
8.53
308.
65-3
Mvo
ti an
d U
mki
mku
lu
U10
U
1H00
6 N
kom
azi
1962
-198
6 96
6.93
984.
062
Mzi
mvu
bu to
Kei
skam
ma
T31
T3H
007
Mzi
mvu
bu
1990
-200
6 77
5.53
791.
722
Upp
er O
rang
e D
31
D3R
003
(Van
Der
Klo
of D
am)
Ora
nge
1977
-200
9 4
977.
075
108.
663
Upp
er O
rang
e D
14
D1H
003
Ora
nge
1920
-200
9 4
457.
564
661.
345
Low
er O
rang
e D
73, D
53 a
nd D
54
D7H
008
Ora
nge
1971
-200
9 6
541.
017
140.
399
Fish
to T
sits
ikam
ma
Q93
Q
9H01
8 G
reat
Fis
h 19
77-2
009
362.
0931
2.97
-14
Fish
to T
sits
ikam
ma
N23
N
2R00
1 (M
entz
Dam
) S
unda
ys
1923
-198
6 16
6.46
167.
632
Gou
ritz
J24
J2R
006
(Gam
kapo
ort D
am)
Gam
ka
1970
-200
9 71
.40
66.4
0-7
Olif
ants
/Dor
ing
E23
, E24
, E40
E
2H00
3 D
orin
g 19
28-2
009
418.
8838
9.88
-7
Olif
ants
/Dor
ing
E10
E
1R00
2 (C
lanw
illia
m D
am)
Olif
ants
19
35-2
009
403.
3339
8.23
1

Wat
er R
esou
rces
of S
outh
Afri
ca –
201
2 S
tudy
: Exe
cutiv
e S
umm
ary
17
WM
A
Tert
iary
Cat
chm
ent
Stre
amflo
w g
auge
R
iver
R
ecor
d pe
riod
Obs
erve
d M
AR
(m
illio
n m
³/a)
Sim
ulat
ed M
AR
(m
illio
n m
³/a)
% D
iffer
ence
Bree
de
H70
H
7H00
6 Br
eede
19
65-2
009
1122
.48
1263
.65
13
Ber
g G
10
G1R
003
(Mis
vers
tand
Dam
) B
erg
1977
-200
4 58
9.40
578.
51-2
Water Resources of South Africa – 2012 Study: Executive Summary 18
Naturalisation
An important output of the project is the generation of time series of naturalised monthly flows for the study period, i.e. 1920 to 2009 (hydrological years). Apart from gauged catchments, this also requires the extension of calibrated model parameters to ungauged areas, based on similarities in geology, topography, soil type, natural vegetation and climate. The method used to generate naturalised flows was to set the naturalised “tickbox” on in the runoff sub-model which then results in the model ignoring alien vegetation, afforestation, paved flows and there are no reductions in catchment area for irrigation and mining activities.
Naturalised flows for WR2012 are compared to those for WR90 and WR2005 in Appendix A. It can be seen that the MAR for the country is now evaluated as 49 251 million m³/annum, whereas in WR90 and WR2005 it was 50 278 and 49 210 million m³/annum respectively.
Differences between the WR90, WR2005 and WR2012 studies can be ascribed to the following:
the effect of climatic variations with WR2012 rainfall being extended from 2004 to 2009; the use of additional flow records in WR2012 that were not available or were too short in the
WR2005 study; the revision of the Sami groundwater/surface water interaction default data and use of Google Earth to improve various aspects of the systems.
Present Day Analysis
Following this analysis, the present day analysis was carried out. This is a new analysis and by “present day”, we are referring to land use development as at September 2010. For this purpose all land use from 1920 to 2009 (hydrological years) was set as for September 2010 and then run on historical rainfall from 1920 to 2009.
This necessitated the following:
Runoff modules. Paved areas, afforestation and alien vegetation were set as for September 2010 throughout;
Irrigation modules. Areas of irrigation were set to September 2010 throughout; Reservoir areas and capacities were set to September 2010 throughout; Time series abstraction, transfer and return flow files were set to appropriate values throughout.
These time series files required significant thought as to how best to reflect the present day. In cases where the 2009 year was complete and representative then that year was simply used. However, in some cases we have missing data and data that varies tremendously from one year to the next. If there was missing data then that month for previous years was considered. Where the data varied a great deal, an average of the last 3-5 years was taken. In cases of releases from reservoirs, it is important not to include natural spill so the data was scanned together with the level trajectory and typical recent releases were chosen which did not include spills and
Mining modules. Areas were set to September 2010 throughout.
A separate folder system was set up for the present day analysis with the relevant data sets.
A total of 84 key points were selected covering the 19 WMAs at strategic points to compare naturalised streamflow with present day streamflow. These locations were generally at major dams, outflows to oceans or other countries or at confluences of major rivers. Spreadsheets were then compiled for each WMA giving details of these key points as well as the present day statistics and naturalized statistics for comparison for WR2012.
Water Resources of South Africa – 2012 Study: Executive Summary 19
For each WMA and key point, a spreadsheet was compiled giving MAR, standard deviation and seasonal index for both naturalised and present day streamflow and a document for each WMA was set up with the graphs showing the annual hydrograph, mean monthly flows and cumulative frequency at each key point.
A schematic map was established showing the 19 WMAs and outflows whether they are to the ocean, other countries or other WMAs with the MAR values for naturalised and present day – refer to Figure 4.7. The total naturalised MAR is slightly higher than for WR2005 and the present day MAR is obviously considerably less as land use as at 2009 has been applied throughout the record period. A spreadsheet showing these values for the 19 WMAs together with the impact of land use and comparisons against WR2005 was compiled. Appendix A shows this information.
A report “WRSM/Pitman Model Analysis Overview” (Pitman et al., 2015) which summarises this process for each of the WMAs is included on the website. Present day analyses and WRSM/Pitman model set-ups are available on the website.

Wat
er R
esou
rces
of S
outh
Afri
ca –
201
2 S
tudy
: Exe
cutiv
e S
umm
ary
20
Fi
gure
4.7
: S
chem
atic
of p
rese
nt d
ay a
nd n
atur
alis
ed s
tream
flow

Water Resources of South Africa – 2012 Study: Executive Summary 21
4.14 TRAINING AND USER SUPPORT (PART B)
Training and user support consisted of the following initiatives:
WR2012 and WRSM2000 courses at universities and other institutions (partly covered in section 4.5) and development of course material;
training of personnel both on the WRSM/Pitman model and the WR2012 deliverables; WR2012 mini-launch at SANCIAHS at the University of the Western Cape in 2014; WR2012 official launch at Centurion in 2015. In March 2015 the official WR2012 Launch was held
in Centurion. Dr Ronnie McKenzie, Dr Bill Pitman, Allan Bailey and Professor Geoff Pegram gave presentations;
press release and SAICE articles. A document was compiled for a press release regarding the WR2012 Launch. Dr Bill Pitman and Allan Bailey also produced an article for the SAICE Civil Engineering magazine June 2015 edition;
registration of users on the website (over 600 to date); subsequent user support to WR2012 users; informal information sessions at Royal HaskoningDHV; support to students who have assignments for which WR2012 provides data and information; and SANCOLD 2014 presentation.
4.15 WEBSITE DEVELOPMENT
It was decided that a website (www.waterresourceswr2012.co.za) would be produced to make it as easy as possible for users to access data and information. In addition it allows the study team the means to add information which can become immediately available, i.e. users do not have to wait until the end of the study until deliverables become available.
Once the user has logged on to the website, a menu or dashboard system is available in the so-called “Resource Centre”. Clicking on a menu item will then “explode” the item further to show greater levels of detail such as WMAs and then catchment groupings or whatever.
Work done in WR2012 has been added to the website. This website contains:
models used in the study; WRSM/Pitman data sets for South Africa, Lesotho and Swaziland; WR2012 study, WRSM/Pitman model and other reports; database containing WRSM2000 input data; time series data; spreadsheet information by quaternary catchment; reservoir records; and GIS maps.
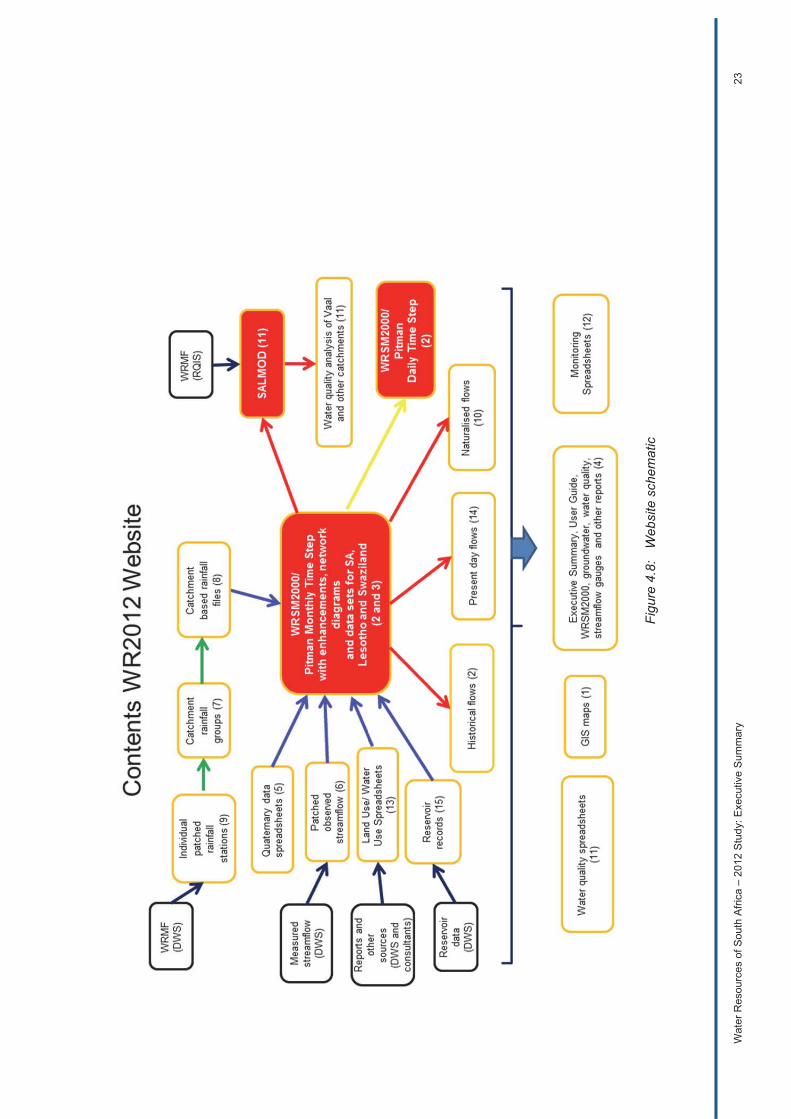
The website menu items have been numbered for easy reference. A web schematic has been added to the website to make it clear as to how the various menu items link to each other. This schematic has been shown in Figure 4.8 below. Note that in Figure 4.8, the number in brackets relates to the menu item in the Resource Centre (on the website), blocks with a black border indicate input and blocks with an orange border indicate output. Green arrows indicate the rainfall transformation from individual stations to catchment based rainfall. The yellow arrow indicates that the daily time step uses monthly rainfall as well as daily rainfall. The dark blue arrows indicate data from external sources and the light blue arrows are input into the WRSM/Pitman model. The red arrows indicate information from the WRSM/Pitman and SALMOD models.

Water Resources of South Africa – 2012 Study: Executive Summary 22
There are three folders on the WR2012 website pertaining to rainfall as shown in the website schematic as follows :
individual rainfall station records; catchment rainfall groups; and catchment based rainfall files.
Models/computer programs are:
WRSM/Pitman monthly time step; WRSM/Pitman daily time step; SALMOD (salinity model); and OTHER (water quality – only covered in the WR2005 study).
Wat
er R
esou
rces
of S
outh
Afri
ca –
201
2 S
tudy
: Exe
cutiv
e S
umm
ary
23
Figu
re 4
.8:
Web
site
sch
emat
ic
Water Resources of South Africa – 2012 Study: Executive Summary 24
4.16 PRESENT DAY STREAMFLOW (PART B)
This task was covered in section 3.12. This second part covered the WMAs 13-19.
4.17 UPDATE GIS MAPS, REPORTS HAVING USED WRSM/PITMAN TO ANALYSE SOUTH AFRICA, LESOTHO AND SWAZILAND AND SALMOD WATER QUALITY ANALYSIS ON THE UPPER VAAL, MIDDLE VAAL AND LOWER VAAL SUB-WMAS
4.17.1 GIS MAPS
GIS maps were updated from WR2005 where there has been a change in detail. The following GIS maps have new information:
rainfall; runoff; water quality (TDS); calibration parameters; land/water use; present day streamflow; and population.
Particular attention has been given to the rainfall stations and observed streamflow stations maps. The observed streamflow stations map will now have a colour code for 6 categories of observed streamflow station. An example has been given below for the Thukela WMA.
The following is a brief description of the GIS maps.
GIS maps used/developed during the calibration process
used for different catchment rainfall groups in order to determine different catchment based rainfall files. If the user selects the “information icon”, then the station code, start and end record period, MAP, WMA(s) in which it was used and catchment group name(s) will appear. Note that the hard copy book of maps has the overall map for South Africa, Lesotho and Swaziland as well as the 19 WMA maps; rainfall. This GIS map contains all “usable” rainfall stations in South Africa, Lesotho and Swaziland”, i.e. those used in the WRSM/Pitman analyses. The rainfall station code is included in both hard copy and electronic form. In the electronic form the station code becomes visible as the user zooms in. Mean annual rainfall is shown in a particular shade based on individual rainfall stations. Many rainfall stations have closed down over the past 20 years or so. Only those with too many missing values and/or too short a period have been excluded as not “usable”. There is no category breakdown as for runoff. The same rainfall station may have been
runoff. This GIS map contains all “usable” observed streamflow stations in South Africa, Lesotho and Swaziland”, i.e. those used in the WRSM/Pitman analyses. The observed streamflow station code is included in both hard copy and electronic form. In the electronic form the station code becomes visible as the user zooms in. Naturalised mean annual runoff is shown in a particular shade for each quaternary catchment. Observed streamflow stations have been divided into six categories as explained in the Calibration report (Pitman WV, 2015). Some observed streamflow stations have closed down over the past 20 years or so. Only those with too many missing values and/or too short a period have been excluded as not “usable”. An example of a runoff GIS map has been given in Figure 12.1 for the Thukela WMA. If the user selects the “information icon”, then the station DWS code, description, latitude, longitude, start and end record period, WMA and category will appear. Note that the hard copy book of maps has the overall map for South Africa, Lesotho and Swaziland as well as the 19 WMA maps;
Water Resources of South Africa – 2012 Study: Executive Summary 25
water quality (TDS). TDS values were obtained from the IWQS and are available in the water quality spreadsheets. TDS values have been taken from the 95th percentile over the 10 year period from 2001 to 2010 and if there is no water quality station in the quaternary, then a value has been determined by comparison with adjoining quaternaries or flow weighting which is described in the “comments” column. Refer to water quality spreadsheets on the website;
calibration parameters. The latest WRSM/Pitman calibration parameters as used in the model associated data sets have been shown for the 8 calibration parameters and
present day streamflow. This GIS map is a new map which shows the naturalised streamflow versus the present day streamflow with land/water use as at 2010 development levels for 84 key locations spread over South Africa, Lesotho and Swaziland.
GIS maps for information
base map. This GIS map contains basic information such as rivers, reservoirs, urban areas, primary, tertiary, secondary and quaternary catchments, endoreic areas, WMA and other boundaries. Note that the hard copy book of maps has the overall map for South Africa, Lesotho and Swaziland as well as the 19 WMA maps;
evaporation (S-pan). This GIS map of Symons pan evapotranspiration (applying to surface water ) has not changed since the WR90/WR205 studies;
evaporation (A-pan); This GIS map of A-pan evapotranspiration (applying to irrigation) has not changed since the WR90/WR205 studies;
land cover. The latest land use GIS map from the Department of Environmental Affairs has been included. It is extremely detailed and the coverage exceeds 5.5 Gb;
inter-basin water transfers. This GIS map contains largely WR2005 transfers as no updated source appeared to be readily available;
simplified geology. This GIS map has not changed since the WR90/WR205 studies;
soils. This GIS map has not changed since the WR90/WR205 studies;
sediment. This GIS map has not changed since the WR90/WR205 studies;
vegetation. This GIS map has not changed since the WR90/WR205 studies;
Ecological Water Requirements (EWRs) management class. This GIS map has not changed since the WR90/WR205 studies. EWRs are required for most hydrological studies. These are based on the Ecological Management Class (EMC). EMCs were obtained from and are currently being reviewed by DWS and are likely to change; and
population density. The 2011 census was used for this GIS map.

Water Resources of South Africa – 2012 Study: Executive Summary 26
Figure 4.9: GIS Runoff map for the Thukela WMA
4.17.2 REPORTS
As for the WR2005 study, there is an executive summary and a far more detailed user guide. Other reports that have been included are the Sami groundwater, calibration accuracy analysis of 600 streamflow gauges, WRSM/Pitman Model Overview and the SALMOD report. Additions have also been made to the WRSM/Pitman suite of reports. The full set of reports includes the following:
WR2012 Executive Summary; WR2012 User Guide; WR2012 Book of Maps; WR2012 SALMOD: Salinity Modelling of the Upper Vaal, Middle Vaal and Lower Vaal sub-Water
Management Areas (new Vaal Water Management Area); WR2012 Calibration Accuracy; WR2012 SAMI Groundwater module: Verification Studies, Default Parameters and Calibration
Guide; WR2012 WRSM/Pitman Model Analysis Overview; WRSM/Pitman User Manual; WRSM/Pitman Theory Manual; and WRSM/Pitman Programmer’s Code Manual.
Water Resources of South Africa – 2012 Study: Executive Summary 27
4.17.3 SALMOD SALINITY ANALYSIS
For the WR2005 study only selected parts of the country which were regarded as the most problematic were analysed. In this study the simplified salt balance model SALMOD was analysed and calibrated for the entire Upper Vaal, Middle Vaal and Lower Vaal sub-WMAs (which have now been combined into the “new” Vaal WMA). This catchment is the most highly developed in South Africa with a great deal of land use/water use which impacts on water quality. Observed data was extended from 1974 to 2009. SALMOD uses the WRSM/Pitman model output files together with other information that is required to analyse flow, Total Dissolved Solids (TDS) concentration and TDS load. Calibration is done by means of three parameters and by varying the growth or decline in return flow. The SALMOD model produces both statistical indicators of flow, TDS concentration and TDS load as well as graphs of these parameters at chosen water quality stations to aid the user in achieving a successful calibration.
Full details are given in the report “Water Resources of South Africa 2012 Study (WR2012): SALMOD: Salinity Modelling of the Upper Vaal, Middle Vaal and Lower Vaal sub-Water Management Areas (new Vaal Water Management Area)”. This report gives a detailed analysis of flow, TDS concentration and TDS load at all the relevant water quality stations throughout the Upper, Middle and Lower Vaal sub-WMAs. It includes insights gained from many years of experience in analysing water quality in the Vaal River catchment with comments about each tertiary catchment.
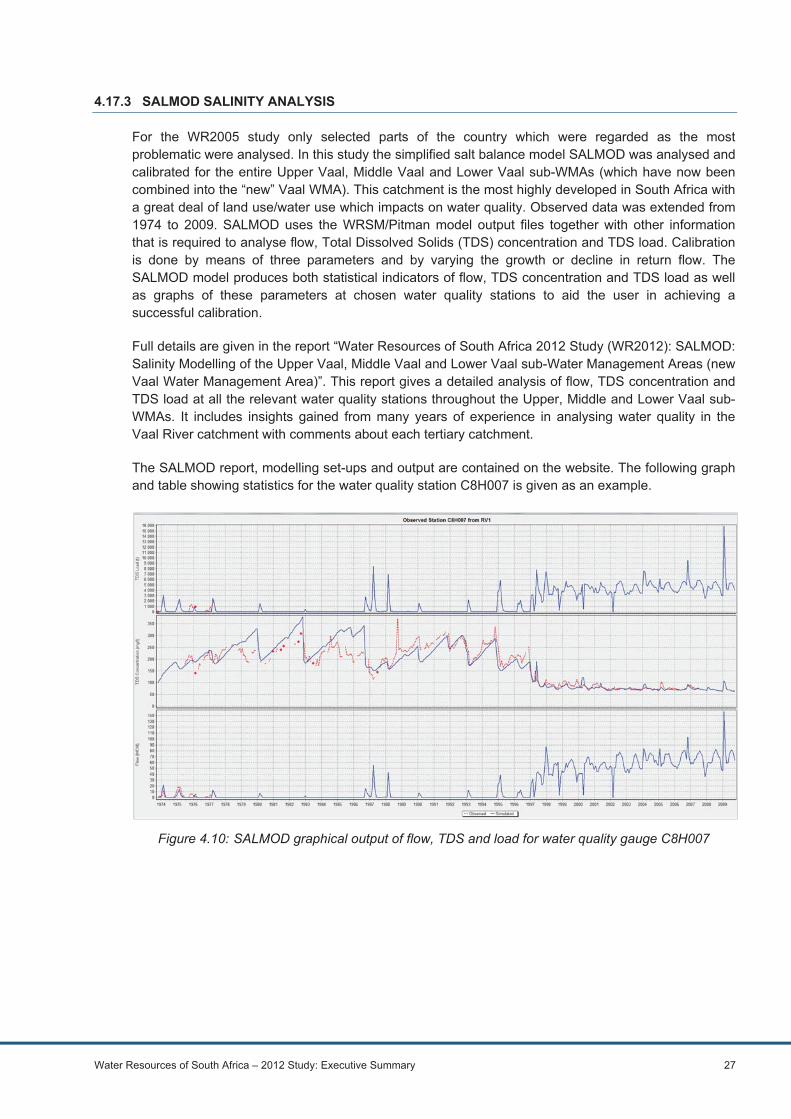
The SALMOD report, modelling set-ups and output are contained on the website. The following graph and table showing statistics for the water quality station C8H007 is given as an example.
Figure 4.10: SALMOD graphical output of flow, TDS and load for water quality gauge C8H007
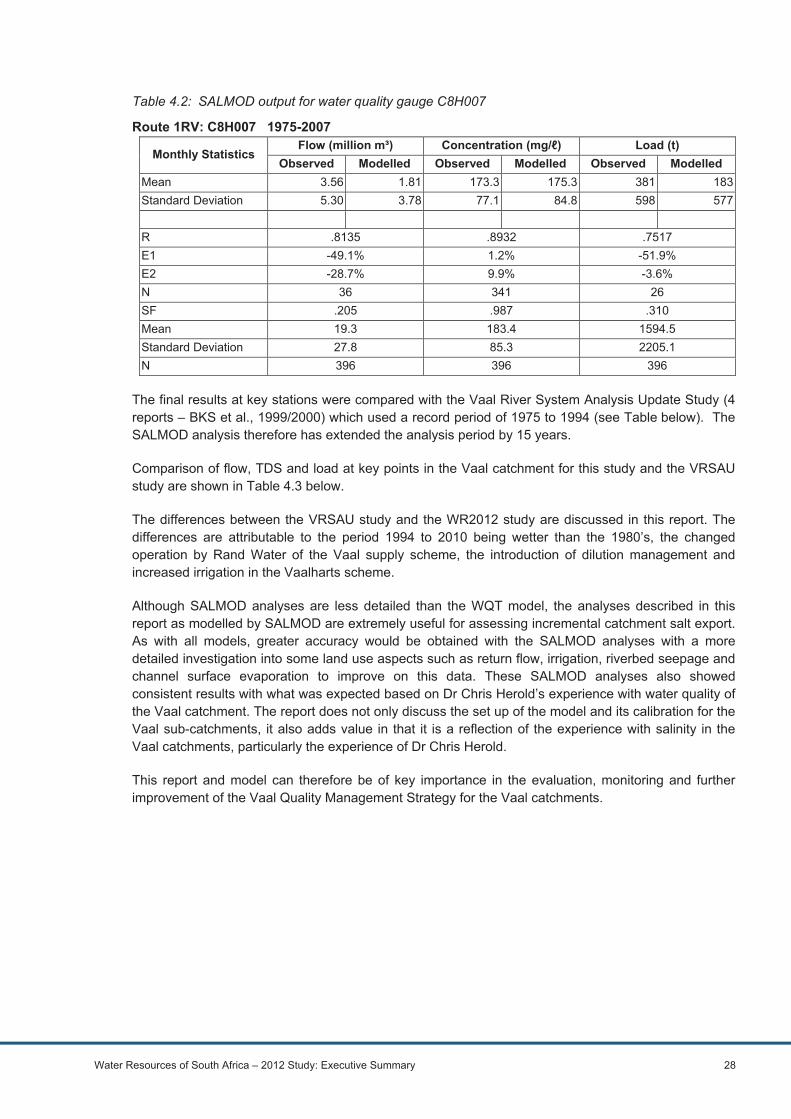
Water Resources of South Africa – 2012 Study: Executive Summary 28
Table 4.2: SALMOD output for water quality gauge C8H007
Route 1RV: C8H007 1975-2007
Monthly Statistics Flow (million m³) Concentration (mg/ ) Load (t)
Observed Modelled Observed Modelled Observed ModelledMean 3.56 1.81 173.3 175.3 381 183Standard Deviation 5.30 3.78 77.1 84.8 598 577 R .8135 .8932 .7517 E1 -49.1% 1.2% -51.9% E2 -28.7% 9.9% -3.6% N 36 341 26 SF .205 .987 .310 Mean 19.3 183.4 1594.5 Standard Deviation 27.8 85.3 2205.1 N 396 396 396
The final results at key stations were compared with the Vaal River System Analysis Update Study (4 reports – BKS et al., 1999/2000) which used a record period of 1975 to 1994 (see Table below). The SALMOD analysis therefore has extended the analysis period by 15 years.
Comparison of flow, TDS and load at key points in the Vaal catchment for this study and the VRSAU study are shown in Table 4.3 below.
The differences between the VRSAU study and the WR2012 study are discussed in this report. The differences are attributable to the period 1994 to 2010 being wetter than the 1980’s, the changed operation by Rand Water of the Vaal supply scheme, the introduction of dilution management and increased irrigation in the Vaalharts scheme.
Although SALMOD analyses are less detailed than the WQT model, the analyses described in this report as modelled by SALMOD are extremely useful for assessing incremental catchment salt export. As with all models, greater accuracy would be obtained with the SALMOD analyses with a more detailed investigation into some land use aspects such as return flow, irrigation, riverbed seepage and channel surface evaporation to improve on this data. These SALMOD analyses also showed consistent results with what was expected based on Dr Chris Herold’s experience with water quality of the Vaal catchment. The report does not only discuss the set up of the model and its calibration for the Vaal sub-catchments, it also adds value in that it is a reflection of the experience with salinity in the Vaal catchments, particularly the experience of Dr Chris Herold.
This report and model can therefore be of key importance in the evaluation, monitoring and further improvement of the Vaal Quality Management Strategy for the Vaal catchments.

Wat
er R
esou
rces
of S
outh
Afri
ca –
201
2 S
tudy
: Exe
cutiv
e S
umm
ary
29
Tabl
e 4.
3: C
ompa
rison
of s
alin
ity re
sults
bet
wee
n th
e V
RS
AU
stu
dy (u
sing
WQ
T) a
nd W
R20
12 (u
sing
SA
LMO
D)
WM
A
Key
poi
nt
WR
2012
St
art-E
nd
VRSA
U
Star
t-End
Flow
(m
illio
n m
³/mon
th)
TDS
Con
cent
ratio
n(m
g/)
TDS
Load
(tons
/mon
th)
WR
2012
VRSA
UW
R20
12VR
SAU
WR
2012
VRSA
U
Upp
er V
aal
Gro
otdr
aai D
am (C
1R00
2/
C1H
019)
19
95-2
009
(C1H
019)
19
75-1
994
(C1R
002)
47
.141
.019
.219
.517
8.0
176.
916
4.1
159.
57
985.
07
770.
03
410.
43
331.
4
Upp
er V
aal
Vaa
l Dam
(C
1R00
1/ C
2H12
2)
1975
-200
9 (C
2H12
2)
1975
-199
4 (C
1R00
1)
101.
511
9.0
120.
412
1.5
149.
317
4.1
140.
814
2.7
16 2
48.0
22 1
00.0
16 3
67.8
16 3
60.2
Upp
er V
aal
Vaa
l Bar
rage
(C
2R00
8/ C
2H01
8)
1975
-200
9 (C
2H01
8)
1975
-199
4 (C
2R00
8)
136.
512
6.9
88.6
87.5
490.
449
2.5
476.
451
9.2
39 9
83.0
37 3
42.0
26 7
35.1
26 7
20.5
Mid
dle
Vaal
C
2H01
8/ C
2H00
7 19
78-2
009
(C2H
007)
19
75-1
994
(C2H
018)
13
6.5
139.
590
.692
.355
3.1
535.
450
1.2
508.
346
581
.044
389
.028
562
.628
786
.5
Mid
dle
Vaal
C
4H00
4 19
77-2
009
1985
-199
4 17
.89
17.0
724
.47
24.8
300.
839
7.5
276.
627
7.8
5 08
0.0
4 81
6.0
6 12
8.4
7 07
7.3
Mid
dle
Vaal
Bl
oem
hof D
am
(C9R
002)
19
77-2
007
1975
-199
4 14
1.89
139.
4013
7.5
139.
138
7.4
392.
338
1.8
482.
242
208
41 1
8844
661
.945
585
.0
Low
er V
aal
Vaa
lhar
ts W
eir
(C9H
009)
19
75-2
006
1974
-199
4 11
6.07
112.
2413
4.9
147.
239
3.5
384.
538
7.2
397.
330
380
28 4
2837
959
.245
888
.9
Low
er V
aal
Dou
glas
Wei
r (C
9R00
3)
1977
-200
9 19
74-1
994
109.
7413
0.35
27.6
150.
950
1.4
347.
057
0.2
603.
337
540
.042
269
.09
317.
244
407
.1
Not
e 1:
Red
is o
bser
ved
and
blue
is s
imul
ated
Not
e 2:
The
reco
rd p
erio
d fo
r SA
LMO
D w
as d
icta
ted
by th
e av
aila
bilit
y of
TD
S d
ata.
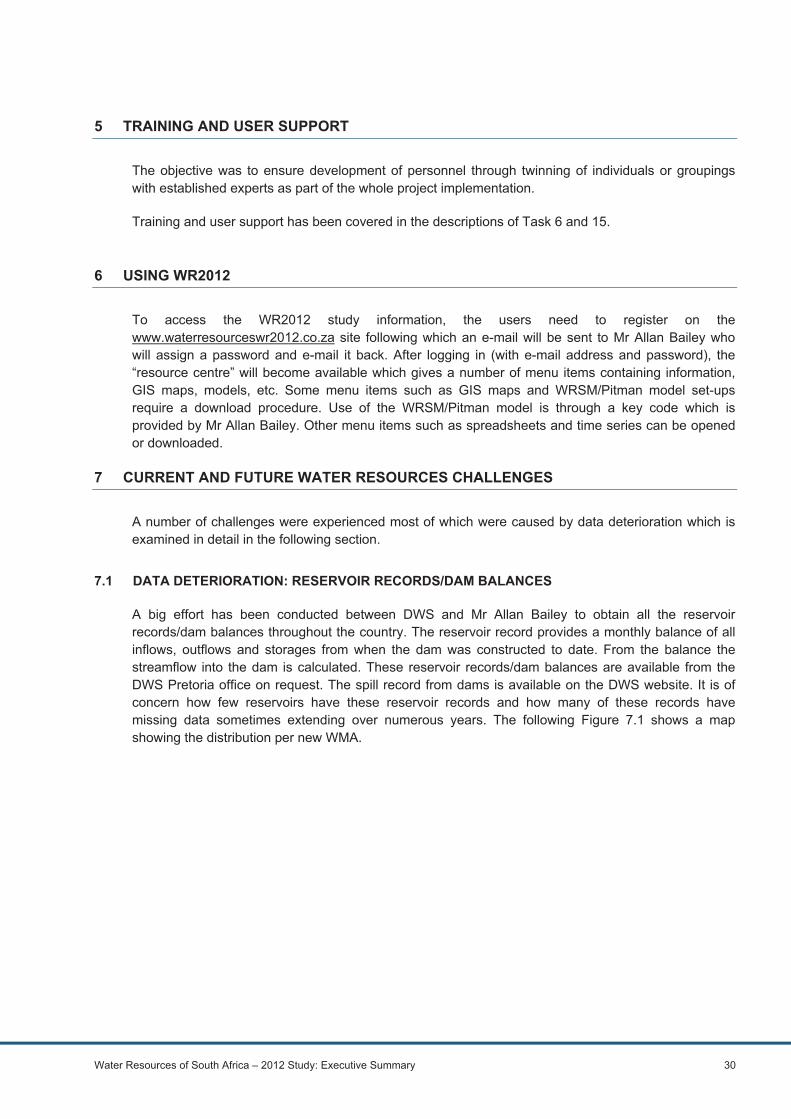
Water Resources of South Africa – 2012 Study: Executive Summary 30
5 TRAINING AND USER SUPPORT
The objective was to ensure development of personnel through twinning of individuals or groupings with established experts as part of the whole project implementation.
Training and user support has been covered in the descriptions of Task 6 and 15.
6 USING WR2012
To access the WR2012 study information, the users need to register on the www.waterresourceswr2012.co.za site following which an e-mail will be sent to Mr Allan Bailey who will assign a password and e-mail it back. After logging in (with e-mail address and password), the “resource centre” will become available which gives a number of menu items containing information, GIS maps, models, etc. Some menu items such as GIS maps and WRSM/Pitman model set-ups require a download procedure. Use of the WRSM/Pitman model is through a key code which is provided by Mr Allan Bailey. Other menu items such as spreadsheets and time series can be opened or downloaded.
7 CURRENT AND FUTURE WATER RESOURCES CHALLENGES
A number of challenges were experienced most of which were caused by data deterioration which is examined in detail in the following section.
7.1 DATA DETERIORATION: RESERVOIR RECORDS/DAM BALANCES
A big effort has been conducted between DWS and Mr Allan Bailey to obtain all the reservoir records/dam balances throughout the country. The reservoir record provides a monthly balance of all inflows, outflows and storages from when the dam was constructed to date. From the balance the streamflow into the dam is calculated. These reservoir records/dam balances are available from the DWS Pretoria office on request. The spill record from dams is available on the DWS website. It is of concern how few reservoirs have these reservoir records and how many of these records have missing data sometimes extending over numerous years. The following Figure 7.1 shows a map showing the distribution per new WMA.
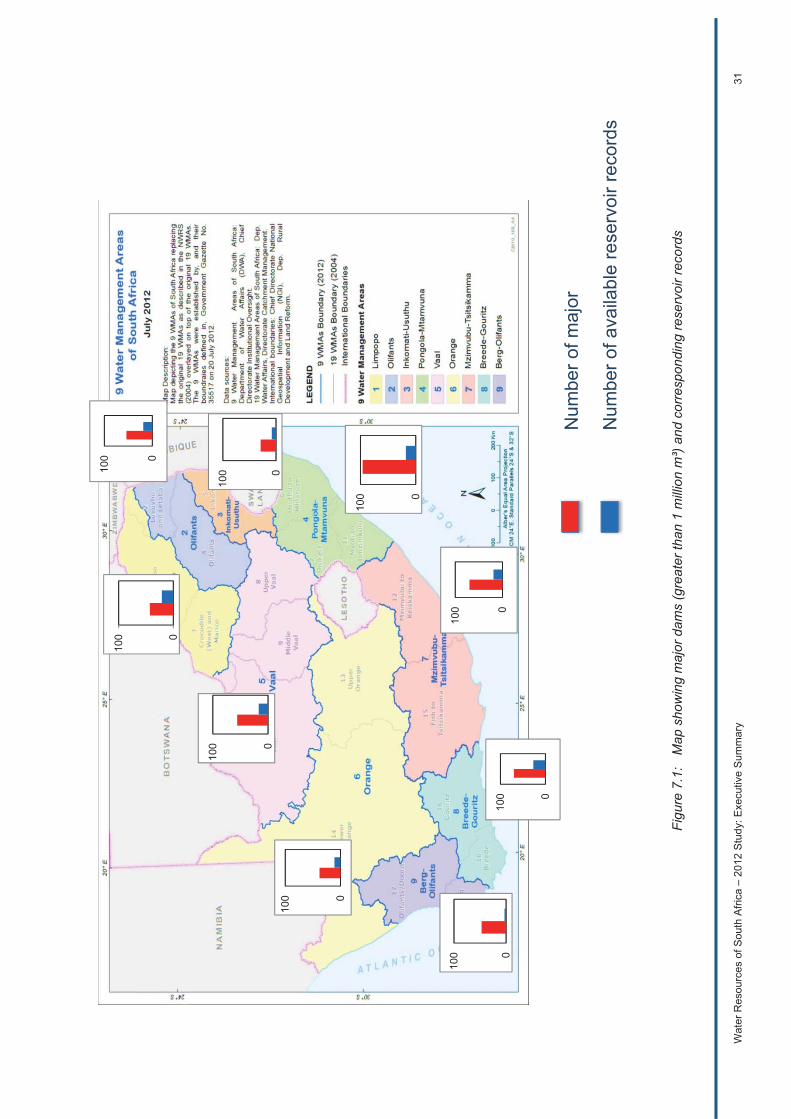
Wat
er R
esou
rces
of S
outh
Afri
ca –
201
2 S
tudy
: Exe
cutiv
e S
umm
ary
31
Figu
re 7
.1:
Map
sho
win
g m
ajor
dam
s (g
reat
er th
an 1
mill
ion
m³)
and
cor
resp
ondi
ng re
serv
oir r
ecor
ds
Num
ber o
f maj
or
Num
ber o
f ava
ilabl
e re
serv
oir r
ecor
ds
0
100
0
100
0
100
0
100
0
100
0
100
0
100
0
100
0
100

Water Resources of South Africa – 2012 Study: Executive Summary 32
7.2 DATA DETERIORATION: RAINFALL
Of greatest concern is the number of rainfall stations that are closing down. Rainfall is the most important data not only for WRSM/Pitman but for most other water resource models. This deterioration has been highlighted in numerous symposiums over the past three years or so by the WR2012 project team. The number of rainfall stations open is shown below in Figure 7.2 .
Figure 7.2: Number of useful rainfall stations open over time
7.3 DATA DETERIORATION: OBSERVED STREAMFLOW
Observed streamflow for river gauges were updated to September 2010 using the DWS website and patched where necessary. Figure 7.3 shows the decline in the number of useful streamflow gauging stations. Note that some streamflow stations are of such poor quality due to missing and unreliable values that the project team did not consider them useful for calibration in the WR2012 study.
0
500
1000
1500
2000
2500
1920 1930 1940 1950 1960 1970 1980 1990 2000 2010
Num
ber o
f use
ful s
tatio
ns o
pen
WR2005 WR2012
Water Resources of South Africa – 2012 Study: Executive Summary 33
Figure 7.3: Number of useful observed streamflow stations open over time
8 PROJECT USER SUPPORT
Queries on the website can be addressed to Mr Allan Bailey at [email protected]. There is also a forum option on the website for users to post comments and questions.
The WRSM/Pitman model has a drop-down help menu which takes the user to either the WRSM/Pitman User’s Guide, the WRSM/Pitman Theory Manual or the enhanced graph manual.
The WRSM/Pitman User’s Guide and the WRSM/Pitman Theory Manual can also be accessed from the Website.
9 PROJECT DOCUMENTATION
The objective of the website of WR2012 was mainly to improve and speed up access, allow user interaction, be easier to use and be merged with the improved tools and database. Although the interactive maps are available from the website, they are also available in hard copy.
9.1 PROJECT WEBSITE
Refer to section 4.15 for details.
0
100
200
300
400
500
600
1920 1930 1940 1950 1960 1970 1980 1990 2000
Num
ber o
f use
ful s
tatio
ns o
pen
Water Resources of South Africa – 2012 Study: Executive Summary 34
9.2 HARD COPY DOCUMENTS
Although GIS maps are available in electronic format, there is also a Book of Maps which contains the following maps:
Figure 0: Base map Figures: 0.1-0.19: Base map by Water Management Area Figure 1: Rainfall Figures 1.1-1.19: Rainfall map by Water Management Area Figure 2a: – Evaporation (WR90 S-pan) Figure 2b: – Evaporation (A-pan) Figure 3: − Runoff Figures 3.1-3.19: − Runoff map by Water Management Area Figure 4a: – Landcover Figure 4b: – Interbasin water transfers Figure 5a: – Calibration parameter: POW Figure 5b: − Calibration parameters : FT Figure 5c: – Calibration parameter: ST Figure 5d: – Calibration parameter: ZMin Figure 5e: – Calibration parameter: ZMax Figure 5f: – Calibration parameter: GPOW Figure 5g: – Calibration parameter: HGSL Figure 5h: – Calibration parameter: HGGW Figure 6: – Simplified Geology (WR90) Figure 7: – Soils (WR90) Figure 8: – Sediment (WR90) Figure 9: – Vegetation (WR90) Figure 10: – EWR Management Class Figure 11: – Surface Water Quality – TDS Figure 12: – Population Density Figure 13: − Present Day and Naturalised Streamflow at Key Points
10 CAPACITY BUILDING
There were numerous 2 day training courses held at universities and other organisations on the WRSM/Pitman model and the WR2012 study. The following universities received training:
University of Stellenbosch (twice); University of Western Cape (twice); University of North-West (twice); University of the Witwatersrand and SAICE/University of Pretoria.
Students at some universities are given assignments that require them to use the WRSM/Pitman model and data/information from the WR2012 study.
The Department of Water and Sanitation also received training.
Two WR2012 launches were undertaken which provided information to users. Mr Allan Bailey gave presentations at SANCIAHS and SANCOLD on WR2012 related issues.

Water Resources of South Africa – 2012 Study: Executive Summary 35
An article was written for the SAICE June 2015 edition (“A wealth of new freely downloadable information on the water resources of South Africa, Swaziland and Lesotho”).
There was in-house training to a number of people on various aspects of the WR2012 study. Ms Sarah Collinge was trained to assist with the WRSM/Pitman course and at a later stage Mr Seun Oyebode (who is studying for a PhD) was also trained in this respect.
On-going support was provided to over 950 users who have registered for the WR2012 website. Many of them have sent e-mails and made calls to Mr Allan Bailey requesting assistance and guidance on the use of the website.
11 CONCLUSIONS AND RECOMMENDATIONS
The WR2012 study was commissioned by the Water Research Commission in 2012, undertaken by Royal HaskoningDHV and assisted by a number of firms and individuals was completed in November 2015. The aims and objectives of the study as listed in the introduction to this report and described further in each task were met and the list of deliverables as outlined in the introduction were provided.
A survey of this nature is by its very extent an overview, to be used by many disciplines for overall planning purposes. It is likely that more detailed studies will be done in the WMAs in the study area and improved data and information will be collected, which in turn can be used to great benefit in studies of this scope in the future.
This is the second time that a country-wide survey has included surface water, groundwater and water quality components, and it is likely that techniques to deal with these components, and the integration thereof, will improve with time. For example, remote sensing and it is possible that rainfall data applications may eventually be available on a cell phone. In addition, the computer platforms, programs and computer methodologies continue to show huge expansion with time and techniques to deal with this will need development.
The naturalised mean annual runoff (MAR) for the country has been evaluated at 49 251 million m³ per annum, which is virtually the same as for WR2005. As determined in WR2005 and not updated in WR2012, the utilisable groundwater exploitation potential (UGEP) has been estimated at 10 350 million m³ per annum (7 500 million m³ per annum during drought conditions). There are obviously large differences in the unit runoff and unit groundwater potential in each WMA, driven mainly by natural processes and climatic variation. There are also large variations in water quality across the country both natural and through contamination of the water resources.
There are a number of recommendations from the study:
when new detailed studies produce improved information where this was not readily available, it is recommended that the WRSM/Pitman systems be updated;
there have been changes to the rain gauge and streamflow networks over time with gaps in geographical coverage now apparent. It is recommended that a task group representation of the data collection agencies meet to address this issue;
quaternary catchment boundary revisions be included in the next appraisal; the revised set of 9 WMAs be used in the next appraisal; water use by alien vegetation be revised; land/water use although improved from WR2005, still requires updating and correction as it has
sometimes been extended where no information existed. It is extremely difficult to obtain but there have been certain studies carried out using remote sensing and these could be used in the next appraisal;
Water Resources of South Africa – 2012 Study: Executive Summary 36
MAPs need to be re-assessed particularly in mountainous catchments in a separate study. Synergy with Professor Geoff Pegram’s study for the WRC should be investigated;
evaporation needs to be re-assessed; for dams, calibrations should be done on both simulated inflow and simulated storage. Issues
arising from the SALMOD water quality analysis should also be considered such as riverbed seepage (bedlosses) particularly in the Vaal catchment, which need to be reviewed in terms of location and magnitude;
enhancements to the daily time step version of WRSM/Pitman; user feedback and requests on model enhancements and information provided should be carried
out where practical; the SALMOD model requires some further enhancements; the website requires annual fees, registration of users and user support and WRSM/Pitman and WR2012 training and user support should be on-going.
12 REFERENCES
The following references are specific to work carried out by this consortium. Internal reports compiled by individual firms may have further references to work in specific WMAs:
Bailey, AK and Pitman, WV (2015): WR2012 User Guide
Bailey, AK and Pitman, WV (2015): WR2012 Book of Maps
BKS, Stewart Scott, Ninham Shand (1999): Vaal River System Analysis Update Study: Hydro-salinity Model Calibration: Upper Vaal Catchment. October 2000
BKS, Stewart Scott, Ninham Shand (1999): Vaal River System Analysis Update Study: Hydro-salinity Model Calibration: Vaal Barrage Catchment. October 1999
BKS, Stewart Scott, Ninham Shand (1999): Vaal River System Analysis Update Study: Hydro-salinity Model Calibration: Middle Vaal Catchment. October 1999
BKS, Stewart Scott, Ninham Shand (1999): Vaal River System Analysis Update Study: Hydro-salinity Model Calibration: Lower Vaal Catchment. January 1999
Herold CE (2007): SALMOD Water Quality Analysis. March 2007.
Herold CE (1988): Water Quality Modelling, Volume A : Water Quality Calibration Model.
Herold CE, Van Rooyen P and Steyn R: Irrigation Type 4 in the WQT, WRYM and WRPM Models: Theoretical Background and Model Configuration, April 2013.
Herold CE and Bailey AK, (2015): SALMOD Water Quality Analysis. June 2015.
Middleton BJ and Bailey AK, (2005): Water Resources of South Africa, 2005 Study (WR2005).
Pitman WV, (1976): A Mathematical Model for Generating Daily River Flows from Meteorological Data in South Africa, Report 2/76 . Hydrological Research Unit, University of the Witwatersrand.
Pitman WV, Kakebeeke JP and Bailey AK (2015): WRSM/Pitman : Water Resources Simulation Model for Windows : User Manual, December 2015.
Water Resources of South Africa – 2012 Study: Executive Summary 37
Pitman WV and Bailey AK (2015): WRSM/Pitman : Water Resources Simulation Model for Windows : Theory Manual, December 2015.
Pitman WV and Bailey AK (2015): WRSM/Pitman : Water Resources Simulation Model for Windows : Course Manual, December 2015.
Pitman WV (2015): A Review of calibrations undertaken with the WRSM/Pitman model.
Pitman WV and Bailey AK (2015): WRSM/Pitman Model Analysis Overview
Pitman WV, Bailey AK and Nyland G (2015): WRSM/Pitman : Water Resources Simulation Model for Windows : Programmer’s Code Manual, December 2015.
Sami K (2015): Sami K (2015): WR2012 SAMI Groundwater module: Verification Studies, Default Parameters and Calibration Guide;
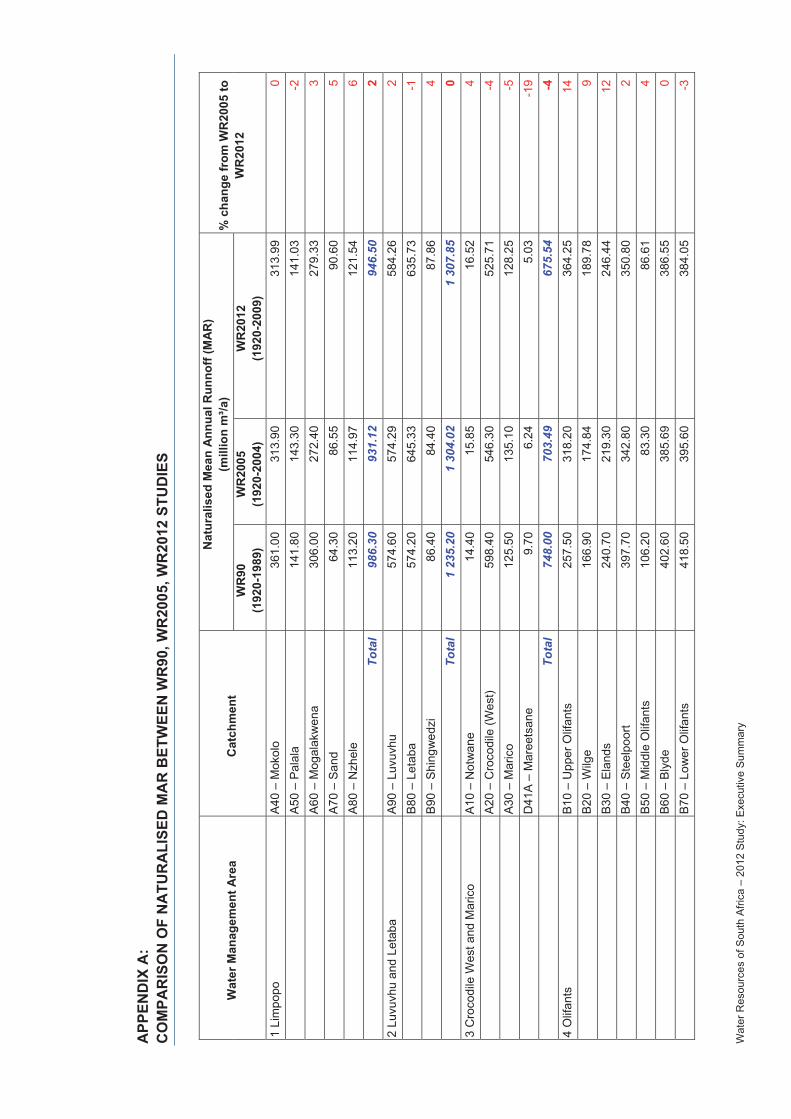
Wat
er R
esou
rces
of S
outh
Afri
ca –
201
2 S
tudy
: Exe
cutiv
e S
umm
ary
APP
END
IX A
: C
OM
PAR
ISO
N O
F N
ATU
RA
LISE
D M
AR
BET
WEE
N W
R90
, WR
2005
, WR
2012
STU
DIE
S
Wat
er M
anag
emen
t Are
a C
atch
men
t
Nat
ural
ised
Mea
n A
nnua
l Run
noff
(MA
R)
(mill
ion
m³/a
) %
cha
nge
from
WR
2005
to
WR
2012
W
R90
(192
0-19
89)
WR
2005
(192
0-20
04)
WR
2012
(192
0-20
09)
1 Li
mpo
po
A40
– M
okol
o 36
1.00
31
3.90
31
3.99
0
A5
0 –
Pala
la
141.
80
143.
30
141.
03
-2
A
60 –
Mog
alak
wen
a 30
6.00
27
2.40
27
9.33
3
A7
0 –
Sand
64
.30
86.5
5 90
.60
5
A80
– N
zhel
e 11
3.20
11
4.97
12
1.54
6
To
tal
986.
30
931.
12
946.
50
2 2
Luvu
vhu
and
Leta
ba
A90
– Lu
vuvh
u 57
4.60
57
4.29
58
4.26
2
B8
0 –
Leta
ba
574.
20
645.
33
635.
73
-1
B9
0 –
Shin
gwed
zi
86.4
0 84
.40
87.8
6 4
To
tal
1 23
5.20
1
304.
02
1 30
7.85
0
3 C
roco
dile
Wes
t and
Mar
ico
A10
– N
otw
ane
14.4
0 15
.85
16.5
2 4
A
20 –
Cro
codi
le (W
est)
598.
40
546.
30
525.
71
-4
A3
0 –
Mar
ico
125.
50
135.
10
128.
25
-5
D
41A
– M
aree
tsan
e 9.
70
6.24
5.
03
-19
To
tal
748.
00
703.
49
675.
54
-4
4 O
lifan
ts
B10
– U
pper
Olif
ants
25
7.50
31
8.20
36
4.25
14
B20
– W
ilge
166.
90
174.
84
189.
78
9
B30
– El
ands
24
0.70
21
9.30
24
6.44
12
B40
– St
eelp
oort
397.
70
342.
80
350.
80
2
B50
– M
iddl
e O
lifan
ts
106.
20
83.3
0 86
.61
4
B60
– Bl
yde
402.
60
385.
69
386.
55
0
B70
– Lo
wer
Olif
ants
41
8.50
39
5.60
38
4.05
-3

Wat
er R
esou
rces
of S
outh
Afri
ca –
201
2 S
tudy
: Exe
cutiv
e S
umm
ary
Wat
er M
anag
emen
t Are
a C
atch
men
t
Nat
ural
ised
Mea
n A
nnua
l Run
noff
(MA
R)
(mill
ion
m³/a
) %
cha
nge
from
WR
2005
to
WR
2012
W
R90
(192
0-19
89)
WR
2005
(192
0-20
04)
WR
2012
(192
0-20
09)
To
tal
1 99
0.10
1
919.
73
2 00
8.48
5
5 In
kom
ati
X10
– Ko
mat
i 1
365.
60
1 31
8.60
1
276.
02
-3
X2
0 –
Cro
codi
le (E
ast)
1 23
6.40
1
063.
00
1 18
5.14
11
X30
– Sa
bie
732.
20
670.
50
671.
72
0
X40
– N
wan
edzi
27
.00
36.5
0 50
.95
40
To
tal
3 36
1.20
3
088.
60
3 18
3.83
3
6 U
sutu
to M
hlat
uze
(incl
. Sw
azila
nd)
W10
– M
hlat
uze
931.
10
951.
30
958.
69
1
W20
– M
folo
si
971.
90
910.
50
824.
76
-9
W
30 –
Mku
ze
538.
70
558.
50
577.
59
3
W40
– P
ongo
la
1 36
6.60
1
288.
20
1 10
3.79
-1
4
W50
– U
sutu
2
341.
80
2 13
0.30
2
211.
87
4
W60
– M
belu
zi
459.
80
458.
22
453.
90
-1
W
70 –
sm
all r
iver
s an
d la
ke
Sib
ayi
111.
20
124.
08
142.
77
15
To
tal
6 72
1.10
6
421.
10
6 27
3.37
-2
7
Thuk
ela
V10
– U
pper
Thu
kela
1
622.
90
1 54
2.60
1
454.
08
-6
V2
0 –
Moo
i 40
2.50
40
0.40
38
9.75
-3
V30
– Bu
ffalo
1
016.
80
942.
90
879.
11
-7
V4
0 –
Nsu
ze
170.
60
160.
50
159.
23
-1
V5
0 –
Low
er T
huke
la
156.
70
201.
58
181.
21
-10
V6
0 –
Sund
ays
311.
70
314.
88
313.
34
0
V70
– Bu
shm
ans
312.
70
318.
86
307.
94
-3
To
tal
3 99
3.90
3
881.
72
3 68
4.66
-5
8
Upp
er V
aal
C10
– U
pper
Vaa
l 1
136.
70
1 10
0.09
1
082.
35
-2
C
21-C
23 –
Vaa
l Bar
rage
51
1.70
40
4.40
47
5.49
18
C80
– W
ilge
932.
40
948.
40
933.
36
-2
To
tal
2 58
0.80
2
452.
89
2 49
1.20
2
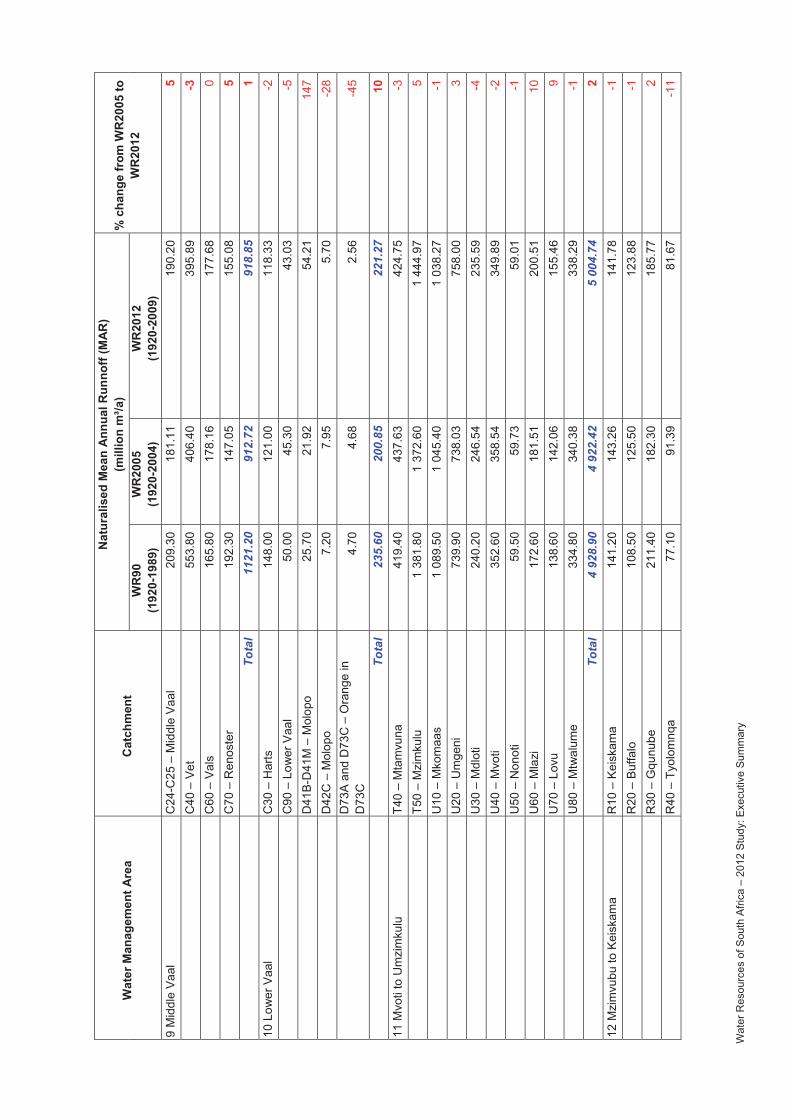
Wat
er R
esou
rces
of S
outh
Afri
ca –
201
2 S
tudy
: Exe
cutiv
e S
umm
ary
Wat
er M
anag
emen
t Are
a C
atch
men
t
Nat
ural
ised
Mea
n A
nnua
l Run
noff
(MA
R)
(mill
ion
m³/a
) %
cha
nge
from
WR
2005
to
WR
2012
W
R90
(192
0-19
89)
WR
2005
(192
0-20
04)
WR
2012
(192
0-20
09)
9 M
iddl
e Va
al
C24
-C25
– M
iddl
e Va
al
209.
30
181.
11
190.
20
5
C40
– V
et
553.
80
406.
40
395.
89
-3
C
60 –
Val
s 16
5.80
17
8.16
17
7.68
0
C
70 –
Ren
oste
r 19
2.30
14
7.05
15
5.08
5
To
tal
1121
.20
912.
72
918.
85
1 10
Low
er V
aal
C30
– H
arts
14
8.00
12
1.00
11
8.33
-2
C90
– L
ower
Vaa
l 50
.00
45.3
0 43
.03
-5
D
41B-
D41
M –
Mol
opo
25.7
0 21
.92
54.2
1 14
7
D42
C –
Mol
opo
7.20
7.
95
5.70
-2
8
D
73A
and
D73
C –
Ora
nge
in
D73
C
4.70
4.
68
2.56
-4
5
To
tal
235.
60
200.
85
221.
27
10
11 M
voti
to U
mzi
mku
lu
T40
– M
tam
vuna
41
9.40
43
7.63
42
4.75
-3
T50
– M
zim
kulu
1
381.
80
1 37
2.60
1
444.
97
5
U10
– M
kom
aas
1 08
9.50
1
045.
40
1 03
8.27
-1
U20
– U
mge
ni
739.
90
738.
03
758.
00
3
U30
– M
dlot
i 24
0.20
24
6.54
23
5.59
-4
U40
– M
voti
352.
60
358.
54
349.
89
-2
U
50 –
Non
oti
59.5
0 59
.73
59.0
1 -1
U60
– M
lazi
17
2.60
18
1.51
20
0.51
10
U70
– L
ovu
138.
60
142.
06
155.
46
9
U80
– M
twal
ume
334.
80
340.
38
338.
29
-1
To
tal
4 92
8.90
4
922.
42
5 00
4.74
2
12 M
zim
vubu
to K
eisk
ama
R10
– K
eisk
ama
141.
20
143.
26
141.
78
-1
R
20 –
Buf
falo
10
8.50
12
5.50
12
3.88
-1
R30
– G
qunu
be
211.
40
182.
30
185.
77
2
R40
– T
yolo
mnq
a 77
.10
91.3
9 81
.67
-11
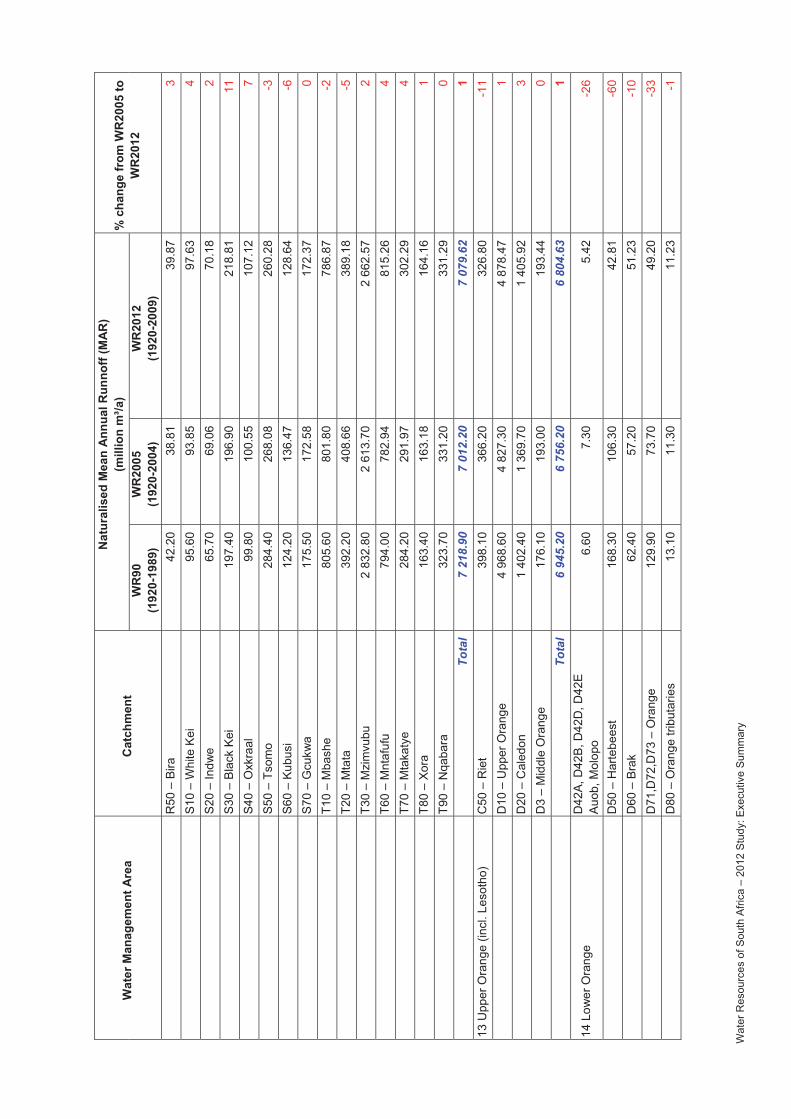
Wat
er R
esou
rces
of S
outh
Afri
ca –
201
2 S
tudy
: Exe
cutiv
e S
umm
ary
Wat
er M
anag
emen
t Are
a C
atch
men
t
Nat
ural
ised
Mea
n A
nnua
l Run
noff
(MA
R)
(mill
ion
m³/a
) %
cha
nge
from
WR
2005
to
WR
2012
W
R90
(192
0-19
89)
WR
2005
(192
0-20
04)
WR
2012
(192
0-20
09)
R
50 –
Bira
42
.20
38.8
1 39
.87
3
S10
– W
hite
Kei
95
.60
93.8
5 97
.63
4
S20
– In
dwe
65.7
0 69
.06
70.1
8 2
S3
0 –
Blac
k K
ei
197.
40
196.
90
218.
81
11
S4
0 –
Oxk
raal
99
.80
100.
55
107.
12
7
S50
– Ts
omo
284.
40
268.
08
260.
28
-3
S6
0 –
Kubu
si
124.
20
136.
47
128.
64
-6
S7
0 –
Gcu
kwa
175.
50
172.
58
172.
37
0
T10
– M
bash
e 80
5.60
80
1.80
78
6.87
-2
T20
– M
tata
39
2.20
40
8.66
38
9.18
-5
T30
– M
zim
vubu
2
832.
80
2 61
3.70
2
662.
57
2
T60
– M
ntaf
ufu
794.
00
782.
94
815.
26
4
T70
– M
taka
tye
284.
20
291.
97
302.
29
4
T80
– Xo
ra
163.
40
163.
18
164.
16
1
T90
– N
qaba
ra
323.
70
331.
20
331.
29
0
Tota
l 7
218.
90
7 01
2.20
7
079.
62
1 13
Upp
er O
rang
e (in
cl. L
esot
ho)
C50
– R
iet
398.
10
366.
20
326.
80
-11
D
10 –
Upp
er O
rang
e 4
968.
60
4 82
7.30
4
878.
47
1
D20
– C
aled
on
1 40
2.40
1
369.
70
1 40
5.92
3
D
3 –
Mid
dle
Ora
nge
176.
10
193.
00
193.
44
0
Tota
l 6
945.
20
6 75
6.20
6
804.
63
1
14 L
ower
Ora
nge
D42
A, D
42B
, D42
D, D
42E
A
uob,
Mol
opo
6.60
7.
30
5.42
-2
6
D
50 –
Har
tebe
est
168.
30
106.
30
42.8
1 -6
0
D60
– B
rak
62.4
0 57
.20
51.2
3 -1
0
D71
,D72
,D73
– O
rang
e 12
9.90
73
.70
49.2
0 -3
3
D80
– O
rang
e tri
buta
ries
13.1
0 11
.30
11.2
3 -1
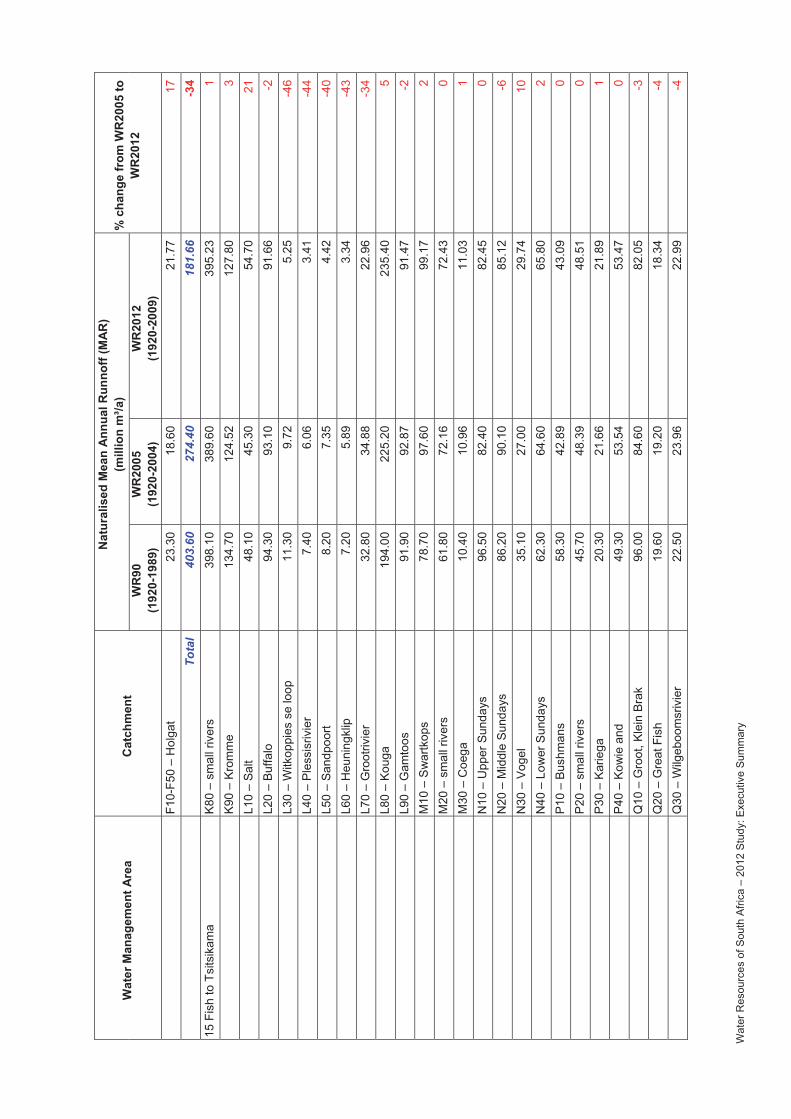
Wat
er R
esou
rces
of S
outh
Afri
ca –
201
2 S
tudy
: Exe
cutiv
e S
umm
ary
Wat
er M
anag
emen
t Are
a C
atch
men
t
Nat
ural
ised
Mea
n A
nnua
l Run
noff
(MA
R)
(mill
ion
m³/a
) %
cha
nge
from
WR
2005
to
WR
2012
W
R90
(192
0-19
89)
WR
2005
(192
0-20
04)
WR
2012
(192
0-20
09)
F1
0-F5
0 –
Hol
gat
23.3
0 18
.60
21.7
7 17
Tota
l 40
3.60
27
4.40
18
1.66
-3
4 15
Fis
h to
Tsi
tsik
ama
K80
– s
mal
l riv
ers
398.
10
389.
60
395.
23
1
K90
– Kr
omm
e 13
4.70
12
4.52
12
7.80
3
L1
0 –
Salt
48.1
0 45
.30
54.7
0 21
L20
– Bu
ffalo
94
.30
93.1
0 91
.66
-2
L3
0 –
Witk
oppi
es s
e lo
op
11.3
0 9.
72
5.25
-4
6
L40
– Pl
essi
sriv
ier
7.40
6.
06
3.41
-4
4
L50
– Sa
ndpo
ort
8.20
7.
35
4.42
-4
0
L60
– H
euni
ngkl
ip
7.20
5.
89
3.34
-4
3
L70
– G
root
rivie
r 32
.80
34.8
8 22
.96
-34
L8
0 –
Koug
a 19
4.00
22
5.20
23
5.40
5
L9
0 –
Gam
toos
91
.90
92.8
7 91
.47
-2
M
10 –
Sw
artk
ops
78.7
0 97
.60
99.1
7 2
M
20 –
sm
all r
iver
s
61.8
0 72
.16
72.4
3 0
M
30 –
Coe
ga
10.4
0 10
.96
11.0
3 1
N
10 –
Upp
er S
unda
ys
96.5
0 82
.40
82.4
5 0
N
20 –
Mid
dle
Sund
ays
86.2
0 90
.10
85.1
2 -6
N30
– V
ogel
35
.10
27.0
0 29
.74
10
N
40 –
Low
er S
unda
ys
62.3
0 64
.60
65.8
0 2
P1
0 –
Bush
man
s 58
.30
42.8
9 43
.09
0
P20
– sm
all r
iver
s 45
.70
48.3
9 48
.51
0
P30
– Ka
riega
20
.30
21.6
6 21
.89
1
P40
– Ko
wie
and
49
.30
53.5
4 53
.47
0
Q10
– G
root
, Kle
in B
rak
96.0
0 84
.60
82.0
5 -3
Q20
– G
reat
Fis
h 19
.60
19.2
0 18
.34
-4
Q
30 –
Wilg
eboo
msr
ivie
r 22
.50
23.9
6 22
.99
-4
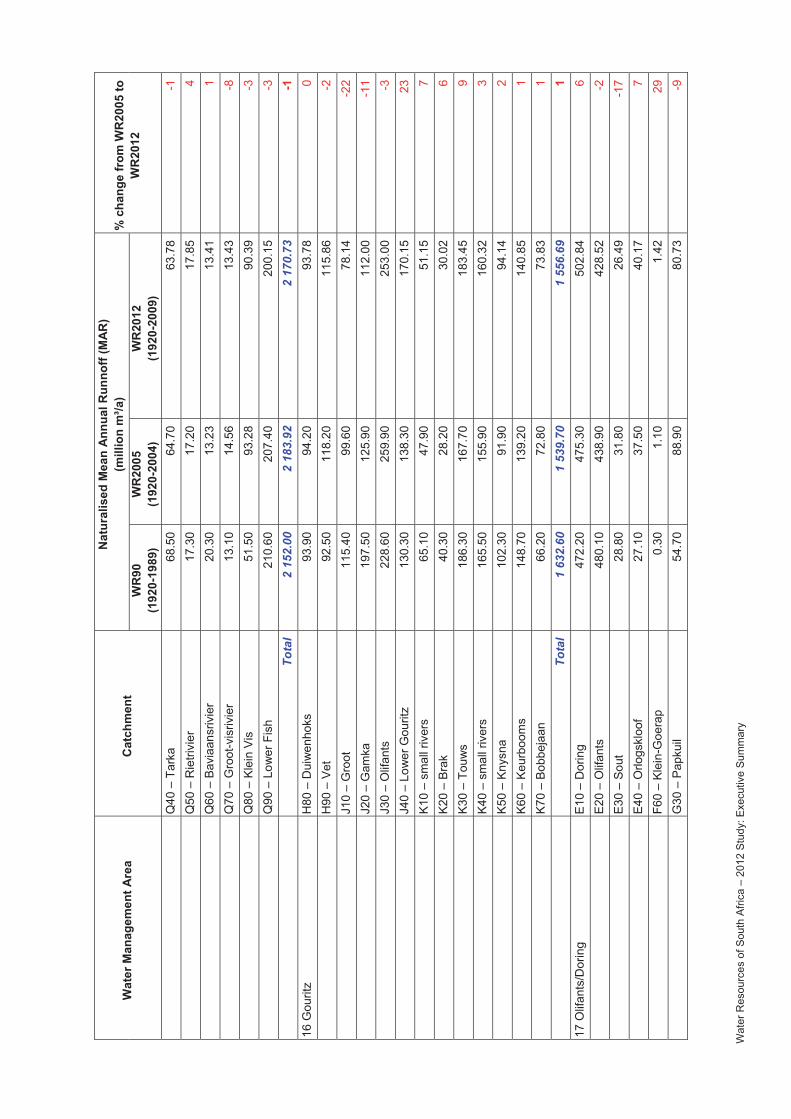
Wat
er R
esou
rces
of S
outh
Afri
ca –
201
2 S
tudy
: Exe
cutiv
e S
umm
ary
Wat
er M
anag
emen
t Are
a C
atch
men
t
Nat
ural
ised
Mea
n A
nnua
l Run
noff
(MA
R)
(mill
ion
m³/a
) %
cha
nge
from
WR
2005
to
WR
2012
W
R90
(192
0-19
89)
WR
2005
(192
0-20
04)
WR
2012
(192
0-20
09)
Q
40 –
Tar
ka
68.5
0 64
.70
63.7
8 -1
Q50
– R
ietri
vier
17
.30
17.2
0 17
.85
4
Q60
– B
avia
ansr
ivie
r 20
.30
13.2
3 13
.41
1
Q70
– G
root
-vis
rivie
r 13
.10
14.5
6 13
.43
-8
Q
80 –
Kle
in V
is
51.5
0 93
.28
90.3
9 -3
Q90
– L
ower
Fis
h 21
0.60
20
7.40
20
0.15
-3
Tota
l 2
152.
00
2 18
3.92
2
170.
73
-1
16 G
ourit
z H
80 –
Dui
wen
hoks
93
.90
94.2
0 93
.78
0
H90
– V
et
92.5
0 11
8.20
11
5.86
-2
J10
– G
root
11
5.40
99
.60
78.1
4 -2
2
J20
– G
amka
19
7.50
12
5.90
11
2.00
-1
1
J30
– O
lifan
ts
228.
60
259.
90
253.
00
-3
J4
0 –
Low
er G
ourit
z 13
0.30
13
8.30
17
0.15
23
K10
– sm
all r
iver
s 65
.10
47.9
0 51
.15
7
K20
– Br
ak
40.3
0 28
.20
30.0
2 6
K3
0 –
Touw
s 18
6.30
16
7.70
18
3.45
9
K4
0 –
smal
l riv
ers
165.
50
155.
90
160.
32
3
K50
– Kn
ysna
10
2.30
91
.90
94.1
4 2
K6
0 –
Keur
boom
s 14
8.70
13
9.20
14
0.85
1
K7
0 –
Bobb
ejaa
n 66
.20
72.8
0 73
.83
1
Tota
l 1
632.
60
1 53
9.70
1
556.
69
1 17
Olif
ants
/Dor
ing
E10
– D
orin
g 47
2.20
47
5.30
50
2.84
6
E2
0 –
Olif
ants
48
0.10
43
8.90
42
8.52
-2
E30
– So
ut
28.8
0 31
.80
26.4
9 -1
7
E40
– O
rlogs
kloo
f 27
.10
37.5
0 40
.17
7
F60
– Kl
ein-
Goe
rap
0.30
1.
10
1.42
29
G30
– P
apku
il 54
.70
88.9
0 80
.73
-9
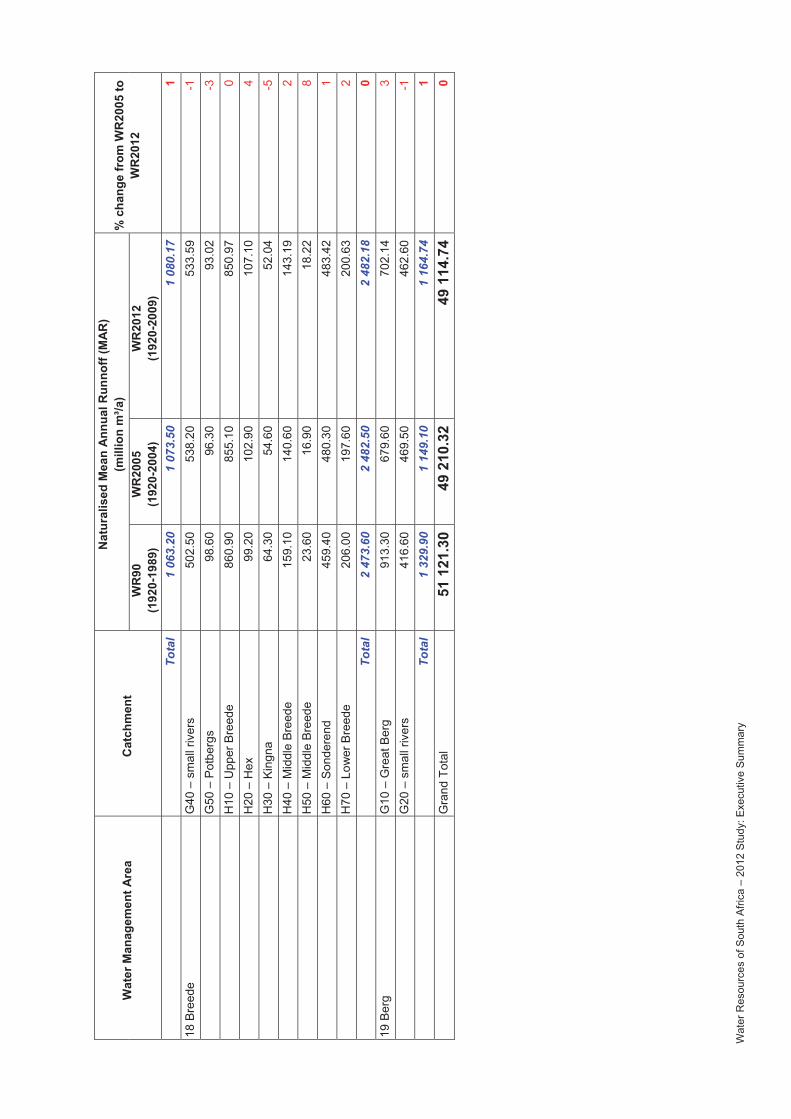
Wat
er R
esou
rces
of S
outh
Afri
ca –
201
2 S
tudy
: Exe
cutiv
e S
umm
ary
Wat
er M
anag
emen
t Are
a C
atch
men
t
Nat
ural
ised
Mea
n A
nnua
l Run
noff
(MA
R)
(mill
ion
m³/a
) %
cha
nge
from
WR
2005
to
WR
2012
W
R90
(192
0-19
89)
WR
2005
(192
0-20
04)
WR
2012
(192
0-20
09)
To
tal
1 06
3.20
1
073.
50
1 08
0.17
1
18 B
reed
e G
40 –
sm
all r
iver
s 50
2.50
53
8.20
53
3.59
-1
G50
– P
otbe
rgs
98.6
0 96
.30
93.0
2 -3
H10
– U
pper
Bre
ede
860.
90
855.
10
850.
97
0
H20
– H
ex
99.2
0 10
2.90
10
7.10
4
H
30 –
Kin
gna
64.3
0 54
.60
52.0
4 -5
H40
– M
iddl
e Br
eede
15
9.10
14
0.60
14
3.19
2
H
50 –
Mid
dle
Bree
de
23.6
0 16
.90
18.2
2 8
H
60 –
Son
dere
nd
459.
40
480.
30
483.
42
1
H70
– L
ower
Bre
ede
206.
00
197.
60
200.
63
2
Tota
l 2
473.
60
2 48
2.50
2
482.
18
0 19
Ber
g G
10 –
Gre
at B
erg
913.
30
679.
60
702.
14
3
G20
– s
mal
l riv
ers
416.
60
469.
50
462.
60
-1
To
tal
1 32
9.90
1
149.
10
1 16
4.74
1
G
rand
Tot
al
51 1
21.3
049
210
.32
49 1
14.7
40
