world ocean circulation experiment€¦ · world ocean circulation experiment world climate...
TRANSCRIPT
WORLD OCEAN CIRCULATION EXPERIMENT
WORLD CLIMATE RESEARCH PROGRAMME
WOCE DATA GUIDE1997
WO
RLD
CLIMATE RESEARCH PROGRAMM
EW
OR
LD
OC
EA
NCIRCULATIO
N
EX
PE
RIM
EN
T
WOCE
CRAY
WOCEDAC
WDCAUSA
CD-ROMWOCE DATA
page 2 WOCE Data Guide 1997
The WOCE data management structure is adistributed system which utilises the expertiseof scientists in order to attain the highestpossible data quality and documentation. Eachmeasurement technique produces a differentdata “stream”, and the data managementsystem brings them together to form a singledata resource for numerous investigators andanalysis groups. The system consists of severalelements with the flow being from PrincipalInvestigator to DAC to SAC to users andArchive.
Data Assembly Centres (DACs) aremanaged by scientists, handle assembly andquality control of data sets, and generate dataproducts.
Special Analysis Centres (SACs) performdata analysis and synthesis functions,including the generation of derived data sets.
WOCE Archive is distributed across thecentres of the World Data Center System.
The Data Information Unit (DIU) is a centralsource of information on the status of WOCE,tracking all data collection, processing andarchiving activities, and acting as the primaryinterface between the WOCE data systemand all users.
WORLD OCEAN CIRCULATION EXPERIMENTDATA AND INFORMATION SYSTEM
The World Ocean Circulation Experiment is the part of the World Climate Research Programme that will provide much-needed improvements in ocean circulation models for use in climate prediction. The oceans are a key element in theclimate system in the way they transport heat and fresh water and exchange these with the atmosphere. The oceans alsosequester CO
2 released by the burning of fossil fuels. WOCE has used resources from 25 countries to make unprecedented
in-situ and satellite observations of the global ocean between 1990 and 1997 and to observe poorly-understood butimportant physical processes. In parallel, great advances have been made during WOCE in the ability of ocean modelsto reproduce the known characteristics of the ocean and its circulation. Analysis, Interpretation, Modelling and Synthesisof WOCE data (WOCE AIMS) will continue to 2002 but a prerequisite for its success will be the continuing assemblyand quality control of WOCE data. The diverse WOCE data sets will serve as a unique resource for climate researchersand marine scientists for decades to come.
What is WOCE?
WOCE has developed a data sharing policy which strikesa balance between the requirements of the experiment as awhole and the intellectual rights of the individuals whocontribute to the programme. The trade-off between thesedifferent interests has resulted in a policy which expectsdata to be made publicly available within 2 years of the dataset being complete. Investigators are thus allowed areasonable period to complete their own analysis andpublications, while ensuring the global dataset isaccumulated and made accessible for wider examination.Data will not be released by the data centres without theconsent of the originator. WOCE encourages investigatorsto share data with others and to authorise general release assoon as possible. If investigators demand exclusive rightsto data more than 2 years old then WOCE encourages peerpressure and funding agencies to persuade the originator togive consent.
This document provides a basic outline of the WOCEdata system but for detailed information the usershould contact the DIU, and for access to data setscontact the DACs and SACs themselves. A suggestedroute is to start a World Wide Web tour at the DIUwhere summaries of the field programme and datastatus are continually updated. Links exist to allcomponents of the WOCE data system, to further datasources which may be of interest, and to a bibliographyof WOCE references. If you do not have access to theInternet, contact the DIU (see back cover) forinformation on other means of accessing data.
Navigation through the Webhttp://www.cms.udel.edu/woce/
Sharing WOCE Data
WOCE Data Guide 1997 page 3
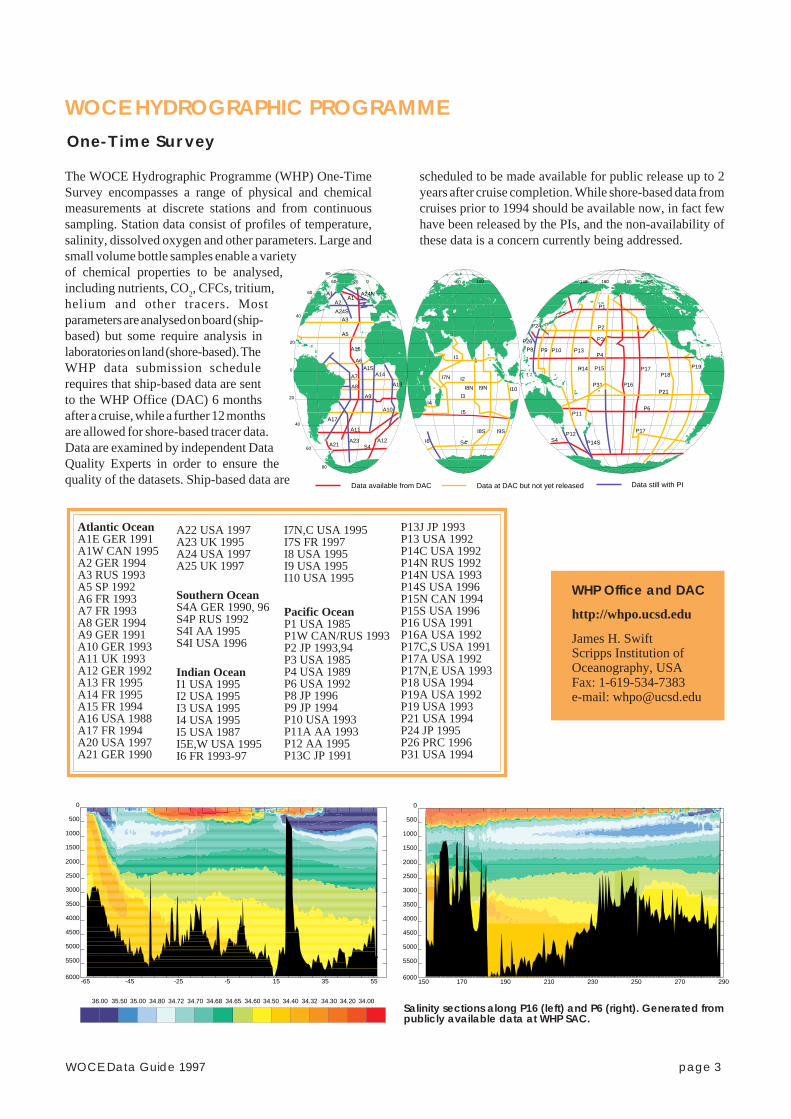
The WOCE Hydrographic Programme (WHP) One-TimeSurvey encompasses a range of physical and chemicalmeasurements at discrete stations and from continuoussampling. Station data consist of profiles of temperature,salinity, dissolved oxygen and other parameters. Large andsmall volume bottle samples enable a varietyof chemical properties to be analysed,including nutrients, CO
2, CFCs, tritium,
helium and other tracers. Mostparameters are analysed on board (ship-based) but some require analysis inlaboratories on land (shore-based). TheWHP data submission schedulerequires that ship-based data are sentto the WHP Office (DAC) 6 monthsafter a cruise, while a further 12 monthsare allowed for shore-based tracer data.Data are examined by independent DataQuality Experts in order to ensure thequality of the datasets. Ship-based data are
WOCE HYDROGRAPHIC PROGRAMMEOne-Time Survey
Salinity sections along P16 (left) and P6 (right). Generated frompublicly available data at WHP SAC.
-65 -45 -25 -5 15 35 556000
5500
5000
4500
4000
3500
3000
2500
2000
1500
1000
500
0
34.0034.2034.3034.3234.4034.5034.6034.6534.6834.7034.7234.8035.0035.5036.00
150 170 190 210 230 250 270 2906000
5500
5000
4500
4000
3500
3000
2500
2000
1500
1000
500
0
Atlantic OceanA1E GER 1991A1W CAN 1995A2 GER 1994A3 RUS 1993A5 SP 1992A6 FR 1993A7 FR 1993A8 GER 1994A9 GER 1991A10 GER 1993A11 UK 1993A12 GER 1992A13 FR 1995A14 FR 1995A15 FR 1994A16 USA 1988A17 FR 1994A20 USA 1997A21 GER 1990
A22 USA 1997A23 UK 1995A24 USA 1997A25 UK 1997
Southern OceanS4A GER 1990, 96S4P RUS 1992S4I AA 1995S4I USA 1996
Indian OceanI1 USA 1995I2 USA 1995I3 USA 1995I4 USA 1995I5 USA 1987I5E,W USA 1995I6 FR 1993-97
I7N,C USA 1995I7S FR 1997I8 USA 1995I9 USA 1995I10 USA 1995
Pacific OceanP1 USA 1985P1W CAN/RUS 1993P2 JP 1993,94P3 USA 1985P4 USA 1989P6 USA 1992P8 JP 1996P9 JP 1994P10 USA 1993P11A AA 1993P12 AA 1995P13C JP 1991
P13J JP 1993P13 USA 1992P14C USA 1992P14N RUS 1992P14N USA 1993P14S USA 1996P15N CAN 1994P15S USA 1996P16 USA 1991P16A USA 1992P17C,S USA 1991P17A USA 1992P17N,E USA 1993P18 USA 1994P19A USA 1992P19 USA 1993P21 USA 1994P24 JP 1995P26 PRC 1996P31 USA 1994
WHP Office and DAC
http://whpo.ucsd.edu
James H. SwiftScripps Institution ofOceanography, USAFax: 1-619-534-7383e-mail: [email protected]
80
60
40
20
0
20
40
60
80
60 20 0 20 60 100140 180 140100
S4
P15
S4A23
A16
A1
A3
A5
A6
A7
A9
A10
A11
A12A21
A1
A2
A8 A13
A14A15
A17
P1
P3
P4
P19P17
P16
P14
P13
S4
P10
I6
I4
I1
I2
I3
I8S I9S
I9NI8N
I7N
I10
P2
P21
P12
P11
P14S
P17
P31
P18
P8 P9
P26
P6
A24S
A24N
Data available from DAC Data at DAC but not yet released Data still with PI
P24
I5
scheduled to be made available for public release up to 2years after cruise completion. While shore-based data fromcruises prior to 1994 should be available now, in fact fewhave been released by the PIs, and the non-availability ofthese data is a concern currently being addressed.

page 4 WOCE Data Guide 1997
The repeated sections and time seriesstations provide information on thetemporal variability of the ocean fromseveral occupations in different seasonsand years. The data from eachoccupation are considered separatelyin the data management system, thusearly data from a section may beavailable before all the plannedoccupations have occurred. The mapshows the sections for which at leastsome data have been made available orare at the WHP Office (DAC), and thosefor which all data remain with the PrincipalInvestigators.
The WHP Special Analysis Centre (SAC) is the final stagein the hydrographic data management process; it providesa globally consistent data set and generates dynamicalproducts for use in models and other analyses. Specialisedvisualisation programs and historical (pre-WOCE)hydrographic data are also available from the SAC.
Repeat Hydrography
WHP Special Analysis Centre
Repeated occupations of SR1; potential temperature (colours)and neutral density (lines). Source: S. Cunningham, SOC, UK.
5.0
4.0
3.0
2.0
1.0
0.0
-1.0
54.5 55.5 56.5 57.5 58.5 59.5 60.5 61.5°S
0
200
400
600
800
1000
0
200
400
600
800
1000
0
200
400
600
800
10001993
1994
1996
°C
WHP Special Analysis Centre
http://www.dkrz.de/~u241046/
Kai Jancke, Bundesamt für Seeschiffahrt undHydrographie (BSH), GermanyFax: 49-40-3190-5000e-mail: [email protected]
Atlantic OceanAR1 USA 1998,1AR4E GER,FR 1990-96,9AR4W GER,FR 1990-95,7AR5 CAN 1991-95,2AR6 GER,SP 1991-94,2AR7E NL,UK,GER 1990-94,6AR7W CAN 1990-96,7AR8 ARG,BRA 1991-96,10AR10 UK,USA,CAN 1992-93,5AR11 RUS,UKR,USA 1991-93,12AR12 UK,NL 1991-92,4AR13 CAN,RUS 1992-95,6AR14 CAN 1994,1AR15 GER,FR,USA 1990-93,7AR16 GER,NOR,SP,POR 1991-4,16AR18 NORDIC 1991-95,5AR20 CAN,RUS 1991-94,2
AR19 CAN,GER,RUS 1993-95,3AR21 USA 1991-93,2AR22 CAN 1991-93,2AR23 USA 1996,1AR24 USA 1996-97,2AR25 UK 1997,1
Southern OceanSR1 CL,SP,UK,USA 1992-7,10SR2 GER,SA 1989-93,3SR4 GER 1989-96,5
Pacific OceanPR1 JP,PRC 1990-94,4PR2 JP 1990-94,8PR3 JP,PRC 1990-95,10PR4 JP 1992,1PR5 CAN 1992-94,5PR6 CAN 1990-96,13
PR11 AA,NZ 1989-94,7PR12 AA 1983-92,5PR13 AA,NZ 1989-94,5PR14 CL 1991-95,6PR15 FR 1990-92,8PR16 USA 1990-95,16PR17 JP,PRC 1990-95,19PR18 JP,PRC 1991-96,18PR19 JP,PRC 1990-96,9PR20 ROC 1990-93,7PR21 PRC,ROC 1990-95,8PR22 PRC 1991,1PR23 JP,PRC 1991-95,5PR24 JP,PRC 1991-95,4PR27 JP 1991-94,6PR29 RUS 1992,1PR30 UK 1991-92,2PR31 AA 1991,1
WOCE Repeat Sections and Areas (Years, No. of Occupations) and Time Series Stations (Start Date)
Indian OceanIR1W GER,USA 1993-95,3IR2 AA 1994,1IR3 GER,USA 1995,3IR4 GER,AA,USA 1991-95,4IR6 AA,FR 1989-95,3ISS1 FR,SA,UK,USA 1991-95,9ISS2 GER,USA 1993-95,5ISS3 AA 1996,1
Time Series StationsARS1 USA 1954ARS2 CAN 1946ARS8 SP 1992PRS1 CAN 1959PRS2 USA 1988PRS3 USA 1993SRS1 FR 1991
80
60
40
20
0
20
40
60
80
60 20 0 20 60 100140 180 140100
AR15
ISS1
ISS2
AR8
AR11
AR13
AR10
AR12
AR14AR16
IR6
SR3
PR13S
PR11
PR15
PR4PR3
PR2
PRS2PRS3
PR16
PR14
PRS1
PR1
PR27
PR29
PR31
PR21PR22
PR20
PR18PR19
PR30SRS1
IR2
IR3
IR1
IR4
IR5
AR4a
AR4b
SR1
SR4
SR2
AR21
AR21
AR1 AR6
AR18AR7AR7
ARS2
ARS8
AR5AR22
AR20ARS1
PR6
PR5
PR17
PR23
PR24
PR13N
AR19
ISS3
Data available from DAC Data at DAC but not yet released Data still with PI
WOCE Data Guide 1997 page 5
High quality along-track bathymetry data from WOCEcruises are assembled at the National Geophysical DataCentre, an international facility for marine geological andgeophysical data management. Data are availableimmediately they are received by the DAC, and can beaccessed via the Internet or by CD-ROM.
Bathymetry
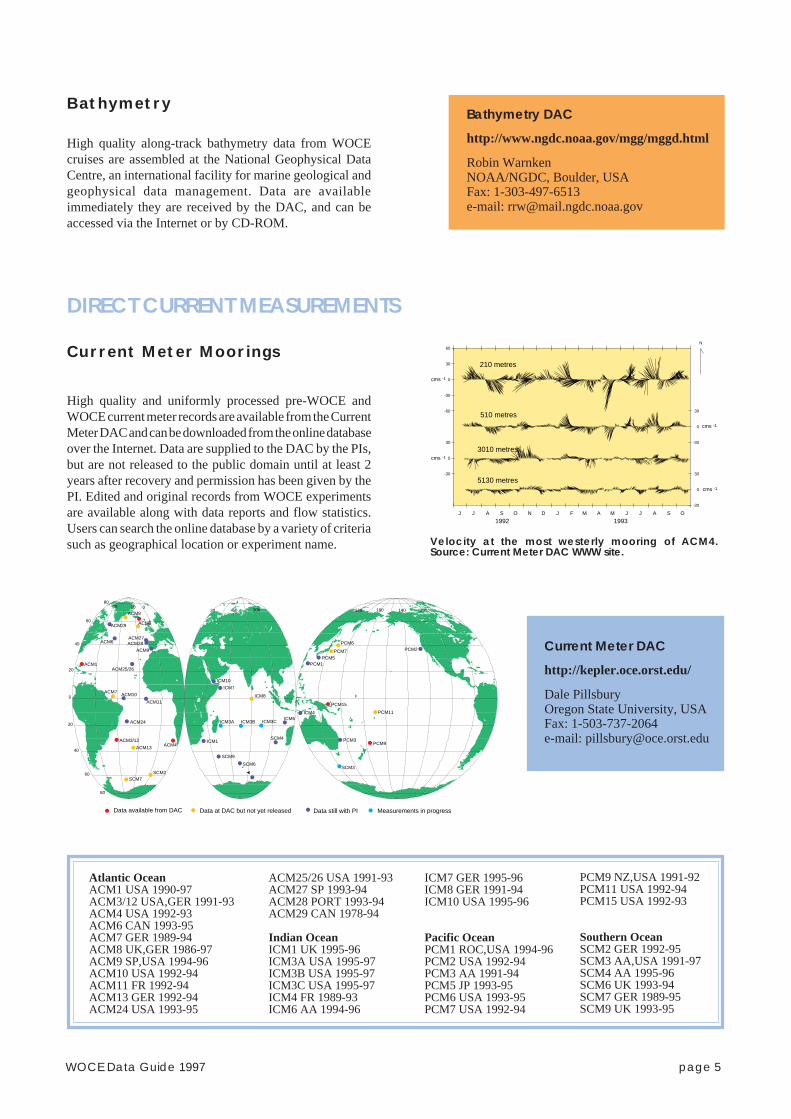
High quality and uniformly processed pre-WOCE andWOCE current meter records are available from the CurrentMeter DAC and can be downloaded from the online databaseover the Internet. Data are supplied to the DAC by the PIs,but are not released to the public domain until at least 2years after recovery and permission has been given by thePI. Edited and original records from WOCE experimentsare available along with data reports and flow statistics.Users can search the online database by a variety of criteriasuch as geographical location or experiment name.
DIRECT CURRENT MEASUREMENTS
Current Meter Moorings
Velocity at the most westerly mooring of ACM4.Source: Current Meter DAC WWW site.
Current Meter DAC
http://kepler.oce.orst.edu/
Dale PillsburyOregon State University, USAFax: 1-503-737-2064e-mail: [email protected]
J J A S O N D
1992J F M A M J J A S O
1993
-60
-30
0
30
60
cms -1
N
-30
0
30
-30
0
30
-30
0
30
210 metres
510 metres
3010 metres
5130 metres
cms -1
cms -1
cms -1
Bathymetry DAC
http://www.ngdc.noaa.gov/mgg/mggd.html
Robin WarnkenNOAA/NGDC, Boulder, USAFax: 1-303-497-6513e-mail: [email protected]
Atlantic OceanACM1 USA 1990-97ACM3/12 USA,GER 1991-93ACM4 USA 1992-93ACM6 CAN 1993-95ACM7 GER 1989-94ACM8 UK,GER 1986-97ACM9 SP,USA 1994-96ACM10 USA 1992-94ACM11 FR 1992-94ACM13 GER 1992-94ACM24 USA 1993-95
ACM25/26 USA 1991-93ACM27 SP 1993-94ACM28 PORT 1993-94ACM29 CAN 1978-94
Indian OceanICM1 UK 1995-96ICM3A USA 1995-97ICM3B USA 1995-97ICM3C USA 1995-97ICM4 FR 1989-93ICM6 AA 1994-96
ICM7 GER 1995-96ICM8 GER 1991-94ICM10 USA 1995-96
Pacific OceanPCM1 ROC,USA 1994-96PCM2 USA 1992-94PCM3 AA 1991-94PCM5 JP 1993-95PCM6 USA 1993-95PCM7 USA 1992-94
PCM9 NZ,USA 1991-92PCM11 USA 1992-94PCM15 USA 1992-93
Southern OceanSCM2 GER 1992-95SCM3 AA,USA 1991-97SCM4 AA 1995-96SCM6 UK 1993-94SCM7 GER 1989-95SCM9 UK 1993-95
80
60
40
20
0
20
40
60
80
60 20 020 60 100140 180 140100
ACM8
ACM1
ACM3/12
ACM13
ACM24
ACM11
ACM10
SCM2SCM7
ICM8
ICM3B ICM3CICM3AICM6
ICM1SCM4
SCM9
SCM6
PCM5PCM7
PCM6
PCM1
PCM15
PCM11
PCM3PCM9
PCM2
SCM3
ICM7
ICM4
ACM7
ICM10
ACM9
ACM25/26
ACM27ACM28
ACM4
ACM29
ACM6
Data available from DAC Data at DAC but not yet released Data still with PI Measurements in progress
ACM8

page 6 WOCE Data Guide 1997
A variety of acoustically- or satellite-tracked, neutrally buoyant subsurfacefloats have been released duringWOCE. The Subsurface Float DACis assembling these (and historicaldata) to form a consolidated floatdata set for incorporation into oceanmodels and climatologies. Datareceived by the DAC are checked,archived and made available (with PIpermission) through the DAC Web site.More data are available by direct contactand joint investigations with the PIs.
ALACE (AutonomousLagrangian CirculationExplorer) float tracks at1000 m in the SouthAtlantic from 1990 to 1996.Source: Float DAC WWWsite (R. Davis, SIO).
Release locations of WOCE subsurface floats
Subsurface Floats
Drifting buoys provide surface velocitymeasurements for validation of modelsand ground truth sea surface tem-perature data to initialize the oceancomponent of climate predictionmodels. Some buoys also measureatmospheric pressure. The DrifterDAC assembles and provides uniformquality data from WOCE drifting buoysand WOCE quality buoys released underother programmes. Data files andproducts such as track plots, mean velocityand temperature fields are available within amonth of collection (no proprietary period). Release locations of WOCE-quality surface drifting buoys (since 1990).
30
40
50
60°S
80°W 60 40 20 0 20 40°E
80
60
40
20
0
20
40
60
80
60 20 0 20 60 100140 180 140100
Surface Drifting Buoys
Subsurface Float DAC
http://wfdac.whoi.edu/
Philip L. RichardsonWoods Hole OceanographicInstitution, USAFax: 1-508-457-2181e-mail: [email protected]
Atlantic OceanNorth (15-60°N)CAN 1994,1996 14FR 1992-93,1996-98 133GER 1991-94,1996-97 83UK 1996 7USA 1989-97 521PORT 1997-98 24Tropical (15°N-15°S)FR 1994,1997 44
GER 1994 16USA 1989-94,1997-98 277South (45-15°S)FR 1994,1997 55GER 1992,1994,1997 131USA 1992-97 150
Pacific OceanNorth (20-55°N)CAN 1996 2
Subsurface Float Deployments (Years, No. of Floats)
JP 1989-95 36USA 1991-93 89South (45°S-20°N)GER 1996-98 19USA 1991-96 240
Indian OceanUSA 1995 136
Southern OceanUSA 1990-96 136
80
60
40
20
0
20
40
60
80
60 20 0 20 60 100140 180 140100

WOCE Data Guide 1997 page 7
Pacific annual mean 15 m velocity estimates (1991 to August 1996). Generatedfrom publicly available data.
Shipboard acoustic Doppler currentprofilers (ADCPs) when used inconjunction with reliable heading andnavigation data can determine absolutecurrents in the upper ocean. ManyWOCE hydrography cruises includethe collection and processing ofunderway ADCP data, and the DACassembles, reviews, documents,archives and distributes these data. TheDAC is a joint effort between the JapanOceanographic Data Centre (JODC) andUniversity of Hawaii (UH). Data areavailable in two forms, the densely sampledset or an ASCII standard subset. The mapshows the location of WOCE data currently held by theDAC; many other data sets still reside with the PIs and willeventually be submitted. For information of these other
ADCP Co-DAC
http://www.soest.hawaii.edu/caldwell/index.html
Patrick CaldwellUniversity of Hawaii, USAFax: 1-808-956-2352e-mail: [email protected]
ADCP DAC
http://www.jodc.jhd.go.jp/inf/data/current/shipboard-adcp.html
Shohei WakamatsuJapan Oceanographic Data CentreFax: 81-3-3545-2885e-mail: [email protected]
Acoustic Doppler Current Profilers
datasets, including the names and contact addresses of thePIs, see the DIU inventory at:http://www.cms.udel/woce/dacs/adcp_param.html
Atlantic OceanBRAZIL 1993-96 69FR 1992-96 52GER 1990-96 273ICE 1992-96 72NATO 1991-96 107NL 1990-95 31PORT 1993 30UK 1992,1994-95 8USA 1991-96 442
Indian OceanAA 1993-94 20
Drifting Buoy Deployments (Years, No. of Buoys)
FR 1995-96 16GER 1995 12INDIA 1993-96 70JP 1990-96 49USA 1995-96 196
Pacific OceanAA 1991-95 70CAN 1990-96 136FR 1990-95 100JP 1990-96 168KOREA 1991-96 39ROC,USA 1991-96 207
USA 1990-96 1353RUS,USA 1991-94 70NZ 1993-95 21
Southern OceanARG 1994-95 8AA 1991-96 33FR 1995 3GER 1991-92 40USA 1993-96 184SA 1994-96 64OTHERS 1996 56
100°E 140 180 140 100 60°W
50°S
30
10
10
30
10
30
50°N
10.0 cms-1
80
60
40
20
0
20
40
60
80
60 20 0 20 60 100140 180 140100
P15
A11
P2
P4
P19P17P16
P14
P17
P31
P18
Data available from DAC
P10
Surface Drifter DAC
Scientific Quality Control and Products
http://www.aoml.noaa.gov/phod/dac/dac.html
Mark SwensonNOAA/AOML, USAFax:1-305-361-4582e-mail: [email protected]
Surface Drifter DAC
Distribution and Archival
http://www.meds.dfo.ca/Meds/e_inv.html
André BolducMEDS, CanadaFax:1-613-990-5510e-mail: [email protected]
page 8 WOCE Data Guide 1997
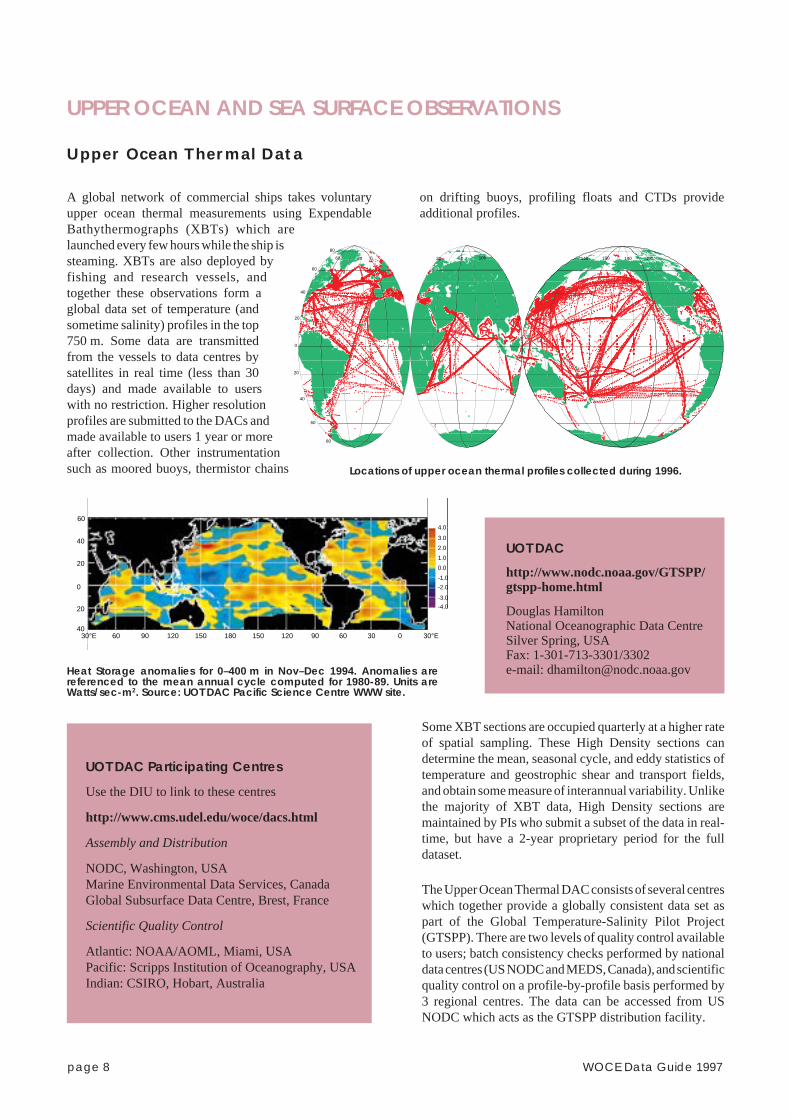
A global network of commercial ships takes voluntaryupper ocean thermal measurements using ExpendableBathythermographs (XBTs) which arelaunched every few hours while the ship issteaming. XBTs are also deployed byfishing and research vessels, andtogether these observations form aglobal data set of temperature (andsometime salinity) profiles in the top750 m. Some data are transmittedfrom the vessels to data centres bysatellites in real time (less than 30days) and made available to userswith no restriction. Higher resolutionprofiles are submitted to the DACs andmade available to users 1 year or moreafter collection. Other instrumentationsuch as moored buoys, thermistor chains
UPPER OCEAN AND SEA SURFACE OBSERVATIONS
Upper Ocean Thermal Data
UOT DAC Participating Centres
Use the DIU to link to these centres
http://www.cms.udel.edu/woce/dacs.html
Assembly and Distribution
NODC, Washington, USAMarine Environmental Data Services, CanadaGlobal Subsurface Data Centre, Brest, France
Scientific Quality Control
Atlantic: NOAA/AOML, Miami, USAPacific: Scripps Institution of Oceanography, USAIndian: CSIRO, Hobart, Australia
Some XBT sections are occupied quarterly at a higher rateof spatial sampling. These High Density sections candetermine the mean, seasonal cycle, and eddy statistics oftemperature and geostrophic shear and transport fields,and obtain some measure of interannual variability. Unlikethe majority of XBT data, High Density sections aremaintained by PIs who submit a subset of the data in real-time, but have a 2-year proprietary period for the fulldataset.
The Upper Ocean Thermal DAC consists of several centreswhich together provide a globally consistent data set aspart of the Global Temperature-Salinity Pilot Project(GTSPP). There are two levels of quality control availableto users; batch consistency checks performed by nationaldata centres (US NODC and MEDS, Canada), and scientificquality control on a profile-by-profile basis performed by3 regional centres. The data can be accessed from USNODC which acts as the GTSPP distribution facility.
Locations of upper ocean thermal profiles collected during 1996.
60
40
20
0
20
4030°E 60 90 120 150 180 150 120 90 60 30 0 30°E
4.0
3.0
2.0
1.0
0.0
-1.0
-2.0
-3.0
-4.0
80
60
40
20
0
20
40
60
80
60 20 0 20 60 100140 180 140100
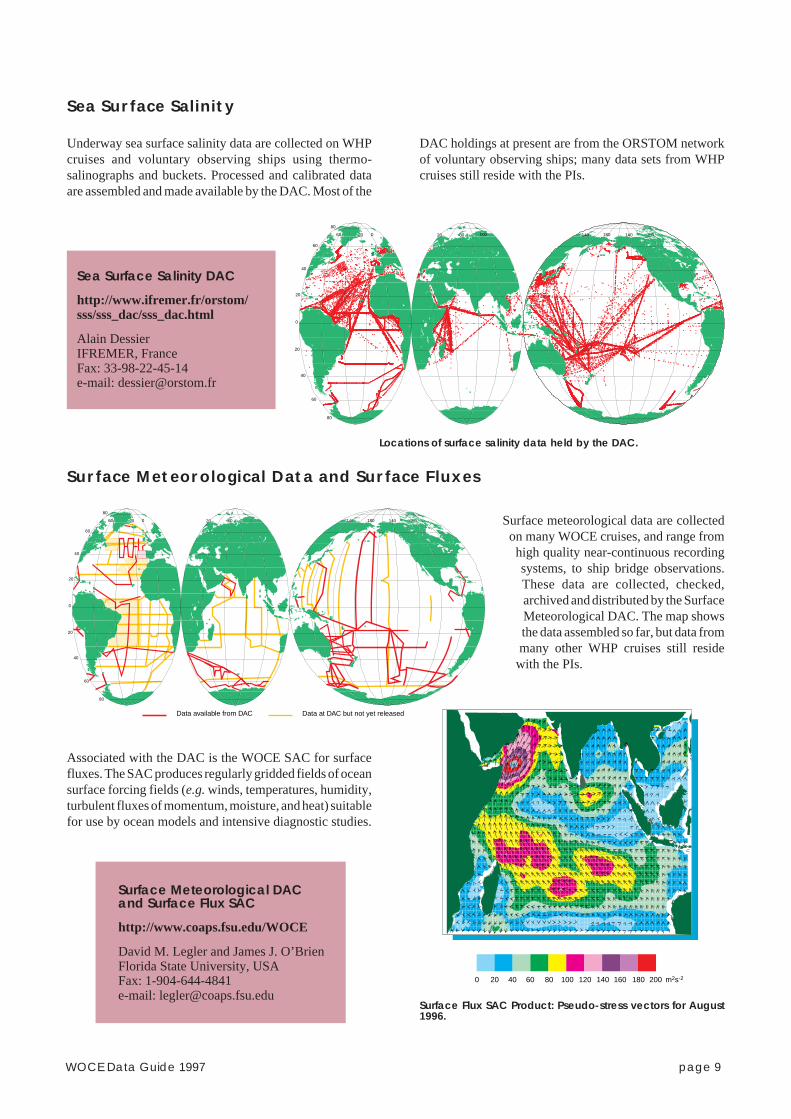
Heat Storage anomalies for 0–400 m in Nov–Dec 1994. Anomalies arereferenced to the mean annual cycle computed for 1980-89. Units areWatts/sec-m2. Source: UOT DAC Pacific Science Centre WWW site.
on drifting buoys, profiling floats and CTDs provideadditional profiles.
UOT DAC
http://www.nodc.noaa.gov/GTSPP/gtspp-home.html
Douglas HamiltonNational Oceanographic Data CentreSilver Spring, USAFax: 1-301-713-3301/3302e-mail: [email protected]
WOCE Data Guide 1997 page 9
Sea Surface Salinity
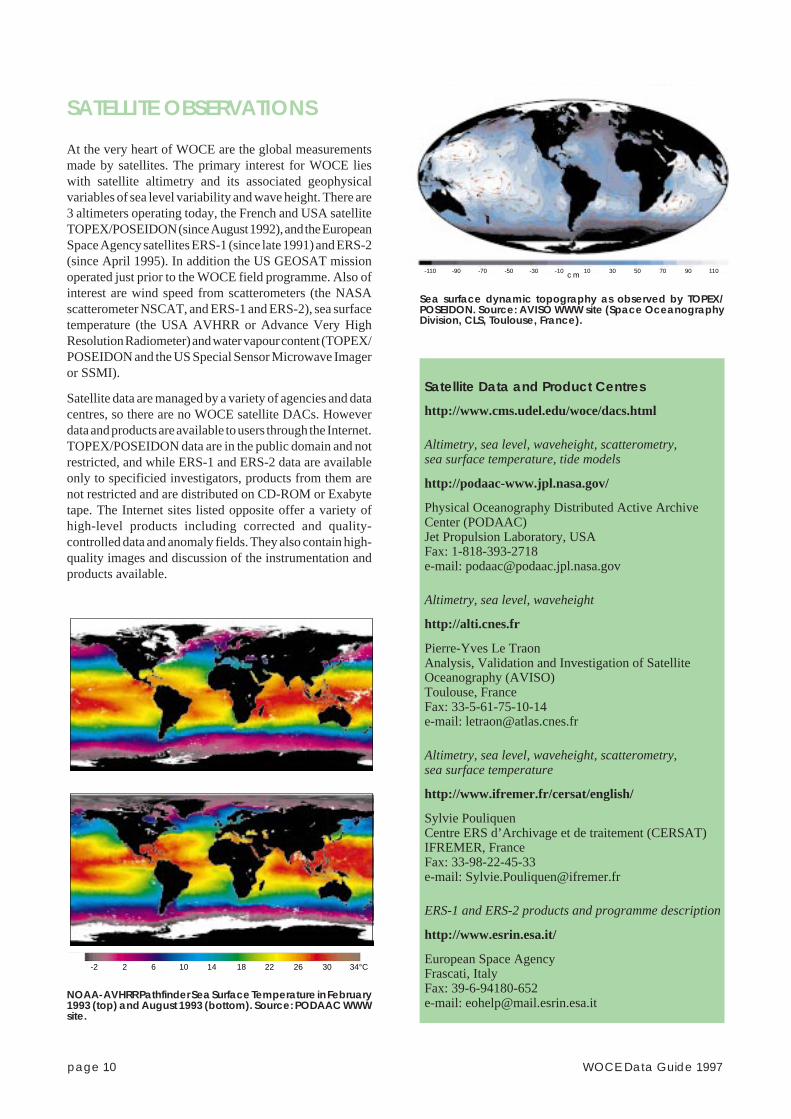
Locations of surface salinity data held by the DAC.
Underway sea surface salinity data are collected on WHPcruises and voluntary observing ships using thermo-salinographs and buckets. Processed and calibrated dataare assembled and made available by the DAC. Most of the
Surface Meteorological Data and Surface Fluxes
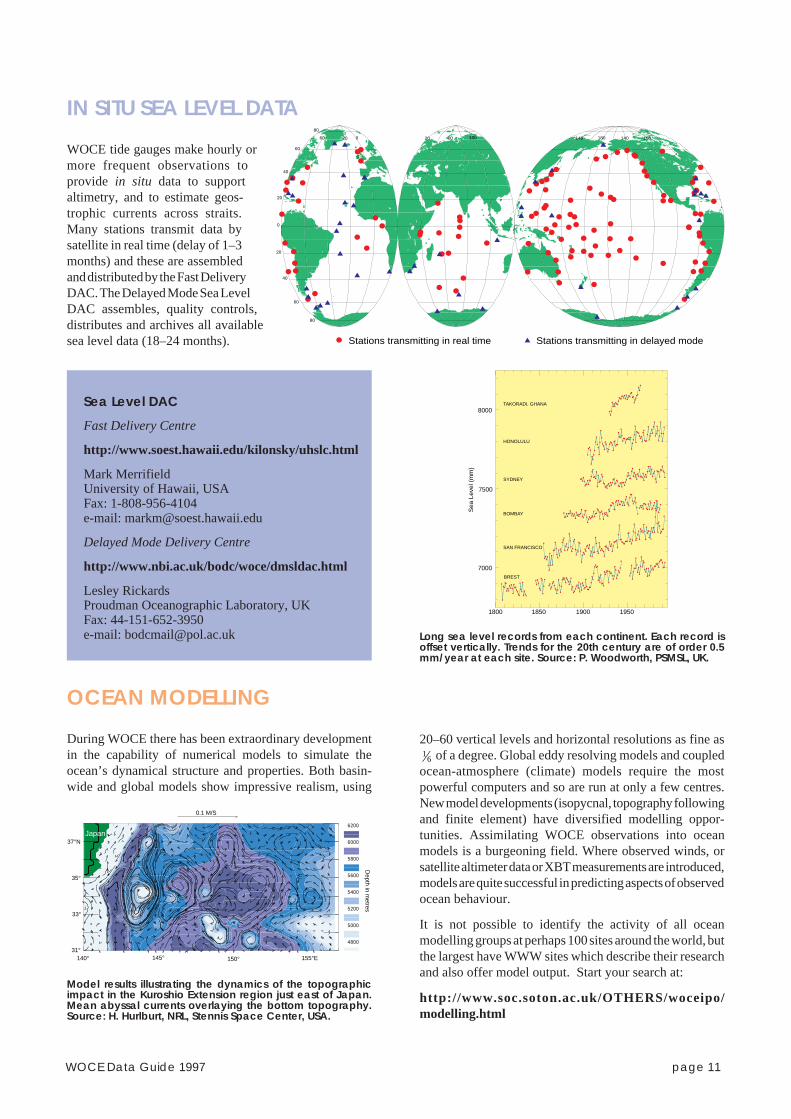
Surface meteorological data are collectedon many WOCE cruises, and range fromhigh quality near-continuous recordingsystems, to ship bridge observations.These data are collected, checked,archived and distributed by the SurfaceMeteorological DAC. The map showsthe data assembled so far, but data frommany other WHP cruises still residewith the PIs.
80
60
40
20
0
20
40
60
80
60 20 0 20 60 100140 180 140100
Data available from DAC Data at DAC but not yet released
Associated with the DAC is the WOCE SAC for surfacefluxes. The SAC produces regularly gridded fields of oceansurface forcing fields (e.g. winds, temperatures, humidity,turbulent fluxes of momentum, moisture, and heat) suitablefor use by ocean models and intensive diagnostic studies.
Surface Flux SAC Product: Pseudo-stress vectors for August1996.
0 20 40 60 80 100 120 140 160 180 200 m2s-2
Surface Meteorological DACand Surface Flux SAC
http://www.coaps.fsu.edu/WOCE
David M. Legler and James J. O’BrienFlorida State University, USAFax: 1-904-644-4841e-mail: [email protected]
80
60
40
20
0
20
40
60
80
60 20 0 20 60 100140 180 140100
DAC holdings at present are from the ORSTOM networkof voluntary observing ships; many data sets from WHPcruises still reside with the PIs.
Sea Surface Salinity DAC
http://www.ifremer.fr/orstom/sss/sss_dac/sss_dac.html
Alain DessierIFREMER, FranceFax: 33-98-22-45-14e-mail: [email protected]
page 10 WOCE Data Guide 1997
At the very heart of WOCE are the global measurementsmade by satellites. The primary interest for WOCE lieswith satellite altimetry and its associated geophysicalvariables of sea level variability and wave height. There are3 altimeters operating today, the French and USA satelliteTOPEX/POSEIDON (since August 1992), and the EuropeanSpace Agency satellites ERS-1 (since late 1991) and ERS-2(since April 1995). In addition the US GEOSAT missionoperated just prior to the WOCE field programme. Also ofinterest are wind speed from scatterometers (the NASAscatterometer NSCAT, and ERS-1 and ERS-2), sea surfacetemperature (the USA AVHRR or Advance Very HighResolution Radiometer) and water vapour content (TOPEX/POSEIDON and the US Special Sensor Microwave Imageror SSMI).
Satellite data are managed by a variety of agencies and datacentres, so there are no WOCE satellite DACs. Howeverdata and products are available to users through the Internet.TOPEX/POSEIDON data are in the public domain and notrestricted, and while ERS-1 and ERS-2 data are availableonly to specificied investigators, products from them arenot restricted and are distributed on CD-ROM or Exabytetape. The Internet sites listed opposite offer a variety ofhigh-level products including corrected and quality-controlled data and anomaly fields. They also contain high-quality images and discussion of the instrumentation andproducts available.
Sea surface dynamic topography as observed by TOPEX/POSEIDON. Source: AVISO WWW site (Space OceanographyDivision, CLS, Toulouse, France).
Satellite Data and Product Centres
http://www.cms.udel.edu/woce/dacs.html
Altimetry, sea level, waveheight, scatterometry,sea surface temperature, tide models
http://podaac-www.jpl.nasa.gov/
Physical Oceanography Distributed Active ArchiveCenter (PODAAC)Jet Propulsion Laboratory, USAFax: 1-818-393-2718e-mail: [email protected]
Altimetry, sea level, waveheight
http://alti.cnes.fr
Pierre-Yves Le TraonAnalysis, Validation and Investigation of SatelliteOceanography (AVISO)Toulouse, FranceFax: 33-5-61-75-10-14e-mail: [email protected]
Altimetry, sea level, waveheight, scatterometry,sea surface temperature
http://www.ifremer.fr/cersat/english/
Sylvie PouliquenCentre ERS d’Archivage et de traitement (CERSAT)IFREMER, FranceFax: 33-98-22-45-33e-mail: [email protected]
ERS-1 and ERS-2 products and programme description
http://www.esrin.esa.it/
European Space AgencyFrascati, ItalyFax: 39-6-94180-652e-mail: [email protected]
SATELLITE OBSERVATIONS
NOAA-AVHRR Pathfinder Sea Surface Temperature in February1993 (top) and August 1993 (bottom). Source: PODAAC WWWsite.
-2 2 6 10 14 18 22 26 30 34°C
-110 -90 -70 -50 -30 -10 10 30 50 70 90 110cm
WOCE Data Guide 1997 page 11
IN SITU SEA LEVEL DATA
WOCE tide gauges make hourly ormore frequent observations toprovide in situ data to supportaltimetry, and to estimate geos-trophic currents across straits.Many stations transmit data bysatellite in real time (delay of 1–3months) and these are assembledand distributed by the Fast DeliveryDAC. The Delayed Mode Sea LevelDAC assembles, quality controls,distributes and archives all availablesea level data (18–24 months).
OCEAN MODELLING
Long sea level records from each continent. Each record isoffset vertically. Trends for the 20th century are of order 0.5mm/year at each site. Source: P. Woodworth, PSMSL, UK.
During WOCE there has been extraordinary developmentin the capability of numerical models to simulate theocean’s dynamical structure and properties. Both basin-wide and global models show impressive realism, using
8000
7500
7000
Sea
Lev
el (
mm
)
1800 1850 1900 1950
TAKORADI, GHANA
HONOLULU
SYDNEY
BOMBAY
SAN FRANCISCO
BREST
80
60
40
20
0
20
40
60
80
60 20 0 20 60 100140 180 140100
Stations transmitting in real time Stations transmitting in delayed mode
Sea Level DAC
Fast Delivery Centre
http://www.soest.hawaii.edu/kilonsky/uhslc.html
Mark MerrifieldUniversity of Hawaii, USAFax: 1-808-956-4104e-mail: [email protected]
Delayed Mode Delivery Centre
http://www.nbi.ac.uk/bodc/woce/dmsldac.html
Lesley RickardsProudman Oceanographic Laboratory, UKFax: 44-151-652-3950e-mail: [email protected]
4800
5000
5200
5400
5600
5800
6000
6200
0.1 M/S
31°
33°
35°
37°N
140° 145° 150° 155°E
Depth in m
etres
Japan
Model results illustrating the dynamics of the topographicimpact in the Kuroshio Extension region just east of Japan.Mean abyssal currents overlaying the bottom topography.Source: H. Hurlburt, NRL, Stennis Space Center, USA.
20–60 vertical levels and horizontal resolutions as fine as1
6 of a degree. Global eddy resolving models and coupledocean-atmosphere (climate) models require the mostpowerful computers and so are run at only a few centres.New model developments (isopycnal, topography followingand finite element) have diversified modelling oppor-tunities. Assimilating WOCE observations into oceanmodels is a burgeoning field. Where observed winds, orsatellite altimeter data or XBT measurements are introduced,models are quite successful in predicting aspects of observedocean behaviour.
It is not possible to identify the activity of all oceanmodelling groups at perhaps 100 sites around the world, butthe largest have WWW sites which describe their researchand also offer model output. Start your search at:
http://www.soc.soton.ac.uk/OTHERS/woceipo/modelling.html

14000
12000
10000
8000
6000
2000
0
4000
IGYStations1957-58
GEOSECSStations1972-76
WHPOne Time
SurveyStations
WHPRepeat
HydrographyStations
WOCECurrentMeterYears
WOCESubsurface
FloatYears
WOCESurfaceDrifterYears
The various components of WOCE combine to form thebiggest and most comprehensive oceanographic experimentundertaken to date. Satellite measurements, in situobservations and the development of models are all con-tributing to this first truly global ocean experiment. Thechart shows how the number of WOCE oceanographicstations far exceeds previous experiments, and illustratesthe high number of “data years” of direct current measure-ments being accumulated. In addition there are some 60,000XBT profiles collected per year, and extensive sets ofADCP and surface salinity data. The global satellite datasets provide a level of coverage previously unobtainable.The accurate and quasisynoptic WOCE data set will be thedefinitive baseline of the “state of the ocean” against whichfuture changes will be measured. The success of WOCEhas relied on a new level of international co-operationwhich is set to continue in future climate-related projectsand global ocean observational programmes.
The secure final archive of the WOCE data set is to becarried out by the World Data Centre, specifically WDC-A(Oceanography) at the National Oceanographic Data Centerin the USA. WDC-A is committed to archiving andpreserving the (non-satellite) WOCE data set in its entirety.In addition, all DACs and SACs are committed to producingCD-ROMs of their complete holdings to be distributed inassociation with WDC-A. A searchable data retrieval systemwill be developed at WDC-A for the WOCE data set. TheArchive will provide continuity into the future when theWOCE DACs and SACs are no longer active.
WOCE: THE LARGEST GLOBAL OCEAN EXPERIMENT SO FAR
THE WOCE DATA ARCHIVE
Number of hydrographic stations and data-years ofmeasurements taken by WOCE, and previous oceanographicexpeditions.
WOCE International Project Office
http://www.soc.soton.ac.uk/OTHERS/woceipo/ipo.html
W. John GouldSouthampton Oceanography CentreEmpress DockSouthampton SO14 3ZH, UKTel: 44-1703-596789Fax: 44-1703-596204e-mail: [email protected]
WOCE Data Information Unit
http://diu.cms.udel.edu/woce/
Ferris WebsterUniversity of DelawareCollege of Marine StudiesLewes, DE 19958, USATel: 1-302-645-4278Fax: 1-302-645-4007e-mail: [email protected]
WOCE Report No. 150/97, March 1997WOCE International Project Office, Southampton
WOCE Archive
http://www.nodc.noaa.gov/
Douglas HamiltonNational Oceanographic Data CenterSilver Spring, USAFax: 1-301-713-3301email: [email protected]