world energy resources coal | 2016 · pdf filecanada’s government tells provinces to...
TRANSCRIPT

1
World Energy Resources Coal | 2016
CO2-Emission

WORLD ENERGY COUNCIL | WORLD ENERGY RESOURCES 2016
1
TABLE OF CONTENTS
KEY FINDINGS 3
INTRODUCTION 5
1. TECHNOLOGIES 8 Extraction types and mining techniques 8
Beneficiation, transporting and handling 10
Generation Technology 11
Subcritical boiler technology 11
Supercritical 11
Ultra-supercritical (USC) & advanced ultra-supercritical (AUSC) 11
Integrated Gasification Combined Cycle (IGCC) 11
Coal to liquid (CTL) 14
Technology Outlook 14
2. ECONOMICS AND MARKETS 15 Coal production in 2014 – first decline in decades 15
Coal consumption 16
Energy Security 16
China 17
India 18
Australia 22
Southeast Asia 23
Indonesia 23
Vietnam 24
Thailand 25
South Africa 25
Germany 26
Poland 27
United States 32
Future outlook 32
3. SOCIO-ECONOMICS 35 Community impacts from taxes 36
Public health and environmental improvement 36
Lower electricity prices 36
Case studies 37

WORLD ENERGY COUNCIL | COAL
2
4. ENVIRONMENTAL IMPACTS 43 Coal mining & the environment 43
Coal use & the environment 45
Reducing carbon dioxide emissions 47
Water usage 48
Waste generation 49
5. OUTLOOK 51 China 51
India 53
Southeast Asia 55
South Africa 57
Europe 59
United States 60
6. GLOBAL TABLE 62 Coal Reserves 2014/2015 62
Coal Production 2014/2015 65
List of Tables and Figures 58
References 70
Acknowledgements 74
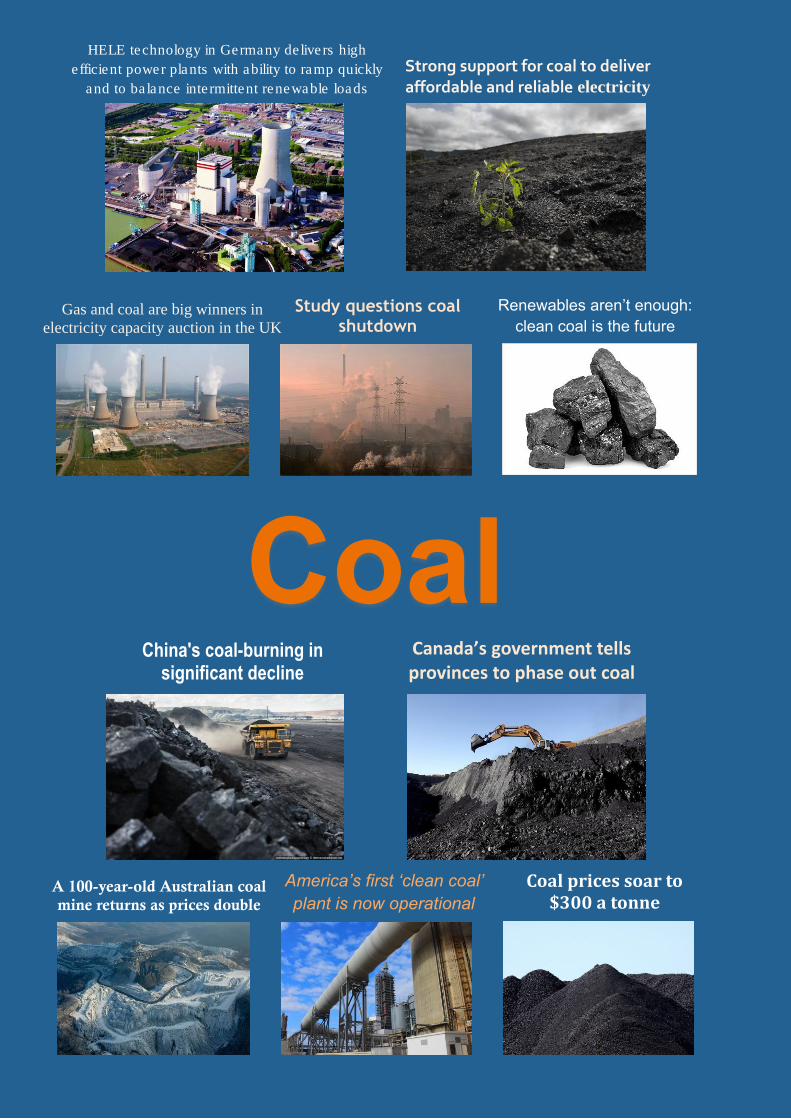
Canada’s government tells provinces to phase out coal
A 100-year-old Australian coal
mine returns as prices double
Coal prices soar to $300 a tonne
China's coal-burning in significant decline
Coal
America’s first ‘clean coal’
plant is now operational
Renewables aren’t enough:
clean coal is the future
Study questions coal shutdown
HELE technology in Germany delivers high
efficient power plants with ability to ramp quickly
and to balance intermittent renewable loads
Strong support for coal to deliver affordable and reliable electricity
Gas and coal are big winners in
electricity capacity auction in the UK

WORLD ENERGY COUNCIL | WORLD ENERGY RESOURCES 2016
3
KEY FINDINGS
1. Coal is the second most important energy source, covering 30% of global primary
energy consumption.
2. Coal – hard coal and lignite (brown coal) is the leading energy source in power
generation with 40% of globally generated power relying on this fuel.
3. Coal is predominantly an indigenous fuel, mined and used in the same country,
allowing for security of supply where this is the case.
4. Technology that reduces the emissions from coal-fired power stations is essential to
utilizing the abundant coal reserves in an increasingly carbon-constrained environment.
5. 75% of the global coal plants utilise subcritical technology. An increase in the efficiency
of coal-fired power plants throughout the world from today’s average of 33% to 40%
could cut global carbon dioxide emissions by 1.7 billion tonnes each year.
6. Apart from the continued increase in the efficiency of power plants, the implementation
of carbon capture utilisation and storage (CCUS) is one of the elementary strategies for
climate protection.
7. Carbon Capture and Storage (CCS) is a critical component in a portfolio of low-carbon
energy technologies. The quantities of CO2 to be captured and stored represent tens of
giga tonness, the coming years are critical for demonstrators at industrial scale, aiming
at deployment in OECD and non-OECD countries.
8. Global coal consumption increased by 64% from 2000 to 2014. That classified coal as
the fastest growing fuel in absolute numbers within the indicated period.
9. 2014 witnessed the first annual decrease in global thermal coal production since 1999.
10. Oversupply & price of natural gas has negatively impacted the coal industry.
11. China contributes 50% to global coal demand. 2014 was the first year within the past
decades, in which there was no further increase in the coal demand in China
12. China is shifting to clean coal technologies.
13. India’s coal consumption is set to increase.
14. The US is closing or replacing coal with gas in power plants.
15. In Western Europe coal faces much opposition as mitigation of climate change is
targeted.

WORLD ENERGY COUNCIL | COAL
4
16. Some nations (China, India, Australia, Indonesia, South Africa and Poland) rely heavily
on coal to supply base load electricity.

WORLD ENERGY COUNCIL | WORLD ENERGY RESOURCES 2016
5
INTRODUCTION
Coal plays an important role in the security of supply in developed countries, and is a key
enabler for economic growth and development in developing countries. Coal resource
exists in developing countries (including those with significant energy challenges).
Therefore, coal has a key role to play in assisting the development of baseload electricity
where it is most needed.
Developing countries are increasingly satisfying their growing energy demands with cheap
coal in order to sustain economic growth to reduce energy poverty and to achieve the
United Nations (U.N.) development goals. Many countries in Asia and Africa are currently
making major investments in new coal infrastructures albeit with clean coal technologies1.
The incremental demand for coal is visible because some regions, notably non-OECD Asia,
are focused on maintaining the potential for continued economic growth, while
simultaneously protecting the environment from excessive accumulation of anthropogenic
greenhouse gas (GHG) emissions and other air pollutants (Figure 1).
Coal is known as the most carbon-intensive fossil fuel and the continuing use of coal in
global electrification could have implications for climate change mitigation strategies only if
low emissions and high efficiency technology will be utilised in high proportions. With
modern technological advancements, coal plants could have technologies that allow higher
efficiency and low carbon emissions in order to tackle climate change. A further step would
be the incorporation of CCUS.
1 Mercator Research Institute on Global Commons and Climate Change (2015): Renaissance of coal isn’t stopping at China

WORLD ENERGY COUNCIL | COAL
6
FIGURE 1: FORECAST OF INCREMENTAL GLOBAL COAL DEMAND 2014 -
2020 (MTCE)
Source: IEA (2015)
The step ahead is implementation of CCS. The individual component required technologies
are well known and partially mature; for example, transport of CO2 by pipelines and
storage. Addressing the quantities (the order of magnitude is ¾ to 1 MTon CO2 per TWh),
the main challenges is the integration into large-scale demonstration projects, supported by
governments if necessary, and accepted by the public and all stakeholders. Co-operation
should be encouraging to ensure that the projects cover all the situations in the power
industry and in others emitting industries as well. Sharing knowledge will be key for future
investments. Given the rapid growth in energy demand in non-OECD countries, OECD and
non-OECD countries must work together, and the multilateral institutions should establish
the required and relevant support mechanisms.
This chapter seeks to highlight how climate change actions and market dynamics has
impacted the coal industry. It discusses how the coal industry is advancing towards clean
technologies in order to tackle greenhouse gas emissions and maintaining a role in
securing energy supply. This chapter is organised into six sections:
1. Section 2 describes the current technologies available for coal mining, the mode of
transportation, coal-fired generation and the investment costs associated with clean
technologies.
2. Section 3 looks at different markets and their associated drivers influencing the
production and supply of coal.

WORLD ENERGY COUNCIL | WORLD ENERGY RESOURCES 2016
7
3. Section 4 focuses on case studies illustrating how the coal industry has impacted
communities.
4. Section 5 discusses the extent to which coal-fired electricity generation contributes to
water consumption, air and environmental pollution.
5. Section 6 offers the outlook for the coal industry.
6. Section 7 shows data associated with coal reserves and production.

WORLD ENERGY COUNCIL | COAL
8
1. TECHNOLOGIES
Comprehensive electrification is essential for sustainable economic development and coal-
fired power is seen as a key input to global electricity generation. This accounts for around
40% of total generation2. This section briefly explains extraction techniques, transportation
and handling, and plant technologies associated with coal-fired power generation.
EXTRACTION TYPES AND MINING TECHNIQUES Coal, a product of organic sedimentation, occurs in seam-shaped deposits and must be
extracted selectively from the surrounding strata. Flat deposits with no faults are of major
commercial importance, which account for 50% of the world’s deposits. These have few
seams that are often of an even thickness and a wide horizontal spread. Flat, hardly
disturbed deposits of little depth lend themselves to extraction in opencast operations.
These mainly concern lignites, but most hard coal deposits from the Gondwana period on
the Southern continents are also of this type.
Sloping to steeply inclined or fault-containing coal deposits have a large number of
irregularly shaped seams in layer sequences that are often thousands of metres thick. The
seams are encountered at varying depths, with the deposits frequently marked by
complicated faults and disturbed conditions, so that extraction is mostly in underground
operations. They are generally of high rank; high quality coking coal, non-bituminous coals
and anthracites can usually be found in this type of deposit.
Depending on seam depth and formation and on the overlying loose or solid rock, the coal
is extracted either in opencast or underground operations. In underground mining, access
is by shafts and/or drifts while, in surface operations, the layer above the coal is stripped to
permit extraction of the exposed coal. Depending on seam thickness, the composition of
the overlying strata and surface use (e.g. inter alia, density of settlement). Opencast mining
is an economic proposition down to depths of 500m.
Hard coal extracted in underground operations is mined either from the surface via drifts or
shafts, depending on the depth of the deposit. In drift mining, the deposit is developed
using slightly inclined drifts equipped with conveyor belts. By contrast, coal deposits at
greater depths require shafts, which are also used for proper extraction. The coal is mined
either in room-and-pillar or in long-walling operations, with the latter being predominant.
In room-and-pillar mining, continuous miners drive extraction roads into the coal to cross at
right angles. Pillars are left standing in-between to support the overlying strata. This method
is associated with high extraction losses, since a considerable quantity of coal remains
underground. Transportation to the conveyor belts is often by shuttle car. A variant of the 2 Office of Chief Economist (2015) Coal in India
WORLD ENERGY COUNCIL | WORLD ENERGY RESOURCES 2016
9
room-and-pillar method extraction is by conventional drilling and blasting, with the conveyor
belts being fed by wheel loader.
In long-walling, continuous miners are used to drive two parallel roads into the seam at
intervals of 200 to 400 m; the roads are then connected at right angles using long-wall
equipment. Actual extracted coal falls automatically onto a chain conveyor and is
transported further. The long-wall is protected against falling rock by hydraulic shield and
frame supports, although the latter are losing importance.
In underground mining, methane gas is released in the long-wall roads; thanks to suitable
mine ventilation this gas is so diluted that no firedamp explosions occur. Where the coal is
under high pressure from methane gas, gas relaxations are produced by horizontal drilling.
The mining technique used in the extraction of hard coal in open cast operations depends
on the number and thickness of the seams and their inclination. In this respect, minimum
thicknesses of 0.5 to 1m are considered workable; otherwise, the seams are crushed or
loosened by drilling and blasting and removed by dragline/shovel and truck. The seam
exposed in dragline operation is likewise drilled and blasted and then loaded by shovel or
wheel loader onto heavy trucks for transportation. In this work, small draglines and, to a
growing extent, hydraulic excavators are also used. By contrast, the extraction of several
inclined seams is by truck and shovel, with the entire group of seams and inter-burden
layers being worked in horizontal slices (benches).
The extraction of lignite worldwide is mainly by continuous opencast operation, i.e. bucket
wheel excavator (BWE), conveyor belt and spreader. This is also true of the Rhenish lignite
mining area to the west of Cologne. The large scale equipment deployed in this German
mining area since the end of the 1970s yields a daily output of 240,000 m3 (12,500 m3/h). In
the Lusatian mining area near Dresden, the equipment of choice for the removal of over-
burden owing to the even formation of the lignite seams is the conveyor bridge. The coal is
extracted by bucket wheel excavator and bucket chain dredger. The capacity of the
conveyor bridges assuming three upstream bucket chain dredgers is up to 450,000 m3 per
day. In the Central German mining area near Leipzig, the same extraction technique has
made headway like in the Rhenish area, although with limited use of mobile conveyor
methods.
Most other European and non-European large-scale opencast mines also prefer continuous
opencast techniques. In Victoria (Australia), for example, the opencast lignite mines employ
BWEs, and the Mae Moh (Thailand) mine has been using BWEs for a number of years in
the removal of over-burden. By contrast, the opencast lignite mines in Texas (USA) mostly
use draglines, shovel and truck combinations. However, some companies have been
deploying BWE systems with conveyor belts or cross mine dumpers for years now.
The general trend in extraction technology involves further development of the continuous
mining technique that originated in lignite mining for use in harder materials like phosphate
or hard coal, including the associated over-burden removal resulting in the non-blasting
technique involved with direct extraction and selective mining.

WORLD ENERGY COUNCIL | COAL
10
BENEFICIATION, TRANSPORTING AND HANDLING Owing to relatively high water content (40 to 60%) and a corresponding lower calorific value
compared to hard coal, lignite is mostly utilised close to the mines. The focus of lignite use,
accounting for nearly 90% worldwide, is on power generation. In Germany, lignite is
transported by conveyor belts or train to power plants located near the deposits.
The hard coal quantities mined, a worldwide average of 83% is used in the country of origin
itself. Unlike lignite, a functioning international trade exists in hard coal. Since hard coal is
seriously contaminated owing to the high degree of mechanisation in mining operation, in
that, in raw state its quality often fails to meet customer’s requirements, hence it must be
subject to a cleaning process. In beneficiation, the raw coal is first crushed and then
classified by grain size, i.e. as coarse, fine and ultrafine. In the subsequent sorting of coal
and rock particles, the crucial features are specific weight in the case of coarse and fine
grain, and surface properties in the case of ultrafine grain. The separating medium in the
former case is either water or a heavy liquid (sink/float process), with the separation being
in sink/float drum (coarse grain) or washers (jigs), or in water cyclones or in heavy media
cyclones (medium grain). The ultrafine grain, by contrast, is cleaned by flotation. The
crucial economic factor in beneficiation is product output, i.e. the share of washed coal to
raw coal. This is around 80% for steam coal and 65 to 70% for coking coal.
The world trade in hard coal is based not only on an efficient mining industry, but also on
capable infrastructure. Its interlocking phases, all the way from mining to consumer use
extend via:
port handling
marine transportation
discharge at the port of destination
inland transportation (road or rail)
and these are referred to as the coal chain.
Transportation of hard coal to the port of shipment is generally by rail or by truck. The
feasible distances for economic transportation are limited by cost consideration, i.e. the
export mines are located relatively near the coast. Rail transport is by complete trainloads
with trains up to 1.5 km in length and a capacity of over 10,000 tonnes. Where rail links to
the coast are non-existent, the coal can also be taken to the port by truck. Another option is
shipping by inland waterway, e.g. to the US Gulf ports or, in Indonesia, to the deep-water
ports/loading points.
In the port of shipment, the coal is discharged by wagon tippler and moved by belt conveyor
to intermediate stockpiles. Recovery is by bucket wheel reclaimer or subsurface extractor
onto conveyor belts, which take the coal available with loading capacities of up to 6000 t/h.
WORLD ENERGY COUNCIL | WORLD ENERGY RESOURCES 2016
11
The marine transportation of coal is by bulk freighter. Depending on cargo size, distance to
the port of discharge and permissible draught in the ports, and three ship sizes are
deployed:
10,000 to 50,000 dwt (dead weight tonnage) = Handysize
50,000 to 80,000 dwt = Panama
80,000 to 150,000 dwt = Capesize
Handysize ships are mainly used for small quantities, short distances, coastal shipping and
ports of shipment/destination with only little draught. However, most coal transportation is
ocean-wide or between oceans, using panama and capesize freighters. The first can pass
through the Panama Canal, while the second have to round Cape Horn or the Cape of
Good Hope.
In the receiving countries, there are some 200 ports of discharge available, although this
does have to be shared with other bulk dry goods. Some of these have dedicated coal
terminals e.g. in the ARA ports (Amsterdam/Rotterdam/Antwerp). Coal discharge is usually
by grab crane onto belt conveyors, which take the coal to intermediate stockpiles where
coal can be collected for inland transportation.
GENERATION TECHNOLOGY
Subcritical boiler technology These have efficiencies of about 30% and are the most common type of plant globally
because they are faster and less costly to build when compared to other technologies. With
CO2 mitigation on a global agenda, the International Energy Agency (IEA) and other
international bodies propagate that global deployment and utilisation of subcritical
technologies. In addition, the World Bank has made a decision to cease funding for coal
fired projects with lower efficiencies in developing countries, unless there is no other viable
option3. This may likely increase the rise in utilising more efficient technologies.
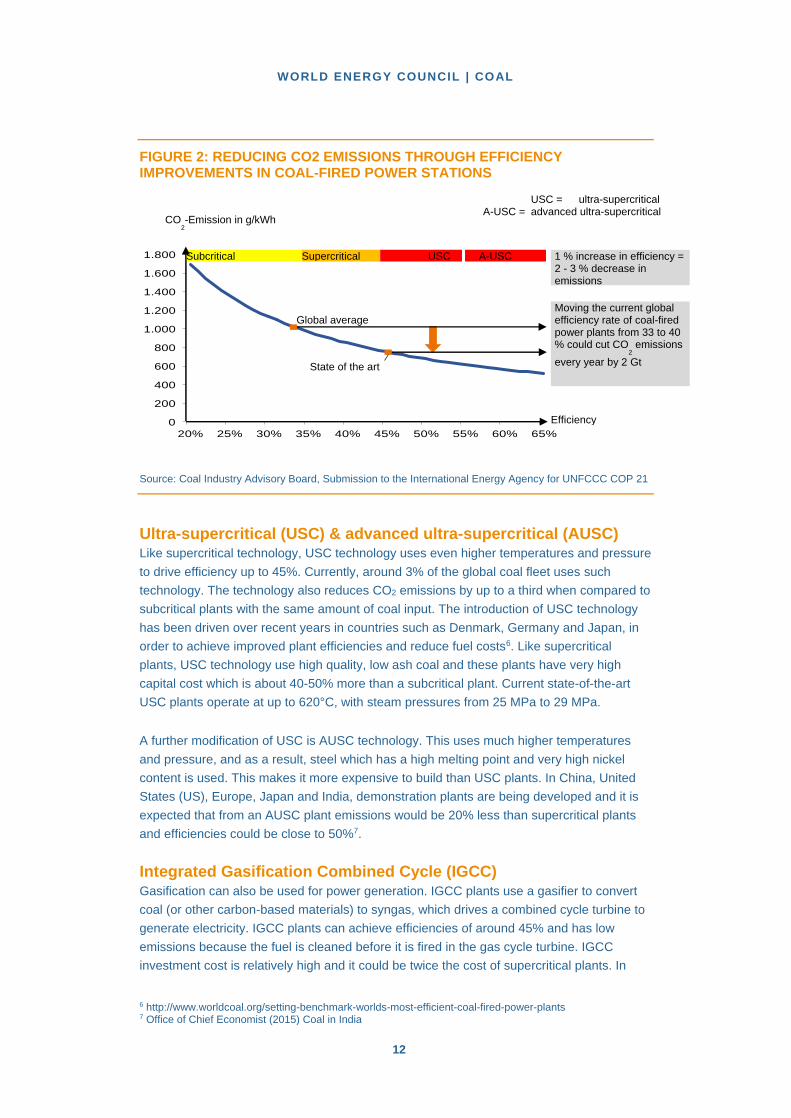
Supercritical Supercritical plants make up 22% of the global coal-fired power fleet with thermal
efficiencies of about 40%4 (Figure 2). The high capital costs of supercritical technology are
due largely to the alloys used and the welding techniques required for operation at higher
steam pressures and temperatures. The higher costs may be partially or wholly offset by
fuel savings (depending on the price of fuel). With respect to CO2 emissions, a supercritical
plant emits around 20% less than a subcritical plant5.
3 Reuters (2013) World Bank to limit financing coal-fired plants 4 https://www.iea.org/media/workshops/2015/cop21/ieaday/1.3GRAY.pdf 5 Office of Chief Economist (2015) Coal in India
WORLD ENERGY COUNCIL | COAL
12
FIGURE 2: REDUCING CO2 EMISSIONS THROUGH EFFICIENCY IMPROVEMENTS IN COAL-FIRED POWER STATIONS
Source: Coal Industry Advisory Board, Submission to the International Energy Agency for UNFCCC COP 21
Ultra-supercritical (USC) & advanced ultra-supercritical (AUSC) Like supercritical technology, USC technology uses even higher temperatures and pressure
to drive efficiency up to 45%. Currently, around 3% of the global coal fleet uses such
technology. The technology also reduces CO2 emissions by up to a third when compared to
subcritical plants with the same amount of coal input. The introduction of USC technology
has been driven over recent years in countries such as Denmark, Germany and Japan, in
order to achieve improved plant efficiencies and reduce fuel costs6. Like supercritical
plants, USC technology use high quality, low ash coal and these plants have very high
capital cost which is about 40-50% more than a subcritical plant. Current state-of-the-art
USC plants operate at up to 620°C, with steam pressures from 25 MPa to 29 MPa.
A further modification of USC is AUSC technology. This uses much higher temperatures
and pressure, and as a result, steel which has a high melting point and very high nickel
content is used. This makes it more expensive to build than USC plants. In China, United
States (US), Europe, Japan and India, demonstration plants are being developed and it is
expected that from an AUSC plant emissions would be 20% less than supercritical plants
and efficiencies could be close to 50%7.
Integrated Gasification Combined Cycle (IGCC) Gasification can also be used for power generation. IGCC plants use a gasifier to convert
coal (or other carbon-based materials) to syngas, which drives a combined cycle turbine to
generate electricity. IGCC plants can achieve efficiencies of around 45% and has low
emissions because the fuel is cleaned before it is fired in the gas cycle turbine. IGCC
investment cost is relatively high and it could be twice the cost of supercritical plants. In 6 http://www.worldcoal.org/setting-benchmark-worlds-most-efficient-coal-fired-power-plants 7 Office of Chief Economist (2015) Coal in India
0
200
400
600
800
1.000
1.200
1.400
1.600
1.800
20% 25% 30% 35% 40% 45% 50% 55% 60% 65%
CO2-Emission in g/kWh
Subcritical Supercritical
Global average
State of the art
USC = ultra-supercritical A-USC = advanced ultra-supercritical
USC A-USC
Efficiency
1 % increase in efficiency = 2 - 3 % decrease in emissions
Moving the current global efficiency rate of coal-fired power plants from 33 to 40 % could cut CO
2 emissions
every year by 2 Gt
WORLD ENERGY COUNCIL | WORLD ENERGY RESOURCES 2016
13
addition, IGCC technology is still in its nascent stages and the technology has not had
much testing as supercritical units.
Gasification typically takes place in an aboveground gasification plant. However, the
reaction can also take place below ground in coal seams. Underground coal gasification
(UCG) uses a similar process to surface gasification. The main difference between both
gasification processes is that in UCG the cavity itself becomes the reactor so that the
gasification of coal takes place underground instead of at the surface.
The advantages in the use of this technology are the low plant costs (as no surface
gasifiers are required) and the absence of coal transport costs. UCG also presents the
opportunity to reduce emissions, as there are fewer surface emissions. UCG technology
could also have synergies with CCS as the CO2 could be stored in the coal cavity after
gasification.
South African companies Sasol and Eskom both have UCG pilot facilities that have been
operating for some time, giving valuable information and data. In Australia, Linc Energy has
the Chinchilla site, which first started operating in 2000. Demonstration projects and studies
are also currently underway in a number of countries, including the US, Western and
Eastern Europe, Japan, Indonesia, Vietnam, India, Australia and China, with work being
carried out by both industry and research establishments.
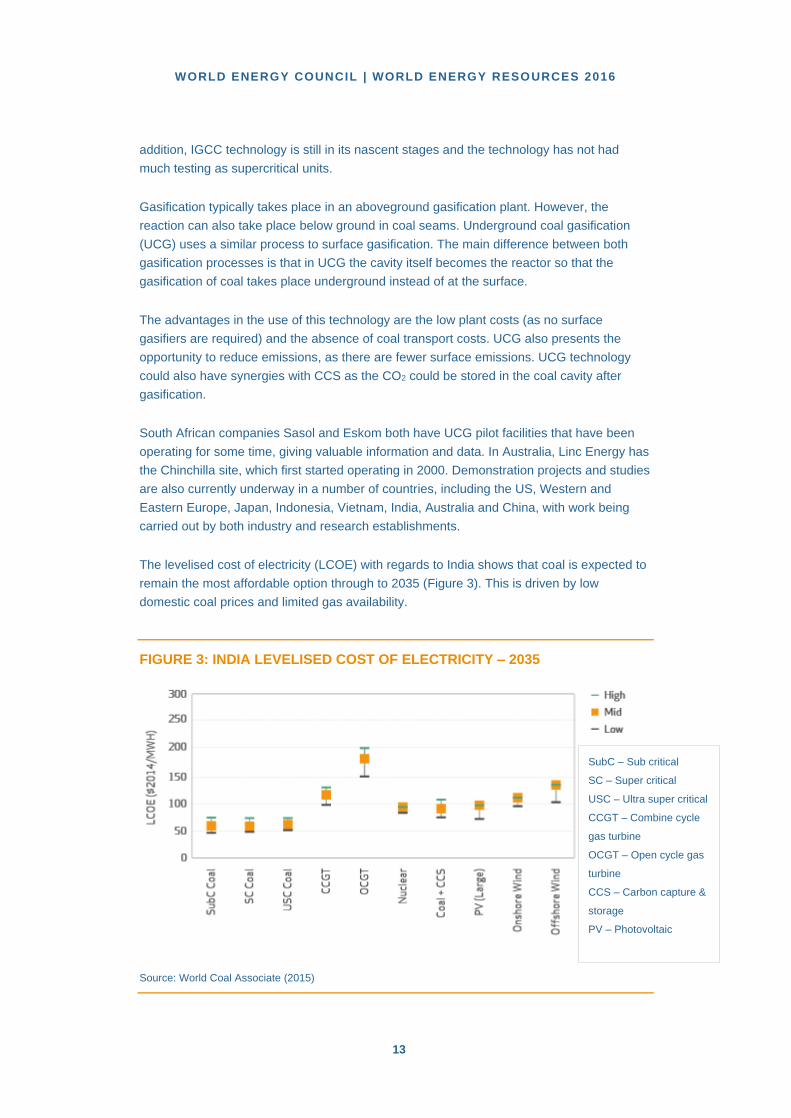
The levelised cost of electricity (LCOE) with regards to India shows that coal is expected to
remain the most affordable option through to 2035 (Figure 3). This is driven by low
domestic coal prices and limited gas availability.
FIGURE 3: INDIA LEVELISED COST OF ELECTRICITY – 2035
Source: World Coal Associate (2015)
SubC – Sub critical
SC – Super critical
USC – Ultra super critical
CCGT – Combine cycle
gas turbine
OCGT – Open cycle gas
turbine
CCS – Carbon capture &
storage
PV – Photovoltaic
WORLD ENERGY COUNCIL | COAL
14
COAL TO LIQUID (CTL) Converting coal to a liquid fuel is a process referred to as coal liquefaction. This allows coal
to be utilised as an alternative to oil. CTL is particularly suited to countries that rely heavily
on oil imports and have large domestic reserves of coal. South Africa has been producing
coal-derived fuels since 1955 and has the only commercial coal to liquids industry in
operation today8. Not only are CTL fuels used in cars and other vehicles, but South African
energy company Sasol also has approval for CTL fuel to be used in commercial jets.
Currently around 30% of the country’s gasoline and diesel needs are produced from
indigenous coal. The total capacity of the South African CTL operations stands in excess of
160,000 barrels per day. Fuels produced from coal can also be used outside the
transportation sector. Coal-derived dimethyl ether (DME) is receiving particular attention
today, as it is a product that holds out great promise as a domestic fuel. DME is non-
carcinogenic and non-toxic to handle and generates less carbon monoxide and
hydrocarbon air pollution than liquefied petroleum gas (LPG).
TECHNOLOGY OUTLOOK Currently, subcritical coal capacity constitutes a significant share of global installed
capacity. By 2025, however, policy interventions and technological progress are likely to
drive deployment of high efficiency low emission (HELE) technologies and result in the
subcritical fleet declining to around 50% or lower9. The rising economies of Asia will lead
the efficiency drive, with India and Southeast Asia seeing particular growth. India, for
instance, has recently mandated that power plants above 600 MW must employ
supercritical or USC technology10. Elsewhere, the US and Japan also expect to use IGCC
technology.
Deployment of CCS technology is key to reducing global CO2 emissions, not only from coal,
but also from all fossil fuels. As previously explored, CCS is an integrated suite of
technologies that can capture up to 90% of the CO2 emissions produced from the use of
fossil fuels in electricity generation and industrial processes, preventing the CO2 from
entering the atmosphere. In recent years, positive developments have been made in CCS
that suggests increased scope for deployment over the coming decades. For instance, in
2014, SaskPower launched the Boundary Dam Project in southern Saskatchewan, Canada.
The project has the potential to reduce GHG emissions by one million tonnes of CO2 each
year. In addition, the Kemper County Energy Facility and Petra Nova Carbon Capture
Project are two large-scale CCS projects in the power sector which are targeting operations
in 2016 (see CCS chapter for more).
8 https://www.worldcoal.org/sites/default/files/coal_liquid_fuels_report(03_06_2009).pdf 9 World Coal (2015) Cleaning up the coal-fired market 10 CSE India (2015) An epochal shift in the idea of India – Meeting Aspirations?

WORLD ENERGY COUNCIL | WORLD ENERGY RESOURCES 2016
15
2. ECONOMICS & MARKETS
The world currently consumes over 7,800 Mt of coal which is used by a variety of sectors
including power generation, iron and steel production, cement manufacturing and as a
liquid fuel. The majority of coal is either utilised in power generation that utilises steam coal
or lignite, or iron and steel production that uses coking coal.
COAL PRODUCTION IN 2014 – FIRST DECLINE IN DECADES In 2014, global coal production was approximately 5.7 billion tonnes coal equivalent11.
About 77% of the coal production was steam coal to be utilised in other industries and for
power generation, 13% was coking coal to be used for coke production in the steel industry
and 10% lignite. The total global coal production was 0.7% less than in 2013 and 2.8% less
in 2015, making this the first decline in global coal production growth since the 1990s. This
was primarily due to the weakening of world economic growth and the flagging electricity
demand in some important Asian countries12.
The largest coal producing countries are not confined to one region. The top five producers
are China, the US, India, Indonesia, Australia and South Africa. Much of global coal
production is used in the country in which it is produced and only around 18% of hard coal
production is destined for the international coal market.
COAL CONSUMPTION Coal plays a vital role in power generation and this role is set to continue. Coal currently
fuels 40% of the world’s electricity and is forecast to continue to supply a strategic share
over the next three decades.
In 2014, coal demand in China fell for the first time since 1999 by 2.9% to 3.9 billion
tonnes13, but China remains the world’s largest coal consumer with a share of 50%.
In addition, the US coal demand strongly dropped by more than 13% to 835 million tonnes
in 2014. The US coal demand peaked at about 1 billion tonnes in 2007. The fall in US coal
demand was mainly due to the increasing competition from natural gas. US gas prices
visibly fell as a result of the enormous boost in production of unconventional (shale) gas.
This led to a large fuel switch from coal to gas. Furthermore, weaker power demand from
coal, stronger headwind from political/governmental opposition and increasingly more
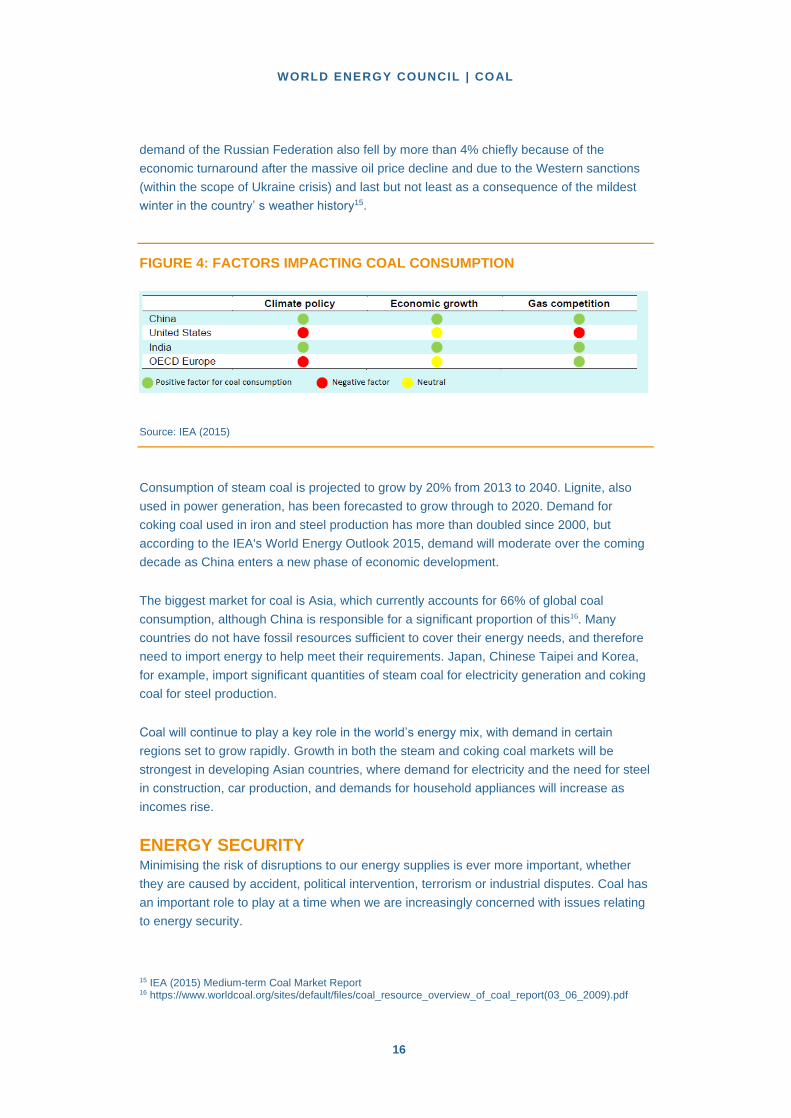
environmental regulations resulted in a fall in coal demand in the US14 (Figure 4).
European (EU 28) coal demand fell by nearly 6%, which can partly be explained by
continued pressure on coal-fired power generation due to environmental policies. Coal 11 IEA Coal Information (2015) here coal comprises all primary coals like anthracite, coking coal, other bituminous coal, sub-bituminous coal and lignite 12 German Coal Assosiation (GVSt e.V.), Steinkohle (2015) 13 Reuters (2015) Peak coal by 2020 could save China thousands of lives: study 14 IEA (2015) Medium-term Coal Market Report
WORLD ENERGY COUNCIL | COAL
16
demand of the Russian Federation also fell by more than 4% chiefly because of the
economic turnaround after the massive oil price decline and due to the Western sanctions
(within the scope of Ukraine crisis) and last but not least as a consequence of the mildest
winter in the country’ s weather history15.
FIGURE 4: FACTORS IMPACTING COAL CONSUMPTION
Source: IEA (2015)
Consumption of steam coal is projected to grow by 20% from 2013 to 2040. Lignite, also
used in power generation, has been forecasted to grow through to 2020. Demand for
coking coal used in iron and steel production has more than doubled since 2000, but
according to the IEA's World Energy Outlook 2015, demand will moderate over the coming
decade as China enters a new phase of economic development.
The biggest market for coal is Asia, which currently accounts for 66% of global coal
consumption, although China is responsible for a significant proportion of this16. Many
countries do not have fossil resources sufficient to cover their energy needs, and therefore
need to import energy to help meet their requirements. Japan, Chinese Taipei and Korea,
for example, import significant quantities of steam coal for electricity generation and coking
coal for steel production.
Coal will continue to play a key role in the world’s energy mix, with demand in certain
regions set to grow rapidly. Growth in both the steam and coking coal markets will be
strongest in developing Asian countries, where demand for electricity and the need for steel
in construction, car production, and demands for household appliances will increase as
incomes rise.
ENERGY SECURITY Minimising the risk of disruptions to our energy supplies is ever more important, whether
they are caused by accident, political intervention, terrorism or industrial disputes. Coal has
an important role to play at a time when we are increasingly concerned with issues relating
to energy security.
15 IEA (2015) Medium-term Coal Market Report 16 https://www.worldcoal.org/sites/default/files/coal_resource_overview_of_coal_report(03_06_2009).pdf
WORLD ENERGY COUNCIL | WORLD ENERGY RESOURCES 2016
17
The global coal market is large and diverse, with many different producers and consumers
from every continent. Coal supplies do not come from one specific area, which would make
consumers independent on the security of supplies and stability of only one region.
Many countries such as China, India, Indonesia, Australia and South Africa rely on
domestic supplies of coal for their energy need. Others import coal from a variety of
countries: in 2013 the UK, for example, imported coal from Australia, Colombia, Russia,
South Africa, and the USA, as well as smaller amounts from a number of other countries
and its own domestic supplies:
Coal therefore has an important role to play in maintaining the security of the
global energy mix.
Coal reserves are very large and will be available for the near future without rising
geopolitical or safety issues.
Coal is readily available from a wide variety of sources in a well-supplied worldwide
market.
Coal can easily be stored at power stations and stocks can be relied upon in an
emergency.
Coal-based power is not dependent on the weather and can be used as a backup
for wind and hydropower.
Coal does not need high-pressure pipelines or dedicated supply routes.
Coal supply routes do not need to be protected at enormous expense. These
features help to facilitate efficient and competitive energy markets and help to
stabilise energy prices through inter-fuel competition.
CHINA China has been the growth engine of world energy and coal demand over the last ten
years. The development in China has largely been powered by coal, which accounted for
about 72% of primary energy demand growth over the period 2004-2013. In 2013, the
share of China’s coal consumption was over 50%17. In 2014 the slowdown in Chinese coal
consumption was influenced by the slower growth in the steel and cement sectors. Steel
and cement have a share of over 26% of coal demand in China and when compared to that
of the US of about 4% and some 14% in the EU18. Steel and cement production are largely
dependent on infrastructure expansion in China, therefore coal consumption is also linked
through these sectors to infrastructure developments.
Electricity generation accounts for the majority of coal demand in China (about 60%) and
this nation tops the rank in coal-fired power generation (Figure 5). The main driver was 17 IEA (2015) Medium Term Market Report 18 Ibid 17
WORLD ENERGY COUNCIL | COAL
18
development in the industrial sector, which accounts for the bulk of electricity consumption
in China, in contrast to regions such as the EU or North America, where the bulk of
electricity consumption is in the service and residential sectors.
FIGURE 5: 2014 COUNTRY RANKING: COAL-FIRED POWER GENERATION
(TWH)
Source: IEA (2015) Electricity Information (*for Non-OECD-countries numbers for 2013)
The decreased global supply in 2014 was caused mainly by declining supply in China and
Indonesia (Table 1). For both countries, this was a significant change as supply in China
and Indonesia grew strongly over the last decade with average growth rates of 7.5% in
China and 15.3% in Indonesia.
TABLE 1: COAL SUPPLY OVERVIEW
Total coal supply (Mt) 2013
Total coal supply
(Mt) 2014
Relative growth
(%) 2014
China 3749 3650 -2.6%
India 610 668 9.6%
Indonesia 488 471 -3.5%
Australia 459 491 7.0%
WORLD ENERGY COUNCIL | WORLD ENERGY RESOURCES 2016
19
United
States 904 916 1.4%
Source: IEA (2015)
INDIA Out of the total coal production of 565.7 million tonnes in the country, public sector
companies accounted for around 93.3% of the production led by Coal India Limited (CIL)
and Singareni Collieries Company Limited (SCCL). Similarly, as far as lignite production is
concerned, around 90% of the production is done through public sector companies, led by
Neyveli Lignite Corporation (NLC). However, the contribution of the private sector is
gradually gaining significance mainly facilitated by the Government policy of allocating coal
blocks to private players.
Today, CIL is the largest coal producer in India and produces around 81% of the total coal19
(Table 2).
TABLE 2: PRODUCTION SHARE OF COAL PRODUCING COMPANY IN INDIA
Company Production (million tonnes) Share
CIL 462.4 81.7%
SCCL 50.5 8.9%
Other Govt.
Companies
15.2 2.7%
Total share of Govt.
Companies
528.1 93.3%
Private Companies 37.7 6.6%
Source: Ministry of Coal, India (2013-2014)
Production and supply The total solid fuel (coal and lignite) production in India was 610.04 million tonnes (565.8
million tonnes of coal and 44.3 million tonnes of lignite) in 2013 and it was the fifth largest 19 Data from Coal Directory of India (2013-14) Ministry of Coal

WORLD ENERGY COUNCIL | COAL
20
country in the world in terms of coal production. 90% of the total coal produced in the
country is thermal coal while the rest consists of coking coal.
Domestic coal production has been inadequate to meet the total demand of coal in the
country. The production has been slow mainly in the last five years starting from 2009 in
comparison to previous years (Figure 6). In addition, this period also experienced increased
coal based generation capacity in the country, which demanded large volume imports of
coal from other countries to meet the shortfall in domestic coal production, compensation
for India’s low quality, high ash coal and the total coal demand.
FIGURE 6: COAL PRODUCTION IN INDIA
Source: Ministry of Coal, India
While the importance of coal in meeting the primary energy requirement has been
increasing incessantly, the production of coal has not kept pace with the demand,
particularly in recent years. The gap between domestic coal production and consumption is
being met almost entirely through imports. The net import of coal increased by 193% from
2008 to 2013 (Figure 7).
The working group on coal in its report for the 12th five-year plan has estimated that the
total demand in the country in the year 2016-2017 will be 980.50 million tonnes and the
domestic coal availability has been projected at 715 million tonnes in the ‘business as
usual’ scenario and 795 million tonnes in the ‘optimistic scenario’20.
20 Planning Commission of India, 12th Working Group Report on Coal
389413
437462
491525
566 571 583604 610
0
100
200
300
400
500
600
700
2003-04 2004-05 2005-06 2006-07 2007-08 2008-09 2009-10 2010-11 2011-12 2012-13 2013-14
Pro
du
cti
on
, m
illio
n t
on
ne
s
LIGNITE
COAL
TOTAL Solid Fuel
WORLD ENERGY COUNCIL | WORLD ENERGY RESOURCES 2016
21
FIGURE 7: DOMESTIC PRODUCTION AND TOTAL CONSUMPTION IN INDIA
Source: Ministry of Coal, India
As per the Import Policy 1993-1994, coal has been under Open General License (OGL)
and therefore consumers are free to import coal based on their requirement. For
importation, Indonesia has been a major exporter to India with regards to thermal coal and
Australia a major source for coking coal.
The main reason for the increasing dependence of imports is the substantial coal-based
power generation capacity added in the recent past. Coal based thermal capacity currently
accounts for around 60% of the total generation capacity in the country. In terms of
electricity generated in the country, the share of coal-based generation is still high, around
78% of the total generation. The share of thermal coal in the total import of coal has been
increasing over the years and has reached 78% in 2013-2014.
The coal based generation capacity has increased by almost 104% in the period from
March 2007 to March 2014 whereas the growth in thermal coal production in the country
was only 29% in the same period. Because of this gap, the import of thermal coal increased
by 40% on average in the same period. It is estimated that coal based power plants meet
almost 26% of their total coal requirement through coal importation21.
India is endowed with abundant quantity of coal, which serves as the main resource for
meeting the primary energy and economic growth needs of the country. However, as the
country is on the path to rapid economic growth with added generation capacity, the
domestic coal production has not increased in the same proportion, resulting in a huge
shortfall between coal demand and domestic coal supply. This has increased reliance on
imported coal, which is generally more expensive compared to the domestic coal.
Additionally, the imported coal is normally of better quality and this limits the generating
plants in utilising domestic coal.
21 Data from Central Electricity Authority, www.cea.nic.in
0.0
100.0
200.0
300.0
400.0
500.0
600.0
700.0
800.0
900.0
2008-09 2009-10 2010-11 2011-12 2012-13 2013-14
millio
n t
on
ne
s
Gap Net Import
Total consumption Domestic Production
WORLD ENERGY COUNCIL | COAL
22
AUSTRALIA Coal has always been the dominant fuel in the energy mix of Australia where about 75% of
the electricity produced is from coal. This is predominantly hard coal, which makes up 47%
of Australia’s electricity supply. As a result, there are plans to extend mining capacity to a
total of 10.8 million tonnes per annum over the next years. For example, in late 2016, the
US$1.9 billion underground coking coal mine project in Grosvenor operated by Anglo
American will come online with a capacity of 5 Mtpa22.
Infrastructure investment has aided Australia towards an increase in production and export,
but the falling coal prices have caused some coal port projects to be cancelled or
postponed, including amongst others the Indgeon Point Terminal in the port of Hay Point.
Overall, Australia was able to increase its exports in 2014, with an increase in volume from
29 million tonnes to 387 million tonnes.
The largest importers of Australian coking coal are China, India, Japan, Europe and South
Korea. China’s import of coking coal was 18% higher and India imported 21% more than in
the previous year.
22 IEA (2015) Coal Medium-Term Market Report

WORLD ENERGY COUNCIL | WORLD ENERGY RESOURCES 2016
23
TABLE 3: AUSTRALIAN EXPORT DEVELOPMENT IN SELECTED REGIONS
(HARD COAL, MT)
2013 2014
China 27.0 31.9
India 25.1 30.4
Japan 20.6 21.9
Europe 15.1 15.9
South Korea 7.9 8.6
Total 95.7 108.7
Source: VDKI (2015)
SOUTHEAST ASIA
Indonesia The supply of hard coal in Indonesia declined by 3.6% to 470.8 million tonnes in 2014 as
the Indonesian government tried to limit production in order to stabilise prices in the
oversupplied international coal market. Most of the coal supply served the export market,
with about 8% of the supply utilised for domestic consumption. The decline in supply is
because of the export market, more specifically in lower exports to China as well as new
regulations in China, such as coal testing requirements to ensure that the imports comply
with the new quality standards. The testing is supposed to be conducted exclusively by the
Chinese customs and border authorities, and the entire cargo could be refused in the event
of non-compliance with the threshold values. Indonesian coal exports in 2014 were also
affected by new regulations that came into effect in October, which requires companies to
be registered as official exporters in order to reduce exports from illegal mining activities.
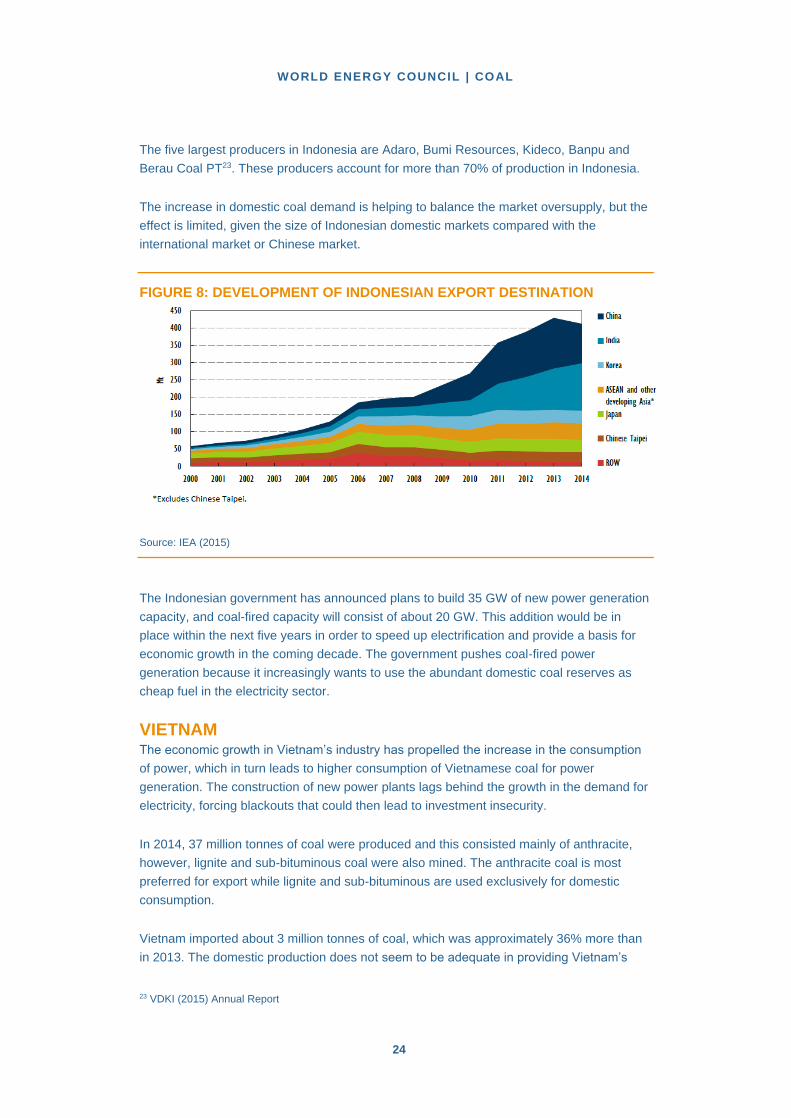
In the period 2004-2013 China and India absorbed over 70% of additional coal supplies
from Indonesia (Figure 8). Indonesian exports consist almost entirely of steam coal; as
Indonesian coal typically has high moisture content, it does not meet the quality
requirements for metallurgical/coking coal.
WORLD ENERGY COUNCIL | COAL
24
The five largest producers in Indonesia are Adaro, Bumi Resources, Kideco, Banpu and
Berau Coal PT23. These producers account for more than 70% of production in Indonesia.
The increase in domestic coal demand is helping to balance the market oversupply, but the
effect is limited, given the size of Indonesian domestic markets compared with the
international market or Chinese market.
FIGURE 8: DEVELOPMENT OF INDONESIAN EXPORT DESTINATION
Source: IEA (2015)
The Indonesian government has announced plans to build 35 GW of new power generation
capacity, and coal-fired capacity will consist of about 20 GW. This addition would be in
place within the next five years in order to speed up electrification and provide a basis for
economic growth in the coming decade. The government pushes coal-fired power
generation because it increasingly wants to use the abundant domestic coal reserves as
cheap fuel in the electricity sector.
VIETNAM The economic growth in Vietnam’s industry has propelled the increase in the consumption
of power, which in turn leads to higher consumption of Vietnamese coal for power
generation. The construction of new power plants lags behind the growth in the demand for
electricity, forcing blackouts that could then lead to investment insecurity.
In 2014, 37 million tonnes of coal were produced and this consisted mainly of anthracite,
however, lignite and sub-bituminous coal were also mined. The anthracite coal is most
preferred for export while lignite and sub-bituminous are used exclusively for domestic
consumption.
Vietnam imported about 3 million tonnes of coal, which was approximately 36% more than
in 2013. The domestic production does not seem to be adequate in providing Vietnam’s 23 VDKI (2015) Annual Report

WORLD ENERGY COUNCIL | WORLD ENERGY RESOURCES 2016
25
dynamically growing economy with a satisfactory amount of coal supplies24. This could be
one of the reasons why the demand for imports of steam coal will steadily rise. Coal-fired
power plants would still remain the most important source of power generation in Vietnam,
fuelling 48% of the nation’s total generation capacity25. The government estimates that coal
demand is leaping upward as a result of the additional 24 coal-fired power plants that are
planned or under construction which are scheduled to operate before 2016. It is estimated
that the demand for coal will move from 43 million tonnes in 2014 to about 70 to 80 million
tonnes in 202026.
THAILAND There are significant reserves of brown coal estimated at 1.1 billion tonnes, which is
produced for local use in power generation. In 2013, 7.3 million tonnes of coal were
produced and the import of hard coal continues to rise in quantity, particularly from
Indonesia and Australia, to fuel its power stations in coastal areas27.
In 2013, the importation of coal stood at about 17 million tonnes, and this figure is expected
to increase significantly in the coming decades due to an expanding coal-fired power
generation fleet.
SOUTH AFRICA South Africa has 70% of all coal found on the African continent and coal-fired generation
accounts for about 80% of its electrification. South Africa has well developed infrastructure,
unlike countries such as Botswana or Mozambique with undeveloped infrastructures, but
with rich coal deposits.
In South Africa, some new mines will be commissioned such as the Boikarabelo mine in the
Waterberg region, which is operated by the company Resource Generation and is projected
to start in 201628. Output from the deposits in Limpopo Province is initially supposed to be 6
million tonnes per year; this will be increased to a capacity of 25 million tonnes per year.
The state-owned mining company African Exploration and Mining Finance Company
(AEMFC) wants to open two new mines that are expected to supply coal to the Eskom
power plants from 201729.
The exports from South Africa increased by 1 million tonnes in 2014 and totalled just
slightly less than 77 million tonnes. The structure of exports continues to shift towards India.
India imported 30 million tonnes of steam coal, about 10 million tonnes more than in 2013,
while China reduced its imports from 13.5 million tonnes to 3.3 million tonnes. In view of
India’s high need for steam coal in the future, the exports to this country will presumably
continue to rise.
24 VDKI (2015) Annual Report 25http://www.renewableenergy.org.vn/index.php?mact=News,cntnt01,detail,0&cntnt01articleid=3256&cntnt01origid=53&cntnt01returnid=53 26 VDKI (2015) Annual Report 27 IEA (2015) Southeast Asia Energy Outlook Report 28 IEA (2015) Coal Medium-Term Market Report 29 VDKI (2015) Annual Report
WORLD ENERGY COUNCIL | COAL
26
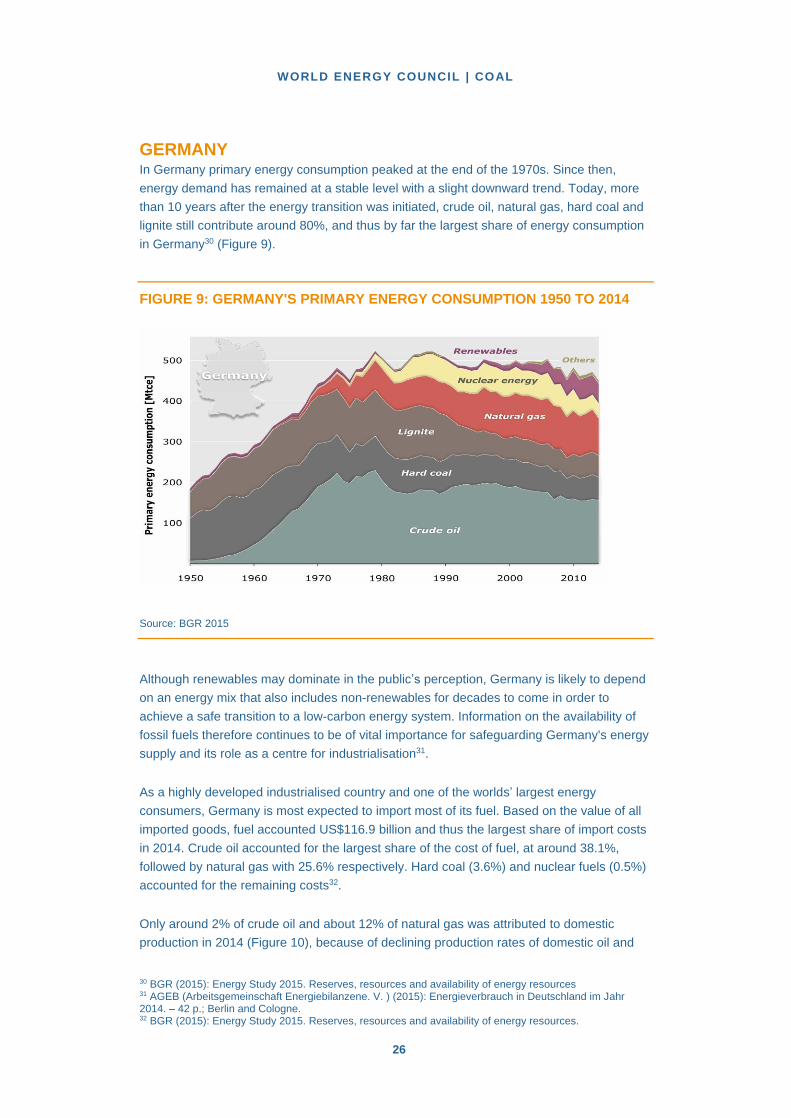
GERMANY In Germany primary energy consumption peaked at the end of the 1970s. Since then,
energy demand has remained at a stable level with a slight downward trend. Today, more
than 10 years after the energy transition was initiated, crude oil, natural gas, hard coal and
lignite still contribute around 80%, and thus by far the largest share of energy consumption
in Germany30 (Figure 9).
FIGURE 9: GERMANY'S PRIMARY ENERGY CONSUMPTION 1950 TO 2014
Source: BGR 2015
Although renewables may dominate in the public’s perception, Germany is likely to depend
on an energy mix that also includes non-renewables for decades to come in order to
achieve a safe transition to a low-carbon energy system. Information on the availability of
fossil fuels therefore continues to be of vital importance for safeguarding Germany's energy
supply and its role as a centre for industrialisation31.
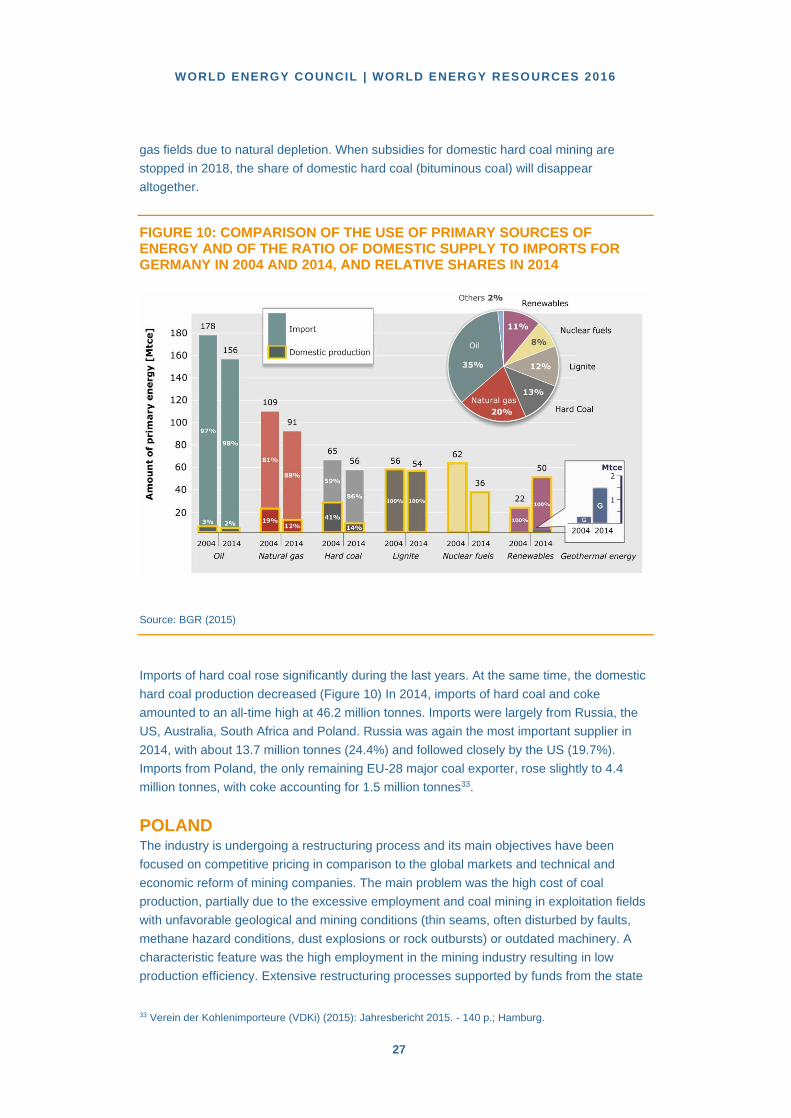
As a highly developed industrialised country and one of the worlds’ largest energy
consumers, Germany is most expected to import most of its fuel. Based on the value of all
imported goods, fuel accounted US$116.9 billion and thus the largest share of import costs
in 2014. Crude oil accounted for the largest share of the cost of fuel, at around 38.1%,
followed by natural gas with 25.6% respectively. Hard coal (3.6%) and nuclear fuels (0.5%)
accounted for the remaining costs32.
Only around 2% of crude oil and about 12% of natural gas was attributed to domestic
production in 2014 (Figure 10), because of declining production rates of domestic oil and 30 BGR (2015): Energy Study 2015. Reserves, resources and availability of energy resources 31 AGEB (Arbeitsgemeinschaft Energiebilanzene. V. ) (2015): Energieverbrauch in Deutschland im Jahr 2014. – 42 p.; Berlin and Cologne. 32 BGR (2015): Energy Study 2015. Reserves, resources and availability of energy resources.
WORLD ENERGY COUNCIL | WORLD ENERGY RESOURCES 2016
27
gas fields due to natural depletion. When subsidies for domestic hard coal mining are
stopped in 2018, the share of domestic hard coal (bituminous coal) will disappear
altogether.
FIGURE 10: COMPARISON OF THE USE OF PRIMARY SOURCES OF ENERGY AND OF THE RATIO OF DOMESTIC SUPPLY TO IMPORTS FOR GERMANY IN 2004 AND 2014, AND RELATIVE SHARES IN 2014
Source: BGR (2015)
Imports of hard coal rose significantly during the last years. At the same time, the domestic
hard coal production decreased (Figure 10) In 2014, imports of hard coal and coke
amounted to an all-time high at 46.2 million tonnes. Imports were largely from Russia, the
US, Australia, South Africa and Poland. Russia was again the most important supplier in
2014, with about 13.7 million tonnes (24.4%) and followed closely by the US (19.7%).
Imports from Poland, the only remaining EU-28 major coal exporter, rose slightly to 4.4
million tonnes, with coke accounting for 1.5 million tonnes33.
POLAND The industry is undergoing a restructuring process and its main objectives have been
focused on competitive pricing in comparison to the global markets and technical and
economic reform of mining companies. The main problem was the high cost of coal
production, partially due to the excessive employment and coal mining in exploitation fields
with unfavorable geological and mining conditions (thin seams, often disturbed by faults,
methane hazard conditions, dust explosions or rock outbursts) or outdated machinery. A
characteristic feature was the high employment in the mining industry resulting in low
production efficiency. Extensive restructuring processes supported by funds from the state 33 Verein der Kohlenimporteure (VDKi) (2015): Jahresbericht 2015. - 140 p.; Hamburg.

WORLD ENERGY COUNCIL | COAL
28
budget, the World Bank and later by the European Union funds led to the industry's positive
financial results in 2003.
FIGURE 11: THE FINANCIAL RESULTS OF HARD COAL MINING IN THE
YEARS 2010 TO 2014.
Source: Ministry of Economy, Poland (2015)
In 2011, Polish mining achieved a positive financial result of approximately US$1.017 billion
(Figure 11). Unfortunately, this trend was short lived. In 2014 and in 2015, Polish mining
reported heavy losses.
The reasons for such worsening of the financial situation of mining companies was due to
several factors, among which the most important was the continued decrease in coal prices
since 2011 (Figure 12). This shows two indicators of power coal prices: CIF ARA -
representing the price of coal imported to Europe and FOB Newcastle - representing the
price of coal exported from Australia.
468.2
1017.0
501.6
-92.6
-650.4-503.4
-800.0
-600.0
-400.0
-200.0
0.0
200.0
400.0
600.0
800.0
1000.0
1200.0
2010 2011 2012 2013 2014 2015
millio
n U
S$

WORLD ENERGY COUNCIL | WORLD ENERGY RESOURCES 2016
29
FIGURE 12: COMPARISON OF THERMAL COAL SPOT PRICE INDICES:
MONTHLY AVERAGES IN US$/TONNES
Source: Lorenz U. (2015)34
With the decreasing prices in international markets, the prices received by Polish
manufacturers also decreased. In 2013, the average price of coal sold was lower by as
much as 14% compared to the previous year which was followed by a further 6% decrease
in 201435 (Figure 13).
34 Lorenz U. (2015), Current situation and forecasts for international steam coal Polityka Energetyczna – Energy Policy Journal 18, 4, 5-18 (in Polish). 35 Ministry of Economy, Poland (2015), Information about the functioning of hard coal mining industry and the evaluation of the realization of the activity strategy of the hard coal mining industry in Poland in the years 2007-2015, Warsaw
50
60
70
80
90
100
110
120
130
14020
10
2011
2012
2013
2014
2015
[USD
/tonę
]
CIF ARA FOB Newcastle
WORLD ENERGY COUNCIL | COAL
30
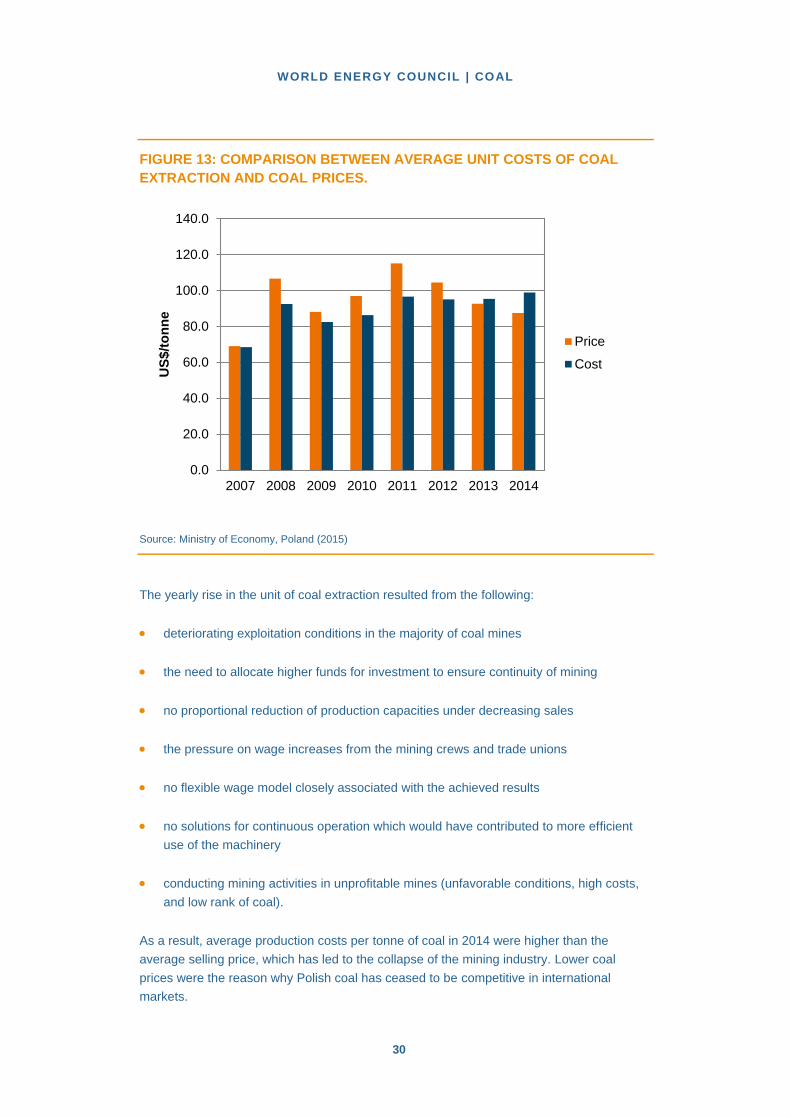
FIGURE 13: COMPARISON BETWEEN AVERAGE UNIT COSTS OF COAL
EXTRACTION AND COAL PRICES.
Source: Ministry of Economy, Poland (2015)
The yearly rise in the unit of coal extraction resulted from the following:
deteriorating exploitation conditions in the majority of coal mines
the need to allocate higher funds for investment to ensure continuity of mining
no proportional reduction of production capacities under decreasing sales
the pressure on wage increases from the mining crews and trade unions
no flexible wage model closely associated with the achieved results
no solutions for continuous operation which would have contributed to more efficient
use of the machinery
conducting mining activities in unprofitable mines (unfavorable conditions, high costs,
and low rank of coal).
As a result, average production costs per tonne of coal in 2014 were higher than the
average selling price, which has led to the collapse of the mining industry. Lower coal
prices were the reason why Polish coal has ceased to be competitive in international
markets.
0.0
20.0
40.0
60.0
80.0
100.0
120.0
140.0
2007 2008 2009 2010 2011 2012 2013 2014
US
$/t
on
ne
Price
Cost

WORLD ENERGY COUNCIL | WORLD ENERGY RESOURCES 2016
31
Mining remains a key supplier of primary fuels for the domestic economy, giving Poland
one of the highest rates in Europe's energy security. Energy dependence of Poland on
energy imports (for all energy products) was 30.4% in 2012 in comparison to 53.4% for the
EU-28 during the same period36. The low dependence is due to the structure of electricity
production in the country; in 2013, 83.7% of electricity was produced from solid fuels
(49.6% from hard coal and 34.1% from lignite).
The coal market in Poland is currently facing a number of serious challenges arising from
the rapidly changing conditions in the sector. Its long-term role depends on many factors,
both at the national and international level. In spite of high coal reserves, the future and role
of hard coal mining industry will depend on the successful combat of the deep crisis
currently experienced in Poland. In view of the high losses and lack of financial liquidity, the
mining companies and the government have to undertake a better restructuring process
which should be carried out in a planned and systematic manner. It seems that the sector
needs some aid and financial support, as demanded by trade unions.
The EU climate policy is a challenge for the Polish national fuel and energy sector. Its
intensification can directly affect the position of coal as a fuel for power generation and as a
result can affect the entire economy because coal is an enabler for Poland’s economic
growth.
UNITED STATES No significant additions to export mining capacity are expected to come on line over the
next five years because of the weak domestic coal demand and low international prices.
Coal exports from the US to Asian markets are currently limited by scarce port capacity at
the US West Coast. To alleviate the problem, projects like the Gateway Pacific is underway
with a planned export capacity of 24-38 Mtpa and Millennium Bulk Logistics project and the
Port Westward project both have a projected capacity of 15-30 Mtpa. These projects are
currently in the approval process37.
The ongoing limited export capacity and the replacement of coal-fired power plants with
power plants fired with natural gas and the plan initiated by the Obama administration to
reduce emissions in the energy sector nationwide to 30% below the 2005 level by 2030
could have a major effect on the coal-producing and coal-consuming industry.
Overall, coal will continue as a major part of the US energy mix. It is expected to account
for about one quarter of the countries generation capacity in 203038.
FUTURE OUTLOOK The total world coal production (lignite and hard coal) declined in 2014 by about 53 million
tonnes, which is the first annual decline since 199939. After more than a decade of strong
growth in global coal production and consumption, the coal sector entered a phase of 36 Eurostat (2014). Energy, transport and environment indicators. Luxemburg. 37 IEA (2015) Medium-term Coal Market Report 38 http://www.whitecase.com/publications/insight/power-dynamics-forces-shaping-future-coal-united-states 39 IEA (2015b): Coal Information 2015. – 674 p.; Paris.

WORLD ENERGY COUNCIL | COAL
32
oversupply and a stagnating global demand. The former high growth rates in coal
consumption lead to huge investments in coal exploration, and subsequently to expansions
in coal mining capacities worldwide. Due to the continuing oversupply in the global coal
market, prices for coal have fallen since 2011 for nearly four consecutive years. In August
2015, thermal coal prices decreased by 50% to about US$50 per tonne. On the contrary,
world coking coal production increased by 2.6% in 201440. This increase has been
consistent since 2002, driven by growth in production intended for export by Australia, the
world’s largest exporter of coking coal and second largest producer (Table 4).
TABLE 4: MAJOR COKING COAL (1) PRODUCERS (MT)
Country 2012 2013 2014p
China 515.7 561.6 567.9
Australia 146.9 159.5 184.8
Russia 72.8 73.8 75
United States 81.3 77.9 75
India 43.5 49.6 51.4
Canada 31.1 34.1 30.6
Kazakhstan 13 13 15.3
Ukraine 20.9 19.7 12.8
Poland 11.7 12.1 12.3
Mongolia 8.8 6.9 10.3
Colombia 4.5 4.2 5.1
Germany 6.3 4.8 4.8
Czech Republic 5.1 4.6 4.6
Mozambique 2.8 3.3 3.8
Indonesia 3.1 3.6 2.7
South Africa 1.6 3.4 2.6
Other 7.1 5.8 6.0
40 IEA (2015): Coal information 2015

WORLD ENERGY COUNCIL | WORLD ENERGY RESOURCES 2016
33
World 976.1 1,037.6 1,064.8
‘(1)’ significant proportions of production in some countries may be designated for thermal
usage.
Data for Australia and India are provided on a fiscal basis.
Source: IEA (2015) Coal Information
In the last years, more mines with high production costs were closed down, most of them in
the United States, Australia and China. At the same time, all coal producers were focusing
on cost-saving initiatives and improving their productivity in coal mining. Thus, it seems the
global oversupply situation may hardly change in the near future. Furthermore, reductions
through mine closures are offset by the commissioning of new production capacities.
In the European coal mining industry, particularly hard coal, there are plans for major
restructuring processes. Furthermore, the phasing out of subsidies for hard coal mining in
the EU by the end of 2018 based on the EU rules governing state aid for the coal sector as
decided on 10 December 2010 by the Competitiveness Council, will have a major impact
on hard coal mining in nearly all hard coal producing EU member countries41. Nonetheless,
coal will continue to play an important role, as the rise in global primary energy
consumption is expected to continue, particularly in Asian countries42.
41 Council of the European Union (2010) COUNCIL DECISION of 10 December 2010 on State aid to facilitate the closure of uncompetitive coal mines (2010/787/EU). Official Journal of the European Union 42 BGR (2014) Energy Study 2014. Reserves, resources and availability of energy resources, Hannover.
WORLD ENERGY COUNCIL | COAL
34
3. SOCIO-ECONOMICS
Coal has been a support for the economy in both developed and developing countries, but
there are still over 1.2 billion people in the world who live without adequate electricity, which
is vital for basic needs43. Electrification is a critical element in the development of societies;
the ability to provide reliable electricity has far-reaching effects on economic and social
development. Electrification leads to advancements in public health, education,
transportation, communications, manufacturing and trade. In some places, access to
electricity is a fundamental social right, and yet the demand for electricity continues to
outstrip some regions' ability to supply it because of a lack of fuels, transmission, or
infrastructure.44
In many cases, achieving electrification would simply not be possible without coal-fuelled
power plants. Its role in the electricity system is an important one in ending electricity
poverty for billions of people and contributing to economic development.
For example, in South Africa, coal accounts for over 70% of the country's primary energy
consumption, more than 80% electricity generation and 30% liquid fuels45. This has aided
the development in infrastructure, industrialisation, and the economy as a whole. Medupi
and Kusile, the two new power stations under construction will be South Africa's first
supercritical power plants with operating efficiencies of 40% and equipped with flue gas
desulphurisation (FGD) installation. The first unit (800 MW) of the 4,800 MW Medupi coal-
fired power station was synchronised to the grid in March 2015. The first unit of the 4,800
MW Kusile coal-fired power station is expected to be synchronised during the first half of
2017.
The World Bank estimates that in the last three decades 600 million people have been lifted
out of poverty, almost all of whom were in China. Remove China from the mix and poverty
levels in the rest of the world have barely improved. The link between access to affordable
power from coal, economic growth and prosperity is clear. In China close to 99% of the
population is connected to the grid 46. Advanced boilers and state-of-the-art emission control
technology are moving to the forefront in order to tackle China's severe air quality challenge
and rapidly growing need for electricity.
Coal also plays a significant role in global steel production. According to recent statistics
issued by the World Steel Association, there was an increase in global steel production in
2014 up to 1665 million tonnes, which was a 16.2% increase from 2010 values47. Coking 43 IEA (2015) World Energy Outlook Electricity access database 44 Coal Industry Advisory Board to the IEA, The Socioeconomic Impacts of Advanced Technology Coal-Fuelled Power Stations, Paris 2015 45 Mutemi, A. (2013). MUI Coal mines: A blessing or a curse? Socioeconomic and environmental intricacies. University of Nairobi. 46 World Coal Asssociation, http://www.worldcoal.org/sustainable-societies/improving-access-energy 47 https://www.worldsteel.org/dms/internetDocumentList/bookshop/2015/World-Steel-in-Figures-2015/document/World%20Steel%20in%20Figures%202015.pdf p.7
WORLD ENERGY COUNCIL | WORLD ENERGY RESOURCES 2016
35
coal is an essential element in blast furnace steel production, making up 70% of total steel
production (the remainder is produced from electric arc furnaces using scrap steel).
Steel is an essential material for modern life. Manufacturing steel delivers the goods and
services that our societies need – healthcare, telecommunications, improved agricultural
practices, better transport networks and access to reliable and affordable energy. Steel is a
critical component in the construction of transport infrastructure and high energy efficiency
residential housing and commercial buildings.
China is by far the world’s largest steel producer followed by Japan, the United States,
India and Russia. There has been a significant shift towards China in global steel markets
over the past decade. China’s share of global production increased from just over 15% in
2000 to more than 49% in 201448.
However, other developing economies in Latin America, Asia, Africa and the Indian sub-
continent, where steel will be vital in improving economic and social conditions, are also
expected to see significant increases in steel production. In these regions, according to the
World Steel Association, more than 60% of steel consumption will be used to create new
infrastructure. With world steel production expected to continue to grow, the outlook for the
coking coal sector will also be strong.
There are socio-economic benefits and concerns with regards to managing coal resource.
Firstly, one can look at the benefit of coal mining in rural and remote areas where transport
infrastructural development becomes the norm since roads or rail needs to be present for
the transfer of coal. The impact of coal on infrastructure development is more noticeable in
developing nations due to the absence of pre-existing infrastructure. The rail line used to
transport coal can also be utilised by a variety of industries. The investment in infrastructure
caused by the energy industry helps to foster economic development. Also, the local
population will benefit since employment is provided and hence, other businesses will begin
to prosper owing to the increase in market transactions and needs.
On the other hand, concerns can also be seen in that the natural topography of land close
to the mining area is disrupted and disfigured. In addition, air quality significantly
deteriorates as coal dust particles linger in the atmosphere; however, this is mainly due to
poor emissions control. Another effect of poor management practices is the change that
mining brings to ground water, as the water course is diverted in order for extraction
process to occur49. This often would have an impact on communities that depend on
underground water to sustain their source of income or for survival.
Coal resource developments in several regions do have significant socio-economic impacts
especially for the cities and communities near the project sites. The following looks at these
benefits.
48 https://www.worldsteel.org/dms/internetDocumentList/bookshop/2015/World-Steel-in-Figures-2015/document/World%20Steel%20in%20Figures%202015.pdf p.9 49 Mutemi, A. (2013). MUI Coal mines: A blessing or a curse? Socioeconomic and environmental intricacies. University of Nairobi.

WORLD ENERGY COUNCIL | COAL
36
COMMUNITY IMPACTS FROM TAXES The taxes that come from coal related activities provide significant revenue for the
government. In 2011, the direct contribution from the US mining activity provided over
US$20 billion in tax payments to all tier of the government - federal, state and local50.
In Germany, about US$112 million of tax revenue was collected as a result of the
construction phase of Neurath Units F&G between 2005 and 2011.
China also had tax revenues of about US$19 million and US$65 million annually based on
the on-grid prices for Zhoushan Unit 4 and Ninghai Units 5. For this nation, electricity
consumption is a significant source of tax revenue via a Value Added Tax (VAT) of 17%51.
PUBLIC HEALTH AND ENVIRONMENTAL IMPROVEMENT Cleaner coal technologies can mitigate the present situation by replacing old coal units and
through retrofitting older plants, which will result in emissions reduction. Advanced coal
power plants have better efficiencies and produce fewer emissions than older generation
units. Besides boiler efficiency, new advanced coal units’ employ emissions control
systems that eliminate more than 95% of nitrogen oxide, sulphur dioxide, and particulate
matter. In addition to these air emissions, advanced plants also aid in the reduction of GHG
emissions.
LOWER ELECTRICITY PRICES Economies benefit from lower electricity prices because of reduced energy costs, but this
also increases industrial competitiveness. Nations that enjoy reduced cost in energy can
manufacture goods at lower prices, thus increasing domestic profits and rise in economic
activity.
The efficiencies of modern coal plants have gone beyond 43%, as evidenced by the
Neurath F and G lignite plants commissioned in August 201252. Charles River Associate
(CRA) estimated that if all German coal was converted overnight to state-of-the-art
technology, German power prices would decrease by 6.8% amounting to consumer savings
of about US$2.53 billion annually53. This highlights the negative correlation between
advanced coal technology and lower electricity prices.
50 CIAB (2014). The socio-economic impacts of advanced technology coal-fuelled power stations. 51 https://www.gov.uk/government/publications/exporting-to-china/exporting-to-china 52 https://www.rwe.com/web/cms/mediablob/en/208030/data/12068/3/rwe-power-ag/fuels/kw-neurath-boa-2-3/Neurath-F-and-G-set-new-benchmarks-Article-by-Dr.-Reinhold-Elsen-RWE-Power-and-Matthias-Fleischmann-Alstom-published-in-Modern-Power-Systems-June-2008.pdf 53 CIAB (2014). The socio-economic impacts of advanced technology coal-fuelled power stations
WORLD ENERGY COUNCIL | WORLD ENERGY RESOURCES 2016
37
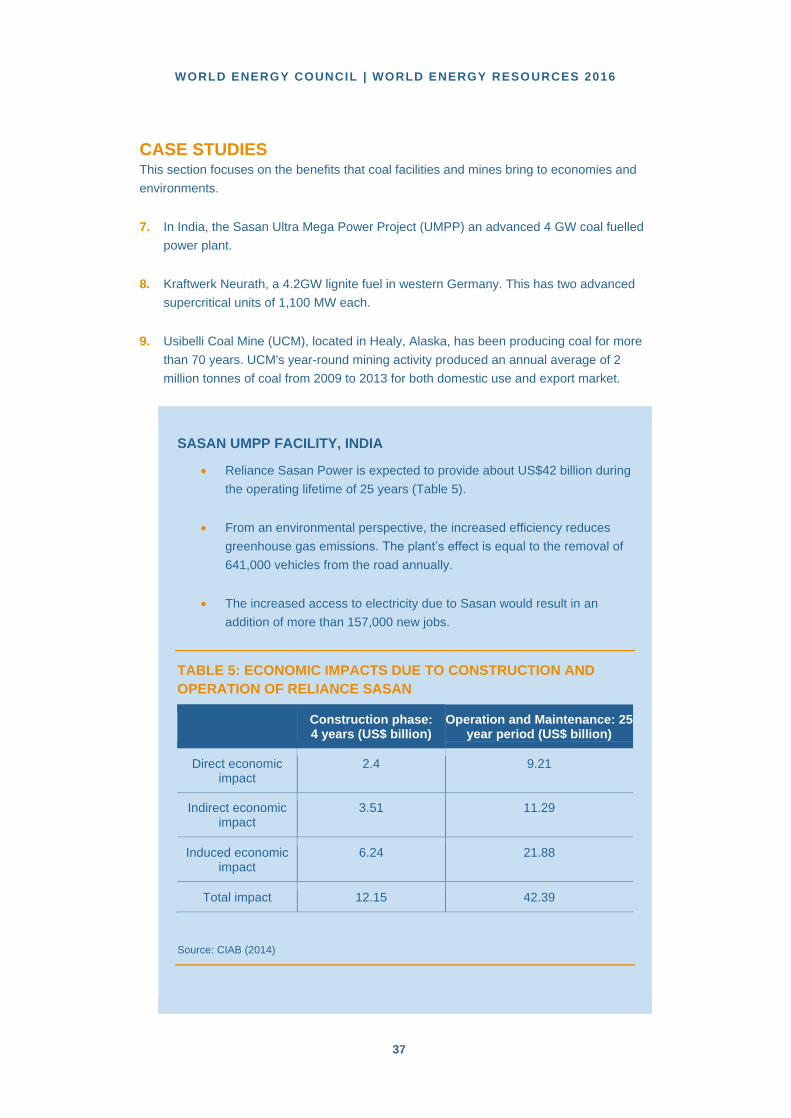
CASE STUDIES This section focuses on the benefits that coal facilities and mines bring to economies and
environments.
7. In India, the Sasan Ultra Mega Power Project (UMPP) an advanced 4 GW coal fuelled
power plant.
8. Kraftwerk Neurath, a 4.2GW lignite fuel in western Germany. This has two advanced
supercritical units of 1,100 MW each.
9. Usibelli Coal Mine (UCM), located in Healy, Alaska, has been producing coal for more
than 70 years. UCM's year-round mining activity produced an annual average of 2
million tonnes of coal from 2009 to 2013 for both domestic use and export market.
SASAN UMPP FACILITY, INDIA
Reliance Sasan Power is expected to provide about US$42 billion during
the operating lifetime of 25 years (Table 5).
From an environmental perspective, the increased efficiency reduces
greenhouse gas emissions. The plant’s effect is equal to the removal of
641,000 vehicles from the road annually.
The increased access to electricity due to Sasan would result in an
addition of more than 157,000 new jobs.
TABLE 5: ECONOMIC IMPACTS DUE TO CONSTRUCTION AND
OPERATION OF RELIANCE SASAN
Construction phase: 4 years (US$ billion)
Operation and Maintenance: 25 year period (US$ billion)
Direct economic impact
2.4 9.21
Indirect economic impact
3.51 11.29
Induced economic impact
6.24 21.88
Total impact 12.15 42.39
Source: CIAB (2014)
WORLD ENERGY COUNCIL | COAL
38
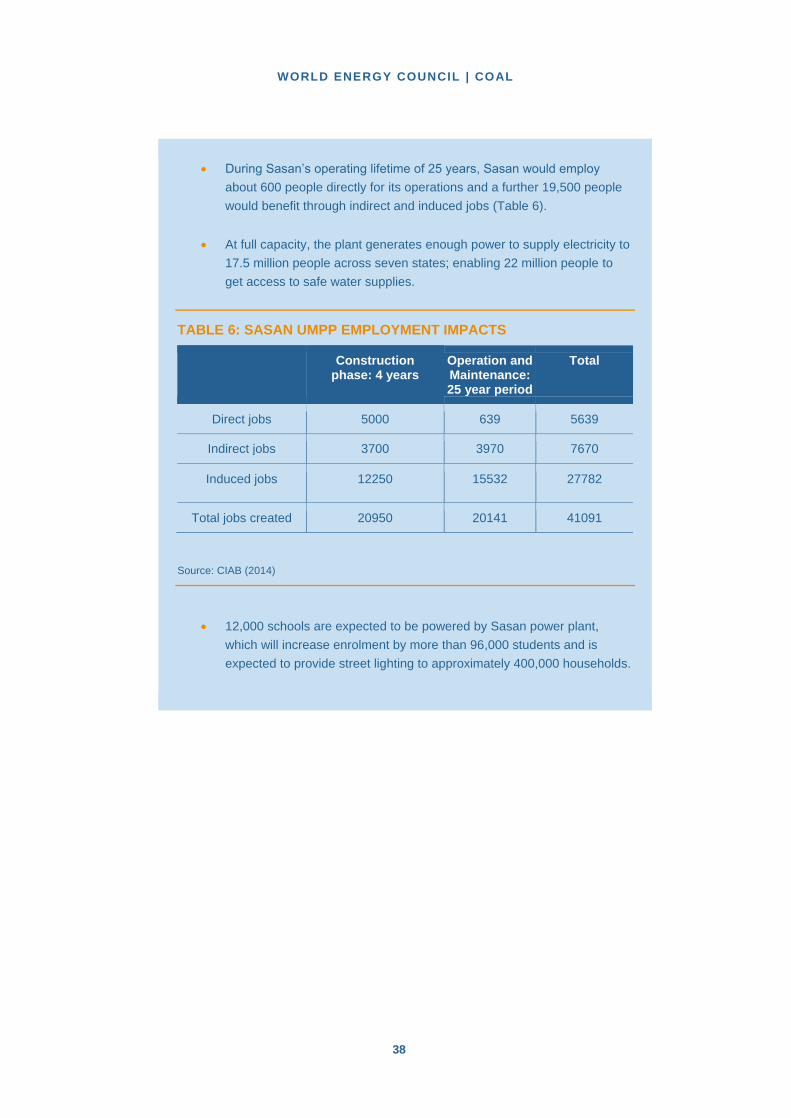
During Sasan’s operating lifetime of 25 years, Sasan would employ
about 600 people directly for its operations and a further 19,500 people
would benefit through indirect and induced jobs (Table 6).
At full capacity, the plant generates enough power to supply electricity to
17.5 million people across seven states; enabling 22 million people to
get access to safe water supplies.
TABLE 6: SASAN UMPP EMPLOYMENT IMPACTS
Construction phase: 4 years
Operation and Maintenance: 25 year period
Total
Direct jobs 5000 639 5639
Indirect jobs 3700 3970 7670
Induced jobs 12250 15532 27782
Total jobs created 20950 20141 41091
Source: CIAB (2014)
12,000 schools are expected to be powered by Sasan power plant,
which will increase enrolment by more than 96,000 students and is
expected to provide street lighting to approximately 400,000 households.
WORLD ENERGY COUNCIL | WORLD ENERGY RESOURCES 2016
39
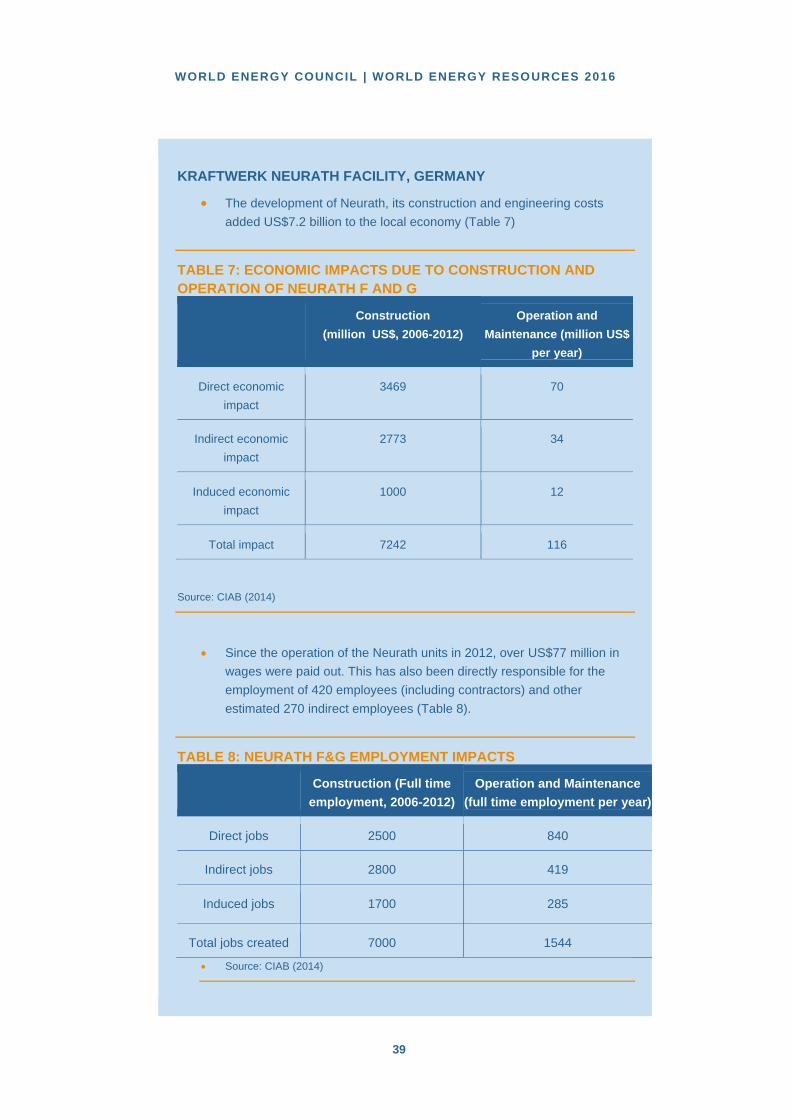
KRAFTWERK NEURATH FACILITY, GERMANY
The development of Neurath, its construction and engineering costs
added US$7.2 billion to the local economy (Table 7)
TABLE 7: ECONOMIC IMPACTS DUE TO CONSTRUCTION AND
OPERATION OF NEURATH F AND G
Construction
(million US$, 2006-2012)
Operation and
Maintenance (million US$
per year)
Direct economic
impact
3469 70
Indirect economic
impact
2773 34
Induced economic
impact
1000 12
Total impact 7242 116
Source: CIAB (2014)
Since the operation of the Neurath units in 2012, over US$77 million in
wages were paid out. This has also been directly responsible for the
employment of 420 employees (including contractors) and other
estimated 270 indirect employees (Table 8).
TABLE 8: NEURATH F&G EMPLOYMENT IMPACTS
Construction (Full time
employment, 2006-2012)
Operation and Maintenance
(full time employment per year)
Direct jobs 2500 840
Indirect jobs 2800 419
Induced jobs 1700 285
Total jobs created 7000 1544
Source: CIAB (2014)
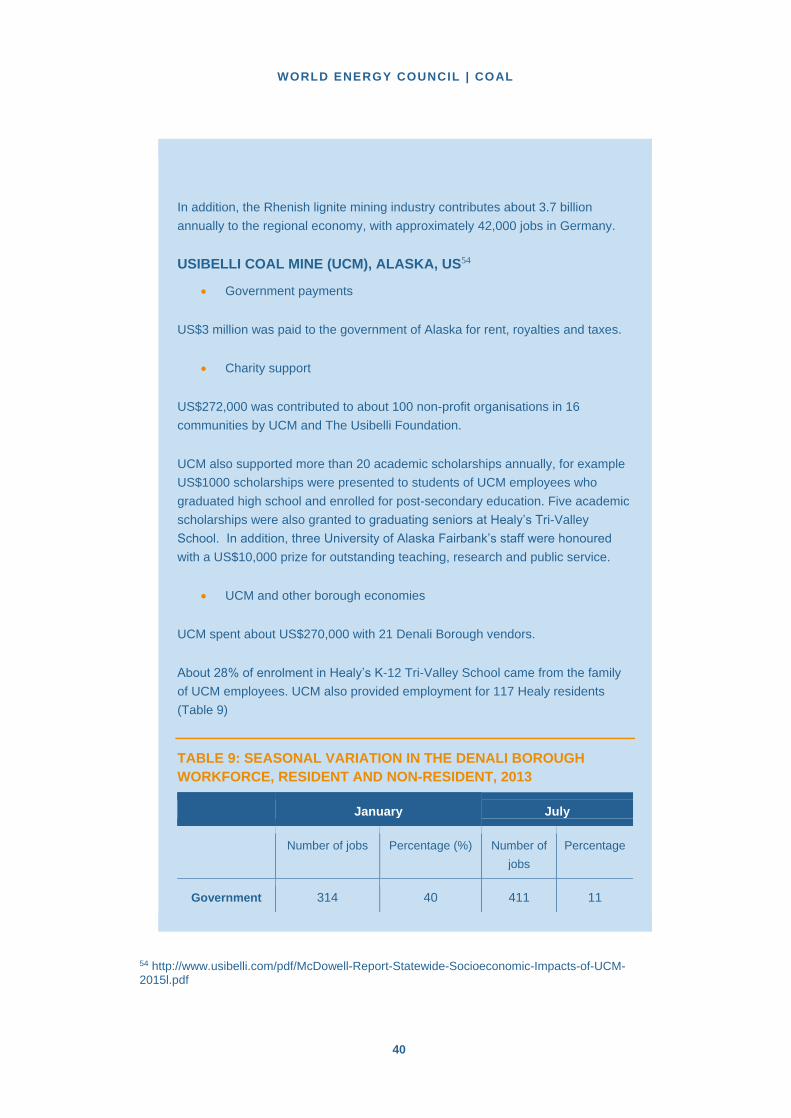
WORLD ENERGY COUNCIL | COAL
40
In addition, the Rhenish lignite mining industry contributes about 3.7 billion
annually to the regional economy, with approximately 42,000 jobs in Germany.
USIBELLI COAL MINE (UCM), ALASKA, US54
Government payments
US$3 million was paid to the government of Alaska for rent, royalties and taxes.
Charity support
US$272,000 was contributed to about 100 non-profit organisations in 16
communities by UCM and The Usibelli Foundation.
UCM also supported more than 20 academic scholarships annually, for example
US$1000 scholarships were presented to students of UCM employees who
graduated high school and enrolled for post-secondary education. Five academic
scholarships were also granted to graduating seniors at Healy’s Tri-Valley
School. In addition, three University of Alaska Fairbank’s staff were honoured
with a US$10,000 prize for outstanding teaching, research and public service.
UCM and other borough economies
UCM spent about US$270,000 with 21 Denali Borough vendors.
About 28% of enrolment in Healy’s K-12 Tri-Valley School came from the family
of UCM employees. UCM also provided employment for 117 Healy residents
(Table 9)
TABLE 9: SEASONAL VARIATION IN THE DENALI BOROUGH
WORKFORCE, RESIDENT AND NON-RESIDENT, 2013
January July
Number of jobs Percentage (%) Number of
jobs
Percentage
Government 314 40 411 11
54 http://www.usibelli.com/pdf/McDowell-Report-Statewide-Socioeconomic-Impacts-of-UCM-2015l.pdf
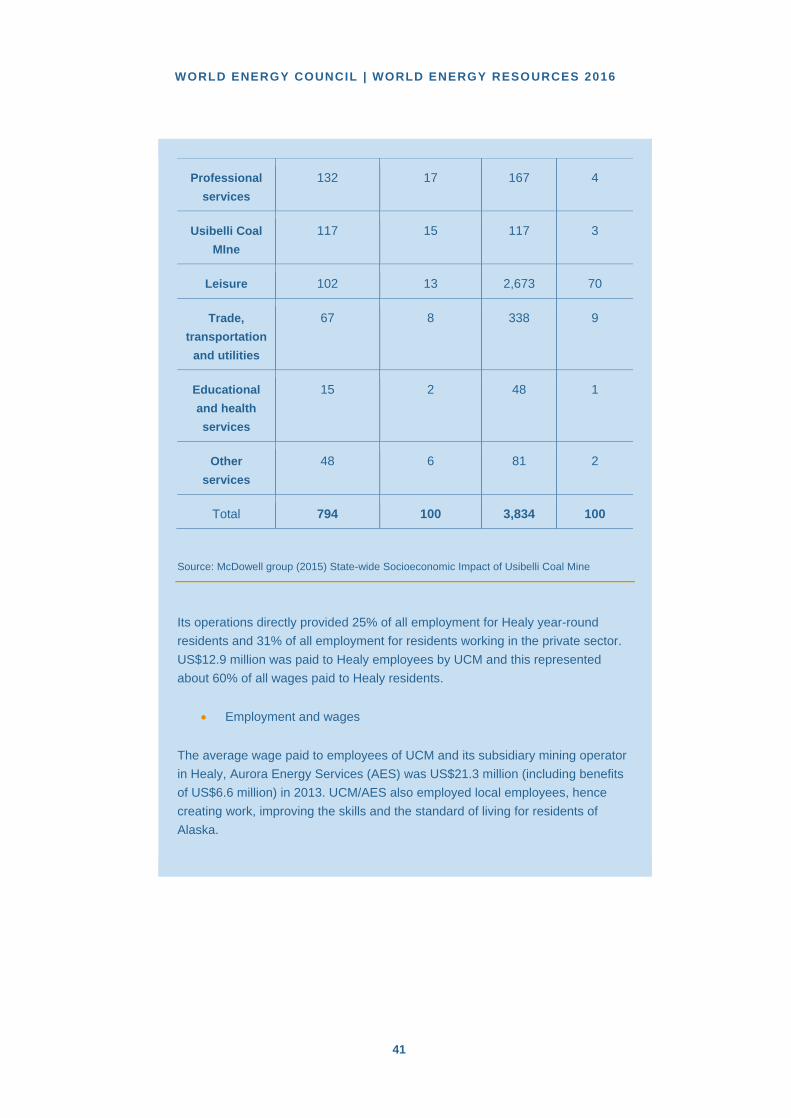
WORLD ENERGY COUNCIL | WORLD ENERGY RESOURCES 2016
41
Professional
services
132 17 167 4
Usibelli Coal
MIne
117 15 117 3
Leisure 102 13 2,673 70
Trade,
transportation
and utilities
67 8 338 9
Educational
and health
services
15 2 48 1
Other
services
48 6 81 2
Total 794 100 3,834 100
Source: McDowell group (2015) State-wide Socioeconomic Impact of Usibelli Coal Mine
Its operations directly provided 25% of all employment for Healy year-round
residents and 31% of all employment for residents working in the private sector.
US$12.9 million was paid to Healy employees by UCM and this represented
about 60% of all wages paid to Healy residents.
Employment and wages
The average wage paid to employees of UCM and its subsidiary mining operator
in Healy, Aurora Energy Services (AES) was US$21.3 million (including benefits
of US$6.6 million) in 2013. UCM/AES also employed local employees, hence
creating work, improving the skills and the standard of living for residents of
Alaska.

WORLD ENERGY COUNCIL | COAL
42
4. ENVIRONMENTAL IMPACTS
Our consumption of energy can have a significant impact on the environment. Minimising
the negative impacts of human activities on the natural environment, including energy use
is a key global priority. The coal industry works to ensure environmental impacts are
minimised.
COAL MINING & THE ENVIRONMENT Coal mining, in particular surface mining, requires large areas of land to be temporarily
disturbed. This raises a number of environmental challenges, including soil erosion, dust,
noise and water pollution, and impacts on local biodiversity. Steps are taken in modern
mining operations to minimise these impacts. Good planning and environmental
management minimises the impact of mining on the environment and helps to preserve
biodiversity.
Land disturbance
In best practice, studies of the immediate environment are carried out several years before
a coal mine opens in order to define the existing conditions and to identify sensitivities and
potential problems. The studies look at the impact of mining on surface and ground water,
soils, local land use, and native vegetation and wildlife populations. Computer simulations
can be undertaken to model impacts on the local environment. The findings are then
reviewed as part of the process leading to the award of a mining permit by the relevant
government authorities.
Mine subsidence
A consideration that can be associated with underground coal mining is subsidence,
whereby the ground level lowers as a result of coal having been mined beneath. Any land
use activity that could place public or private property or valuable landscapes at risk is
clearly a concern, as shown in the Witbank-Middelburg case study where poor
management practices were undertaken. A thorough understanding of subsistence patterns
in a particular region allows the effects of underground mining on the surface to be
quantified. This ensures the safe, maximum recovery of a coal resource, while providing
protection to other land uses.
WITBANK-MIDDELBURG AREA, SOUTH AFRICA
Close to the Middelburg Steam Mine is Ligazi, a settlement area in which the
land trembles and sinks. Residents found the 126 sinkholes and the trembling
worrying. The holes appeared suddenly in homes and sometimes it was quite
WORLD ENERGY COUNCIL | WORLD ENERGY RESOURCES 2016
43
laborious for residents to keep filling the holes. Objects sometimes fell into the
earth and residents saw these sinkholes as a hazard to the children or night
travellers. This was clearly as a result of poor management practices.
Source: Victor Munnik (2010) The social and environmental consequences of coal mining in
South Africa.
Dust & noise pollution
During mining operations, the impact of air and noise pollution on workers and local
communities can be minimised by modern mine planning techniques and specialised
equipment. Dust at mining operations can be caused by trucks being driven on unsealed
roads, coal crushing operations, drilling operations and wind blowing over areas disturbed
by mining. Dust levels can be controlled by spraying water on roads, stockpiles and
conveyors. However, this should be guided by strong water management practices in order
to increase water efficiency and reduce the strain on water scarcity in certain regions. Other
steps can also be taken, including fitting drills with dust collection systems and purchasing
additional land surrounding the mine to act as a buffer zone between the mine and its
neighbours. Trees planted in these buffer zones can also minimise the visual impact of
mining operations on local communities.
Noise can be controlled through the careful selection of equipment and insulation and
sound enclosures around machinery. In best practice, each site has noise and vibration
monitoring equipment installed, so that noise levels can be measured to ensure the mine is
within specified limits.
Rehabilitation
Coal mining is only a temporary use of land, so it is vital that rehabilitation of land takes
place once mining operations have ceased. In best practice, a detailed rehabilitation or
reclamation plan is designed and approved for each coal mine, covering the period from the
start of operations until well after mining has finished. Land reclamation is an integral part of
modern mining operations around the world and the cost of rehabilitating the land once
mining has ceased is factored into the mine’s operating costs.
Reclaimed land can have many uses, including agriculture, forestry, wildlife habitation and
recreation.
Using methane from coal mines
Methane (CH4) is a gas formed as part of the process of coal formation. It is released from
the coal seam and the surrounding disturbed strata during mining operations.
Methane is highly explosive and has to be drained during mining operations to keep
working conditions safe. At active underground mines, large-scale ventilation systems
move massive quantities of air through the mine, keeping the mine safe but also releasing
methane into the atmosphere at very low concentrations. Some active and abandoned

WORLD ENERGY COUNCIL | COAL
44
mines produce methane from degasification systems, also known as gas drainage systems,
which use wells to recover methane.
As well as improving safety at coal mines, the use of coal mine methane improves the
environmental performance of a coal mining operation and can have a commercial benefit.
Coal mine methane has a variety of uses, including onsite or off-site electricity production
(Gaohe coal mine case study), use in industrial processes and fuel for co-firing boilers.
GAOHE COAL MINE
Lu’an Group uses 99% of methane gas from the Gaohe coal mine in north
China’s Shanxi Province to operate a generator with a capacity of 30 MW. This
new technology converts methane concentrations lower than 10%, which
constitutes about 80% of the gas released during mining. Gas having a
concentration level of more than 10% is transformed to methyl alcohol and
utilised as fuel for internal combustion engines. Low concentration coal mine
methane (CMM) has contributed majorly to China’s environmental pollution. It is
estimated that coal mines produces more than 10 billion m3/year of gas, leading
to a massive GHG emissions. This is likely to help reduce 1.4 million tonnes of
GHGs and produce 200 million kWh/year of electricity. This facility installed at
Gaohe coal mine has attracted a number of interests from coal mining firms, as
the industry develops emissions reduction initiatives in order to control carbon
emissions.
Source: World Coal Association
COAL USE & THE ENVIRONMENT Global consumption of energy raises a number of environmental considerations. For coal,
the release of pollutants, such as oxides of sulphur and nitrogen (SOx and NOx), particulate
matter and trace elements, such as mercury, have been a challenge. However,
technologies have been developed and deployed to minimise these emissions.
The release of CO2 into the atmosphere from human activities has been linked to global
warming. The combustion of fossil fuels is a major source of anthropogenic emissions
worldwide. While the use of oil in the transportation sector is the major source of energy-
related CO2 emissions, coal is also a significant source. As a result, the industry has been
researching and developing technological options to meet this new environmental
challenge.
Technological response
Clean coal technologies (CCTs) are a range of technological options which improve the
environmental performance of coal. These technologies reduce emissions, reduce waste,
and increase the amount of energy gained from each tonne of coal (Emissions reduction
case study). Different technologies suit different types of coal and tackle different

WORLD ENERGY COUNCIL | WORLD ENERGY RESOURCES 2016
45
environmental problems. The choice of technologies can also depend on a country’s level
of economic development.
EMISSIONS REDUCTION INITIATIVES
Alstom saved 207 million tonnes of CO2 from being emitted yearly for nine years
(2002 – 2011). This was achieved by constructing new highly efficient plants and
retrofitting new technology to existing plants. In Germany, the Rheinhafen
Dampfkraftwerk 8 (RDK 8) coal-fired power station in Karlsruhe is one of the first
new generation units adopting the ultra-supercritical technology. The 912 MW
plant achieves 46% efficiency and even more when its district heating capabilities
are taking into consideration (58% efficiency). RDK 8 emits 740gCO2/kWh since
its commissioning in 2012. A 1980s generation coal-fired power station emits
1200gCO2/kWh which is about 40% improvement.
Source: World Coal Association
Steps have been taken to significantly reduce SOx and NOx emissions from coal-fired
power stations. Certain approaches also have the additional benefit of reducing other
emissions, such as mercury. The activated carbon injection (ACI) technology has
demonstrated mercury removal rates of 70% to 90%. However, there is a huge difference in
capital cost when considering different control technologies (ACI systems costs US$5-
US$15/kW while fabric filters and carbon injection costs US$120 – US$150/kW).55
Sulphur is present in coal as an impurity and reacts with air when coal is burned to form
SOx. In contrast, NOx is formed when any fossil fuel is burned. In many circumstances, the
use of low sulphur coal is the most economical way to control sulphur dioxide. An
alternative approach has been the development of flue gas desulphurisation (FGD)
systems for use in coal fired power stations (unpolluted air case study).
UNPOLLUTED AIR
In South Africa, Kusile and Medupi power plants utilises supercritical technology
with the incorporation of Alstom’s wet flue gas desulphurisation system which
removes 90% of the SOX generated in the boilers. In sub-Saharan Africa, these
are the most environmentally friendly plants and also the world’s largest air-
cooled coal power plants having six 800 MW turbines each. The use of air
cooling is significant in water stressed areas which increases the local
environmental sustainability.
55 Natural Defence Council (2011): Evaluating mercury control technologies for coal power plants.
WORLD ENERGY COUNCIL | COAL
46
Source: World Coal Association
Oxides of nitrogen can contribute to the development of smog as well as acid rain. NOx
emissions from coal combustion can be reduced by the use of ‘low NOx’ burners, improving
burner design and applying technologies that treat NOx in the exhaust gas stream.
Selective catalytic reduction (SCR) and selective non-catalytic reduction (SNCR)
technologies can reduce NOx emissions by around 80-90% by treating the NOx post-
combustion.
Fluidised bed combustion (FBC) is a high efficiency, advanced technological approach to
reducing both NOx and SOx emissions. FBC is able to achieve reductions of 90% or more.
REDUCING CARBON DIOXIDE EMISSIONS A major environmental challenge facing the world today is the risk of global warming. The
IEA advocates a two-step process to reducing emissions from coal: firstly, by improving
power plant thermal efficiency while providing meaningful reductions in CO2 emissions and
secondly, by advancing CCS technologies to commercial scale.
Energy efficiency
Improving efficiency levels increases the amount of energy that can be extracted from a
single unit of coal. Increases in the efficiency of electricity generation are essential in
tackling climate change. A single percentage point improvement in the efficiency of a
conventional pulverised coal combustion plant results in a 2-3% reduction in CO2
emissions. Highly efficient modern supercritical and ultra-supercritical coal plants emit
almost 40% less CO2 than subcritical plants.
Efficiency improvements include the most cost effective and shortest lead time actions for
reducing emissions from coal-fired electricity. This is particularly the case in developing
countries and economies in transition where existing plant efficiencies are generally lower
and coal use in electricity generation is increasing.
The average global efficiency of coal-fired plants is currently 28% compared to 45% for the
most efficient plants. A programme of repowering existing coal-fired plants to improve their
efficiency, coupled with the newer and more efficient plants being built, will generate
significant CO2 reductions of around 1.8 Gt annually. Although the deployment of new,
highly efficient plants is subject to local constraints, such as ambient environmental
conditions and coal quality, deploying the most efficient plant possible is critical to enable
these plants to be retrofitted with carbon capture technology in the future.
Improving the efficiency of the oldest and most inefficient coal-fired plants would reduce
CO2 emissions from coal use by almost 25%, representing a 6% reduction in global CO2
emissions. By way of comparison, under the Kyoto Protocol, parties have committed to
reduce their emissions by “at least 5%”. These emission reductions can be achieved by the
replacement of plants that are < 300 MW capacity and older than 25 years, with larger and

WORLD ENERGY COUNCIL | WORLD ENERGY RESOURCES 2016
47
markedly more efficient plants and, where technically and economically appropriate, the
replacement or repowering of larger inefficient plants with high-efficiency plants of >40%.
The role of increased efficiency as a means to CO2 mitigation is often overlooked in
discussions about climate and energy. As the IEA notes “If the average efficiency of all
coal-fired power plants were to be five percentage points higher than in the New Policies
Scenario in 2035, such an accelerated move away from the least efficient combustion
technologies would lower CO2 emissions from the power sector by 8% and reduce local air
pollution”. It is also important to note that the cost of avoided emissions from more efficient
coal-based generation can be very low, requiring relatively small additional investments.
This is especially the case when compared to the cost of avoided emissions through
deployment of renewables and nuclear.
WATER USAGE A good start for efficient water consumption is by improving the washing rate of thermal
coal56. This reduces net water consumption and removes ash which results in less waste
and improves thermal efficiencies. It is estimated that if all thermal coal was washed and
10% of ash removed, overall water consumption would fall by 6-16%. However, in China
the washing rate is below 40%57 and this rate may be similar or lower in India where its coal
is mainly low-grade, with a high ash content of around 40%. In China, steps are in place in
order to conserve water in some regions, such as the requirement for new coal-fired power
plants to have closed-cycle and air-cooling loops in the face of water scarcity. However, this
cooling technology can reduce production efficiency by 3-10%, thus the need for more coal
per unit of energy produced58.
THERMOSYPHON DRY COOLING
Electric Power Research Institute (EPRI) is moving fast with the scale-up of
thermosyphon cooling (TSC) by integrating this air-cooling technology with an
experimental cooling tower at the Water Research Centre at Georgia Power’s
Plant Bowen. This is a dry cooling technology that transfers heat from hot
condenser and returns water to a refrigerant and then to the ambient air without
water evaporation. In 2015 a commercial demonstration of a 15 MW TSC dry
cooling operation will commence. In retrofit applications with TSC, the annual
water usage could reduce to about 75% with less energy penalty than present
air-cooled technologies.
Source: EPRI (2014) Technology Innovation Prospectus
Water shortages are also experienced in developed worlds, such as the US where 52% of
US coal-fired power plant utilises once-through cooling technology59. Due to extreme water 56 Carbon Tracker (2014) The Great Coal Gap: China’s energy policies and the financial implications for thermal coal, ibid. 57 ibid. 56 58 http://www.theguardian.com/sustainable-business/china-conflict-coal-fired-plants-water# 59 EIA (2014) Many newer plants have cooling systems that reuse water.

WORLD ENERGY COUNCIL | COAL
48
shortages in western US many states could follow the footsteps of California. The once-
through technology was not favoured in this state because 2010 witnessed the California
State Water Resources Control Board approve a measure to ban this technology. This will
force 19 plants to retrofit their cooling systems between 2010 and 2024, thus encouraging
better water-efficient technologies60. A solution could be to incorporate dry cooling which
could drastically reduce the amount of water use (Thermosyphon Dry Cooling case study).
At the power generation end of the coal-energy cycle, new technologies are also reducing
coal’s water footprint. As with other forms of thermal power generation, water in coal-fired
plants is used in different ways depending on the type of cooling technology employed.
Many technologies do not actually consume significant amounts of water but it is important
to make sure that the extraction and return process minimises impacts on water
temperature and wildlife.
Eskom, South Africa’s largest electricity provider is a leader in dry cooling technology. This
is crucial because South Africa is a water-stressed country. Eskom is currently constructing
two new dry-cooled plants at Medupi and Kusile that are incorporating lessons learned from
their older plants that already consume approximately 19 times less water than an
equivalent wet-cooled power plant.
WASTE GENERATION The combustion of coal generates waste consisting primarily of non-combustible mineral
matter along with a small amount of unreacted carbon. The production of this waste can be
minimised by coal cleaning prior to combustion. Waste can be further minimised through
the use of high efficiency coal combustion technologies.
There is increasing awareness of the opportunities to reprocess power station waste into
valuable materials for use primarily in the construction and civil engineering industry. In the
year 2009-2011, slightly above half (53%) of the coal combustible products (CCPs) were
utilised while the rest were transferred to storage or disposal sites (Table 10).
60 California’s Clean Energy Future (2011) Once Through Cooling Phase-Out

WORLD ENERGY COUNCIL | WORLD ENERGY RESOURCES 2016
49
TABLE 10: ANNUAL CCPS PRODUCTION, UTILISATION RATE BY
COUNTRIES 2010
Country/Region CCPs Production
(Mt)
CCPs Utilisation
(Mt)
Utilisation rate
%
Australia 13.1 6.0 45.8%
Canada 6.8 2.3 33.8%
China* 395.0 265 67.1%
Europe (EU15) 52.6 47.8 90.9%
India* 105.0 14.5 13.8%
Japan 11.1 10.7 96.4%
Middle East & Africa 32.2 3.4 10.6%
USA 118.0 49.7 42.1%
Other Asia* 16.7 11.1 66.5%
Russia 26.6 5.0 18.8%
Total/s 777.1 415.5 53.5%
Source: Heidrich, C. et al. (2013)61 (* non-members of World Wide Coal Combustion Products Networks)
The fly ash, FGD gypsum, bottom ash and boiler slag generated from coal combustion are
utilised in a variety of ways. A common global application is the substitution of Portland
cement in concrete with fly ash, which improves performance of concrete because of its
decrease in permeability and high durability62. In developed countries, FGD gypsum
utilisation has progressed quite well and these are also adopted by the construction
industries63.
61 Heidrich, C., Feuerborn, H., Weir, A. (2013) Coal Combustion Products: a global perspective. 62 World Coal Association (2015) 63 Jiabin Fu (2010) Challenges to increased use of coal combustion products in China.
WORLD ENERGY COUNCIL | COAL
50
5. OUTLOOK
Thermal coal has been available for over nine decades, but this resource has been
suffering from a supply surplus for years. It is no surprise that the price of thermal coal has
reduced by half since 2011.
Countries need to meet their electricity needs and this will be possible with low-cost
electricity, which in turn points to the role coal has played and what it would play in the
future. Coal is abundant, accessible, secure, reliable and affordable, and has a substantial
existing infrastructure. However, despite these attributes the leverage for coal seems
uncertain in light of growing CO2 emission levels and increasing competitiveness of non-
coal power sources in China, the US and the EU.
CHINA China, the key market driver experienced an unexpected decline of 2.7% in 2014 (Figure
14).
FIGURE 14: CHINA COAL USE TRENDS
Source: China National Bureau of Statistic, BP Statistical Review (2015)
Essentially, not only is the decline due to a fall in demand but also on tougher regulations
that do not favour low quality coal imports from some producers like Indonesia and
Australia. The reduction in coal importation would favour China as larger volumes of coal
WORLD ENERGY COUNCIL | WORLD ENERGY RESOURCES 2016
51
exportation are expected due to the domestic coal oversupply and the export tax reduction
from 10% to 3% which was effective since January 201564.
China continues to tackle its severe air pollution and it is likely that the share of primary
energy consumption from renewables such as solar and wind will continue to increase up to
15% in 202065. It is important to note that coal will not be completely phased out because it
would be needed as base load to secure supply. However, China will target to reduce its
consumption from coal to below 62% by 202066. In 2014, coal had less than 10% of growth
capacity, this means there is growth, but in modest level (Figure 15).
FIGURE 15: 2014 GROWTH OF POWER GENERATION CAPACITY IN CHINA
Source: National Bureau of Statistics of China
China added 39 GW of coal-fired capacity in 2014 which was 8.3% increase from the
previous year67. Only about 60% of the new plants are built using ultra supercritical
technology which produces efficiency as high as 44%, meaning CO2 emissions can be cut
by more than a third compared to plants with efficiency between 27% - 36%68. It is likely to
see this trend progressing in the future as under the IEAs New Policies Scenario, China is
seen to cumulatively have 383 GW of coal based power generation between 2014-2015, as
the usage of coal as an enabler for economic growth persists (Figure 16).
64 China coal Resource, http://en.sxcoal.com/111509/NewsShow.html 65 Climate News Network (2015) China’s investment in renewables soars by a third. 66 South China Morning Posts (2015) China aims to reduce coal reliance in next five-year plan. 67 Institute for Energy Research 68 Office of Chief Economist (2015) Coal in India
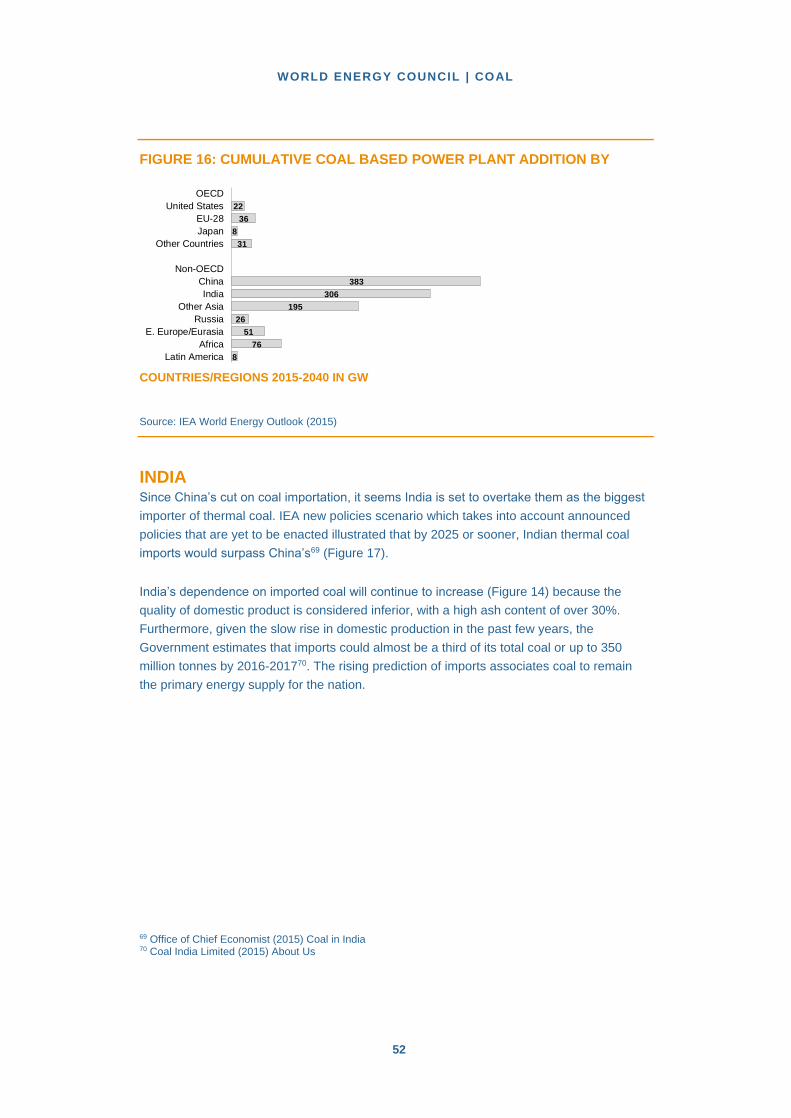
WORLD ENERGY COUNCIL | COAL
52
FIGURE 16: CUMULATIVE COAL BASED POWER PLANT ADDITION BY
COUNTRIES/REGIONS 2015-2040 IN GW
Source: IEA World Energy Outlook (2015)
INDIA Since China’s cut on coal importation, it seems India is set to overtake them as the biggest
importer of thermal coal. IEA new policies scenario which takes into account announced
policies that are yet to be enacted illustrated that by 2025 or sooner, Indian thermal coal
imports would surpass China’s69 (Figure 17).
India’s dependence on imported coal will continue to increase (Figure 14) because the
quality of domestic product is considered inferior, with a high ash content of over 30%.
Furthermore, given the slow rise in domestic production in the past few years, the
Government estimates that imports could almost be a third of its total coal or up to 350
million tonnes by 2016-201770. The rising prediction of imports associates coal to remain
the primary energy supply for the nation.
69 Office of Chief Economist (2015) Coal in India 70 Coal India Limited (2015) About Us
8
76
51
26
195
306
383
31
8
36
22
Latin America
Africa
E. Europe/Eurasia
Russia
Other Asia
India
China
Non-OECD
Other Countries
Japan
EU-28
United States
OECD

WORLD ENERGY COUNCIL | WORLD ENERGY RESOURCES 2016
53
FIGURE 17: WORLD COAL IMPORTS, NEW POLICIES SCENARIO
Source: Office of the Chief Economist, Australian Government (2015) Coal in India Report
FIGURE 18: INDIA'S GROWING COAL IMPORTS
Source: Central Statistical Office, India
India like most nations is diversifying its generation sector, however coal is projected to
remain in dominance and also coal-fired power is projected to more than double with an
increasing rate of 3.3% per year, from 840 TWh to about 2,100 TWh before 202571. 71 Coal India Limited (2015) About Us
0
20
40
60
80
100
120
140
160
180
200
6
200
7
200
8
200
9
201
0
201
1
201
2
201
3
201
4
Millio
n t
on
nes
Year

WORLD ENERGY COUNCIL | COAL
54
Currently there are plans for coal in this nation’s generation capacity as a majority of new
plants under construction are mainly coal-fired (Figure 19).
Over the past decade about 90% of India’s coal-fired capacity was based on subcritical
technology. With global talks on CO2 emission mitigations, the proportion of subcritical coal-
fired technology commissioned in the next five years will decrease. In the next five years it
is expected that supercritical technology will be 36% of total coal-fired plants72.
FIGURE 19: INDIA'S ELECTRICITY GENERATION CAPACITY UNDER DEVELOPMENT > 50MW
Source: Coal in India 2015 Report, Office of the Chief Economist, Australian Government
Overall, electricity generation from coal is expected to grow with increasing focus on
improved coal-fired power plant efficiency because the cost competitiveness of coal is
driven primarily by low coal prices and limited availability of alternative fuels.
SOUTHEAST ASIA In the New Policies Scenarios, the total primary energy demand in Southeast Asia remains
heavily reliant on fossil fuels with their share of 74% in 2013 expanding to 78% in 2040.
In Southeast Asia the demand for coal is expected to more than triple from 2013 to 2040
growing at an average of 4.6% per year (Table 11). The need to provide electricity to 120 72 Enerdata (2015)

WORLD ENERGY COUNCIL | WORLD ENERGY RESOURCES 2016
55
million people in the region that still lack access all contributes to coal’s expanding role in
the fuel mix, especially in Indonesia, Malaysia, Philippines, Thailand and Vietnam.
TABLE 11: PRIMARY ENERGY DEMAND IN SOUTHEAST ASIA (MTOE)
Fuel Shares
1990 2013 2020 2040 2013 2040
Fossil fuels
131 437 547 838 74% 78%
Coal 13 91 151 309 15% 29%
Oil 89 213 247 309 36% 29%
Gas 30 133 149 220 22% 21%
Source: IEA (2015)
Southeast Asia is one of the regions in the world where coal’s share of the energy mix is
projected to increase. The coal share is to rise in 2020 overtaking natural gas (Figure 20).
This trend is underpinned by the price advantage and relative availability of coal versus gas
in the region.
FIGURE 20: PRIMARY ENERGY DEMAND BY FOSSIL FUEL IN SOUTHEAST
ASIA, 1990-2040
Source: IEA (2015)
0
50
100
150
200
250
300
350
1990 2000 2010 2020 2030 2040 2050
Mto
e Coal
Oil
Gas

WORLD ENERGY COUNCIL | COAL
56
By 2040, Southeast Asia’s total electricity generation will almost triple from 789 TWh in
2013 to 2200 TWh in 2040. Coal use increases its share in power generation from 32% to
50%, while the share of natural gas declines from 44% to 26% (Table 12). Southeast Asia’s
electricity depends largely on fossil fuels, especially coal where countries such as
Indonesia, Malaysia and Thailand intend to expand their use of coal.
TABLE 12: ELECTRICITY GENERATION BY FOSSIL FUELS IN SOUTHEAST
ASIA (TWH)
Shares
1990 2013 2020 2040 2013 2040
Fossil fuels
120 648 925 1699 82% 77%
Coal 28 255 482 1097 32% 50%
Oil 66 45 36 24 6% 1%
Gas 26 349 406 578 44% 26%
Source: IEA (2015)
SOUTH AFRICA More than 85% of South Africa’s electricity is generated from coal and about 90% of the
supply is provided by Eskom, the nation’s electricity public utility73 (Figure 21). In early 2015
the company was forced to implement three stages of load shedding which reduced supply
by up to 4 GW because of years of under investment in new generation capacity and
insufficient maintenance74.
73 Burton, J.& Winkler, H. (2014) South Africa’s planned coal infrastructure expansion: Drivers, dynamics and impacts on greenhouse gas emissions 74 Wood Mackenzie (2015)., South Africa’s power supply crisis

WORLD ENERGY COUNCIL | WORLD ENERGY RESOURCES 2016
57
FIGURE 21: COAL SHARE IN POWER GENERATION IN 2014
Source: IEA, Electricity Information, Paris 2015 (* for Non-OECD-countries numbers for 2013)
There could be a challenge for South Africa’s electrification as the available coal reserve is
expected to be in mass shortage in the 2020s75. With this in light, the government and
major players in the supply chain industry have implemented a plan called “coal roadmap”.
It is expected that provision will be made to supply higher grade coal to the older Central
Basin power stations from the Waterberg and also rail infrastructure are likely to be
available in the early 2020s to facilitate transport of coal to overcome shortfalls in local
utility supply76.
As the nation is struggling to meet its demand as it upgrades aging plants and builds new
generating capacity, including coal-fired power plants such as Medupi Power Station which
will produce 4.8 GW when completed in 201977, it is likely that electricity importation from
neighbouring Mozambique could increase by as much as 40%78. The building of non-coal-
fired new generation capacity is already a challenge, for example the first new nuclear
power stations which are projected to be operational in 2023 are facing severe financial
constraints. However, this will aid in rebalancing the mix of power generation79.
EUROPE The pace of closure in the coal sector is accelerating because of ample supplies of gas and
environmental policies to cut GHG emissions, but this does not mean coal-fired power
generation will completely disappear.
In Germany, its energy policy points to a 2.7 GW capacity reserve for lignite plants which
will pay plant operators to put their power stations on standby and subsequently shut them 75 Christian, S. (2015) Eskom South Africa: A case of planning failure 76 Ibid 75 77 Business Day live (2015) Medupi finally produces first power 78 Bloomberg (2015) Eskom Sees Power Supply from Mozambique up by up to 40% 79 World Nuclear Association (2015) Nuclear Power in South Africa
37
29
29
39
38
41
5
18
48
6
51
42
70
75
81
48
93
3
2
37
25
46
42
19
72
3
34
World
United Kingdom
Japan
South Korea
USA
Ukraine*
Bulgaria*
Germany
Greece
Taiwan*
Tzech Rep.
Indonesia*
Australia
Serbia*
India*
China*
Kazakhstan*
Poland
South Africa*
Hard coal
Lignite
93%
82 %
75 %
73 %
61 %
48 %
48 %
46 %
39 % 40 %
29 %
40 %
41 %
43 %
51 %
42 %
81 %
72 %
29 %
WORLD ENERGY COUNCIL | COAL
58
down after 202080. In the UK’s electricity mix, in 2014, it provided 35.4% of UK’s electricity
generation, but the capacity of UK’s coal-fired stations could fall by 66% by 2021 and
disappear altogether by 2030 with gas, nuclear and renewable power expected to pick up
what’s left81.
As with other hydrocarbons, Russia has a rich supply of coal reserves. According to BP’s
Statistical Review of Energy 2015, Russia had 157,010 million tonnes of coal reserves or
17% share of global reserves. In 2014, Russia produced 334,058 tonnes of coal, with
74,995 tonnes coking coal. Major coking coal export destinations include: China, Ukraine,
Japan and Korea. Major steam coal export destinations include: UK, Japan, Korea, China
and Germany. The ‘Coal Industry’ was identified in the ‘Energy Strategy of Russia for the
Period up to 2030’ as a priority area for scientific and technological progress. A key element
of this programme will be driving efficiencies in coal-fired power generation. Average
efficiency of coal-fired power plants is planned to reach 41% by 2030, with the most
advanced coal-fired stations having electricity production net efficiency between 45% and
47%.
Countries with growing economies and abundant coal reserves, such as Poland, plan to
increase their installed capacity with coal. However, this task is challenging as there is a
cross road, the huge investments into energy generation are needed as well as phasing out
7GW of its current coal-fired generation capacity by the end of 201582, despite the reality
that 85% of electricity is from coal.
Amid climate change talks, Poland will still remain clear on fossil fuels being its main
energy source, with this, the nation plans to construct a capacity of 11,300 MW of coal
power by 2020 (Figure 22)
80 Financial Times (2015) Germany –decision means the coal industry lives on 81 Financial Times (2015) British coal-fired power plant bows to the inevitable, 82 Bank watch (2015) Coal-fired plant in Poland

WORLD ENERGY COUNCIL | WORLD ENERGY RESOURCES 2016
59
FIGURE 22: MW OF GENERATION CAPACITY IN POLAND BY 2020
Source: Bank watch (2015)
“Black gold” or “Polish gold” as supporters call this energy source is believed to be
significant in avoiding dependence on Russia’s natural gas83. It is projected that coal will
remain Poland’s primary fuel for electricity generation because it is an affordable option for
a nation that cannot afford a quick transition to cleaner alternatives. As the EU puts in
tougher rules, it is expected that coal’s share from Poland’s electricity generation will slowly
decline. Polish mining companies will have to adjust its production level to the economically
profitable demand, but coal is expected to remain the primary electricity generation source.
Despite the current economic slowdown, coal companies and other investors, both national
and international are interested in making investments in new Polish coal mines84.
UNITED STATES In the US, the coal industry is declining as a result of the Environmental Protection Agency
(EPA) policies and low natural gas prices85. The EPA will require existing power plants to
cut carbon emissions by 30% by 2030. Since 2010, utilities have formally announced
retirement of substantial amounts of coal-fired generating units (Figure 23) and it is
expected to see more coal-fired stations closed or substituted with natural gas by 2020,
with the majority of generating capacity retiring by end of 201686.
83 New York Times (2015) Coal in Poland lowering life spans 84 EURACOAL (2015) 85 Coal Unit Shutdowns, American Coalition for Clean Coal Electricity (ACCCE) 86 Coal Unit Shutdowns, American Coalition for Clean Coal Electricity (ACCCE)
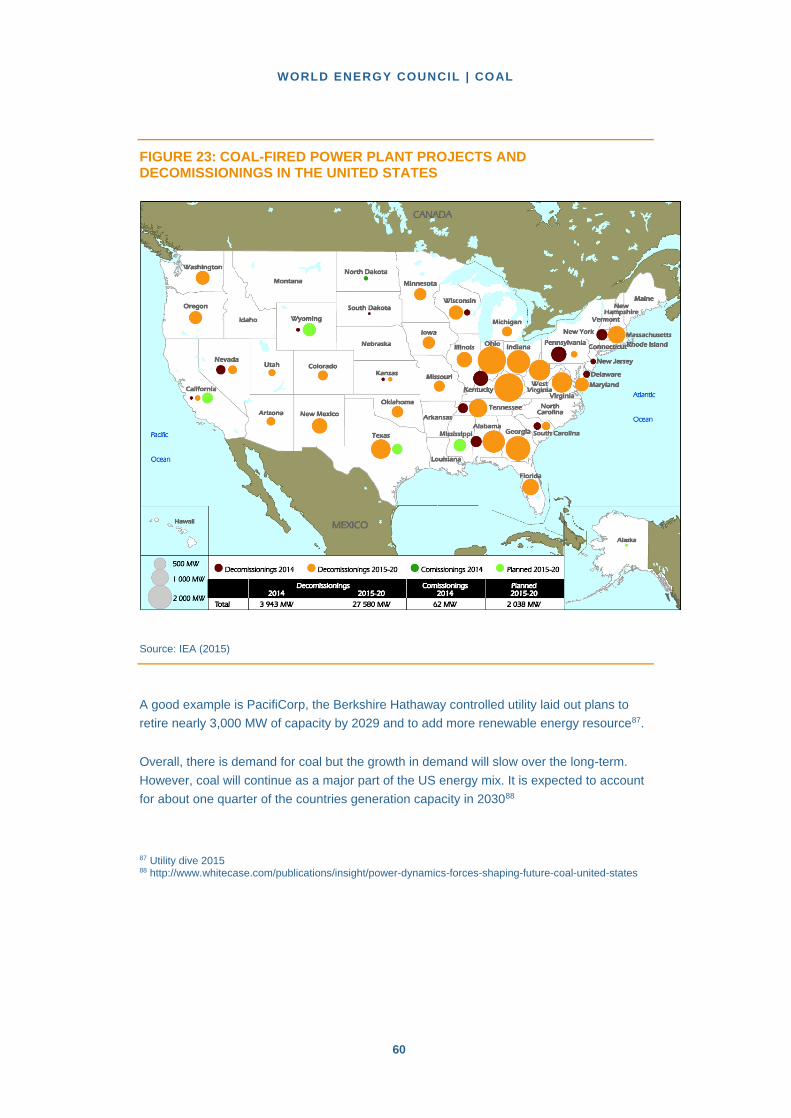
WORLD ENERGY COUNCIL | COAL
60
FIGURE 23: COAL-FIRED POWER PLANT PROJECTS AND DECOMISSIONINGS IN THE UNITED STATES
Source: IEA (2015)
A good example is PacifiCorp, the Berkshire Hathaway controlled utility laid out plans to
retire nearly 3,000 MW of capacity by 2029 and to add more renewable energy resource87.
Overall, there is demand for coal but the growth in demand will slow over the long-term.
However, coal will continue as a major part of the US energy mix. It is expected to account
for about one quarter of the countries generation capacity in 203088
87 Utility dive 2015 88 http://www.whitecase.com/publications/insight/power-dynamics-forces-shaping-future-coal-united-states

WORLD ENERGY COUNCIL | WORLD ENERGY RESOURCES 2016
61
6. GLOBAL TABLE
2014/2015 COAL RESERVES, RESOURCES AND REMAINING POTENTIAL Source: BP Statistical Review of World Energy 2016, BGR Energy, WEC, and IEA
Hard coal - energy content of ≥ 16,500 kJ/kg comprises sub-bituminous coal, bituminous coal and anthracite.
Lignite - possess lower energy content (< 16,500 kJ/kg) and higher water content
Million Tonnes RESERVES 2014* RESERVES 2015**
RESOURCES 2014* REMAINING POTENTIAL 2014*
Region Hard coal Lignite Total Total Hard coal Lignite Hard coal Lignite
Afghanistan 66 0 66 0 n.s. 0 66 0
Albania 0 522 522 0 0 205 0 727
Algeria 59 0 59 0 164 0 223 0
Argentina 500 0 500 0 300 7300 800 7300
Armenia 163 0 163 0 154 0 317 0
Australia 62095 44164 106259 76400 1536666 399267 1598761 443431
Austria 0 0 0 0 0 333 0 333
Bangladesh 293 0 293 0 2967 3 3260 3
Belarus 0 0 0 0 0 1500 0 1500
Belgium 0 0 0 0 4100 0 4100 0
Bhutan n.s. 0 0 0 n.s. 0 n.s. 0
Bolivia 1 0 1 0 n.s. 0 1 0
Bosnia & Herzegovina
0 2264 2264 0 0 3010 0 5274
Botswana 40 0 40 0 21200 0 21240 0
Brazil 1547 5049 6596 6630 4665 12587 6212 17636
Bulgaria 192 2174 2366 2366 3920 2400 4112 4574
Canada 4346 2236 6582 6582 183260 118270 187606 120506
Central African Rep.
0 3 3 0 0 n.s. 0 3
Chile 1181 n.s. 0 0 4135 7 5316 7
China 124059 7555 131614 114500 5338613 325097 5462672 332652
Colombia 4881 0 4881 6746 9928 0 14809 0
Congo DR 88 0 88 0 900 0 988 0
Costa Rica 0 0 0 0 17 0 17 0
Croatia 0 n.s. 0 0 0 300 0 300
Czech Republic 1107 2604 3711 1052 15419 7163 16526 9767
Dominican Rep. 0 0 0 0 0 84 0 84
Ecuador 0 24 24 0 0 n.s. 0 24
Egypt 16 0 16 0 166 0 182 0
Ethiopia 0 n.s. 0 0 0 n.s. 0 n.s.
France 0 n.s. 0 0 160 114 160 114
Georgia 201 0 201 0 700 0 901 0
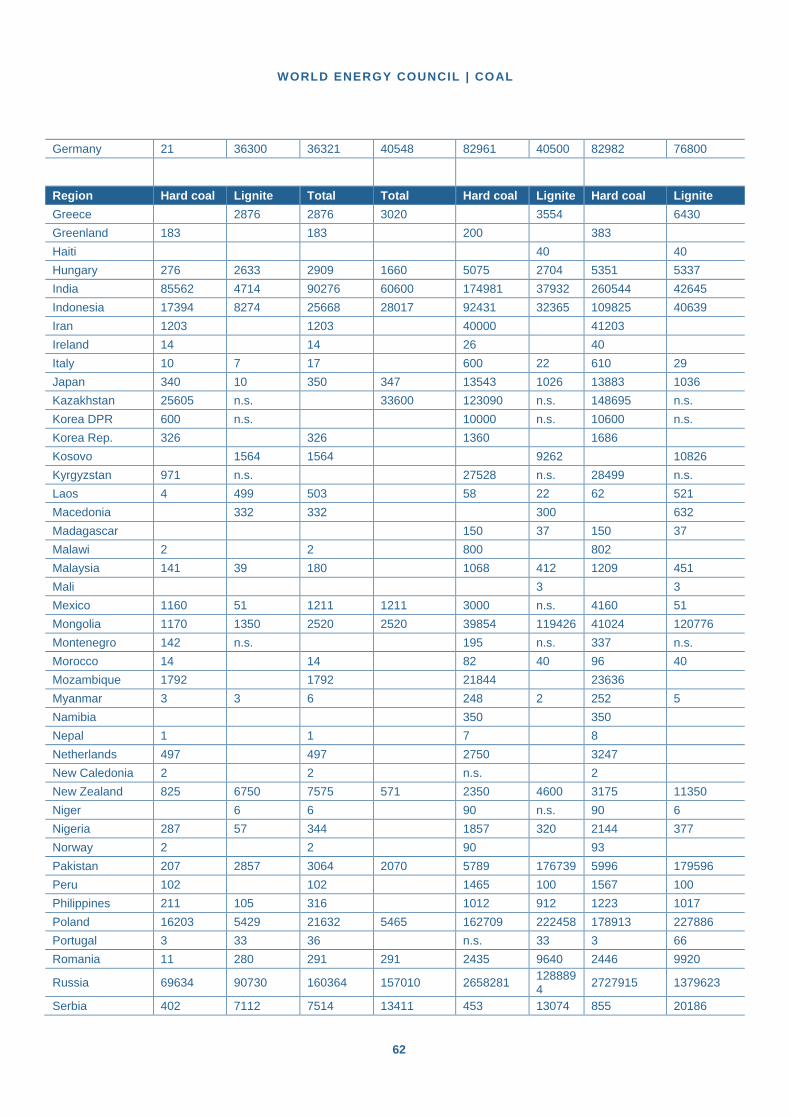
WORLD ENERGY COUNCIL | COAL
62
Germany 21 36300 36321 40548 82961 40500 82982 76800
Million Tonnes RESERVES 2014* RESERVES 2015**
RESOURCES 2014* REMAINING POTENTIAL 2014*
Region Hard coal Lignite Total Total Hard coal Lignite Hard coal Lignite
Greece 0 2876 2876 3020 0 3554 0 6430
Greenland 183 0 183 0 200 0 383 0
Haiti 0 0 0 0 0 40 0 40
Hungary 276 2633 2909 1660 5075 2704 5351 5337
India 85562 4714 90276 60600 174981 37932 260544 42645
Indonesia 17394 8274 25668 28017 92431 32365 109825 40639
Iran 1203 0 1203 0 40000 0 41203 0
Ireland 14 0 14 0 26 0 40 0
Italy 10 7 17 0 600 22 610 29
Japan 340 10 350 347 13543 1026 13883 1036
Kazakhstan 25605 n.s. 0 33600 123090 n.s. 148695 n.s.
Korea DPR 600 n.s. 0 0 10000 n.s. 10600 n.s.
Korea Rep. 326 0 326 0 1360 0 1686 0
Kosovo 0 1564 1564 0 0 9262 0 10826
Kyrgyzstan 971 n.s. 0 0 27528 n.s. 28499 n.s.
Laos 4 499 503 0 58 22 62 521
Macedonia 0 332 332 0 0 300 0 632
Madagascar 0 0 0 0 150 37 150 37
Malawi 2 0 2 0 800 0 802 0
Malaysia 141 39 180 0 1068 412 1209 451
Mali 0 0 0 0 0 3 0 3
Mexico 1160 51 1211 1211 3000 n.s. 4160 51
Mongolia 1170 1350 2520 2520 39854 119426 41024 120776
Montenegro 142 n.s. 0 0 195 n.s. 337 n.s.
Morocco 14 0 14 0 82 40 96 40
Mozambique 1792 0 1792 0 21844 0 23636 0
Myanmar 3 3 6 0 248 2 252 5
Namibia 0 0 0 0 350 0 350 0
Nepal 1 0 1 0 7 0 8 0
Netherlands 497 0 497 0 2750 0 3247 0
New Caledonia 2 0 2 0 n.s. 0 2 0
New Zealand 825 6750 7575 571 2350 4600 3175 11350
Niger 0 6 6 0 90 n.s. 90 6
Nigeria 287 57 344 0 1857 320 2144 377
Norway 2 0 2 0 90 0 93 0
Pakistan 207 2857 3064 2070 5789 176739 5996 179596
Peru 102 0 102 0 1465 100 1567 100
Philippines 211 105 316 0 1012 912 1223 1017
Poland 16203 5429 21632 5465 162709 222458 178913 227886
Portugal 3 33 36 0 n.s. 33 3 66
Romania 11 280 291 291 2435 9640 2446 9920
Russia 69634 90730 160364 157010 2658281 1288894
2727915 1379623
Serbia 402 7112 7514 13411 453 13074 855 20186

WORLD ENERGY COUNCIL | WORLD ENERGY RESOURCES 2016
63
Sierra Leone 0 0 0 0 0 2 0 2
Slovakia 0 135 135 0 19 938 19 1073
Slovenia 56 315 371 0 39 341 95 656
*BGR
** BP Statistical Review of World Energy 2016
Million Tonnes
RESERVES 2014* RESERVES 2015**
RESOURCES 2014* REMAINING POTENTIAL 2014*
Region Hard coal Lignite Total Total Hard coal Lignite Hard coal Lignite
South Africa 9893 0 9893 30156 203667 0 213560 0
Spain 868 319 1187 530 3363 n.s. 4231 319
Swaziland 144 0 144 0 4500 0 4644 0
Sweden 1 0 1 0 4 0 5 0
Taiwan 1 0 1 0 101 0 102 0
Tajikistan 375 0 375 0 3700 0 4075 0
Tanzania 269 0 269 0 1141 0 1410 0
Thailand 0 1063 1063 1239 0 826 0 1889
Turkey 380 12466 12846 8702 802 362 1182 12828
Turkmenistan 0 0 0 0 800 0 800 0
Uganda 0 0 0 0 800 0 800 0
Ukraine 32039 2336 34375 33873 49006 5381 81045 7717
United Kingdom
70 0 70 228 186700 1000 186770 1000
USA 222641 30483 253124 237295 6457688 1367877
6680329 1398360
Uzbekistan 1375 n.s. 0 1900 9477 n.s. 10852 n.s.
Venezuela 731 0 731 479 5981 0 6712 0
Viet Nam 3116 244 3360 150 3519 199876 6635 200120
Zambia 45 0 45 0 900 0 945 0
Zimbabwe 502 0 502 502 25000 0 25502 0
Total Africa 13151 66 13217 0 283611 402 296762 468
Total Asia Pacific
296416 77627 374043 288328 7224567 1298505
7520985 1376131
Total CIS 130363 93066 223429 227833 2872736 1295775
3003099 1388840
Total Europe 20255 77365 97620 0 471820 317713 492077 395077
Total Middle East
1203 0 1203 1122 40000 0 41203 0
Total North America
228330 32770 261100 245088 6644148 1486147
6872478 1518917
Total S. & Cent. America
8943 5073 14016 14641 26491 20118 35434 25191
World 698660 285964 984624 891531 17713376 4418658
18412036 4704622
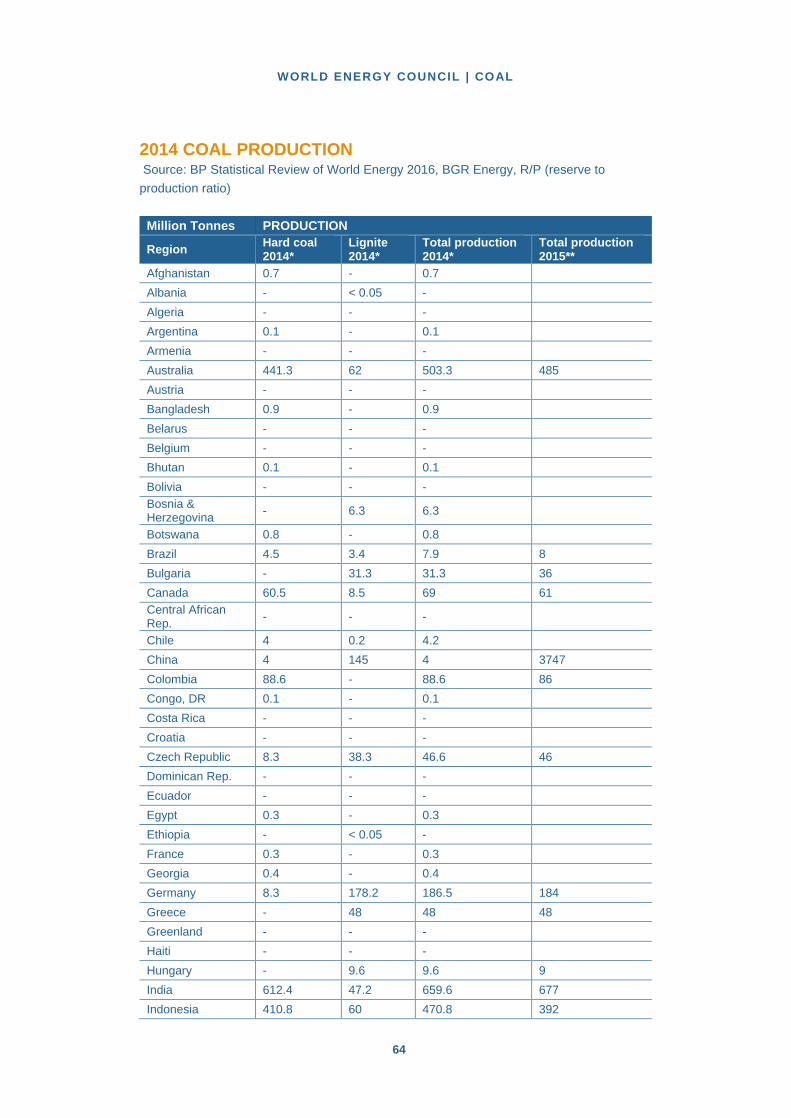
WORLD ENERGY COUNCIL | COAL
64
2014 COAL PRODUCTION Source: BP Statistical Review of World Energy 2016, BGR Energy, R/P (reserve to
production ratio)
Million Tonnes PRODUCTION
Region Hard coal 2014*
Lignite 2014*
Total production 2014*
Total production 2015**
Afghanistan 0.7 - 0.7 0
Albania - < 0.05 - 0
Algeria - - - 0
Argentina 0.1 - 0.1 0
Armenia - - - 0
Australia 441.3 62 503.3 485
Austria - - - 0
Bangladesh 0.9 - 0.9 0
Belarus - - - 0
Belgium - - - 0
Bhutan 0.1 - 0.1 0
Bolivia - - - 0
Bosnia & Herzegovina
- 6.3 6.3 0
Botswana 0.8 - 0.8 0
Brazil 4.5 3.4 7.9 8
Bulgaria - 31.3 31.3 36
Canada 60.5 8.5 69 61
Central African Rep.
- - - 0
Chile 4 0.2 4.2 0
China 4 145 4 3747
Colombia 88.6 - 88.6 86
Congo, DR 0.1 - 0.1 0
Costa Rica - - - 0
Croatia - - - 0
Czech Republic 8.3 38.3 46.6 46
Dominican Rep. - - - 0
Ecuador - - - 0
Egypt 0.3 - 0.3 0
Ethiopia - < 0.05 - 0
France 0.3 - 0.3 0
Georgia 0.4 - 0.4 0
Germany 8.3 178.2 186.5 184
Greece - 48 48 48
Greenland - - - 0
Haiti - - - 0
Hungary - 9.6 9.6 9
India 612.4 47.2 659.6 677
Indonesia 410.8 60 470.8 392

WORLD ENERGY COUNCIL | WORLD ENERGY RESOURCES 2016
65
Iran 2.8 - 2.8 0
Million Tonnes PRODUCTION
Region Hard coal 2014*
Lignite 2014*
Total production 2014*
Total production 2015**
Ireland - - - 0
Italy 0.1 - 0.1 0
Japan 1.3 - 1.3 1
Kazakhstan 109.0 6.6 115.6 106
Korea, DPR 33 7 40 0
Korea, Rep. 1.7 - 1.7 0
Kosovo - 7.2 7.2 0
Kyrgyzstan 0.3 1.3 1.6 0
Laos 0.2 0.5 0.7 0
Macedonia - 6.5 6.5 0
Madagascar - - - 0
Malawi 0.1 - 0.1 0
Malaysia 2.5 - 2.5 0
Mali - - - 0
Mexico 14 - 14 14
Mongolia 18.1 6.3 24.4 24
Montenegro - 1.6 1.6 0
Morocco - - - 0
Mozambique 6.1 - 6.1 0
Myanmar 0.5 < 0.05 0.5 0
Namibia - - - 0
Nepal < 0.05 - - 0
Netherlands - - - 0
New Caledonia - - - 0
New Zealand 3.7 0.3 4 3
Niger 0.3 - 0.3 0
Nigeria < 0.05 - - 0
Norway 1.7 - 1.7 0
Pakistan 1.9 1.2 3.1 3
Peru 0.2 - 0.2 0
Philippines 8.1 - 8.1 0
Poland 73.0 63.9 136.9 136
Portugal - - - 0
Romania - 23.6 23.6 25
Russia 287 70 357 373
Serbia 0.2 29.9 30.1 38
Sierra Leone - - - 0
Slovakia - 2.2 2.2 0
Slovenia - 3 3 0
South Korea 0 0 0 2
South Africa 253.2 - 253.2 252
Spain 3.9 1.24 3.9 3

WORLD ENERGY COUNCIL | COAL
66
Swaziland 0.2 - 0.2 0
Million Tonnes PRODUCTION
Region Hard coal 2014*
Lignite 2014*
Total production 2014*
Total production 2015**
Sweden - - 0 0
Taiwan - - - 0
Tajikistan 0.6 - 0.6 0
Tanzania 0.2 - 0.2 0
Thailand 0 18 18 15
Turkey 1.8 60 61.8 0
Turkmenistan - - - 0
Uganda - - - 0
Ukraine 65 0.2 65.2 38
United Kingdom 11.6 - 11.6 9
USA 835.1 71.8 906.9 813
Uzbekistan < 0.05 4.4 4.4 4
Venezuela 2 - 2 1
VietNam 41.7 - 41.7 42
Zambia 0.4 - 0.4 0
Zimbabwe 4 - 4 4
0 0 0 0 0
Total Africa 265.7 - 265.7 266
Total Asia Pacific 5,303.9 347.5 5,651.4 5440
Total CIS 462.3 82.5 544.8 527
Total E.U. 7,262.2 2 8,795.2 528
Total Middle East 2.8 - 2.8 1
Total North America
909.6 80.3 989.9 888
Total S. & Cent. America
99.4 3.6 103 98
World 7,153.0 1,023.4 8,176.4 7861
*BGR
** BP Statistical Review of World Energy 2016

CARBON CAPTURE & STORAGE | WORLD ENERGY RESOURCES 2016
TITLE OF DOCUMENT
67
LIST OF TABLES AND FIGURES
FIGURES
Figure 1 - Forecast of incremental global coal demand 2014 - 2020 (Mtce)…………………………....…6
Figure 2 - Reducing CO2 emissions through efficiency improvements in coal-fired power stations…..12
Figure 3 - India Levelised Cost of Electricity – 2035………………………………………………………..13
Figure 4 - Factors impacting coal consumption……………………………………………………………..16
Figure 5 - 2014 country ranking: coal-fired power generation (TWh)……………………………………..18
Figure 6 - Coal production in India……………………………………………………………………………20
Figure 7 - Domestic production and total consumption in India…………………………………………...21
Figure 8 - Development of Indonesian export destination………………………………………………….24
Figure 9 - Germany's primary energy consumption 1950 to 2014………………………………………...26
Figure 10 - Comparison of the use of primary sources of energy and of the ratio of domestic supply to
imports for Germany in 2004 and 2014, and relative shares in 2014………………………………27
Figure 11 - The financial results of hard coal mining in the years 2010 to 2014………………………...28
Figure 12 - Comparison of thermal coal spot price indices: monthly averages in US$/tonnes………...29
Figure 13 - Comparison between average unit costs of coal extraction and coal prices……………….30
Figure 14 - China coal use trends…………………………………………………………………………….50
Figure 15 - 2014 Growth of power generation capacity in China………………………………………….51
Figure 16 - Cumulative coal based power plant addition by countries/regions 2015-2040 in GW…….52
Figure 17 - World coal imports, New Policies Scenario…………………………………………………….53
Figure 18 - India's growing coal imports……………………………………………………………………..53
Figure 19 - India's electricity generation capacity under development > 50MW………………………...54
Figure 20 - Primary energy demand by fossil fuel in Southeast Asia, 1990-2040…………………….…55
Figure 21 - Coal share in power generation in 2014………………………………………………………..57
Figure 22 - MW of generation capacity in Poland by 2020…………………………………………………59
Figure 23 - Coal-fired power plant projects and decomissionings in the United States…………………60
TABLES
Table 1 - Coal supply overview…………………………………………………………………………….….18
Table 2 - Production share of coal producing company in India……………………………………….…..19
Table 3 - Australian export development in selected regions (Hard coal, Mt)……………………………23

WORLD ENERGY COUNCIL | COAL
68
Table 4 - Major coking coal(1) producers (Mt)………………………………………………………………32
Table 5 - Economic impacts due to construction and operation of Reliance Sasan…………………….37
Table 6 - Sasan UMPP employment impacts……………………………………………………………..…38
Table 7 - Economic impacts due to construction and operation of Neurath F and G……………………39
Table 8 - Neurath F&G employment impacts…………………………………………………………….…..39
Table 9 - Seasonal variation in the Denali Borough Workforce, Resident and Non-Resident, 2013.….40
Table 10 - Annual CCPs production, utilisation rate by countries 2010……………………………….…..49
Table 11 - Primary energy demand in Southeast Asia (Mtoe)………………………………………….…..55
Table 12 - Electricity generation by fossil fuels in Southeast Asia (TWh)……………………………..…..56

WORLD ENERGY COUNCIL | WORLD ENERGY RESOURCES 2016
69
REFERENCES
AGEB (2015), Arbeitsgemeinschaft Energiebilanzene. V, Energieverbrauch in Deutschland im Jahr 2014. –
42 p.; Berlin and Cologne www.ag-
energiebilanzen.de/index.php?article_id=29&fileName=ageb_jahresbericht2014.pdf
Energieverbrauch in Deutschland im Jahr (2014), 42 p; Berlin and Cologne.
Bank watch (2015), Coal-fired plant in Poland, http://bankwatch.org/our-work/projects/coal-fired-power-
plants-poland
BGR (2014), Energy Study, Reserves, resources and availability of energy resources, Hannover
www.bgr.bund.de/EN/Themen/Energie/Downloads/energiestudie_2014_en.pdf;jsessionid=34994D9251
AE00977EBFF6FFF1240FC6.1_cid321?__blob=publicationFile&v=3
BGR (2015), Energy Study, Reserves, resources and availability of energy resources, Hannover
www.bgr.bund.de/DE/Themen/Energie/Downloads/Energiestudie_2015.pdf?__blob=publicationFile&v=2
Bloomberg (2015), Eskom Sees Power Supply from Mozambique up by up to 40%,
www.bloomberg.com/news/articles/2015-07-28/eskom-sees-power-supply-from-mozambique-
increasing-by-up-to-40-
Burton J, & Winkler H, (2014), South Africa’s planned coal infrastructure expansion: Drivers, dynamics and
impacts on greenhouse gas emissions, www.erc.uct.ac.za/Research/publications/14-Burton-Winkler-
Coal_expansion.pdf
Business Day live (2015), Medupi finally produces first power,
www.bdlive.co.za/business/energy/2015/03/03/medupi-finally-produces-first-power
California’s Clean Energy Future (2011), Once Through Cooling Phase-Out
Carbon Tracker (2014), The Great Coal Gap: China’s energy policies and the financial implications for
thermal coal,
China coal Resource, http://en.sxcoal.com/111509/NewsShow.html
Christian S, (2015), Eskom South Africa: A case of planning failure,
www.slideshare.net/smakoso/simonchristian-eskom-south-africa
CIAB (2014), The socio-economic impacts of advanced technology coal-fuelled power stations
Climate News Network (2015), China’s investment in renewables soars by a third,
http://climatenewsnetwork.net/chinas-investment-in-renewables-soars-by-a-third/
Coal India Limited (2015), www.coalindia.in/en-us/company/aboutus.aspx
Coal Industry Advisory Board to the IEA (2015), The Socioeconomic Impacts of Advanced Technology
Coal-Fuelled Power Stations, Paris
Coal Unit Shutdowns (2015), American Coalition for Clean Coal Electricity (ACCCE),
www.americaspower.org/sites/default/files/Coal-Unit-Retirements-JUNE-18-2015.pdf
Council of the European Union (2010), COUNCIL DECISION of 10 December 2010 on State aid to facilitate
the closure of uncompetitive coal mines (2010/787/EU). Official Journal of the European Union
WORLD ENERGY COUNCIL | COAL
70
CSE India (2015), An epochal shift in the idea of India – Meeting Aspirations?,
www.cseindia.org/userfiles/The%20Indian%20Power%20Sector.pdf
Data from Central Electricity Authority, www.cea.nic.in
Data from Coal Directory of India (2013-14), Ministry of Coal
EIA (2014), Many newer plants have cooling systems that reuse water.
Enerdata (2015), www.enerdata.net/enerdatauk/press-and-publication/energy-news-001/india-plans-invest-
us105bn-thermal-power-plant-replacement_34118.html
EURACOAL (2015), http://euracoal.eu/info/country-profiles/poland/
Eurostat (2014), Energy, transport and environment indicators. Luxemburg.
Financial Times (2015), British coal-fired power plant bows to the inevitable, www.ft.com/cms/s/0/f3d1b352-
fef4-11e4-84b2-00144feabdc0.html#axzz3m0U1uZcI
Financial Times (2015), Germany –decision means the coal industry lives on, [http://blogs.ft.com/nick-
butler/2015/07/06/germany-the-coal-industry-lives-on/]
German Coal Assosiation (GVSt e.V.) (2015), Steinkohle
Heidrich C, Feuerborn H, & Weir A, (2013), Coal Combustion Products: a global perspective,
www.mcilvainecompany.com/Decision_Tree/subscriber/Tree/DescriptionTextLinks/International%20flya
sh%20perspective.pdf
http://eur-lex.europa.eu/legal-content/EN/TXT/PDF/?uri=CELEX:32010D0787&from=EN
IEA (2015), Medium Term Market Report
IEA (2015), Medium-term Coal Market Report
IEA (2015), Southeast Asia Energy Outlook Report
IEA (2015), World Energy Outlook Electricity access database
IEA (2015), Coal information 2015
IEA Coal Information (2015), here coal comprises all primary coals like anthracite, coking coal, other
bituminous coal, sub-bituminous coal and lignite
Institute for Energy Research, http://instituteforenergyresearch.org/analysis/as-u-s-shutters-coal-plants-
china-and-japan-are-building-them/
Jiabin Fu (2010), Challenges to increased use of coal combustion products in China, www.diva-
portal.org/smash/get/diva2:324274/FULLTEXT01.pdf
Lorenz U, (2015), Current situation and forecasts for international steam coal
Mercator Research Institute on Global Commons and Climate Change (2015), Renaissance of coal isn’t
stopping at China, www.mcc-berlin.net/en/media/press-information/press-release-
detail/article/renaissance-of-coal-isnt-stopping-at-china.html
Ministry of Economy (2015), Information about the functioning of hard coal mining industry and the
evaluation of the realization of the activity strategy of the hard coal mining industry in Poland in the

WORLD ENERGY COUNCIL | WORLD ENERGY RESOURCES 2016
71
years 2007-2015, Warsaw,
www.mg.gov.pl/files/upload/8155/Informacja%20na%20RM%20za%202014%20r.pdf
Mutem, A. (2013), MUI, Coal mines: A blessing or a curse? Socioeconomic and environmental intricacies.
University of Nairobi
Natural Defence Council (2011), Evaluating mercury control technologies for coal power plants
New York Times (2015), Coal in Poland lowering life spans,
www.nytimes.com/2015/06/08/business/energy-environment/coal-in-poland-lowering-life-
spans.html?_r=0
Office of Chief Economist (2015), Coal in India, www.industry.gov.au/Office-of-the-Chief-
Economist/Publications/Documents/Coal-in-India.pdf
Planning Commission of India, Working Group Report on Coal 12th
Polityka Energetyczna – Energy Policy Journal, 18, 4, 5-18 (in Polish),
www.minpan.krakow.pl/pliki/czasopisma/polityka%20energetyczna/PE20155/01-19-lorenz.pdf
Reuters (2013), World Bank to limit financing coal-fired plants, www.reuters.com/article/2013/07/16/us-
worldbank-climate-coal-idUSBRE96F19U20130716]
Reuters (2015), Peak coal by 2020 could save China thousands of lives: study
South China Morning Posts (2015), China aims to reduce coal reliance in next five-year plan,
www.scmp.com/business/commodities/article/1694984/china-aims-reduce-coal-reliance-next-five-year-
plan
Utility dive (2015), www.utilitydive.com/news/pacificorp-embraces-efficiency-plans-to-reduce-coal-burn-in-
irp/400790/
VDKI (2015), Annual Report, Verein der Kohlenimporteure (VDKi) (2015), Jahresbericht 2015. - 140 p.;
Hamburg. www.kohlenimporteure.de/aktuelles/jahresbericht-2015.html
Wood Mackenzie (2015), South Africa’s power supply crisis, www.woodmac.com/public/views/south-africa-
power
World Coal (2015), Cleaning up the coal-fired market, www.worldcoal.com/special-
reports/13072015/Cleaning-up-the-coal-power-market-2551/
World Coal Association (2015), www.worldcoal.org/coal/uses-of-coal/coal-combustion-products/
World Coal Asssociation, www.worldcoal.org/sustainable-societies/improving-access-energy
World Nuclear Association (2015), Nuclear Power in South Africa
www.world-nuclear.org/info/Country-Profiles/Countries-O-S/South-Africa/
www.ag-energiebilanzen.de/index.php?article_id=29&fileName=ageb_jahresbericht2014.pdf
www.gov.uk/government/publications/exporting-to-china/exporting-to-china
www.iea.org/media/workshops/2015/cop21/ieaday/1.3GRAY.pdf
www.renewableenergy.org.vn/index.php?mact=News,cntnt01,detail,0&cntnt01articleid=3256&cntnt01origid=
53&cntnt01returnid=53
WORLD ENERGY COUNCIL | COAL
72
www.theguardian.com/sustainable-business/china-conflict-coal-fired-plants-water#
www.usibelli.com/pdf/McDowell-Report-Statewide-Socioeconomic-Impacts-of-UCM-2015l.pdf
www.whitecase.com/publications/insight/power-dynamics-forces-shaping-future-coal-united-states
www.worldcoal.org/setting-benchmark-worlds-most-efficient-coal-fired-power-plants
www.rwe.com/web/cms/mediablob/en/208030/data/12068/3/rwe-power-ag/fuels/kw-neurath-boa-2-
3/Neurath-F-and-G-set-new-benchmarks-Article-by-Dr.-Reinhold-Elsen-RWE-Power-and-Matthias-
Fleischmann-Alstom-published-in-Modern-Power-Systems-June-2008.pdf
www.worldcoal.org/sites/default/files/coal_liquid_fuels_report(03_06_2009).pdf
www.worldcoal.org/sites/default/files/coal_resource_overview_of_coal_report(03_06_2009).pdf
www.worldsteel.org/dms/internetDocumentList/bookshop/2015/World-Steel-in-Figures-
2015/document/World%20Steel%20in%20Figures%202015.pdf p.7
www.worldsteel.org/dms/internetDocumentList/bookshop/2015/World-Steel-in-Figures-
2015/document/World%20Steel%20in%20Figures%202015.pdf p.9
WORLD ENERGY COUNCIL | WORLD ENERGY RESOURCES 2016
73
ACKNOWLEDGEMENTS
The project team would like to thank the individuals who informed the project’s approach, supplied
information, provided ideas, and reviewed drafts. Their support and insights have made a major contribution
to the development of the report.
WORLD ENERGY COUNCIL
Executive Chair
Hans-Wilhelm Schiffer RWE Germany
Deputy Director Scenarios & Resources
Zulandi Van der Westhuizen World Energy Council UK
Project Management
David Kenny Onyekpe World Energy Council UK
Lead Author
Liam McHugh World Coal Association UK
Fernando Zancan National Coal Producers Association Brazil
Roland Luebke German Coal Association Germany
Sandro Schmidt Federal Institute for Geosciences
and Natural Resources (BRG) Germany
Abhasha Mohanty NTPC Ltd. India
Miftahul Huda Coal & Mineral Technology R&D Centre Indonesia
Chris Baker Straterra New Zealand
A. O. Yusuf Nigerian Electricity Regulatory
Commission Nigeria
Lidia Gawlik Institute of Polish Academy of Sciences Poland
Mark Morey Alstom S.A. Singapore