quarterly economic review - reserve bank of …€¦ · · 2018-03-21mining ... quarterly coal...
TRANSCRIPT
QUARTERLY
ECONOMIC
REVIEW
DECEMBER 2016
RESERVE BANK OF ZIMBABWE
2
CONTENTS
1. OVERVIEW ........................................................................................................ 5
2. INTERNATIONAL ECONOMIC DEVELOPMENTS ..................................... 6
Emerging Market and Developing Economies .......................................................... 8
International Commodity Price Developments .......................................................... 8
Merchandise Trade Developments ..........................................................................10
Merchandise Export Developments .........................................................................10
Major Merchandise Export Destinations .................................................................11
Merchandise Import Developments .........................................................................12
Major Import Sources ..............................................................................................12
3. DOMESTIC ECONOMIC DEVELOPMENTS................................................13
REAL SECTOR DEVELOPMENTS ......................................................................13
Agriculture ...............................................................................................................13
Mining ......................................................................................................................16
Manufacturing ..........................................................................................................20
Capacity Utilisation ..................................................................................................20
Electricity .................................................................................................................21
4. INFLATION DEVELOPMENTS ........................................................................22
5. MONETARY DEVELOPMENTS, INTEREST RATES AND FINANCIAL
MARKETS ........................................................................................................23
6. PAYMENT, CLEARING AND SETTLEMENT ACTIVITIES ......................25
3
List of Figures
Figure 1: Brent Crude Oil Prices US$/Barrel) ................................................................................ 9
Figure 2: Base Metal Prices (US$/tonne) January to December 2016 ........................................... 9
Figure 3: Precious Minerals Prices ............................................................................................... 10
Figure 4: Total Merchandise Trade –Q1 to Q4 2015 and 2016 (US$ million)............................. 10
Figure 5: Merchandise Exports – Q1 to Q4 2015 and 2016 (US$ millions) ................................ 11
Figure 6: Major Merchandise Export Destinations (% Share)...................................................... 12
Figure 7: Merchandise Imports (US$ million).............................................................................. 12
Figure 8: Major Merchandise Import Sources (% Share) ............................................................. 12
Figure 9: Trade Balance (US$ million) ........................................................................................ 13
Figure 10: Formal Sector Quarterly Cattle Slaughters ................................................................. 15
Figure 11: Formal Sector Quarterly Sheep and Goats Slaughters ................................................ 15
Figure 12: Monthly performance of Colcom relative to other abattoirs in 2016. ......................... 16
Figure 13: Gold Production. ......................................................................................................... 17
Figure 14: Quarterly Platinum Output (Kg) and Average International Prices (US$/ounce)....... 17
Figure 15: Quarterly Diamond Production (Carats) ..................................................................... 18
Figure 16: Quarterly Diamond Output by Producer for 2016 (Carats) ......................................... 18
Figure 17: Quarterly Nickel Output (tonnes) ................................................................................ 19
Figure 18: Quarterly Coal Output and Average Coal Prices (US$/t) ........................................... 19
Figure 19: Major Coal Producers in 2016..................................................................................... 20
Figure 20: Manufacturing Sector Capacity Utilization ................................................................. 20
Figure 21: Quarterly Electricity Generation (GWh) ..................................................................... 21
Figure 22: Quarterly Inflation Profile (%) .................................................................................... 22
Figure 23: Quarterly Annualized Inflation Profile 2016 ............................................................... 23
Figure 24: Annual Broad Money Supply Growth Rates and Levels ............................................ 24
Figure 25: Market Capitalisation .................................................................................................. 24
Figure 26: Zimbabwe Stock Exchange Indices ............................................................................ 25
Figure 27: Market Turnover Value ............................................................................................... 25
Figure 28 : RTGS Values and Volumes ....................................................................................... 27
Figure 29: SWIFT Cross Border Transactions ............................................................................. 27
Figure 30: Over the Counter Cash Withdrawals. .......................................................................... 28
Figure 31: Values of Retail Transactions...................................................................................... 28
Figure 32 : Volumes of Retail Transactions ................................................................................. 28
Figure 33: Total Collateral ............................................................................................................ 29
4
List of Tables
Table 1: Global Economic Growth & Outlook (%) ........................................................................ 6
Table 2: International Commodity Prices ....................................................................................... 8
Table 3: Exports Classified by lHS Code ..................................................................................... 11
Table 4: Cumulative Tobacco Sales: 2015 and 2016 Tobacco Selling Season. ........................... 14
Table 5: Command Agriculture Performance by 31/12 2016. ...................................................... 14
Table 6: Quarterly Milk Output in 2015 and 2016 ....................................................................... 16
Table 7: Quarterly Production Statistics ....................................................................................... 16
Table 8: Average Capacity Utilisation in 2016............................................................................. 21
Table 9: Annual Inflation rates for selected SADC Member Countries and USA (%) ................ 23
Table 10: Consolidated Transactional Activities ....................................................................... 26
Table 11: Payment Systems Access Points and Devices .............................................................. 29
1. OVERVIEW
Growth in the global economy is estimated to
have declined to 3.1% in 2016, from 3.2% in
2015, the weakest performance since the 2008/9
global financial crisis. Global economic activity
is, however, projected, to pick up in 2017 and
2018, to 3.4% and 3.6% respectively. The policy
paradigm shift in the US, favouring
protectionism has brought uncertainty to global
financial markets.
The country’s real GDP growth rate is estimated
at 0.6% for 2016. On a sectoral basis, growths
are estimated for mining (6.9%); construction
(3.5%); distribution, hotels and restaurants
(1.7%); and manufacturing (0.3). Declines are,
however, estimated for electricity and water
(19%) and agriculture (3.7%), reflecting the
impact of the drought.
Manufacturing sector activity showed some
signs of recovery in the last quarter of 2016.
According to the 2016 Confederation of
Zimbabwe Industries Manufacturing Sector
Survey, the weighted average capacity
utilisation for the manufacturing sector
increased from 34.3% in 2015 to 47.4% in 2016.
Similarly, most of the key minerals performed
better in the last quarter of 2016, than the
comparable period in 2015. In particular, gold
output rose to 6 608 kg in the fourth quarter of
2016, compared to the 5 798 kg produced during
fourth quarter of 2015.
On the external sector front, the country’s
exports earnings increased by 23.9% to
1 Under the multiple currency system, broad money is
defined as total bank deposits less interbank deposits and
also includes Bond notes and coins issued.
US$1,071.1 million, largely on account of
increases in tobacco exports (378.5%), ferro-
chrome (100%) and semi-manufactured gold
(6.3%). Imports declined by 1% to US$1,432.8
million. Resultantly, the trade balance improved
from a deficit of US$646.4 million registered
during the third quarter of 2016, to a deficit of
US$361.7 million in the fourth quarter.
Broad money supply1 recorded an increase of
6.76%, in the fourth quarter of 2016, a stronger
growth compared to 3.51% recorded in the third
quarter. On a year-on-year basis, money supply
grew by 19.20% to US$5 680.5 million, from
US$4 765.4 million in December 2015.
The Zimbabwe Stock Exchange (ZSE) was
bullish during the fourth quarter of 2016.
Concomitantly, the industrial index increased by
45.57 points, from 98.96 points as at end
September 2016 to 144.53 points as at end
December 2016. Similarly, the mining index,
rose by 31.90 points, from 26.61 points as at end
September 2016, to 58.51 points as at end
December 2016. Market capitalisation gained
US$1.3 billion, from US$2.73 billion as at the
end September 2016 to US$4.01 billion as at the
end December 2016.
The value of transactions processed through the
National Payment Systems (NPS) increased by
11% to US$17.49 billion in the fourth quarter of
2016, from US$15.69 billion recorded in the
third quarter. NPS transaction volumes also
increased by 31% to 124.62 million in the fourth
quarter of 2016, from 94.84 million in the third
quarter.
6
2. INTERNATIONAL ECONOMIC
DEVELOPMENTS
The global economy was characterized by
stagnant trade, subdued investment, and
intensified policy uncertainty in 2016. Global
growth is estimated to have fallen to 3.1 percent
in 2016from 3.2 percent in 2015, the weakest
performance since the global financial crisis.
Economic activity is, however, projected to pick
up to 3.4 percent in 2017 and 3.6 percent in 2018.
Recovery in global growth stems from
improvements in some large emerging market
and low income economies. In the United States,
Europe, China and Japan better prospects are
expected to lift up growth. Notwithstanding the
global recovery, vulnerabilities include rising
antipathy toward trade and immigration,
widespread high levels of public and private
debt, the ongoing climate change which
especially affects low-income countries; and
continuing slow growth and deflationary
pressures. In addition, non-economic factors in
the form of geopolitical and political uncertainty
in some regions are expected to adversely affect
global recovery.
Growth in major advanced economies is
estimated to have decelerated to 1.6 percent in
2016, from 2.1 percent in 2015, mainly on the
backdrop of renewed policy uncertainties, weak
external demand, and subdued productivity
growth. The uncertainty associated with
protectionist policies of the Trump
administration in the United States and the
United Kingdom’s decision to leave the
European Union (Brexit) could significantly
influence the growth trajectory of advanced
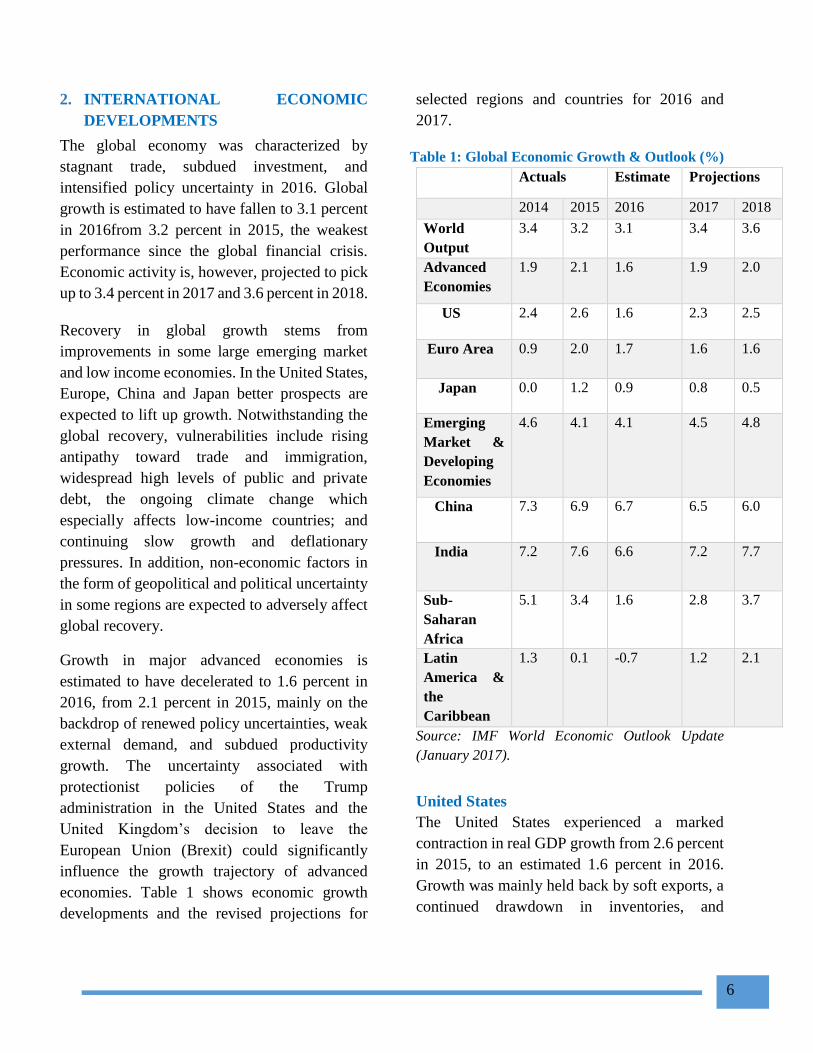
economies. Table 1 shows economic growth
developments and the revised projections for
selected regions and countries for 2016 and
2017.
Table 1: Global Economic Growth & Outlook (%)
Actuals Estimate Projections
2014 2015 2016 2017 2018
World
Output
3.4 3.2 3.1 3.4 3.6
Advanced
Economies
1.9 2.1 1.6 1.9 2.0
US 2.4 2.6 1.6 2.3 2.5
Euro Area 0.9 2.0 1.7 1.6 1.6
Japan 0.0 1.2 0.9 0.8 0.5
Emerging
Market &
Developing
Economies
4.6 4.1 4.1 4.5 4.8
China 7.3 6.9 6.7 6.5 6.0
India 7.2 7.6 6.6 7.2 7.7
Sub-
Saharan
Africa
5.1 3.4 1.6 2.8 3.7
Latin
America &
the
Caribbean
1.3 0.1 -0.7 1.2 2.1
Source: IMF World Economic Outlook Update
(January 2017).
United States
The United States experienced a marked
contraction in real GDP growth from 2.6 percent
in 2015, to an estimated 1.6 percent in 2016.
Growth was mainly held back by soft exports, a
continued drawdown in inventories, and
7
deceleration in private investment. Activity
picked up in the run-up to the November 2016
elections, with a further tightening of labour
markets leading to rising wage growth.
The raft of measures from the new
administration, such as proposals for corporate
and personal income tax cuts; infrastructure
spending; and shifts in trade (renegotiations of
trade agreements), immigration, and regulation
policies have brought uncertainty on the U.S.
economic outlook which may have spill-overs to
the rest of the world.
The unemployment rate remained slightly below
5 percent during the second half of 2016. While
labour force participation could recover from
current low levels, as workers return to the
labour market.
Eurozone
Growth in the Euro Area slowed from 2 percent
in 2015 to 1.7 percent in 2016, as both domestic
demand and exports lost momentum. The region
has been characterized by low confidence,
following the United Kingdom’s vote to exit the
European Union (EU) in June 2016. The
Eurozone’s labour market and credit conditions
continued to improve in 2016, with employment
recovering from the pre-crisis levels. The region
also experienced an improvement in lending
flows, mainly due to the prevailing negative
policy interest rates and large-scale asset
purchase programs by the European Central
Bank, which significantly led to a noticeable
easing of borrowing costs.
The Eurozone had a slightly expansionary fiscal
policy in 2016, mainly due to refugee related
expenditures. Most countries are riddled with
fiscal sustainability concerns. This, coupled with
uncertainty about the Brexit process, is expected
to exert downward pressure on growth in 2017-
18, on the United Kingdom in particular, and the
Euro Area to a lesser extent. Growth in the Euro
Area in 2017 is projected to slow marginally to
1.6 percent, from 1.7 percent in 2016, as the
unwinding of the income boost associated with
lower oil prices, increased policy uncertainties,
and lingering banking sector concerns offset the
benefits of more favourable financial conditions.
Japan
The Japanese economy is estimated to have
grown by 0.9 percent in 2016 from 1.2 percent
in 2015. This was on the backdrop of low
investment. The Japanese economy experienced
some improvements in private consumption,
after two years of contraction. While labour
shortages triggered a modest increase in wage
growth, low inflation expectations and a rising
share of part-time employment dampened the
gains. The change of policy by the Bank of Japan
from a quantitative target for government bond
purchases to a more flexible approach aimed at
stabilizing long term interest rates around zero,
resulted in an appreciation of the yen during the
first half on 2016.
Investments and profits were dampened in 2016,
mainly due to the fact that Japanese exports are
often denominated in destination currencies. The
yen depreciated rapidly towards the end of the
year, trimming most of its earlier gains. To
support growth, the Japanese government
postponed a planned consumption tax hike and a
fiscal stimulus package, with new public
spending amounting to 1.2 percent of GDP. This
was expected to add around 0.3 percentage
points to growth in 2017. Growth projections for
2017 and 2018 have been revised up to 0.8
percent and 0.5 percent, respectively.
8
The Japanese economy, however, remains
constrained by heightened policy uncertainty in
major trading partners and the shrinking and
aging labour force.
Emerging Market and Developing Economies
Growth in emerging market and developing
economies reached an estimated 4.1 percent in
2016. The weak global trade in 2016 was offset
by some pick-up in domestic demand and
generally mild financing conditions. Marked
divergence between commodity exporters and
importers continued, although with notable
variations within each group. Reflecting these
divergences, growth in commodity imports in
2016, accounted for almost the totality of the
growth in emerging market and developing
economies.
In Sub-Saharan Africa (SSA), growth prospects
are expected to improve on account of
normalization of conditions in large economies
that experienced macroeconomic strains,
primarily Nigeria, where higher oil production is
projected due to security improvements. Growth
in the region is projected to rise from 1.6% in
2016 to 2.8% and 3.6% in 2017 and 2018,
respectively. Economic growth prospects for
Zimbabwe are spurred by the good 2016/2017
agricultural season, with the national economy
projected to grow by 3.7% in 2017.
The risks to global growth in the outlook period
call for accelerated implementation of monetary,
fiscal and structural policies tailored to country
circumstances, in order to spur productivity and
output.
International Commodity Price
Developments
Prices of most international commodities
continued to rise in the fourth quarter,
rebounding from their lows in early 2016 and are
expected to gradually recover in 2017. Precious
metals, however, were subdued on the back of
weak investment demand in response to a
stronger dollar and high interest rates.
Crude oil prices which recorded strong quarterly
gains, recovered from a low of US$30 per barrel
at the beginning of 2016, to about US$50 by
December 2016. The oil market continued to
rebalance, as consumption rose, while non-
OPEC supplies declined notably, in the United
States.
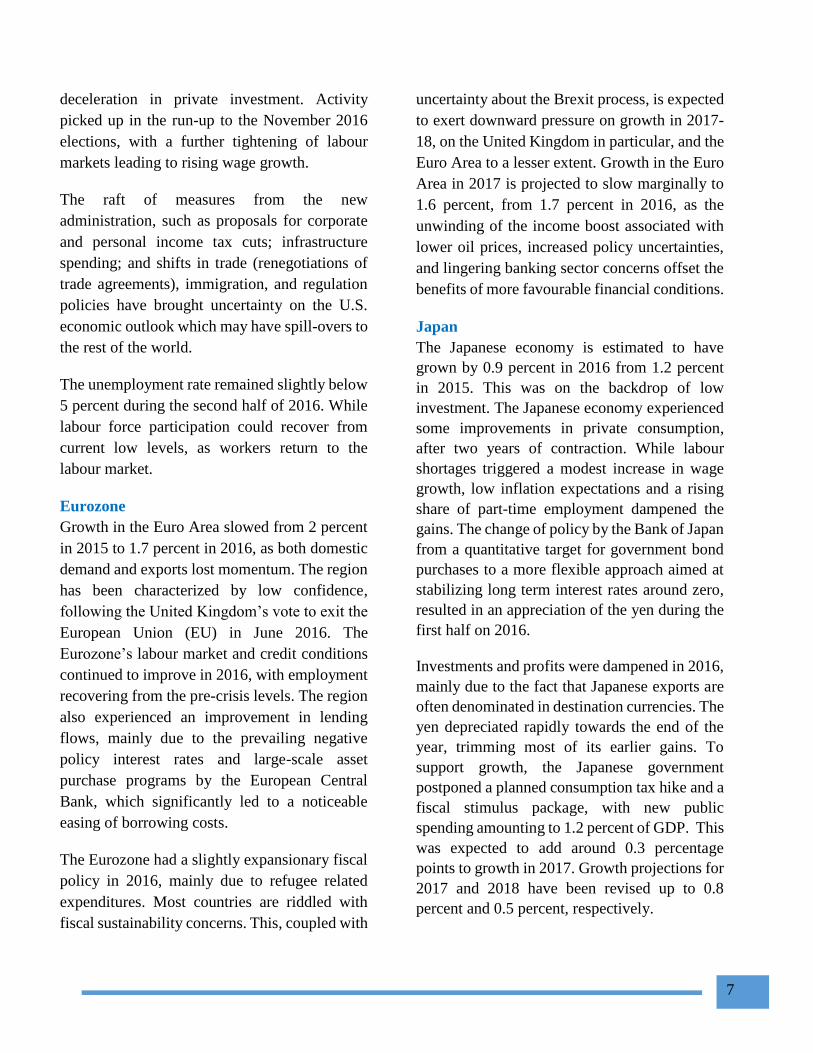
The evolution of international commodity prices
during the period under review is shown in
Table 2.
Table 2: International Commodity Prices
September
2016
December
2016
%
Change
Gold
(US$/oz) 1,334.85 1,219.39 -8.60
Platinum
(US$/oz) 1,085.10 941.24 -13.30
Copper
(US$/ton) 4,771.18 5,268.22 10.40
Nickel
(US$/ton) 10,259.12 10,793.93 5.20
Crude Oil
(US$/
barrel)
47.01 51.74 10.10
Source: Bloomberg, BBC, Kitco 2016
9
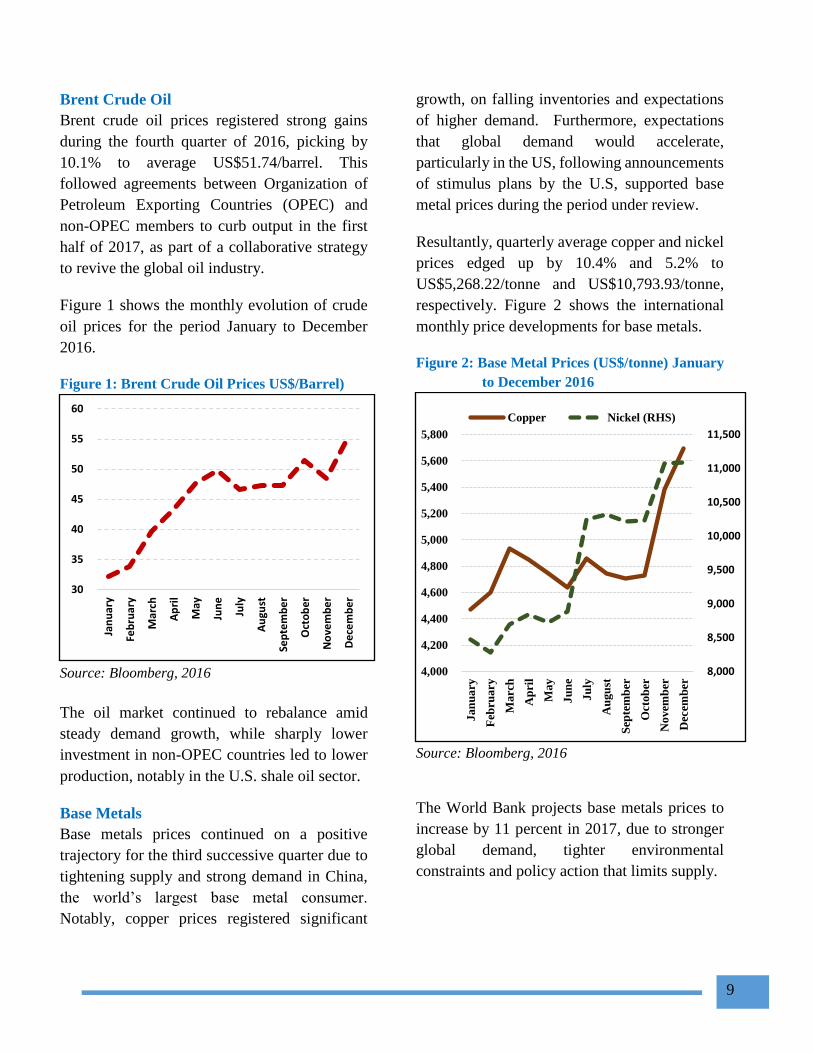
Brent Crude Oil
Brent crude oil prices registered strong gains
during the fourth quarter of 2016, picking by
10.1% to average US$51.74/barrel. This
followed agreements between Organization of
Petroleum Exporting Countries (OPEC) and
non-OPEC members to curb output in the first
half of 2017, as part of a collaborative strategy
to revive the global oil industry.
Figure 1 shows the monthly evolution of crude
oil prices for the period January to December
2016.
Figure 1: Brent Crude Oil Prices US$/Barrel)
Source: Bloomberg, 2016
The oil market continued to rebalance amid
steady demand growth, while sharply lower
investment in non-OPEC countries led to lower
production, notably in the U.S. shale oil sector.
Base Metals
Base metals prices continued on a positive
trajectory for the third successive quarter due to
tightening supply and strong demand in China,
the world’s largest base metal consumer.
Notably, copper prices registered significant
growth, on falling inventories and expectations
of higher demand. Furthermore, expectations
that global demand would accelerate,
particularly in the US, following announcements
of stimulus plans by the U.S, supported base
metal prices during the period under review.
Resultantly, quarterly average copper and nickel
prices edged up by 10.4% and 5.2% to
US$5,268.22/tonne and US$10,793.93/tonne,
respectively. Figure 2 shows the international
monthly price developments for base metals.
Figure 2: Base Metal Prices (US$/tonne) January
to December 2016
Source: Bloomberg, 2016
The World Bank projects base metals prices to
increase by 11 percent in 2017, due to stronger
global demand, tighter environmental
constraints and policy action that limits supply.
30
35
40
45
50
55
60
Jan
uar
y
Feb
ruar
y
Mar
ch
Ap
ril
May
Jun
e
July
Au
gust
Sep
tem
be
r
Oct
ob
er
No
vem
be
r
De
cem
be
r
8,000
8,500
9,000
9,500
10,000
10,500
11,000
11,500
4,000
4,200
4,400
4,600
4,800
5,000
5,200
5,400
5,600
5,800
Jan
ua
ry
Feb
ruary
March
Ap
ril
May
Ju
ne
Ju
ly
Au
gu
st
Sep
tem
ber
Octo
ber
No
vem
ber
Dec
emb
er
Copper Nickel (RHS)
10
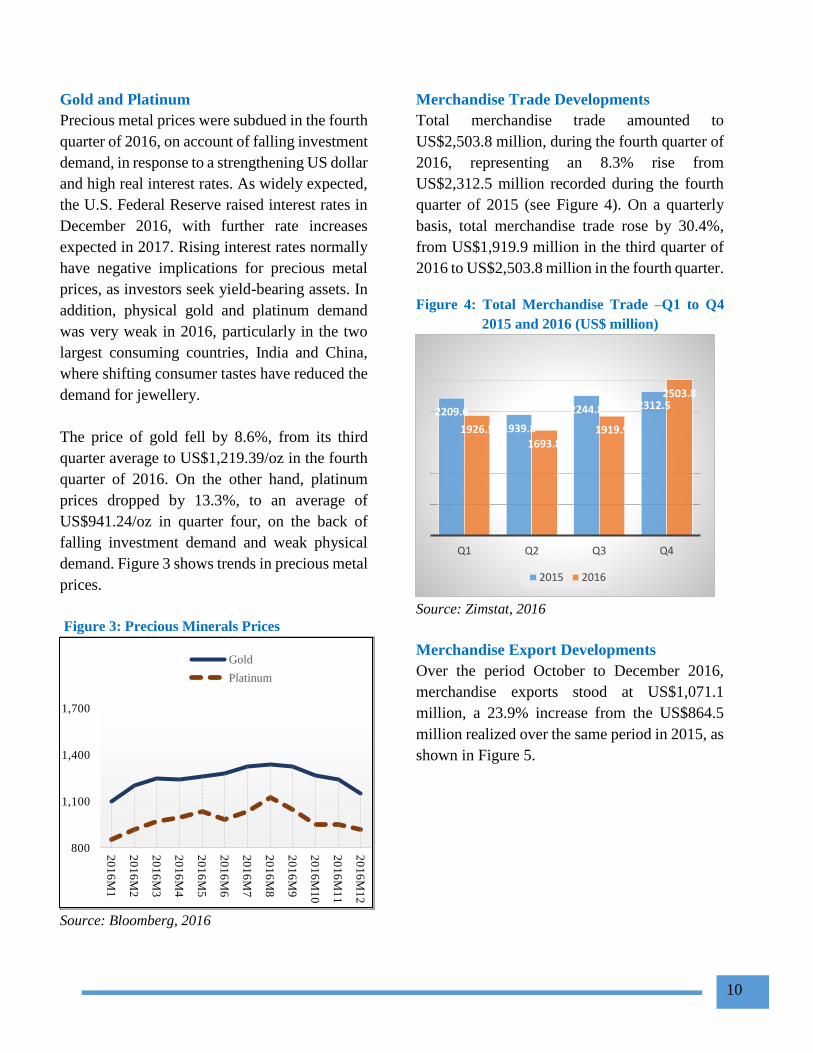
Gold and Platinum
Precious metal prices were subdued in the fourth
quarter of 2016, on account of falling investment
demand, in response to a strengthening US dollar
and high real interest rates. As widely expected,
the U.S. Federal Reserve raised interest rates in
December 2016, with further rate increases
expected in 2017. Rising interest rates normally
have negative implications for precious metal
prices, as investors seek yield-bearing assets. In
addition, physical gold and platinum demand
was very weak in 2016, particularly in the two
largest consuming countries, India and China,
where shifting consumer tastes have reduced the
demand for jewellery.
The price of gold fell by 8.6%, from its third
quarter average to US$1,219.39/oz in the fourth
quarter of 2016. On the other hand, platinum
prices dropped by 13.3%, to an average of
US$941.24/oz in quarter four, on the back of
falling investment demand and weak physical
demand. Figure 3 shows trends in precious metal
prices.
Figure 3: Precious Minerals Prices
Source: Bloomberg, 2016
Merchandise Trade Developments
Total merchandise trade amounted to
US$2,503.8 million, during the fourth quarter of
2016, representing an 8.3% rise from
US$2,312.5 million recorded during the fourth
quarter of 2015 (see Figure 4). On a quarterly
basis, total merchandise trade rose by 30.4%,
from US$1,919.9 million in the third quarter of
2016 to US$2,503.8 million in the fourth quarter.
Figure 4: Total Merchandise Trade –Q1 to Q4
2015 and 2016 (US$ million)
Source: Zimstat, 2016
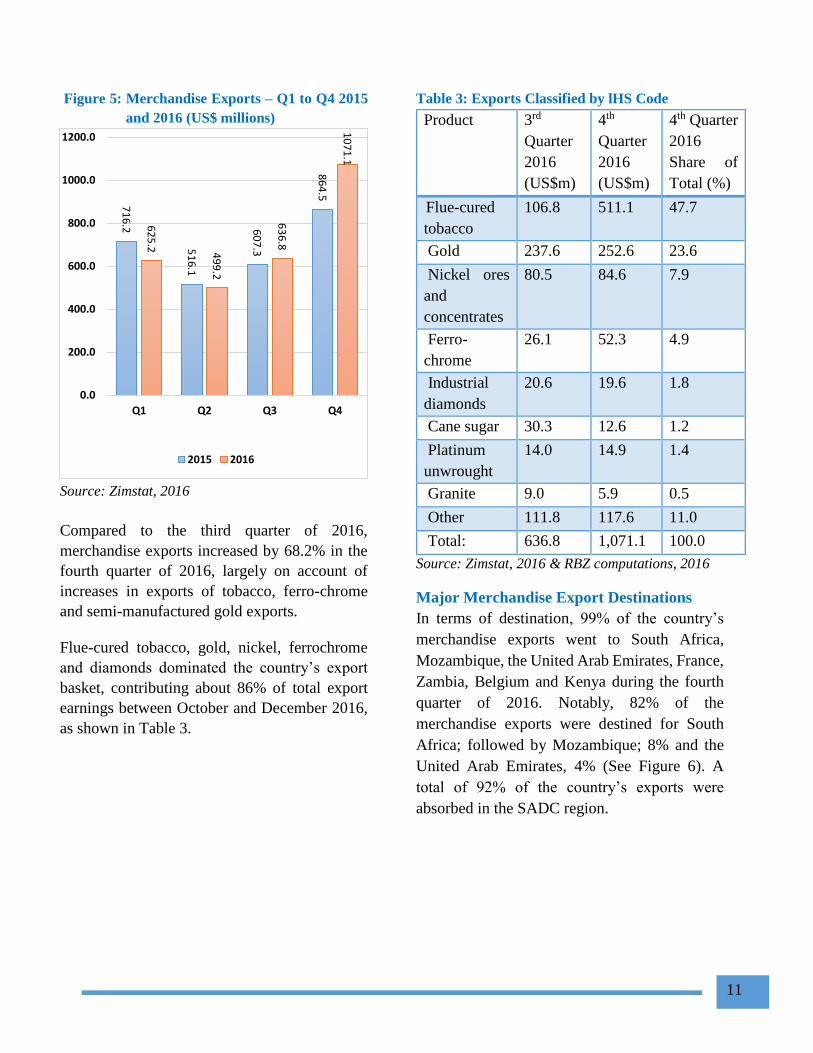
Merchandise Export Developments
Over the period October to December 2016,
merchandise exports stood at US$1,071.1
million, a 23.9% increase from the US$864.5
million realized over the same period in 2015, as
shown in Figure 5.
800
1,100
1,400
1,7002
01
6M
1
20
16
M2
20
16
M3
20
16
M4
20
16
M5
20
16
M6
20
16
M7
20
16
M8
20
16
M9
20
16
M1
0
20
16
M1
1
20
16
M1
2
Gold
Platinum
2209.6
1939.8
2244.8 2312.5
1926.51693.8
1919.9
2503.8
Q1 Q2 Q3 Q4
2015 2016
11
Figure 5: Merchandise Exports – Q1 to Q4 2015
and 2016 (US$ millions)
Source: Zimstat, 2016
Compared to the third quarter of 2016,
merchandise exports increased by 68.2% in the
fourth quarter of 2016, largely on account of
increases in exports of tobacco, ferro-chrome
and semi-manufactured gold exports.
Flue-cured tobacco, gold, nickel, ferrochrome
and diamonds dominated the country’s export
basket, contributing about 86% of total export
earnings between October and December 2016,
as shown in Table 3.
Table 3: Exports Classified by lHS Code
Product 3rd
Quarter
2016
(US$m)
4th
Quarter
2016
(US$m)
4th Quarter
2016
Share of
Total (%)
Flue-cured
tobacco
106.8 511.1 47.7
Gold 237.6 252.6 23.6
Nickel ores
and
concentrates
80.5 84.6 7.9
Ferro-
chrome
26.1 52.3 4.9
Industrial
diamonds
20.6 19.6 1.8
Cane sugar 30.3 12.6 1.2
Platinum
unwrought
14.0 14.9 1.4
Granite 9.0 5.9 0.5
Other 111.8 117.6 11.0
Total: 636.8 1,071.1 100.0
Source: Zimstat, 2016 & RBZ computations, 2016
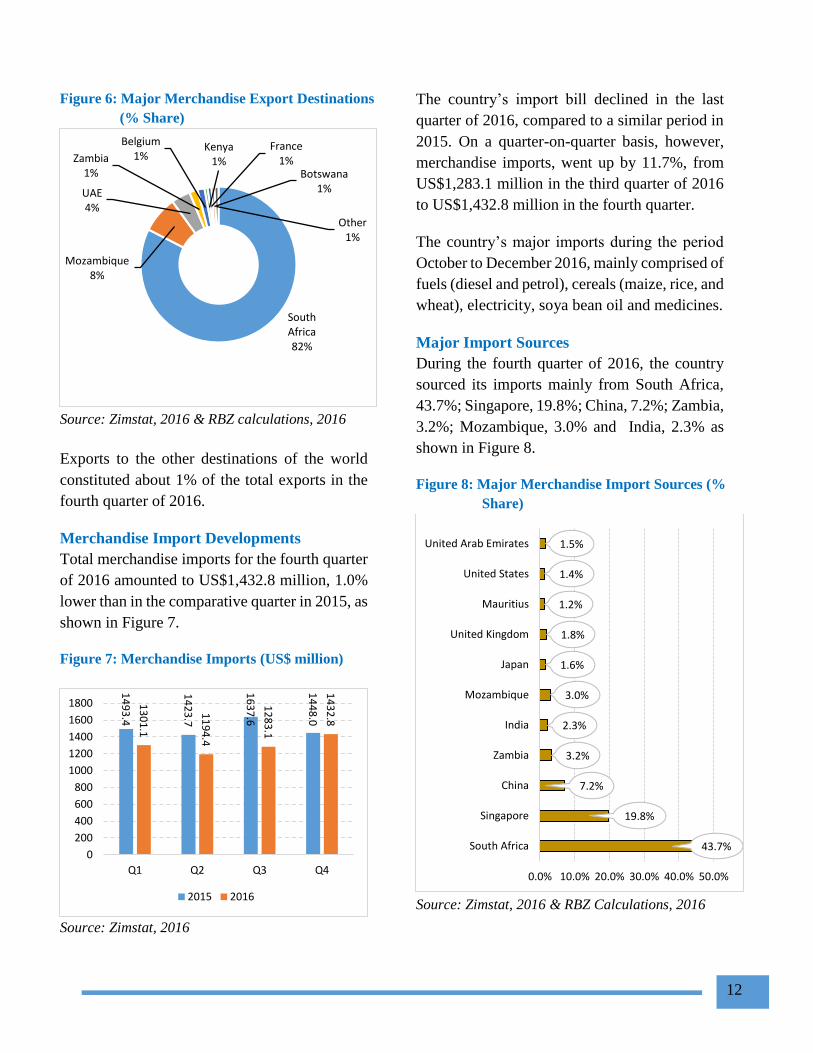
Major Merchandise Export Destinations
In terms of destination, 99% of the country’s
merchandise exports went to South Africa,
Mozambique, the United Arab Emirates, France,
Zambia, Belgium and Kenya during the fourth
quarter of 2016. Notably, 82% of the
merchandise exports were destined for South
Africa; followed by Mozambique; 8% and the
United Arab Emirates, 4% (See Figure 6). A
total of 92% of the country’s exports were
absorbed in the SADC region.
71
6.2
51
6.1
60
7.3
86
4.5
62
5.2 4
99
.2
63
6.8
10
71
.1
0.0
200.0
400.0
600.0
800.0
1000.0
1200.0
Q1 Q2 Q3 Q4
2015 2016
12
Figure 6: Major Merchandise Export Destinations
(% Share)
Source: Zimstat, 2016 & RBZ calculations, 2016
Exports to the other destinations of the world
constituted about 1% of the total exports in the
fourth quarter of 2016.
Merchandise Import Developments
Total merchandise imports for the fourth quarter
of 2016 amounted to US$1,432.8 million, 1.0%
lower than in the comparative quarter in 2015, as
shown in Figure 7.
Figure 7: Merchandise Imports (US$ million)
Source: Zimstat, 2016
The country’s import bill declined in the last
quarter of 2016, compared to a similar period in
2015. On a quarter-on-quarter basis, however,
merchandise imports, went up by 11.7%, from
US$1,283.1 million in the third quarter of 2016
to US$1,432.8 million in the fourth quarter.
The country’s major imports during the period
October to December 2016, mainly comprised of
fuels (diesel and petrol), cereals (maize, rice, and
wheat), electricity, soya bean oil and medicines.
Major Import Sources
During the fourth quarter of 2016, the country
sourced its imports mainly from South Africa,
43.7%; Singapore, 19.8%; China, 7.2%; Zambia,
3.2%; Mozambique, 3.0% and India, 2.3% as
shown in Figure 8.
Figure 8: Major Merchandise Import Sources (%
Share)
Source: Zimstat, 2016 & RBZ Calculations, 2016
South Africa82%
Mozambique8%
UAE4%
Zambia1%
Belgium1%
Kenya1%
France1%
Botswana1%
Other1%
14
93
.4
14
23
.7
16
37
.6
14
48
.0
13
01
.1
11
94
.4
12
83
.1
14
32
.8
0
200
400
600
800
1000
1200
1400
1600
1800
Q1 Q2 Q3 Q4
2015 2016
43.7%
19.8%
7.2%
3.2%
2.3%
3.0%
1.6%
1.8%
1.2%
1.4%
1.5%
0.0% 10.0% 20.0% 30.0% 40.0% 50.0%
South Africa
Singapore
China
Zambia
India
Mozambique
Japan
United Kingdom
Mauritius
United States
United Arab Emirates
13
The country’s merchandise imports from South
Africa mainly constituted capital, intermediate
and consumer goods, while imports from
Singapore were dominated by diesel and petrol.
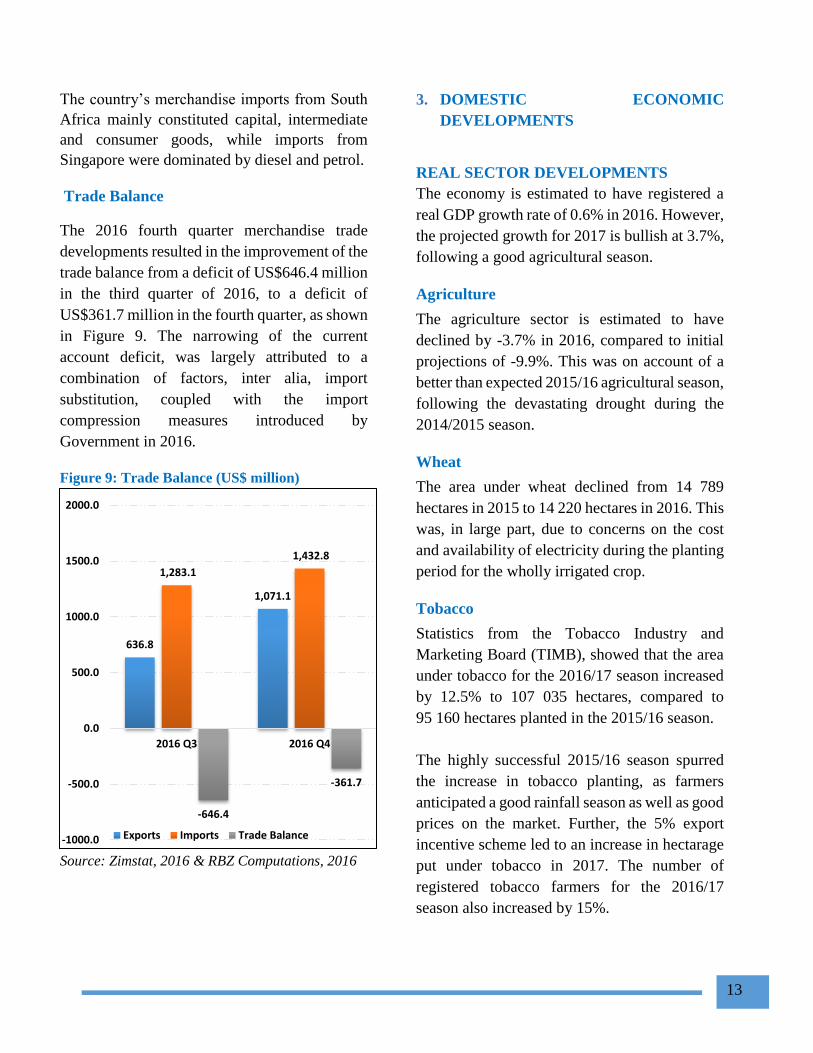
Trade Balance
The 2016 fourth quarter merchandise trade
developments resulted in the improvement of the
trade balance from a deficit of US$646.4 million
in the third quarter of 2016, to a deficit of
US$361.7 million in the fourth quarter, as shown
in Figure 9. The narrowing of the current
account deficit, was largely attributed to a
combination of factors, inter alia, import
substitution, coupled with the import
compression measures introduced by
Government in 2016.
Figure 9: Trade Balance (US$ million)
Source: Zimstat, 2016 & RBZ Computations, 2016
3. DOMESTIC ECONOMIC
DEVELOPMENTS
REAL SECTOR DEVELOPMENTS
The economy is estimated to have registered a
real GDP growth rate of 0.6% in 2016. However,
the projected growth for 2017 is bullish at 3.7%,
following a good agricultural season.
Agriculture
The agriculture sector is estimated to have
declined by -3.7% in 2016, compared to initial
projections of -9.9%. This was on account of a
better than expected 2015/16 agricultural season,
following the devastating drought during the
2014/2015 season.
Wheat
The area under wheat declined from 14 789
hectares in 2015 to 14 220 hectares in 2016. This
was, in large part, due to concerns on the cost
and availability of electricity during the planting
period for the wholly irrigated crop.
Tobacco
Statistics from the Tobacco Industry and
Marketing Board (TIMB), showed that the area
under tobacco for the 2016/17 season increased
by 12.5% to 107 035 hectares, compared to
95 160 hectares planted in the 2015/16 season.
The highly successful 2015/16 season spurred
the increase in tobacco planting, as farmers
anticipated a good rainfall season as well as good
prices on the market. Further, the 5% export
incentive scheme led to an increase in hectarage
put under tobacco in 2017. The number of
registered tobacco farmers for the 2016/17
season also increased by 15%.
636.8
1,071.1
1,283.1
1,432.8
-646.4
-361.7
-1000.0
-500.0
0.0
500.0
1000.0
1500.0
2000.0
2016 Q3 2016 Q4
Exports Imports Trade Balance
14
Cumulative Tobacco sales in 2016 significantly
surpassed the projected performance, despite the
lower hectarage. Table 4 shows a comparison of
the performance of the 2015 and 2016 marketing
seasons.
Table 4: Cumulative Tobacco Sales: 2015 and
2016 Tobacco Selling Season.
2015 2016
Variance
(%)
Total
Quantity Sold
(million Kgs)
198.9 202.3 1.7
Total Value
(US$ million) 586.4 595.9 1.6
Average Price
(US$)/Kg 2.95 2.95 0
Source: TIMB, 2017
Cotton
Cotton output declined significantly from
104 935 tonnes in 2015, to less than 30 000
tonnes in 2016. The decline was due to the
severe drought conditions that affected the
establishment of the crop at the onset of the
season. General apathy by farmers, following
years of poor prices, resulted in the breaking
down of the hitherto successful contract
arrangements with cotton merchants and
ginners.
For the 2016/17 season, five contractors were
licensed and they intend to finance about
550 000 hectares of the crop, to the tune of
US$53 million. In addition, Government
financing through a three year free input
programme is expected to boost production, and
set the crop on a recovery path. The parastatal,
Cottco, one of the licenced contractors, is
implementing the Government input schemes in
this endeavour.
Maize
A total of 100 425 hectares had been planted
under the Command Agriculture programme by
end December 2016. Table 5 shows the status of
implementation of the Command Agriculture
programme as at 31st December 2016.
Table 5: Command Agriculture Performance as at
end December 2016. Dryland Irrigated Total
Contracted 175 191 71811.3 247 002
Tilled 108 161 63 299 171 460
Planted 52 587 47 837 100 425
Source: Ministry of Agriculture and Irrigation
Development, 2017
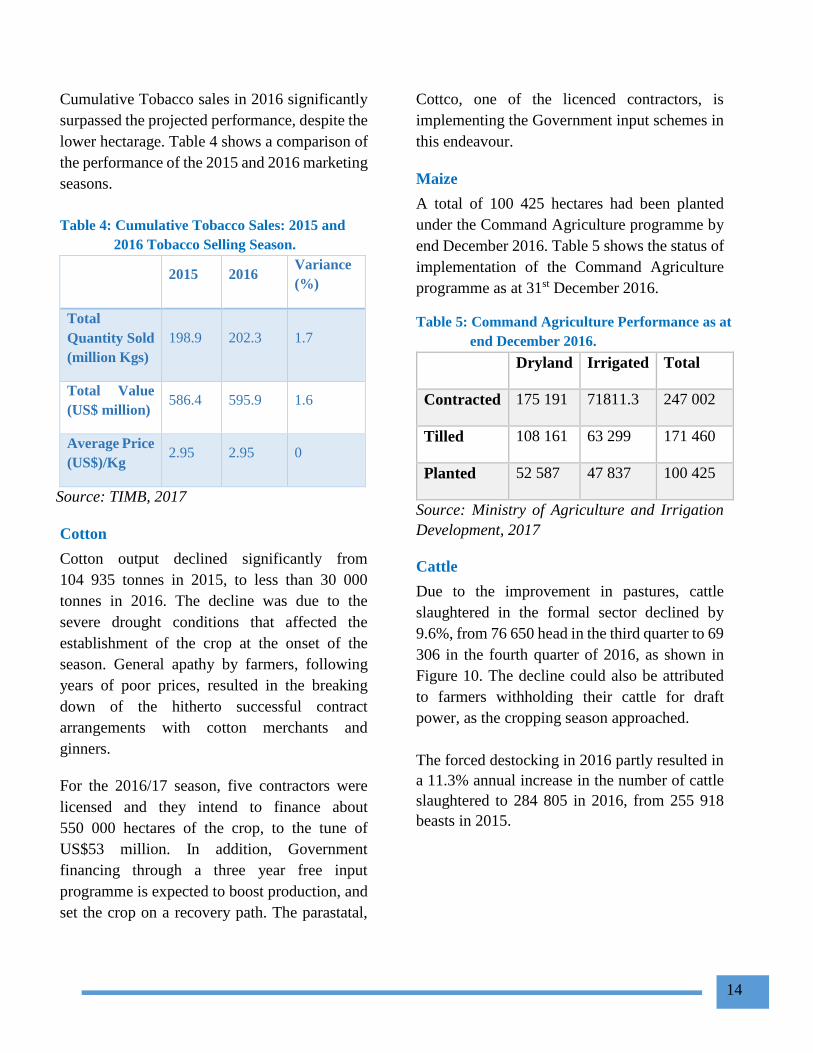
Cattle
Due to the improvement in pastures, cattle
slaughtered in the formal sector declined by
9.6%, from 76 650 head in the third quarter to 69
306 in the fourth quarter of 2016, as shown in
Figure 10. The decline could also be attributed
to farmers withholding their cattle for draft
power, as the cropping season approached.
The forced destocking in 2016 partly resulted in
a 11.3% annual increase in the number of cattle
slaughtered to 284 805 in 2016, from 255 918
beasts in 2015.
15
Figure 10: Formal Sector Quarterly Cattle
Slaughters
Source: Ministry of Agriculture, Mechanization and
Irrigation Development
The Cold Storage Company contributed 7% of
the cattle slaughters, as a result of operational
challenges at the State Owned Enterprise and
competition from private abattoirs.
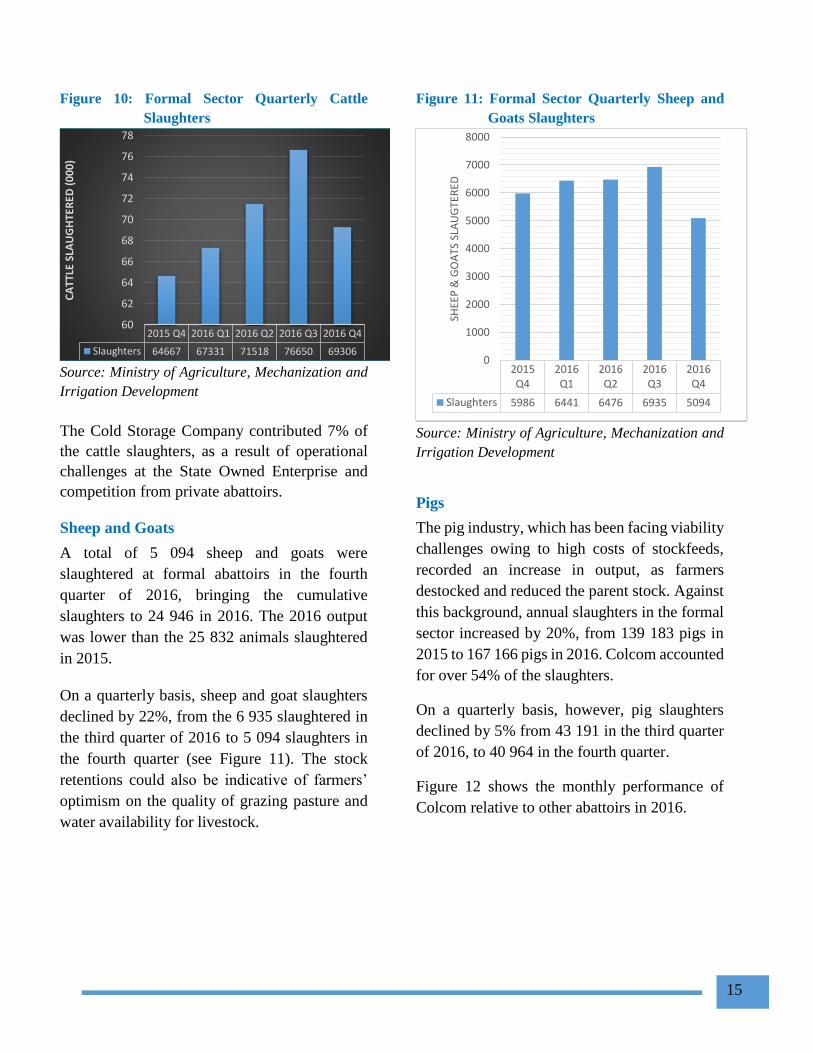
Sheep and Goats
A total of 5 094 sheep and goats were
slaughtered at formal abattoirs in the fourth
quarter of 2016, bringing the cumulative
slaughters to 24 946 in 2016. The 2016 output
was lower than the 25 832 animals slaughtered
in 2015.
On a quarterly basis, sheep and goat slaughters
declined by 22%, from the 6 935 slaughtered in
the third quarter of 2016 to 5 094 slaughters in
the fourth quarter (see Figure 11). The stock
retentions could also be indicative of farmers’
optimism on the quality of grazing pasture and
water availability for livestock.
Figure 11: Formal Sector Quarterly Sheep and
Goats Slaughters
Source: Ministry of Agriculture, Mechanization and
Irrigation Development
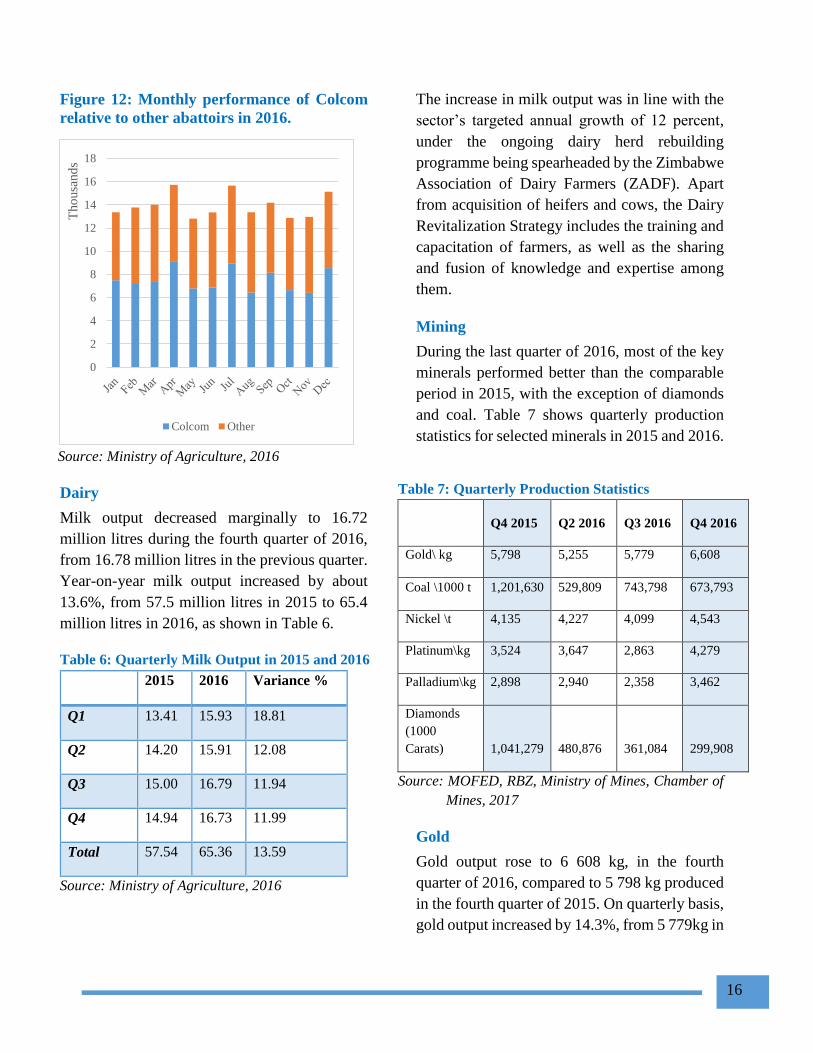
Pigs
The pig industry, which has been facing viability
challenges owing to high costs of stockfeeds,
recorded an increase in output, as farmers
destocked and reduced the parent stock. Against
this background, annual slaughters in the formal
sector increased by 20%, from 139 183 pigs in
2015 to 167 166 pigs in 2016. Colcom accounted
for over 54% of the slaughters.
On a quarterly basis, however, pig slaughters
declined by 5% from 43 191 in the third quarter
of 2016, to 40 964 in the fourth quarter.
Figure 12 shows the monthly performance of
Colcom relative to other abattoirs in 2016.
2015 Q4 2016 Q1 2016 Q2 2016 Q3 2016 Q4
Slaughters 64667 67331 71518 76650 69306
60
62
64
66
68
70
72
74
76
78
CA
TTLE
SLA
UG
HTE
RED
(0
00
)
2015Q4
2016Q1
2016Q2
2016Q3
2016Q4
Slaughters 5986 6441 6476 6935 5094
0
1000
2000
3000
4000
5000
6000
7000
8000
SHEE
P &
GO
ATS
SLA
UG
TER
ED
16
Figure 12: Monthly performance of Colcom
relative to other abattoirs in 2016.
Source: Ministry of Agriculture, 2016
Dairy
Milk output decreased marginally to 16.72
million litres during the fourth quarter of 2016,
from 16.78 million litres in the previous quarter.
Year-on-year milk output increased by about
13.6%, from 57.5 million litres in 2015 to 65.4
million litres in 2016, as shown in Table 6.
Table 6: Quarterly Milk Output in 2015 and 2016
2015 2016 Variance %
Q1 13.41 15.93 18.81
Q2 14.20 15.91 12.08
Q3 15.00 16.79 11.94
Q4 14.94 16.73 11.99
Total 57.54 65.36 13.59
Source: Ministry of Agriculture, 2016
The increase in milk output was in line with the
sector’s targeted annual growth of 12 percent,
under the ongoing dairy herd rebuilding
programme being spearheaded by the Zimbabwe
Association of Dairy Farmers (ZADF). Apart
from acquisition of heifers and cows, the Dairy
Revitalization Strategy includes the training and
capacitation of farmers, as well as the sharing
and fusion of knowledge and expertise among
them.
Mining
During the last quarter of 2016, most of the key
minerals performed better than the comparable
period in 2015, with the exception of diamonds
and coal. Table 7 shows quarterly production
statistics for selected minerals in 2015 and 2016.
Table 7: Quarterly Production Statistics
Q4 2015 Q2 2016 Q3 2016 Q4 2016
Gold\ kg 5,798 5,255 5,779 6,608
Coal \1000 t 1,201,630 529,809 743,798 673,793
Nickel \t 4,135 4,227 4,099 4,543
Platinum\kg 3,524 3,647 2,863 4,279
Palladium\kg 2,898 2,940 2,358 3,462
Diamonds
(1000
Carats) 1,041,279 480,876 361,084 299,908
Source: MOFED, RBZ, Ministry of Mines, Chamber of
Mines, 2017
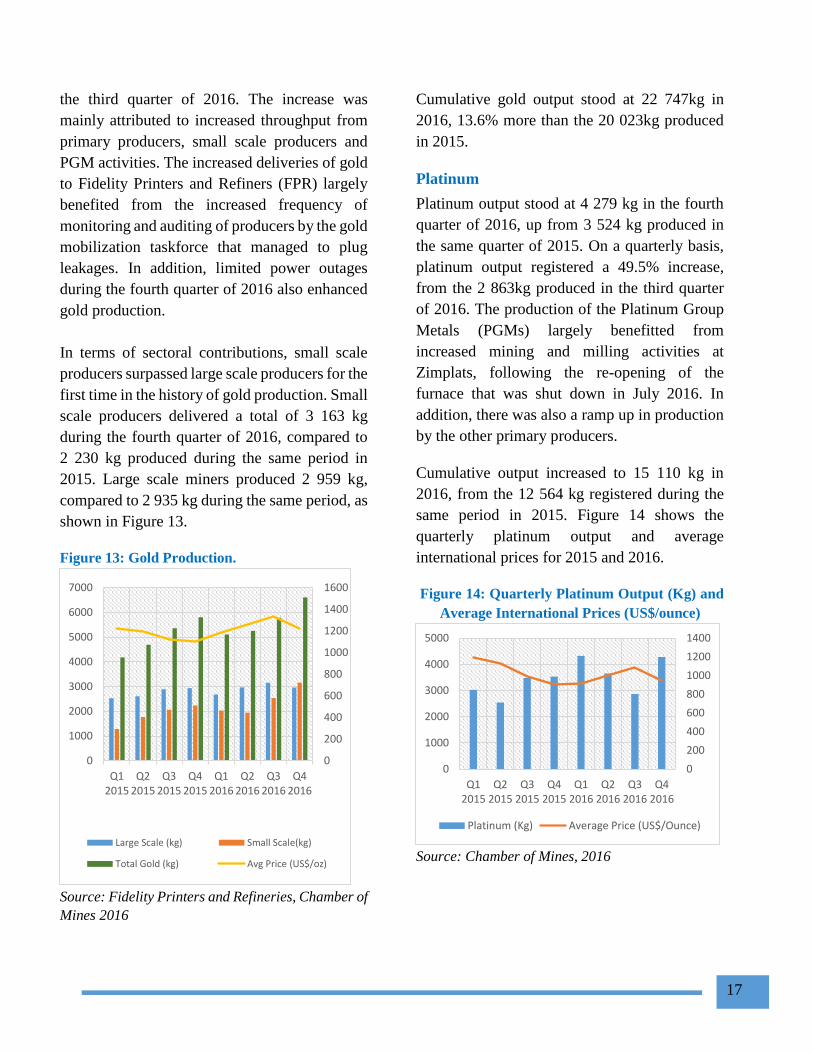
Gold
Gold output rose to 6 608 kg, in the fourth
quarter of 2016, compared to 5 798 kg produced
in the fourth quarter of 2015. On quarterly basis,
gold output increased by 14.3%, from 5 779kg in
0
2
4
6
8
10
12
14
16
18
Tho
usa
nd
s
Colcom Other
17
the third quarter of 2016. The increase was
mainly attributed to increased throughput from
primary producers, small scale producers and
PGM activities. The increased deliveries of gold
to Fidelity Printers and Refiners (FPR) largely
benefited from the increased frequency of
monitoring and auditing of producers by the gold
mobilization taskforce that managed to plug
leakages. In addition, limited power outages
during the fourth quarter of 2016 also enhanced
gold production.
In terms of sectoral contributions, small scale
producers surpassed large scale producers for the
first time in the history of gold production. Small
scale producers delivered a total of 3 163 kg
during the fourth quarter of 2016, compared to
2 230 kg produced during the same period in
2015. Large scale miners produced 2 959 kg,
compared to 2 935 kg during the same period, as
shown in Figure 13.
Figure 13: Gold Production.
Source: Fidelity Printers and Refineries, Chamber of
Mines 2016
Cumulative gold output stood at 22 747kg in
2016, 13.6% more than the 20 023kg produced
in 2015.
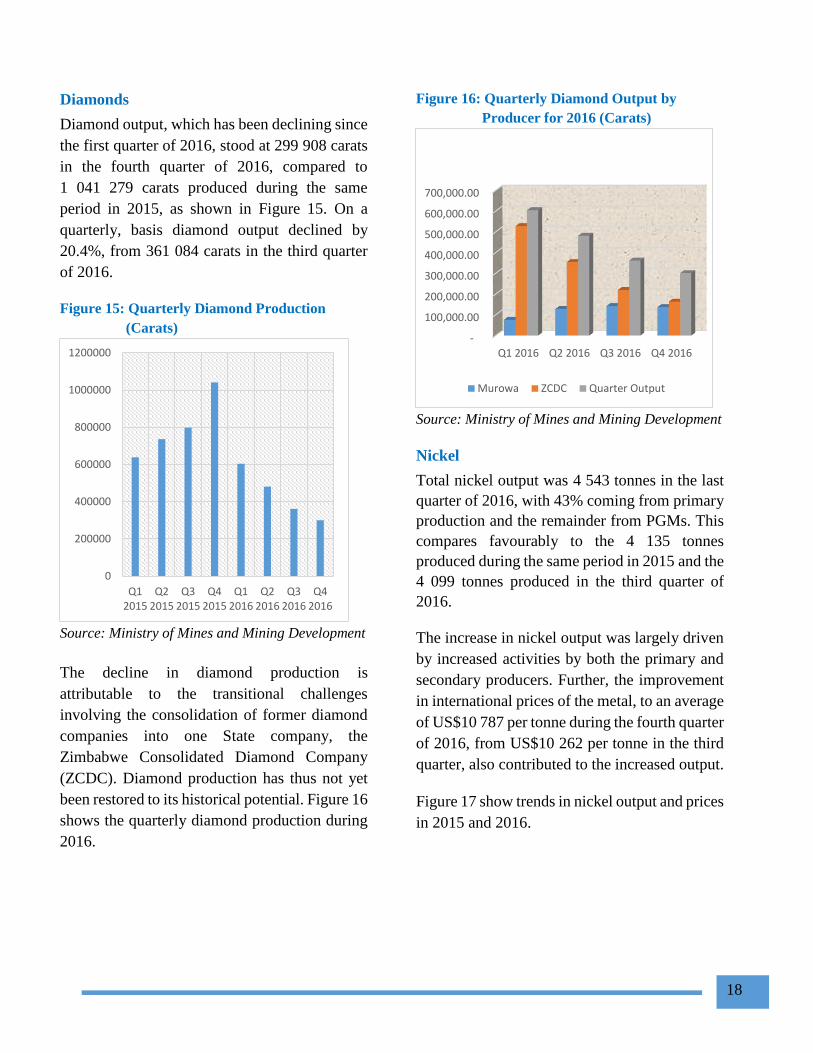
Platinum
Platinum output stood at 4 279 kg in the fourth
quarter of 2016, up from 3 524 kg produced in
the same quarter of 2015. On a quarterly basis,
platinum output registered a 49.5% increase,
from the 2 863kg produced in the third quarter
of 2016. The production of the Platinum Group
Metals (PGMs) largely benefitted from
increased mining and milling activities at
Zimplats, following the re-opening of the
furnace that was shut down in July 2016. In
addition, there was also a ramp up in production
by the other primary producers.
Cumulative output increased to 15 110 kg in
2016, from the 12 564 kg registered during the
same period in 2015. Figure 14 shows the
quarterly platinum output and average
international prices for 2015 and 2016.
Figure 14: Quarterly Platinum Output (Kg) and
Average International Prices (US$/ounce)
Source: Chamber of Mines, 2016
0
200
400
600
800
1000
1200
1400
1600
0
1000
2000
3000
4000
5000
6000
7000
Q12015
Q22015
Q32015
Q42015
Q12016
Q22016
Q32016
Q42016
Large Scale (kg) Small Scale(kg)
Total Gold (kg) Avg Price (US$/oz)
0
200
400
600
800
1000
1200
1400
0
1000
2000
3000
4000
5000
Q12015
Q22015
Q32015
Q42015
Q12016
Q22016
Q32016
Q42016
Platinum (Kg) Average Price (US$/Ounce)
18
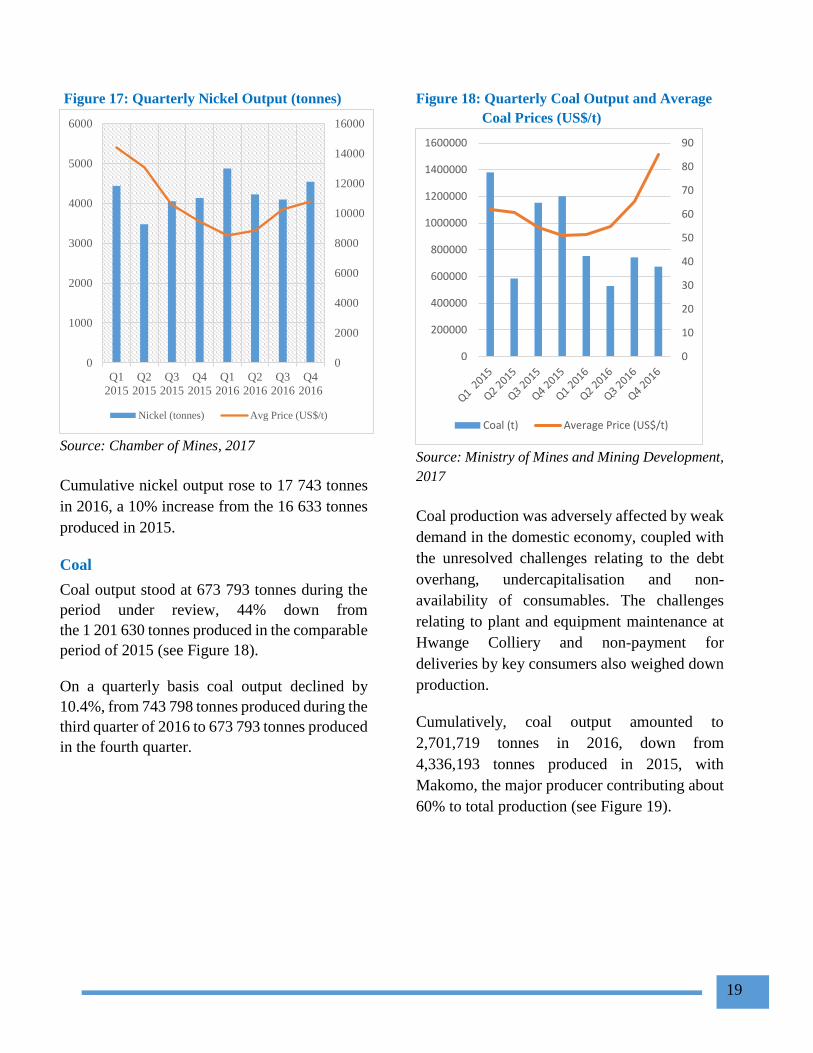
Diamonds
Diamond output, which has been declining since
the first quarter of 2016, stood at 299 908 carats
in the fourth quarter of 2016, compared to
1 041 279 carats produced during the same
period in 2015, as shown in Figure 15. On a
quarterly, basis diamond output declined by
20.4%, from 361 084 carats in the third quarter
of 2016.
Figure 15: Quarterly Diamond Production
(Carats)
Source: Ministry of Mines and Mining Development
The decline in diamond production is
attributable to the transitional challenges
involving the consolidation of former diamond
companies into one State company, the
Zimbabwe Consolidated Diamond Company
(ZCDC). Diamond production has thus not yet
been restored to its historical potential. Figure 16
shows the quarterly diamond production during
2016.
Figure 16: Quarterly Diamond Output by
Producer for 2016 (Carats)
Source: Ministry of Mines and Mining Development
Nickel
Total nickel output was 4 543 tonnes in the last
quarter of 2016, with 43% coming from primary
production and the remainder from PGMs. This
compares favourably to the 4 135 tonnes
produced during the same period in 2015 and the
4 099 tonnes produced in the third quarter of
2016.
The increase in nickel output was largely driven
by increased activities by both the primary and
secondary producers. Further, the improvement
in international prices of the metal, to an average
of US$10 787 per tonne during the fourth quarter
of 2016, from US$10 262 per tonne in the third
quarter, also contributed to the increased output.
Figure 17 show trends in nickel output and prices
in 2015 and 2016.
0
200000
400000
600000
800000
1000000
1200000
Q12015
Q22015
Q32015
Q42015
Q12016
Q22016
Q32016
Q42016
-
100,000.00
200,000.00
300,000.00
400,000.00
500,000.00
600,000.00
700,000.00
Q1 2016 Q2 2016 Q3 2016 Q4 2016
Murowa ZCDC Quarter Output
19
Figure 17: Quarterly Nickel Output (tonnes)
Source: Chamber of Mines, 2017
Cumulative nickel output rose to 17 743 tonnes
in 2016, a 10% increase from the 16 633 tonnes
produced in 2015.
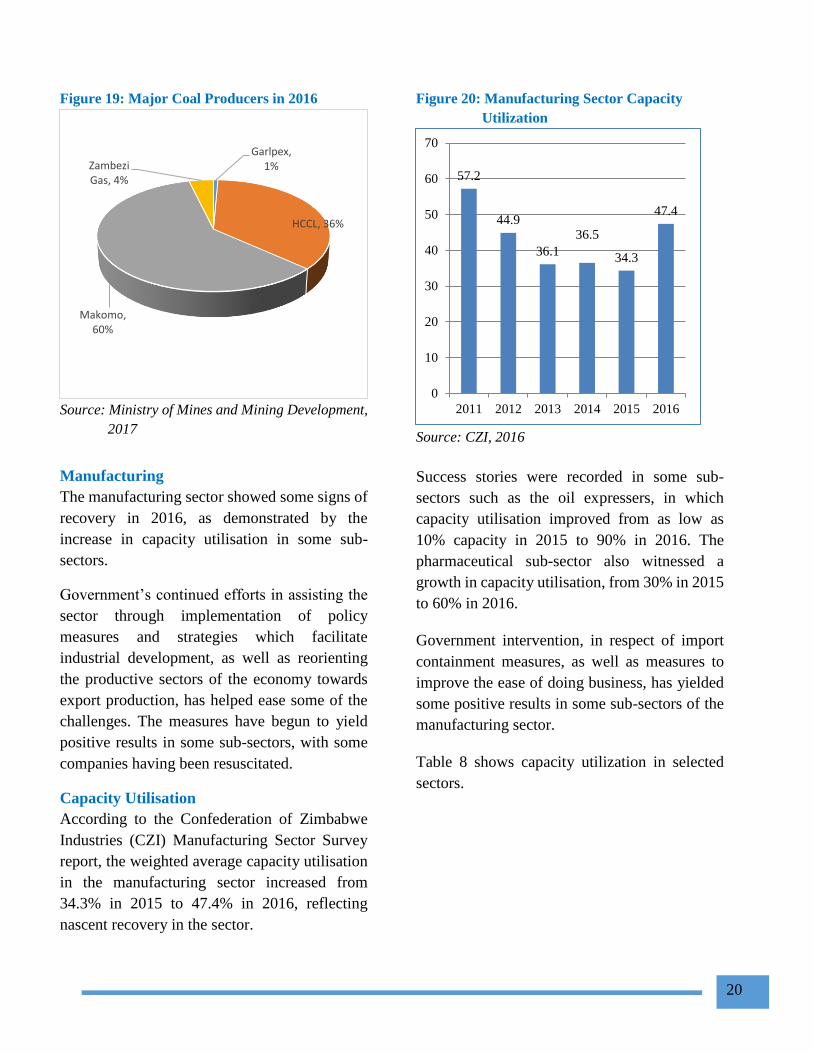
Coal
Coal output stood at 673 793 tonnes during the
period under review, 44% down from
the 1 201 630 tonnes produced in the comparable
period of 2015 (see Figure 18).
On a quarterly basis coal output declined by
10.4%, from 743 798 tonnes produced during the
third quarter of 2016 to 673 793 tonnes produced
in the fourth quarter.
Figure 18: Quarterly Coal Output and Average
Coal Prices (US$/t)
Source: Ministry of Mines and Mining Development,
2017
Coal production was adversely affected by weak
demand in the domestic economy, coupled with
the unresolved challenges relating to the debt
overhang, undercapitalisation and non-
availability of consumables. The challenges
relating to plant and equipment maintenance at
Hwange Colliery and non-payment for
deliveries by key consumers also weighed down
production.
Cumulatively, coal output amounted to
2,701,719 tonnes in 2016, down from
4,336,193 tonnes produced in 2015, with
Makomo, the major producer contributing about
60% to total production (see Figure 19).
0
2000
4000
6000
8000
10000
12000
14000
16000
0
1000
2000
3000
4000
5000
6000
Q1
2015
Q2
2015
Q3
2015
Q4
2015
Q1
2016
Q2
2016
Q3
2016
Q4
2016
Nickel (tonnes) Avg Price (US$/t)
0
10
20
30
40
50
60
70
80
90
0
200000
400000
600000
800000
1000000
1200000
1400000
1600000
Coal (t) Average Price (US$/t)
20
Figure 19: Major Coal Producers in 2016
Source: Ministry of Mines and Mining Development,
2017
Manufacturing
The manufacturing sector showed some signs of
recovery in 2016, as demonstrated by the
increase in capacity utilisation in some sub-
sectors.
Government’s continued efforts in assisting the
sector through implementation of policy
measures and strategies which facilitate
industrial development, as well as reorienting
the productive sectors of the economy towards
export production, has helped ease some of the
challenges. The measures have begun to yield
positive results in some sub-sectors, with some
companies having been resuscitated.
Capacity Utilisation
According to the Confederation of Zimbabwe
Industries (CZI) Manufacturing Sector Survey
report, the weighted average capacity utilisation
in the manufacturing sector increased from
34.3% in 2015 to 47.4% in 2016, reflecting
nascent recovery in the sector.
Figure 20: Manufacturing Sector Capacity
Utilization
Source: CZI, 2016
Success stories were recorded in some sub-
sectors such as the oil expressers, in which
capacity utilisation improved from as low as
10% capacity in 2015 to 90% in 2016. The
pharmaceutical sub-sector also witnessed a
growth in capacity utilisation, from 30% in 2015
to 60% in 2016.
Government intervention, in respect of import
containment measures, as well as measures to
improve the ease of doing business, has yielded
some positive results in some sub-sectors of the
manufacturing sector.
Table 8 shows capacity utilization in selected
sectors.
Garlpex, 1%
HCCL, 36%
Makomo, 60%
Zambezi Gas, 4% 57.2
44.9
36.1
36.5
34.3
47.4
0
10
20
30
40
50
60
70
2011 2012 2013 2014 2015 2016
21
Table 8: Average Capacity Utilisation in 2016
Sector Capacity
Utilisation
Food-stuffs 56.1%
Drink and Tobacco 52.4%
Clothing and
Footwear
46%
Chemical and
Petroleum
43.6%
Non Metalic Mineral
Products
57.5%
Paper, printing and
packaging
52.9%
Transport Equipment 45%
Wood and Furniture 54.8%
Source: CZI, 2016
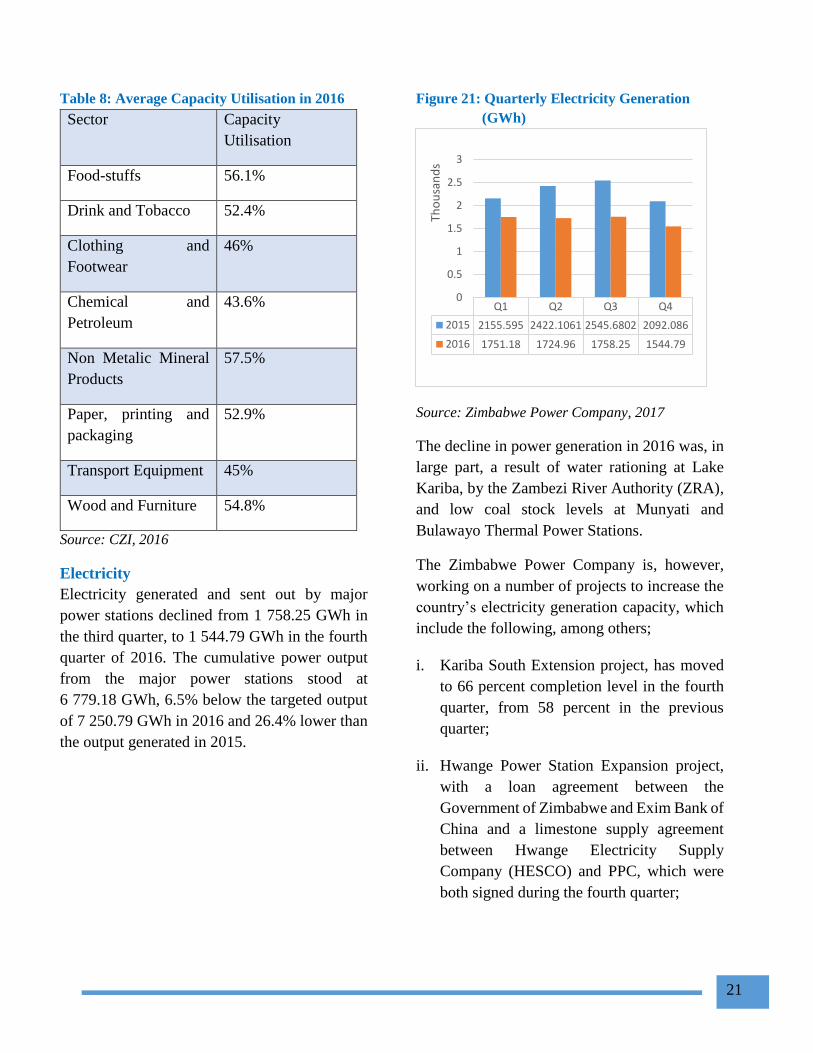
Electricity
Electricity generated and sent out by major
power stations declined from 1 758.25 GWh in
the third quarter, to 1 544.79 GWh in the fourth
quarter of 2016. The cumulative power output
from the major power stations stood at
6 779.18 GWh, 6.5% below the targeted output
of 7 250.79 GWh in 2016 and 26.4% lower than
the output generated in 2015.
Figure 21: Quarterly Electricity Generation
(GWh)
Source: Zimbabwe Power Company, 2017
The decline in power generation in 2016 was, in
large part, a result of water rationing at Lake
Kariba, by the Zambezi River Authority (ZRA),
and low coal stock levels at Munyati and
Bulawayo Thermal Power Stations.
The Zimbabwe Power Company is, however,
working on a number of projects to increase the
country’s electricity generation capacity, which
include the following, among others;
i. Kariba South Extension project, has moved
to 66 percent completion level in the fourth
quarter, from 58 percent in the previous
quarter;
ii. Hwange Power Station Expansion project,
with a loan agreement between the
Government of Zimbabwe and Exim Bank of
China and a limestone supply agreement
between Hwange Electricity Supply
Company (HESCO) and PPC, which were
both signed during the fourth quarter;
Q1 Q2 Q3 Q4
2015 2155.595 2422.1061 2545.6802 2092.086
2016 1751.18 1724.96 1758.25 1544.79
0
0.5
1
1.5
2
2.5
3
Tho
usa
nd
s
22
iii. The Deka Pump Station and pipeline, which
is undergoing assessment of the costs of
engineering, procurement and construction;
and
iv. Batoka Gorge Hydro Electric Scheme,
whose environmental impact assessment
studies and engineering feasibility studies
are being finalized.
The current good rains are also expected to
increase electricity generation at Kariba and
other small hydro stations.
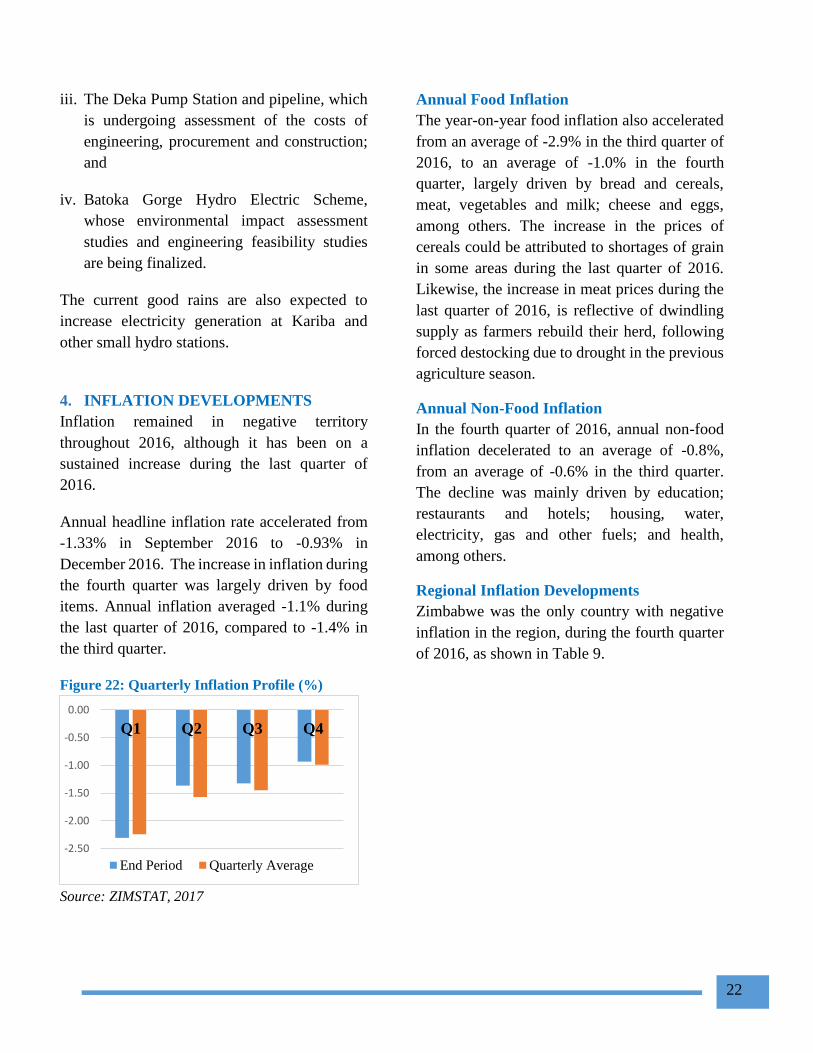
4. INFLATION DEVELOPMENTS
Inflation remained in negative territory
throughout 2016, although it has been on a
sustained increase during the last quarter of
2016.
Annual headline inflation rate accelerated from
-1.33% in September 2016 to -0.93% in
December 2016. The increase in inflation during
the fourth quarter was largely driven by food
items. Annual inflation averaged -1.1% during
the last quarter of 2016, compared to -1.4% in
the third quarter.
Figure 22: Quarterly Inflation Profile (%)
Source: ZIMSTAT, 2017
Annual Food Inflation
The year-on-year food inflation also accelerated
from an average of -2.9% in the third quarter of
2016, to an average of -1.0% in the fourth
quarter, largely driven by bread and cereals,
meat, vegetables and milk; cheese and eggs,
among others. The increase in the prices of
cereals could be attributed to shortages of grain
in some areas during the last quarter of 2016.
Likewise, the increase in meat prices during the
last quarter of 2016, is reflective of dwindling
supply as farmers rebuild their herd, following
forced destocking due to drought in the previous
agriculture season.
Annual Non-Food Inflation
In the fourth quarter of 2016, annual non-food
inflation decelerated to an average of -0.8%,
from an average of -0.6% in the third quarter.
The decline was mainly driven by education;
restaurants and hotels; housing, water,
electricity, gas and other fuels; and health,
among others.
Regional Inflation Developments
Zimbabwe was the only country with negative
inflation in the region, during the fourth quarter
of 2016, as shown in Table 9.
-2.50
-2.00
-1.50
-1.00
-0.50
0.00
Q1 Q2 Q3 Q4
End Period Quarterly Average
23
Table 9: Annual Inflation rates for selected SADC
Member Countries and USA (%)
Zim SA Bot Moz Tan Zam Mal USA
Jun
2016
-1.4 6.3 2.7 19.7 5.5 21.0 22.6 1.0
Sept
2016
-1.3 6.1 2.8 24.9 4.5 18.9 21.2 1.5
Dec
2016
-0.9 6.8 3.0 25.3 5.0 7.5 20.0 2.1
Source: Country Central Bank Websites, 2017
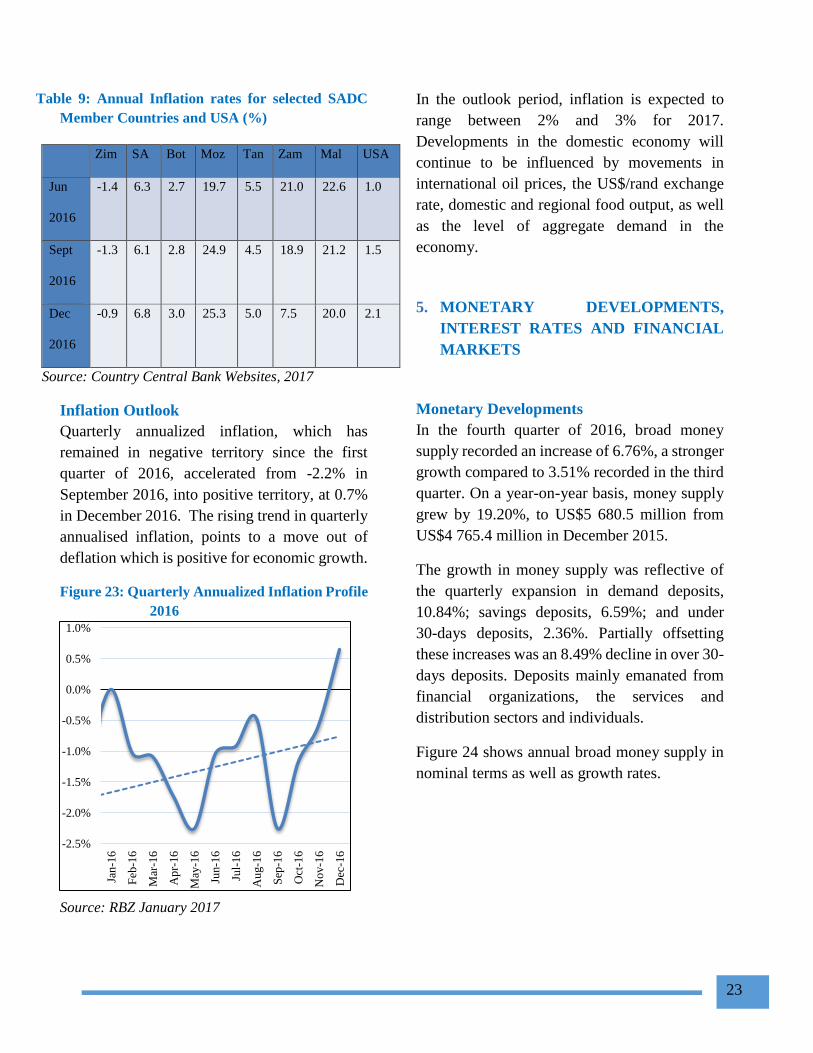
Inflation Outlook
Quarterly annualized inflation, which has
remained in negative territory since the first
quarter of 2016, accelerated from -2.2% in
September 2016, into positive territory, at 0.7%
in December 2016. The rising trend in quarterly
annualised inflation, points to a move out of
deflation which is positive for economic growth.
Figure 23: Quarterly Annualized Inflation Profile
2016
Source: RBZ January 2017
In the outlook period, inflation is expected to
range between 2% and 3% for 2017.
Developments in the domestic economy will
continue to be influenced by movements in
international oil prices, the US$/rand exchange
rate, domestic and regional food output, as well
as the level of aggregate demand in the
economy.
5. MONETARY DEVELOPMENTS,
INTEREST RATES AND FINANCIAL
MARKETS
Monetary Developments
In the fourth quarter of 2016, broad money
supply recorded an increase of 6.76%, a stronger
growth compared to 3.51% recorded in the third
quarter. On a year-on-year basis, money supply
grew by 19.20%, to US$5 680.5 million from
US$4 765.4 million in December 2015.
The growth in money supply was reflective of
the quarterly expansion in demand deposits,
10.84%; savings deposits, 6.59%; and under
30-days deposits, 2.36%. Partially offsetting
these increases was an 8.49% decline in over 30-
days deposits. Deposits mainly emanated from
financial organizations, the services and
distribution sectors and individuals.
Figure 24 shows annual broad money supply in
nominal terms as well as growth rates.
-2.5%
-2.0%
-1.5%
-1.0%
-0.5%
0.0%
0.5%
1.0%
Jan
-16
Feb
-16
Mar
-16
Ap
r-16
May
-16
Jun-1
6
Jul-
16
Au
g-1
6
Sep
-16
Oct
-16
No
v-1
6
Dec
-16
24
Figure 24: Annual Broad Money Supply Growth
Rates and Levels
Source: RBZ, 2016
Domestic Credit
Net domestic credit increased by 9.49%, from
US$5 829.1 million in the third quarter to
US$6 382.3 million in the fourth quarter of 2016.
Credit extended to the private sector increased
by 3.63% to US$3 648.2 million in the fourth
quarter of 2016, from US$3 520.3 million in the
third quarter.
Outstanding private sector credit was channelled
to households, 22.40%; agriculture, 15.95%;
services, 15.19%; manufacturing, 13.81%;
distribution, 11.38%; financial organisations and
investments, 11.97%; mining, 4.92%; transport
and communications, 2.06%; and construction,
1.51%.
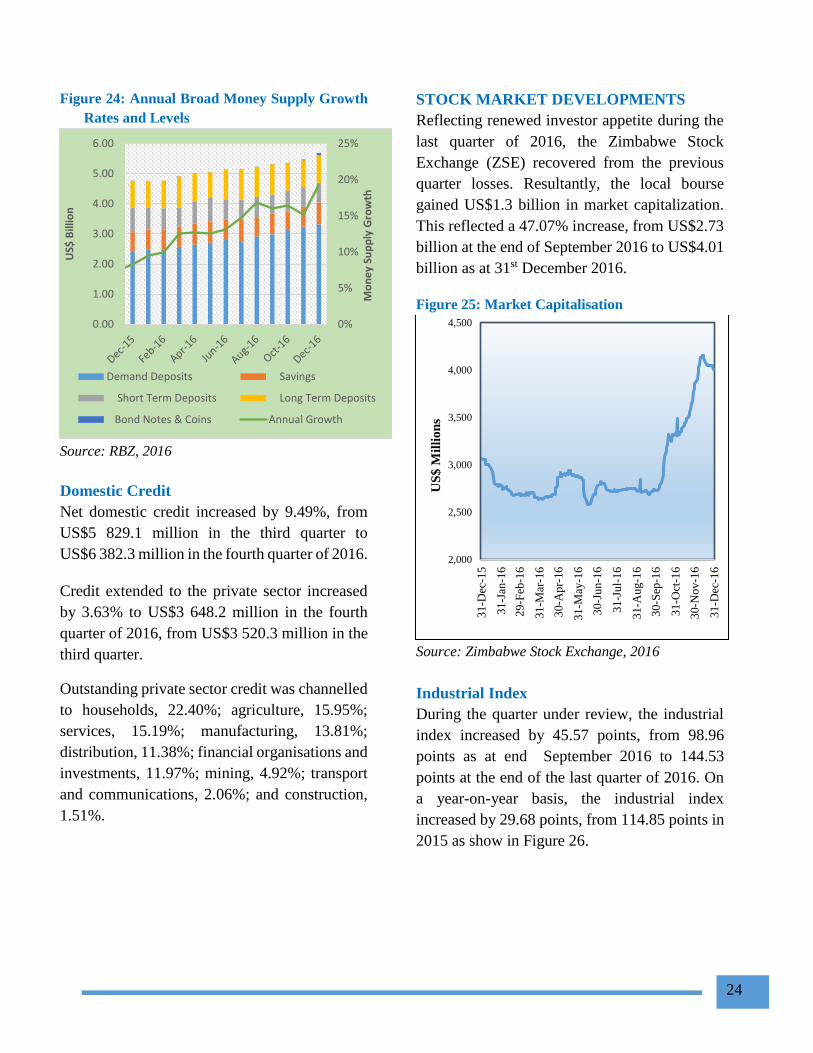
STOCK MARKET DEVELOPMENTS
Reflecting renewed investor appetite during the
last quarter of 2016, the Zimbabwe Stock
Exchange (ZSE) recovered from the previous
quarter losses. Resultantly, the local bourse
gained US$1.3 billion in market capitalization.
This reflected a 47.07% increase, from US$2.73
billion at the end of September 2016 to US$4.01
billion as at 31st December 2016.
Figure 25: Market Capitalisation
Source: Zimbabwe Stock Exchange, 2016
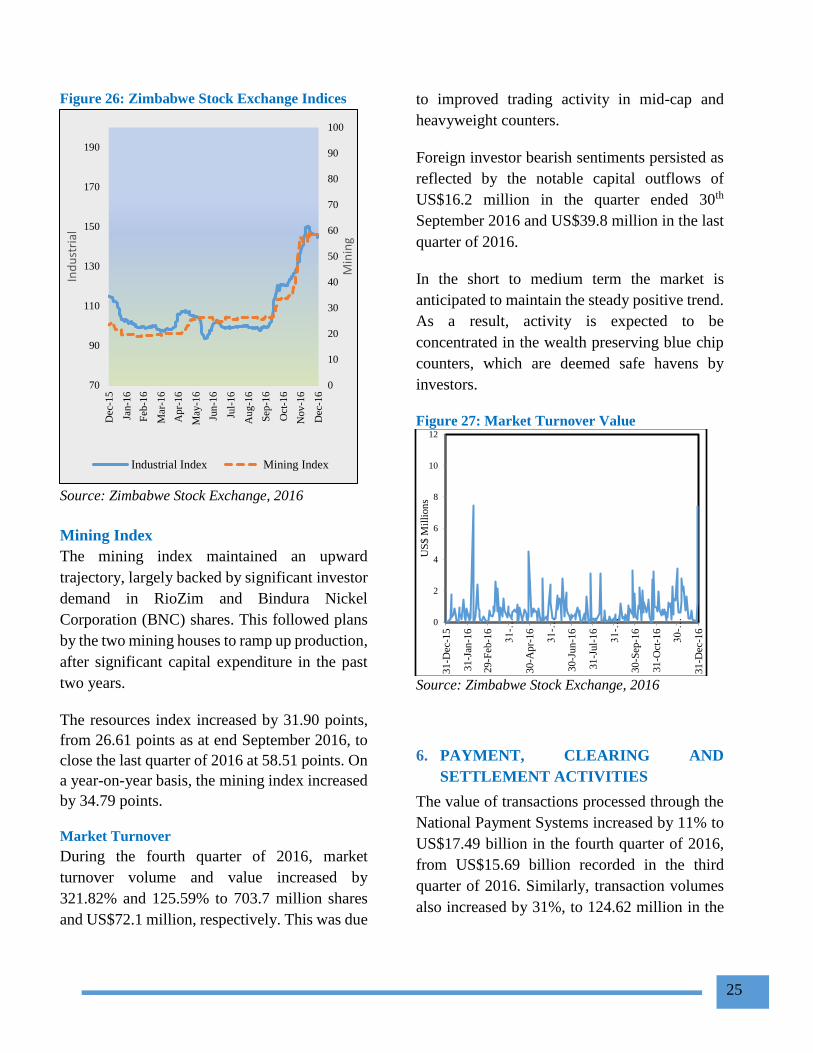
Industrial Index
During the quarter under review, the industrial
index increased by 45.57 points, from 98.96
points as at end September 2016 to 144.53
points at the end of the last quarter of 2016. On
a year-on-year basis, the industrial index
increased by 29.68 points, from 114.85 points in
2015 as show in Figure 26.
0%
5%
10%
15%
20%
25%
0.00
1.00
2.00
3.00
4.00
5.00
6.00
Mo
ne
y Su
pp
ly G
row
th
US$
Bill
ion
Demand Deposits Savings
Short Term Deposits Long Term Deposits
Bond Notes & Coins Annual Growth
2,000
2,500
3,000
3,500
4,000
4,500
31-D
ec-1
5
31-J
an-1
6
29-F
eb-1
6
31-M
ar-1
6
30-A
pr-
16
31-M
ay-1
6
30-J
un-1
6
31-J
ul-
16
31-A
ug-1
6
30-S
ep-1
6
31-O
ct-1
6
30-N
ov-1
6
31-D
ec-1
6
US
$ M
illi
on
s
25
Figure 26: Zimbabwe Stock Exchange Indices
Source: Zimbabwe Stock Exchange, 2016
Mining Index
The mining index maintained an upward
trajectory, largely backed by significant investor
demand in RioZim and Bindura Nickel
Corporation (BNC) shares. This followed plans
by the two mining houses to ramp up production,
after significant capital expenditure in the past
two years.
The resources index increased by 31.90 points,
from 26.61 points as at end September 2016, to
close the last quarter of 2016 at 58.51 points. On
a year-on-year basis, the mining index increased
by 34.79 points.
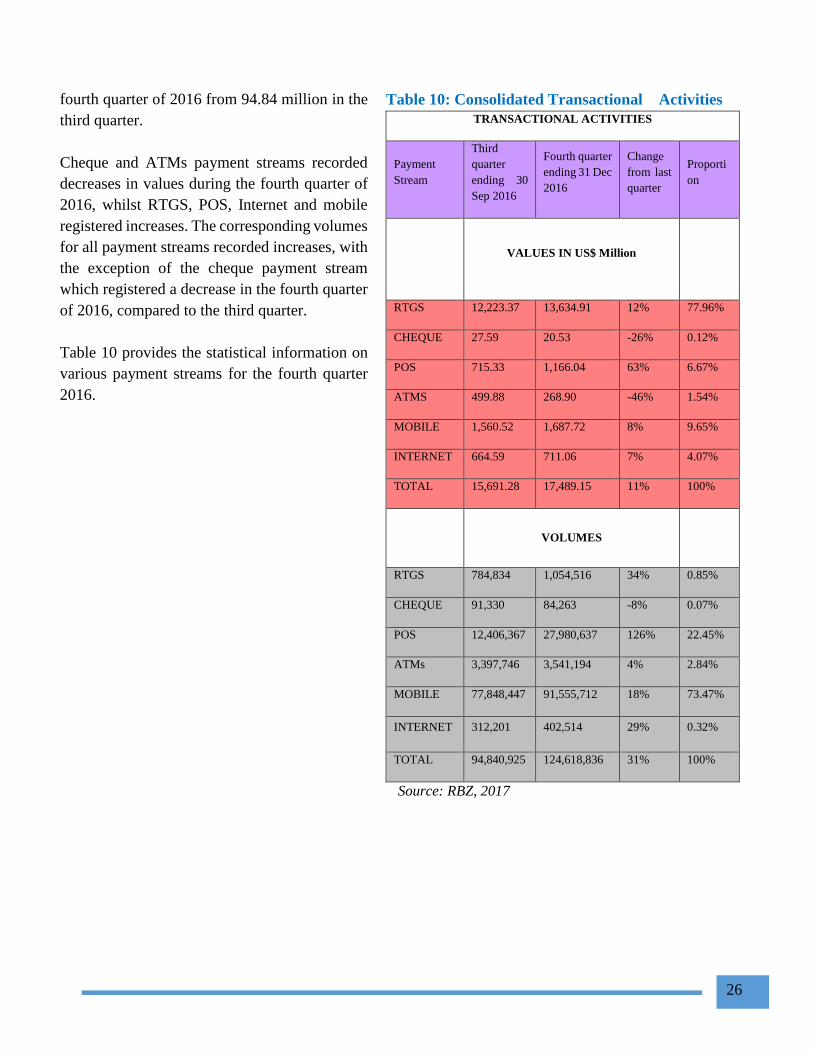
Market Turnover
During the fourth quarter of 2016, market
turnover volume and value increased by
321.82% and 125.59% to 703.7 million shares
and US$72.1 million, respectively. This was due
to improved trading activity in mid-cap and
heavyweight counters.
Foreign investor bearish sentiments persisted as
reflected by the notable capital outflows of
US$16.2 million in the quarter ended 30th
September 2016 and US$39.8 million in the last
quarter of 2016.
In the short to medium term the market is
anticipated to maintain the steady positive trend.
As a result, activity is expected to be
concentrated in the wealth preserving blue chip
counters, which are deemed safe havens by
investors.
Figure 27: Market Turnover Value
Source: Zimbabwe Stock Exchange, 2016
6. PAYMENT, CLEARING AND
SETTLEMENT ACTIVITIES
The value of transactions processed through the
National Payment Systems increased by 11% to
US$17.49 billion in the fourth quarter of 2016,
from US$15.69 billion recorded in the third
quarter of 2016. Similarly, transaction volumes
also increased by 31%, to 124.62 million in the
0
10
20
30
40
50
60
70
80
90
100
70
90
110
130
150
170
190
Dec
-15
Jan-1
6
Feb
-16
Mar
-16
Apr-
16
May
-16
Jun
-16
Jul-
16
Aug
-16
Sep
-16
Oct
-16
Nov
-16
Dec
-16
Min
ing
Ind
ust
rial
Industrial Index Mining Index
0
2
4
6
8
10
12
31
-Dec
-15
31
-Jan
-16
29
-Feb
-16
31
-…
30
-Apr-
16
31
-…
30
-Jun
-16
31
-Jul-
16
31
-…
30
-Sep
-16
31
-Oct
-16
30
-…
31
-Dec
-16
US
$ M
illi
on
s
26
fourth quarter of 2016 from 94.84 million in the
third quarter.
Cheque and ATMs payment streams recorded
decreases in values during the fourth quarter of
2016, whilst RTGS, POS, Internet and mobile
registered increases. The corresponding volumes
for all payment streams recorded increases, with
the exception of the cheque payment stream
which registered a decrease in the fourth quarter
of 2016, compared to the third quarter.
Table 10 provides the statistical information on
various payment streams for the fourth quarter
2016.
Table 10: Consolidated Transactional Activities
TRANSACTIONAL ACTIVITIES
Payment
Stream
Third
quarter
ending 30
Sep 2016
Fourth quarter
ending 31 Dec
2016
Change
from last
quarter
Proporti
on
VALUES IN US$ Million
RTGS 12,223.37 13,634.91 12% 77.96%
CHEQUE 27.59 20.53 -26% 0.12%
POS 715.33 1,166.04 63% 6.67%
ATMS 499.88 268.90 -46% 1.54%
MOBILE 1,560.52 1,687.72 8% 9.65%
INTERNET 664.59 711.06 7% 4.07%
TOTAL 15,691.28 17,489.15 11% 100%
VOLUMES
RTGS 784,834 1,054,516 34% 0.85%
CHEQUE 91,330 84,263 -8% 0.07%
POS 12,406,367 27,980,637 126% 22.45%
ATMs 3,397,746 3,541,194 4% 2.84%
MOBILE 77,848,447 91,555,712 18% 73.47%
INTERNET 312,201 402,514 29% 0.32%
TOTAL 94,840,925 124,618,836 31% 100%
Source: RBZ, 2017
27
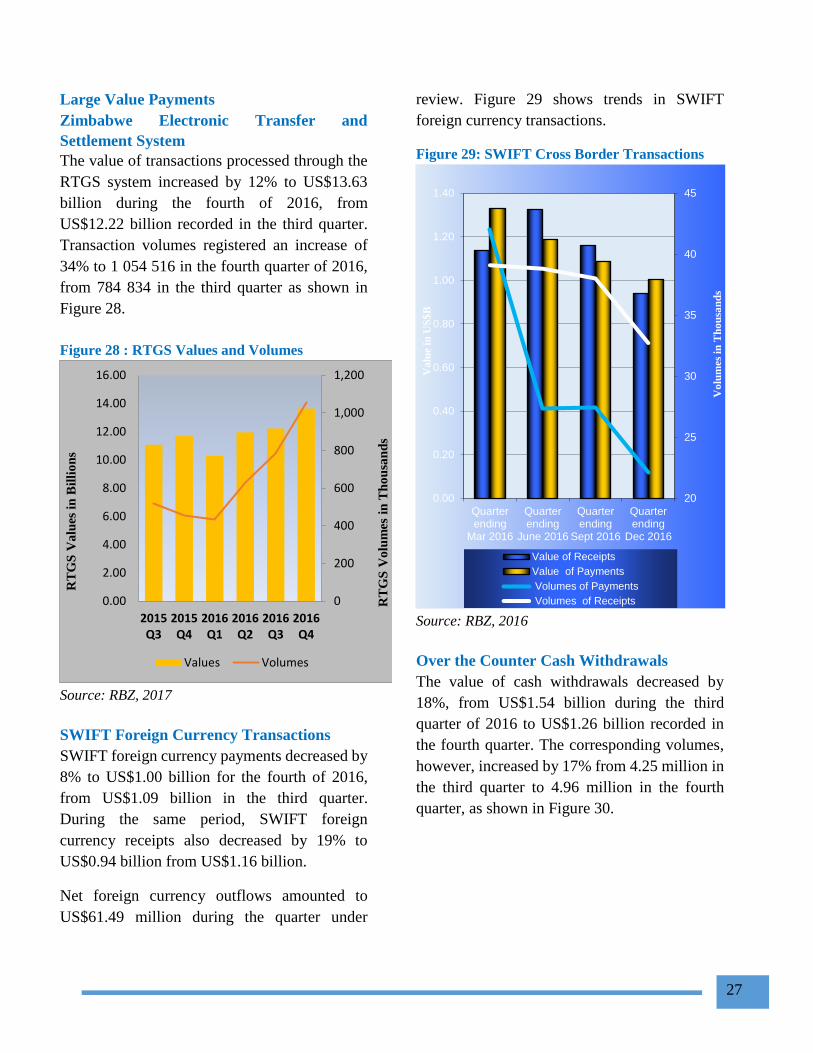
Large Value Payments
Zimbabwe Electronic Transfer and
Settlement System
The value of transactions processed through the
RTGS system increased by 12% to US$13.63
billion during the fourth of 2016, from
US$12.22 billion recorded in the third quarter.
Transaction volumes registered an increase of
34% to 1 054 516 in the fourth quarter of 2016,
from 784 834 in the third quarter as shown in
Figure 28.
Figure 28 : RTGS Values and Volumes
Source: RBZ, 2017
SWIFT Foreign Currency Transactions
SWIFT foreign currency payments decreased by
8% to US$1.00 billion for the fourth of 2016,
from US$1.09 billion in the third quarter.
During the same period, SWIFT foreign
currency receipts also decreased by 19% to
US$0.94 billion from US$1.16 billion.
Net foreign currency outflows amounted to
US$61.49 million during the quarter under
review. Figure 29 shows trends in SWIFT
foreign currency transactions.
Figure 29: SWIFT Cross Border Transactions
Source: RBZ, 2016
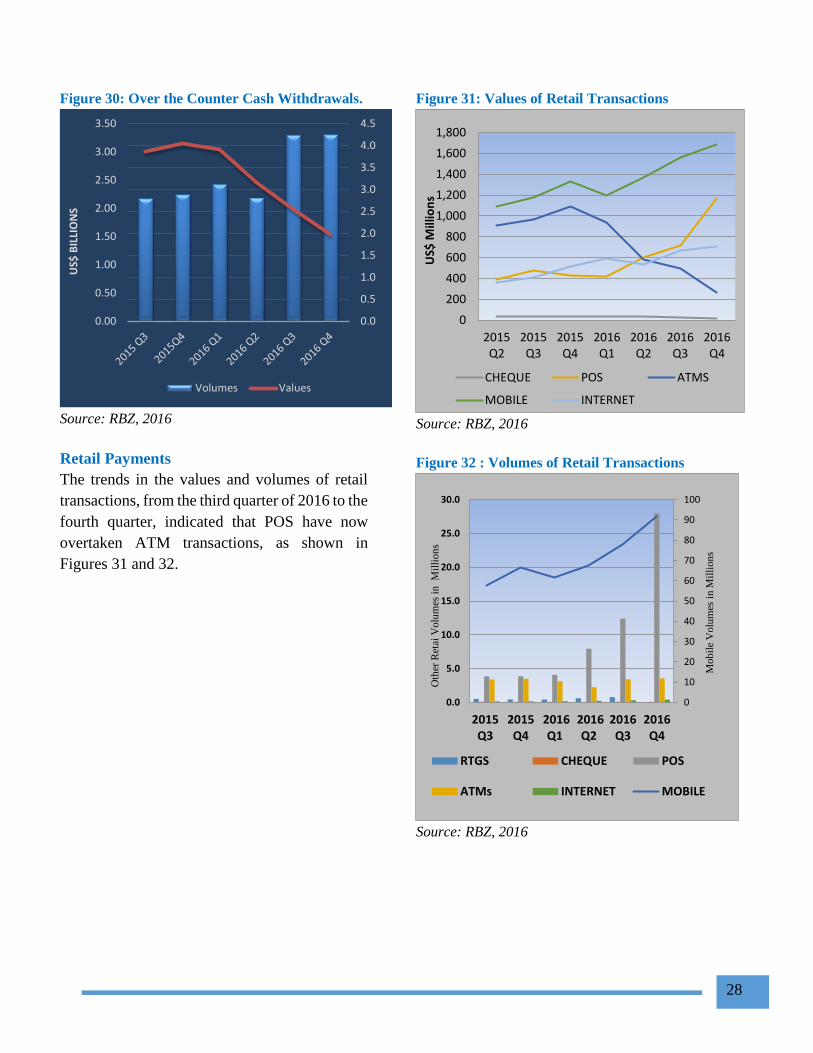
Over the Counter Cash Withdrawals
The value of cash withdrawals decreased by
18%, from US$1.54 billion during the third
quarter of 2016 to US$1.26 billion recorded in
the fourth quarter. The corresponding volumes,
however, increased by 17% from 4.25 million in
the third quarter to 4.96 million in the fourth
quarter, as shown in Figure 30.
0
200
400
600
800
1,000
1,200
0.00
2.00
4.00
6.00
8.00
10.00
12.00
14.00
16.00
2015Q3
2015Q4
2016Q1
2016Q2
2016Q3
2016Q4
RT
GS
Va
lues
in
Bil
lio
ns
RT
GS
Vo
lum
es i
n T
ho
usa
nd
s
Values Volumes
20
25
30
35
40
45
0.00
0.20
0.40
0.60
0.80
1.00
1.20
1.40
Quarterending
Mar 2016
Quarterending
June 2016
Quarterending
Sept 2016
Quarterending
Dec 2016
Vo
lum
es
in T
ho
usa
nd
s
Va
lue i
n U
S$
B
Value of Receipts
Value of Payments
Volumes of Payments
Volumes of Receipts
28
Figure 30: Over the Counter Cash Withdrawals.
Source: RBZ, 2016
Retail Payments
The trends in the values and volumes of retail
transactions, from the third quarter of 2016 to the
fourth quarter, indicated that POS have now
overtaken ATM transactions, as shown in
Figures 31 and 32.
Figure 31: Values of Retail Transactions
Source: RBZ, 2016
Figure 32 : Volumes of Retail Transactions
Source: RBZ, 2016
0.00
0.50
1.00
1.50
2.00
2.50
3.00
3.50
0.0
0.5
1.0
1.5
2.0
2.5
3.0
3.5
4.0
4.5
US$
BIL
LIO
NS
MIL
LIO
NS
Volumes Values
0
200
400
600
800
1,000
1,200
1,400
1,600
1,800
2015Q2
2015Q3
2015Q4
2016Q1
2016Q2
2016Q3
2016Q4
US$
Mill
ion
s
CHEQUE POS ATMS
MOBILE INTERNET
0
10
20
30
40
50
60
70
80
90
100
0.0
5.0
10.0
15.0
20.0
25.0
30.0
2015Q3
2015Q4
2016Q1
2016Q2
2016Q3
2016Q4
Mob
ile
Volu
mes
in
Mil
lion
s
Oth
er R
etai
Volu
mes
in
M
illi
on
s
RTGS CHEQUE POS
ATMs INTERNET MOBILE
29
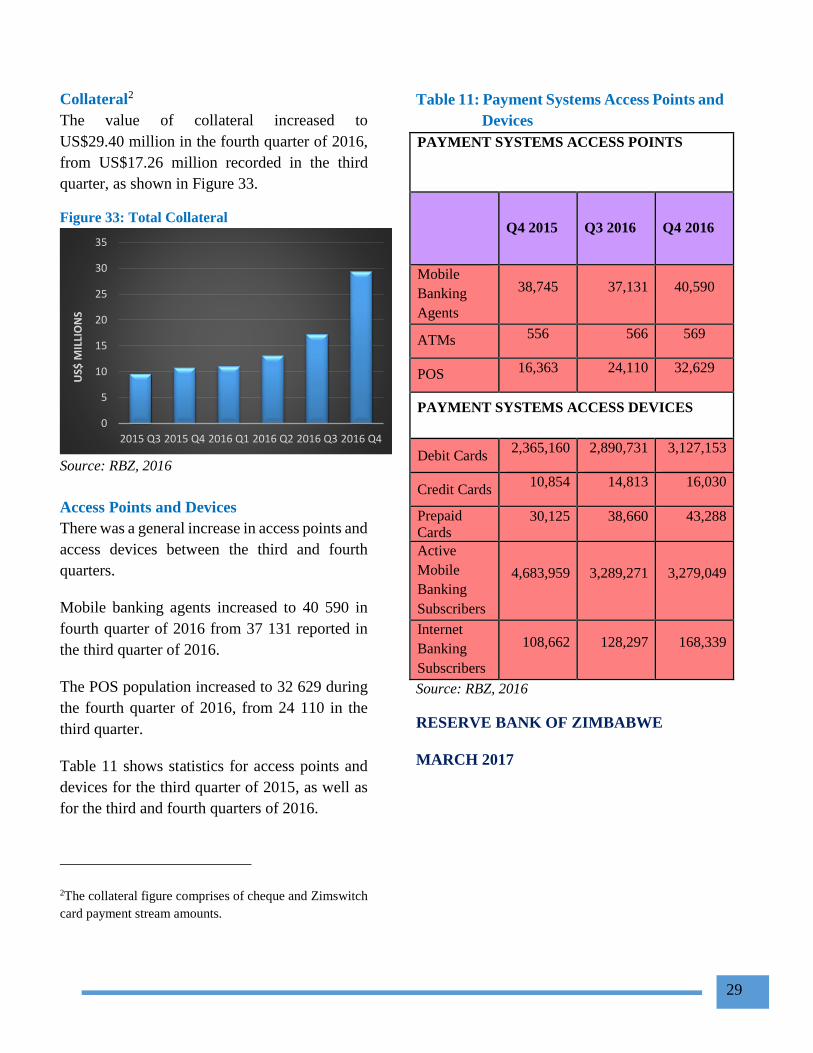
Collateral2
The value of collateral increased to
US$29.40 million in the fourth quarter of 2016,
from US$17.26 million recorded in the third
quarter, as shown in Figure 33.
Figure 33: Total Collateral
Source: RBZ, 2016
Access Points and Devices
There was a general increase in access points and
access devices between the third and fourth
quarters.
Mobile banking agents increased to 40 590 in
fourth quarter of 2016 from 37 131 reported in
the third quarter of 2016.
The POS population increased to 32 629 during
the fourth quarter of 2016, from 24 110 in the
third quarter.
Table 11 shows statistics for access points and
devices for the third quarter of 2015, as well as
for the third and fourth quarters of 2016.
2The collateral figure comprises of cheque and Zimswitch
card payment stream amounts.
Table 11: Payment Systems Access Points and
Devices
PAYMENT SYSTEMS ACCESS POINTS
Q4 2015 Q3 2016 Q4 2016
Mobile
Banking
Agents
38,745 37,131 40,590
ATMs 556 566 569
POS 16,363 24,110 32,629
PAYMENT SYSTEMS ACCESS DEVICES
Debit Cards 2,365,160 2,890,731 3,127,153
Credit Cards 10,854 14,813 16,030
Prepaid
Cards 30,125 38,660 43,288
Active
Mobile
Banking
Subscribers
4,683,959 3,289,271 3,279,049
Internet
Banking
Subscribers
108,662 128,297 168,339
Source: RBZ, 2016
RESERVE BANK OF ZIMBABWE
MARCH 2017
0
5
10
15
20
25
30
35
2015 Q3 2015 Q4 2016 Q1 2016 Q2 2016 Q3 2016 Q4
US$
MIL
LIO
NS
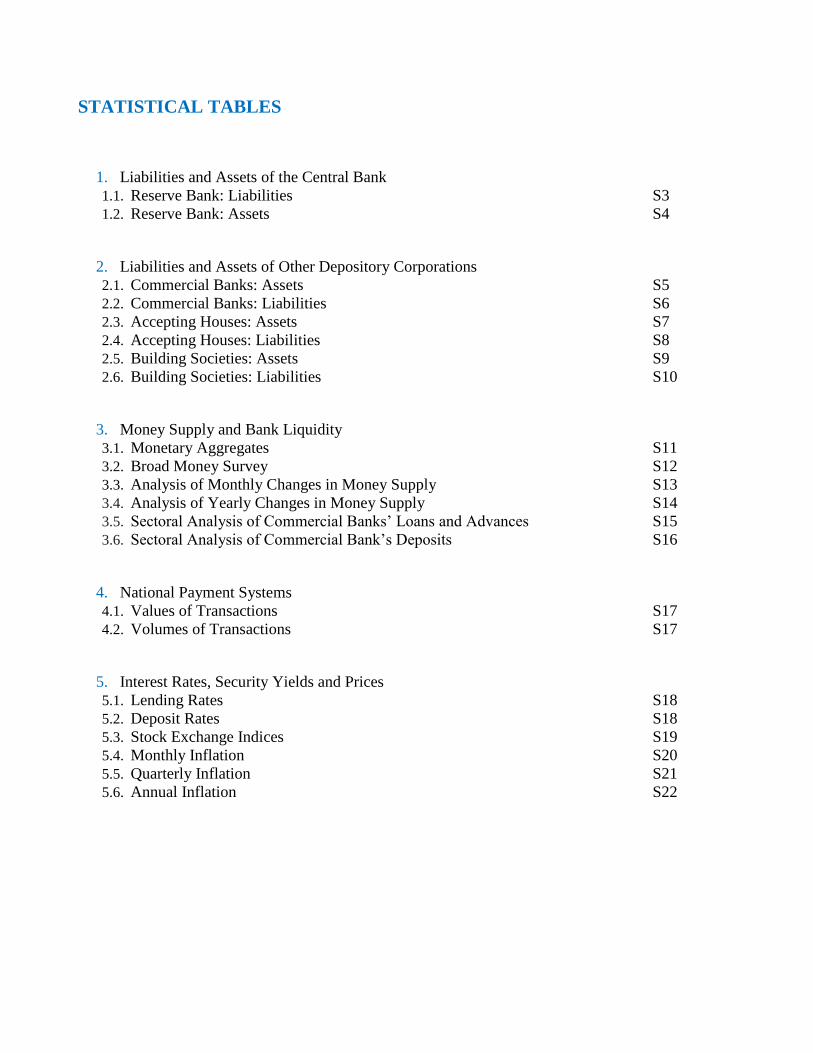
STATISTICAL TABLES
1. Liabilities and Assets of the Central Bank
1.1. Reserve Bank: Liabilities S3
1.2. Reserve Bank: Assets S4
2. Liabilities and Assets of Other Depository Corporations
2.1. Commercial Banks: Assets S5
2.2. Commercial Banks: Liabilities S6
2.3. Accepting Houses: Assets S7
2.4. Accepting Houses: Liabilities S8
2.5. Building Societies: Assets S9
2.6. Building Societies: Liabilities S10
3. Money Supply and Bank Liquidity
3.1. Monetary Aggregates S11
3.2. Broad Money Survey S12
3.3. Analysis of Monthly Changes in Money Supply S13
3.4. Analysis of Yearly Changes in Money Supply S14
3.5. Sectoral Analysis of Commercial Banks’ Loans and Advances S15
3.6. Sectoral Analysis of Commercial Bank’s Deposits S16
4. National Payment Systems
4.1. Values of Transactions S17
4.2. Volumes of Transactions S17
5. Interest Rates, Security Yields and Prices
5.1. Lending Rates S18
5.2. Deposit Rates S18
5.3. Stock Exchange Indices S19
5.4. Monthly Inflation S20
5.5. Quarterly Inflation S21
5.6. Annual Inflation S22
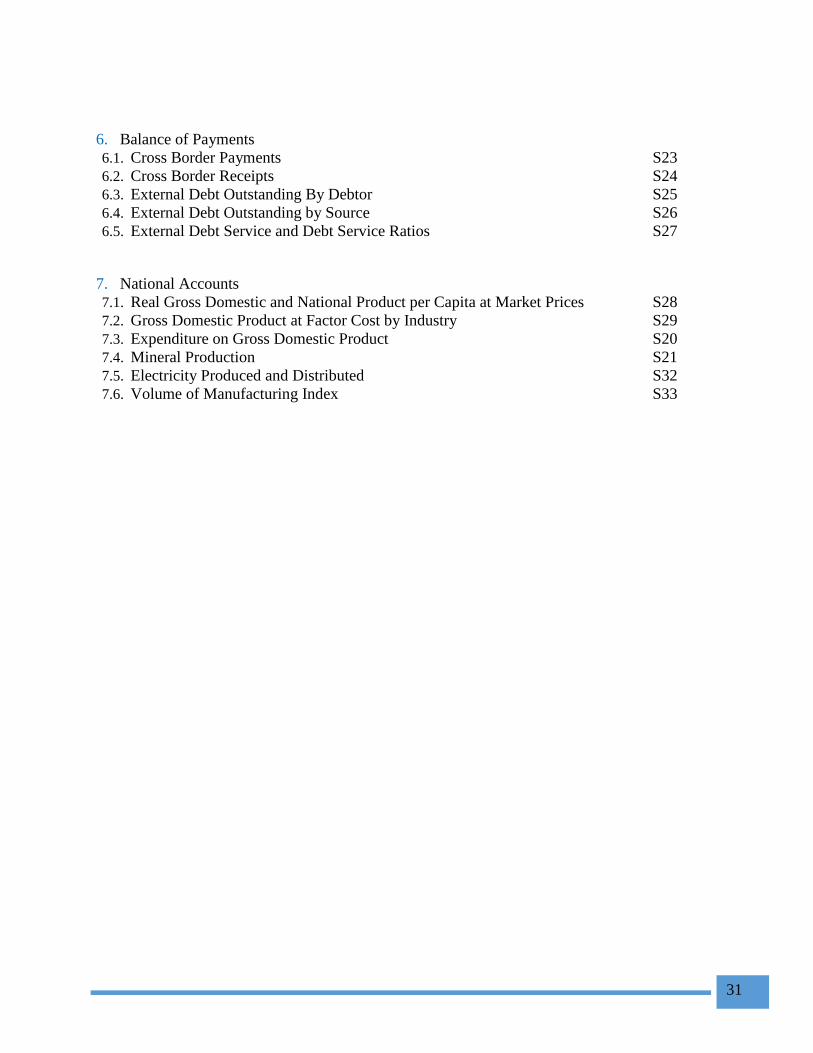
31
6. Balance of Payments
6.1. Cross Border Payments S23
6.2. Cross Border Receipts S24
6.3. External Debt Outstanding By Debtor S25
6.4. External Debt Outstanding by Source S26
6.5. External Debt Service and Debt Service Ratios S27
7. National Accounts
7.1. Real Gross Domestic and National Product per Capita at Market Prices S28
7.2. Gross Domestic Product at Factor Cost by Industry S29
7.3. Expenditure on Gross Domestic Product S20
7.4. Mineral Production S21
7.5. Electricity Produced and Distributed S32
7.6. Volume of Manufacturing Index S33
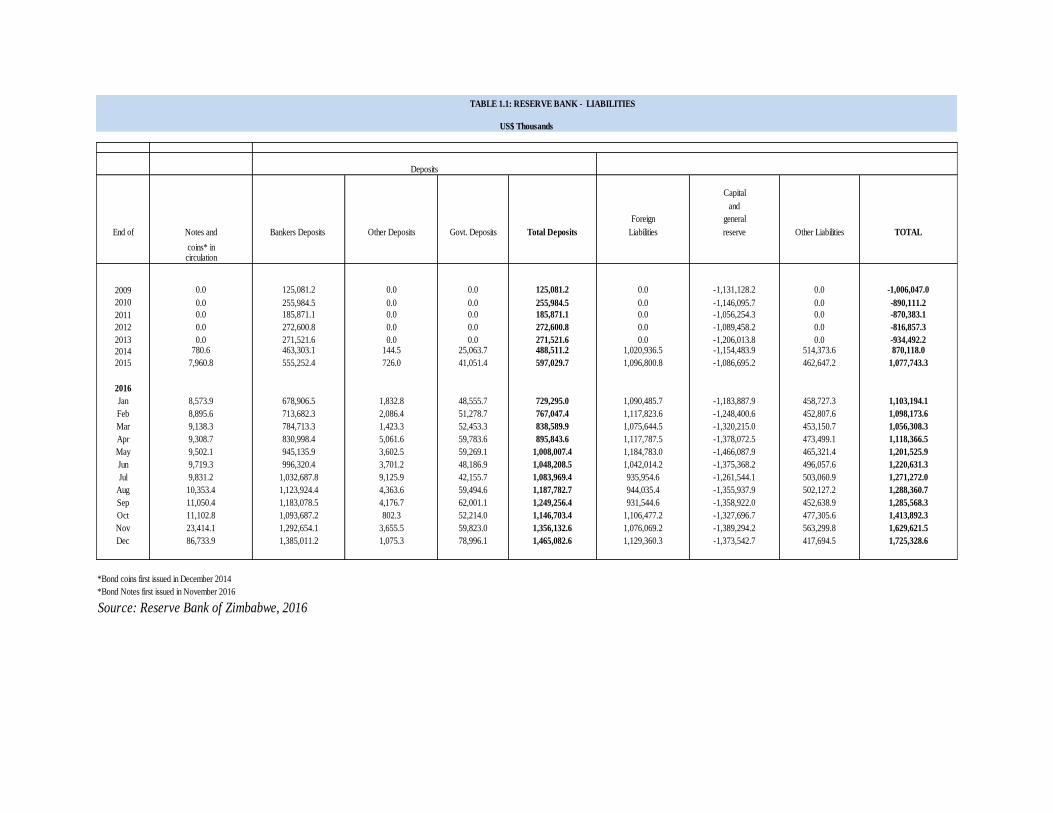
TABLE 1.1: RESERVE BANK - LIABILITIES
Capital
and
Foreign general
End of Notes and Bankers Deposits Other Deposits Govt. Deposits Total Deposits Liabilities reserve Other Liabilities TOTAL
coins* incirculation
2009 0.0 125,081.2 0.0 0.0 125,081.2 0.0 -1,131,128.2 0.0 -1,006,047.0
2010 0.0 255,984.5 0.0 0.0 255,984.5 0.0 -1,146,095.7 0.0 -890,111.2
2011 0.0 185,871.1 0.0 0.0 185,871.1 0.0 -1,056,254.3 0.0 -870,383.1
2012 0.0 272,600.8 0.0 0.0 272,600.8 0.0 -1,089,458.2 0.0 -816,857.3
2013 0.0 271,521.6 0.0 0.0 271,521.6 0.0 -1,206,013.8 0.0 -934,492.2
2014 780.6 463,303.1 144.5 25,063.7 488,511.2 1,020,936.5 -1,154,483.9 514,373.6 870,118.0
2015 7,960.8 555,252.4 726.0 41,051.4 597,029.7 1,096,800.8 -1,086,695.2 462,647.2 1,077,743.3
2016
Jan 8,573.9 678,906.5 1,832.8 48,555.7 729,295.0 1,090,485.7 -1,183,887.9 458,727.3 1,103,194.1
Feb 8,895.6 713,682.3 2,086.4 51,278.7 767,047.4 1,117,823.6 -1,248,400.6 452,807.6 1,098,173.6
Mar 9,138.3 784,713.3 1,423.3 52,453.3 838,589.9 1,075,644.5 -1,320,215.0 453,150.7 1,056,308.3
Apr 9,308.7 830,998.4 5,061.6 59,783.6 895,843.6 1,117,787.5 -1,378,072.5 473,499.1 1,118,366.5
May 9,502.1 945,135.9 3,602.5 59,269.1 1,008,007.4 1,184,783.0 -1,466,087.9 465,321.4 1,201,525.9
Jun 9,719.3 996,320.4 3,701.2 48,186.9 1,048,208.5 1,042,014.2 -1,375,368.2 496,057.6 1,220,631.3
Jul 9,831.2 1,032,687.8 9,125.9 42,155.7 1,083,969.4 935,954.6 -1,261,544.1 503,060.9 1,271,272.0
Aug 10,353.4 1,123,924.4 4,363.6 59,494.6 1,187,782.7 944,035.4 -1,355,937.9 502,127.2 1,288,360.7
Sep 11,050.4 1,183,078.5 4,176.7 62,001.1 1,249,256.4 931,544.6 -1,358,922.0 452,638.9 1,285,568.3
Oct 11,102.8 1,093,687.2 802.3 52,214.0 1,146,703.4 1,106,477.2 -1,327,696.7 477,305.6 1,413,892.3
Nov 23,414.1 1,292,654.1 3,655.5 59,823.0 1,356,132.6 1,076,069.2 -1,389,294.2 563,299.8 1,629,621.5
Dec 86,733.9 1,385,011.2 1,075.3 78,996.1 1,465,082.6 1,129,360.3 -1,373,542.7 417,694.5 1,725,328.6
*Bond coins first issued in December 2014
*Bond Notes first issued in November 2016
Source: Reserve Bank of Zimbabwe, 2016
Deposits
US$ Thousands
S2
US$ Thousands
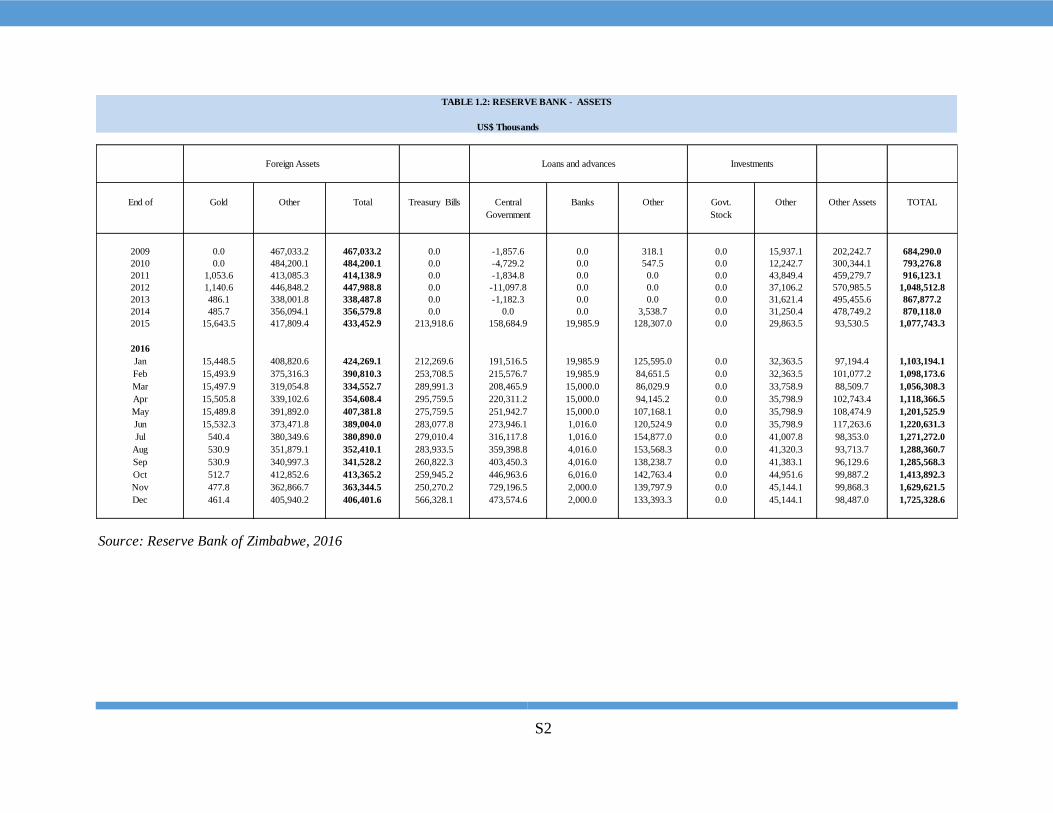
End of Gold Other Total Treasury Bills Central Banks Other Govt. Other Other Assets TOTAL
Government Stock
2009 0.0 467,033.2 467,033.2 0.0 -1,857.6 0.0 318.1 0.0 15,937.1 202,242.7 684,290.0
2010 0.0 484,200.1 484,200.1 0.0 -4,729.2 0.0 547.5 0.0 12,242.7 300,344.1 793,276.8
2011 1,053.6 413,085.3 414,138.9 0.0 -1,834.8 0.0 0.0 0.0 43,849.4 459,279.7 916,123.1
2012 1,140.6 446,848.2 447,988.8 0.0 -11,097.8 0.0 0.0 0.0 37,106.2 570,985.5 1,048,512.8
2013 486.1 338,001.8 338,487.8 0.0 -1,182.3 0.0 0.0 0.0 31,621.4 495,455.6 867,877.2
2014 485.7 356,094.1 356,579.8 0.0 0.0 0.0 3,538.7 0.0 31,250.4 478,749.2 870,118.0
2015 15,643.5 417,809.4 433,452.9 213,918.6 158,684.9 19,985.9 128,307.0 0.0 29,863.5 93,530.5 1,077,743.3
2016
Jan 15,448.5 408,820.6 424,269.1 212,269.6 191,516.5 19,985.9 125,595.0 0.0 32,363.5 97,194.4 1,103,194.1
Feb 15,493.9 375,316.3 390,810.3 253,708.5 215,576.7 19,985.9 84,651.5 0.0 32,363.5 101,077.2 1,098,173.6
Mar 15,497.9 319,054.8 334,552.7 289,991.3 208,465.9 15,000.0 86,029.9 0.0 33,758.9 88,509.7 1,056,308.3
Apr 15,505.8 339,102.6 354,608.4 295,759.5 220,311.2 15,000.0 94,145.2 0.0 35,798.9 102,743.4 1,118,366.5
May 15,489.8 391,892.0 407,381.8 275,759.5 251,942.7 15,000.0 107,168.1 0.0 35,798.9 108,474.9 1,201,525.9
Jun 15,532.3 373,471.8 389,004.0 283,077.8 273,946.1 1,016.0 120,524.9 0.0 35,798.9 117,263.6 1,220,631.3
Jul 540.4 380,349.6 380,890.0 279,010.4 316,117.8 1,016.0 154,877.0 0.0 41,007.8 98,353.0 1,271,272.0
Aug 530.9 351,879.1 352,410.1 283,933.5 359,398.8 4,016.0 153,568.3 0.0 41,320.3 93,713.7 1,288,360.7
Sep 530.9 340,997.3 341,528.2 260,822.3 403,450.3 4,016.0 138,238.7 0.0 41,383.1 96,129.6 1,285,568.3
Oct 512.7 412,852.6 413,365.2 259,945.2 446,963.6 6,016.0 142,763.4 0.0 44,951.6 99,887.2 1,413,892.3
Nov 477.8 362,866.7 363,344.5 250,270.2 729,196.5 2,000.0 139,797.9 0.0 45,144.1 99,868.3 1,629,621.5
Dec 461.4 405,940.2 406,401.6 566,328.1 473,574.6 2,000.0 133,393.3 0.0 45,144.1 98,487.0 1,725,328.6
Source: Reserve Bank of Zimbabwe, 2016
Loans and advances Investments Foreign Assets
TABLE 1.2: RESERVE BANK - ASSETS
S3
Loans & Contingent OtherNon
Financial Total
End ofBond
Notes
Foreign
NotesTotal
Other
BalancesAdvances Assets Assets Assets Assets
& Coins & Balances Balances Balances Liquid with RBZ
Coins with with Other at Trade Treasury Agric PEs Assets
RBZ Banks Foreign Bills Bills
2009 - 158.3 106.3 7.3 423.6 36.2 0.0 0.0 731.8 91.1 523.5 192.3 47.3 217.8 1,803.8
2010 - 206.3 136.2 12.0 420.5 88.8 0.0 0.0 863.7 115.2 1,080.0 303.5 125.1 222.0 2,709.4
2011 - 256.0 225.3 92.0 361.7 140.6 0.0 0.0 1,075.7 119.8 1,952.0 244.2 127.6 310.5 3,829.8
2012 - 375.9 374.7 131.1 219.7 190.8 8.2 0.0 1,300.4 27.7 2,631.8 375.3 250.7 389.0 4,975.0
2013 - 354.8 367.8 135.5 287.3 199.9 118.0 6.6 1,469.9 28.4 2,799.5 490.8 259.5 347.6 5,395.7
2014 - 310.2 466.1 168.0 152.4 188.8 285.4 0.0 1,571.0 7.3 2,961.2 633.2 377.7 389.2 5,939.5
2015 0.7 181.6 542.9 127.5 118.6 79.7 1,031.3 5.2 2,087.6 20.8 2,820.5 582.0 352.8 396.7 6,260.4
2016
Jan 1.0 172.0 646.9 119.2 130.7 76.6 981.9 5.2 2,133.5 20.6 2,763.7 582.8 387.3 396.6 6,284.4
Feb 1.2 140.7 682.1 96.3 118.1 21.5 1,125.6 5.2 2,190.7 20.1 2,680.9 477.1 390.1 399.3 6,158.2
Mar 1.3 161.9 714.2 96.3 156.8 19.2 1,140.5 5.1 2,295.4 20.3 2,690.6 430.6 428.7 405.1 6,270.8
Apr 1.3 135.5 757.8 135.5 133.3 18.7 1,198.1 5.1 2,385.4 20.4 2,653.4 413.7 441.1 404.7 6,318.6
May 1.4 89.6 871.6 130.5 110.4 19.3 1,215.9 5.0 2,443.6 19.8 2,681.8 397.0 358.0 412.6 6,312.8
Jun 1.4 108.5 914.7 84.6 148.3 19.2 1,274.4 1.8 2,553.0 19.7 2,669.3 407.7 358.0 431.6 6,439.3
Jul 1.4 101.2 972.6 82.5 166.0 16.5 1,313.2 0.0 2,653.5 20.5 2,567.9 393.2 342.6 440.3 6,418.1
Aug 1.4 140.2 1,054.0 97.5 156.9 14.9 1,293.8 0.0 2,758.7 20.5 2,565.9 390.2 367.5 447.3 6,550.2
Sep 1.4 91.6 1,104.1 143.9 194.6 6.0 1,329.1 5.4 2,876.2 18.5 2,547.7 382.3 422.0 455.9 6,702.6
Oct 1.3 81.0 1,069.6 130.2 182.1 6.5 1,373.5 5.4 2,849.7 20.8 2,614.8 397.2 357.9 458.2 6,698.6
Nov 4.2 69.4 1,221.3 103.2 163.4 7.6 1,346.8 5.3 2,921.3 20.8 2,644.9 350.5 348.5 466.2 6,752.2
Dec 14.1 99.0 1,286.1 134.4 183.7 4.9 1,416.0 5.1 3,143.2 20.9 2,645.8 376.7 365.7 473.4 7,025.6
Source: Reserve Bank of Zimbabwe, 2016
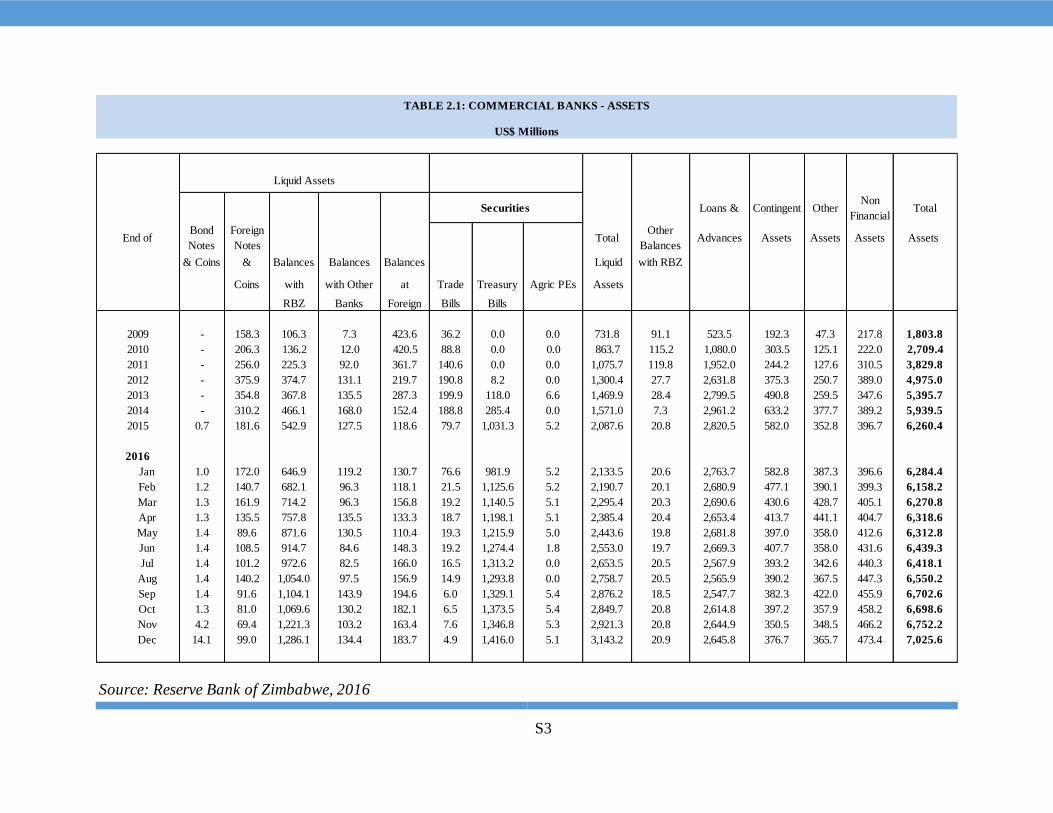
TABLE 2.1: COMMERCIAL BANKS - ASSETS
US$ Millions
Liquid Assets
Securities
S4
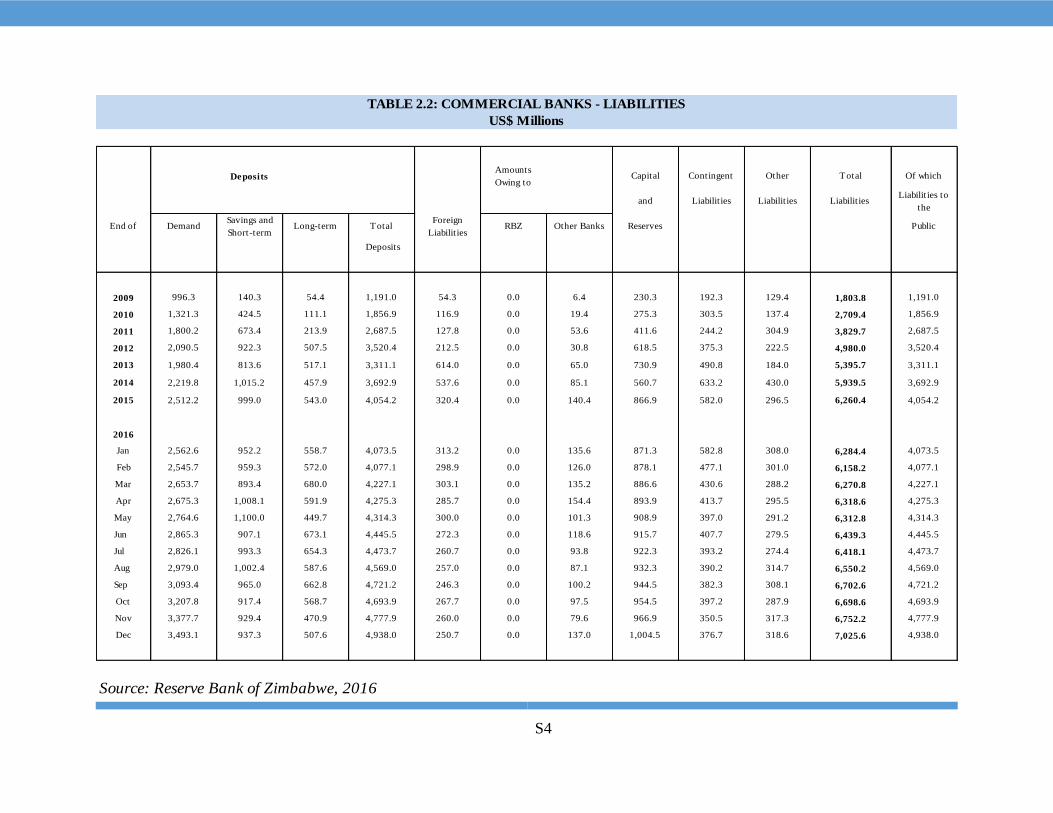
DepositsAmounts
Owing toCapital Contingent Other Total Of which
and Liabilities Liabilities Liabilities Liabilities to
the
End of DemandSavings and
Short-termLong-term Total
Foreign
LiabilitiesRBZ Other Banks Reserves Public
Deposits
2009 996.3 140.3 54.4 1,191.0 54.3 0.0 6.4 230.3 192.3 129.4 1,803.8 1,191.0
2010 1,321.3 424.5 111.1 1,856.9 116.9 0.0 19.4 275.3 303.5 137.4 2,709.4 1,856.9
2011 1,800.2 673.4 213.9 2,687.5 127.8 0.0 53.6 411.6 244.2 304.9 3,829.7 2,687.5
2012 2,090.5 922.3 507.5 3,520.4 212.5 0.0 30.8 618.5 375.3 222.5 4,980.0 3,520.4
2013 1,980.4 813.6 517.1 3,311.1 614.0 0.0 65.0 730.9 490.8 184.0 5,395.7 3,311.1
2014 2,219.8 1,015.2 457.9 3,692.9 537.6 0.0 85.1 560.7 633.2 430.0 5,939.5 3,692.9
2015 2,512.2 999.0 543.0 4,054.2 320.4 0.0 140.4 866.9 582.0 296.5 6,260.4 4,054.2
2016
Jan 2,562.6 952.2 558.7 4,073.5 313.2 0.0 135.6 871.3 582.8 308.0 6,284.4 4,073.5
Feb 2,545.7 959.3 572.0 4,077.1 298.9 0.0 126.0 878.1 477.1 301.0 6,158.2 4,077.1
Mar 2,653.7 893.4 680.0 4,227.1 303.1 0.0 135.2 886.6 430.6 288.2 6,270.8 4,227.1
Apr 2,675.3 1,008.1 591.9 4,275.3 285.7 0.0 154.4 893.9 413.7 295.5 6,318.6 4,275.3
May 2,764.6 1,100.0 449.7 4,314.3 300.0 0.0 101.3 908.9 397.0 291.2 6,312.8 4,314.3
Jun 2,865.3 907.1 673.1 4,445.5 272.3 0.0 118.6 915.7 407.7 279.5 6,439.3 4,445.5
Jul 2,826.1 993.3 654.3 4,473.7 260.7 0.0 93.8 922.3 393.2 274.4 6,418.1 4,473.7
Aug 2,979.0 1,002.4 587.6 4,569.0 257.0 0.0 87.1 932.3 390.2 314.7 6,550.2 4,569.0
Sep 3,093.4 965.0 662.8 4,721.2 246.3 0.0 100.2 944.5 382.3 308.1 6,702.6 4,721.2
Oct 3,207.8 917.4 568.7 4,693.9 267.7 0.0 97.5 954.5 397.2 287.9 6,698.6 4,693.9
Nov 3,377.7 929.4 470.9 4,777.9 260.0 0.0 79.6 966.9 350.5 317.3 6,752.2 4,777.9
Dec 3,493.1 937.3 507.6 4,938.0 250.7 0.0 137.0 1,004.5 376.7 318.6 7,025.6 4,938.0
Source: Reserve Bank of Zimbabwe, 2016
TABLE 2.2: COMMERCIAL BANKS - LIABILITIES
US$ Millions
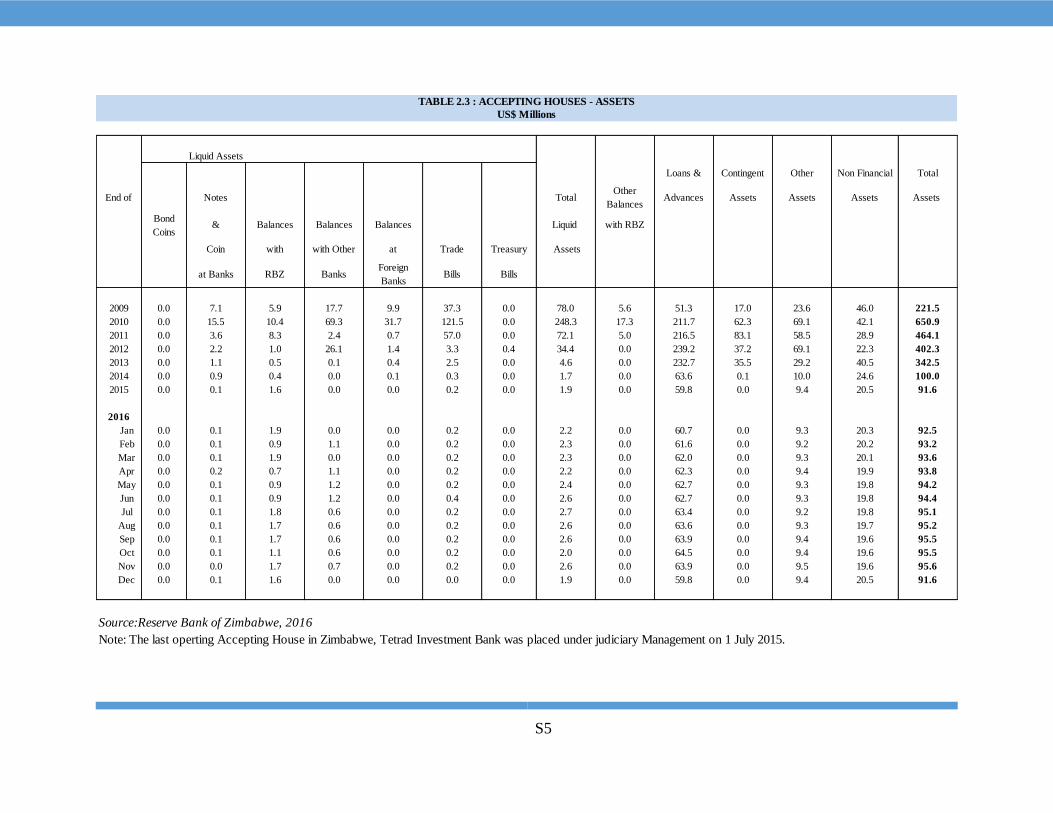
S5
Liquid Assets
Loans & Contingent Other Non Financial Total
End of Notes TotalOther
BalancesAdvances Assets Assets Assets Assets
Bond
Coins& Balances Balances Balances Liquid with RBZ
Coin with with Other at Trade Treasury Assets
at Banks RBZ BanksForeign
BanksBills Bills
2009 0.0 7.1 5.9 17.7 9.9 37.3 0.0 78.0 5.6 51.3 17.0 23.6 46.0 221.5
2010 0.0 15.5 10.4 69.3 31.7 121.5 0.0 248.3 17.3 211.7 62.3 69.1 42.1 650.9
2011 0.0 3.6 8.3 2.4 0.7 57.0 0.0 72.1 5.0 216.5 83.1 58.5 28.9 464.1
2012 0.0 2.2 1.0 26.1 1.4 3.3 0.4 34.4 0.0 239.2 37.2 69.1 22.3 402.3
2013 0.0 1.1 0.5 0.1 0.4 2.5 0.0 4.6 0.0 232.7 35.5 29.2 40.5 342.5
2014 0.0 0.9 0.4 0.0 0.1 0.3 0.0 1.7 0.0 63.6 0.1 10.0 24.6 100.0
2015 0.0 0.1 1.6 0.0 0.0 0.2 0.0 1.9 0.0 59.8 0.0 9.4 20.5 91.6
2016
Jan 0.0 0.1 1.9 0.0 0.0 0.2 0.0 2.2 0.0 60.7 0.0 9.3 20.3 92.5
Feb 0.0 0.1 0.9 1.1 0.0 0.2 0.0 2.3 0.0 61.6 0.0 9.2 20.2 93.2
Mar 0.0 0.1 1.9 0.0 0.0 0.2 0.0 2.3 0.0 62.0 0.0 9.3 20.1 93.6
Apr 0.0 0.2 0.7 1.1 0.0 0.2 0.0 2.2 0.0 62.3 0.0 9.4 19.9 93.8
May 0.0 0.1 0.9 1.2 0.0 0.2 0.0 2.4 0.0 62.7 0.0 9.3 19.8 94.2
Jun 0.0 0.1 0.9 1.2 0.0 0.4 0.0 2.6 0.0 62.7 0.0 9.3 19.8 94.4
Jul 0.0 0.1 1.8 0.6 0.0 0.2 0.0 2.7 0.0 63.4 0.0 9.2 19.8 95.1
Aug 0.0 0.1 1.7 0.6 0.0 0.2 0.0 2.6 0.0 63.6 0.0 9.3 19.7 95.2
Sep 0.0 0.1 1.7 0.6 0.0 0.2 0.0 2.6 0.0 63.9 0.0 9.4 19.6 95.5
Oct 0.0 0.1 1.1 0.6 0.0 0.2 0.0 2.0 0.0 64.5 0.0 9.4 19.6 95.5
Nov 0.0 0.0 1.7 0.7 0.0 0.2 0.0 2.6 0.0 63.9 0.0 9.5 19.6 95.6
Dec 0.0 0.1 1.6 0.0 0.0 0.0 0.0 1.9 0.0 59.8 0.0 9.4 20.5 91.6
Source:Reserve Bank of Zimbabwe, 2016
Note: The last operting Accepting House in Zimbabwe, Tetrad Investment Bank was placed under judiciary Management on 1 July 2015.
TABLE 2.3 : ACCEPTING HOUSES - ASSETS
US$ Millions
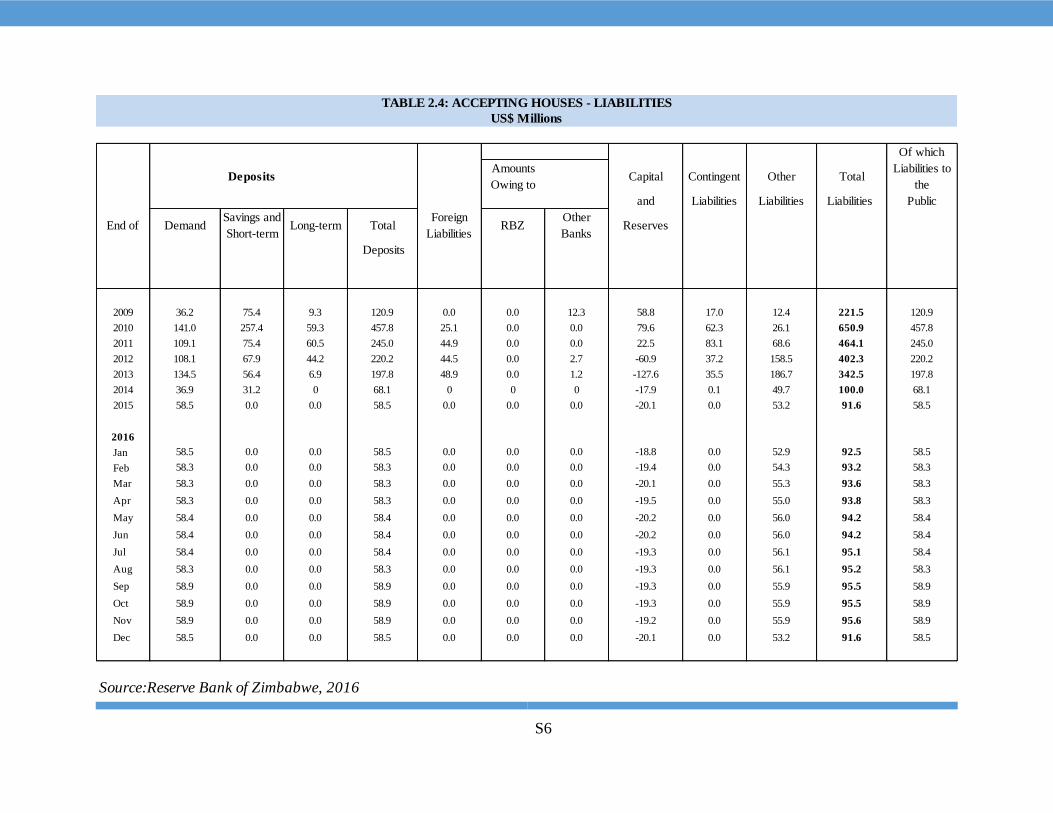
S6
Of which
DepositsAmounts
Owing toCapital Contingent Other Total
Liabilities to
the
and Liabilities Liabilities Liabilities Public
End of DemandSavings and
Short-termLong-term Total
Foreign
LiabilitiesRBZ
Other
BanksReserves
Deposits
2009 36.2 75.4 9.3 120.9 0.0 0.0 12.3 58.8 17.0 12.4 221.5 120.9
2010 141.0 257.4 59.3 457.8 25.1 0.0 0.0 79.6 62.3 26.1 650.9 457.8
2011 109.1 75.4 60.5 245.0 44.9 0.0 0.0 22.5 83.1 68.6 464.1 245.0
2012 108.1 67.9 44.2 220.2 44.5 0.0 2.7 -60.9 37.2 158.5 402.3 220.2
2013 134.5 56.4 6.9 197.8 48.9 0.0 1.2 -127.6 35.5 186.7 342.5 197.8
2014 36.9 31.2 0 68.1 0 0 0 -17.9 0.1 49.7 100.0 68.1
2015 58.5 0.0 0.0 58.5 0.0 0.0 0.0 -20.1 0.0 53.2 91.6 58.5
2016
Jan 58.5 0.0 0.0 58.5 0.0 0.0 0.0 -18.8 0.0 52.9 92.5 58.5
Feb 58.3 0.0 0.0 58.3 0.0 0.0 0.0 -19.4 0.0 54.3 93.2 58.3
Mar 58.3 0.0 0.0 58.3 0.0 0.0 0.0 -20.1 0.0 55.3 93.6 58.3
Apr 58.3 0.0 0.0 58.3 0.0 0.0 0.0 -19.5 0.0 55.0 93.8 58.3
May 58.4 0.0 0.0 58.4 0.0 0.0 0.0 -20.2 0.0 56.0 94.2 58.4
Jun 58.4 0.0 0.0 58.4 0.0 0.0 0.0 -20.2 0.0 56.0 94.2 58.4
Jul 58.4 0.0 0.0 58.4 0.0 0.0 0.0 -19.3 0.0 56.1 95.1 58.4
Aug 58.3 0.0 0.0 58.3 0.0 0.0 0.0 -19.3 0.0 56.1 95.2 58.3
Sep 58.9 0.0 0.0 58.9 0.0 0.0 0.0 -19.3 0.0 55.9 95.5 58.9
Oct 58.9 0.0 0.0 58.9 0.0 0.0 0.0 -19.3 0.0 55.9 95.5 58.9
Nov 58.9 0.0 0.0 58.9 0.0 0.0 0.0 -19.2 0.0 55.9 95.6 58.9
Dec 58.5 0.0 0.0 58.5 0.0 0.0 0.0 -20.1 0.0 53.2 91.6 58.5
Source:Reserve Bank of Zimbabwe, 2016
TABLE 2.4: ACCEPTING HOUSES - LIABILITIES
US$ Millions
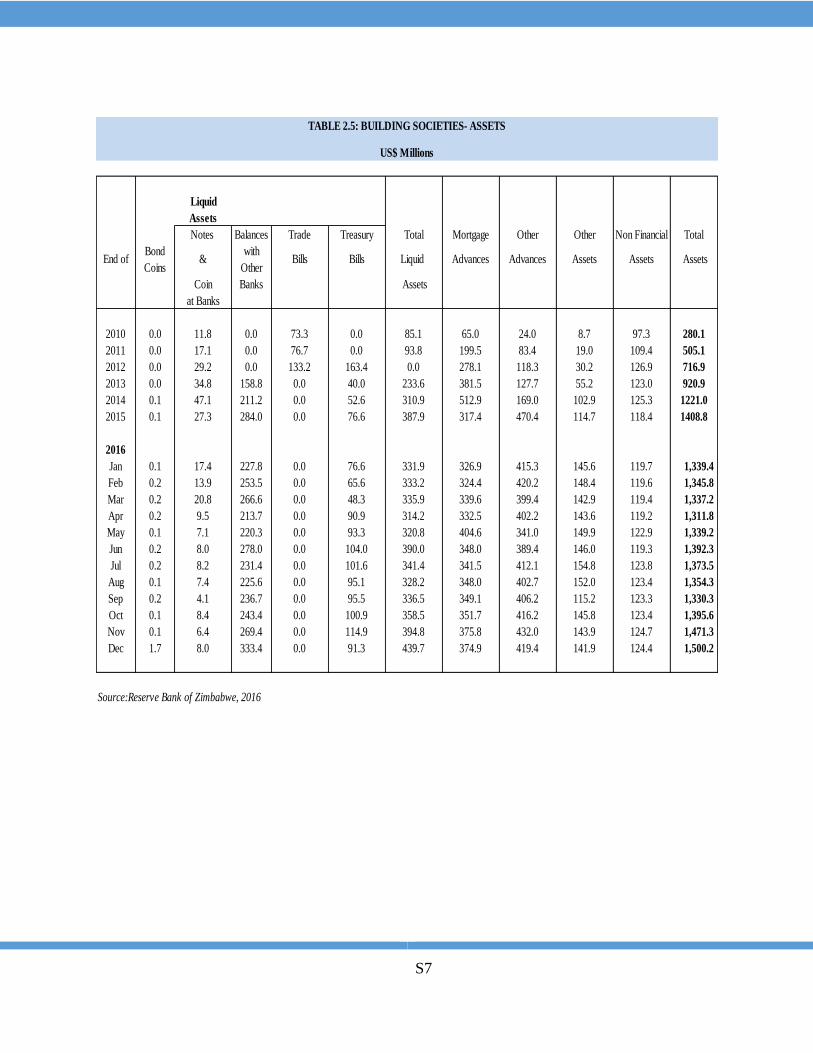
S7
Liquid
Assets
Notes Balances Trade Treasury Total Mortgage Other Other Non Financial Total
End ofBond
Coins&
with
Other Bills Bills Liquid Advances Advances Assets Assets Assets
Coin Banks Assets
at Banks
2010 0.0 11.8 0.0 73.3 0.0 85.1 65.0 24.0 8.7 97.3 280.1
2011 0.0 17.1 0.0 76.7 0.0 93.8 199.5 83.4 19.0 109.4 505.1
2012 0.0 29.2 0.0 133.2 163.4 0.0 278.1 118.3 30.2 126.9 716.9
2013 0.0 34.8 158.8 0.0 40.0 233.6 381.5 127.7 55.2 123.0 920.9
2014 0.1 47.1 211.2 0.0 52.6 310.9 512.9 169.0 102.9 125.3 1221.0
2015 0.1 27.3 284.0 0.0 76.6 387.9 317.4 470.4 114.7 118.4 1408.8
2016
Jan 0.1 17.4 227.8 0.0 76.6 331.9 326.9 415.3 145.6 119.7 1,339.4
Feb 0.2 13.9 253.5 0.0 65.6 333.2 324.4 420.2 148.4 119.6 1,345.8
Mar 0.2 20.8 266.6 0.0 48.3 335.9 339.6 399.4 142.9 119.4 1,337.2
Apr 0.2 9.5 213.7 0.0 90.9 314.2 332.5 402.2 143.6 119.2 1,311.8
May 0.1 7.1 220.3 0.0 93.3 320.8 404.6 341.0 149.9 122.9 1,339.2
Jun 0.2 8.0 278.0 0.0 104.0 390.0 348.0 389.4 146.0 119.3 1,392.3
Jul 0.2 8.2 231.4 0.0 101.6 341.4 341.5 412.1 154.8 123.8 1,373.5
Aug 0.1 7.4 225.6 0.0 95.1 328.2 348.0 402.7 152.0 123.4 1,354.3
Sep 0.2 4.1 236.7 0.0 95.5 336.5 349.1 406.2 115.2 123.3 1,330.3
Oct 0.1 8.4 243.4 0.0 100.9 358.5 351.7 416.2 145.8 123.4 1,395.6
Nov 0.1 6.4 269.4 0.0 114.9 394.8 375.8 432.0 143.9 124.7 1,471.3
Dec 1.7 8.0 333.4 0.0 91.3 439.7 374.9 419.4 141.9 124.4 1,500.2
Source:Reserve Bank of Zimbabwe, 2016
TABLE 2.5: BUILDING SOCIETIES- ASSETS
US$ Millions
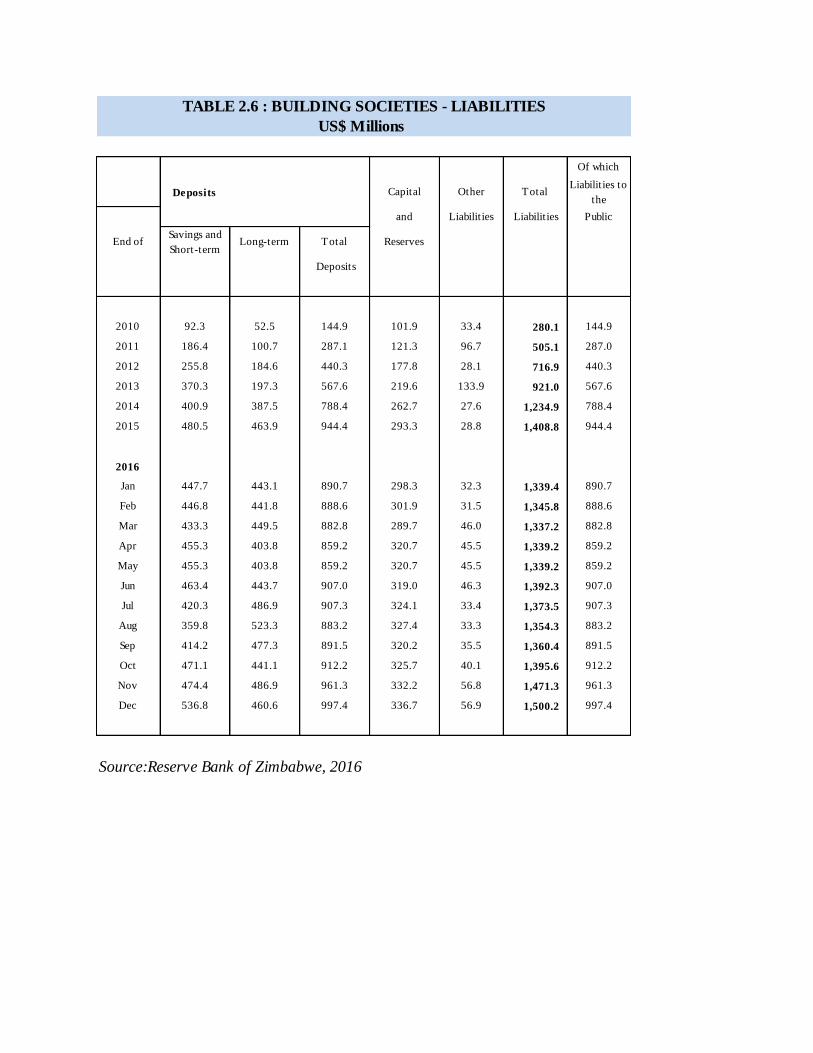
Of which
Deposits Capital Other TotalLiabilities to
the
and Liabilities Liabilities Public
End ofSavings and
Short-termLong-term Total Reserves
Deposits
2010 92.3 52.5 144.9 101.9 33.4 280.1 144.9
2011 186.4 100.7 287.1 121.3 96.7 505.1 287.0
2012 255.8 184.6 440.3 177.8 28.1 716.9 440.3
2013 370.3 197.3 567.6 219.6 133.9 921.0 567.6
2014 400.9 387.5 788.4 262.7 27.6 1,234.9 788.4
2015 480.5 463.9 944.4 293.3 28.8 1,408.8 944.4
2016
Jan 447.7 443.1 890.7 298.3 32.3 1,339.4 890.7
Feb 446.8 441.8 888.6 301.9 31.5 1,345.8 888.6
Mar 433.3 449.5 882.8 289.7 46.0 1,337.2 882.8
Apr 455.3 403.8 859.2 320.7 45.5 1,339.2 859.2
May 455.3 403.8 859.2 320.7 45.5 1,339.2 859.2
Jun 463.4 443.7 907.0 319.0 46.3 1,392.3 907.0
Jul 420.3 486.9 907.3 324.1 33.4 1,373.5 907.3
Aug 359.8 523.3 883.2 327.4 33.3 1,354.3 883.2
Sep 414.2 477.3 891.5 320.2 35.5 1,360.4 891.5
Oct 471.1 441.1 912.2 325.7 40.1 1,395.6 912.2
Nov 474.4 486.9 961.3 332.2 56.8 1,471.3 961.3
Dec 536.8 460.6 997.4 336.7 56.9 1,500.2 997.4
Source:Reserve Bank of Zimbabwe, 2016
TABLE 2.6 : BUILDING SOCIETIES - LIABILITIES
US$ Millions
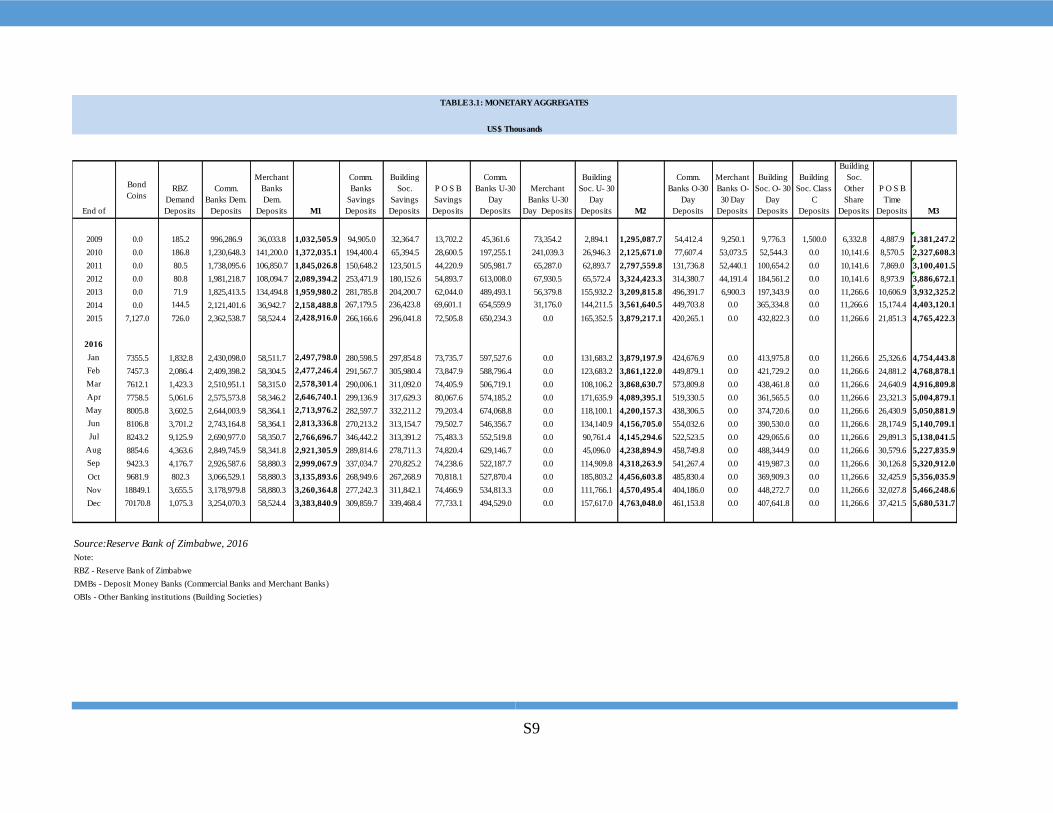
S9
End of
Bond
CoinsRBZ
Demand
Deposits
Comm.
Banks Dem.
Deposits
Merchant
Banks
Dem.
Deposits M1
Comm.
Banks
Savings
Deposits
Building
Soc.
Savings
Deposits
P O S B
Savings
Deposits
Comm.
Banks U-30
Day
Deposits
Merchant
Banks U-30
Day Deposits
Building
Soc. U- 30
Day
Deposits M2
Comm.
Banks O-30
Day
Deposits
Merchant
Banks O-
30 Day
Deposits
Building
Soc. O- 30
Day
Deposits
Building
Soc. Class
C
Deposits
Building
Soc.
Other
Share
Deposits
P O S B
Time
Deposits M3
2009 0.0 185.2 996,286.9 36,033.8 1,032,505.9 94,905.0 32,364.7 13,702.2 45,361.6 73,354.2 2,894.1 1,295,087.7 54,412.4 9,250.1 9,776.3 1,500.0 6,332.8 4,887.9 1,381,247.2
2010 0.0 186.8 1,230,648.3 141,200.0 1,372,035.1 194,400.4 65,394.5 28,600.5 197,255.1 241,039.3 26,946.3 2,125,671.0 77,607.4 53,073.5 52,544.3 0.0 10,141.6 8,570.5 2,327,608.3
2011 0.0 80.5 1,738,095.6 106,850.7 1,845,026.8 150,648.2 123,501.5 44,220.9 505,981.7 65,287.0 62,893.7 2,797,559.8 131,736.8 52,440.1 100,654.2 0.0 10,141.6 7,869.0 3,100,401.5
2012 0.0 80.8 1,981,218.7 108,094.7 2,089,394.2 253,471.9 180,152.6 54,893.7 613,008.0 67,930.5 65,572.4 3,324,423.3 314,380.7 44,191.4 184,561.2 0.0 10,141.6 8,973.9 3,886,672.1
2013 0.0 71.9 1,825,413.5 134,494.8 1,959,980.2 281,785.8 204,200.7 62,044.0 489,493.1 56,379.8 155,932.2 3,209,815.8 496,391.7 6,900.3 197,343.9 0.0 11,266.6 10,606.9 3,932,325.2
2014 0.0 144.5 2,121,401.6 36,942.7 2,158,488.8 267,179.5 236,423.8 69,601.1 654,559.9 31,176.0 144,211.5 3,561,640.5 449,703.8 0.0 365,334.8 0.0 11,266.6 15,174.4 4,403,120.1
2015 7,127.0 726.0 2,362,538.7 58,524.4 2,428,916.0 266,166.6 296,041.8 72,505.8 650,234.3 0.0 165,352.5 3,879,217.1 420,265.1 0.0 432,822.3 0.0 11,266.6 21,851.3 4,765,422.3
2016
Jan 7355.5 1,832.8 2,430,098.0 58,511.7 2,497,798.0 280,598.5 297,854.8 73,735.7 597,527.6 0.0 131,683.2 3,879,197.9 424,676.9 0.0 413,975.8 0.0 11,266.6 25,326.6 4,754,443.8
Feb 7457.3 2,086.4 2,409,398.2 58,304.5 2,477,246.4 291,567.7 305,980.4 73,847.9 588,796.4 0.0 123,683.2 3,861,122.0 449,879.1 0.0 421,729.2 0.0 11,266.6 24,881.2 4,768,878.1
Mar 7612.1 1,423.3 2,510,951.1 58,315.0 2,578,301.4 290,006.1 311,092.0 74,405.9 506,719.1 0.0 108,106.2 3,868,630.7 573,809.8 0.0 438,461.8 0.0 11,266.6 24,640.9 4,916,809.8
Apr 7758.5 5,061.6 2,575,573.8 58,346.2 2,646,740.1 299,136.9 317,629.3 80,067.6 574,185.2 0.0 171,635.9 4,089,395.1 519,330.5 0.0 361,565.5 0.0 11,266.6 23,321.3 5,004,879.1
May 8005.8 3,602.5 2,644,003.9 58,364.1 2,713,976.2 282,597.7 332,211.2 79,203.4 674,068.8 0.0 118,100.1 4,200,157.3 438,306.5 0.0 374,720.6 0.0 11,266.6 26,430.9 5,050,881.9
Jun 8106.8 3,701.2 2,743,164.8 58,364.1 2,813,336.8 270,213.2 313,154.7 79,502.7 546,356.7 0.0 134,140.9 4,156,705.0 554,032.6 0.0 390,530.0 0.0 11,266.6 28,174.9 5,140,709.1
Jul 8243.2 9,125.9 2,690,977.0 58,350.7 2,766,696.7 346,442.2 313,391.2 75,483.3 552,519.8 0.0 90,761.4 4,145,294.6 522,523.5 0.0 429,065.6 0.0 11,266.6 29,891.3 5,138,041.5
Aug 8854.6 4,363.6 2,849,745.9 58,341.8 2,921,305.9 289,814.6 278,711.3 74,820.4 629,146.7 0.0 45,096.0 4,238,894.9 458,749.8 0.0 488,344.9 0.0 11,266.6 30,579.6 5,227,835.9
Sep 9423.3 4,176.7 2,926,587.6 58,880.3 2,999,067.9 337,034.7 270,825.2 74,238.6 522,187.7 0.0 114,909.8 4,318,263.9 541,267.4 0.0 419,987.3 0.0 11,266.6 30,126.8 5,320,912.0
Oct 9681.9 802.3 3,066,529.1 58,880.3 3,135,893.6 268,949.6 267,268.9 70,818.1 527,870.4 0.0 185,803.2 4,456,603.8 485,830.4 0.0 369,909.3 0.0 11,266.6 32,425.9 5,356,035.9
Nov 18849.1 3,655.5 3,178,979.8 58,880.3 3,260,364.8 277,242.3 311,842.1 74,466.9 534,813.3 0.0 111,766.1 4,570,495.4 404,186.0 0.0 448,272.7 0.0 11,266.6 32,027.8 5,466,248.6
Dec 70170.8 1,075.3 3,254,070.3 58,524.4 3,383,840.9 309,859.7 339,468.4 77,733.1 494,529.0 0.0 157,617.0 4,763,048.0 461,153.8 0.0 407,641.8 0.0 11,266.6 37,421.5 5,680,531.7
Source:Reserve Bank of Zimbabwe, 2016
Note:
RBZ - Reserve Bank of Zimbabwe
DMBs - Deposit Money Banks (Commercial Banks and Merchant Banks)
OBIs - Other Banking institutions (Building Societies)
TABLE 3.1: MONETARY AGGREGATES
US$ Thousands
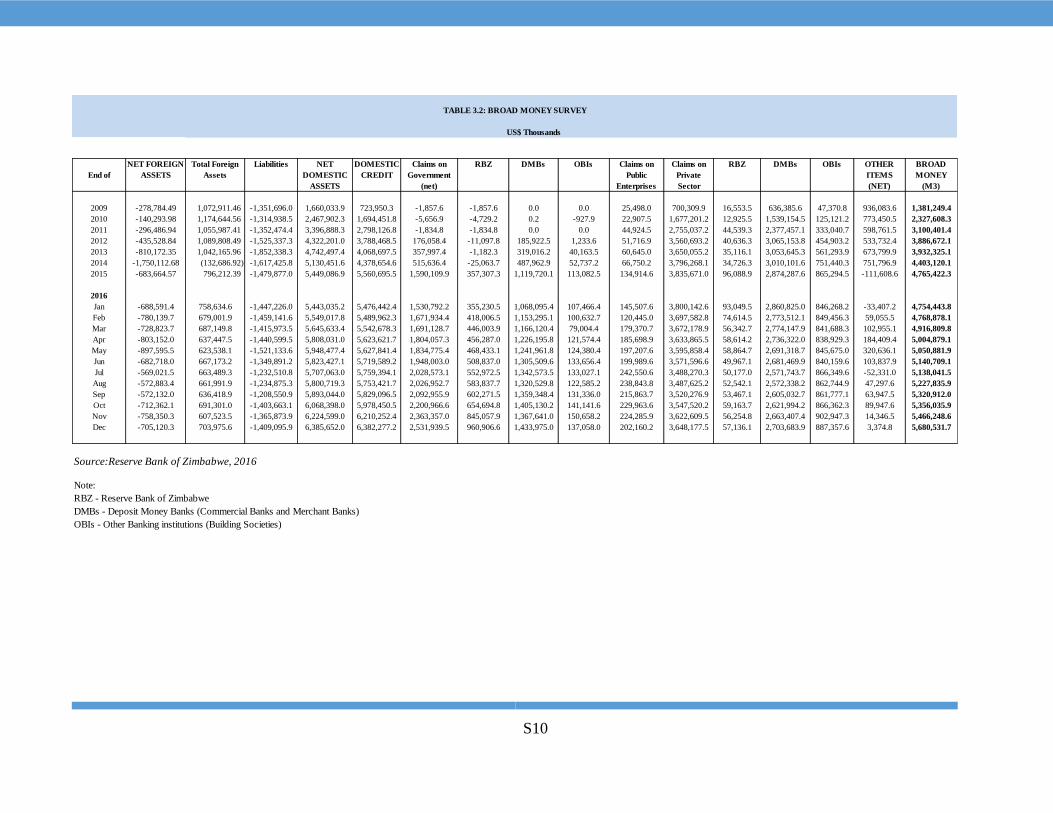
S10
US$ Thousands
End of
NET FOREIGN
ASSETS
Total Foreign
Assets
Liabilities NET
DOMESTIC
ASSETS
DOMESTIC
CREDIT
Claims on
Government
(net)
RBZ DMBs OBIs Claims on
Public
Enterprises
Claims on
Private
Sector
RBZ DMBs OBIs OTHER
ITEMS
(NET)
BROAD
MONEY
(M3)
2009 -278,784.49 1,072,911.46 -1,351,696.0 1,660,033.9 723,950.3 -1,857.6 -1,857.6 0.0 0.0 25,498.0 700,309.9 16,553.5 636,385.6 47,370.8 936,083.6 1,381,249.4
2010 -140,293.98 1,174,644.56 -1,314,938.5 2,467,902.3 1,694,451.8 -5,656.9 -4,729.2 0.2 -927.9 22,907.5 1,677,201.2 12,925.5 1,539,154.5 125,121.2 773,450.5 2,327,608.3
2011 -296,486.94 1,055,987.41 -1,352,474.4 3,396,888.3 2,798,126.8 -1,834.8 -1,834.8 0.0 0.0 44,924.5 2,755,037.2 44,539.3 2,377,457.1 333,040.7 598,761.5 3,100,401.4
2012 -435,528.84 1,089,808.49 -1,525,337.3 4,322,201.0 3,788,468.5 176,058.4 -11,097.8 185,922.5 1,233.6 51,716.9 3,560,693.2 40,636.3 3,065,153.8 454,903.2 533,732.4 3,886,672.1
2013 -810,172.35 1,042,165.96 -1,852,338.3 4,742,497.4 4,068,697.5 357,997.4 -1,182.3 319,016.2 40,163.5 60,645.0 3,650,055.2 35,116.1 3,053,645.3 561,293.9 673,799.9 3,932,325.1
2014 -1,750,112.68 (132,686.92) -1,617,425.8 5,130,451.6 4,378,654.6 515,636.4 -25,063.7 487,962.9 52,737.2 66,750.2 3,796,268.1 34,726.3 3,010,101.6 751,440.3 751,796.9 4,403,120.1
2015 -683,664.57 796,212.39 -1,479,877.0 5,449,086.9 5,560,695.5 1,590,109.9 357,307.3 1,119,720.1 113,082.5 134,914.6 3,835,671.0 96,088.9 2,874,287.6 865,294.5 -111,608.6 4,765,422.3
2016
Jan -688,591.4 758,634.6 -1,447,226.0 5,443,035.2 5,476,442.4 1,530,792.2 355,230.5 1,068,095.4 107,466.4 145,507.6 3,800,142.6 93,049.5 2,860,825.0 846,268.2 -33,407.2 4,754,443.8
Feb -780,139.7 679,001.9 -1,459,141.6 5,549,017.8 5,489,962.3 1,671,934.4 418,006.5 1,153,295.1 100,632.7 120,445.0 3,697,582.8 74,614.5 2,773,512.1 849,456.3 59,055.5 4,768,878.1
Mar -728,823.7 687,149.8 -1,415,973.5 5,645,633.4 5,542,678.3 1,691,128.7 446,003.9 1,166,120.4 79,004.4 179,370.7 3,672,178.9 56,342.7 2,774,147.9 841,688.3 102,955.1 4,916,809.8
Apr -803,152.0 637,447.5 -1,440,599.5 5,808,031.0 5,623,621.7 1,804,057.3 456,287.0 1,226,195.8 121,574.4 185,698.9 3,633,865.5 58,614.2 2,736,322.0 838,929.3 184,409.4 5,004,879.1
May -897,595.5 623,538.1 -1,521,133.6 5,948,477.4 5,627,841.4 1,834,775.4 468,433.1 1,241,961.8 124,380.4 197,207.6 3,595,858.4 58,864.7 2,691,318.7 845,675.0 320,636.1 5,050,881.9
Jun -682,718.0 667,173.2 -1,349,891.2 5,823,427.1 5,719,589.2 1,948,003.0 508,837.0 1,305,509.6 133,656.4 199,989.6 3,571,596.6 49,967.1 2,681,469.9 840,159.6 103,837.9 5,140,709.1
Jul -569,021.5 663,489.3 -1,232,510.8 5,707,063.0 5,759,394.1 2,028,573.1 552,972.5 1,342,573.5 133,027.1 242,550.6 3,488,270.3 50,177.0 2,571,743.7 866,349.6 -52,331.0 5,138,041.5
Aug -572,883.4 661,991.9 -1,234,875.3 5,800,719.3 5,753,421.7 2,026,952.7 583,837.7 1,320,529.8 122,585.2 238,843.8 3,487,625.2 52,542.1 2,572,338.2 862,744.9 47,297.6 5,227,835.9
Sep -572,132.0 636,418.9 -1,208,550.9 5,893,044.0 5,829,096.5 2,092,955.9 602,271.5 1,359,348.4 131,336.0 215,863.7 3,520,276.9 53,467.1 2,605,032.7 861,777.1 63,947.5 5,320,912.0
Oct -712,362.1 691,301.0 -1,403,663.1 6,068,398.0 5,978,450.5 2,200,966.6 654,694.8 1,405,130.2 141,141.6 229,963.6 3,547,520.2 59,163.7 2,621,994.2 866,362.3 89,947.6 5,356,035.9
Nov -758,350.3 607,523.5 -1,365,873.9 6,224,599.0 6,210,252.4 2,363,357.0 845,057.9 1,367,641.0 150,658.2 224,285.9 3,622,609.5 56,254.8 2,663,407.4 902,947.3 14,346.5 5,466,248.6
Dec -705,120.3 703,975.6 -1,409,095.9 6,385,652.0 6,382,277.2 2,531,939.5 960,906.6 1,433,975.0 137,058.0 202,160.2 3,648,177.5 57,136.1 2,703,683.9 887,357.6 3,374.8 5,680,531.7
Source:Reserve Bank of Zimbabwe, 2016
Note:
RBZ - Reserve Bank of Zimbabwe
DMBs - Deposit Money Banks (Commercial Banks and Merchant Banks)
OBIs - Other Banking institutions (Building Societies)
TABLE 3.2: BROAD MONEY SURVEY
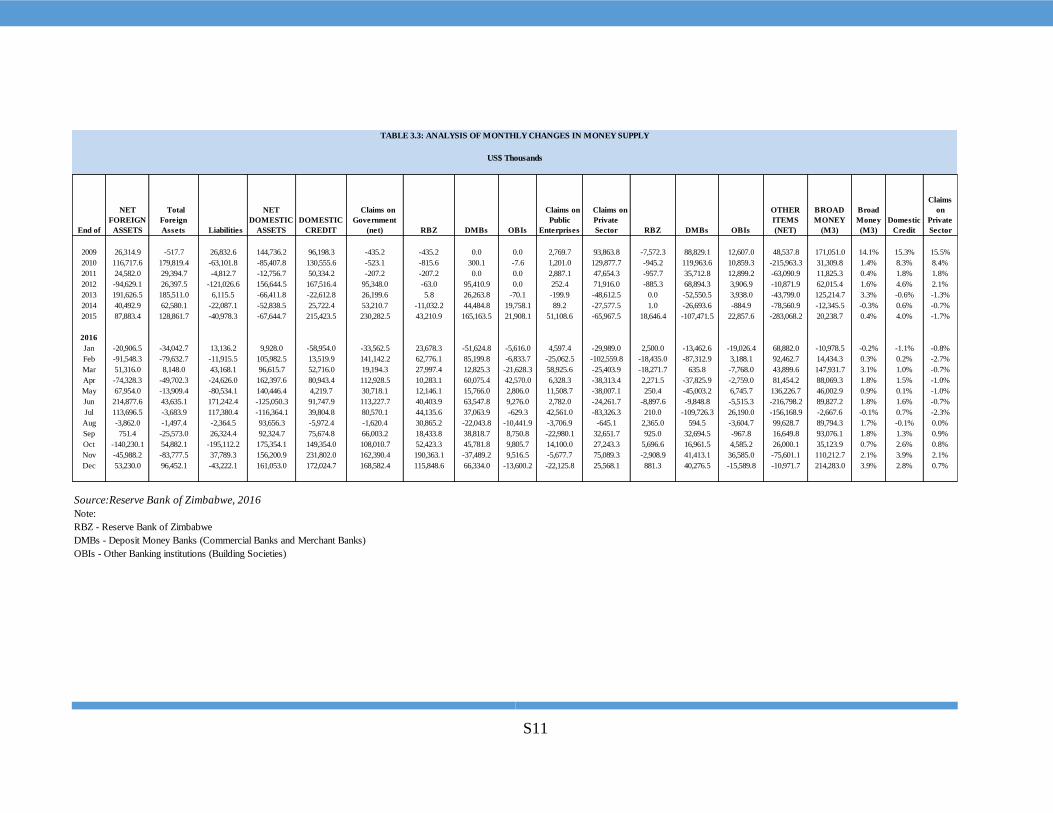
S11
End of
NET
FOREIGN
ASSETS
Total
Foreign
Assets Liabilities
NET
DOMESTIC
ASSETS
DOMESTIC
CREDIT
Claims on
Government
(net) RBZ DMBs
OBIs
Claims on
Public
Enterprises
Claims on
Private
Sector RBZ DMBs OBIs
OTHER
ITEMS
(NET)
BROAD
MONEY
(M3)
Broad
Money
(M3)
Domestic
Credit
Claims
on
Private
Sector
2009 26,314.9 -517.7 26,832.6 144,736.2 96,198.3 -435.2 -435.2 0.0 0.0 2,769.7 93,863.8 -7,572.3 88,829.1 12,607.0 48,537.8 171,051.0 14.1% 15.3% 15.5%
2010 116,717.6 179,819.4 -63,101.8 -85,407.8 130,555.6 -523.1 -815.6 300.1 -7.6 1,201.0 129,877.7 -945.2 119,963.6 10,859.3 -215,963.3 31,309.8 1.4% 8.3% 8.4%
2011 24,582.0 29,394.7 -4,812.7 -12,756.7 50,334.2 -207.2 -207.2 0.0 0.0 2,887.1 47,654.3 -957.7 35,712.8 12,899.2 -63,090.9 11,825.3 0.4% 1.8% 1.8%
2012 -94,629.1 26,397.5 -121,026.6 156,644.5 167,516.4 95,348.0 -63.0 95,410.9 0.0 252.4 71,916.0 -885.3 68,894.3 3,906.9 -10,871.9 62,015.4 1.6% 4.6% 2.1%
2013 191,626.5 185,511.0 6,115.5 -66,411.8 -22,612.8 26,199.6 5.8 26,263.8 -70.1 -199.9 -48,612.5 0.0 -52,550.5 3,938.0 -43,799.0 125,214.7 3.3% -0.6% -1.3%
2014 40,492.9 62,580.1 -22,087.1 -52,838.5 25,722.4 53,210.7 -11,032.2 44,484.8 19,758.1 89.2 -27,577.5 1.0 -26,693.6 -884.9 -78,560.9 -12,345.5 -0.3% 0.6% -0.7%
2015 87,883.4 128,861.7 -40,978.3 -67,644.7 215,423.5 230,282.5 43,210.9 165,163.5 21,908.1 51,108.6 -65,967.5 18,646.4 -107,471.5 22,857.6 -283,068.2 20,238.7 0.4% 4.0% -1.7%
2016
Jan -20,906.5 -34,042.7 13,136.2 9,928.0 -58,954.0 -33,562.5 23,678.3 -51,624.8 -5,616.0 4,597.4 -29,989.0 2,500.0 -13,462.6 -19,026.4 68,882.0 -10,978.5 -0.2% -1.1% -0.8%
Feb -91,548.3 -79,632.7 -11,915.5 105,982.5 13,519.9 141,142.2 62,776.1 85,199.8 -6,833.7 -25,062.5 -102,559.8 -18,435.0 -87,312.9 3,188.1 92,462.7 14,434.3 0.3% 0.2% -2.7%
Mar 51,316.0 8,148.0 43,168.1 96,615.7 52,716.0 19,194.3 27,997.4 12,825.3 -21,628.3 58,925.6 -25,403.9 -18,271.7 635.8 -7,768.0 43,899.6 147,931.7 3.1% 1.0% -0.7%
Apr -74,328.3 -49,702.3 -24,626.0 162,397.6 80,943.4 112,928.5 10,283.1 60,075.4 42,570.0 6,328.3 -38,313.4 2,271.5 -37,825.9 -2,759.0 81,454.2 88,069.3 1.8% 1.5% -1.0%
May 67,954.0 -13,909.4 -80,534.1 140,446.4 4,219.7 30,718.1 12,146.1 15,766.0 2,806.0 11,508.7 -38,007.1 250.4 -45,003.2 6,745.7 136,226.7 46,002.9 0.9% 0.1% -1.0%
Jun 214,877.6 43,635.1 171,242.4 -125,050.3 91,747.9 113,227.7 40,403.9 63,547.8 9,276.0 2,782.0 -24,261.7 -8,897.6 -9,848.8 -5,515.3 -216,798.2 89,827.2 1.8% 1.6% -0.7%
Jul 113,696.5 -3,683.9 117,380.4 -116,364.1 39,804.8 80,570.1 44,135.6 37,063.9 -629.3 42,561.0 -83,326.3 210.0 -109,726.3 26,190.0 -156,168.9 -2,667.6 -0.1% 0.7% -2.3%
Aug -3,862.0 -1,497.4 -2,364.5 93,656.3 -5,972.4 -1,620.4 30,865.2 -22,043.8 -10,441.9 -3,706.9 -645.1 2,365.0 594.5 -3,604.7 99,628.7 89,794.3 1.7% -0.1% 0.0%
Sep 751.4 -25,573.0 26,324.4 92,324.7 75,674.8 66,003.2 18,433.8 38,818.7 8,750.8 -22,980.1 32,651.7 925.0 32,694.5 -967.8 16,649.8 93,076.1 1.8% 1.3% 0.9%
Oct -140,230.1 54,882.1 -195,112.2 175,354.1 149,354.0 108,010.7 52,423.3 45,781.8 9,805.7 14,100.0 27,243.3 5,696.6 16,961.5 4,585.2 26,000.1 35,123.9 0.7% 2.6% 0.8%
Nov -45,988.2 -83,777.5 37,789.3 156,200.9 231,802.0 162,390.4 190,363.1 -37,489.2 9,516.5 -5,677.7 75,089.3 -2,908.9 41,413.1 36,585.0 -75,601.1 110,212.7 2.1% 3.9% 2.1%
Dec 53,230.0 96,452.1 -43,222.1 161,053.0 172,024.7 168,582.4 115,848.6 66,334.0 -13,600.2 -22,125.8 25,568.1 881.3 40,276.5 -15,589.8 -10,971.7 214,283.0 3.9% 2.8% 0.7%
Source:Reserve Bank of Zimbabwe, 2016
Note:
RBZ - Reserve Bank of Zimbabwe
DMBs - Deposit Money Banks (Commercial Banks and Merchant Banks)
OBIs - Other Banking institutions (Building Societies)
TABLE 3.3: ANALYSIS OF MONTHLY CHANGES IN MONEY SUPPLY
US$ Thousands
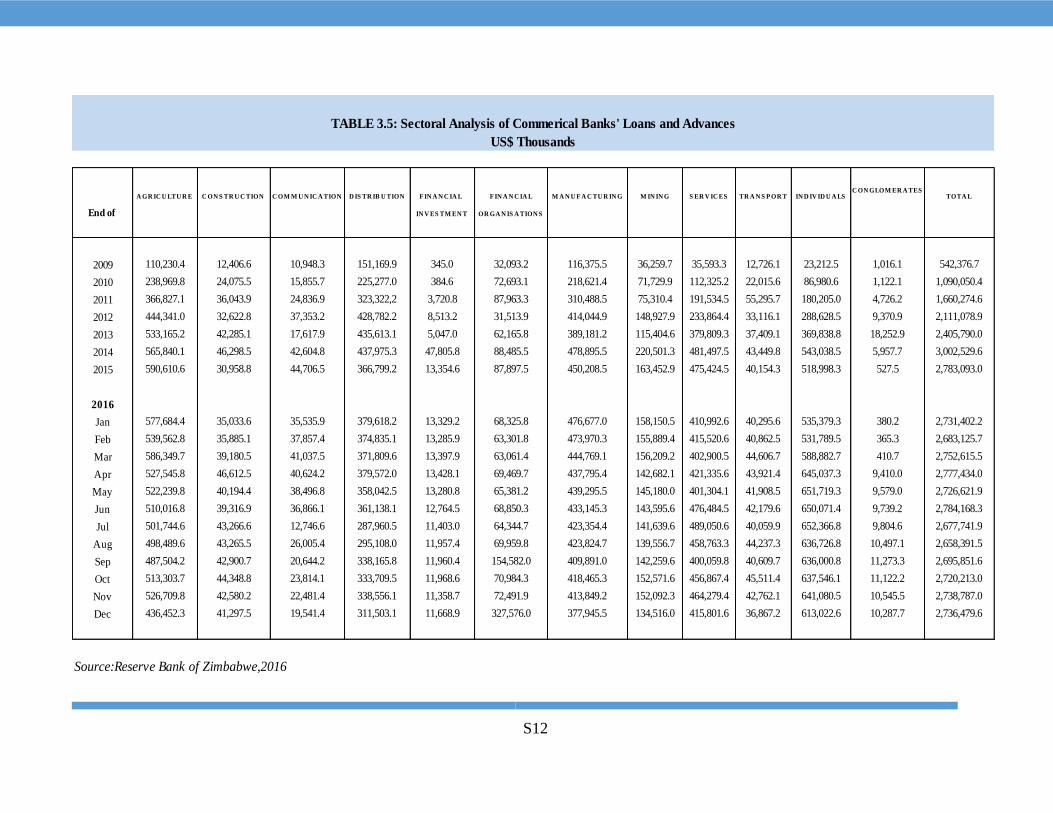
S12
A GR IC U LTU R E C ON S TR U C TION C OM M U N IC A TION D IS TR IB U TION F IN A N C IA L F IN A N C IA L M A N U F A C TU R IN G M IN IN G S ER V IC ES TR A N S P OR T IN D IV ID U A LSC ON GLOM ER A TES
TOTA L
End of IN V ES TM EN T OR GA N IS A TION S
2009 110,230.4 12,406.6 10,948.3 151,169.9 345.0 32,093.2 116,375.5 36,259.7 35,593.3 12,726.1 23,212.5 1,016.1 542,376.7
2010 238,969.8 24,075.5 15,855.7 225,277.0 384.6 72,693.1 218,621.4 71,729.9 112,325.2 22,015.6 86,980.6 1,122.1 1,090,050.4
2011 366,827.1 36,043.9 24,836.9 323,322,2 3,720.8 87,963.3 310,488.5 75,310.4 191,534.5 55,295.7 180,205.0 4,726.2 1,660,274.6
2012 444,341.0 32,622.8 37,353.2 428,782.2 8,513.2 31,513.9 414,044.9 148,927.9 233,864.4 33,116.1 288,628.5 9,370.9 2,111,078.9
2013 533,165.2 42,285.1 17,617.9 435,613.1 5,047.0 62,165.8 389,181.2 115,404.6 379,809.3 37,409.1 369,838.8 18,252.9 2,405,790.0
2014 565,840.1 46,298.5 42,604.8 437,975.3 47,805.8 88,485.5 478,895.5 220,501.3 481,497.5 43,449.8 543,038.5 5,957.7 3,002,529.6
2015 590,610.6 30,958.8 44,706.5 366,799.2 13,354.6 87,897.5 450,208.5 163,452.9 475,424.5 40,154.3 518,998.3 527.5 2,783,093.0
2016
Jan 577,684.4 35,033.6 35,535.9 379,618.2 13,329.2 68,325.8 476,677.0 158,150.5 410,992.6 40,295.6 535,379.3 380.2 2,731,402.2
Feb 539,562.8 35,885.1 37,857.4 374,835.1 13,285.9 63,301.8 473,970.3 155,889.4 415,520.6 40,862.5 531,789.5 365.3 2,683,125.7
Mar 586,349.7 39,180.5 41,037.5 371,809.6 13,397.9 63,061.4 444,769.1 156,209.2 402,900.5 44,606.7 588,882.7 410.7 2,752,615.5
Apr 527,545.8 46,612.5 40,624.2 379,572.0 13,428.1 69,469.7 437,795.4 142,682.1 421,335.6 43,921.4 645,037.3 9,410.0 2,777,434.0
May 522,239.8 40,194.4 38,496.8 358,042.5 13,280.8 65,381.2 439,295.5 145,180.0 401,304.1 41,908.5 651,719.3 9,579.0 2,726,621.9
Jun 510,016.8 39,316.9 36,866.1 361,138.1 12,764.5 68,850.3 433,145.3 143,595.6 476,484.5 42,179.6 650,071.4 9,739.2 2,784,168.3
Jul 501,744.6 43,266.6 12,746.6 287,960.5 11,403.0 64,344.7 423,354.4 141,639.6 489,050.6 40,059.9 652,366.8 9,804.6 2,677,741.9
Aug 498,489.6 43,265.5 26,005.4 295,108.0 11,957.4 69,959.8 423,824.7 139,556.7 458,763.3 44,237.3 636,726.8 10,497.1 2,658,391.5
Sep 487,504.2 42,900.7 20,644.2 338,165.8 11,960.4 154,582.0 409,891.0 142,259.6 400,059.8 40,609.7 636,000.8 11,273.3 2,695,851.6
Oct 513,303.7 44,348.8 23,814.1 333,709.5 11,968.6 70,984.3 418,465.3 152,571.6 456,867.4 45,511.4 637,546.1 11,122.2 2,720,213.0
Nov 526,709.8 42,580.2 22,481.4 338,556.1 11,358.7 72,491.9 413,849.2 152,092.3 464,279.4 42,762.1 641,080.5 10,545.5 2,738,787.0
Dec 436,452.3 41,297.5 19,541.4 311,503.1 11,668.9 327,576.0 377,945.5 134,516.0 415,801.6 36,867.2 613,022.6 10,287.7 2,736,479.6
Source:Reserve Bank of Zimbabwe,2016
TABLE 3.5: Sectoral Analysis of Commerical Banks' Loans and Advances
US$ Thousands

S13
AGRICULTURE CONSTRUCTION COMMUNICATION DISTRIBUTION FINANCIAL FINANCIAL MANUFACTURING MINING SERVICES TRANSPORT INDIVIDUALS CONGLOMERATES TOTAL
End of INVESTMENT ORGANISATIONS
2009 61,792.7 6,467.2 35,365.8 81,470.7 45,127.5 68,001.8 111,397.9 30,218.3 480,954.6 14,728.8 180,117.5 3,415.5 1,119,058.5
2010 113,727.1 13,189.9 52,087.1 195,080.2 84,886.8 146,548.7 144,660.9 67,916.4 504,291.2 17,349.7 300,489.1 5,962.4 1,646,189.5
2011 120,665.7 35,860.2 107,439.2 295,439.3 94,854.2 277,933.7 267,305.3 69,436.0 518,311.2 24,462.2 444,051.7 15,849.9 2,271,608.5
2012 96,098.4 50,492.7 126,343.5 379,068.0 198,323.3 509,241.6 280,975.4 95,457.1 582,286.2 41,852.2 538,135.2 26,491.3 2,924,764.8
2013 94,346.3 52,722.4 141,401.4 338,625.9 223,223.8 754,145.4 339,305.6 99,583.3 754,116.1 41,527.2 440,197.9 97,771.1 3,376,966.4
2014 147,242.4 60,358.1 118,725.7 328,729.5 325,746.6 950,304.9 290,329.3 118,977.8 964,815.0 47,574.3 638,061.1 92,040.8 4,082,906.3
2015 196,092.9 88,273.0 102,636.9 518,411.4 336,909.2 864,491.7 307,845.0 63,337.5 1,163,771.1 57,410.5 639,985.6 66,435.7 4,405,600.5
2016
Jan 231,827.3 101,724.1 93,544.2 517,089.2 325,203.1 977,272.1 345,812.2 62,026.3 1,083,702.7 61,755.6 618,080.1 58,808.7 4,476,845.6
Feb 226,568.3 105,747.9 97,684.4 525,070.9 339,839.0 896,869.2 326,026.0 59,381.3 1,047,904.6 63,248.3 634,478.3 63,017.8 4,385,835.9
Mar 243,546.9 102,238.4 116,471.1 582,943.5 362,058.8 879,340.8 368,689.6 60,514.0 402,900.5 62,839.4 642,779.4 61,037.6 4,556,027.1
Apr 243,151.6 102,234.0 112,219.5 569,660.7 360,299.5 907,855.6 335,068.6 71,721.0 1,156,122.6 63,858.0 628,901.1 61,087.0 4,612,179.4
May 236,180.5 97,008.6 120,726.3 593,284.9 371,034.5 923,580.9 356,500.9 99,176.4 1,107,956.8 61,396.5 607,501.4 64,066.3 4,638,413.9
Jun 218,386.8 103,914.2 134,181.8 596,904.8 362,400.2 973,333.3 316,490.8 58,856.9 1,128,688.7 72,063.3 601,813.8 61,833.2 4,628,867.8
Jul 207,280.2 99,727.9 138,781.2 616,359.8 348,779.7 1,035,697.0 370,456.9 63,986.1 1,114,413.7 65,391.9 622,329.2 69,058.9 4,752,262.6
Aug 233,004.5 97,248.8 153,590.8 578,487.3 365,366.8 997,123.0 356,522.0 64,413.7 1,227,979.0 67,005.8 621,307.8 73,076.2 4,835,125.8
Sep 236,724.3 101,117.1 155,483.5 597,290.0 346,375.9 1,046,195.2 366,312.8 57,885.0 1,365,673.5 73,805.9 595,219.8 70,669.7 5,012,752.7
Oct 239,373.9 107,235.7 160,641.2 593,362.2 344,681.9 988,274.7 363,815.8 63,998.0 1,384,083.2 76,834.0 593,827.7 73,608.8 4,989,737.2
Nov 318,652.7 107,089.5 189,581.3 501,506.5 329,147.3 992,135.7 411,467.8 150,691.6 1,337,295.6 79,405.2 591,639.0 71,016.3 5,079,628.6
Dec 258,814.9 110,009.2 202,260.4 590,595.6 348,457.0 1,020,795.0 382,615.8 81,542.7 1,466,867.2 82,186.5 592,932.5 76,874.9 5,213,951.8
Source:Reserve Bank of Zimbabwe,2016
TABLE 3.6: Sectoral Analysis of Commercial Banks' Deposits
US$ Thousands
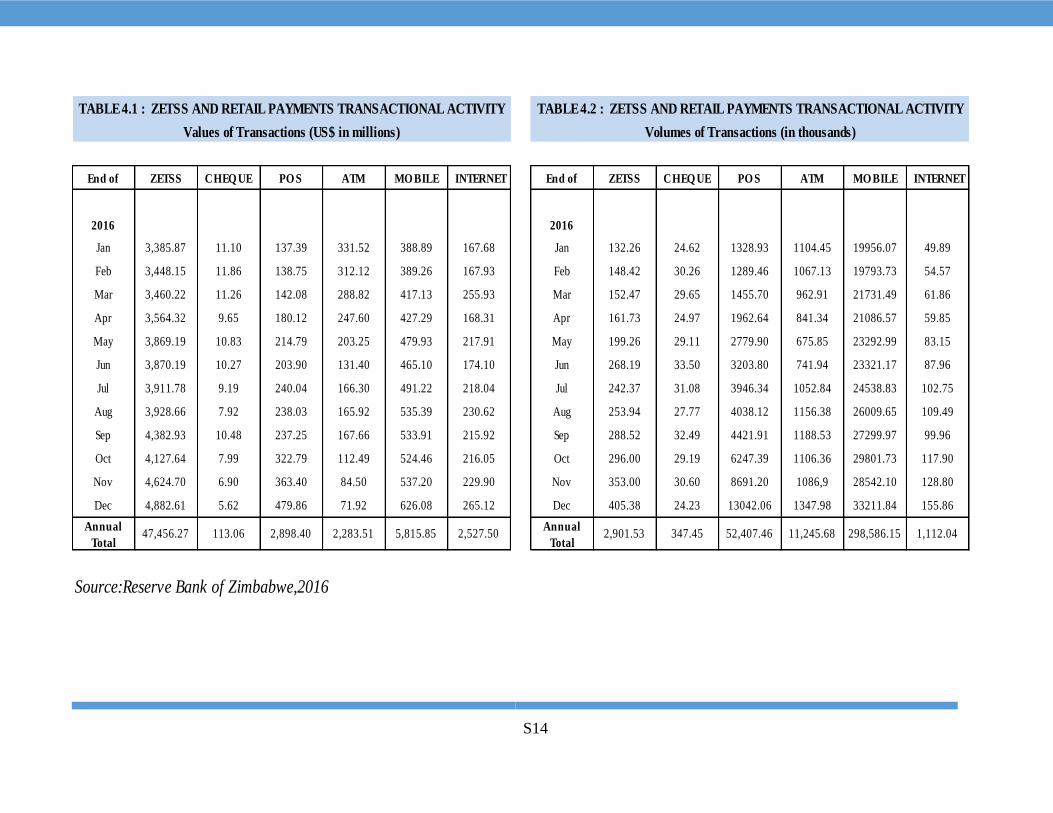
S14
End of ZETSS CHEQ UE PO S ATM MO BILE INTERNET End of ZETSS CHEQ UE PO S ATM MO BILE INTERNET
2016 2016
Jan 3,385.87 11.10 137.39 331.52 388.89 167.68 Jan 132.26 24.62 1328.93 1104.45 19956.07 49.89
Feb 3,448.15 11.86 138.75 312.12 389.26 167.93 Feb 148.42 30.26 1289.46 1067.13 19793.73 54.57
Mar 3,460.22 11.26 142.08 288.82 417.13 255.93 Mar 152.47 29.65 1455.70 962.91 21731.49 61.86
Apr 3,564.32 9.65 180.12 247.60 427.29 168.31 Apr 161.73 24.97 1962.64 841.34 21086.57 59.85
May 3,869.19 10.83 214.79 203.25 479.93 217.91 May 199.26 29.11 2779.90 675.85 23292.99 83.15
Jun 3,870.19 10.27 203.90 131.40 465.10 174.10 Jun 268.19 33.50 3203.80 741.94 23321.17 87.96
Jul 3,911.78 9.19 240.04 166.30 491.22 218.04 Jul 242.37 31.08 3946.34 1052.84 24538.83 102.75
Aug 3,928.66 7.92 238.03 165.92 535.39 230.62 Aug 253.94 27.77 4038.12 1156.38 26009.65 109.49
Sep 4,382.93 10.48 237.25 167.66 533.91 215.92 Sep 288.52 32.49 4421.91 1188.53 27299.97 99.96
Oct 4,127.64 7.99 322.79 112.49 524.46 216.05 Oct 296.00 29.19 6247.39 1106.36 29801.73 117.90
Nov 4,624.70 6.90 363.40 84.50 537.20 229.90 Nov 353.00 30.60 8691.20 1086,9 28542.10 128.80
Dec 4,882.61 5.62 479.86 71.92 626.08 265.12 Dec 405.38 24.23 13042.06 1347.98 33211.84 155.86
Annual
Total47,456.27 113.06 2,898.40 2,283.51 5,815.85 2,527.50
Annual
Total2,901.53 347.45 52,407.46 11,245.68 298,586.15 1,112.04
Source:Reserve Bank of Zimbabwe,2016
TABLE 4.1 : ZETSS AND RETAIL PAYMENTS TRANSACTIONAL ACTIVITY
Values of Transactions (US$ in millions)
TABLE 4.2 : ZETSS AND RETAIL PAYMENTS TRANSACTIONAL ACTIVITY
Volumes of Transactions (in thousands)
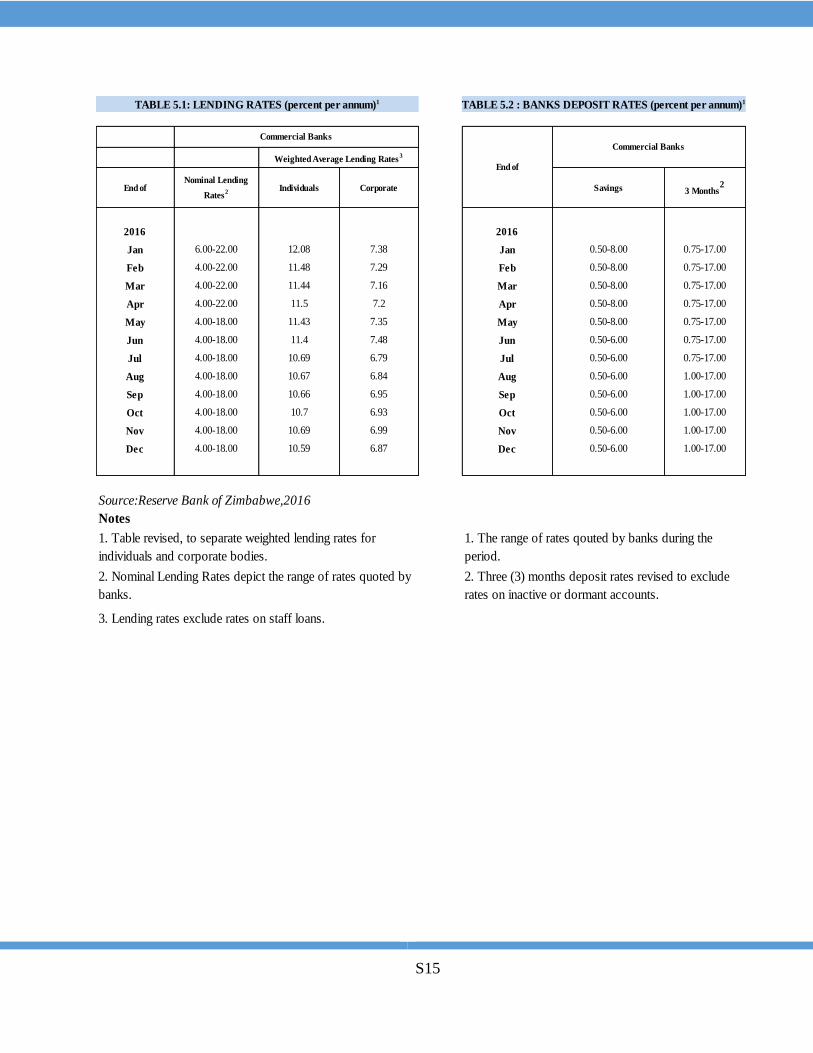
S15
End ofNominal Lending
Rates2
Individuals Corporate Savings 3 Months2
2016 2016
Jan 6.00-22.00 12.08 7.38 Jan 0.50-8.00 0.75-17.00
Feb 4.00-22.00 11.48 7.29 Feb 0.50-8.00 0.75-17.00
Mar 4.00-22.00 11.44 7.16 Mar 0.50-8.00 0.75-17.00
Apr 4.00-22.00 11.5 7.2 Apr 0.50-8.00 0.75-17.00
May 4.00-18.00 11.43 7.35 May 0.50-8.00 0.75-17.00
Jun 4.00-18.00 11.4 7.48 Jun 0.50-6.00 0.75-17.00
Jul 4.00-18.00 10.69 6.79 Jul 0.50-6.00 0.75-17.00
Aug 4.00-18.00 10.67 6.84 Aug 0.50-6.00 1.00-17.00
Sep 4.00-18.00 10.66 6.95 Sep 0.50-6.00 1.00-17.00
Oct 4.00-18.00 10.7 6.93 Oct 0.50-6.00 1.00-17.00
Nov 4.00-18.00 10.69 6.99 Nov 0.50-6.00 1.00-17.00
Dec 4.00-18.00 10.59 6.87 Dec 0.50-6.00 1.00-17.00
Source:Reserve Bank of Zimbabwe,2016
Notes
TABLE 5.2 : BANKS DEPOSIT RATES (percent per annum)1
1. The range of rates qouted by banks during the
period.
2. Three (3) months deposit rates revised to exclude
rates on inactive or dormant accounts.
TABLE 5.1: LENDING RATES (percent per annum)1
3. Lending rates exclude rates on staff loans.
1. Table revised, to separate weighted lending rates for
individuals and corporate bodies.
2. Nominal Lending Rates depict the range of rates quoted by
banks.
Weighted Average Lending Rates3
Commercial BanksCommercial Banks
End of
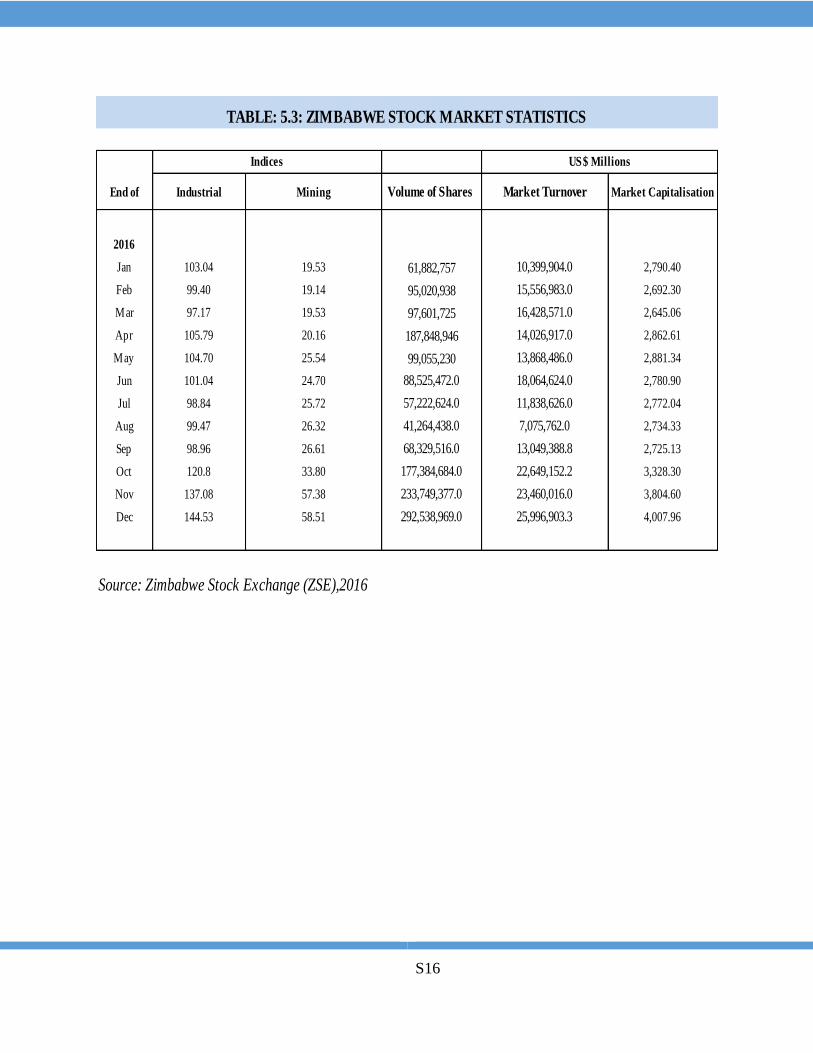
S16
End of Industrial Mining Volume of Shares Market Turnover Market Capitalisation
2016
Jan 103.04 19.53 61,882,757 10,399,904.0 2,790.40
Feb 99.40 19.14 95,020,938 15,556,983.0 2,692.30
Mar 97.17 19.53 97,601,725 16,428,571.0 2,645.06
Apr 105.79 20.16 187,848,946 14,026,917.0 2,862.61
May 104.70 25.54 99,055,230 13,868,486.0 2,881.34
Jun 101.04 24.70 88,525,472.0 18,064,624.0 2,780.90
Jul 98.84 25.72 57,222,624.0 11,838,626.0 2,772.04
Aug 99.47 26.32 41,264,438.0 7,075,762.0 2,734.33
Sep 98.96 26.61 68,329,516.0 13,049,388.8 2,725.13
Oct 120.8 33.80 177,384,684.0 22,649,152.2 3,328.30
Nov 137.08 57.38 233,749,377.0 23,460,016.0 3,804.60
Dec 144.53 58.51 292,538,969.0 25,996,903.3 4,007.96
Source: Zimbabwe Stock Exchange (ZSE),2016
Indices US$ Millions
TABLE: 5.3: ZIMBABWE STOCK MARKET STATISTICS
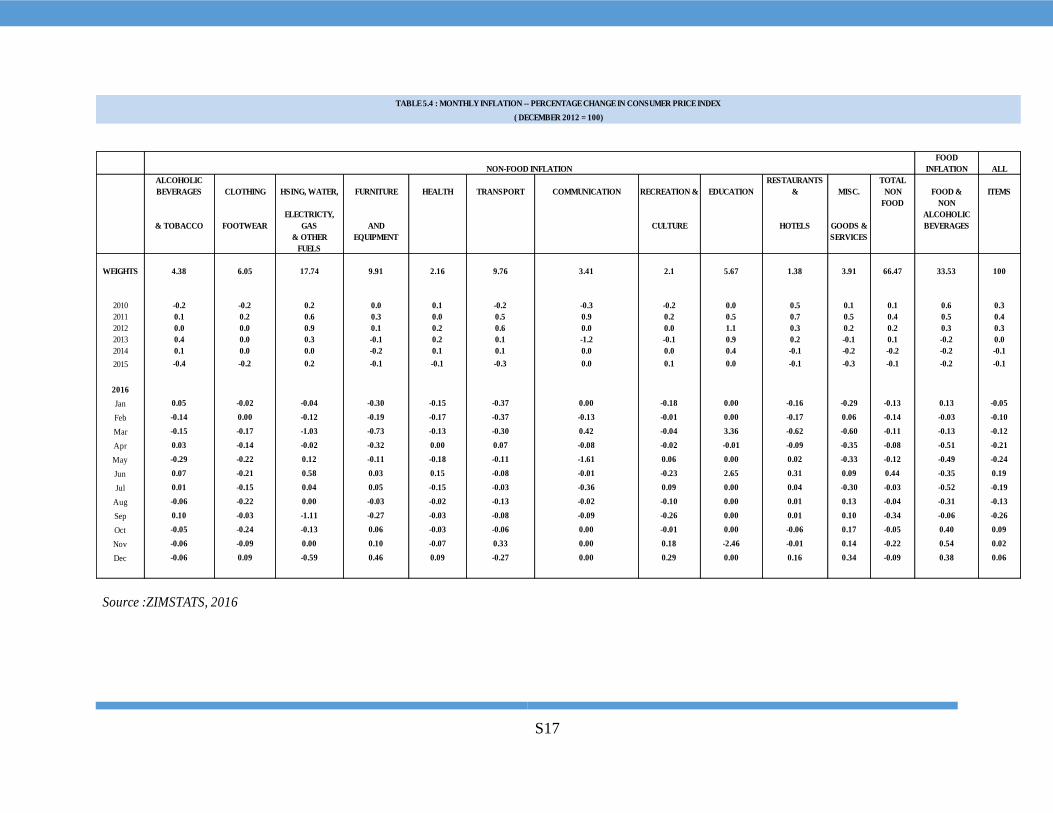
S17
FOOD
INFLATION ALL
ALCOHOLIC
BEVERAGES CLOTHING HSING, WATER, FURNITURE HEALTH TRANSPORT COMMUNICATION RECREATION & EDUCATION
RESTAURANTS
& MISC.
TOTAL
NON FOOD & ITEMS
& TOBACCO FOOTWEAR
ELECTRICTY,
GAS AND CULTURE HOTELS GOODS &
FOOD NON
ALCOHOLIC
BEVERAGES
& OTHER EQUIPMENT SERVICES
FUELS
WEIGHTS 4.38 6.05 17.74 9.91 2.16 9.76 3.41 2.1 5.67 1.38 3.91 66.47 33.53 100
2010 -0.2 -0.2 0.2 0.0 0.1 -0.2 -0.3 -0.2 0.0 0.5 0.1 0.1 0.6 0.3
2011 0.1 0.2 0.6 0.3 0.0 0.5 0.9 0.2 0.5 0.7 0.5 0.4 0.5 0.4
2012 0.0 0.0 0.9 0.1 0.2 0.6 0.0 0.0 1.1 0.3 0.2 0.2 0.3 0.3
2013 0.4 0.0 0.3 -0.1 0.2 0.1 -1.2 -0.1 0.9 0.2 -0.1 0.1 -0.2 0.0
2014 0.1 0.0 0.0 -0.2 0.1 0.1 0.0 0.0 0.4 -0.1 -0.2 -0.2 -0.2 -0.1
2015 -0.4 -0.2 0.2 -0.1 -0.1 -0.3 0.0 0.1 0.0 -0.1 -0.3 -0.1 -0.2 -0.1
2016
Jan 0.05 -0.02 -0.04 -0.30 -0.15 -0.37 0.00 -0.18 0.00 -0.16 -0.29 -0.13 0.13 -0.05
Feb -0.14 0.00 -0.12 -0.19 -0.17 -0.37 -0.13 -0.01 0.00 -0.17 0.06 -0.14 -0.03 -0.10
Mar -0.15 -0.17 -1.03 -0.73 -0.13 -0.30 0.42 -0.04 3.36 -0.62 -0.60 -0.11 -0.13 -0.12
Apr 0.03 -0.14 -0.02 -0.32 0.00 0.07 -0.08 -0.02 -0.01 -0.09 -0.35 -0.08 -0.51 -0.21
May -0.29 -0.22 0.12 -0.11 -0.18 -0.11 -1.61 0.06 0.00 0.02 -0.33 -0.12 -0.49 -0.24
Jun 0.07 -0.21 0.58 0.03 0.15 -0.08 -0.01 -0.23 2.65 0.31 0.09 0.44 -0.35 0.19
Jul 0.01 -0.15 0.04 0.05 -0.15 -0.03 -0.36 0.09 0.00 0.04 -0.30 -0.03 -0.52 -0.19
Aug -0.06 -0.22 0.00 -0.03 -0.02 -0.13 -0.02 -0.10 0.00 0.01 0.13 -0.04 -0.31 -0.13
Sep 0.10 -0.03 -1.11 -0.27 -0.03 -0.08 -0.09 -0.26 0.00 0.01 0.10 -0.34 -0.06 -0.26
Oct -0.05 -0.24 -0.13 0.06 -0.03 -0.06 0.00 -0.01 0.00 -0.06 0.17 -0.05 0.40 0.09
Nov -0.06 -0.09 0.00 0.10 -0.07 0.33 0.00 0.18 -2.46 -0.01 0.14 -0.22 0.54 0.02
Dec -0.06 0.09 -0.59 0.46 0.09 -0.27 0.00 0.29 0.00 0.16 0.34 -0.09 0.38 0.06
Source :ZIMSTATS, 2016
NON-FOOD INFLATION
TABLE 5.4 : MONTHLY INFLATION -- PERCENTAGE CHANGE IN CONSUMER PRICE INDEX
( DECEMBER 2012 = 100)
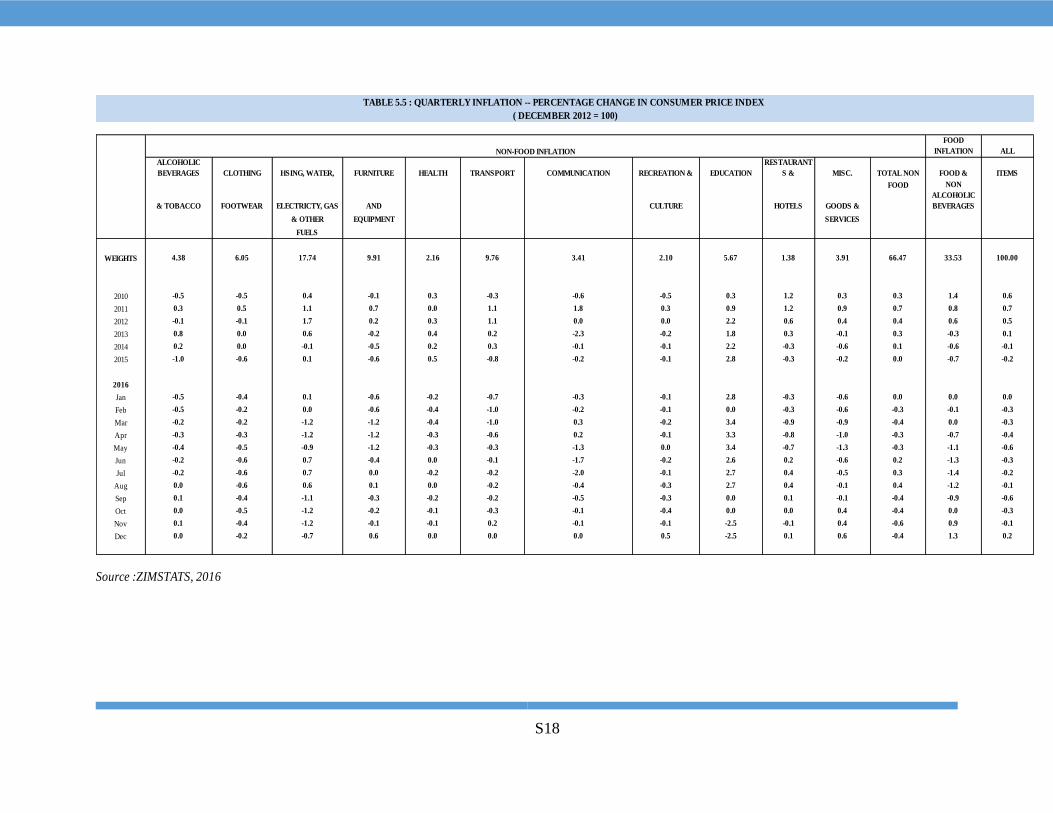
S18
FOOD
INFLATION ALL
ALCOHOLIC
BEVERAGES CLOTHING HSING, WATER, FURNITURE HEALTH TRANSPORT COMMUNICATION RECREATION & EDUCATION
RESTAURANT
S & MISC. TOTAL NON FOOD & ITEMS
& TOBACCO FOOTWEAR ELECTRICTY, GAS AND CULTURE HOTELS GOODS &
FOOD NON
ALCOHOLIC
BEVERAGES
& OTHER EQUIPMENT SERVICES
FUELS
WEIGHTS 4.38 6.05 17.74 9.91 2.16 9.76 3.41 2.10 5.67 1.38 3.91 66.47 33.53 100.00
2010 -0.5 -0.5 0.4 -0.1 0.3 -0.3 -0.6 -0.5 0.3 1.2 0.3 0.3 1.4 0.6
2011 0.3 0.5 1.1 0.7 0.0 1.1 1.8 0.3 0.9 1.2 0.9 0.7 0.8 0.7
2012 -0.1 -0.1 1.7 0.2 0.3 1.1 0.0 0.0 2.2 0.6 0.4 0.4 0.6 0.5
2013 0.8 0.0 0.6 -0.2 0.4 0.2 -2.3 -0.2 1.8 0.3 -0.1 0.3 -0.3 0.1
2014 0.2 0.0 -0.1 -0.5 0.2 0.3 -0.1 -0.1 2.2 -0.3 -0.6 0.1 -0.6 -0.1
2015 -1.0 -0.6 0.1 -0.6 0.5 -0.8 -0.2 -0.1 2.8 -0.3 -0.2 0.0 -0.7 -0.2
2016
Jan -0.5 -0.4 0.1 -0.6 -0.2 -0.7 -0.3 -0.1 2.8 -0.3 -0.6 0.0 0.0 0.0
Feb -0.5 -0.2 0.0 -0.6 -0.4 -1.0 -0.2 -0.1 0.0 -0.3 -0.6 -0.3 -0.1 -0.3
Mar -0.2 -0.2 -1.2 -1.2 -0.4 -1.0 0.3 -0.2 3.4 -0.9 -0.9 -0.4 0.0 -0.3
Apr -0.3 -0.3 -1.2 -1.2 -0.3 -0.6 0.2 -0.1 3.3 -0.8 -1.0 -0.3 -0.7 -0.4
May -0.4 -0.5 -0.9 -1.2 -0.3 -0.3 -1.3 0.0 3.4 -0.7 -1.3 -0.3 -1.1 -0.6
Jun -0.2 -0.6 0.7 -0.4 0.0 -0.1 -1.7 -0.2 2.6 0.2 -0.6 0.2 -1.3 -0.3
Jul -0.2 -0.6 0.7 0.0 -0.2 -0.2 -2.0 -0.1 2.7 0.4 -0.5 0.3 -1.4 -0.2
Aug 0.0 -0.6 0.6 0.1 0.0 -0.2 -0.4 -0.3 2.7 0.4 -0.1 0.4 -1.2 -0.1
Sep 0.1 -0.4 -1.1 -0.3 -0.2 -0.2 -0.5 -0.3 0.0 0.1 -0.1 -0.4 -0.9 -0.6
Oct 0.0 -0.5 -1.2 -0.2 -0.1 -0.3 -0.1 -0.4 0.0 0.0 0.4 -0.4 0.0 -0.3
Nov 0.1 -0.4 -1.2 -0.1 -0.1 0.2 -0.1 -0.1 -2.5 -0.1 0.4 -0.6 0.9 -0.1
Dec 0.0 -0.2 -0.7 0.6 0.0 0.0 0.0 0.5 -2.5 0.1 0.6 -0.4 1.3 0.2
Source :ZIMSTATS, 2016
TABLE 5.5 : QUARTERLY INFLATION -- PERCENTAGE CHANGE IN CONSUMER PRICE INDEX
( DECEMBER 2012 = 100)
NON-FOOD INFLATION
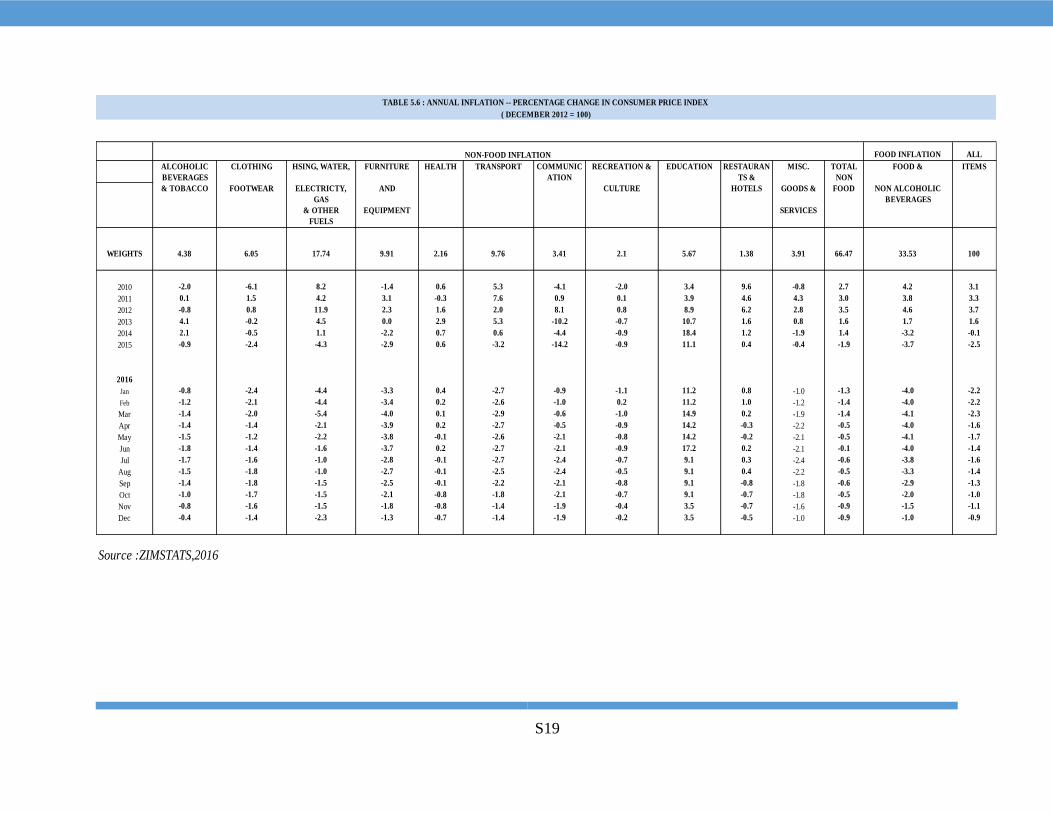
S19
FOOD INFLATION ALL
ALCOHOLIC
BEVERAGES
CLOTHING HSING, WATER, FURNITURE HEALTH TRANSPORT COMMUNIC
ATION
RECREATION & EDUCATION RESTAURAN
TS &
MISC. TOTAL
NON
FOOD & ITEMS
& TOBACCO FOOTWEAR ELECTRICTY,
GAS
AND CULTURE HOTELS GOODS & FOOD NON ALCOHOLIC
BEVERAGES
& OTHER EQUIPMENT SERVICES
FUELS
WEIGHTS 4.38 6.05 17.74 9.91 2.16 9.76 3.41 2.1 5.67 1.38 3.91 66.47 33.53 100
2010 -2.0 -6.1 8.2 -1.4 0.6 5.3 -4.1 -2.0 3.4 9.6 -0.8 2.7 4.2 3.1
2011 0.1 1.5 4.2 3.1 -0.3 7.6 0.9 0.1 3.9 4.6 4.3 3.0 3.8 3.3
2012 -0.8 0.8 11.9 2.3 1.6 2.0 8.1 0.8 8.9 6.2 2.8 3.5 4.6 3.7
2013 4.1 -0.2 4.5 0.0 2.9 5.3 -10.2 -0.7 10.7 1.6 0.8 1.6 1.7 1.6
2014 2.1 -0.5 1.1 -2.2 0.7 0.6 -4.4 -0.9 18.4 1.2 -1.9 1.4 -3.2 -0.1
2015 -0.9 -2.4 -4.3 -2.9 0.6 -3.2 -14.2 -0.9 11.1 0.4 -0.4 -1.9 -3.7 -2.5
2016
Jan -0.8 -2.4 -4.4 -3.3 0.4 -2.7 -0.9 -1.1 11.2 0.8 -1.0 -1.3 -4.0 -2.2
Feb -1.2 -2.1 -4.4 -3.4 0.2 -2.6 -1.0 0.2 11.2 1.0 -1.2 -1.4 -4.0 -2.2
Mar -1.4 -2.0 -5.4 -4.0 0.1 -2.9 -0.6 -1.0 14.9 0.2 -1.9 -1.4 -4.1 -2.3
Apr -1.4 -1.4 -2.1 -3.9 0.2 -2.7 -0.5 -0.9 14.2 -0.3 -2.2 -0.5 -4.0 -1.6
May -1.5 -1.2 -2.2 -3.8 -0.1 -2.6 -2.1 -0.8 14.2 -0.2 -2.1 -0.5 -4.1 -1.7
Jun -1.8 -1.4 -1.6 -3.7 0.2 -2.7 -2.1 -0.9 17.2 0.2 -2.1 -0.1 -4.0 -1.4
Jul -1.7 -1.6 -1.0 -2.8 -0.1 -2.7 -2.4 -0.7 9.1 0.3 -2.4 -0.6 -3.8 -1.6
Aug -1.5 -1.8 -1.0 -2.7 -0.1 -2.5 -2.4 -0.5 9.1 0.4 -2.2 -0.5 -3.3 -1.4
Sep -1.4 -1.8 -1.5 -2.5 -0.1 -2.2 -2.1 -0.8 9.1 -0.8 -1.8 -0.6 -2.9 -1.3
Oct -1.0 -1.7 -1.5 -2.1 -0.8 -1.8 -2.1 -0.7 9.1 -0.7 -1.8 -0.5 -2.0 -1.0
Nov -0.8 -1.6 -1.5 -1.8 -0.8 -1.4 -1.9 -0.4 3.5 -0.7 -1.6 -0.9 -1.5 -1.1
Dec -0.4 -1.4 -2.3 -1.3 -0.7 -1.4 -1.9 -0.2 3.5 -0.5 -1.0 -0.9 -1.0 -0.9
Source :ZIMSTATS,2016
TABLE 5.6 : ANNUAL INFLATION -- PERCENTAGE CHANGE IN CONSUMER PRICE INDEX
( DECEMBER 2012 = 100)
NON-FOOD INFLATION
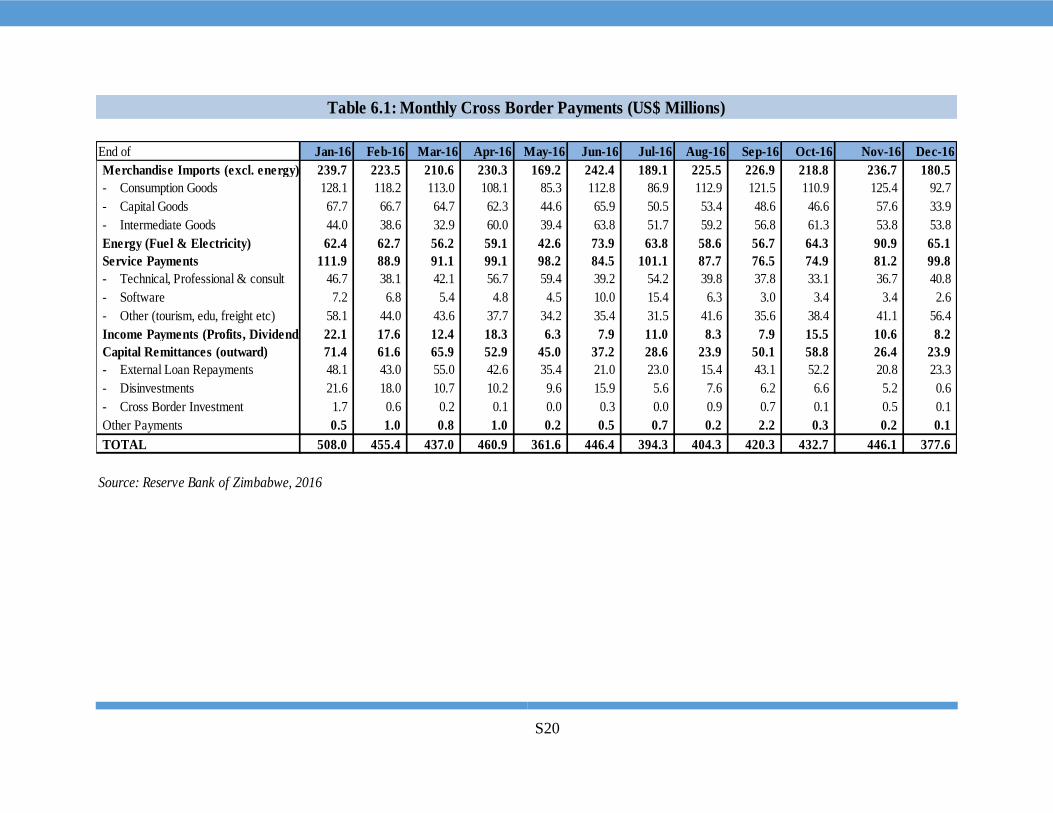
S20
End of Jan-16 Feb-16 Mar-16 Apr-16 May-16 Jun-16 Jul-16 Aug-16 Sep-16 Oct-16 Nov-16 Dec-16
Merchandise Imports (excl. energy) 239.7 223.5 210.6 230.3 169.2 242.4 189.1 225.5 226.9 218.8 236.7 180.5
- Consumption Goods 128.1 118.2 113.0 108.1 85.3 112.8 86.9 112.9 121.5 110.9 125.4 92.7
- Capital Goods 67.7 66.7 64.7 62.3 44.6 65.9 50.5 53.4 48.6 46.6 57.6 33.9
- Intermediate Goods 44.0 38.6 32.9 60.0 39.4 63.8 51.7 59.2 56.8 61.3 53.8 53.8
Energy (Fuel & Electricity) 62.4 62.7 56.2 59.1 42.6 73.9 63.8 58.6 56.7 64.3 90.9 65.1
Service Payments 111.9 88.9 91.1 99.1 98.2 84.5 101.1 87.7 76.5 74.9 81.2 99.8
- Technical, Professional & consult 46.7 38.1 42.1 56.7 59.4 39.2 54.2 39.8 37.8 33.1 36.7 40.8
- Software 7.2 6.8 5.4 4.8 4.5 10.0 15.4 6.3 3.0 3.4 3.4 2.6
- Other (tourism, edu, freight etc) 58.1 44.0 43.6 37.7 34.2 35.4 31.5 41.6 35.6 38.4 41.1 56.4
Income Payments (Profits, Dividends) 22.1 17.6 12.4 18.3 6.3 7.9 11.0 8.3 7.9 15.5 10.6 8.2
Capital Remittances (outward) 71.4 61.6 65.9 52.9 45.0 37.2 28.6 23.9 50.1 58.8 26.4 23.9
- External Loan Repayments 48.1 43.0 55.0 42.6 35.4 21.0 23.0 15.4 43.1 52.2 20.8 23.3
- Disinvestments 21.6 18.0 10.7 10.2 9.6 15.9 5.6 7.6 6.2 6.6 5.2 0.6
- Cross Border Investment 1.7 0.6 0.2 0.1 0.0 0.3 0.0 0.9 0.7 0.1 0.5 0.1
Other Payments 0.5 1.0 0.8 1.0 0.2 0.5 0.7 0.2 2.2 0.3 0.2 0.1
TOTAL 508.0 455.4 437.0 460.9 361.6 446.4 394.3 404.3 420.3 432.7 446.1 377.6
Source: Reserve Bank of Zimbabwe, 2016
Table 6.1: Monthly Cross Border Payments (US$ Millions)
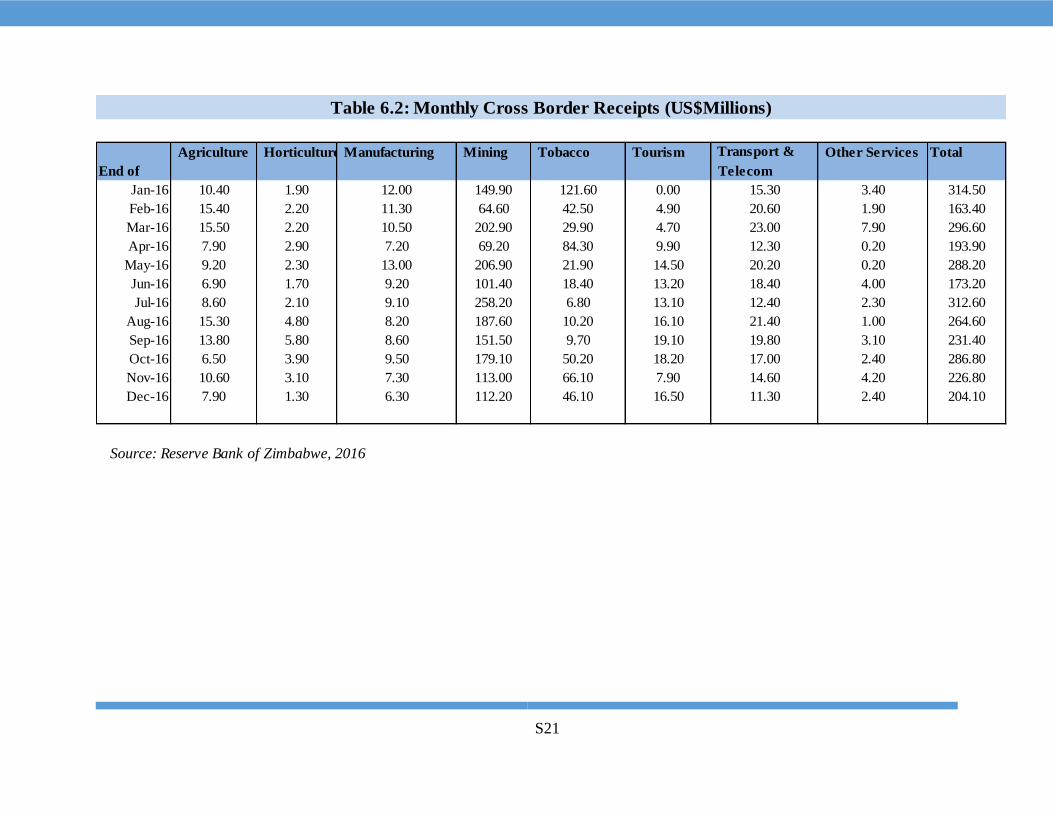
S21
Agriculture Horticulture Manufacturing Mining Tobacco Tourism Transport & Other Services Total
End of Telecom
Jan-16 10.40 1.90 12.00 149.90 121.60 0.00 15.30 3.40 314.50
Feb-16 15.40 2.20 11.30 64.60 42.50 4.90 20.60 1.90 163.40
Mar-16 15.50 2.20 10.50 202.90 29.90 4.70 23.00 7.90 296.60
Apr-16 7.90 2.90 7.20 69.20 84.30 9.90 12.30 0.20 193.90
May-16 9.20 2.30 13.00 206.90 21.90 14.50 20.20 0.20 288.20
Jun-16 6.90 1.70 9.20 101.40 18.40 13.20 18.40 4.00 173.20
Jul-16 8.60 2.10 9.10 258.20 6.80 13.10 12.40 2.30 312.60
Aug-16 15.30 4.80 8.20 187.60 10.20 16.10 21.40 1.00 264.60
Sep-16 13.80 5.80 8.60 151.50 9.70 19.10 19.80 3.10 231.40
Oct-16 6.50 3.90 9.50 179.10 50.20 18.20 17.00 2.40 286.80
Nov-16 10.60 3.10 7.30 113.00 66.10 7.90 14.60 4.20 226.80
Dec-16 7.90 1.30 6.30 112.20 46.10 16.50 11.30 2.40 204.10
Source: Reserve Bank of Zimbabwe, 2016
Table 6.2: Monthly Cross Border Receipts (US$Millions)
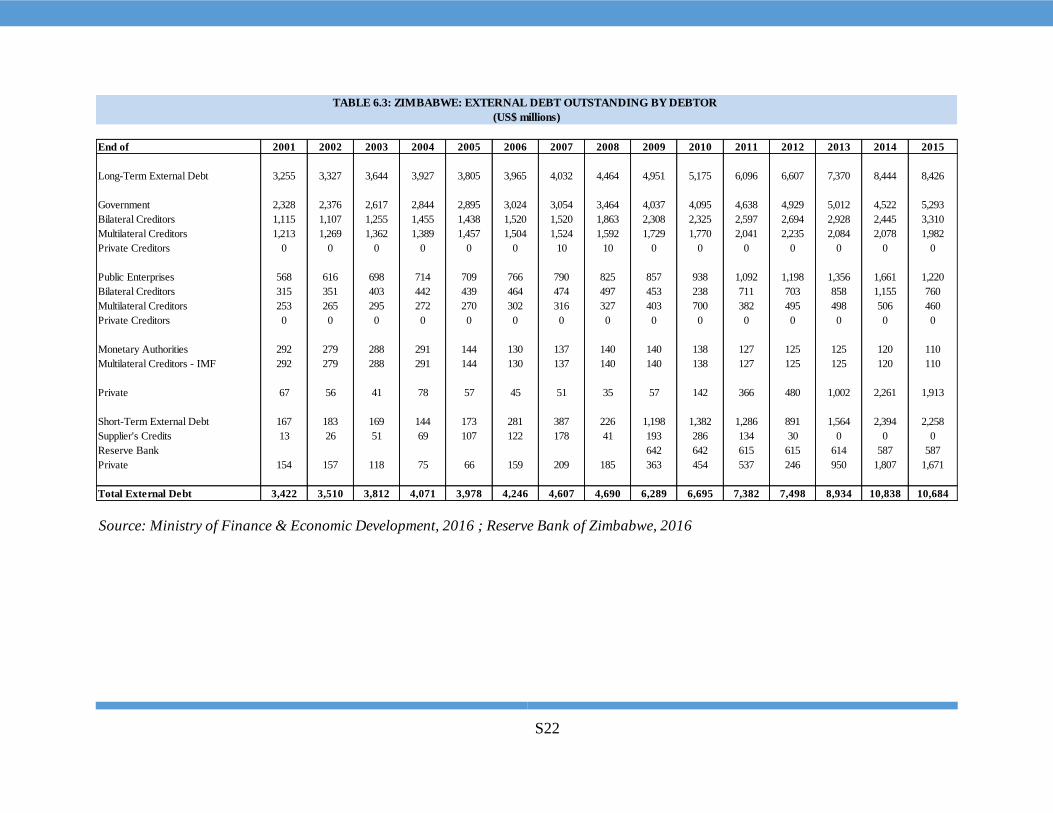
S22
End of 2001 2002 2003 2004 2005 2006 2007 2008 2009 2010 2011 2012 2013 2014 2015
Long-Term External Debt 3,255 3,327 3,644 3,927 3,805 3,965 4,032 4,464 4,951 5,175 6,096 6,607 7,370 8,444 8,426
Government 2,328 2,376 2,617 2,844 2,895 3,024 3,054 3,464 4,037 4,095 4,638 4,929 5,012 4,522 5,293
Bilateral Creditors 1,115 1,107 1,255 1,455 1,438 1,520 1,520 1,863 2,308 2,325 2,597 2,694 2,928 2,445 3,310
Multilateral Creditors 1,213 1,269 1,362 1,389 1,457 1,504 1,524 1,592 1,729 1,770 2,041 2,235 2,084 2,078 1,982
Private Creditors 0 0 0 0 0 0 10 10 0 0 0 0 0 0 0
Public Enterprises 568 616 698 714 709 766 790 825 857 938 1,092 1,198 1,356 1,661 1,220
Bilateral Creditors 315 351 403 442 439 464 474 497 453 238 711 703 858 1,155 760
Multilateral Creditors 253 265 295 272 270 302 316 327 403 700 382 495 498 506 460
Private Creditors 0 0 0 0 0 0 0 0 0 0 0 0 0 0 0
Monetary Authorities 292 279 288 291 144 130 137 140 140 138 127 125 125 120 110
Multilateral Creditors - IMF 292 279 288 291 144 130 137 140 140 138 127 125 125 120 110
Private 67 56 41 78 57 45 51 35 57 142 366 480 1,002 2,261 1,913
Short-Term External Debt 167 183 169 144 173 281 387 226 1,198 1,382 1,286 891 1,564 2,394 2,258
Supplier's Credits 13 26 51 69 107 122 178 41 193 286 134 30 0 0 0
Reserve Bank 642 642 615 615 614 587 587
Private 154 157 118 75 66 159 209 185 363 454 537 246 950 1,807 1,671
Total External Debt 3,422 3,510 3,812 4,071 3,978 4,246 4,607 4,690 6,289 6,695 7,382 7,498 8,934 10,838 10,684
Source: Ministry of Finance & Economic Development, 2016 ; Reserve Bank of Zimbabwe, 2016
TABLE 6.3: ZIMBABWE: EXTERNAL DEBT OUTSTANDING BY DEBTOR
(US$ millions)

S23
End of 2001 2002 2003 2004 2005 2006 2007 2008 2009 2010 2011 2012 2013 2014 2015
(US$ millions)
Total Medium to Long-Term External Debt 3,255 3,327 3,644 3,927 3,805 3,965 4,032 4,464 5,091 5,313 6,096 6,607 7,370 8,444 8,426
Public and Publicly Guaranteed Debt 3,188 3,271 3,603 3,849 3,748 3,920 3,981 4,429 5,676 5,813 6,345 6,742 6,982 6,768 7,100
Bilateral Creditors 1,430 1,458 1,658 1,897 1,877 1,984 1,994 2,360 2,761 2,563 3,307 3,397 3,786 3,479 3,960
Multilateral Creditors 1,758 1,813 1,945 1,952 1,871 1,936 1,976 2,059 2,272 2,608 2,423 2,730 2,582 2,704 2,553
Private Creditors 0 0 0 0 0 0 10 10 0 0 0 0 0 0 0
Private Non-Guaranteed Long term 67 56 41 78 57 45 51 35 57 142 366 480 1,002 2,261 1,913
Short-Term External Debt 167 183 169 144 173 281 387 226 1198 1382 1,286 891 1,564 2,394 2,258
Public and Publicly Guaranteed Debt 13 26 51 69 107 122 178 41 193 286 134 30 0 0 0
Reserve Bank - - - - - - - - 642 642 615 615 614 587 587
Private 154 157 118 75 66 159 209 185 363 454 537 246 950 1,807 1,671
Total External Debt 3,422 3,510 3,812 4,071 3,978 4,246 4,419 4,690 6,289 6,695 7,382 7,498 8,934 10,838 10,684
Gross Domestic Product 10,887 6,715 5,037 4,299 2,918 6,645 4,000 3,175 8157 9457 10,956 12,472 12,973 14,068 13,891
External Debt / GDP 31.4% 52.3% 75.7% 94.7% 136.3% 63.9% 110.5% 147.7% 77.1% 70.8% 67.4% 60.1% 68.9% 77.0% 76.9%
Source: Ministry of Finance & Economic Development, 2016 ; Reserve Bank of Zimbabwe, 2016
TABLE 6.4: External Debt Outstanding by Source
(US$ millions)
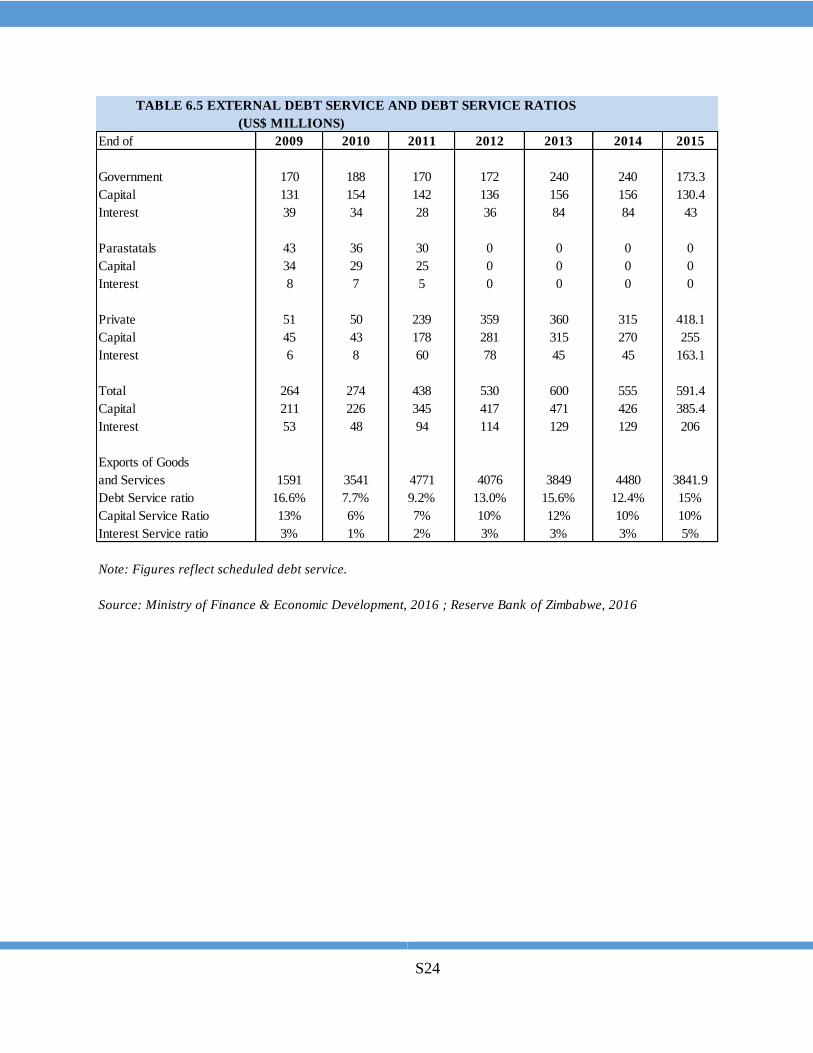
S24
TABLE 6.5 EXTERNAL DEBT SERVICE AND DEBT SERVICE RATIOS
(US$ MILLIONS)
End of 2009 2010 2011 2012 2013 2014 2015
Government 170 188 170 172 240 240 173.3
Capital 131 154 142 136 156 156 130.4
Interest 39 34 28 36 84 84 43
Parastatals 43 36 30 0 0 0 0
Capital 34 29 25 0 0 0 0
Interest 8 7 5 0 0 0 0
Private 51 50 239 359 360 315 418.1
Capital 45 43 178 281 315 270 255
Interest 6 8 60 78 45 45 163.1
Total 264 274 438 530 600 555 591.4
Capital 211 226 345 417 471 426 385.4
Interest 53 48 94 114 129 129 206
Exports of Goods
and Services 1591 3541 4771 4076 3849 4480 3841.9
Debt Service ratio 16.6% 7.7% 9.2% 13.0% 15.6% 12.4% 15%
Capital Service Ratio 13% 6% 7% 10% 12% 10% 10%
Interest Service ratio 3% 1% 2% 3% 3% 3% 5%
Note: Figures reflect scheduled debt service.
Source: Ministry of Finance & Economic Development, 2016 ; Reserve Bank of Zimbabwe, 2016
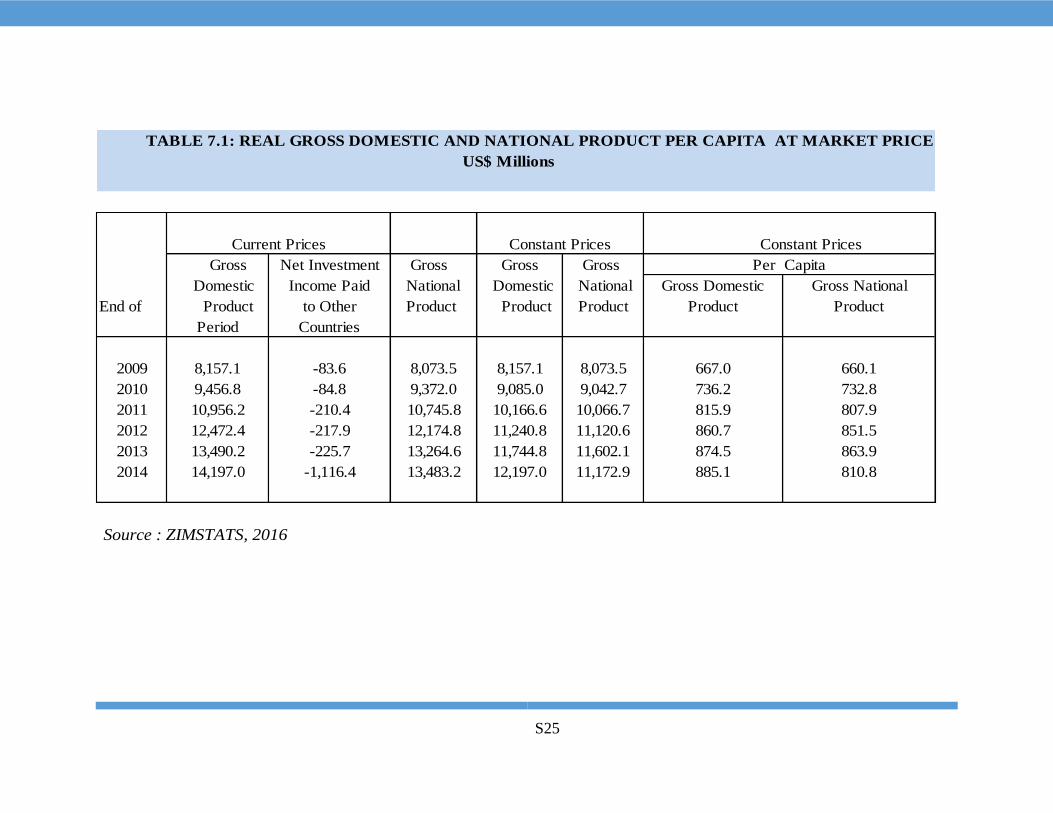
S25
US$ Millions
Gross Net Investment Gross Gross Gross
Domestic Income Paid National Domestic National Gross Domestic Gross National
End of Product to Other Product Product Product Product Product
Period Countries
2009 8,157.1 -83.6 8,073.5 8,157.1 8,073.5 667.0 660.1
2010 9,456.8 -84.8 9,372.0 9,085.0 9,042.7 736.2 732.8
2011 10,956.2 -210.4 10,745.8 10,166.6 10,066.7 815.9 807.9
2012 12,472.4 -217.9 12,174.8 11,240.8 11,120.6 860.7 851.5
2013 13,490.2 -225.7 13,264.6 11,744.8 11,602.1 874.5 863.9
2014 14,197.0 -1,116.4 13,483.2 12,197.0 11,172.9 885.1 810.8
Source : ZIMSTATS, 2016
Current Prices Constant Prices Constant Prices
Per Capita
TABLE 7.1: REAL GROSS DOMESTIC AND NATIONAL PRODUCT PER CAPITA AT MARKET PRICES
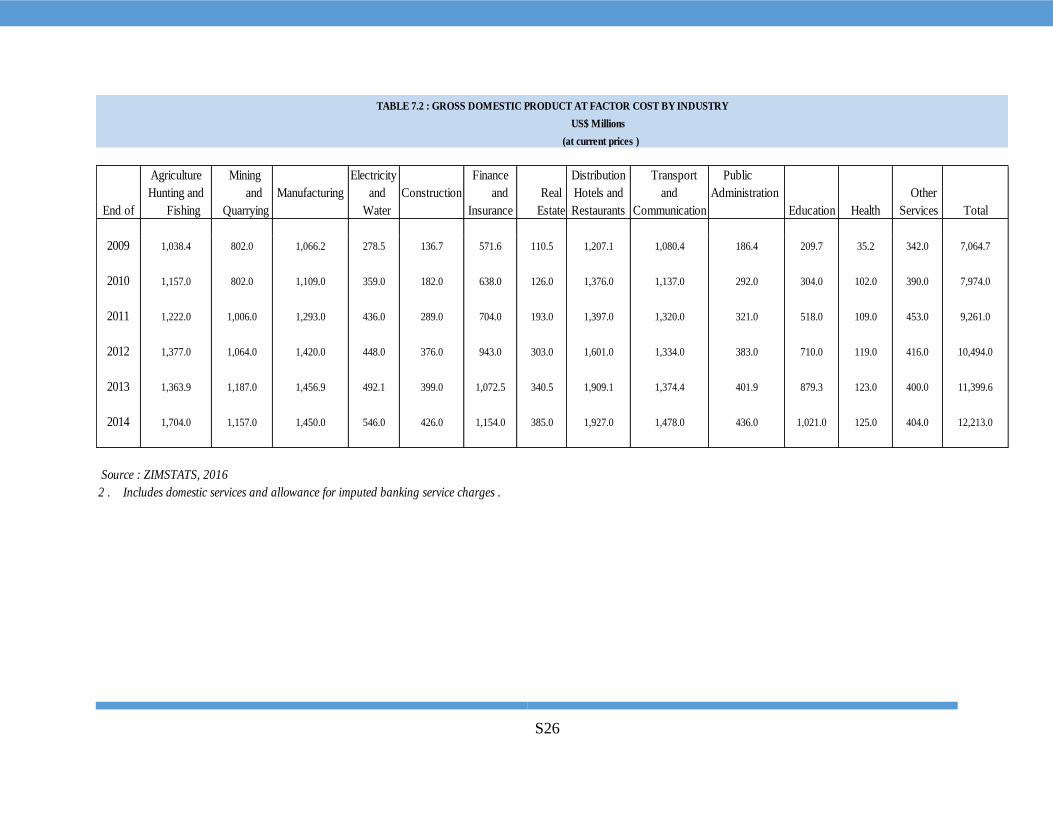
S26
Agriculture Mining Electricity Finance Distribution Transport Public
Hunting and and Manufacturing and Construction and Real Hotels and and Administration Other
End of Fishing Quarrying Water Insurance Estate Restaurants Communication Education Health Services Total
2009 1,038.4 802.0 1,066.2 278.5 136.7 571.6 110.5 1,207.1 1,080.4 186.4 209.7 35.2 342.0 7,064.7
2010 1,157.0 802.0 1,109.0 359.0 182.0 638.0 126.0 1,376.0 1,137.0 292.0 304.0 102.0 390.0 7,974.0
2011 1,222.0 1,006.0 1,293.0 436.0 289.0 704.0 193.0 1,397.0 1,320.0 321.0 518.0 109.0 453.0 9,261.0
2012 1,377.0 1,064.0 1,420.0 448.0 376.0 943.0 303.0 1,601.0 1,334.0 383.0 710.0 119.0 416.0 10,494.0
2013 1,363.9 1,187.0 1,456.9 492.1 399.0 1,072.5 340.5 1,909.1 1,374.4 401.9 879.3 123.0 400.0 11,399.6
2014 1,704.0 1,157.0 1,450.0 546.0 426.0 1,154.0 385.0 1,927.0 1,478.0 436.0 1,021.0 125.0 404.0 12,213.0
Source : ZIMSTATS, 2016
2 . Includes domestic services and allowance for imputed banking service charges .
TABLE 7.2 : GROSS DOMESTIC PRODUCT AT FACTOR COST BY INDUSTRY
US$ Millions
(at current prices )
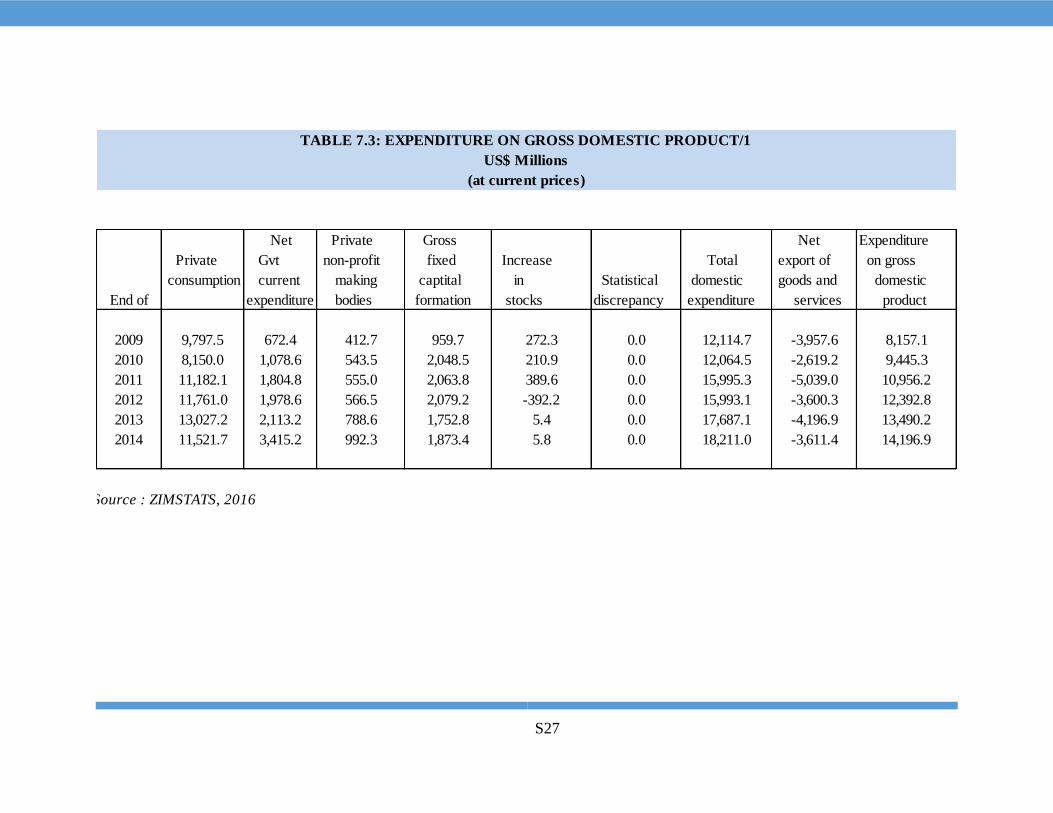
S27
Net Private Gross Net Expenditure
Private Gvt non-profit fixed Increase Total export of on gross
consumption current making captital in Statistical domestic goods and domestic
End of expenditure bodies formation stocks discrepancy expenditure services product
2009 9,797.5 672.4 412.7 959.7 272.3 0.0 12,114.7 -3,957.6 8,157.1
2010 8,150.0 1,078.6 543.5 2,048.5 210.9 0.0 12,064.5 -2,619.2 9,445.3
2011 11,182.1 1,804.8 555.0 2,063.8 389.6 0.0 15,995.3 -5,039.0 10,956.2
2012 11,761.0 1,978.6 566.5 2,079.2 -392.2 0.0 15,993.1 -3,600.3 12,392.8
2013 13,027.2 2,113.2 788.6 1,752.8 5.4 0.0 17,687.1 -4,196.9 13,490.2
2014 11,521.7 3,415.2 992.3 1,873.4 5.8 0.0 18,211.0 -3,611.4 14,196.9
Source : ZIMSTATS, 2016
(at current prices)
US$ Millions
TABLE 7.3: EXPENDITURE ON GROSS DOMESTIC PRODUCT/1
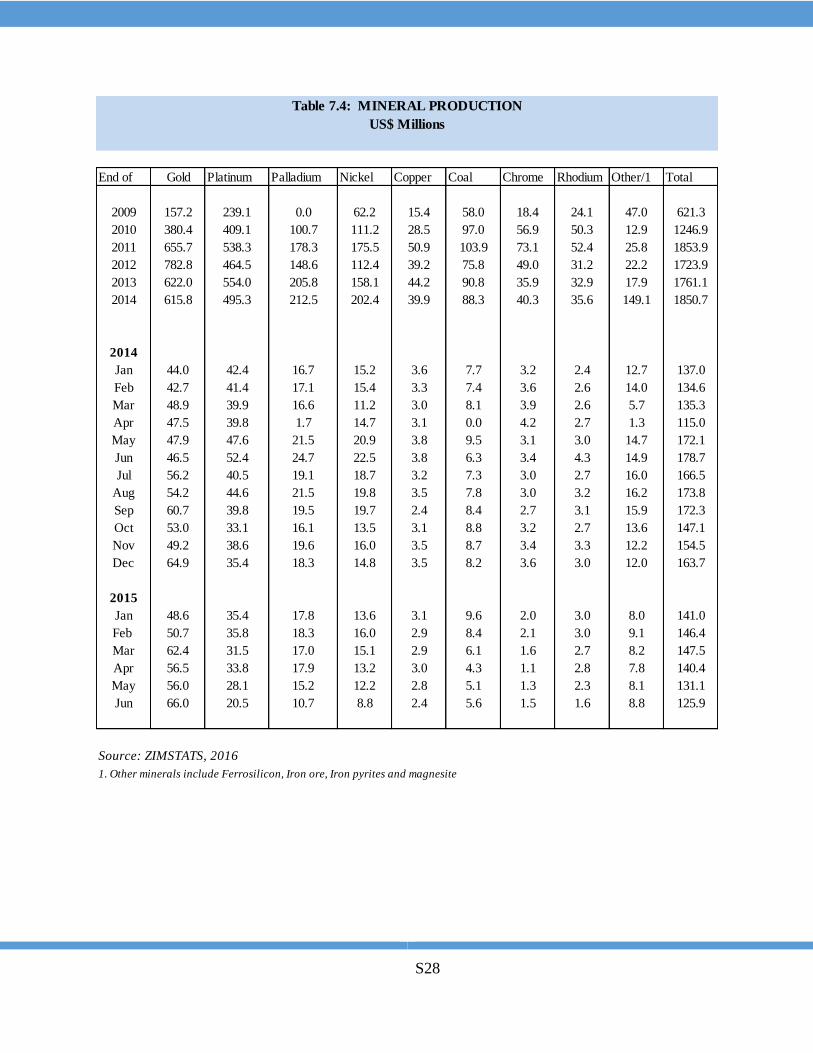
S28
End of Gold Platinum Palladium Nickel Copper Coal Chrome Rhodium Other/1 Total
2009 157.2 239.1 0.0 62.2 15.4 58.0 18.4 24.1 47.0 621.3
2010 380.4 409.1 100.7 111.2 28.5 97.0 56.9 50.3 12.9 1246.9
2011 655.7 538.3 178.3 175.5 50.9 103.9 73.1 52.4 25.8 1853.9
2012 782.8 464.5 148.6 112.4 39.2 75.8 49.0 31.2 22.2 1723.9
2013 622.0 554.0 205.8 158.1 44.2 90.8 35.9 32.9 17.9 1761.1
2014 615.8 495.3 212.5 202.4 39.9 88.3 40.3 35.6 149.1 1850.7
2014
Jan 44.0 42.4 16.7 15.2 3.6 7.7 3.2 2.4 12.7 137.0
Feb 42.7 41.4 17.1 15.4 3.3 7.4 3.6 2.6 14.0 134.6
Mar 48.9 39.9 16.6 11.2 3.0 8.1 3.9 2.6 5.7 135.3
Apr 47.5 39.8 1.7 14.7 3.1 0.0 4.2 2.7 1.3 115.0
May 47.9 47.6 21.5 20.9 3.8 9.5 3.1 3.0 14.7 172.1
Jun 46.5 52.4 24.7 22.5 3.8 6.3 3.4 4.3 14.9 178.7
Jul 56.2 40.5 19.1 18.7 3.2 7.3 3.0 2.7 16.0 166.5
Aug 54.2 44.6 21.5 19.8 3.5 7.8 3.0 3.2 16.2 173.8
Sep 60.7 39.8 19.5 19.7 2.4 8.4 2.7 3.1 15.9 172.3
Oct 53.0 33.1 16.1 13.5 3.1 8.8 3.2 2.7 13.6 147.1
Nov 49.2 38.6 19.6 16.0 3.5 8.7 3.4 3.3 12.2 154.5
Dec 64.9 35.4 18.3 14.8 3.5 8.2 3.6 3.0 12.0 163.7
2015
Jan 48.6 35.4 17.8 13.6 3.1 9.6 2.0 3.0 8.0 141.0
Feb 50.7 35.8 18.3 16.0 2.9 8.4 2.1 3.0 9.1 146.4
Mar 62.4 31.5 17.0 15.1 2.9 6.1 1.6 2.7 8.2 147.5
Apr 56.5 33.8 17.9 13.2 3.0 4.3 1.1 2.8 7.8 140.4
May 56.0 28.1 15.2 12.2 2.8 5.1 1.3 2.3 8.1 131.1
Jun 66.0 20.5 10.7 8.8 2.4 5.6 1.5 1.6 8.8 125.9
Source: ZIMSTATS, 2016
1. Other minerals include Ferrosilicon, Iron ore, Iron pyrites and magnesite
Table 7.4: MINERAL PRODUCTION
US$ Millions
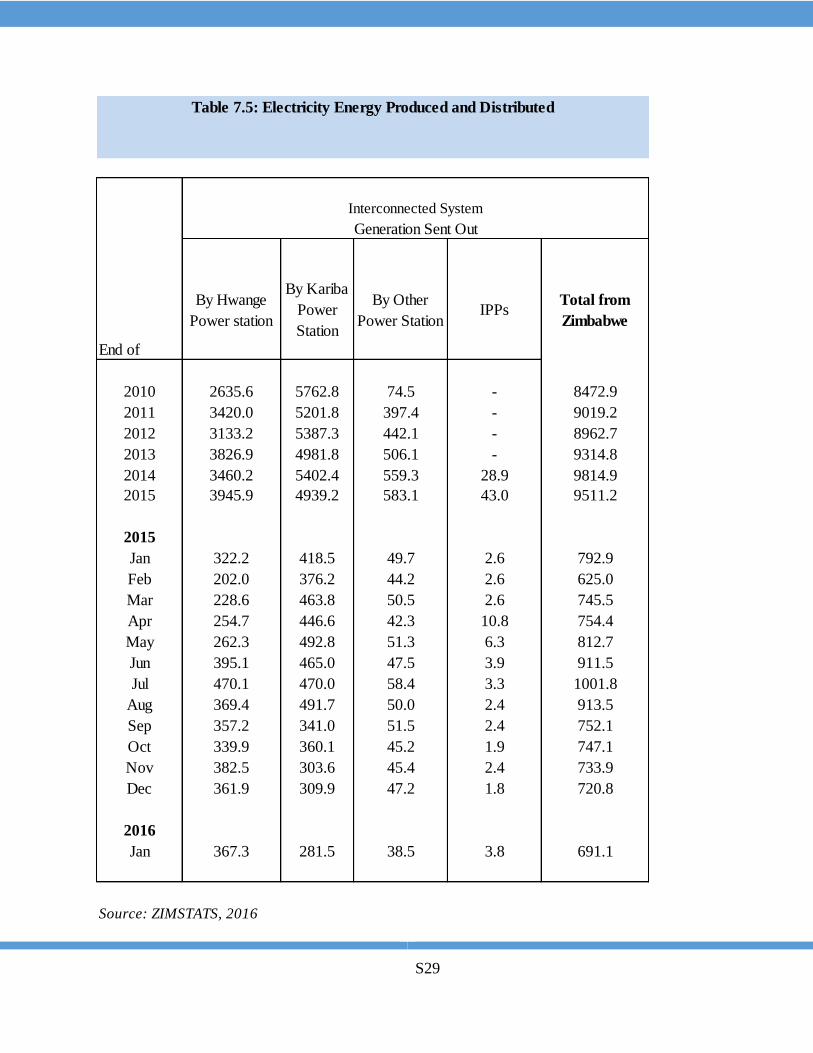
S29
End of
By Hwange
Power station
By Kariba
Power
Station
By Other
Power StationIPPs
Total from
Zimbabwe
2010 2635.6 5762.8 74.5 - 8472.9
2011 3420.0 5201.8 397.4 - 9019.2
2012 3133.2 5387.3 442.1 - 8962.7
2013 3826.9 4981.8 506.1 - 9314.8
2014 3460.2 5402.4 559.3 28.9 9814.9
2015 3945.9 4939.2 583.1 43.0 9511.2
2015
Jan 322.2 418.5 49.7 2.6 792.9
Feb 202.0 376.2 44.2 2.6 625.0
Mar 228.6 463.8 50.5 2.6 745.5
Apr 254.7 446.6 42.3 10.8 754.4
May 262.3 492.8 51.3 6.3 812.7
Jun 395.1 465.0 47.5 3.9 911.5
Jul 470.1 470.0 58.4 3.3 1001.8
Aug 369.4 491.7 50.0 2.4 913.5
Sep 357.2 341.0 51.5 2.4 752.1
Oct 339.9 360.1 45.2 1.9 747.1
Nov 382.5 303.6 45.4 2.4 733.9
Dec 361.9 309.9 47.2 1.8 720.8
2016
Jan 367.3 281.5 38.5 3.8 691.1
Source: ZIMSTATS, 2016
Table 7.5: Electricity Energy Produced and Distributed
Interconnected System
Generation Sent Out
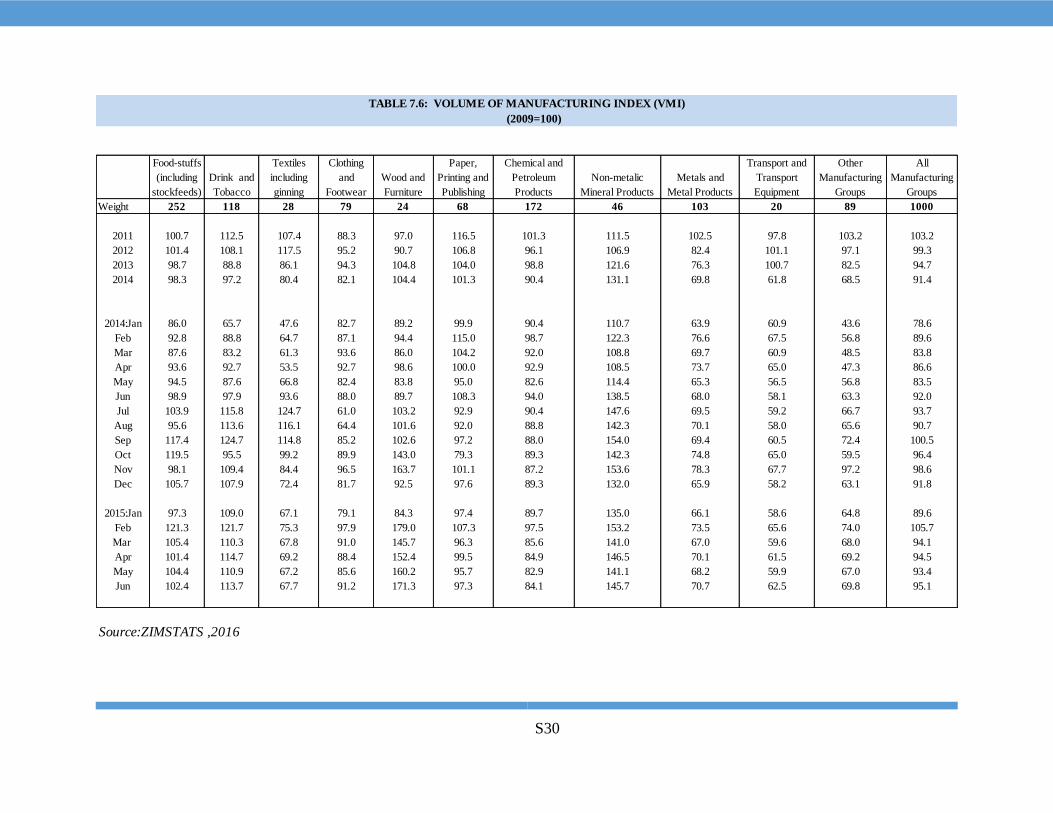
S30
(2009=100)
Food-stuffs
(including
stockfeeds)
Drink and
Tobacco
Textiles
including
ginning
Clothing
and
Footwear
Wood and
Furniture
Paper,
Printing and
Publishing
Chemical and
Petroleum
Products
Non-metalic
Mineral Products
Metals and
Metal Products
Transport and
Transport
Equipment
Other
Manufacturing
Groups
All
Manufacturing
Groups
Weight 252 118 28 79 24 68 172 46 103 20 89 1000
2011 100.7 112.5 107.4 88.3 97.0 116.5 101.3 111.5 102.5 97.8 103.2 103.2
2012 101.4 108.1 117.5 95.2 90.7 106.8 96.1 106.9 82.4 101.1 97.1 99.3
2013 98.7 88.8 86.1 94.3 104.8 104.0 98.8 121.6 76.3 100.7 82.5 94.7
2014 98.3 97.2 80.4 82.1 104.4 101.3 90.4 131.1 69.8 61.8 68.5 91.4
2014:Jan 86.0 65.7 47.6 82.7 89.2 99.9 90.4 110.7 63.9 60.9 43.6 78.6
Feb 92.8 88.8 64.7 87.1 94.4 115.0 98.7 122.3 76.6 67.5 56.8 89.6
Mar 87.6 83.2 61.3 93.6 86.0 104.2 92.0 108.8 69.7 60.9 48.5 83.8
Apr 93.6 92.7 53.5 92.7 98.6 100.0 92.9 108.5 73.7 65.0 47.3 86.6
May 94.5 87.6 66.8 82.4 83.8 95.0 82.6 114.4 65.3 56.5 56.8 83.5
Jun 98.9 97.9 93.6 88.0 89.7 108.3 94.0 138.5 68.0 58.1 63.3 92.0
Jul 103.9 115.8 124.7 61.0 103.2 92.9 90.4 147.6 69.5 59.2 66.7 93.7
Aug 95.6 113.6 116.1 64.4 101.6 92.0 88.8 142.3 70.1 58.0 65.6 90.7
Sep 117.4 124.7 114.8 85.2 102.6 97.2 88.0 154.0 69.4 60.5 72.4 100.5
Oct 119.5 95.5 99.2 89.9 143.0 79.3 89.3 142.3 74.8 65.0 59.5 96.4
Nov 98.1 109.4 84.4 96.5 163.7 101.1 87.2 153.6 78.3 67.7 97.2 98.6
Dec 105.7 107.9 72.4 81.7 92.5 97.6 89.3 132.0 65.9 58.2 63.1 91.8
2015:Jan 97.3 109.0 67.1 79.1 84.3 97.4 89.7 135.0 66.1 58.6 64.8 89.6
Feb 121.3 121.7 75.3 97.9 179.0 107.3 97.5 153.2 73.5 65.6 74.0 105.7
Mar 105.4 110.3 67.8 91.0 145.7 96.3 85.6 141.0 67.0 59.6 68.0 94.1
Apr 101.4 114.7 69.2 88.4 152.4 99.5 84.9 146.5 70.1 61.5 69.2 94.5
May 104.4 110.9 67.2 85.6 160.2 95.7 82.9 141.1 68.2 59.9 67.0 93.4
Jun 102.4 113.7 67.7 91.2 171.3 97.3 84.1 145.7 70.7 62.5 69.8 95.1
Source:ZIMSTATS ,2016
TABLE 7.6: VOLUME OF MANUFACTURING INDEX (VMI)
S31