euracoal market report 2/2014 · · 2018-02-14euracoal market report 2/2014 december 2014 ......
TRANSCRIPT

1
EURACOAL Market Report 2/2014
December 2014
WORLD COAL MARKET DEVELOPMENTS - WORLD COAL PRODUCTION AND SEABORNETRADE
Developments in which a worldwide surplus in the supply of coal runs into demandwhich is not growing fast enough continued in 2014. Prices remained under pressure in2014 as a result. From October 2013 to July 2014 alone, prices for steam coal fell fromUS$89/tonne to US$72/tonne, about 20%. The same is true of coking coal prices. Bothcoking coal and coke prices declined also in 2014 because of the general slump indemand accompanied by a simultaneous expansion in supply. While prices betweenUS$135 and US$140/tonne were still being paid for coking coal at the end of 2013, thislevel had continuously decreased. This development continues to hold sway in 2014;as of the middle of 2014, spot prices for HCC quality had fallen to US$116/tonne.
EURACOAL has therefore determined stagnation or only a slight rise in the demand forelectric power as well as a tendency toward decline in iron and steel production inthe Pacific region. In our estimation, this is why seaborne trade during the first fourmonths of 2014 rose by no more than about 3 % in comparison with the comparableperiod of the previous year. Worldwide, however, production and demand for the firstsix month in 2014 will most likely remain at the same level as last year.
The situation is similar in Europe. Europe has a substantial surplus in coal supplies;renewable energies are reducing the full-load operating hours of hard coal-firedpower plants in other countries as well as in Germany.
In Italy, power generation from wind farms rose rapidly from 9 TWh in 2010 to more than14 TWh in 2013. Power generation from photovoltaics rose from 1.9 TWh in 2010 to morethan 11 times this amount (22 TWh) in 2013. In Spain, water, wind and photovoltaicscomprise 55 % of the total power generating capacity. The mild winter did not giveany cause for increased demand for hard coal, either. However, the clean darkspread favouring coal-fired power generation was reduced because of declining gasprices and slightly rising CO2 prices. We expect the tendency for consumption of hardcoal in all of Europe in 2014 to be downward, which will mean a correspondingly lowerlevel of imports, if the weather conditions favouring renewable energies continue.

2
EUROPEAN COAL MARKET
2014 (1-6) 2013 (1-6)Mt Mt
Domestic hard coal production 53.4 57
Hard coal imports 96.3 100.7
Lignite production 197.9 198.2
Total 347.6 355.9
HARD COAL
Producing country 2014 (1-6) 2013 (1-6)Mt Mt
Bulgaria 1.1 1.0Czech Republic 4.8 4.1Germany 4.2 4.3Poland 35.2 37.7Romania 0.8 1.1Spain 1.8 1.4United Kingdom 5.5 7.4Total 53.4 57
In Germany, the biggest current issue is the increasing feed-in of wind and otherrenewable power into the grid. Germany has 34 GW of installed wind capacity and35 GW of installed photovoltaic capacity connected to the grid. In 2013, the maximuminput of wind into the grid was 26 GW (76%) and the minimum input was 100 MW (0.3%).On average, 5 GW or more was supplied for only 3 400 hours, whilst for 5 300 hours (i.e.for over 200 days) less than 5 GW was supplied to the grid. Even if wind power capacitywere to be doubled over the coming years, the low availability of wind would notchange. In fact, wind power only works if there is a load-balancing system ofconventional power plants in place, which in Germany is mainly based on coal andlignite. This gives a chance for coal and lignite for the future. Similar calculations canbe done for solar energy. So the only solution to guarantee supply security is tomaintain the two systems in parallel, supported by national and regional energypolicies.
The German hard coal industry still operates three deep mines, with the next mineclosure foreseen for 2016 when Auguste Victoria closes. In 2013, production totalled7.7 Mt of saleable coal of which 6.4 Mt went to power plants and 0.9 Mt to the ironand steel industry. Production is planned to reach 7.4 Mt in 2014, but could be slightlyhigher. Sales in the first five months of 2014 were difficult as less hard coal was usedand the BAFA price was extremely low. At the end of 2014, the German hard coalindustry should employ around 10 000 people. The closure of Auguste Victoria couldentail problems as many employees unexpectedly announced their wish to continuein employment after the mine closes which would not be in accord with thenegotiated plan. Unlike the lignite sector, the hard coal mining sector does not faceattack from green NGOs since deep mining will end in Germany.

3
In Poland, hard coal production for the first quarter of 2014 reached 17.9 Mt against18.7 Mt for the same period in 2013. In 2013, 77.5 Mt of hard coal was sold (72.0 Mt in2012) of which 66.9 Mt went to the home market. Stocks reduced from 8.4 Mt at theend of 2012 to 6.6 Mt at the end of 2013. At the same time, Poland imported 10.8 Mtof coal, making the country again a net importer. Imports came mainly from Russia,with some smaller quantities from the Czech Republic, Ukraine, Kazakhstan, Australiaand the US.
The Polish coal industry is facing serious problems: due to low world market prices,indigenous coal struggles against stiff competition. Indigenous producers also facedifficult mining conditions. Power utilities stopped buying coal and used their ownstockpiles whilst negotiating lower prices for 2014. Kompania Węglowa is seeking to sellnearly 5 Mt of coal from its stockpiles to boost liquidity. It also raised cash by selling itsKnurów-Szczygłowice mine to JSW SA for 1.49 billion zloty. Another 310 million zlotycame from the state-owned power utility Tauron Polska Energia SA, which bought KW’sstake in the joint mining venture Tauron Wydobycie.
In the United Kingdom, coal production decreased by around 4.5 Mt in 2013, afterhaving been stable for 7-8 years at between 16.5 and 18 Mt, due to the closure of DawMill colliery, the liquidation of Scottish Coal and the closure of Maltby colliery.
For general energy policy, 2014 will be a critical year: the remaining 8 GW of coal-firedplants which opted out of the LCPD will close; Drax (4 GW) will continue to convert itssix units to wood pellet biomass and Ratcliffe (owned by E.ON) has committed to investin SCR to comply with the IED. None of the remaining coal plants are committing toany level of IED compliance and most have opted to be governed by the TransitionalNational Plan which has been rejected by the European Commission. The UKgovernment’s intent was to allow generators flexibility to allow all factors, including thenew capacity mechanism, to be evaluated before investing.
The Chancellor of the Exchequer (i.e. finance minister) announced in 2011/12 that theUK would adopt a “gas strategy” to bridge to a low-carbon future. A further switch togas would cut emissions and enable the UK to meet its “legally binding targets” in the2008 Climate Change Act. However, the UK’s North Sea gas reserves are declining,gas prices are much higher than anticipated and the cost of generating electricityfrom gas is 2x to 3x higher than that from coal. The government therefore believes thatnew, much needed supplies will come from shale gas exploitation.
Another concern for the coal industry is the Carbon Price Floor, a tax aimed atproducing a carbon price of £70/tCO2 (88 €/tCO2) by 2030. The UK’s capacitymechanism, contracts for difference for nuclear and their strike prices, and ratificationof the emission performance standards in the Electricity Market Reform package haveto be finalised and tested for compliance with competition and State-aid rules inBrussels. A general election in May 2015 may change the picture, with the oppositionpromising a freeze on energy prices until 2017.
CoalPro embarked on an intensive lobbying campaign to bring the cost of the CarbonPrice Support tax to the attention of the public and MPs, commissioning a report fromNERA Economic Consulting. As a result, the Chancellor of the Exchequer announced

4
in his March 2014 Budget that he was capping the value of the Carbon Price Supportat £18.08/tCO2 until 2020. The conclusions of the NERA report are quite dramatic:severe damage to the UK economy and growth with a loss of industrialcompetitiveness. The response of utilities was not unexpected: no coal-fired powerplants will be built in the UK and, although gas plants can be built, gas is so expensivethat no new gas plants will be built either; and nuclear plants are too capital intensive.Many energy-intensive users are campaigning for relief from the Carbon Price Supporttax and also from renewables levies, preferring the EU ETS as a market-basedmechanism with everybody on the same level playing field.
To conclude, no large-capacity power stations are currently under construction in theUK and coal producers cannot convince financiers that there is a long-term marketfor coal. The only possibility is investment in CCS. There is currently one active coal CCSproject in the UK (White Rose) which has won NER300 funding of up to €300 million andthe UK government remains willing to put £1 billion into CCS projects.
In Spain, hard coal production in 2013 was 7.8 Mt with a share of coal in powergeneration of 15% which is far below the target. The economic situation and politicalproblems in Spain make coal mining very difficult. Subsidies for 2013 were still not paidand some mines had to temporarily stop extraction due to cash shortages. Subsidiesfor 2014 have similarly not been paid which makes the future of coal mining in Spainvery uncertain.
In the Czech Republic, hard coal production in 2013 dropped by one quarter, butincreased again in the first three months of 2014 by 26%.
Concerning the new energy strategy, a further delay is expected and CEZ haswithdrawn from the permitting procedure to construct two new nuclear blocks atTemelín power plant since the future of nuclear energy is so uncertain.
In Romania, net coal consumption decreased in 2013 by a massive 27% comparedwith 2012. Of the integrated mines and coal-fired power plants, the Oltenia EnergyComplex is the biggest. The government intends to put 15% of the company on thestock market by the end of 2014. The Oltenia Energy Complex plans to build a new600 MW lignite-fired unit to replace an old 330 MW installation at Rovinari using Chinesefunding and technology (Huadian). The electricity will be exported to Turkey.
New gas reserves were discovered beneath the Black Sea, but it is unlikely that thesewill have any impact on the energy mix until 2017/18. Coal will remain the main primaryenergy resource – mainly lignite, since many hard coal mines will close by 2018.
In Ukraine, 34.4 Mt of coal was mined during the first five months of 2014 (25.1 Mt steamcoal and 9.3 Mt coking coal), 1.2% above 2013 production. Exports from Ukraine grew,especially to China and India, but domestic demand also grew after units 3 & 4restarted at Uglegorska thermal power station following a major fire in 2013. The coalindustry has to struggle with the military conflict and if military activities continue in theEastern region, then coal extraction could stop. The announced restructuring andprivatisation of the mining sector by the government has been put on hold.

5
In Sweden, energy policy was unchanged in 2013. A new nuclear power plant couldbe constructed, replacing old units. Nuclear and hydro have the biggest shares inelectricity production, whilst wind had a share of 7% in 2013. RES subsidies are rathersmall. Sweden is currently a net electricity exporter and this situation will not change infuture. There is one steam coal plant in Stockholm, but it is currently being replacedwhich will be the end of coal-fired electricity generation in Sweden. Vattenfall – wholeft the Swedish Coal institute – announced that the company would no longer buildcoal-fired power plants in Sweden. The Swedish steel industry imported 2.5 Mt of cokingcoal in 2013.
LIGNITE
Producing country 2014 (1-6) 2013 (1-6)Mt = t Mt = t
Bulgaria 13.6 10.7Czech Republic 19.0 20.0Germany 88.9 90.9Greece 26.1 26.1Hungary 4.6 4.6Poland 32.3 32.6Romania 10.6 10.5Slovak Republic 1.0 1.0Slovenia 1.8 1.8Total 197.9 198.2
In Germany, important developments in the lignite industry are taking place in theeastern part of the country, where Vattenfall negotiated new permits for the follow-onof its opencast activities at Nochten which will begin shortly, including the resettlementof some 1 700 citizens, and, in Brandenburg, resettlement near opencast mine Welzowwill also start in 2014, despite protests by Greenpeace and others. NGOs present a realproblem for the industry, even where local citizens are in favour of industrialdevelopment and the inevitable consequences such as resettlement.
In the Czech Republic, annual lignite output is expected to be maintained at a levelof 40 Mt for the years to come. The biggest concern of the Czech coal and ligniteindustry is a new proposal from the Ministry of Finance to raise royalties and taxes onthe coal industry by 10% which would cause enormous financial difficulties. A firstcalculation will be presented very soon.
In Greece, lignite is mainly used for power generation. Due to mild weather, electricityconsumption fell slightly in 2013 to 50.7 GWh compared with the peak in 2008 of 56.9GWh. The share of lignite in the interconnected electricity system is still considerable,but the government does not want to see this share increase, so no new lignite-firedpower plants will be built in the near future. Instead, the government has licensed theconstruction of five new gas-fired power plants. However, high gas prices mean that

6
gas-fired electricity generation has fallen considerably, so the future of these newinstallations is uncertain.
Currently, the share of lignite in net electricity production is about 46.5%, gas 24.3%and hydro 12.8%. PV covers more and more of the peak midday load. Electricity pricesare still fixed by the government and there is no free market. To summarise, one canobserve that renewables (including hydro) have pushed down generation from bothgas and lignite. Greek lignite is still competitive in SE Europe, although electricityproduction costs have increased because of “green” policies.
It has been difficult to increase retail electricity market tariffs due to the economiccrisis, but consumers were asked to pay 21 €/MWh (instead of 9 €/MWh) to coverrenewable subsidies, even though these were scaled back (-30% for PV). Unpaidelectricity bills total still attends €1.5 billion, but the deficit is expected to plateau at theend of 2014.
In 2013, Poland produced 65.7 Mt of lignite, showing a stable increase over a numberof years (from 61.6 Mt in 2007) and still having huge reserves in the central and westernparts of the country. The Bełchatów mine increased extraction in 2013 and anadjacent new power unit is fully operational. Extraction at Turów mine fell, as onepower unit had to be decommissioned for environmental and technical reasons. It isexpected that lignite extraction from existing mines will decrease, as the Adamów andKonin but also Turów and Bełchatów mines exhaust in the years to come. PGE isexamining new mine sites to maintain extraction levels. One possibility is the Gubinbasin, but the local government is against mining activities due to unfoundedenvironmental concerns. Another deposit, close to Bełchatów, has the full support oflocal authorities. Poland faces a similar situation as in Germany: if local people andgovernment support the opening of new opencast mines, then lignite could have abright future, if not then lignite mining will face a sad downturn as existing minesapproach depletion. Nevertheless, the Polish government is aware of the need tomaintain coal and lignite extraction in order to maintain security of energy supply.Moreover, Polish energy policy fully supports mining as a cornerstone that will allowcoal and lignite to remain the main fuels in the energy mix.
Electricity production in 2013 increased by 1.4%, mainly generated from hard coal andlignite (+4%). Big increases were reported from wind power, although more than 80%of total electricity generation still comes from coal and lignite. The bright futurepredicted for shale gas looks to be, after serious investigations, less and less likely andmore and more controversial.
In Bulgaria, the internal electric power market is built on the basis of bilateral contractswith a balancing market. At present there are two segments of the electric powermarket, operating in parallel at the same time – a market with prices regulated by theState Energy and Water Regulatory Commission, and a freely-negotiated-pricesmarket. The share of the latter will gradually increase on a step-by-step basis until fullliberalisation of the electric power market has been achieved.
Gross electric power generation in the country in the first half of 2014 amounted to22,830 GWh, which is an increase of 10.8% in generation over the same period of theprevious year. Commercial exports of electric power amounted to 5,822 GWh, or

7
25.5% of gross generation. Net internal electric power consumption in the country inthe first half of 2014 amounted to 20,777 GWh, which is an increase of 10.0% on thesame period of 2013.
In Hungary, coal remains an important fuel: lignite production in 2013 was 9.1 Mt andimports totalled 1.6 Mt. In Borsod County, coal was mined until 2002 when miningbecame uneconomic. Taking into account today’s high energy prices and the threatsto security of supply, indigenous coal extraction and use is again being discussed inHungary. An important new project is currently being discussed in Borsod County.
In 2013, the Paks Nuclear Power Plant supplied 50.7% of the country’s total output. Twonew nuclear units are planned at Paks, using Russian technology and partly financedby Russian loans. For social reasons, the Hungarian government decided to regulateresidential electricity prices, resulting in substantially lower prices over the last twoyears. The government’s long-term energy policy objective, as stated in its NationalEnergy Strategy, is to ensure secure supply and maximise the exploitation of domesticresources, including coal.
In Slovenia, the second power plant beside Šoštanj, Trbovlje power plant was shutdown on 15 September 2014. At the moment, it looks as if it will be sold to the RussianOlag Burakov. The 600 MW block of power plant Šoštanj 6 performed its firstsynchronisation with the electricity grid on 24 September. Further tests will follow beforefully including it into the national network next spring.
In Slovakia, it is expected that the Italian power company ENEL will sell its shares innational power plants to the Czech ČEZ Group. Further, the reconstruction of Block 1and 2 at Nováky power plant, both with a capacity of 110 MW is expected. Blocks 3and 4 shall be decommissioned in 2015. The biggest energy importer to Slovakia isHungary.

TABLE 1
World Market Price evolution (Coal, Coke, Freight, Crude Oil)MCIS Steam Coal Marker Price (7000kcal/kg)
Jan Feb March Apr May June July Aug Sept Oct Nov Deccif-NW EuropeSteam Coal 2013 102.38 100.67 105.11 93.14 97.58 90.07 85.26 89.37 88.98 96.66 99.94 97.07(US$ / tce) 2014 95.48 93.45 85.59 90.45 88.07 85.40 84.02 88.85 88.87 84.83
Steam Coal 2013 77.05 75.36 81.08 71.50 75.17 68.29 65.18 67.14 66.66 70.89 74.07 70.83(EUR / tce) 2014 70.16 68.41 61.92 65.49 64.13 62.83 62.06 66.73 68.88 66.94Source: VDKI, McCloskey: First quotation of the month, basis 6000 kcal/kg (converted to 7000 kcal/kg)
Freight Rates (USD /t)R Bay/Rotterdam 2013 7.48 6.90 6.36 6.24 6.65 7.89 8.77 9.69 14.16 13.29 10.24 14.93(Capesize) 2014 8.43 8.09 10.71 8.96 8.26 8.69 8.38 10.06 10.58 9.63
Newcastle/Rotterdam 2013 14.24 14.60 13.49 12.86 14.48 16.49 17.67 18.70 24.45 23.88 19.79 25.77(Capesize) 2014 15.64 15.01 19.69 16.62 16.18 16.38 15.86 17.60 18.23 17.44
Bolivar/Rotterdam 2013 9.95 9.68 8.88 8.50 8.55 9.51 10.76 10.29 15.81 15.02 12.50 16.47(Capesize) 2014 11.49 9.11 12.58 8.96 9.44 10.28 8.75 9.05 9.76 9.94Source: VDKI, Frachtcontor Junge & Co
Currency RatesUSD/EUR 2013 0.75 0.75 0.77 0.77 0.77 0.76 0.76 0.75 0.75 0.73 0.74 0.73
2014 0.73 0.73 0.72 0.72 0.73 0.74 0.74
USD/ZAR 2013 8.79 8.87 9.19 9.10 9.33 10.00 9.93 10.06 10.00 9.90 10.21 10.362014 10.86 10.96 10.74 10.54 10.41 10.66 10.66
AUD/USD 2013 1.05 1.03 1.03 1.04 1.00 0.94 0.92 0.90 0.93 0.95 0.93 0.902014 0.89 0.90 0.91 0.93 0.93 0.94 0.94
Crude Oil (USD/Barrel)Crude Oil 2013 109.28 112.75 106.44 101.05 100.65 101.03 104.45 107.52 108.73 106.69 104.97 107.67
2014 104.71 105.38 104.15 104.27 105.44 107.89 105.61Source: OPEC Basket Prices

TABLE 2
WORLD SEABORNE COAL TRADE - STEAM COALExporting Countries 2014 (1-6) 2013 (1-6) Diff. 2013/14
Mt Mt Mt
PACIFIC
Australia 94 88 6China 3 3 0Indonesia 170 161 9Vietnam 5 8 – 3SUB-TOTAL 272 260 12
ATLANTIC
Colombia 34 36 – 2Russia 60 57 3South Africa 35 34 1Venezuela 1 1 0USA 16 22 – 6Others 4 5 – 1
SUB-TOTAL 150 155 – 5
TOTAL 422 415 7incl. Anthracite and PCI-CoalSource: VDKI, preliminary figures
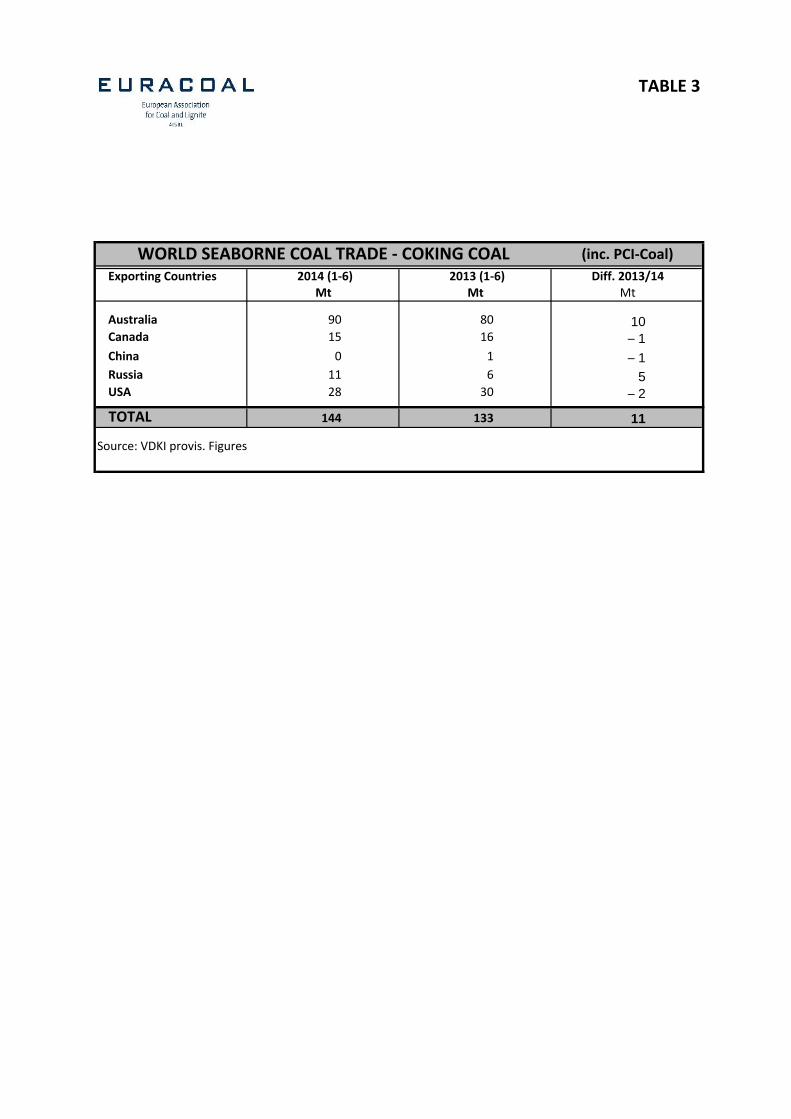
TABLE 3
WORLD SEABORNE COAL TRADE - COKING COAL (inc. PCI-Coal)Exporting Countries 2014 (1-6) 2013 (1-6) Diff. 2013/14
Mt Mt Mt
Australia 90 80 10Canada 15 16 – 1China 0 1 – 1Russia 11 6 5USA 28 30 – 2
TOTAL 144 133 11
Source: VDKI provis. Figures

TABLE 4
EU CRUDE STEEL PRODUCTION
COUNTRY2014 (1-6)
Mt2013 (1-6)
Mt
Austria 4.0 4.0Belgium 3.7 3.5Bulgaria 0.3 0.3Czech Republic 2.7 2.6Finland 2.0 1.7France 8.3 8.0Germany 22.5 21.7
Greece 0.5 0.5Hungary 0.5 0.4Italy 13.1 12.7Luxembourg 1.1 1.0Netherlands 3.5 3.1Poland 4.2 4.0Slovakia 2.3 2.3Slovenia 0.3 0.3Spain 7.5 7.5Sweden 2.4 2.3United Kingdom 6.2 5.7Others 2.4 2.7EU-27 87.5 84.3 29.0Source: IISI

TABLE 5
EU Hard coal and lignite production and consumption
COUNTRY 1-6 2014Mt
1-6 2013Mt
1-6 2014Mt
1-6 2013Mt
Bulgaria * 1.1 1.0 0.9 1.0Czech Republic 4.8 4.1 1.7 1.8Germany 4.2 4.3 3.0 3.1Poland 35.2 37.7 14.5 15.9Romania 0.8 1.1 0.1 1.2Spain 1.8 1.4 0.6 0.6United Kingdom 5.5 7.4 5.0 6.7EU-27 53.4 57 25.8 30.3Ukraine* brown and black coal** only hard coal producing countries
Lignite production
COUNTRY 1-6 2014Mt
1-6 2013Mt
1-6 2013Mt
1-6 2014Mt
Bulgaria 13.6 10.7 13.6 9.6Czech Republic 19.0 20.0 18.3 18.9Germany 88.9 90.9 79.4 81.8Greece 26.1 26.1 26.3 25.3Hungary 4.6 4.6 4.6 4.4Poland 32.3 32.6 32.6 32.3Romania 10.6 10.5 9.2 11.5Slovakia 1.0 1.0 1.0 1.0Slovenia 1.8 1.8 1.8 1.6EU-27 197.9 198.2 186.8 186.4
EU Hard coal production Consumption of indig. hard coalfor power generation
Lignite consumption forpower generation

TABLE 6
EU Hard coal imports
COUNTRY1-6 2014
Mt
1-6 2013
Mt
1-6 2014
Mt
1-6 2013
Mt
1-6 2014
Mt
1-6 2013
MtAustria 1.5 1.5
Belgium 1.1 1.1 0.4 0.6 1.5 1.7
Bulgaria 0 0 1.0 0.6 1.0 0.6
Czech Republic 0.7 0.6 0.6 0.4 1.3 1.0
Denmark 0.007 0.006 2.507 2.288 2.5 2.3
Finland 0.47 0.6 1.5 1.5 2.0 2.1
France 2.9 2.5 4.4 6.5 7.3 9.0
Germany 5.5 5.2 18.6 18.9 24.1 24.1
Greece 0.0364 0.3 0 0 0.0 0.3
Hungary 0.6 0.7 0 0 0.6 0.7
Ireland 0 0 0.149 0.46 0.1 0.5
Italy 1.7 2.6 8.0 9.5 9.7 12.1
Netherlands 1.8 1.7 4.3 4.5 6.1 6.2
Poland 1.4 1.1 3.7 3.5 5.1 4.6
Portugal 0.2 0 1.5 1.7 1.7 1.7
Romania 0.3 0.4 0.2 0.4 0.5 0.8
Slovakia 0.069 0.07 2.0 2.0 2.1 2.0
Slovenia 0 0 0.3 0.3 0.3 0.3
Spain 0.8 1.1 5.4 4.3 6.2 5.4
Sweden 0.7 0.8 0.6 0.4 1.3 1.2
United Kingdom 3.0 3.0 18.4 19.6 21.4 22.6
EU-27 96.3 100.7
EU Coking coal imports EU Steam coal imports EU Total coal imports