workforce equality and diversity data annual report year ... · 1 workforce equality and diversity...
TRANSCRIPT
1
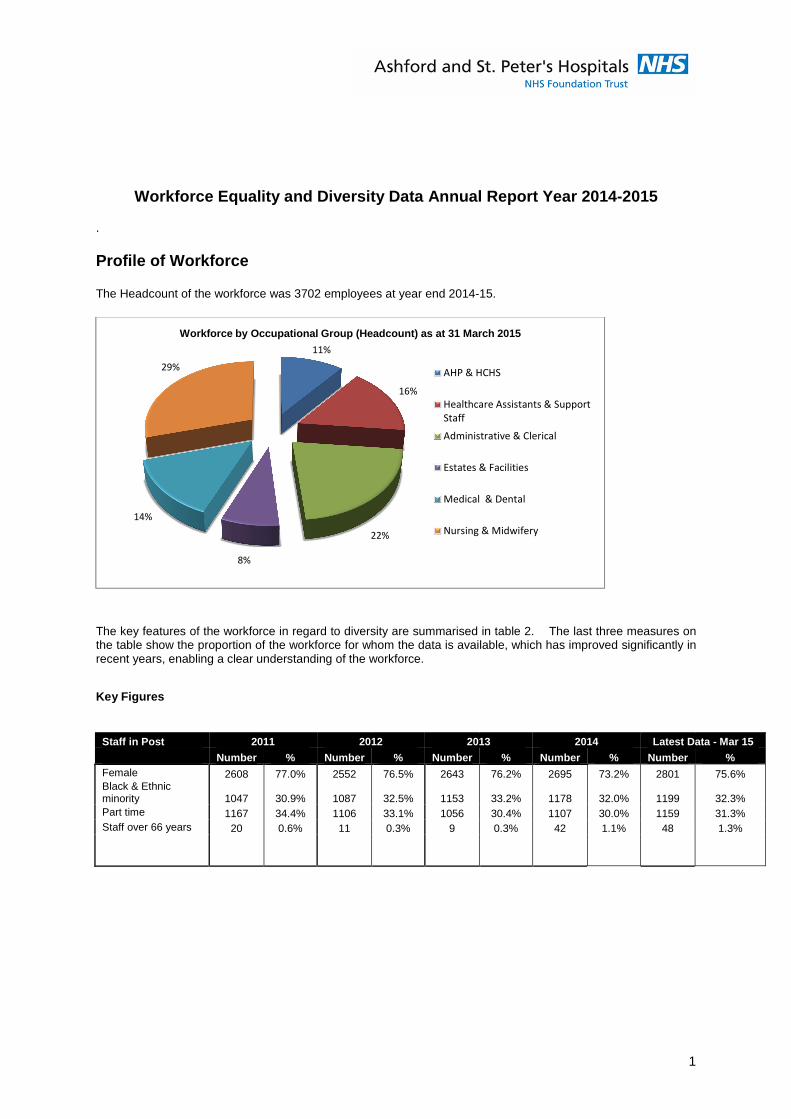
Workforce Equality and Diversity Data Annual Report Year 2014-2015 . Profile of Workforce The Headcount of the workforce was 3702 employees at year end 2014-15.
The key features of the workforce in regard to diversity are summarised in table 2. The last three measures on the table show the proportion of the workforce for whom the data is available, which has improved significantly in recent years, enabling a clear understanding of the workforce. Key Figures
Staff in Post 2011 2012 2013 2014 Latest Data - Mar 15
Number % Number % Number % Number % Number % Female 2608 77.0% 2552 76.5% 2643 76.2% 2695 73.2% 2801 75.6% Black & Ethnic minority 1047 30.9% 1087 32.5% 1153 33.2% 1178 32.0% 1199 32.3% Part time 1167 34.4% 1106 33.1% 1056 30.4% 1107 30.0% 1159 31.3% Staff over 66 years 20 0.6% 11 0.3% 9 0.3% 42 1.1% 48 1.3%
11%
16%
22%
8%
14%
29%
Workforce by Occupational Group (Headcount) as at 31 March 2015
AHP & HCHS
Healthcare Assistants & Support
Staff
Administrative & Clerical
Estates & Facilities
Medical & Dental
Nursing & Midwifery

2
A. Ethnicity
Ethnic Grouping Headcount Numbers Ethnic Group
as % of Workforce Total Full
Time Part Time
Asian Bangladeshi 15 15 0 0.4% Asian Indian 384 309 75 10.4% Asian Pakistani 46 32 14 1.2% Asian Other 318 274 44 8.6% Black African 113 85 28 3.1% Black Caribbean 28 23 5 0.8% Black Other 15 11 4 0.4% Mixed White Asian 16 10 6 0.4% Mixed White African 13 11 2 0.4% Mixed White Caribbean 12 7 5 0.3% Mixed Other 22 16 6 0.6% Chinese 29 23 6 0.8% Any other ethnic group 190 151 39 5.1% Not Declared 0 0 0 0.0% White Other 400 305 95 10.8% White Irish 47 30 17 1.3% White British 2054 1241 813 55.5% Total 3702 2543 1159 100.0% % BME 32.6% 38.0% 20.2%
% White 67.4% 62.0% 78.8% All white categories
The BME and White groupings of staff by pay band are shown below as percentages for each pay band.
0.0%
20.0%
40.0%
60.0%
80.0%
100.0%
85.5%
40.6% 37.5%22.0%
56.5%
37.8%27.8%
15.5%
60.9%
14.5%
59.4% 62.5%78.0%
43.5%
62.2%72.2%
84.5%
39.1%
Ethnic Grouping of Workforce by Payband as at 31 March 15
% White of all
staff
% BME of all
Staff

3
B. Sexual Orientation The Trust collects data on the sexual orientation of the workforce, subject to an individual’s wish to provide the information. The categories for reporting reflect the current national collection criteria. On-going data validation work has reduced the ‘undefined’ category from 11.2% by December 2011 to 0.1% by March 2015. Sexual Orientation Headcount % of
Workforce
Bisexual 33 0.9% Gay 20 0.5% Heterosexual 2658 71.8% Lesbian 7 0.2% Not Disclosed 981 26.5% Undefined 3 0.1% Total 3702 100%
0
100
200
300
400
500
600
700
800
1 2 3 4 5 6 7 Snr
Managers
(inc
board)
Medical
Sexual Orientation by Pay Band as at 31 March 2015Undefined
Lesbian
Not Disclosed
Heterosexual
Gay
Bisexual
0
200
400
600
800
1000
1200
Workforce Occupational Groups by Sexual Orientation as at 31 March 2015
Undefined
Lesbian
Not disclosed
Heterosexual
Gay
Bisexual

4
C. Disability Data collected from the workforce indicates that 1.9% of the workforce (70 individuals) consider themselves to have a disability. On-going data validation work has reduced the number of ‘undefined’ i.e. unknown records from 11.5% at December 2011 to 0.1% at March 2015.
Disabled Headcount Numbers Disabled
as % of Workforce Total Full Time Part Time
Yes 70 48 22 1.9%
No 3149 2207 942 85.1%
Not declared 482 287 195 13.0%
Undefined 1 1 0 0.0%
Total 3702 2543 1159 100%
Disability by Pay Band Yes No Not
Declared Undefined Total Band 1 2 140 21 163 Band 2 17 505 74 596 Band 3 10 305 48 363 Band 4 2 225 38 265 Band 5 17 686 92 795 Band 6 10 384 72 466 Band 7 4 277 54 335
Senior Manages (incl. Board) 3 171 13 187 Medical 5 456 70 1 532 Total 70 3149 482 1 3702
0
200
400
600
800
1000
1200
Additional
Clinical
Services
Administrative
and Clerical
AHP &HCHS Estates &
Ancillary
Medical &
Dental
Nursing &
Midwifery
Disability Status of Workforce Occupational Groups as at 31 March 2015
Undefined
Not
Declared
No
Yes
5
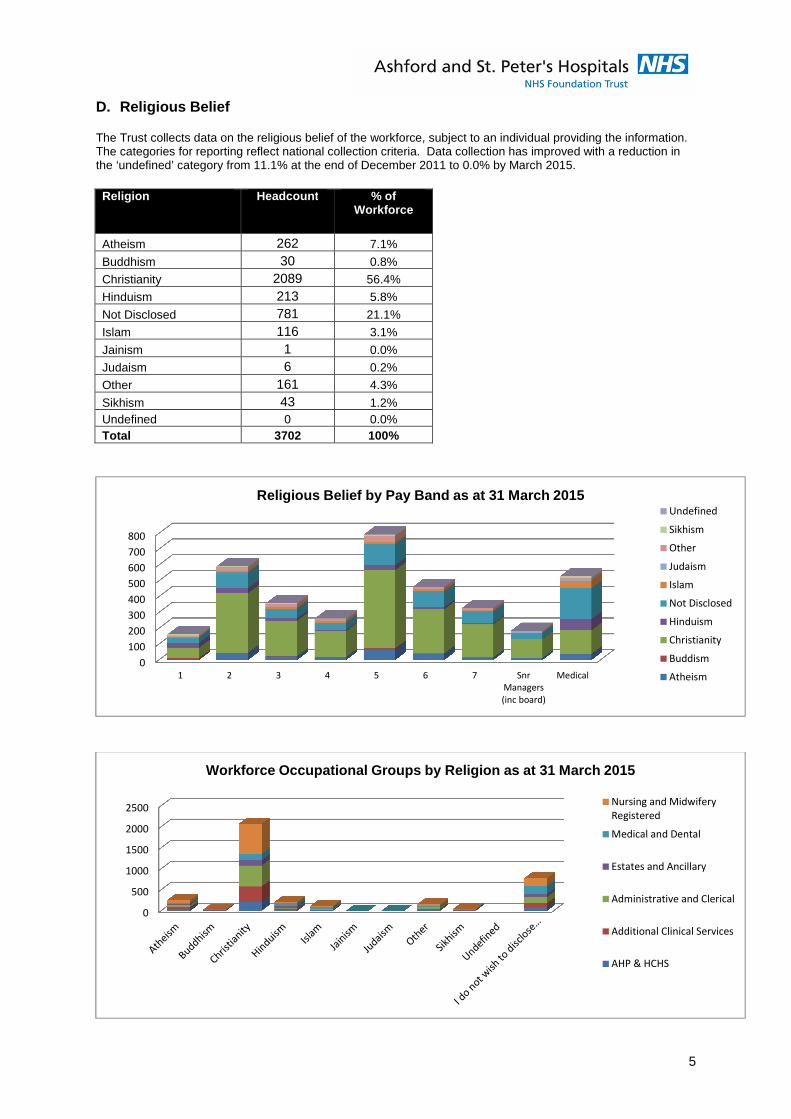
D. Religious Belief The Trust collects data on the religious belief of the workforce, subject to an individual providing the information. The categories for reporting reflect national collection criteria. Data collection has improved with a reduction in the ‘undefined’ category from 11.1% at the end of December 2011 to 0.0% by March 2015. Religion Headcount % of
Workforce
Atheism 262 7.1%
Buddhism 30 0.8%
Christianity 2089 56.4%
Hinduism 213 5.8%
Not Disclosed 781 21.1%
Islam 116 3.1%
Jainism 1 0.0%
Judaism 6 0.2%
Other 161 4.3%
Sikhism 43 1.2% Undefined 0 0.0% Total 3702 100%
0
100
200
300
400
500
600
700
800
1 2 3 4 5 6 7 Snr
Managers
(inc board)
Medical
Religious Belief by Pay Band as at 31 March 2015Undefined
Sikhism
Other
Judaism
Islam
Not Disclosed
Hinduism
Christianity
Buddism
Atheism
0
500
1000
1500
2000
2500
Workforce Occupational Groups by Religion as at 31 March 2015
Nursing and Midwifery
Registered
Medical and Dental
Estates and Ancillary
Administrative and Clerical
Additional Clinical Services
AHP & HCHS

6
E. Gender
Gender
Headcount Numbers Gender as % of
Workforce
Gender %
working Full Time
Gender %
working Part Time
Total Full Time Part Time
Female 2801 1746 1055 75.7% 62.3% 37.7%
Male 901 797 104 24.3% 88.5% 11.5% Total 3702 2543 1159 100%
0
100
200
300
400
500
600
700
800
1 2 3 4 5 6 7 Snr
Manages
(incl Board)
Medical
Gender of Workforce by Payband as at 31 March 2015
Headcount
Females
Headcount
Males
0.0%
20.0%
40.0%
60.0%
80.0%
100.0%
Profile of Males in the Workforce by Pay Band as at 31 March 2015
% Males on
band working
PT
% Males on
band working
FT
0.0%
20.0%
40.0%
60.0%
80.0%
100.0%
Profile of Females in the Workforce by Pay Band as at 31 March 2015
% Female on
band working
PT
% Females on
band working
FT

7
F. Age Age Group Full
Time Part Time Total
16-20 15 2 17 21-25 301 34 335 26-30 442 68 510 31-35 271 151 422 36-40 304 147 451 41-45 345 134 479 46-50 284 189 473 51-55 297 183 480 56-60 186 133 319 61-65 85 83 168 66-70 11 33 44
Over 70 2 2 4 Total 2543 1159 3702
0
100
200
300
400
500
600
16-20 21-25 26-30 31-35 36-40 41-45 46-50 51-55 56-60 61-65 66-70 Over 70
Age Profile of Workforce by Full or Part time as at 31 March 2015
Part Time
Full Time
0
100
200
300
400
500
600
16-20 21-25 26-30 31-35 36-40 41-45 46-50 51-55 56-60 61-65 66-70 Over 70
Workforce Occupational Groups by Age Group as at 31 March 2015
Nursing and Midwifery
Registered
Medical and Dental
Estates and Ancillary
Administrative and
Clerical
Healthcare Assistants &
Support Staff
AHP & HCHS