wmo social and economic benefit studies non-economic social science methods assessing the uptake of...
TRANSCRIPT

WMO
Social and Economic Benefit Studies
Non-Economic Social Science MethodsAssessing the Uptake of Services
Gerald FlemingChair, OPAG/PWS
Mahé, Seychelles, 5th May 2015
WMO - Public Weather Services, WDS

Social Sciences Social science is a major branch of science, and
a major category of academic disciplines, concerned with society and the relationships among individuals within a society.
Social science dates from the Age of Enlightenment, and attempts to use scientific methods to examine social behaviour and characteristics.
WMO Public Weather Services 2

Social Sciences Some of the Social Sciences:
Sociology Human Geography Economics Political Science Psychology Demography Anthropology etc etc...
WMO Public Weather Services 3

Social Sciences Some of the Social Sciences:
Sociology Human Geography Economics Political Science Psychology Demography Anthropology etc etc...
WMO Public Weather Services 4

“Assessing the Uptake of Services” What does this mean?
It’s much easier to assess the uptake of Products
Trial new products Refine them Put them on sale Measure the uptake (sales)
WMO Public Weather Services 5

“Assessing the Uptake of Services” How do we measure Services?
NMHSs have historically been very good at producing forecasts and warnings.
Once they are issued – what happens to them?
Do we know HOW people use them?
Often we have no clue about this
WMO Public Weather Services 6

Weather Warnings
What ways can we assess these?
Measure accuracy of the warnings
Measure number of warnings issued
Measure whether warnings reached intended users
Measure whether or not the warning was understood
WMO Public Weather Services 7

Weather Warnings
What ways can we assess these?
Measure whether the consequences of the likely weather were understood
Measure the intended behaviour of the user before and after receiving the warning
Measure the warning outcomes
Measure the satisfaction of the users
WMO Public Weather Services 8

Weather Warnings
What ways can we assess these?
Measure accuracy of the warnings
Measure number of warnings issued
Measure whether warnings reached intended users
Measure whether or not the warning was understood
√
√
X
X
WMO Public Weather Services 9
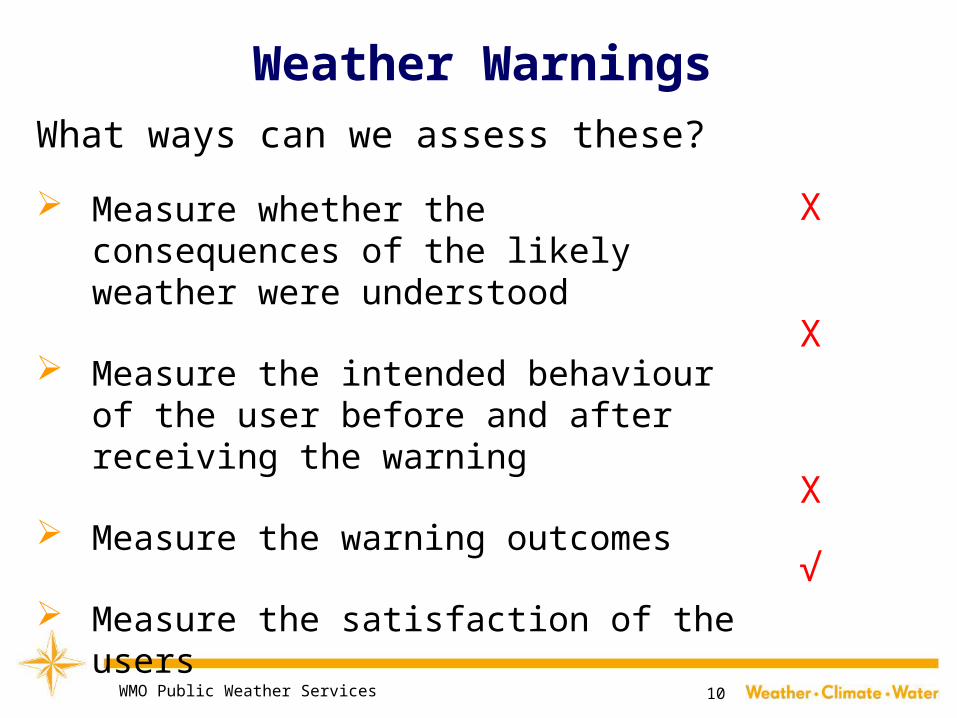
Weather Warnings
What ways can we assess these?
Measure whether the consequences of the likely weather were understood
Measure the intended behaviour of the user before and after receiving the warning
Measure the warning outcomes
Measure the satisfaction of the users
WMO Public Weather Services 10
X
X
X
√

Weather Forecasts and Warnings
We need to know more about the behaviour of those who receive the warnings
Especially – decision-making
o Was it rational?
o Was it logical?
o Was it intuitive?
WMO Public Weather Services 11

Weather Forecasts and Warnings
Decision-making by Users
What are the constraining factors?
Are there options?
Were these options weighed-up in an appropriate manner?
How did other peoples behaviour influence the decision-maker?
What were the uncertainties?
All-in-all, a complex area for study.
WMO Public Weather Services 12

Weather Forecasts and Warnings
How can we get to understand users – individually and collectively?
Surveys
Focus Groups
Seminars
Field Research
WMO Public Weather Services 13

Weather Forecasts and Warnings
Surveys
Can be random (e.g. telephone surveys) or self-selecting (e.g. users of websites)
Can be Closed (questions with a limited range of answers) or Open (invite free text / comment)
Were the questions properly designed (e.g. not asked in a leading manner)
Were the number of respondents statistically significant?
WMO Public Weather Services 14

Weather Forecasts and Warnings
Field Surveys
Can entail close collaboration with decision-makers, to observe their activities and processes at first hand (intrusive)
Can use other data sets
• Health statistics
• Traffic information
• Consumer behaviour
• Agricultural inputs and outputs
• Communication / Social Media data
WMO Public Weather Services 15

Weather Forecasts and Warnings
All surveys
Must be careful to recognise the differences between “Stated Preference” (what people say they will do) and “Revealed Preference” (what they actually do, as indicated by the evidence.
Understanding user needs is much more complex than just asking them!
A research area in itself.
WMO Public Weather Services 16

Weather Forecasts and Warnings
In this context...
Economics can be seen as the study of social behaviour as revealed by financial evidence
Social Sciences encompass a broader, more holistic view of social behaviour
WMO Public Weather Services 17

WMO Public Weather Services 18

Surveys of Users
Need to know the profile of the survey respondents
Male / Female
Age group
Occupation
Location
etc etc..
WMO Public Weather Services 19

Surveys of Users
A recent example from Met Éireann
Survey conducted of users of the website met.ie
Therefore not a random survey, but self-selecting
Website users could choose whether or not to take the survey
Each user asked only once (minimise the nuisance value)
Mix of Closed and Open questions
WMO Public Weather Services 20
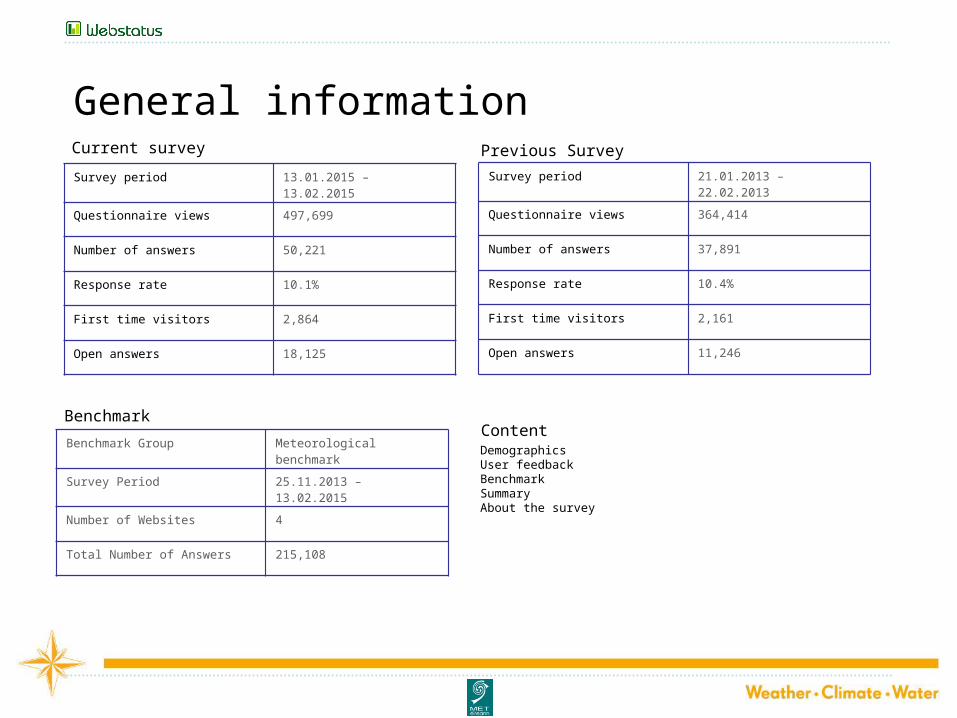
General informationCurrent survey Previous SurveySurvey period 13.01.2015 – 13.02.2015
Questionnaire views 497,699
Number of answers 50,221
Response rate 10.1%
First time visitors 2,864
Open answers 18,125
DemographicsUser feedbackBenchmarkSummaryAbout the survey
ContentBenchmarkBenchmark Group Meteorological benchmark
Survey Period 25.11.2013 – 13.02.2015
Number of Websites 4
Total Number of Answers 215,108
Survey period 21.01.2013 – 22.02.2013
Questionnaire views 364,414
Number of answers 37,891
Response rate 10.4%
First time visitors 2,161
Open answers 11,246

General informationSwedish Meteorological and Hydrological Institute Finnish Metrological InstituteSurvey period 03.03.2014 – 31.03.2014
Questionnaire views 1,180,762
Number of answers 53,199
Response rate 4.5%
First time visitors 2,024
Open answers 11,082
Danish Meteorological Institute
Survey period 25.11.2013 – 23.12.2013
Questionnaire views 2,074,919
Number of answers 100,814
Response rate 4.9%
First time visitors 2 ,076
Open answers 19,599
Survey period 14.12.2014 – 22.12.2014
Questionnaire views 794,330
Number of answers 23,204
Response rate 5.5%
First time visitors 433
Open answers 6,378

Gender - Website
Who Are Your Users?Gender – Device
Men59%
Women41%
Number of answers: 5,172
Number of answers: 38,857
Number of answers: 44,029
Number of answers: 37,863
Number of answers: 92,193
Number of answers: 48, 204
Number of answers: 33,138
Number of answers: 44,029
Met Éireann 2015 overall
Met Éireann 2015 desktop
Met Éireann 2015 tablet
0% 10% 20% 30% 40% 50% 60% 70% 80% 90%100%
41%
40%
51%
59%
60%
49%
Female Male
Note: Percentages are rounded to the closest whole number.
Met Éireann 2015
Met Éireann 2013
Swedish Meteorological and Hydrological Institute
Finnish Metrological Institute
Danish Meteorological Institute
Meteorological benchmark
0% 10% 20% 30% 40% 50% 60% 70% 80% 90% 100%
41%
33%
33%
36%
31%
35%
59%
67%
67%
64%
69%
65%
Female Male

Met Éireann 2015 overall
Met Éireann 2015 desktop
Met Éireann 2015 tablet
0% 10% 20% 30% 40% 50% 60% 70% 80% 90% 100%
32%
33%
20%
2%
2%
2%
16%
16%
17%
11%
10%
12%
3%
3%
3%
7%
7%
5%
6%
6%
10%
24%
23%
32%
Office worker Labourer CEO/senior manager/manager Self-employed Unemployed Trainee/student Retired
Website
OccupationDevice
Met Éireann 2015
Met Éireann 2013
Swedish Meteorological and Hydrological Institute
Finnish Metrological Institute
Danish Meteorological Institute
Meteorological benchmark
0% 10% 20% 30% 40% 50% 60% 70% 80% 90% 100%
31%
27%
42%
28%
27%
32%
2%
2%
15%
18%
15%
12%
16%
18%
5%
15%
8%
11%
11%
12%
9%
7%
10%
9%
3%
4%
2%
4%
2%
3%
7%
8%
4%
7%
4%
5%
6%
6%
18%
13%
27%
16%
24%
24%
5%
7%
7%
11%
Office worker Labourer CEO/senior manager/manager Self-employed
Unemployed Trainee/student Retired Other
Number of answers: 6,509
Number of answers: 41,515
Number of answers: 48,024
Number of answers : 41,977
Number of answers: 97,815
Number of answers: 52,111
Number of answers: 34,963
Number of answers: 48,024
Note: Percentages are rounded to the closest whole number.

Age - Device
0-9 years 10-19 years 20-29 years 30-39 years 40-49 years 50-59 years 60-69 years 70-79 years 80-89 years over 90 years
0%
5%
10%
15%
20%
25%
30%
35%
Met Éireann 2015 overall
Met Éireann 2015 desktop
Met Éireann 2015 tablet
Number of answers: 48,152
Number of answers: 41,613
Number of answers: 6,539
Note: Percentages are rounded to the closest whole number.

Frequency
Met Éireann 2015
Met Éireann 2013
Swedish Meteorological and Hydrological Institute
Finnish Metrological Institute
Danish Meteorological Institute
Meteorological benchmark
0% 10% 20% 30% 40% 50% 60% 70% 80% 90% 100%
6%
5%
4%
2%
1%
3%
46%
46%
44%
65%
65%
55%
35%
38%
39%
27%
29%
33%
8%
7%
9%
4%
4%
6%
5%
5%
4%
2%
1%
3%
This is my first visit Every day Every week Every month Less often
Met Éireann 2015 overall
Met Éireann 2015 desktop
Met Éireann 2015 tablet
0% 10% 20% 30% 40% 50% 60% 70% 80% 90% 100%
6%
6%
8%
45%
45%
46%
36%
36%
34%
8%
8%
6%
6%
6%
5%
This is my first visit Every day Every week Every month
Website
Device
Number of answers: 6,728
Number of answers: 42,584
Number of answers: 48,005
Number of answers: 42,147
Number of answers: 98,599
Number of answers: 51,787
Number of answers: 36,852
Number of answers: 48,005
Note: Percentages are rounded to the closest whole number.

Device Type
Number of answers: 49,312
Met Éireann 2015
Desktop Tablet0%
10%20%30%40%50%60%70%80%90%
100%86%
14%
Note: Percentages are rounded to the closest whole number.

9%
50%
36%
5%
Very exciting Exciting Boring
Exciting/Boring
«
«more interactive features
More detail for the areas of interest. Maybe live stats for particular areas around the country.
Add 5 to 15 day location forecast for specific locations. And product more images with animations
more interactive and county specific illustrations
More interactive, the radar option is very good.
Some Video ?
Take a look at how other Weather Sites do it. No need to re-invent the wheel. But you are so so so boring :)
Pictures are always interesting to look at. More pictures would break up the text better. Pictures of today's weather?
Desktop
TabletLook at other providers, I like rainfall radar and thing that are more integrated with users
Perhaps more interactive regarding maps at regional level.
Strategic webcams would be interesting and more info about why a aprticular forecast has been made.
Your website could have better graphics and more interesting content. I have always found met.ie quite boring however it does supply what's important and that's the weather.
More local information. I especially like yr.no and the detailed local info that it gives. More graphical info as opposed to text might also be good
Would like more responsive elements in it
Some video forecast
Number of answers: 43,620
9%
51%
36%
5%Desktop
Number of answers: 38,631
9%
49%
38%
4%Tablet
Number of answers: 4,989
Note: Percentages are rounded to the closest whole number.

21%
49%
25%
4%
Very attractive Attractive Ugly Very ugly
Attractive/Ugly
«
«Make it slightly more visually appealing.
I really like the short range and 5 day forecasts. However, I think thye could be jazzed up a bit and be more prominent on the site. Also often the time on the scale does not reflect the time on the map - thye can be out of synch.
rainfall radar is brilliant but it could always be better more information or improved animation would be nice
the image of the website could be brightened up.A little bit more user friendly,
I humbly suggest that it should be more graphical. Include Animations for Forecasts as well as last few hours. (Similar to rain radar, but also projected into the future.) Include Wind Speed, Temperature and Rain fall in animations. Have a look at www.theyr.com to get ideas.
would be nice to have the animated forecast screen bigger, it's all a bit small
maybe a little more visual
Desktop
TabletI would Maybe change the Back ground Colours but other the That always very Professional
Make the map on the right hand side a littlebigger. I always zoom in.
More colour, bigger print
Please make the website a little more attractive and educative for the kids as well!!
surely you can design a better, more attractive website?
It could be significantly updated to look more attractive and make gathering information more intuitive
Larger text; more interaction; more colour
Better graphics of current and incoming weather.24hr,48hr72hr.
Number of answers: 43,818
21%
49%
25%
4%Desktop
Number of answers: 38,791
20%
49%
26%
4%Tablet
Number of answers: 5,027
Note: Percentages are rounded to the closest whole number.

46%
51%
2% 0%Strongly agree Agree Disagree
LanguageText is written in a language that is easy to understand
«
«Please use more paragraphs when describing the weather. Bick chunks of text are too difficult to read.
Leagan as GAEILGE le do thoil! Irish Language versions please.
Content in Irish language is incomplete, this should be addressed.
Its old and not user friendly, also its difficult to get just a simple weather forecast for your town or county. You should take a look at how BBC Weather do it. Much simpler and in layman terms. Use less of the isotopes language, keep it simple.
at times some charts and information do not correspond and scattered. Language is too vague.Tidy it up.
Easier language please
A link to explaining key meterological terms to people of modest understanding
Desktop
TabletPlease set the regional forecasts with a more laymans language with a more friendly site‘
Content and language over technical for common usage.
Avoid lengthy sentences. Short punchy key points are more effective. Language used is often more conversational than professional.
Speak in a language that the average citizen can understand, not just those with 3rd level education or a professional qualification. Also, with regard to compatibility with tablets, the site needs serious attention.
Short range forecast into charts or words easier yo understand. Precipitation in charts defined as rain, sleet or hail if possible.
Ambiguous language used to describe forecast
Make able to use the site in other languages , such as Russian , Polish , German.
Number of answers: 43,943
46%51%
2% 0%Desktop
42%
55%
3%Tablet
Number of answers: 38,873 Number of answers: 5,070
Note: Strongly disagree had a 0.34% response rate
Note: Percentages are rounded to the closest whole number.

52%44%
3%1%
Strongly agree Agree Disagree
TrustThe website gives an impression that the organization
behind it is professional and trustworthy
«
«Some of the comments never get updated and hence lose their message (Water Safety bulletin as example)
Gives me what I want and I trust it.
How about slicker images! I'm thinking along the lines of 3D. Having said that, I'd rather the content to remain as accurate and professional as it is.
Sometimes the graphics suggest weather different to the text. Maybe on the home page there should be three maps depicting morning, afternoon and evening and including temps and wind on the one map.
There should be proper editing of the written forecast on the home page. It is unusual not to find several typos/errors on any given day. This looks unprofessional and could easily be eliminated.
If it was possible to have a rainfall radar with a predictive sequence for 3/6 hrs ahead it would be super as I use this every day for work and fully depend on this
Desktop
TabletAs a teacher I use the website occasionally as a teaching tool perhaps some simplified links for children to help them read weather update sect more easily
Keep it professional/technical, don't simplify it in an effort to modernise/attract larger audiences. For the outlook forecast, breaking it out more clearly by day would make it easier to follow - eg Monday - showers... Monday night -...
Avoid lengthy sentences. Short punchy key points are more effective. Language used is often more conversational than professional.
It could look a bit more modern and professional but otherwise I feel its a very good website for updated weather warnings and of course regional weather warnings.
More information please and a more professional appearance. But I like its simplicity so don't lose that. Define the terms and phrases used in the forecasts. For example I don't know what winter showers are as opposed to showers. Anyone I ask guesses but don't know either. thanks and good luck.
Number of answers: 44,051
52%44%
3% 1%Desktop
Number of answers: 38,974
52%45%
3% 1%Tablet
Number of answers: 5,077
Note: Percentages are rounded to the closest whole number.

Design index - benchmark
45.0
65.0
Met Éireann 2015
Met Éireann 2013
Swedish Meteorological and Hydrological Institute
Finnish Metrological Institute
Danish Meteorological Institute
Meteorological benchmark
50.0
70.0
Met Éireann 2015 overall
Met Éireann 2015 desktop
Met Éireann 2015 tablet
Attractive/ugly
Exciting/boringWell-organised/messy
Overall assessment
Modern/outdated
Attractive/ugly
Exciting/boringWell-organised/messy
Overall assessment
Modern/outdated
Note: Percentages are rounded to the closest whole number.

Usability index - benchmark
50.0
70.0
90.0
Met Éireann 2015 overall
Met Éireann 2015 desktop
Met Éireann 2015 tablet
50.0
70.0
90.0
Met Éireann 2015
Met Éireann 2013
Swedish Meteorological and Hydrological Institute
Finnish Metrological Institute
Danish Meteorological Institute
Meteorological benchmark
Relevance
CommunicationSpeed
Trust
Navigation
Relevance
CommunicationSpeed
Trust
Navigation
Note: Percentages are rounded to the closest whole number.

Open Survey Answers
WMO Public Weather Services 34

Open Survey Answers
WMO Public Weather Services 35

WMO Service Delivery Strategy One of the key strategic thrusts of WMO
Helping NMHSs to better deliver their products and services to users
Incorporates an Implementation Plan Designed to be a practical guide to the steps
we must all take to improve our services Incorporates the “Service Delivery Progress
Model” A technique to help us find out how good (or
bad) we are at Service Delivery, and how to improve.
36WMO Public Weather Services

Service Delivery Progress Model
Defines five different stages of development for NMHSs (each over a number of elements) Undeveloped Development Initiated Development in Progress Developed Advanced
WMO Public Weather Services 37

Service Delivery Progress Model
Defines six elements of development Evaluate user needs and decisions Link service development and delivery to user
needs Evaluate and monitor service performance and
outcomes Sustain improved service delivery Develop skills needed to sustain service
delivery Share best practices and knowledge
WMO Public Weather Services 38

Service Delivery Progress Model
WMO Public Weather Services 39

Service Delivery Progress Model
WMO Public Weather Services 40

Service Delivery Progress Model
WMO Public Weather Services 41

WMO Public Weather Services 42
Undeveloped Development Initiated
Development in Progress
Developed Advanced
Evaluate user needs, decisions √
Link SD and delivery to user needs
√
Evaluate and monitor service performance and outcomes
√
Sustain improved SD √
Develop skills needed to sustain SD
√
Share best practices and knowledge
√

Social Sciences and Met Services Its all about the users! Improving our knowledge and understanding of
those who use forecast and warnings services Helping users to get more from our forecast and
warnings services Trying to understand decision-making, in all its
complexity Try to get to some measure of the ultimate
outcomes for society of the services provided by NMHSs
WMO Public Weather Services 43

WMO Public Weather Services 44