within occupation wage dispersion and task inequality
TRANSCRIPT
Within occupation wage inequality and task dispersion
Within occupation wage inequality and taskdispersion
Lucas van der Velde
GRAPEGroup for Research in APplied Economics
June 2016Warsaw International Economic Meeting
Within occupation wage inequality and task dispersion
Table of contents
1 Motivation
2 Task content of occupations
3 Data description
4 Results
5 Conclusions
Within occupation wage inequality and task dispersion
Motivation
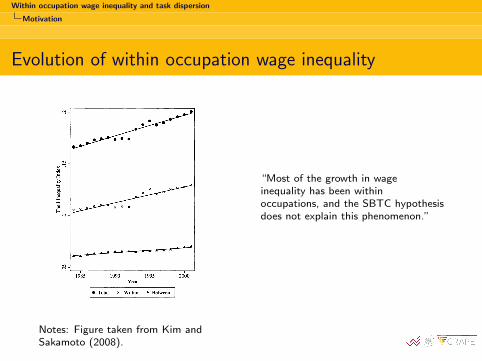
Evolution of within occupation wage inequality
Notes: Figure taken from Kim andSakamoto (2008).
“Most of the growth in wageinequality has been withinoccupations, and the SBTC hypothesisdoes not explain this phenomenon.”
Within occupation wage inequality and task dispersion
Motivation
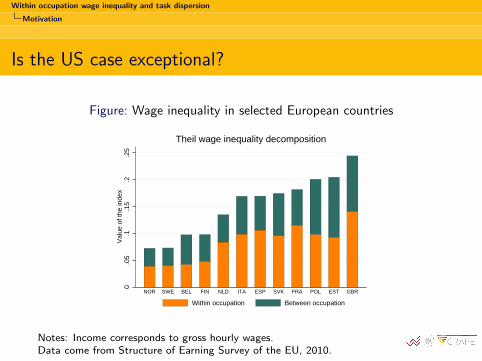
Is the US case exceptional?
Figure: Wage inequality in selected European countries0
.05
.1.1
5.2
.25
Val
ue o
f the
inde
x
NOR SWE BEL FIN NLD ITA ESP SVK FRA POL EST GBR
Theil wage inequality decomposition
Within occupation Between occupation
Notes: Income corresponds to gross hourly wages.Data come from Structure of Earning Survey of the EU, 2010.
Within occupation wage inequality and task dispersion
Motivation
Introduction
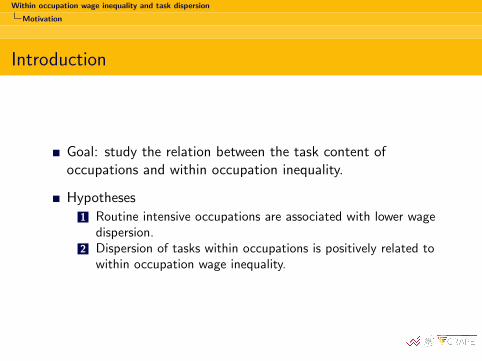
Goal: study the relation between the task content ofoccupations and within occupation inequality.
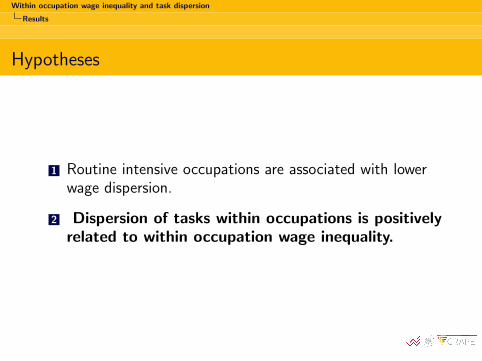
Hypotheses
1 Routine intensive occupations are associated with lower wagedispersion.
2 Dispersion of tasks within occupations is positively related towithin occupation wage inequality.
Within occupation wage inequality and task dispersion
Task content of occupations
Theory
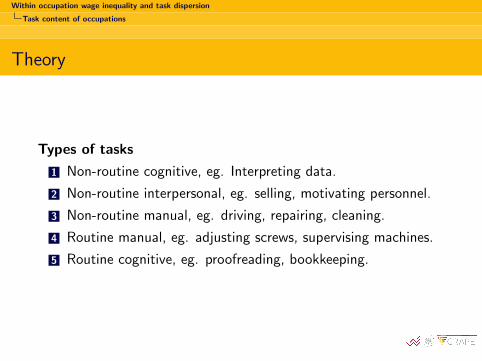
Types of tasks
1 Non-routine cognitive, eg. Interpreting data.
2 Non-routine interpersonal, eg. selling, motivating personnel.
3 Non-routine manual, eg. driving, repairing, cleaning.
4 Routine manual, eg. adjusting screws, supervising machines.
5 Routine cognitive, eg. proofreading, bookkeeping.
Within occupation wage inequality and task dispersion
Task content of occupations
Theory II
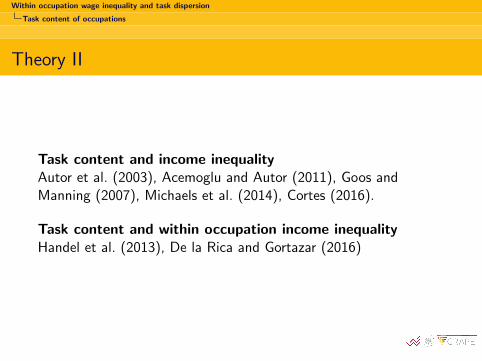
Task content and income inequalityAutor et al. (2003), Acemoglu and Autor (2011), Goos andManning (2007), Michaels et al. (2014), Cortes (2016).
Task content and within occupation income inequalityHandel et al. (2013), De la Rica and Gortazar (2016)
Within occupation wage inequality and task dispersion
Task content of occupations
Hypotheses
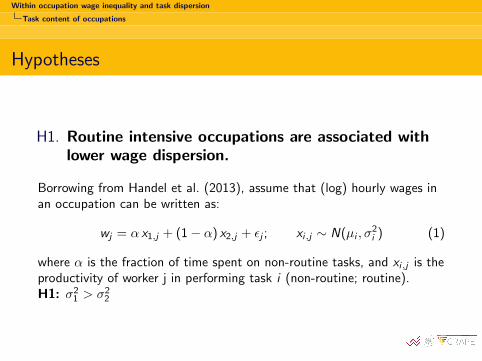
H1. Routine intensive occupations are associated withlower wage dispersion.
Borrowing from Handel et al. (2013), assume that (log) hourly wages inan occupation can be written as:
wj = α x1,j + (1 − α) x2,j + εj ; xi,j ∼ N(µi , σ2i ) (1)
where α is the fraction of time spent on non-routine tasks, and xi,j is theproductivity of worker j in performing task i (non-routine; routine).H1: σ2
1 > σ22
Within occupation wage inequality and task dispersion
Task content of occupations
Hypotheses
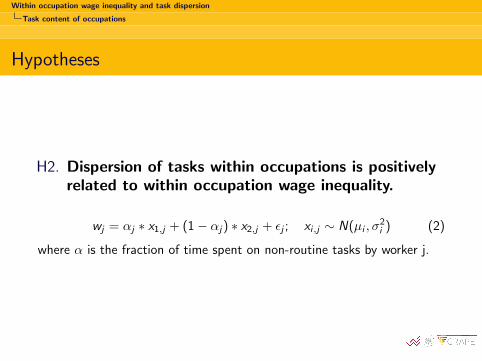
H2. Dispersion of tasks within occupations is positivelyrelated to within occupation wage inequality.
wj = αj ∗ x1,j + (1 − αj) ∗ x2,j + εj ; xi,j ∼ N(µi , σ2i ) (2)
where α is the fraction of time spent on non-routine tasks by worker j.
Within occupation wage inequality and task dispersion
Data description
Operationalizing the variables
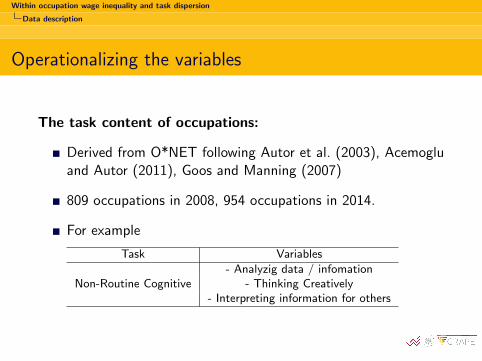
The task content of occupations:
Derived from O*NET following Autor et al. (2003), Acemogluand Autor (2011), Goos and Manning (2007)
809 occupations in 2008, 954 occupations in 2014.
For example
Task Variables
- Analyzig data / infomationNon-Routine Cognitive - Thinking Creatively
- Interpreting information for others
Within occupation wage inequality and task dispersion
Data description
Measures of wage inequality
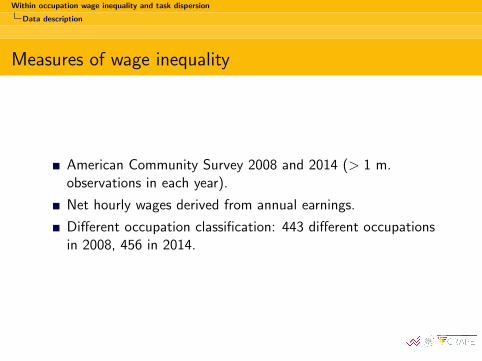
American Community Survey 2008 and 2014 (> 1 m.observations in each year).
Net hourly wages derived from annual earnings.
Different occupation classification: 443 different occupationsin 2008, 456 in 2014.
Within occupation wage inequality and task dispersion
Data description
Within occupation inequality
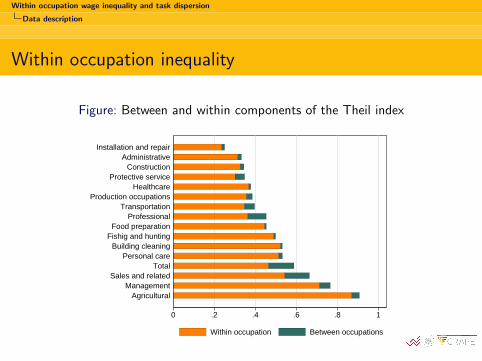
Figure: Between and within components of the Theil index
0 .2 .4 .6 .8 1
AgriculturalManagement
Sales and relatedTotal
Personal careBuilding cleaning
Fishig and huntingFood preparation
ProfessionalTransportation
Production occupationsHealthcare
Protective serviceConstruction
AdministrativeInstallation and repair
Within occupation Between occupations
Notes Theil index calculated for hourly wages in broadly defined occupational groups.
Groups are defined as 3 digit occupation codes (census).
Within occupation wage inequality and task dispersion
Data description
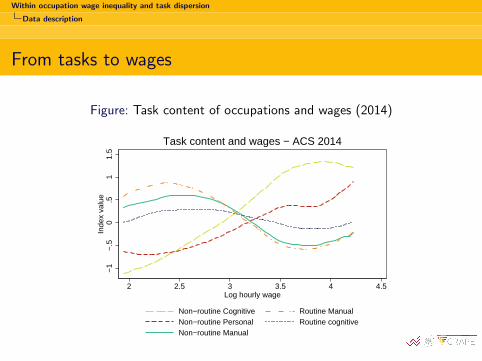
From tasks to wages
Figure: Task content of occupations and wages (2014)−
1−
.50
.51
1.5
Inde
x va
lue
2 2.5 3 3.5 4 4.5Log hourly wage
Non−routine CognitiveNon−routine PersonalNon−routine Manual
Routine ManualRoutine cognitive
Task content and wages − ACS 2014
Within occupation wage inequality and task dispersion
Results
Hypotheses
1 Routine intensive occupations are associated withlower wage dispersion.
2 Dispersion of tasks within occupations is positively relatedto within occupation wage inequality.
Within occupation wage inequality and task dispersion
Results
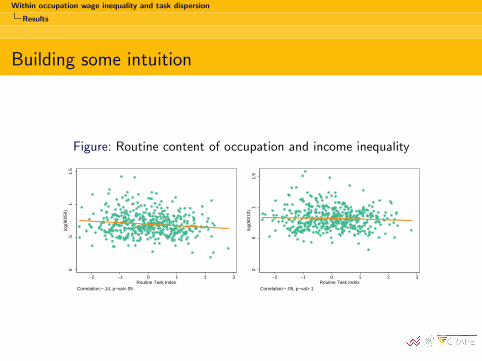
Building some intuition
Figure: Routine content of occupation and income inequality
0.5
11.
5lo
g(90
/50)
−2 −1 0 1 2 3Routine Task Index
Correlation:−.14, p−val<.05
0.5
11.
5lo
g(50
/10)
−2 −1 0 1 2 3Routine Task Index
Correlation:−.05, p−val>.1
Within occupation wage inequality and task dispersion
Results
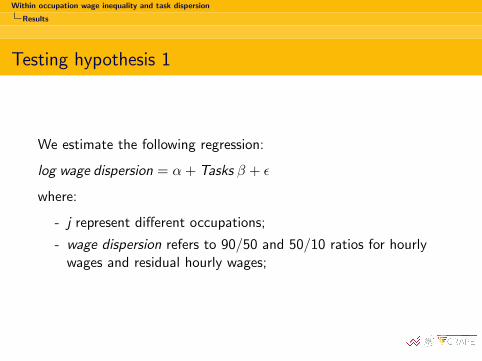
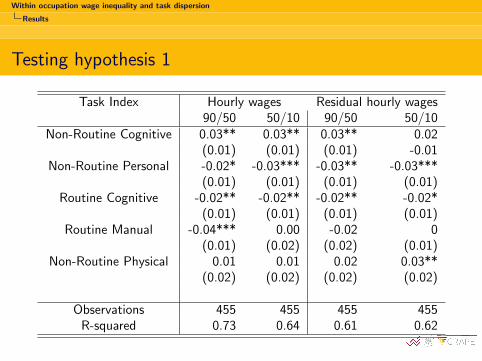
Testing hypothesis 1
We estimate the following regression:
log wage dispersion = α + Tasks β + ε
where:
- j represent different occupations;
- wage dispersion refers to 90/50 and 50/10 ratios for hourlywages and residual hourly wages;
Within occupation wage inequality and task dispersion
Results
Testing hypothesis 1
Task Index Hourly wages Residual hourly wages90/50 50/10 90/50 50/10
Non-Routine Cognitive 0.03** 0.03** 0.03** 0.02(0.01) (0.01) (0.01) -0.01
Non-Routine Personal -0.02* -0.03*** -0.03** -0.03***(0.01) (0.01) (0.01) (0.01)
Routine Cognitive -0.02** -0.02** -0.02** -0.02*(0.01) (0.01) (0.01) (0.01)
Routine Manual -0.04*** 0.00 -0.02 0(0.01) (0.02) (0.02) (0.01)
Non-Routine Physical 0.01 0.01 0.02 0.03**(0.02) (0.02) (0.02) (0.02)
Observations 455 455 455 455R-squared 0.73 0.64 0.61 0.62
Within occupation wage inequality and task dispersion
Results
Hypotheses
1 Routine intensive occupations are associated with lowerwage dispersion.
2 Dispersion of tasks within occupations is positivelyrelated to within occupation wage inequality.
Within occupation wage inequality and task dispersion
Results
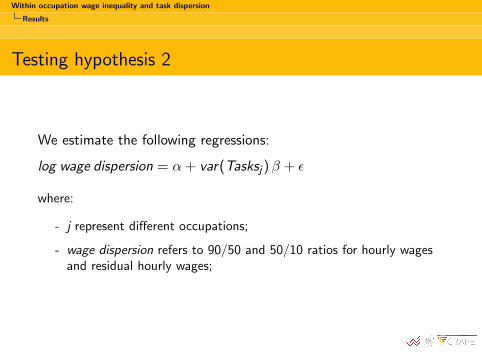
Testing hypothesis 2
We estimate the following regressions:
log wage dispersion = α + var(Tasksj)β + ε
where:
- j represent different occupations;
- wage dispersion refers to 90/50 and 50/10 ratios for hourly wagesand residual hourly wages;
Within occupation wage inequality and task dispersion
Results
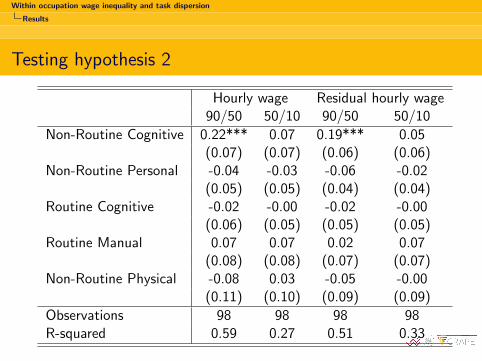
Testing hypothesis 2
Hourly wage Residual hourly wage90/50 50/10 90/50 50/10
Non-Routine Cognitive 0.22*** 0.07 0.19*** 0.05(0.07) (0.07) (0.06) (0.06)
Non-Routine Personal -0.04 -0.03 -0.06 -0.02(0.05) (0.05) (0.04) (0.04)
Routine Cognitive -0.02 -0.00 -0.02 -0.00(0.06) (0.05) (0.05) (0.05)
Routine Manual 0.07 0.07 0.02 0.07(0.08) (0.08) (0.07) (0.07)
Non-Routine Physical -0.08 0.03 -0.05 -0.00(0.11) (0.10) (0.09) (0.09)
Observations 98 98 98 98R-squared 0.59 0.27 0.51 0.33
Within occupation wage inequality and task dispersion
Conclusions
What can we say
We employ tools from the task content literature to analyzewage inequality within occupations.
Evidence supports hypothesis 1: occupations with moreroutine content present lower wage inequality.
Evidence in favor of hypothesis 2 is less conclusive. Onlydispersion in non-routine seems to matter.
Within occupation wage inequality and task dispersion
Conclusions
What needs to be done
Formalize the intuitions.
Extend the analysis to countries in the EU.
Analyze dynamics of income inequality, eg. changes in thedispersion vs. changes in task content.

Within occupation wage inequality and task dispersion
Conclusions
Goodbye frame
Thank you for your attention
Within occupation wage inequality and task dispersion
Conclusions
Acemoglu, D. and Autor, D.: 2011, Skills, tasks and technologies: Implicationsfor employment and earnings, Handbook of labor economics 4, 1043–1171.
Autor, D., Levy, F. and Murnane, R. J.: 2003, The skill content of recenttechnological change: An empirical exploration., Quarterly Journal ofEconomics 118(4).
Cortes, G. M.: 2016, Where have the middle-wage workers gone? a study ofpolarization using panel data, Journal of Labor Economics 34(1), 63–105.
De la Rica, S. and Gortazar, L.: 2016, Differences in job de-routinization inOECD countries: Evidence from PIAAC, IZA Discussion Paper 9736.
Goos, M. and Manning, A.: 2007, Lousy and lovely jobs: The rising polarizationof work in britain, The review of economics and statistics 89(1), 118–133.
Handel, M. J. et al.: 2013, Putting tasks to the test: Human capital, job tasks,and wages, Journal of labor Economics 31(2 Part 2), S59–S96.
Kim, C. and Sakamoto, A.: 2008, The rise of intra-occupational wageinequality in the united states, 1983 to 2002, American Sociological Review73(1), 129–157.
Michaels, G., Natraj, A. and Van Reenen, J.: 2014, Has ict polarized skilldemand? evidence from eleven countries over twenty-five years, Review ofEconomics and Statistics 96(1), 60–77.