income inequality: wage dispersion in the …...income inequality: wage dispersion in the european...
TRANSCRIPT
DIRECTORATE GENERAL FOR INTERNAL POLICIES
POLICY DEPARTMENT A: ECONOMIC AND SCIENTIFIC POLICY
Income Inequality:
Wage Dispersion in
the European Union
STUDY
Abstract
This report, prepared by Policy Department A at the request of the Committee
on Employment and Social Affairs (EMPL), summarises the results of the project
“Wage Dispersion in the European Union”. It has three objectives: first, to
describe the recent evolution of wage dispersion across the EU Member States
using different definitions of labour earnings and inequality measures; second,
to analyse the relationship between wage dispersion and labour market
institutions related to collective bargaining and minimum wages taking into
account recent policy reforms; and, last, to evaluate the impact of changes in
wage inequality on overall income distribution in the European Union.
IP/A/EMPL/2013-05 November 2014
PE 536.294 EN

This document was requested by the European Parliament's Committee on Employment
and Social Affairs.
AUTHORS
Mr Christian Dreger
Mr. Enrique López-Bazo
Mr. Raul Ramos
Mr. Vicente Royuela
Mr Jordi Suriñach
RESPONSIBLE ADMINISTRATOR
Mr Dirk VERBEKEN
Policy Department A: Economic and Scientific Policy
European Parliament
B-1047 Brussels
E-mail: [email protected]
LINGUISTIC VERSIONS
Original: EN
ABOUT THE EDITOR
To contact the Policy Department or to subscribe to its newsletter please write to:
Manuscript completed in October 2014.
Brussels, © European Union, 2014.
This document is available on the Internet at:
http://www.europarl.europa.eu/studies
DISCLAIMER
The opinions expressed in this document are the sole responsibility of the author and do
not necessarily represent the official position of the European Parliament.
Reproduction and translation for non-commercial purposes are authorised, provided the
source is acknowledged and the publisher is given prior notice and sent a copy.

Income Inequality: Wage Dispersion in the European Union
PE 536.294 3
CONTENTS
LIST OF ABBREVIATIONS 4
LIST OF FIGURES 6
LIST OF TABLES 7
EXECUTIVE SUMMARY 8
1. INTRODUCTION 11
2. LITERATURE REVIEW 13
2.1. Introduction 13
2.2. Technological change and crowding out of routinized work 15
2.3. Globalization, openness to trade and outsourcing 16
2.4. Labour market institutions and minimum wages 17
3. RECENT EVOLUTION OF WAGE INEQUALITY IN THE EU 19
3.1. Introduction 19
3.2. Evidence using EU-SILC microdata 21
3.3. Additional results using SES microdata 32
4. LABOUR MARKET INSTITUTIONS 47
5. WAGE DISPERSION AND LABOUR MARKET INSTITUTIONS 56
6. ANALYSIS OF THE RELATIONSHIP BETWEEN WAGE INEQUALITY
AND INCOME INEQUALITY 69
REFERENCES 76
Policy Department A: Economic and Scientific Policy
PE 536.294 4
LIST OF ABBREVIATIONS
AT Austria
BE Belgium
BG Bulgaria
CY Cyprus
CZ Czech Republic
DE Germany
DK Denmark
EE Estonia
EL Greece
ES Spain
EU European Union
EU-SILC European Union Survey on Income and Living Conditions
FI Finland
FR France
GDP Gross Domestic Product
HR Croatia
HU Hungary
IE Ireland
IT Italy
LFS Labour Force Survey
LT Lithuania
LU Luxembourg

Income Inequality: Wage Dispersion in the European Union
PE 536.294 5
LV Latvia
MAPE Mean absolute percentual error
MT Malta
NL Netherlands
OECD Organisation for Economic Co-operation and Development
P9010 Decile ratio: Ratio between the ninth and the first Decile
P5010 Ratio between the fifth and the first decile
P9050 Ration between the ninth and the fifth decile
PL Poland
PPP Purchasing Power Parity
PT Portugal
RO Romania
SE Sweden
SES Structure of Earnings Survey
SI Slovenia
SK Slovakia
UK United Kingdom

Policy Department A: Economic and Scientific Policy
PE 536.294 6
LIST OF FIGURES
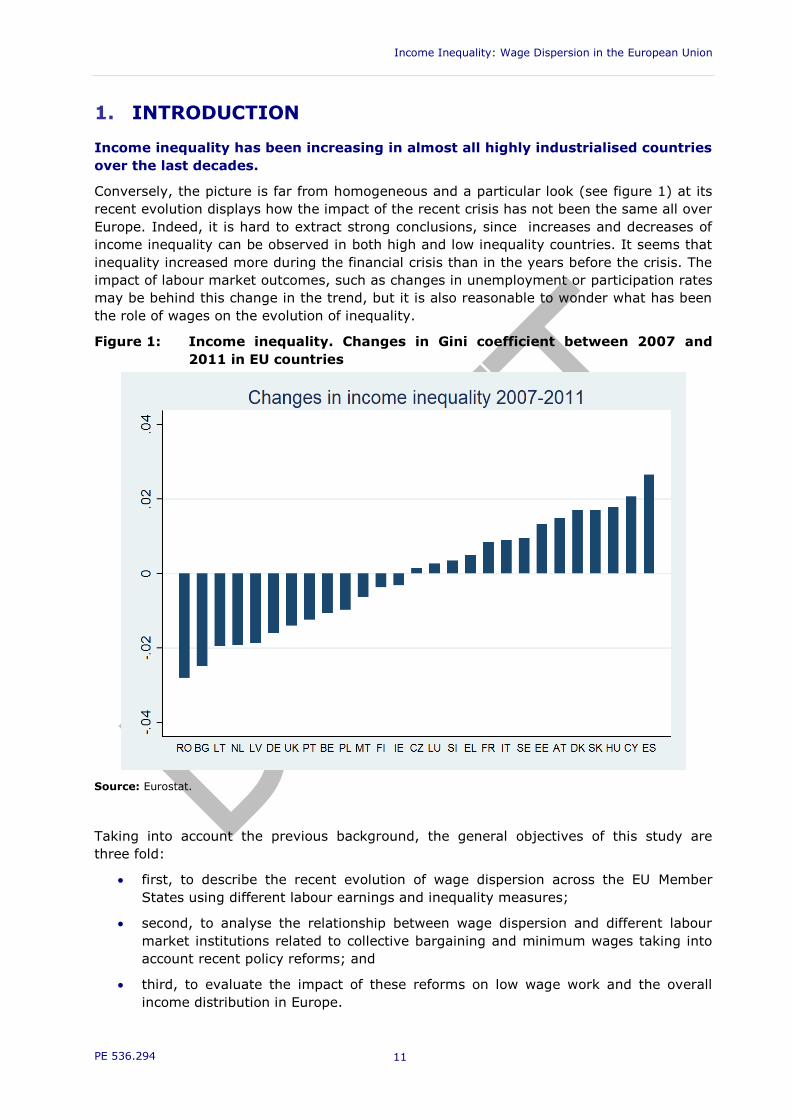
Figure 1: Income inequality. Changes in Gini coefficient between 2007 and 2011
in EU countries 11
Figure 2: Changes in inequality between 2006 and 2011 – Gross annual earnings 25
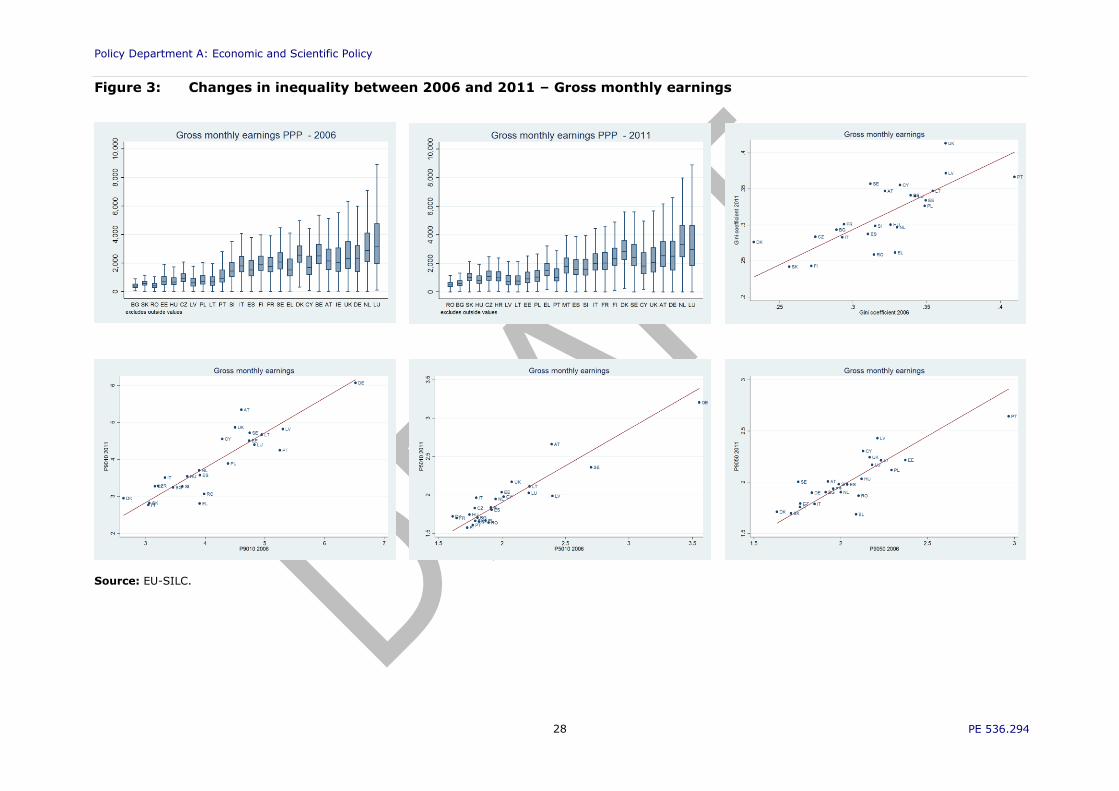
Figure 3: Changes in inequality between 2006 and 2011 – Gross monthly earnings 28
Figure 4: Changes in inequality between 2006 and 2011 – Gross hourly earnings 31
Figure 5: Changes in the Gini index for annual wages between 2006 and 2011 in EU
countries 32
Figure 6: Changes in the incidence of low wage work between 2006 and 2011 33
Figure 7: Changes in inequality between 2006 and 2010 – Gross annual earnings
(SES) 36
Figure 8: Changes in inequality between 2006 and 2010 – Gross monthly earnings
(SES) 36
Figure 9: Changes in inequality between 2006 and 2010 – Gross hourly earnings
(SES) 37
Figure 10: Inequality measures in 2010 - EU-SILC and SES 38
Figure 11: Gini index by type of collective agreement – Gross hourly earnings 2010
(SES) 40
Figure 12: Union density and bargaining coverage rates. Long term evolution in
selected EU countries 51
Figure 13: Union density and bargaining coverage rates. Recent evolution in EU
countries 52
Figure 14: Level of wage bargaining. Recent evolution in EU countries 52
Figure 15: Bargaining coordination and government intervention. Long term evolution
in selected EU countries 53
Figure 16: Bargaining coordination and government intervention. Recent evolution
in EU countries 54
Figure 17: Real minimum wages, PPP adjusted in euros of 2005. 54
Figure 18: Real minimum wages, relative to average and median wages. 55
Figure 19: Inequality and labour market institutions, 2004 59
Figure 20: Inequality and labour market institutions, 2010/2011 60
Figure 21: Inequality and labour market institutions. Changes over 2005-2011 61
Figure 22: Changes between 2006 and 2011 in Gini for annual income (vertical axis)
and Gini for annual wages (horizontal axis) 70
Figure 23: Correlation coefficient between changes in the Gini index for income
between 2006 and 2011 and changes in the contribution to inequality of
the different sources of income 71

Income Inequality: Wage Dispersion in the European Union
PE 536.294 7
LIST OF TABLES
Table 1: Gross annual earnings in 2006 23
Table 2: Gross annual earnings in 2011 24
Table 3: Gross monthly earnings in 2006 26
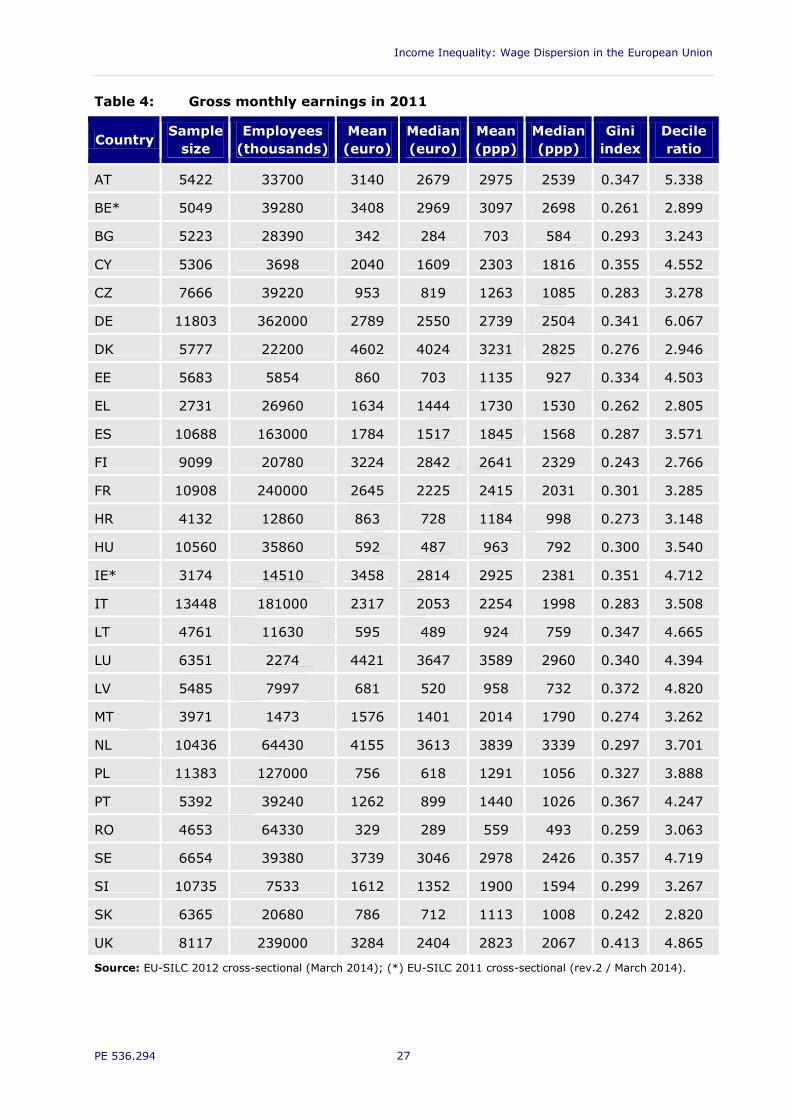
Table 4: Gross monthly earnings in 2011 27
Table 5: Gross hourly earnings in 2006 29
Table 6: Gross hourly earnings in 2011 30
Table 7: Gross monthly earnings in Spain 2010 39
Table 8: Gross monthly earnings in Spain 2010 39
Table 9: Gross hourly earnings in Spain 2010 39
Table 10: Inequality measures for factual and counterfactual annual wages 44
Table 11: Inequality measures for factual and counterfactual monthly wages 45
Table 12: Inequality measures for factual and counterfactual hourly wages 46
Table 13: Summary of basic model estimates. Annual wages 62
Table 14: Summary of basic model estimates. Monthly wages 62
Table 15: Summary of basic model estimates. Hourly wages 63
Table 16: Random effects models for p9010-annual wages 65
Table 17: Fixed effects models for p9010-annual wages 66
Table 18: Random effects models for p9010 - hourly wages 67
Table 19: Fixed effects models for p9010 - hourly wages 68
Table 20: Decomposition of disposable income Gini variation according to the
contribution of different income sources 72
Table 21: Variation in the Gini coefficient for income and wages and evolution of the
wage share between 2006 and 2011 74

Policy Department A: Economic and Scientific Policy
PE 536.294 8
EXECUTIVE SUMMARY
Fierce debates on inequality among academics and policy makers
The low growth performance over the recent decades in the European Union has increased
concerns regarding an increasing wage dispersion, income inequality at large, and social
exclusion. In fact, using different indicators there is clear evidence that income inequality
has risen markedly since the mid 1980 and the euro area debt crisis together with the fiscal
consolidation programs adopted in several EU countries could worsen the situation in the
short and medium run. Recent literature, including by Piketty (2013), has stimulated fierce
debate on inequality among academics and policy makers.
Literature on the topic has highlighted three potential explanatory factors to explain this
trend, but also the differences among countries in terms of the intensity of the process: 1)
technological change and crowding out of routinized work, 2) globalization, openness to
trade and outsourcing and, 3) labour market institutions and minimum wages.
Objectives of the study
In view of the current debate and the recent literature, the objectives of this study focus on
three key isues: first, to describe the recent evolution of wage dispersion across the EU
Member States using different definitions of labour earnings and inequality measures;
second, to analyse the relationship between wage dispersion and labour market institutions
related to collective bargaining and minimum wages taking into account recent policy
reforms; and, last, to evaluate the impact of changes in wage inequality on overall income
distribution in the European Union Member States.
Methodology
Regarding the recent evolution of wage inequality, we use microdata from EU-SILC and
SES and different definitions of wages (annual, monthly and hourly) to analyse changes
between 2003 and 2011 (the latest reference year currently available). In particular, we
have calculated the Gini coefficient, the decile ratio (P9010, the ratio between the ninth and
the first decile), the P5010 (the ratio between the fifth and the first decile), the P9050 (the
ratio between the ninth and the fifth decile) and, last, a measure of the incidence of low
wage work.
Key Findings:
Inequality increased in 2006-2011 in two thirds of EU Member States
Our analysis using EU-SILC microdata shows that between 2006 and 2011, inequality has
increased in around two thirds of the EU countries considered in our analysis, while in the
rest it has decreased. However, the variation is not substantial, particularly when wages
are measured as monthly or hourly earnings. In fact, inequality levels for annual earnings
are significantly higher than inequality measures for monthly and hourly wages, which,
however, are much more similar among them. This means that an important source of
variation of annual earnings inequality is the number of months worked during the last
years while the effect of worked hours is only relevant to a minor extent. An additional
finding is that in most countries inequality has increased in the bottom part of the
distribution and not only in the top part as predicted by the literature. In these countries,
the incidence of low wage work has also increased between 2006 and 2011.

Income Inequality: Wage Dispersion in the European Union
PE 536.294 9
Intermediate levels of collective bargaining spurs wage compression
The analysis of SES microdata has also provided additional interesting results. While
confirming the main stylised facts derived from EU-SILC, it has also permitted to analyse
the impact of collective bargaining systems on wage inequality and also to analyse the
impact of composition effects on inequality evolution. The first analysis shows that
intermediate levels of collective bargaining seem to produce a more compressed wage
structure, a result that is in line with the previous literature. To assess the impact of the
composition effects on the recent evolution of inequality in the EU countries, in our second
analysis of SES microdata, we apply one of the methods suggested in the literature that
consists in computing a counterfactual distribution of wages for the most recent year,
keeping the distribution of characteristics constant to that observed in the initial period.
The comparison of actual and counterfactual wage distribution for some selected EU
countries show that most of the variation in inequality is not explained by changes in the
distribution of characteristics, suggesting that it was caused by modifications in the wage
structure. However, as the impact is likely to vary across countries and even time periods,
it is important that the study of the effect of the labour market policies and institutions on
wage inequality controls for compositional changes.
Union density and bargaining coverage rates declined in most EU countries
The level of wage bargaining has remained mainly stable with predominant decentralised or
intermediate levels. In some countries like Ireland or the Netherlands, recent reforms have
implied a further decentralization of collective bargaining. Regarding coordination, there is
no clear pattern both in terms of the picture at the end of the period but also in terms of
recent reforms. However, real minimum wages have recently increased in most EU
countries, although the picture is far from homogeneous across countries and over time.
Crisis lowers real purchasing power of minimum wages
In general, the great recession has affected minimum wages by lowering its real purchasing
power, particularly in the most recent periods. In order to analyse the impact of these
changes in labour market institutions on wage dispersion, we have specified a panel data
econometric model in line with previous literature where different measures of inequality
are related to a set of control variables, measures of globalisation, technological change
and policy indicators, including labour market institutions.
Large impact of globalization and technological change
The basic results of estimating different versions of this model show a significant impact of
technological change and globalization, although the effect of the latter is not robust to
alternative specifications. As expected, wage inequality is clearly pro-cyclical with output
gap and it is related to the industry mix. Improving competition in regulated network
sectors has also a robust influence in reducing wage inequality. Regarding labour market
institutions, we find a significant impact of minimum wages on inequality, being stronger on
the lower part of the distribution. The wage bargaining level does not seem to have a
robust influence in inequality (a more centralized wage setting only increases inequality in
hourly wages) although this result could be related to the high persistence of collective
bargaining systems during the considered period. Union density and the bargaining
coverage rate reduce inequality but only when analysing hourly wages.
Besides wages capital income contributed most to rising income inequality
Last, and regarding the impact of changes in wage inequality on overall income, it is well
known that wages account for a very important part of income inequality. However, there

Policy Department A: Economic and Scientific Policy
PE 536.294 10
are other sources of household income such as transfers and capital income that can also
contribute to explain trends in overall inequality. With the aim of analysing the contribution
of different sources to overall income inequality, we have decomposed the variation in the
Gini index of household annual income from 2006 to 2011 using microdata from EU-SILC
into the relative contribution of changes in the inequality in each of the following
components: income from paid employment, income from self-employment, transfers,
other income (mainly capital) and taxes. The contribution of these components on income
inequality depend on two factors: individual components’ inequality trends and their shares
on total income. Altough the most important component of income inequality is wage
inequality, the obtained evidence shows that the income source that has contributed most
to the increase in overall income inequality is capital income, while taxes have contributed
to decrease it and transfers have been neutral. The contribution of wage inequality has
been less relevant than in previous studies due to the decreasing wage shares in most EU
countries, a factor that is clearly related to the fall in employment rates due to the
economic crisis.
Income Inequality: Wage Dispersion in the European Union
PE 536.294 11
1. INTRODUCTION
Income inequality has been increasing in almost all highly industrialised countries
over the last decades.
Conversely, the picture is far from homogeneous and a particular look (see figure 1) at its
recent evolution displays how the impact of the recent crisis has not been the same all over
Europe. Indeed, it is hard to extract strong conclusions, since increases and decreases of
income inequality can be observed in both high and low inequality countries. It seems that
inequality increased more during the financial crisis than in the years before the crisis. The
impact of labour market outcomes, such as changes in unemployment or participation rates
may be behind this change in the trend, but it is also reasonable to wonder what has been
the role of wages on the evolution of inequality.
Figure 1: Income inequality. Changes in Gini coefficient between 2007 and
2011 in EU countries
Source: Eurostat.
Taking into account the previous background, the general objectives of this study are
three fold:
first, to describe the recent evolution of wage dispersion across the EU Member
States using different labour earnings and inequality measures;
second, to analyse the relationship between wage dispersion and different labour
market institutions related to collective bargaining and minimum wages taking into
account recent policy reforms; and
third, to evaluate the impact of these reforms on low wage work and the overall
income distribution in Europe.
Policy Department A: Economic and Scientific Policy
PE 536.294 12
Structure of the report
The rest of the report is structured in five sections. After this introduction, Section 2
summarises previous research on the topic. We review the literature of the factors
influencing inequality. The starting point has been the 2012 OECD reports on the topic,
which have had a large impact both in academic and in policy terms. We have moved
beyond these studies and we present recent knowledge on three factors influencing
inequality: technological change, globalization and labour market institutions. Section 3
describes the recent evolution of wage inequality by considering the two main statistical
sources on individual earnings in Europe: SILC and SES. Section 4 is focused on the
analysis of the evolution of labour market institutions: unionisation, the level, coordination
and government intervention on wage bargaining and finally on minimum wages. Section 5
is devoted to the analysis of the relationship between wage inequality and labour market
institutions. Last, Section 6 considers the effect of changes in wage inequality on overall
income inequality. This document annexes a list of statistical information and detailed
econometric results that have been used to build the main sections of the report.

Income Inequality: Wage Dispersion in the European Union
PE 536.294 13
2. LITERATURE REVIEW
KEY FINDINGS
The low growth performance over the recent decades in the European Union has
increased concerns regarding an increasing wage dispersion and social exclusion.
In fact, using different indicators there is clear evidence that income inequality has
risen markedly since the mid 1980 and the Euro area debt crisis together with the
fiscal consolidation programs adopted in several EU countries could worsen the
situation in the short and medium run.
The literature has highlighted three potential explanatory factors to justify this
trend, but also the differences among countries in terms of the intensity of the
process had an impact: technological change and crowding out of routinized work;
globalization, openness to trade and outsourcing; and, labour market institutions
and minimum wages.
According to the first theory, if new technologies increase the productivity of high
skilled workers more than for low skilled labourers, wages of high skilled workers
will rise faster and, as a result, wage inequality will increase due to job
polarisation, particularly in the top part of the distribution.
The second theory argues that due to trade specialization and offshoring, labour
demand in developed countries has shifted towards more skilled workers
reinforcing the effect of technological change on inequality.
Last, literature is not conclusive on the impact of institutions. If they affect wage
inequality, their impact is much lower than the one associated to previous factors
and only affecting the bottom part of the wage distribution. For instance, while
minimum wages seems to be an appropriate instrument to combat the rising
inequality especially at the bottom part of the wage distribution, if it is set to a too
high value, it may actually reduce employment, which in turn dampens its
inequality-reducing effect. The role of unions in reducing wage inequality has been
found in several works, but its overall effect on inequality seems to depend on the
wage bargaining level. Employment protection legislation also affects the structure
of wage formation process, but cross-country research does not allow establishing
sound conclusions on its impact on inequality. In particular, increases in wage
inequality were much stronger in the United States and the United Kingdom than in
continental Europe, but at the same time, unemployment has also evolved in a
very different way with higher increases in Europe. It seems that institutional
rigidities placed a floor under the wages of unskilled workers in continental Europe
resulting in increased unemployment rather than greater wage inequality with an
ambiguous impact on overall income inequality.
2.1. Introduction
Wage developments affected by business cycles
The low growth performance over the recent decades in the European Union has increased
concerns regarding an increasing wage dispersion and social exclusion (Brandolini, Rosolia
and Torrini, 2010). The main sources to investigate the development of the dispersion of
labour earnings are the EU Statistics on Income and Living Conditions as well as the four-
yearly Structure of Earnings Survey both provided by Eurostat. According to the evidence,
inequality has risen markedly since the mid 1980. This can be documented by standard
Policy Department A: Economic and Scientific Policy
PE 536.294 14
measures like Gini coefficients or ratios of certain deciles in the income distribution. A
further descriptive measure is the share of low income work in the economy, i.e. income
less than two third of the median income of the respective country (Bezzina, 2012).
Although this share has been rather stable in the years before 2010, it may have increased
due to the adverse economic developments caused by the euro area debt crisis, as fiscal
consolidation programs launched in several countries are likely to have limited the
employment opportunities in the short and medium run1.
Large cross-country differences persist
Despite this common trend, there are differences in the timing and intensity of these
changes over individual countries, and differences in the evolution of inequality at the lower
and higher edge of the income distribution. For instance, large and sustained increases of
inequality in Germany are observed at the same time as a narrowing income distribution in
France. By using indicators to measure inequality, individual countries can be clustered into
groups with similar inequality patterns, see Hoeller, Journard, Pisu and Bloch (2012) for the
details. Some Nordic countries and Switzerland are characterised by low inequality due to
rather narrow wage dispersions, in particular at the upper end of the scale, combined with
a high employment rate. In several EU Member States (Belgium, Czech Republic, Estonia,
Finland, France, Italy, Slovak Republic, Slovenia), inequality in labour earnings goes hand
in hand with low employment rates. In some continental states (Austria, Germany, Greece,
Hungary, Luxembourg, Poland, Spain) inequality is higher, but due to different
developments. The wage dispersion is rather wide in Germany at lower quintiles of the
distribution. Employment rates are quite low in Greece, Hungary, Luxembourg, Poland and
Spain. The share of part-time employment is comparatively high in Austria and Germany.
The UK, Ireland and the Netherlands are characterised by a large share of part-time
workers that drives inequality in labour earnings. The GINI project conducted by the
University of Amsterdam and financed by the 7th EU framework program provides country
specific reports on the economic and educational drivers and the social, cultural and
political impacts of the increasing inequality.
Other potential determinants remain important
Although heterogeneities are substantial, differences within countries are far more
important than the inter-country dimension (Frederiksen, 2012). To reveal insights into the
main drivers of the development, many studies have explored potential determinants of
labour income inequality. Nonetheless, knowledge of the structure and determinants of
wages and salaries and the evolution of their distribution are still limited for Europe. While
this study is concentrated on the impact of institutions in the wage formation process on
the dispersion of wages, this chapter reviews the general determinants of wage inequality
that have been identified by the literature. According to the evidence, the most important
channels are skill biased technical change coupled with marked devaluations of routinized
work, the outsourcing of low skilled labour and routine tasks fastened by the process of
trade integration and globalization and labour market institutions, like participation of
workers in trade unions, collective bargaining coverage and bargaining coordination. See
Kierzenkowski and Koske (2012) for a recent survey. Other potential determinants include
tax and transfer systems and education, but they are beyond the scope of this study.
However, this does not imply that these variables are not relevant. In particular, increasing
participation rates in higher education can serve as a tool to reduce wage inequality, given
that the demand of firms is not binding and overeducation problems do not play a critical
1 It should be noted that low wage earners refer to all employees (excluding apprentices) working in enterprises
with 10 employees or more, i.e. small firms are excluded. The stability of the share is observed between two
subsequent waves of the Structure of Earnings Survey, i.e. 2006 and 2010. The 2014 wave is not available yet.

Income Inequality: Wage Dispersion in the European Union
PE 536.294 15
role. Under these circumstances Crivellaro (2014), among others, have argued that the
accessibility to tertiary education can not only lower the disparities among different
education groups but can also lower the college wage premia. This in turn, however, can
lower the incentives to invest in human capital accumulation. Finally, the gender dimension
may be among the driving forces of inequality. As female participation rates in the labour
force have increased over the recent decades in most states, a wage gap to males could
widen the income distribution, see for example Brandolini, Rosolia and Torrini (2010). It is
further enforced by the fact that women are more often engaged in part time work than
men. In this regard, the creation of more full time working opportunities for females might
act as an instrument to reduce the difference between certain percentiles of monthly
earnings.
2.2. Technological change and crowding out of routinized work
While technology can boost inequality, better education can work in the opposite
direction..
If new technologies increase the productivity of high skilled workers more than for low
skilled labourers, wages of high skilled workers will rise faster. The skill premium will
generally depend on the interaction between demand and supply of skills. While technology
can boost inequality, better education of labour can work in the opposite direction.
Therefore, the premium will grow if increases in the demand for skilled workers are not
offset by a respective increase of skilled labour. However, the standard setting can lead to
an overprediction of the skill premium, if the advances in technology outperform those in
education. In addition, the model fails to explain the relative fall of wages in the middle
class. Taken Germany as an example, Dustmann, Ludsteck and Schönberg (2009) have
argued that technological change is crucial to understand the widening of the wage gap at
the higher ranges of the distribution. The higher inequality at the bottom can be better
explained by supply shocks, such as a rising participation of women in the work force and
institutional reforms such as deregulation.
By eliminating explanatory deficits, the routinisation hypothesis proposed by Autor, Levy
and Murnane (2003) offers a more nuanced view of the implications of technological
progress. The basic difference to the standard approach refers to the lower edge of the
distribution. Within sectors, industries, occupations and education groups, the impact of
new technology such as computerization is associated with reduced labour input of routine
tasks and increased labour input of non-routine elements.
Workers of a given certain skill level can perform a variety of tasks and the set of tasks
they are assigned to can change in response to changes in labour market conditions and
technology. High skilled workers have an advantage in performing non-routine tasks, such
as problem solving, management and creative occupations. Medium-skilled workers have
an advantage in performing routine tasks that are based on well-understood procedures
(book keeping, clerical and administrative work). Low skilled workers have an advantage in
performing non-routine manual tasks that require adaptability and personal interactions,
such as personal health services. While increased computerization has complemented the
most skilled tasks, it substitutes for routine tasks performed by middle wage earners,
leaving the demand for lowest skilled service tasks largely unaffected (Van Reenen, 2011).
The decline of computer prices lowers the price of routine tasks and thus wages of the
respective workers, contributing to higher divergence.
Hence, the introduction of new technologies can depress the relative wages of medium
skilled workers, both compared to the high and low skilled edge. In contrast, it could have
an ambiguous effect on the wages of highly skilled relative to low skilled workers. If
medium skilled workers move downward the task distribution, higher downward pressure
Policy Department A: Economic and Scientific Policy
PE 536.294 16
on low than on highly skilled wages is expected. This leads to an indirect rise in wages at
the top relative to the bottom of the wage distribution. Adult workers displaced from
medium to low skilled occupations induce stronger competition in the labour markets that
can reduce opportunities for the youth.
The routinisation hypothesis is supported by several studies. Goos and Manning (2007) find
that the recent pattern of employment changes in the UK was marked by increases in the
highest and lowest wage occupations, with job polarisation explaining one third of the rise
in the log 50/10 and one half of the rise in the log 90/50 wage differential. According to the
analysis presented by Spitz-Oener (2006), an increase in non-routine abstract as well as
non-routine manual tasks, but a marked decline in routine tasks characterises employment
changes in West-Germany and hollowed out middle class occupations and the subsequent
earning perspectives. Following Goos, Manning and Salomons (2009, 2010) the European
employment structure polarized with the shares of managers, professionals and low-paid
personal services workers increased at the expense of the shares of manufacturing and
routine workers. The contribution of other hypothesis such as openness to trade and
outsourcing of jobs or labour market institutions to explain the observed pattern is much
smaller. Michaels, Natraj and Van Reenen (2010) confirmed these results. Industries with
faster growth of ICT exhibited larger increases in relative demand for high educated
workers and bigger falls in relative demand for the medium educated.
2.3. Globalization, openness to trade and outsourcing
Trade liberalization is associated with higher returns of skilled workers in the
richer countries.
International trade is one of the potential explanations for an increasing wage gap between
skilled and unskilled workers. Protectionist sentiments are fuelled by the observation that
the benefits of productivity gains accrued mainly to the highly skilled, highly educated
workers, leaving people with lower skills behind. Increased trade is associated with higher
returns of skilled workers in the richer countries. As a consequence, higher inequality can
emerge from trade liberalization (Kremer and Masking, 2006). Theoretical references are
provided by the Heckscher-Ohlin and Stolper-Samuelson theorems. Increasing trade
relationships shift labour demand from unskilled to skilled workers in developed economies,
as they are specialized in the production of skill-intensive products and realize their
comparative advantage. This leads to an increase in wage inequality in the developed
economies. In contrast, the effect for the developing countries is ambiguous.
While trade might indeed play a role as a driver of inequality, its role does not seem to be
overwhelmingly high. For instance, Jaumotte, Lall and Papageorgiou (2008) and Afonso,
Albuquerque and Almeida (2013) reported evidence that technological progress and
globalisation tend to increase the returns to skills, but that the contribution of technology to
rising wage inequality is definitely higher. Nonetheless, trade can stimulate innovation and
the diffusion of technologies. However, it is questionable whether the volume of trade
between developed and developing countries is large enough to generate the observed
increases in inequality, as most of trade flows take place between countries with similar
endowments (Matano and Naticcioni, 2010).
For these reasons, further mechanisms have been suggested through which trade can
affect labour income inequality. Here, labour outsourcing plays a crucial role. With
intensified trade linkages, it becomes easier to offshore, i.e. more tasks can be outsourced
to the skill-poor and lower wage country. The literature concluded that offshoring from
industrialized countries has led to a shift in labour demand towards more skilled workers,
implying that unskilled workers lose while skilled workers will gain from globalization
(Feenstra and Hanson, 1996). Tasks that are relocated from richer to poorer countries are
Income Inequality: Wage Dispersion in the European Union
PE 536.294 17
typically not very skill intensive from the perspective of the skill-rich country, but they
might be from the perspective of the skill-poor country. As a result, offshoring makes
labour demand more skill intensive in both poorer and richer countries, thus increasing
inequality in both.
Note that the routinisation hypothesis is also relevant in the debate, as there might be only
a loose relationship between the suitability of a task for offshoring and the associated skill
level. This is an important point that has strong implications on the potential labour market
effects of offshoring. Utilizing German individual and firm level data, Baumgarten,
Geishecker and Görg (2013) argued that the wage effects of offshoring activities are
modest and depend on the magnitude to which the task under consideration requires
personal interaction or can be described as non-routine. The effects appear to increase if
the labour markets are more competitive. An export orientation of the firms tends to widen
the effect, see Klein, Moser and Urban (2013). In addition, if firms differ in their profitability
and low-income workers work disproportionately in low-productivity firms that are subject
to import competition, trade may increase labour income inequality by lowering
employment and the relative earnings of the low-income workers, see Egger and
Kreickemeier (2009) and Helpman, Itskhoki and Redding (2010).
2.4. Labour market institutions and minimum wages
Wage fluctuations stronger as in a more deregulated environment.
Labour market institutions define the framework conditions under which labour markets
operate. They can have a manifold impact both on the employment record and the wage
distribution. For example, they determine the responsiveness of employment and wages to
shocks. In more deregulated labour markets with a lower presence of trade unions, the role
of wages as an instrument to mitigate shocks is larger. Thus, wage fluctuations are
expected to be stronger as in a highly regulated environment, see Clar, Dreger and Ramos
(2007). Similarly, Buscher, Dreger, Ramos and Surinach (2009) explored the role of the
institutional framework for the labour market performance in the EU countries. Based on
labour demand models, their results suggest that the responsiveness of employment and
wages to macroeconomic conditions is much stronger in deregulated environments. In
periods of a crisis, unemployment is expected to rise particularly in countries with more
liberal frameworks, with the subsequent wage adjustment.
Effects of labour market institutions not equal across the employees.
Moreover, the effects of labour market institutions are not equal across the employees. For
example, employment protection has been much stricter for regular than for temporary
contracts. Hence, workers at the margin of the labour market such as young people run the
risk of getting trapped in a situation where they move between temporary work and
unemployment without having a chance to get a permanent work. In fact, stricter
regulations and restrictions for standard work arrangements might have contributed to the
emergence of atypical employment and precarious forms of work, like solo self-
employment, marginal part time, agency-based or subsidised work. On the one hand, these
atypical working contracts have improved the flexibility of labour markets to react against
shocks. On the other hand, persistence effects can increase the poverty risk of the
respective labourers. Low-income workers on temporary contracts earn less than workers
with similar characteristics on permanent contracts. Such differentials are not observed for
higher income workers (Koske, Fournier and Wanner 2012).
The legislation for employment protection affects also other components of the institutional
setting, such as the structure of wage formation process. If employment protection is strict,
negotiated wages might exceed market clearing levels and reduce the employment chances

Policy Department A: Economic and Scientific Policy
PE 536.294 18
for people entering the labour market. This leads to disincentives and runs against the
trend towards higher participation rates in the labour force, for example, for women and
the elderly. According to Flaig and Rottmann (2013) a tighter system of employment
protection, as well as a higher tax burden on labour income and generous unemployment
benefit systems tend to increase, while a higher centralization of wage formation decreases
unemployment. The stricter the regulation in the labour and product market, the higher the
persistence of inequality. In contrast, the degree of unionization and corporatism, as well
as the tax wedge tend to lower persistent inequality. Similarly, Sologon and O’Donoghue
(2012) found that the inequality of labour earnings is negatively related to unionization, the
degree of corporatism, and the tax wedge. A rationale for the latter finding is that a rise in
the tax wedge, other things being equal, will lead to higher government revenues that are
available for redistribution of incomes.
The wage formation process is often described by trade union densities, collective
bargaining coverage and bargaining coordination. The influence of the wage bargaining
system on the dispersion of wages is ambiguous and depends on the number of workers
who are covered by collective agreements through union membership or administrative
extensions of collective agreements, the strength of unions, the level at which bargaining
actually takes place (e.g. at the firm, industry or economy-wide level) and the degree of
coordination. Based on a panel of countries, Fournier and Koske (2012) argued that the
decrease in the trade union membership has contributed to higher wage inequality. For the
UK the deunionization of unskilled workers might explain a huge part of the increase of the
skill premium both in the private and public sector occupations (Kang and Peng, 2013). In
contrast, the deunionization of skilled workers had no significant effect on the dispersion.
For the Danish labour market Dahl, Le Maire and Munch (2013) found that wages are more
dispersed under firm level bargaining compared to more centralized wage systems.
Furthermore wage premia are more associated with firm-level bargaining, and the return to
skills is usually higher under the more decentralized wage setting systems.
To combat the rising inequality especially at the lower edge of the wage distribution,
minimum wages can act as an appropriate instrument. However, their impact is
ambivalent, as they can not only reduce poverty among the low skilled workers, but can
also wipe out low productivity employment opportunities. A relatively high minimum wage
can narrow the distribution of labour income, but if set too high it may actually reduce
employment, which dampens its inequality-reducing effect. Boeri (2012) emphasized the
role of the wage setting regime and found a sizeable mark-up of collectively agreed
compared to government legislated minimum wages. The mark-up increases with the
bargaining power of unions. According to Butcher, Manning and Dickens (2012) minimum
wages have little effect on employment but do have impacts on wage inequality beyond the
workers who are directly affected. For example, the UK’s National Minimum Wage can
explain a substantial part of the decline of wage inequality in the bottom half of the
distribution over the last decade, especially for young workers. It should be noted that the
contribution of minimum wages to lower wage inequality is not undisputed. In fact,
Laporsek (2013) reported a negative impact of minimum wage on youth employment in a
sample of EU Member States.
Based on household surveys in EU countries, Garnero, Kampelmann and Rycx (2013)
argued that the combination of sectoral minimum wages and high coverage of collective
bargaining can be regarded as an equivalent to a binding statutory minimum wage at the
national level. Estimates suggest that both a national statutory minimum wage and in
countries with sectoral-level minima, higher collective bargaining coverage is associated
with lower levels of overall and inter-industry wage inequalities and a smaller fraction of
workers paid below the prevailing minima.
Income Inequality: Wage Dispersion in the European Union
PE 536.294 19
3. RECENT EVOLUTION OF WAGE INEQUALITY IN THE EU
KEY FINDINGS
Using EU-SILC microdata, we conclude that between 2006 and 2011, inequality
has increased in around two thirds of the EU countries considered, while in the rest
it has decreased. However, the variation is not substantial, particularly when
wages are measured as monthly or hourly earnings. In fact, inequality levels for
annual earnings are significantly higher than inequality measures for monthly and
hourly wages, which, however, are much more similar among them. This means
that an important source of variation of annual earnings inequality is the number of
months worked during the last years while the effect of worked hours is only
relevant to a minor extent. An additional finding is that in most countries inequality
has increased in the bottom part of the distribution and not only in the top part as
predicted by the literature. In these countries, the incidence of low wage work has
also increased between 2006 and 2011
The analysis of SES microdata provides additional interesting results. While
confirming the main stylised facts derived from EU-SILC, it permits to analyse the
impact of collective bargaining systems on wage inequality and also to analyse the
impact of composition effects on inequality evolution. The first analysis, which is
further expanded in other parts of the report, shows that intermediate levels of
collective bargaining seem to produce a more compressed wage structure, a result
that is in line with the previous literature. An assessment of the so-called
composition effect on the recent evolution of inequality in the EU countries is
performed in our second analysis of SES microdata. Results for some selected EU
countries shows that most of the variation in inequality is not explained by changes
in the distribution of worker and job characteristics, suggesting that it was caused
by modifications in the wage structure. However, as the impact is likely to vary
across countries and even time periods, it is important that the study of the effect
of the labour market policies and institutions on wage inequality as that in Section
5 controls for changes in the composition of the wage earners population.
3.1. Introduction
Recent evolution of earnings inequality in EU-28 countries.
The objective of this section is to provide evidence on the recent evolution of earnings
inequality in EU-28 countries. EUROSTAT regularly produces two indicators related to
income inequality: the Gini coefficient of equivalised disposable income and the S80/S20
income quintile ratio. The equivalised disposable income is the total income of a household,
after tax and other deductions, which is available for spending or saving, divided by the
number of household members converted into equalised adults. Household members are
equalised or made equivalent by weighting each according to their age, using the so-called
modified OECD equivalence scale. This scale gives a weight to all members of the
household (and then adds these up to arrive at the equivalised household size): 1.0 to the
first adult; 0.5 to the second and each subsequent person aged 14 and over; and, last, 0.3
to each child aged under 14. Both indicators are calculated using data from the EU
Statistics on Income and Living Conditions (EU-SILC) available for most EU members.
However, information on wage inequality is not currently produced.
In order to achieve our objective, the EU-SILC seems to be the most appropriate source to
analyse earnings inequality covering employees in all sectors and firms in a homogeneous
Policy Department A: Economic and Scientific Policy
PE 536.294 20
way across all the EU Member States. In fact, it provides comparable microdata for 28 EU
Member States plus Iceland and Norway. Currently seven waves are available covering the
period 2004-2012. Data for the 2004 wave is only available for a few countries and the
2012 wave does not provide information for Ireland. Data for 2005 and 2006 is also
incomplete for some EU Member States. It also provides detailed information on wages,
education and other personal and job characteristics that make it an appropriate data set in
order to analyse earnings inequality conditioning on some of these characteristics.
However, it is important to take into account that there are also some potential
shortcomings: first, due to sampling and/or non-response errors it is not clear whether EU-
SILC provides a proper picture of the number of employees and its evolution across all EU
Member States; and, second, as it is self-reported, the information on earnings could be
subjected to measurement errors.
In order to check if the EU-SILC provides an accurate estimate of employees’ level and
evolution across EU Member States, we have compared the number of employees according
to EU-SILC with data from the Labour Force Survey (LFS). The detailed results are shown
in Annex 1. Figure A1.1 shows the comparison between all employees working full or part-
time according to EU-SILC and LFS while Figure A1.2 shows the comparison between
employees according to the LFS criteria that is, however, only applied in a smaller set of EU
Member States. Apart of the values and a graph showing the evolution of employees
according to both sources for each country, we have also calculated the Mean Percentual
Absolute Error (MAPE), a statistical measure that permits us to check the accuracy of the
EU-SILC when compared to the LFS. If the MAPE value is below 3 %, this means an
excellent fit between the two sources. If it is between 3 % and 5 %, we talk about a good
fit. If it is between 5 % and 10 %, it is acceptable and only if it above 10 % we will say that
the differences between the two magnitudes are relevant. When using the first definition
(Figure A1.1) in 9 out the 28 EU Member States the MAPE is below 3 %; in another 5 is
between 3 % and 5 %, in 9 is between 5 % and 10 % and only in 4 cases (Denmark,
Finland, Ireland and the Netherlands), it is equal or above 10 %. In the 16 EU Member
States where we could apply the LFS definition in EU-SILC data, the results are very
similar: in 5 out of 16, the MAPE is below 3 %; in another 5 it is between 3 % and 5 %, in
2 it is between 5 % and 10 % and only in Ireland, Romania and Spain it is above the 10 %.
In the Spanish case, the result is related to the revision of LFS weights according to the
2011 Census. Summarising this evidence, from our point of view, EU-SILC provides a
proper picture of employees’ level evolution in EU-28. The criteria we use in the rest of this
section to identify employees is their self-reported status (not the LFS criteria as it is not
available for all countries) and the only filter we apply is that they receive
positive earnings.
In relation to the second point, the measurement of the earnings variable, we use in our
analysis the variable “Cash or near cash income received in the main and any secondary or
causal jobs including social contributions and income taxes” i.e. gross annual earnings.
Although gross monthly earnings are available for some countries (Austria, Greece, Italy,
Portugal, Spain, and the United Kingdom), we do not use this information in our analysis.
We have carried out some comparisons for these countries and obtained results are very
similar to those obtained when converting annual earnings into monthly earnings (detailed
results are available from the authors on request). In order to convert annual earnings into
monthly earnings, we divide the total annual amount by the number of months worked
during the last years transformed into full-time equivalents (months working part-time
count as half a month in full-time equivalent). As the number of hours worked the last
week is also available, it is possible to extrapolate the number of hours worked during the
last month (multiplying this Figure by 4.3) and calculate hourly earnings. Annual, monthly
and hourly earnings will be considered in our analysis of inequality.

Income Inequality: Wage Dispersion in the European Union
PE 536.294 21
A second data source is used in the analysis in order to assess the robustness of the
results. In particular, we exploit micro-data from the Structure of Earnings Survey (SES).
SES is a survey addressed to firms and regularly carried out by Eurostat every 4 years in
Member States of the EU according to a standard methodology. The SES microdata sets are
available for reference years 2002, 2006 and 2010 as well as for 24 countries (23 EU
Member States plus Norway). The SES collects comprehensive information, provided by the
management of the establishments, on the level and structure of remuneration of
employees; workers’ demographic and job characteristics (nationality, sex, age, level of
education, tenure in the firm, occupation, type of contract, supervision tasks indicators,
full-time/part-time indicators) along with detailed information for each respondent’s
establishment (industry, size, region and type of collective agreement).
It should be stressed that the population of firms-employees covered by the SES have been
changing over the subsequent waves. The mandatory sectoral coverage in 2002 was from
groups C to K of the NACE Rev. 1.1 (Mining and quarrying, Manufacturing, Electricity, gas
and water supply, Construction, Wholesale and retail trade; repair of motor vehicles,
motorcycles and personal and household goods, Hotels and restaurants, Transport, storage
and communication, Financial intermediation, Real estate, renting and business activities).
It was extended to include groups M to O (Education, Health and social work, and Other
community, social and personal service activities) in 2006, and L (Public administration and
defence; compulsory social security) in 2010. This means that the SES samples do not
represent the entire employee population in each country, and that annual comparisons
require some sectoral homogenization.
There are two reasons to consider the SES along with the EU-SILC: first, information on
wages is provided directly by firms and not by workers, so we expect measurement errors
to be lower when using this source. The second reason is that we can check the impact of
some firm characteristics on wage dispersion, such as the structure of collective bargaining.
The wage measures derived from this survey will be gross annual, monthly and hourly
wage as in the case of the EU-SILC.
Summarising, we consider EU-SILC and SES to collect information on annual, monthly and
hourly earnings. In order to carry out time and cross-country comparisons we have
adjusted for Purchasing Power Parity Index (PPP) from Eurostat defined as Price level
indices (EU27=100) based on household final consumption expenditure.
The rest of the section is organised as follows: first, the results of wage inequality
measures using EU-SILC microdata are shown and, second, we present additional evidence
based on SES microdata.
3.2. Evidence using EU-SILC microdata
Rather heterogeneous evolution.
In order to analyse earnings inequality using EU-SILC microdata2 we have calculated four
different measures of inequality for annual, monthly and hourly earnings. In particular, we
have calculated the Gini coefficient, the decile ratio (P9010, the ratio between the ninth and
the first decile), the P5010 (the ratio between the fifth and the first decile), the P9050 (the
ratio between the ninth and the fifth decile) and, last, a measure capturing the incidence of
low wage work. In particular, following the Eurostat's definition, in our study, low wage
earners are defined as those employees earning two thirds or less of the national median
gross hourly earnings. The thresholds that determine low wage earners vary from year to
2 We make use of microdata from the European Commission, Eurostat, EU-SILC cross-sectional database made
available by Eurostat (RPP application number 05/2014-EU-SILC-SES). Eurostat has no responsibility for the
results and conclusions reported here.
Policy Department A: Economic and Scientific Policy
PE 536.294 22
year and are country-specific. All calculations have been performed using personal cross-
sectional weights using data for all employees with positive earnings according to each of
the criteria.
Summary results for 2006 and 2011 (from EU-SILC 2007 and 2012 waves) are shown in
Tables and Figures in this section, while detailed results are shown in Annex 2. Tables 1
and 2 and Figure 2 summarise the results for annual earnings, Tables 3 and 4 and Figure 3
for monthly earnings, whereas Tables 5 and 6 and Figure 4 provide the same information
for hourly earnings.
The first graphs of Figure 2 show for each country the median value (the thick horizontal
mark), the interquartile range (the vertical box) and the distance between the median
and 1,5 times the standard deviation of annual earnings adjusted for PPP in 2006 and in
2011. Countries are ranked according to the interquartile range, so in terms of their within-
country earnings dispersion. Earnings differences are substantial across EU-28 Member
States even after controlling for price level differences, but also earnings dispersion. In
particular, and looking at the 2011 data, inequality in annual wages is substantially higher
in Luxembourg or Germany than in Romania or Belgium. Differences in terms of the decile
ratio are significant going from 3.1 in Romania to 13.3 in Austria. Although there are some
differences in terms of the country ranking when we look at the two inequality measures in
Table 1, it is worth mentioning that the correlation between the Gini coefficient and the
decile ratio is positive and close to 0.72. If we look at changes between 2006 and 2011 in
the decile ratio, we can see that inequality has increased (although not substantially) in 18
out of the 26 countries considered, while in other 8 it has decreased (the comparison for
Croatia and Ireland is not possible due to missing data). If we look at the Gini coefficient
plus the P5010 and the P9050 (that are not shown in Table 1, but available in Annex A2) a
similar picture emerges.
Results from monthly and hourly wages (Figures 3 and 4 summarise the main evidence)
show two interesting results:
Inequality levels significantly reduce when we compare, for instance, the decile ratio
for annual earnings with the values for monthly and hourly wages. While the range
of the decile ratio for annual earnings in 2011 was 10.2 (13.3-3.1), for monthly
earnings was 3.3 (6.1-2.8) and 3.5 (6.3-2.8) for hourly earnings. This means that
an important source of variation of annual earnings inequality is the number of
months worked during the last years while the effect of worked hours is only
relevant to a minor extent. We can also conclude that monthly and hourly earnings
provide a similar picture, so in some particular parts of this final report we focus on
annual and hourly wages.
Changes in monthly and hourly earnings inequality are similar to the ones observed
for annual earnings, although the specific situation of some countries change
substantially depending on the indicator and the wage measured considered.
Summarising, in about two thirds of EU Member States, earnings inequality has
increased between 2006 and 2011. However, the magnitude of the change has not
been substantial, particularly when wages are measured as monthly or hourly
earnings.
Changes in wage inequality from 2006 to 2011 for each EU member state are summarised
in Figure 5. It can be observed a rather heterogeneous evolution, with countries where
inequality increased notably and other in which no significant changes are observed. Even
wage inequality decreased in a group of Member States, including Portugal and Greece.
Last, and regarding the incidence of low wage work, full results are shown in Table A2.31,
while figure 6 summarises the main results. From these results, it is clear that the

Income Inequality: Wage Dispersion in the European Union
PE 536.294 23
incidence of low wage work is quite heterogenous between EU countries. However, as
before, no clear pattern is observed in relation to changes between 2006 and 2011.
Table 1: Gross annual earnings in 2006
Country Sample
size
Employees
(thousands)
Mean
(euro)
Median
(euro)
Mean
(ppp)
Median
(ppp)
Gini
index
Decile
ratio
AT 6728 3444 25610 22400 25123 21974 0.381 8.614
BE 5555 3796 29874 27744 27740 25762 0.301 4.648
BG 3784 2538 2256 1948 5027 4341 0.317 3.825
CY 4072 322 20210 16890 23034 19250 0.378 7.457
CZ 9067 4072 7381 6716 12035 10951 0.315 4.456
DE 12409 34200 25329 23438 24685 22843 0.411 13.660
DK 6417 2136 40450 38516 29234 27836 0.252 3.337
EE 6237 627 6729 5432 9822 7928 0.383 5.767
EL 3675 3017 18354 14660 20612 16464 0.379 6.545
ES 12740 18000 17407 15347 18969 16724 0.361 7.362
FI 10045 2162 27085 25186 22072 20524 0.344 7.732
FR 10432 24500 21929 19797 20205 18241 0.346 6.688
HR
HU 8344 3840 5466 4493 9015 7410 0.383 7.070
IE 4525 1639 30740 24974 24689 20058 0.429 12.590
IT 16781 19100 22253 20075 21356 19266 0.359 7.305
LT 5122 1450 5434 4336 9477 7563 0.388 6.026
LU 4367 44635 35107 40088 31531 0.389 7.028
LV 4868 1049 5030 4123 8281 6787 0.406 8.014
MT
NL 11046 6476 30342 27266 29167 26210 0.369 7.467
PL 12237 12900 6327 5086 10132 8145 0.395 7.220
PT 3984 3935 13340 9167 15704 10792 0.433 6.747
RO 5512 6375 3333 2811 5784 4878 0.323 4.187
SE 8230 4125 25599 25208 21609 21279 0.344 9.396
SI 11250 755 14959 12825 19512 16729 0.333 4.774
SK 6288 2289 4948 4512 6987 6371 0.299 4.563
UK 8841 25500 33765 27179 29987 24139 0.390 6.923
Source: EU-SILC 2007 cross-sectional (rev.4 / March 2011).

Policy Department A: Economic and Scientific Policy
PE 536.294 24
Table 2: Gross annual earnings in 2011
Country Sample
size
Employees
(thousands)
Mean
(euro)
Median
(euro)
Mean
(ppp)
Median
(ppp)
Gini
index
Decile
ratio
AT 5877 3654 29815 25592 28253 24251 0.424 13.320
BE* 5114 3979 32629 30202 29650 27444 0.301 4.665
BG 5887 3159 3536 3062 7260 6287 0.359 6.713
CY 5329 372 22611 17820 25522 20114 0.406 8.492
CZ 7913 4046 10439 9314 13835 12345 0.327 5.218
DE 12487 38400 27514 24850 27013 24398 0.413 13.04
DK 6335 2507 41706 41435 29279 29089 0.333 9.629
EE 5764 593 8914 7341 11764 9689 0.380 6.996
EL 2738 2701 17406 15589 18437 16513 0.327 5.145
ES 10894 16600 18291 16643 18908 17205 0.361 8.466
FI 9863 2244 31492 29698 25803 24333 0.349 8.693
FR 11748 25900 25599 22790 23371 20806 0.365 8.091
HR 4132 1286 9687 8273 13278 11341 0.314 4.141
HU 11043 3747 6205 5312 10097 8644 0.376 7.836
IE* 3206 1465 33511 26023 28348 22014 0.431 10.830
IT 14969 19900 23176 21503 22552 20924 0.355 7.042
LT 5169 1249 6134 5055 9525 7850 0.406 9.747
LU 6371 228 46131 38400 37451 31175 0.374 7.159
LV 6022 872 6940 5309 9764 7470 0.440 12.16
MT 4239 157 16804 15264 21470 19503 0.332 5.867
NL 11293 7057 33831 31065 31263 28707 0.375 10.06
PL 11434 12700 8168 6790 13961 11606 0.358 5.641
PT 5547 4029 13897 10120 15857 11548 0.400 6.225
RO 4836 6648 3895 3436 6628 5848 0.263 3.079
SE 7578 4460 32048 30902 25527 24614 0.347 9.114
SI 11427 804 17387 14825 20497 17477 0.354 6.816
SK 6634 2171 8466 7864 11990 11138 0.293 4.672
UK 8378 24700 32858 25150 28248 21621 0.425 7.177
Source: EU-SILC 2012 cross-sectional (March 2014); (*) EU-SILC 2011 cross-sectional (rev.2 / March 2014).

Income Inequality: Wage Dispersion in the European Union
PE 536.294 25
Figure 2: Changes in inequality between 2006 and 2011 – Gross annual earnings
Source: EU-SILC.

Policy Department A: Economic and Scientific Policy
PE 536.294 26
Table 3: Gross monthly earnings in 2006
Country Sample
size
Employees
(thousands)
Mean
(euro)
Median
(euro)
Mean
(ppp)
Median
(ppp)
Gini
index
Decile
ratio
AT 6582 3370 2522 2200 2474 2158 0.322 4.605
BE 5475 3739 3031 2694 2815 2501 0.252 2.945
BG 3750 2514 205 178 458 397 0.289 3.459
CY 4058 321 1815 1496 2068 1705 0.332 4.284
CZ 8897 3996 661 583 1078 950 0.275 3.155
DE 11720 32100 2565 2417 2500 2355 0.339 6.520
DK 6256 2072 3845 3533 2779 2553 0.233 2.630
EE 6194 623 612 472 893 689 0.349 4.736
EL 3639 2986 1682 1360 1889 1528 0.329 3.907
ES 12582 17800 1666 1400 1815 1526 0.310 3.909
FI 9721 2090 2646 2318 2156 1889 0.272 3.049
FR 9913 23200 2294 1923 2113 1772 0.294 3.213
HR
HU 7937 3661 514 413 848 680 0.326 3.699
IE 4398 1592 3135 2553 2518 2050 0.346 4.717
IT 15022 17300 2220 1887 2131 1811 0.293 3.325
LT 5118 1449 486 394 848 687 0.354 4.948
LU 4354 195 4181 3494 3755 3138 0.342 4.823
LV 4508 983 466 384 767 632 0.363 5.302
MT
NL 10490 6067 3669 3017 3527 2900 0.330 3.899
PL 12188 12800 588 458 942 733 0.349 4.382
PT 3966 3914 1186 796 1396 938 0.410 5.250
RO 5472 6333 284 238 492 413 0.314 3.983
SE 7847 3903 2733 2469 2307 2084 0.312 4.744
SI 11049 740 1334 1110 1739 1448 0.315 3.618
SK 6088 2215 449 403 634 569 0.257 3.066
UK 7853 22600 3343 2630 2969 2336 0.363 4.500
Source: EU-SILC 2007 cross-sectional (rev.4 / March 2011).
Income Inequality: Wage Dispersion in the European Union
PE 536.294 27
Table 4: Gross monthly earnings in 2011
Country Sample
size
Employees
(thousands)
Mean
(euro)
Median
(euro)
Mean
(ppp)
Median
(ppp)
Gini
index
Decile
ratio
AT 5422 33700 3140 2679 2975 2539 0.347 5.338
BE* 5049 39280 3408 2969 3097 2698 0.261 2.899
BG 5223 28390 342 284 703 584 0.293 3.243
CY 5306 3698 2040 1609 2303 1816 0.355 4.552
CZ 7666 39220 953 819 1263 1085 0.283 3.278
DE 11803 362000 2789 2550 2739 2504 0.341 6.067
DK 5777 22200 4602 4024 3231 2825 0.276 2.946
EE 5683 5854 860 703 1135 927 0.334 4.503
EL 2731 26960 1634 1444 1730 1530 0.262 2.805
ES 10688 163000 1784 1517 1845 1568 0.287 3.571
FI 9099 20780 3224 2842 2641 2329 0.243 2.766
FR 10908 240000 2645 2225 2415 2031 0.301 3.285
HR 4132 12860 863 728 1184 998 0.273 3.148
HU 10560 35860 592 487 963 792 0.300 3.540
IE* 3174 14510 3458 2814 2925 2381 0.351 4.712
IT 13448 181000 2317 2053 2254 1998 0.283 3.508
LT 4761 11630 595 489 924 759 0.347 4.665
LU 6351 2274 4421 3647 3589 2960 0.340 4.394
LV 5485 7997 681 520 958 732 0.372 4.820
MT 3971 1473 1576 1401 2014 1790 0.274 3.262
NL 10436 64430 4155 3613 3839 3339 0.297 3.701
PL 11383 127000 756 618 1291 1056 0.327 3.888
PT 5392 39240 1262 899 1440 1026 0.367 4.247
RO 4653 64330 329 289 559 493 0.259 3.063
SE 6654 39380 3739 3046 2978 2426 0.357 4.719
SI 10735 7533 1612 1352 1900 1594 0.299 3.267
SK 6365 20680 786 712 1113 1008 0.242 2.820
UK 8117 239000 3284 2404 2823 2067 0.413 4.865
Source: EU-SILC 2012 cross-sectional (March 2014); (*) EU-SILC 2011 cross-sectional (rev.2 / March 2014).
Policy Department A: Economic and Scientific Policy
PE 536.294 28
Figure 3: Changes in inequality between 2006 and 2011 – Gross monthly earnings
Source: EU-SILC.

Income Inequality: Wage Dispersion in the European Union
PE 536.294 29
Table 5: Gross hourly earnings in 2006
Country Sample
size
Employees
(thousands)
Mean
(euro)
Median
(euro)
Mean
(ppp)
Median
(ppp)
Gini
index
Decile
ratio
AT 6064 3087 17.01 14.00 16.68 13.73 0.345 4.103
BE 5161 3519 20.42 17.27 18.96 16.04 0.269 3.239
BG 3630 2435 1.15 0.98 2.56 2.19 0.289 3.472
CY 3779 298 10.95 8.76 12.48 9.98 0.344 4.530
CZ 8459 3772 3.74 3.30 6.09 5.38 0.260 3.015
DE 11283 30900 17.20 15.23 16.77 14.84 0.330 5.219
DK 6248 2070 25.07 21.95 18.12 15.87 0.257 2.814
EE 5786 582 3.69 2.89 5.38 4.22 0.349 4.545
EL 3349 2761 10.62 8.35 11.93 9.38 0.352 4.447
ES 11056 15700 10.54 8.68 11.48 9.46 0.318 3.983
FI 9086 1950 17.60 14.68 14.35 11.96 0.289 2.970
FR 9154 21200 15.61 12.43 14.38 11.45 0.323 3.163
HR
HU 7233 3340 3.06 2.46 5.05 4.06 0.327 3.733
IE 4080 1467 23.70 18.76 19.03 15.07 0.348 4.236
IT 14064 16300 14.08 11.76 13.52 11.29 0.304 3.658
LT 4757 1354 2.90 2.34 5.05 4.09 0.357 4.933
LU 4043 184 27.03 22.11 24.28 19.86 0.353 4.980
LV 4126 903 2.64 2.16 4.35 3.56 0.358 5.128
MT
NL 10243 5932 28.24 22.10 27.15 21.25 0.354 4.058
PL 11107 11700 3.57 2.70 5.71 4.32 0.371 4.832
PT 3518 3501 7.08 4.79 8.33 5.64 0.409 5.566
RO 5259 6087 1.60 1.34 2.77 2.32 0.323 4.305
SE 7307 3597 16.95 14.71 14.30 12.41 0.314 4.611
SI 10848 724 7.68 6.41 10.02 8.35 0.312 3.618
SK 5860 2132 2.59 2.32 3.65 3.28 0.255 3.017
UK 7787 22400 22.39 17.05 19.89 15.14 0.371 3.888
Source: EU-SILC 2007 cross-sectional (rev.4 / March 2011)

Policy Department A: Economic and Scientific Policy
PE 536.294 30
Table 6: Gross hourly earnings in 2011
Country Sample
size
Employees
(thousands)
Mean
(euro)
Median
(euro)
Mean
(ppp)
Median
(ppp)
Gini
index
Decile
ratio
AT 4939 3048 20.20 16.86 19.14 15.98 0.336 4.617
BE* 4697 3659 23.14 19.28 21.03 17.52 0.289 3.266
BG 4741 2606 2.02 1.65 4.14 3.38 0.302 3.314
CY 4708 328 12.65 9.90 14.28 11.17 0.363 5.067
CZ 7147 3645 5.50 4.74 7.29 6.29 0.267 3.001
DE 10963 33900 18.33 16.33 18.00 16.04 0.313 4.632
DK 5285 1999 28.79 25.21 20.21 17.70 0.258 2.800
EE 5047 522 5.21 4.33 6.88 5.71 0.328 4.359
EL 2388 2362 10.76 9.17 11.39 9.72 0.280 3.283
ES 8561 13100 12.01 10.21 12.41 10.55 0.284 3.428
FI 8308 1896 20.60 17.71 16.88 14.51 0.253 2.812
FR 9974 21900 17.21 14.35 15.72 13.10 0.299 3.184
HR 3713 1156 5.01 4.26 6.87 5.83 0.271 3.175
HU 8921 2999 3.66 3.01 5.96 4.89 0.298 3.363
IE* 2878 1307 26.93 22.30 22.78 18.86 0.332 3.895
IT 12213 16600 14.94 13.25 14.54 12.89 0.286 3.636
LT 4389 1069 3.66 3.02 5.68 4.69 0.346 4.854
LU 5909 211 28.61 23.70 23.22 19.24 0.350 4.628
LV 4860 713 4.19 3.27 5.89 4.60 0.365 4.666
MT 3721 138 9.59 8.47 12.25 10.82 0.269 3.147
NL 9710 5952 31.16 26.80 28.80 24.76 0.291 3.645
PL 10297 11500 4.56 3.62 7.79 6.19 0.342 4.108
PT 4678 3434 7.79 5.46 8.89 6.23 0.383 4.357
RO 4601 6366 1.86 1.63 3.17 2.77 0.267 3.249
SE 6094 3584 31.04 20.57 24.72 16.39 0.433 6.263
SI 9855 693 9.64 8.25 11.37 9.73 0.290 3.206
SK 6050 1957 4.62 4.13 6.54 5.85 0.246 2.782
UK 8093 23800 21.18 15.40 18.21 13.24 0.400 4.133
Source: EU-SILC 2012 cross-sectional (March 2014); (*) EU-SILC 2011 cross-sectional (rev.2 / March 2014)

Income Inequality: Wage Dispersion in the European Union
PE 536.294 31
Figure 4: Changes in inequality between 2006 and 2011 – Gross hourly earnings
Source: EU-SILC.

Policy Department A: Economic and Scientific Policy
PE 236.294X 32
Figure 5: Changes in the Gini index for annual wages between 2006 and 2011
in EU countries
Source: EU-SILC.
3.3. Additional results using SES microdata
Inequality higher in annual gross earnings than in monthly and hourly earnings.
This section summarises the results obtained for the measures of earnings inequality when
using microdata from the Structure of Earnings Survey (SES)3. More specifically, the aim of
this section is to compare the measures obtained by using the data on earnings contained
in EU-SILC with that in SES, and thus checking for the robustness of the measures of
earnings inequality based on the former source. The full set of results obtained for the 23
Member States for which the SES data is available are included in Tables A3.1 to A3.9 in
Annex 3. It is noteworthy that these results correspond to the sample of wage earners in
sectors of activity from C to K of the NACE rev. 1.1. As mentioned above, the number of
sectors included in the SES dataset increased from 2002 to 2010, and it is not fully
homogeneous in all countries. The group of activities from C to K is the one for which data
is available in the three years and for the 23 Member States. To save space and focus the
analysis, we discuss the main features observed in the data next. More details can be found
in Annex 3.
3 We make use of microdata from the European Commission, Eurostat, SES database made available by Eurostat
(RPP application number 05/2014-EU-SILC-SES). Eurostat has no responsibility for the results and conclusions
reported here.

Income Inequality: Wage Dispersion in the European Union
PE 536.294 33
Figure 6: Changes in the incidence of low wage work between 2006 and 2011
Source: EU-SILC.

Policy Department A: Economic and Scientific Policy
PE 536.294 34
As with the EU-SILC data, the first important feature derived from the SES dataset is that
inequality is higher when measured in the gross annual earnings than in the monthly
earning and, particularly, than the one observed for hourly wages. This can easily be
observed when comparing values of the indexes for 2006 and 2010 in Figures 7 to 9. As an
example, the Gini index for 2010 in Latvia, the country with the highest level of inequality
is 0.50, 0.46, and 0.38 when measured in annual, monthly and hourly wages, respectively.
In the case of Finland, the less unequal country, the value of the Gini index for annual,
monthly and hourly wages is 0.30, 0.25, and 0.22, respectively.
Another interesting characteristic of inequality that is derived from the information in
Figures 7 to 9 is the high degree of persistence. There are only minor changes in the value
of the measures of inequality for 2006 and 2010. Actually, this is so as well when they are
compared with the values obtained for 2002. This is in contrast with the sizeable
differences in the degree of inequality observed across countries. In some countries,
inequality is about twice that observed in the more egalitarian Member States –regardless
of the measure of inequality and the definition of wages used. The detailed analysis of
inequality using the different measures and definitions of wages has revealed noteworthy
features, the most striking one being that of the Netherlands. It ranks among the countries
with the highest level of inequality as measured by the Gini index in annual and monthly
wages. However, it is among the countries with medium levels of inequality when it is
measured in hourly wages. Figures for the P5010 ratio for annual, monthly and hourly
wages suggest that the incidence of part-time work in the Netherlands might well explain
this fact. It also confirms the convenience of considering information from complementary
indexes, and analysing the impact of labour market institutions on inequality.
The SES data therefore confirms two stylised facts derived from the EU-SILC: i) the higher
degree of inequality when it is measured in annual and monthly wages in comparison with
that in hourly wages, and ii) the strong persistence over time in the degree of inequality
observed for all EU Member States. This suggests that the information on the measures of
inequality derived from EU-SILC is consistent with the evidence obtained by exploiting the
SES dataset. To further analyse the consistency of the two sources, we have compared the
measures of inequality for the three definitions of wages and the three years for which the
SES data is available. Figure 10 summarises the results obtained for annual, monthly and
hourly wages in 2010. It is observed that values of the Gini index for annual and montly
wages from the SES data are above those obtained with the EU-SILC in a numerous group
of countries. The comparison of the percentile ratios obtained with both datasets suggests
that the higher amount of inequality obtained when using the SES data for annual and
monthly wages is due to the larger dispersion at the upper edge of the distribution when
using this source. In almost all countries, the P9050 ratio for the SES data is above the
value obtained with the EU-SILC dataset. In turn, there is not a clear pattern at the bottom
of the distribution. Interestingly, the same pattern is not observed when inequality is
computed for hourly wages. In this case, the Gini index obtained when using the EU-SILC
dataset is somewhat lower than that obtained from the SES data for most countries. This
seems to be caused by the lower dispersion at the bottom edge of the distribution when
measured with the EU-SILC dataset (lower values of the P5010 ratio for the EU-SILC data
in most countries). This effect is counterbalanced in a small number of countries (e.g.
Romania and Bulgary) by the difference between the two data sources in the measure of
inequality at the upper edge of the hourly wage distribution. It can be observed that for
those countries for which the P9050 ratio from the SES data is above the one obtained with
the EU-SILC, the Gini index with the former data source is above the one with the latter.
In any case, the comparison of the measures of inequality obtained with the two datasets
therefore reveals that there is substantial correspondence between the SES and the EU-
SILC. Actually, the correlation between the country values of the Gini index for 2010 is 0.6

Income Inequality: Wage Dispersion in the EU
_________________________________________________________________________
PE 536.294 35
and 0.7 for annual and monthly wages respectively. The degree of association is however
lower in the case of hourly wages, as the correlation between the Gini indexes from the two
data sources is just 0.3 in this case. As already mentioned, measurement errors in the EU-
SILC data and the lack of correspondence between the population of wage earners covered
by the two statistical operations (partial sectoral coverage and no inclusion of firms with
less than 10 employees for some countries-years in the SES) can explain the differences in
the measures of inequality between the two data sources, and the convenience of providing
information on the amount of wage inequality from both datasets in this section. Next, we
explore the impact of excluding or including wage earners in some sectors and micro-firms
on the measures of inequality computed using the SES data.
As mentioned in Section 3.1, the samples for the Member States in each of the three years
for which the SES data is available vary in terms of sectoral coverage. Another source of
discrepancy between the countries, and also between the years, is the inclusion of wage
earners in firms with less than 10 employees. As a result of the procedure implemented by
EUROSTAT to prevent the identification of firms and workers, it is not possible to compute
the measures of inequality using homogeneous samples, that is to say by excluding
individuals working in firms with less than 10 employees. To assess the impact of such
heterogeneity on the measures of inequality computed using the SES data, we focused on
the Spanish sample for 2010. The reason is that data on the number of workers in the local
unit is available for this country in that year, which allows computing the measures of
inequality when wage earners working in micro-firms are included and excluded from the
sample. Also, data allow the comparison of the measures of inequality for the restricted
sample of sectors C to K with those obtained from the entire sample. Results are
summarised in Tables 7 to 9 for the three types of wages. Interestingly, the discrepancy
between the values obtained for the Gini index and the three percentile ratios is quite
limited, which indicates that the general picture derived from the measures of inequality
based on the restricted sample of sectors does not differ substantially from that using the
entire sample. It also suggests that the inclusion of individuals working in firms with less
than 10 employees for some countries and years is likely to have only a minor effect on the
measures of inequality.
Two additional exercises have been carried out with the SES dataset. Firstly, the availability
of information on the type of collective pay agreement in the SES has allowed us to
compute the measures of inequality in each country and year for wage earners in three
broad categories of collective agreement: i) centralized, ii) intermediate, and iii) firm-level.
The results of the Gini index for the gross hourly wages in 2010 for the three categories of
workers are summarised in figure 11. Countries were grouped based on the number of
types of collective pay agreement. Two interesting results are derived from this figure:
first, no clear pattern emerges from the comparison of wage inequality between the
different groups of workers affected by different kinds of collective bargaining schemes and,
second, the only general result that can be appreciated is that intermediate levels of
collective bargaining seem to produce a more compressed wage structure. However, it is
also observed that the decrease in wage inequality for workers under intermediate levels of
collective agreement is more pronounced in some countries than in others, which suggests
that differences across countries in the functioning of the labour market may be shaping
the effect of the type of collective agreement on wage inequality. The empirical analysis in
the Section 5 will account for this feature.

Policy Department A: Economic and Scientific Policy
PE 536.294 36
Figure 7: Changes in inequality between 2006 and 2010 – Gross annual
earnings (SES)
Source: SES.
Figure 8: Changes in inequality between 2006 and 2010 – Gross monthly
earnings (SES)
Source: SES.

Income Inequality: Wage Dispersion in the EU
_________________________________________________________________________
PE 536.294 37
Figure 9: Changes in inequality between 2006 and 2010 – Gross hourly
earnings (SES)
Source: SES.
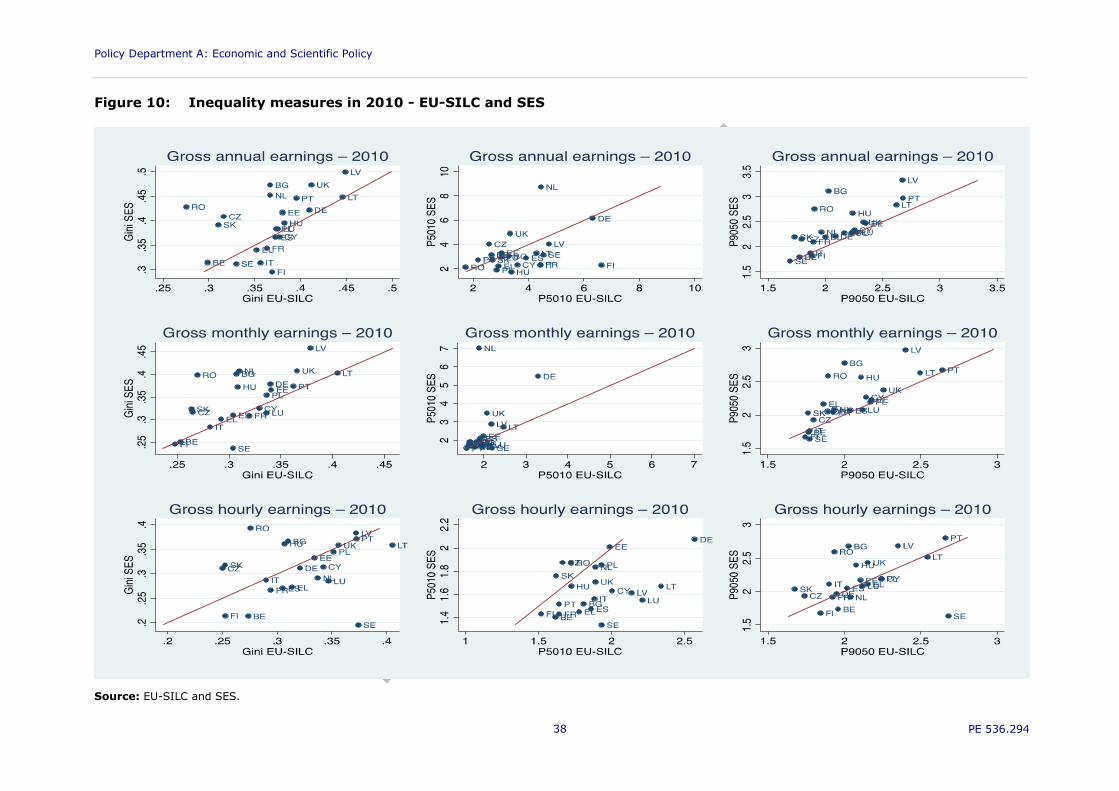
Policy Department A: Economic and Scientific Policy
PE 536.294 38
Figure 10: Inequality measures in 2010 - EU-SILC and SES
Source: EU-SILC and SES.
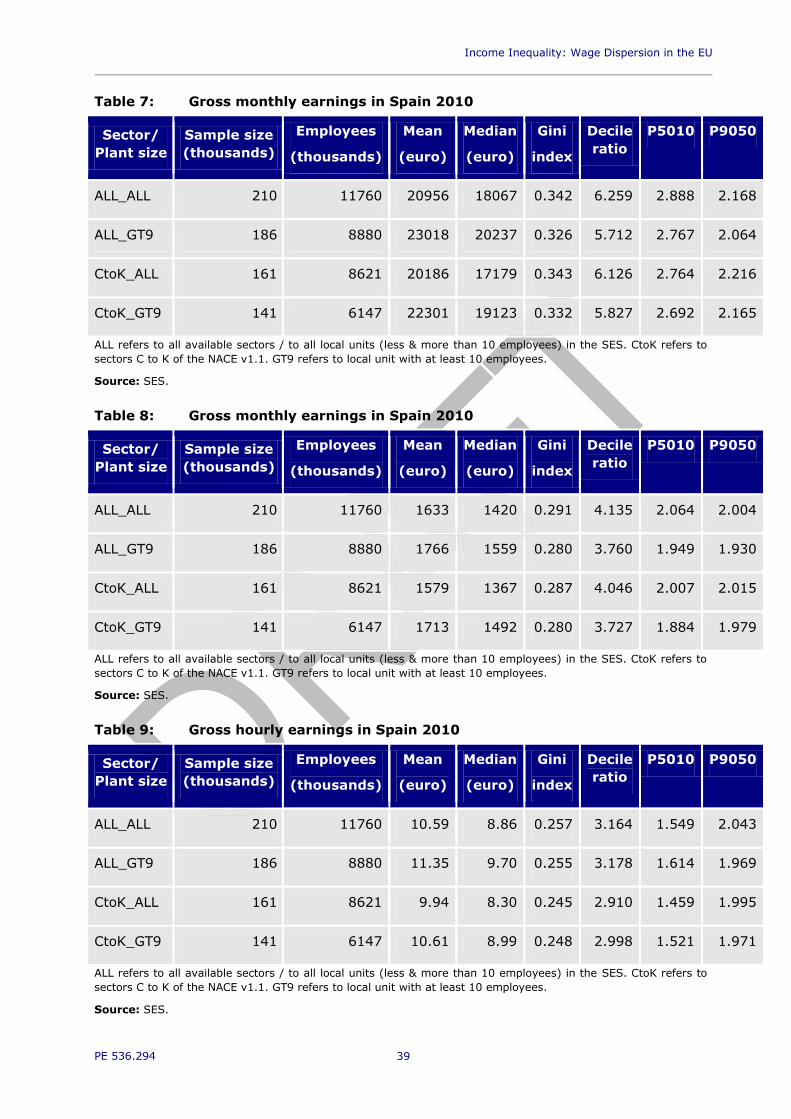
Income Inequality: Wage Dispersion in the EU
_________________________________________________________________________
PE 536.294 39
Table 7: Gross monthly earnings in Spain 2010
Sector/
Plant size
Sample size
(thousands)
Employees
(thousands)
Mean
(euro)
Median
(euro)
Gini
index
Decile
ratio
P5010 P9050
ALL_ALL 210 11760 20956 18067 0.342 6.259 2.888 2.168
ALL_GT9 186 8880 23018 20237 0.326 5.712 2.767 2.064
CtoK_ALL 161 8621 20186 17179 0.343 6.126 2.764 2.216
CtoK_GT9 141 6147 22301 19123 0.332 5.827 2.692 2.165
ALL refers to all available sectors / to all local units (less & more than 10 employees) in the SES. CtoK refers to
sectors C to K of the NACE v1.1. GT9 refers to local unit with at least 10 employees.
Source: SES.
Table 8: Gross monthly earnings in Spain 2010
Sector/
Plant size
Sample size
(thousands)
Employees
(thousands)
Mean
(euro)
Median
(euro)
Gini
index
Decile
ratio
P5010 P9050
ALL_ALL 210 11760 1633 1420 0.291 4.135 2.064 2.004
ALL_GT9 186 8880 1766 1559 0.280 3.760 1.949 1.930
CtoK_ALL 161 8621 1579 1367 0.287 4.046 2.007 2.015
CtoK_GT9 141 6147 1713 1492 0.280 3.727 1.884 1.979
ALL refers to all available sectors / to all local units (less & more than 10 employees) in the SES. CtoK refers to
sectors C to K of the NACE v1.1. GT9 refers to local unit with at least 10 employees.
Source: SES.
Table 9: Gross hourly earnings in Spain 2010
Sector/
Plant size
Sample size
(thousands)
Employees
(thousands)
Mean
(euro)
Median
(euro)
Gini
index
Decile
ratio
P5010 P9050
ALL_ALL 210 11760 10.59 8.86 0.257 3.164 1.549 2.043
ALL_GT9 186 8880 11.35 9.70 0.255 3.178 1.614 1.969
CtoK_ALL 161 8621 9.94 8.30 0.245 2.910 1.459 1.995
CtoK_GT9 141 6147 10.61 8.99 0.248 2.998 1.521 1.971
ALL refers to all available sectors / to all local units (less & more than 10 employees) in the SES. CtoK refers to
sectors C to K of the NACE v1.1. GT9 refers to local unit with at least 10 employees.
Source: SES.

Policy Department A: Economic and Scientific Policy
PE 536.294 40
Figure 11: Gini index by type of collective agreement – Gross hourly earnings
2010 (SES)
Source: SES.

Income Inequality: Wage Dispersion in the EU
_________________________________________________________________________
PE 536.294 41
Secondly, it can be argued that changes over time in the wage distribution, and
correspondingly in the mean and median wage and in any measure of inequality, result
from two possible sources. On the one hand, they may be caused by changes in the wage
structure, that is to say by differences over time in the wage earned by workers with a
given set of characteristics (level of education, age, occupation, sector of activity, type of
contract, type of collective agreement, etc). On the other, it may be the result of
modifications over the period in the endowment of these characteristics. For instance, the
share of salary workers in the construction sector in Spain decreased by 6 percentage
points between 2006 and 2010 (from 14 % to 8 % of the total number of employees in
sectors C to K). Such a change in the sectoral composition is likely to have affected the
distribution of wages regardless of the change in the salary paid to workers in that
particular sector.
The procedure applied to compute the counterfactual inequality measures for 2010 for
some Member States from the SES dataset is described in box 3.1. In particular, we have
selected two group of countries: On the one hand, have been were obtained for Greece,
Portugal and Spain and, on the other, for Germany and UK. It is worthwhile noting that the
procedure to compute the reweighting factor requires that the same set of characteristics,
and categories within each characteristic, were available for the two years. Lack of
correspondence in the coding of some key characteristics between the samples for 2002
and those for 2006 and 2010 made impossible to compute counterfactual measures for
2002. Actually, this drawback also affected the analysis for 2010, as information for some
characteristics is not available for one of the years for some countries. The set of
characteristics included in X were gender, age, level of education, tenure, full or part-time
work, type of contract, occupation, management or supervision role, sector of activity, type
of control of the enterprise, type of collective agreement4. Lack of information on the size
of the firm in the CD version of the SES dataset prevented us from controlling for this
characteristic, which is an important shortcoming in those cases in which wage earners in
micro-firms (1 to 9 employees) were included in the sample of 2010 but not in
that of 2006.
4 Some of the characteristics were not included in the analysis for some countries due to lack of information
(as a result of the process of anonymization). In essence, we had this problem with the type of control, type of
collective agreement, and role of management or supervision.
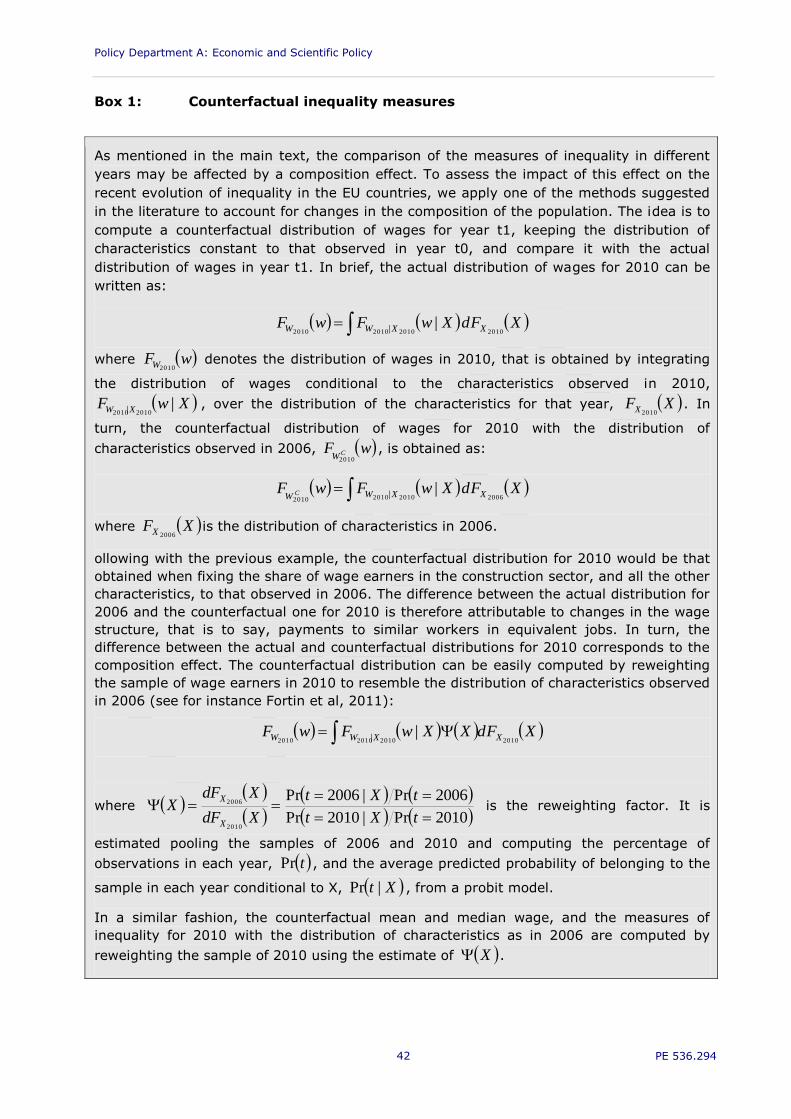
Policy Department A: Economic and Scientific Policy
PE 536.294 42
Box 1: Counterfactual inequality measures
As mentioned in the main text, the comparison of the measures of inequality in different
years may be affected by a composition effect. To assess the impact of this effect on the
recent evolution of inequality in the EU countries, we apply one of the methods suggested
in the literature to account for changes in the composition of the population. The idea is to
compute a counterfactual distribution of wages for year t1, keeping the distribution of
characteristics constant to that observed in year t0, and compare it with the actual
distribution of wages in year t1. In brief, the actual distribution of wages for 2010 can be
written as:
XFdXwFwF XXWW 2010201020102010||
where wFW2010 denotes the distribution of wages in 2010, that is obtained by integrating
the distribution of wages conditional to the characteristics observed in 2010,
XwF XW |20102010|
, over the distribution of the characteristics for that year, XFX2010. In
turn, the counterfactual distribution of wages for 2010 with the distribution of
characteristics observed in 2006, wF CW2010
, is obtained as:
XFdXwFwF XXWW C2006201020102010
||
where XFX 2006is the distribution of characteristics in 2006.
ollowing with the previous example, the counterfactual distribution for 2010 would be that
obtained when fixing the share of wage earners in the construction sector, and all the other
characteristics, to that observed in 2006. The difference between the actual distribution for
2006 and the counterfactual one for 2010 is therefore attributable to changes in the wage
structure, that is to say, payments to similar workers in equivalent jobs. In turn, the
difference between the actual and counterfactual distributions for 2010 corresponds to the
composition effect. The counterfactual distribution can be easily computed by reweighting
the sample of wage earners in 2010 to resemble the distribution of characteristics observed
in 2006 (see for instance Fortin et al, 2011):
XFdXXwFwF XXWW 2010201020102010||
where
2010Pr|2010Pr
2006Pr|2006Pr
2010
2006
tXt
tXt
XdF
XdFX
X
X is the reweighting factor. It is
estimated pooling the samples of 2006 and 2010 and computing the percentage of
observations in each year, tPr , and the average predicted probability of belonging to the
sample in each year conditional to X, Xt |Pr , from a probit model.
In a similar fashion, the counterfactual mean and median wage, and the measures of
inequality for 2010 with the distribution of characteristics as in 2006 are computed by
reweighting the sample of 2010 using the estimate of X .

Income Inequality: Wage Dispersion in the EU
_________________________________________________________________________
PE 536.294 43
Results for the selected countries are reported in Tables 10 to 12, which include the
measures for the actual distribution of wages in 2006 and 2010 and for the counterfactual
distribution for the latter year. They reveal that the impact on inequality of the composition
effect varies by country. In Greece, the counterfactual annual mean wage in 2010 is a bit
above the actual value whereas the opposite is observed for the median wage, which
indicates that changes in the distribution of characteristics affected most workers with
extreme wages. It is also observed that the composition effect accounted for a part of the
decrease in inequality in the annual wage between 2006 and 2010. The Gini index had
been equal to 0.362 if the distribution of characteristics would have been as that of 2006.
This value is somewhat higher than the actual one (0.340). The same applies to the other
measures of inequality. Still, most of the reduction in inequality is not explained by changes
in the distribution of characteristics, suggesting that it was caused by modifications in the
wage structure. Interestingly, the reduction in the percentage of low-wage workers
between 2006 and 2010 seems to be fully due to the composition effect. Results for Greece
also indicate that the impact of the composition effect on the evolution of inequality differs
for annual, monthly and hourly wages, as the pattern described for annual wages is not
observed for the other two measures of wages. Actually, broadly speaking one can say that
the amount of inequality remained stable in the period under analysis when measured in
terms of monthly and hourly wages, and that the composition effect was neutral.
Results for Portugal and Spain on the impact of composition on inequality have quite a lot
in common, and differ from the case of Greece. In these two countries, the change in the
distribution of characteristics contributed to increase both the mean and median wage, and
to increase the amount of inequality. Actually, the Gini index for the counterfactual annual
wage in Portugal would have been similar to that observed in 2006 if the distribution of
characteristics had remained constant (0.414 versus 0.419). Since this was not the case,
the effect is an increase in inequality originated by the composition effect. A similar picture
is observed in the case of the other measures of wages, and for Spain.
Finally, the evidence for Germany and UK confirms that the impact of the composition
effect in the period under analysis is country specific. Although the changes in the
distribution of characteristics had an effect, although moderate, on the mean and median
wages, they did not affect inequality in a significant way. In the case of Germany, the Gini
index for the actual and counterfactual annual wage distribution in 2010 equals 0.422 and
0.426 respectively. Negligible differences are also observed for monthly and hourly wages,
in the Gini index, in the percentile ratios, and in the ratio of low-wage workers when
working with hourly wages. Similar conclusions are reached from the Figures for UK.
All in all, the main conclusion from this analysis is that the composition effect is likely to
explain a portion of the change in wage inequality, and that the impact is likely to vary
across countries and even time periods. Therefore, the study of the effect of the labour
market policies and institutions on wage inequality in Section 5 should control somewhat
for changes in the composition of the wage earners population.

Policy Department A: Economic and Scientific Policy
PE 536.294 44
Table 10: Inequality measures for factual and counterfactual annual wages
Country Year Mean
(euro)
Median
(euro)
Gini
index
Decile
ratio P5010 P9050
EL 2006 22511 15908 0.430 5.542 2.388 2.321
2010 22938 18727 0.340 4.902 2.231 2.197
2010 c 23065 18450 0.362 5.253 2.376 2.211
PT 2006 13821 9632 0.414 5.579 1.984 2.813
2010 14802 10089 0.445 8.202 2.762 2.970
2010 c 14454 10007 0.419 5.822 2.084 2.793
ES 2006 17923 14454 0.381 6.776 2.894 2.341
2010 20752 17179 0.366 6.635 2.906 2.283
2010 c 18696 16190 0.345 5.908 2.870 2.058
DE 2006 30457 27169 0.411 14.227 6.708 2.121
2010 30798 26815 0.422 13.602 6.157 2.209
2010 c 30393 26510 0.426 13.882 6.339 2.190
UK 2006 36089 27405 0.464 11.306 4.698 2.406
2010 30455 22734 0.473 12.221 4.907 2.490
2010 c 31033 22759 0.476 11.787 4.702 2.507
Source: SES 2006 and 2010.

Income Inequality: Wage Dispersion in the EU
_________________________________________________________________________
PE 536.294 45
Table 11: Inequality measures for factual and counterfactual monthly wages
Country Year Mean
(euro)
Median
(euro)
Gini
index
Decile
ratio P5010 P9050
EL 2006 1504 1205 0.302 3.521 1.617 2.177
2010 1702 1374 0.301 3.538 1.634 2.164
2010 c 1719 1360 0.308 3.475 1.600 2.172
PT 2006 1030 735 0.368 4.337 1.686 2.573
2010 1145 801 0.373 4.161 1.555 2.675
2010 c 1111 794 0.350 3.801 1.506 2.524
ES 2006 1459 1211 0.301 3.655 1.802 2.028
2010 1616 1367 0.310 4.337 2.097 2.069
2010 c 1507 1317 0.278 3.518 1.863 1.888
DE 2006 2434 2240 0.367 11.015 5.600 1.967
2010 2499 2238 0.379 11.260 5.485 2.053
2010 c 2465 2208 0.381 11.054 5.412 2.043
UK 2006 3060 2473 0.386 6.954 3.059 2.273
2010 2558 2027 0.408 8.258 3.478 2.374
2010 c 2597 2024 0.408 7.950 3.313 2.400
Source: SES 2006 and 2010.

Policy Department A: Economic and Scientific Policy
PE 536.294 46
Table 12: Inequality measures for factual and counterfactual hourly wages
Country Year Mean
(euro)
Median
(euro)
Gini
index
Decile
ratio P5010 P9050
Low wage
ratio
EL 2006 8.73 6.97 0.282 3.178 1.512 2.102 10.53 %
2010 10.24 8.20 0.272 3.066 1.454 2.109 7.78 %
2010 c 10.35 8.16 0.283 3.046 1.449 2.102 7.70 %
PT 2006 6.17 4.27 0.377 4.446 1.655 2.686 17.20 %
2010 6.97 4.69 0.372 4.256 1.518 2.804 10.99 %
2010 c 6.60 4.56 0.359 3.928 1.485 2.645 8.49 %
ES 2006 8.98 7.26 0.274 3.002 1.476 2.034 9.07 %
2010 10.27 8.30 0.270 3.027 1.477 2.049 8.87 %
2010 c 9.41 7.86 0.241 2.644 1.406 1.880 6.13 %
DE 2006 16.01 13.93 0.310 4.079 2.088 1.953 23.63 %
2010 16.69 14.51 0.311 4.080 2.073 1.968 23.97 %
2010 c 16.14 13.85 0.316 4.105 2.052 2.001 23.48 %
UK 2006 19.29 14.54 0.349 4.161 1.754 2.372 21.50 %
2010 16.51 12.10 0.358 4.163 1.710 2.434 20.89 %
2010 c 16.53 11.91 0.365 4.146 1.675 2.475 19.61 %
Source: SES 2006 and 2010.

Income Inequality: Wage Dispersion in the EU
_________________________________________________________________________
PE 536.294 47
4. LABOUR MARKET INSTITUTIONS
KEY FINDINGS
Our analysis of labour market institutions mainly relies on the ICTWSS database
providing annual information on institutional characteristics of the wage setting
process for the period 1960-2011. One of the main advantages of this dataset is
that it provides homogeneous information on the main variables related to wage
bargaining, like union density, bargaining coverage rates, wage bargaining level,
and coordination. However, as a drawback, significant gaps in the data occur and
interpolation techniques have been used to fill them. Data on minimum wages and
tax wedges has been obtained from Eurostat.
Union density and bargaining coverage rates have declined between 2004 and
2010 in most EU countries. The level of wage bargaining has remained mainly
stable with predominant decentralised or intermediate bargaining levels. In some
countries like Ireland or the Netherlands, recent reforms have implied a further
decentralization of collective bargaining. Regarding coordination, there is no clear
pattern both in terms of the picture at the end of the period but also in terms of
recent reforms.
Real minimum wages have recently increased in most EU countries, although the
picture is far from homogeneous across countries and over time. Countries with
higher wage bargaining levels experienced moderate increases of minimum wages
or even decreases over the last years (Luxembourg and the Netherlands), while
countries with average or low wage bargaining levels saw minimum wages with
important increases: Bulgaria, Estonia, Latvia and Romania had annual growth
rates over 5 %, while Greece, Portugal and Spain experienced average increases
around 1 %. If we look at minimum wages relative to average and median wages,
the evolution of such ratios has been markedly countercyclical as far as the ratios
decrease between 2005 and 2008 in half of the considered countries, while only
two (the Czech Republic and the Netherlands) experienced such decreased
between 2008 and 2010. Countries seriously affected by the economic crisis
experienced a strong decrease in actual wages, what has resulted in a relative
increase of the minimum to average (median) wage ratio. Thus, the great
recession has affected minimum wages by lowering its real purchasing power,
particularly in the more recent periods.
The ICTWSS database comprises annual data on institutional characteristics of
the wage setting process. Important characteristics refer to the role of trade unions,
state intervention practices as well as the availability and scopes of social pacts in all EU
member countries. The data of the current version cover the period from1960 to 2011. See
Visser (2013) for a detailed exposition. Because of the time series dimension, dynamic
effects can be investigated. Wage setting institutions may affect wage inequality, but
probably not instantaneously. If there is a significant delay, a static analysis can lead to
wrong conclusions. The series are comparable across countries. Hence, the empirical
analysis can be based on panel data. This can promote the identification of common and
idiosyncratic, i.e. country specific drivers of the evolution and could increase the efficiency
of the econometric estimates. As a drawback, not all variables are available over the entire
observation period. Significant gaps in the data occur, since some series are missing at all
for some countries or are not reported at the desired frequency. For example, the level of

Policy Department A: Economic and Scientific Policy
PE 536.294 48
collective bargaining coverage is typically observed only at the five year interval even for
the large European countries. In the following discussion, some series in the database are
described in higher detail.
Trade unions are of central importance to describe the structure of wage setting.
The power of unions is reflected in both union membership (union density) and the degree
of coverage of collective bargained contracts. Both measures need to be considered to
determine the impact of unions on wage dispersion. Union density is the percentage of
union members to wage and salary earners employed. A net concept is applied, where
union members outside the active, dependent and employed labour force such as retired
workers, self-employed, unemployed or students are excluded. In general, a disaggregated
perspective could be beneficial to provide deeper insights. For instance, union membership
can vary with the age of workers, gender, sectors or characteristics embedded in the
working contract (permanent or temporary, part time or fulltime work etc.). Although a
larger differentiation is envisaged, the information is still not available.
Bargaining coverage is the other aspect of union strength and focuses on the
proportion of employees to whom a collective agreement signed by a union or worker
representative and the employer or the association of the employers actually applies. In
fact, contracts on wages and other conditions such as working hours often bind not only the
bargaining parties, but also employers and employees within a region or sector. It has
become common practice for the vast majority of employers to apply the terms and
conditions of collective contracts to their workforce as a whole, whether unionised or not.
Administrative extensions can make collective agreements more binding within a
sector, and cover employers who did not really sign the contract. As coverage is a
combined result related to the organization and action of unions, it might be the more
adequate measure than density rates to describe the relevance of collective bargaining in
the economy.
Only a few countries located in Northern Europe (Finland, Sweden, Denmark)
show high rates in both unionisation and bargaining coverage. However, low
unionisation coupled with high bargaining coverage is the more common outcome. For
example, density rates in France and Spain are lower than in Northern Europe, but this
measure largely underestimates the role of trade unions in the wage setting process, as
coverage rates are still rather high (over 80 % on average in Spain and 90 % in France).
Note that data quality is usually higher for densities than for coverage rates. Figure 11
exhibits the evolution of density and coverage ratios for the large euro area Member
States, while Figure 12 displays the recent evolution across all EU countries with available
information. Union density rates experienced a huge decline over the last decades, it has
been particularly strong for some new EU countries together with Sweden and Austria. On
the contrary, coverage rates have remained quite stable, at least for some of the larger
countries in the euro area. A decrease is observed for Germany after the unification,
partially driven by the lower role of trade unions in the Eastern part of the country, and for
Spain and Slovakia. As a complement to the role of unions, data on the structure of
working councils is provided.
The process of wage formation is further described by the prevailing approach
under which bargaining is done at the side of employers. In the single employer
model, each employer negotiates independently. Multi-employer bargaining systems
combine different employers in associations that have a mandate to conduct negotiations
and make binding decisions on behalf of their members. The latter system might have
advantages if sectors face low wage competition. It can keep distributional conflict out of
the workplace and could save transaction costs, especially for small and medium sized
firms. As a disadvantage, wage agreements may not fully reflect the individual conditions
Income Inequality: Wage Dispersion in the EU
_________________________________________________________________________
PE 536.294 49
under which a particular firm operates. If multilevel bargaining is dominant bargaining
coverage rates are usually high (Visser, 2013). Therefore, coverage rates can be also seen
as an indicator to describe the organization of bargaining on the side of employers. Figure
14 displays the distribution of the level of wage bargaining on a 1-5 scale (the larger the
more centralised system of wage bargaining). Most countries display low levels of
centralisation of wage bargaining, as a result of institutional changes over the last 30 years
towards a more decentralised system. Few changes have been observed since 2004, but all
of them have affected countries with moderate or high levels of centralisation. These
changes have been heterogeneous, and consequently we cannot derive a particular trend
over the last years.
Bargaining coordination is devoted to the predominant mechanisms of wage
spillovers in the economy and refers to wage leadership. It comprises the behaviour
of different actors in the wage formation process, i.e. whether bargaining is centralized by
peak associations, whether it is done at the national, sectoral or company level or whether
the government is involved. The state can participate in several areas. Governments can
introduce certain standards for private sector wages, working hours or other conditions, set
minimum wages and provide mechanisms for conflict resolutions. By extending collective
agreements to all employers or all employees who are not members of the parties of the
negotiations, the legislator could support multi-employer bargaining. If extensions are often
used, high rates of bargaining coverage should be expected.
Opening clauses allow firms to deviate from centralised agreements. For example,
the bargaining parties might agree on temporary downward pay variations or a reduction of
working hours. The availability of these clauses introduces more decentralisation in the
wage setting process, although their adaptability is limited by the favourability principle.
According to this rule, deviations from collective contracts should be in favour of the
employees. See Figure 15 for the extent of bargaining coordination and government
intervention in the largest euro area economies, and Figure 16 for recent evolution across
all EU countries. Both variables are reported at a rank scale, where larger entries in the
[1,5] interval refer to higher coordination or involvement of the government, respectively.
There is a large diversity in coordination systems in Europe. Smaller northern European
countries like Belgium, Denmark and Austria, traditionally have a more coordinated system.
At the opposite extreme, with a fragmented wage bargaining system we find the Baltic
countries plus the United Kingdom and Poland. As for the government intervention in wage
bargaining, there is a wide diversity, although most countries display moderate or low
levels of government intervention. Few countries display permanent levels of high
government intervention (Belgium, Finland and Slovenia). In most countries these
indicators do not show much time variation (in fourteen out of 27 countries there has been
no change since 2000 in coordination, and 9 in government intervention). As for
coordination, Finland, Germany, Spain, Luxemburg and dramatically Greece (from a mixed
industry and firm-level bargaining to a centralized bargaining system in 2010) changed
towards a more coordinated system, while Slovakia, Slovenia and Ireland changed towards
a more fragmented system. As for government intervention, the changes have been
parallel to the economic crisis: Greece, Portugal and Spain moved from an average Figure
towards the maximum between 2009 and 2011. Increases can be also observed in
Lithuania. At the opposite site we find Romania: from an index of 5 in 2000 to 1 in 2011.
Three other countries decreased this level since 2000: Germany, Czech Republic
and Ireland.
ICTWSS permits to distinguish whether or not a mandatory minimum wage exists in the
entire economy or at the sectoral level; and how the respective decisions are made.
Measures reflect the degree of government intervention in setting the minimum wage, the
degree to which the government is bound in its decisions by unions and employer

Policy Department A: Economic and Scientific Policy
PE 536.294 50
organizations, whether or not an expert committee is involved in determining the
appropriate level and the application of index based rules. For example, minimum wages
might be linked to the evolution of prices to ensure a desired level in real terms. The data
refer to the organizational aspects of the minimum wage, but not to its level relative to the
median or wages at a certain quintile of the distribution. Similar to other variables, not
much variation is detected for the respective series. The database also includes information
on the negotiation and signing of social pacts and whether the government, trade unions
and employer organizations are involved. The scope of pacts is also recorded, i.e whether
they are dealing with wages or non-wage related issues, such as working hours,
employment policies, employment protection, training measures and pensions.
Minimum wages increased in Europe, although the picture is far from
homogeneous across countries and over time
Information on minimum wages can be obtained at Eurostat. In real terms (adjusting for
PPP and in euros referred to 2005) minimum wages increased in Europe, although the
picture is far from homogeneous across countries and over time (see Figure 17). Countries
with higher wage levels experienced moderate increases of minimum wages or even
decreases over the last years (Luxembourg and the Netherlands), while countries with
average or low wage levels saw minimum waged with important increases: Bulgaria,
Estonia, Latvia and Romania had annual growth rates over 5 %, while Greece, Portugal and
Spain experienced average increases around 1 %. This evolution, though, was not
homogeneous over time. High income countries experienced the decrease in real minimum
wages before the crisis started, with a subsequent increase. On the contrary, other
countries, like France, Spain, Greece, had negative growth rates in recent periods. Indeed,
12 out of 20 countries had negative growth rates or real minimum wages in 2012.
Countries seriously affected by the economic crisis experienced a strong decrease
in actual wages
Figure 18 summarises the evolution of minimum wages relative to average and median
wages. As far as the information on current wages is only available until 2010 we refer our
comments until that period. The minimum to average (median) wage ratio is between 33 %
(38 %) and 53 % (62 %) in 2010, being larger in France, Portugal, Hungary, Lithuania and
Poland (above 50 % to the median ratio) and smaller in the Czech Republic and in the
Netherlands (below 40 % to the median ratio). The evolution of such ratios has been
markedly countercyclical as far as the ratios decreased between 2005 and 2008 in half of
the considered countries, while only two (the Czech Republic and the Netherlands)
experienced such decreased between 2008 and 2010. Countries seriously affected by the
economic crisis experienced a strong decrease in actual wages, what has resulted in a
relative increase of the minimum to average (median) wage ratio. Thus, the great recession
has affected minimum wages by lowering its real purchasing power, particularly in the
more recent periods, but at the same time they have been less damaged than the rest of
the wage distribution in most countries.
More details on each of the institutions described can be found in Annex 4.

Income Inequality: Wage Dispersion in the EU
_________________________________________________________________________
PE 536.294 51
Figure 12: Union density and bargaining coverage rates. Long-term evolution in
selected EU countries
0
20
40
60
80
100
Germany France Italy
1980 1990 2000 2010
Source: ICTWSS database (Visser, 2013). Net union density rates in the upper, bargaining coverage rates in
the lower part. The latter are adjusted for the possibility that some sectors or occupations are excluded from
the right to bargain.
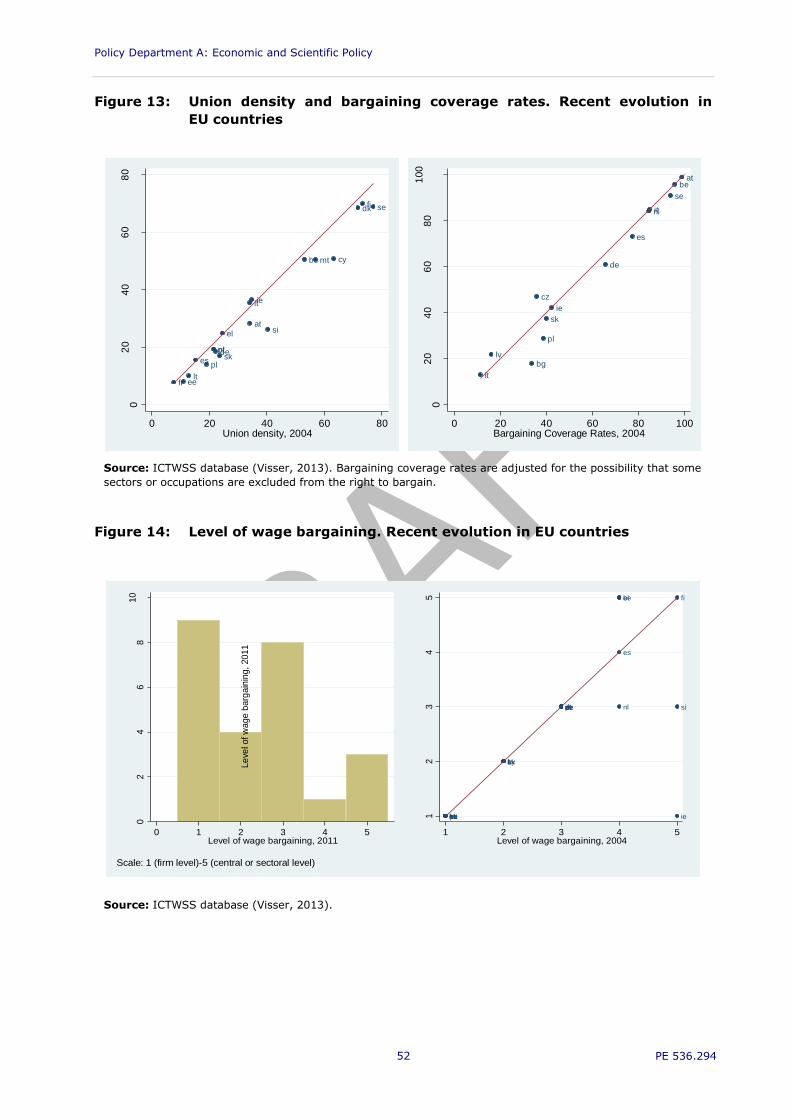
Policy Department A: Economic and Scientific Policy
PE 536.294 52
Figure 13: Union density and bargaining coverage rates. Recent evolution in
EU countries
at
be cy
de
dk
ee
el
es
fi
fr
ieit
lt
mt
nl
pl
pt
se
si
sk
02
04
06
08
0
Un
ion
de
nsity,
20
10
0 20 40 60 80Union density, 2004
atbe
bg
cz
de
es
ie
it
lt
lv
nl
pl
se
sk
02
04
06
08
01
00
Ba
rga
inin
g C
ove
rag
e R
ate
s,
20
10
0 20 40 60 80 100Bargaining Coverage Rates, 2004
Source: ICTWSS database (Visser, 2013). Bargaining coverage rates are adjusted for the possibility that some
sectors or occupations are excluded from the right to bargain.
Figure 14: Level of wage bargaining. Recent evolution in EU countries
02
46
810
Fre
qu
ency
0 1 2 3 4 5Level of wage bargaining, 2011
at
be
cy
cz
dedk
ee
el
es
fi
fr
hu ie
it
lt
lu
lvmt
nl
pl
ptse si
sk
uk12
34
5
Le
vel o
f w
age b
arg
ain
ing,
2011
1 2 3 4 5Level of wage bargaining, 2004
Scale: 1 (firm level)-5 (central or sectoral level)
2004-2011
Level of wage bargaining
Source: ICTWSS database (Visser, 2013).
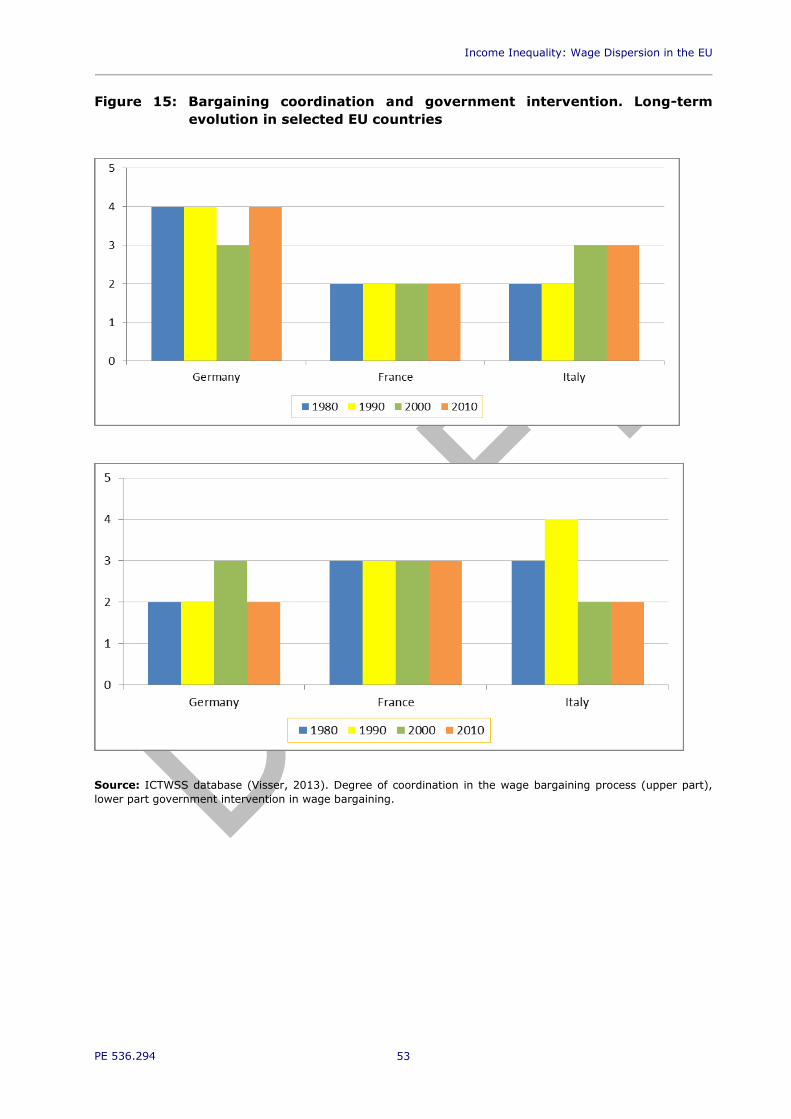
Income Inequality: Wage Dispersion in the EU
_________________________________________________________________________
PE 536.294 53
Figure 15: Bargaining coordination and government intervention. Long-term
evolution in selected EU countries
Source: ICTWSS database (Visser, 2013). Degree of coordination in the wage bargaining process (upper part),
lower part government intervention in wage bargaining.
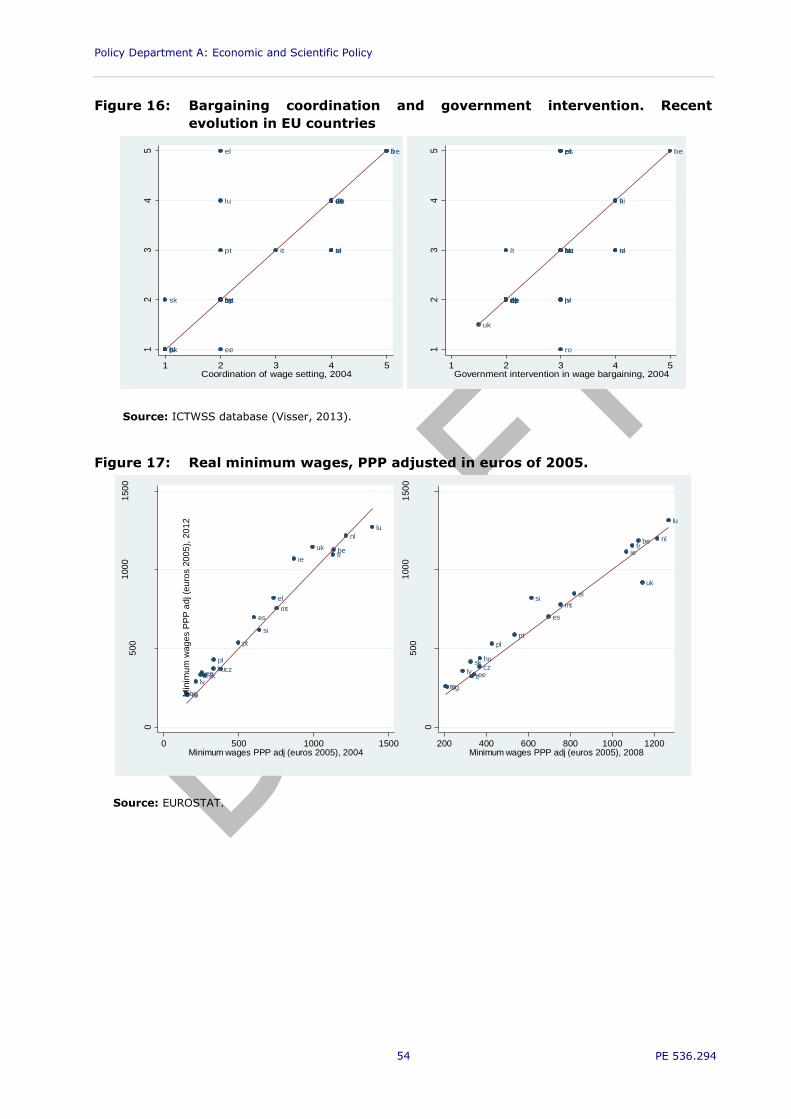
Policy Department A: Economic and Scientific Policy
PE 536.294 54
Figure 16: Bargaining coordination and government intervention. Recent
evolution in EU countries
at
be
cycz
dedk
ee
el
es
fi
frhu
ieit
lt
lu
lv
mt
nl
pl
pt
se
si
sk
uk12
34
5
Coo
rdin
atio
n o
f w
ag
e s
ett
ing,
20
11
1 2 3 4 5Coordination of wage setting, 2004
at
be
cyczdedkee
eles
fi
frhu ie
it
lt lu
lv
mt nl
pl
pt
ro
se
si
sk
uk
12
34
5
Go
vern
men
t in
terv
en
tion in w
ag
e b
arg
ain
ing
, 2
01
1
1 2 3 4 5Government intervention in wage bargaining, 2004
Source: ICTWSS database (Visser, 2013).
Figure 17: Real minimum wages, PPP adjusted in euros of 2005.
be
bg
czee
el
es
fr
hu
ie
lt
lu
lv
mt
nl
pl
pt
ro
si
sk
uk
0
500
100
01
50
0
Min
imu
m w
ag
es P
PP
ad
j (e
uro
s 2
00
5),
20
08
0 500 1000 1500Minimum wages PPP adj (euros 2005), 2004
be
bg
czee
el
es
fr
hu
ie
lt
lu
lv
mt
nl
pl
pt
ro
si
sk
uk
0
500
100
01
50
0
Min
imu
m w
ag
es P
PP
ad
j (e
uro
s 2
00
5),
20
12
200 400 600 800 1000 1200Minimum wages PPP adj (euros 2005), 2008
Changes over 2004-2008-2012
Real Minimum Wages
Source: EUROSTAT.

Income Inequality: Wage Dispersion in the EU
_________________________________________________________________________
PE 536.294 55
Figure 18: Real minimum wages, relative to average and median wages.
be
cz
ee
es
fr
hu
lt
lu
nl
pl
si
sk
uk
.3.3
5.4
.45
.5.5
5
Min
imu
m r
ela
tive
to a
ve
rage
wag
es, 2
010
.3 .35 .4 .45 .5 .55Minimum relative to average wages, 2005
be
cz
ee
es
fr
hu
lt
lu
nl
pl
si
sk
uk
.4.5
.6.7
Min
imu
m r
ela
tive
to m
ed
ian
wa
ges,
201
0
.4 .5 .6 .7Minimum relative to median wages, 2005
Changes over 2005-2010
Minimum relative Wages
Source: EUROSTAT.
Tax wedges experienced a differentiated effect before and after the start of the
Great Recession.
Finally, we include the analysis of tax wedges, a policy directly affecting the labour market.
Over the considered period tax wedges experienced a differentiated effect before and after
the start if the Great Recession. Thus, most European countries experienced a decline of
taxes on gross wage earnings between 2004 and 2008. On the contrary, after that date it
experienced an increase which was particularly important in countries particularly hitted by
the crisis, like Spain, Greece, Latvia and specially Ireland where, in any case, remained well
below the average of the rest of the EU. It has to be stressed in any case that after 2008
several countries decreased the level of this taxes: Bulgaria, Sweden, Slovenia and the
United Kingdom.

Policy Department A: Economic and Scientific Policy
PE 536.294 56
5. WAGE DISPERSION AND LABOUR MARKET
INSTITUTIONS
KEY FINDINGS
In order to analyse the impact of labour market institutions on wage dispersion, we
have specified a panel data econometric model in line with previous literature
where different measures of inequality (y) are related to a set of control variables
(x), measures of globalisation (g), technological change (t) and policy indicators
(p), which include labour market institution.
The basic results of estimating different versions of this model show a significant
impact of globalization although only in a few specifications, technological change
seem to impact the wage distribution. As expected, wage inequality is clearly pro-
cyclical with output gap and it is related to the industry mix. Improving competition
in regulated network sectors has also a robust influence in reducing wage
inequality. Regarding labour market institutions, we find a significant impact of
minimum wages on inequality, being stronger on the lower part of the distribution.
The wage bargaining level does not seem to have a robust influence in inequality
(a more centralized wage setting only increases inequality in hourly wages)
although this result could be related to the high persistence of collective bargaining
systems during the considered period. Union density and the bargaining coverage
rate reduce inequality but only when analysing hourly wages.
Skill biased technological change, the outsourcing of low skill tasks fastened by
globalization, and labour market institution affect inequality increases most.
Section 2 of the report reviewed the main factors behind recent increases in inequality in
developed countries. According to the evidence reported in the empirical literature, the
most important factors are the skill biased technological change, the outsourcing of low skill
tasks fastened by globalization, and labour market institution. Other potential determinants
include for instance, the fiscal system (trough taxes and transfers) and education. The
present section provides new evidence with recent data on the role of policy variables, with
a particular emphasis on labour market institutions.
The starting point of our analysis is previous OECD work (OECD, 2011 and Koske et al
2012), in which different measures of inequality (Y) are related to a set of control variables
(X), measures of globalisation (G), technological change (T) and policy indicators (P), which
include labour market institutions:
Yit = 0 + 1 Xit + 2 G it + 3 Tit + 4 Pit + i + t + it
Where i and t denote country and time, and i and t refer to cross country and time effects
to control for unobserved cross-country heterogeneity and unobserved time shocks
affecting all countries simultaneously.
Our inequality variables include the Gini Index, the 90/10, 90/50 and 50/10 percentiles
ratios, for annual, monthly and hourly wages, plus and the proportion of low wage earners,
computed at the annual level. The list of variables that will be considered in the analysis
include both policy variables, such as product market regulation measures or indices
measuring the strictness of employment protection legislation, and determinants of
inequality as identified in the literature review, such as globalization and technological
change indicators, and finally traditional controls, such as gender and sectoral composition
of the labour market. In particular, we have collected information on the following

Income Inequality: Wage Dispersion in the EU
_________________________________________________________________________
PE 536.294 57
variables:
Globalization
Trade openness
Total assets as a share of GDP
Total liabilities as a share of GDP
Human Capital and Technological Change
Patent applications to the European Patent Office Doctorate students in science and
technology fields – Total
Human resources in science and technology as a share of labour force – Total
Persons with upper secondary or tertiary education attainment
Policy variables
Regulation in network sectors (energy, transport and communications) (PMR)
Economy-wide Product Market Regulation (PMR) - interpolation
Tax wedge
Control variables
Output Gaps - HP Filter
Output Gaps - PF method
Employment share in agriculture
Employment share in industry
Female employment share
Labour market policy variables
Employment rate (15 to 64 years)
Employment rate (15 to 64 years), females
Part-time workers in % of total employment
Part-time workers in % of total employment, Females
Percentage of employees with temporary contracts
Percentage of employees with temporary contracts, Females
Strictness of employment protection for individual and collective dismissals (regular
contracts)
Temporary employment protection
Other variables at the collected data set
Gross domestic product at market prices
GDP per capita, PPP adjusted
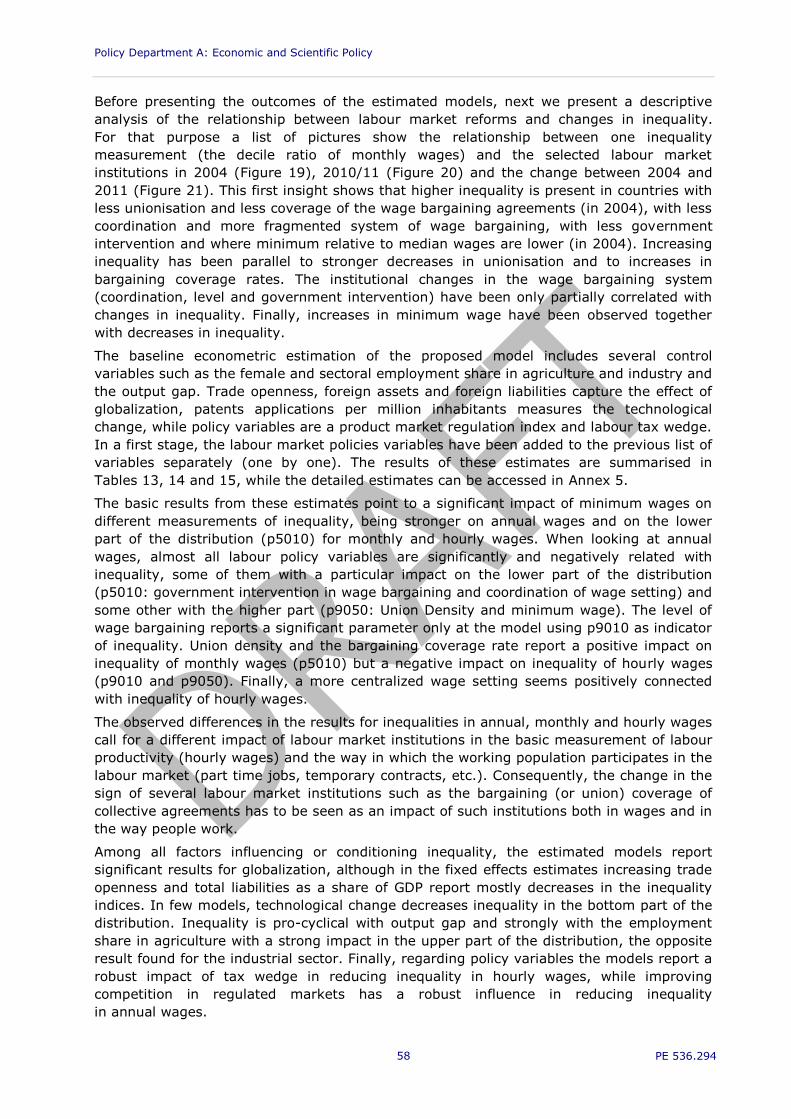
Policy Department A: Economic and Scientific Policy
PE 536.294 58
Before presenting the outcomes of the estimated models, next we present a descriptive
analysis of the relationship between labour market reforms and changes in inequality.
For that purpose a list of pictures show the relationship between one inequality
measurement (the decile ratio of monthly wages) and the selected labour market
institutions in 2004 (Figure 19), 2010/11 (Figure 20) and the change between 2004 and
2011 (Figure 21). This first insight shows that higher inequality is present in countries with
less unionisation and less coverage of the wage bargaining agreements (in 2004), with less
coordination and more fragmented system of wage bargaining, with less government
intervention and where minimum relative to median wages are lower (in 2004). Increasing
inequality has been parallel to stronger decreases in unionisation and to increases in
bargaining coverage rates. The institutional changes in the wage bargaining system
(coordination, level and government intervention) have been only partially correlated with
changes in inequality. Finally, increases in minimum wage have been observed together
with decreases in inequality.
The baseline econometric estimation of the proposed model includes several control
variables such as the female and sectoral employment share in agriculture and industry and
the output gap. Trade openness, foreign assets and foreign liabilities capture the effect of
globalization, patents applications per million inhabitants measures the technological
change, while policy variables are a product market regulation index and labour tax wedge.
In a first stage, the labour market policies variables have been added to the previous list of
variables separately (one by one). The results of these estimates are summarised in
Tables 13, 14 and 15, while the detailed estimates can be accessed in Annex 5.
The basic results from these estimates point to a significant impact of minimum wages on
different measurements of inequality, being stronger on annual wages and on the lower
part of the distribution (p5010) for monthly and hourly wages. When looking at annual
wages, almost all labour policy variables are significantly and negatively related with
inequality, some of them with a particular impact on the lower part of the distribution
(p5010: government intervention in wage bargaining and coordination of wage setting) and
some other with the higher part (p9050: Union Density and minimum wage). The level of
wage bargaining reports a significant parameter only at the model using p9010 as indicator
of inequality. Union density and the bargaining coverage rate report a positive impact on
inequality of monthly wages (p5010) but a negative impact on inequality of hourly wages
(p9010 and p9050). Finally, a more centralized wage setting seems positively connected
with inequality of hourly wages.
The observed differences in the results for inequalities in annual, monthly and hourly wages
call for a different impact of labour market institutions in the basic measurement of labour
productivity (hourly wages) and the way in which the working population participates in the
labour market (part time jobs, temporary contracts, etc.). Consequently, the change in the
sign of several labour market institutions such as the bargaining (or union) coverage of
collective agreements has to be seen as an impact of such institutions both in wages and in
the way people work.
Among all factors influencing or conditioning inequality, the estimated models report
significant results for globalization, although in the fixed effects estimates increasing trade
openness and total liabilities as a share of GDP report mostly decreases in the inequality
indices. In few models, technological change decreases inequality in the bottom part of the
distribution. Inequality is pro-cyclical with output gap and strongly with the employment
share in agriculture with a strong impact in the upper part of the distribution, the opposite
result found for the industrial sector. Finally, regarding policy variables the models report a
robust impact of tax wedge in reducing inequality in hourly wages, while improving
competition in regulated markets has a robust influence in reducing inequality
in annual wages.

Income Inequality: Wage Dispersion in the EU
_________________________________________________________________________
PE 536.294 59
Figure 19: Inequality and labour market institutions, 2004
at
be
cy
cz
de
dk
ee
fi
fr
hu
ielt lu
nl
pl
se
sisk
23
45
6
p90/1
0,
2004
0 20 40 60 80Union density, 2004
at
be
cy
cz
de
dk
ee
fi
fr
hu
ielt lu
nl
pl
se
sisk
23
45
6
p90/1
0,
2004
0 20 40 60 80 100Bargaining Coverage Rates, 2004
at
be
cy
cz
de
dk
ee
fi
fr
hu
ielt lu
nl
pl
se
sisk
uk
23
45
6
p90/1
0,
2004
1 2 3 4 5Coordination of wage setting, 2004
at
be
cy
cz
de
dk
ee
fi
fr
hu
ielt lu
nl
pl
se
sisk
uk
23
45
6
p90/1
0,
2004
1 2 3 4 5Gov intervention in wage barg, 2004
at
be
cy
cz
de
dk
ee
fi
fr
hu
ielt lu
nl
pl
se
sisk
uk
23
45
6
p90/1
0,
2004
1 2 3 4 5Level of wage bargaining, 2004
be
cz
ee
fr
hu
ie ltlu
nl
pl
sisk
uk
23
45
6
p90/1
0,
2004
.4 .5 .6 .7Minimum relative to median wages, 2004
2004
Inequality and Labour Market Institutions
Source: EU-SILC and ICTWSS.

Policy Department A: Economic and Scientific Policy
PE 536.294 60
Figure 20: Inequality and labour market institutions, 2010/2011
at
cy
de
dk
ee
el
es
fi
frit
lt
mt
nlpl
pt
se
si
sk
34
56
p90/1
0,
2011
0 20 40 60 80Union density, 2010
at
bg cz
de
es it
ltlv
nlpl
se
sk
34
56
p90/1
0,
2011
20 40 60 80 100Bargaining Coverage Rates, 2010
at
cy
cz
de
dk
ee
el
es
fi
frhu it
ltlu
lv
mt
nlpl
pt
se
si
sk
uk
34
56
p90/1
0,
2011
1 2 3 4 5Coordination of wage setting, 2011
at
cy
cz
de
dk
ee
el
es
fi
frhuit
ltlu
lv
mt
nlpl
pt
ro
se
si
sk
uk
34
56
p90/1
0,
2011
1 2 3 4 5Gov intervention in wage barg, 2011
at
cy
cz
de
dk
ee
el
es
fi
frhu it
ltlu
lv
mt
nlpl
pt
se
si
sk
uk
34
56
p90/1
0,
2011
1 2 3 4 5Level of wage bargaining, 2011
bgcz
ee
el
esfr
hu
ltlu
lv
mt
nlpl
pt
rosi
sk
uk
34
56
p90/1
0,
2011
.4 .45 .5 .55 .6 .65Minimum relative to median wages, 2010
2010/11
Inequality and Labour Market Institutions
Source: EU-SILC and ICTWSS.
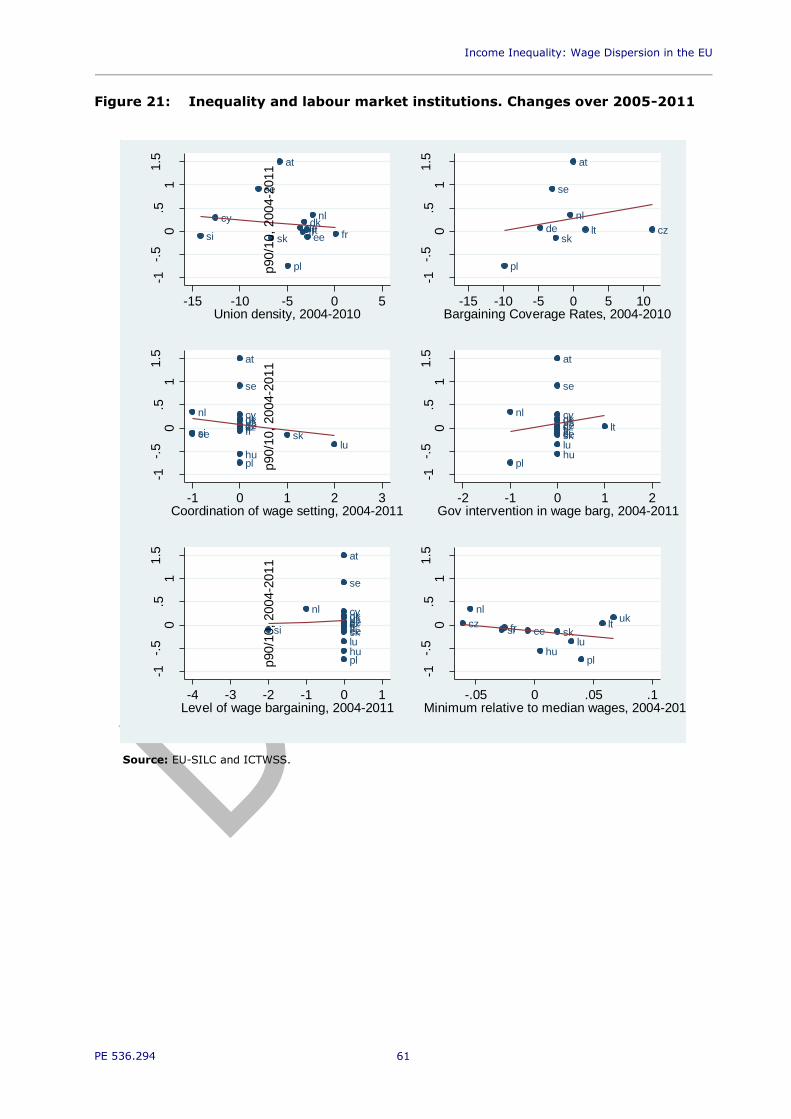
Income Inequality: Wage Dispersion in the EU
_________________________________________________________________________
PE 536.294 61
Figure 21: Inequality and labour market institutions. Changes over 2005-2011
at
cydedk
eefi frlt
nl
pl
se
si sk
-1-.
50
.51
1.5
p9010 2
004-2
011
-15 -10 -5 0 5Union density, 2004-2010
at
czde lt
nl
pl
se
sk
-1-.
50
.51
1.5
p90/1
0,
2004-2
011
-15 -10 -5 0 5 10Bargaining Coverage Rates, 2004-2010
at
cyczdedk
eefifr
hu
lt
lu
nl
pl
se
si sk
uk
-1-.
50
.51
1.5
p90/1
0,
2004-2
011
-1 0 1 2 3Coordination of wage setting, 2004-2011
at
cyczdedk
eefifr
hu
lt
lu
nl
pl
se
sisk
uk-1
-.5
0.5
11.5
p90/1
0,
2004-2
011
-2 -1 0 1 2Gov intervention in wage barg, 2004-2011
at
cyczdedk
eefifr
hu
lt
lu
nl
pl
se
si sk
uk
-1-.
50
.51
1.5
p90/1
0,
2004-2
011
-4 -3 -2 -1 0 1Level of wage bargaining, 2004-2011
czeefr
hu
lt
lu
nl
pl
si sk
uk
-1-.
50
.51
1.5
p90/1
0,
2004-2
011
-.05 0 .05 .1Minimum relative to median wages, 2004-2010
Changes over 2004-2010/11
Inequality and Labour Market Institutions
Source: EU-SILC and ICTWSS.

Policy Department A: Economic and Scientific Policy
PE 536.294 62
Table 13: Summary of basic model estimates. Annual wages
Gini Decile ratio P5010 P9050
Union Density - - 0 -
Bargaining coverage rate + + + +
Gov intervention in wage bargaining - - - 0
Coordination of wage setting 0 - - 0
Minimum wage - - 0 -
Level of wage bargaining 0 - 0 0
A plus symbol (+) denotes a significant positive parameter, a minus symbol (-) a significant negative parameter
and a zero (0) a non-significant impact. Every cell in this table is the summary of a panel estimation where the
inequality measurement is the endogenous variable and the regressors include a list of controls and an isolated
labour market policy
Source: Own elaboration.
Table 14: Summary of basic model estimates. Monthly wages
Gini Decile ratio P5010 P9050
Union Density 0 0 + -
Bargaining coverage rate + 0 + 0
Gov intervention in wage bargaining 0 0 0 0
Coordination of wage setting 0 0 0 0
Minimum wage 0 - - 0
Level of wage bargaining 0 0 0 0
A plus symbol (+) denotes a significant positive parameter, a minus symbol (-) a significant negative parameter
and a zero (0) a non-significant impact. Every cell in this table is the summary of a panel estimation where the
inequality measurement is the endogenous variable and the regressors include a list of controls and an isolated
labour market policy
Source: Own elaboration.

Income Inequality: Wage Dispersion in the EU
_________________________________________________________________________
PE 536.294 63
Table 15: Summary of basic model estimates. Hourly wages
Gini Decile
ratio
P5010 P9050 Low wage
Union Density 0 - 0 - 0
Bargaining coverage rate 0 - 0 - 0
Gov intervention in wage bargaining 0 0 0 0 0
Coordination of wage setting + 0 0 + 0
Minimum wage 0 0 - 0 -
Level of wage bargaining 0 0 0 0 0
A plus symbol (+) denotes a significant positive parameter, a minus symbol (-) a significant negative parameter
and a zero (0) a non-significant impact. Every cell in this table is the summary of a panel estimation where the
inequality measurement is the endogenous variable and the regressors include a list of controls and an isolated
labour market policy
Source: Own elaboration.
Higher minimum wage levels are related with higher levels of inequality.
The reported estimates focus on the within country variation in both inequality and
institutions, what removes cross country differences. We have also developed a list of
random effects estimation. The outcome for the p9010 models using annual and hourly
wages comparing the fixed effects and random effects model are presented in Tables 16
and 17. Union Density, coordination of wage setting and the level of wage bargaining hold
the same sign and significance in both fixed and random effects estimations for the annual
decile ratio. It means that inequality in annual wages is higher and increases where union
density, coordination of wage setting and the level of wage bargaining is lower and
decreases. Higher or lower levels of bargaining coverage rate and government intervention
in wage bargaining are not related with inequality levels. Interestingly, higher minimum
wage levels are related with higher levels of inequality, despite the sign of the coefficient is
negative for the fixed effects estimates. In our view it is a clear proof of the endogeneity of
labour market institutions: as this labour market institution reports a decreasing effect on
wage inequality, it displays higher levels where it is needed.
The models considering hourly wages keep the influence of union density on decreasing
inequality in both fixed and random effects models. Bargaining coverage rate influence
significantly on decreasing inequality (fixed effects model), while countries with higher
government intervention levels report less inequality (random effects model).
Overall, we can report a significant influence of all labour market institutions in reducing
wage inequality, being union density and minimum wages the stronger and more robust
institutions.
The economic crisis has impacted the effect of labour market institutions in the
reduction of wage inequality.
A time disaggregated analysis of the available sample (before and after 2007) report

Policy Department A: Economic and Scientific Policy
PE 536.294 64
interesting results, although in our view we have to be cautious on the obtained results.5 In
almost all cases, the labour market institutions having a significant effect in reducing
inequality, played this role in the pre-crisis period. These institutions are Union Density,
Government intervention in wage bargaining, Coordination of wage setting and Level of
wage bargaining. Minimum wages is the only labour market institution with a robust
significant negative impact in inequality, but only in the bottom part of the distribution
(p5010) of monthly and hourly wages. On the contrary, minimum wages are significantly
and positively associated with increasing inequality in the upper part of the distribution of
annual, monthly and hourly wages in the crisis period (2007-2011). As random effects
models mix results for both cross section and time series information, we interpret such
result as a correlation between higher levels of upper inequality in countries with higher
levels in minimum wages. The observed result is a low level of wage inequality in the
bottom part of the distribution. These outcomes, though, are only observed in the crisis
period, when significant portions of the active population have been expulsed from the
labour market. In this line, minimum wages can be interpreted as a protection mechanism
of the bottom part of the distribution which is not expulsed from the labour market. Clearly,
a wider analysis of labour incomes and overall inequality which would include the
unemployed workers would help to close the circle on the full impact of this labour market
institution.
A final check in the model has been the use of interactions to analyse if policies and
institutions complement each other. In order to do that we follow a standard procedure,
where the interactions are specified as multiplicative terms, which take the form of
products of deviations of every pair of policies or institutions (P1, P2, generically) from their
sample means (P1* and P2*):
Yit = 0 + 1 Xit + 2 G it + 3 Tit + 4 Pit + i + t + (P1- P1*)(P2- P2*) + it
As the amount of potential interactions between labour market institutions is a large
number we refer here to the main results. We have restricted our scope to analyse the
interactions of two institutions related with centralization of wage bargaining: coordination
of wage setting and the level of wage bargaining. By databases constraints, increasing
interacting labour market institutions decreases substantially the country coverage (usually
to 15 to 17 countries, but sometimes even to just 11 countries). The result is that fixed
effects estimations hardly report significant results. Nevertheless, interesting results arise
when we look at random effects estimates. The main outcome is that countries with more
centralized wage bargaining systems (measured in terms of both coordination of wage
setting and the level of wage bargaining), report lower inequality indices. These results
hold no matter which other labour market institution are interacted, although the results
are less robust for union density. Regarding the alternative inequality indices, wage
bargaining centralization affects negatively inequality in the bottom part of the distribution
(p5010), while we observe complementarities with other labour market institutions in the
upper part of wages distribution (p9050), particularly with bargaining coverage rate.
Finally, as we observed above, minimum wages report a dramatically different result for the
bottom and upper part of wage distribution. Actually, centralization itself arises as an
augmenting factor of wages inequality when it is interacted with minimum wages.
5 The reduction of the sample size plus the time invariability of many labour market institutions in short periods
of time are responsible for non-significant results in all fixed effects models. Consequently the comments are
referred only to random effects estimates.

Income Inequality: Wage Dispersion in the EU
_________________________________________________________________________
PE 536.294 65
Table 16: Random effects models for p9010-annual wages
(1) (2) (3) (4) (5) (6)
Union
Density
-0.0270*
(0.0160)
Bargaining
coverage
rate
0.0120
(0.0227)
Gov
intervention
in wage
bargaining
-0.337
(0.222)
Coordination
of wage
setting
-0.432**
(0.217)
Minimum
wage
5.974***
(2.032)
Level of
wage
bargaining
-0.376*
(0.208)
Observations 105 89 124 124 82 124
Countries 16 16 17 17 12 17
All models include the full list of generic controls plus the variables corresponding to globalization, technological
change and policy. Standard errors in parentheses. *** p<0.01, ** p<0.05, * p<0.1
Source: Own elaboration.

Policy Department A: Economic and Scientific Policy
PE 536.294 66
Table 17: Fixed effects models for p9010-annual wages
(1) (2) (3) (4) (5) (6)
Union Density -0.314*
(0.168)
Bargaining
coverage rate
0.296**
(0.141)
Gov
intervention
in wage
bargaining
-
2.024**
(0.998)
Coordination
of wage
setting
-1.955**
(0.815)
Minimum
wage
-8.252*
(4.459)
Level of wage
bargaining
-3.103*
(1.763)
Observations 105 89 124 124 82 124
Countries 16 16 17 17 12 17
All models include the full list of generic controls plus the variables corresponding to globalization,
technological change and policy. Standard errors in parentheses. *** p<0.01, ** p<0.05, * p<0.1
Source: Own elaboration.

Income Inequality: Wage Dispersion in the EU
_________________________________________________________________________
PE 536.294 67
Table 18: Random effects models for p9010 - hourly wages
(1) (2) (3) (4) (5) (6)
Union Density -0.0283***
(0.00913)
Bargaining
coverage rate
0.00313
(0.00694)
Gov
intervention in
wage
bargaining
-
0.240**
*
(0.0813)
Coordination
of wage
setting
-0.107
(0.0827)
Minimum
wage
0.213
(0.598)
Level of wage
bargaining
-0.0482
(0.0787)
Observations 105 89 124 124 82 124
Countries 16 16 17 17 12 17
All models include the full list of generic controls plus the variables corresponding to globalization, technological
change and policy. Standard errors in parentheses. *** p<0.01, ** p<0.05, * p<0.1
Source: Own elaboration.
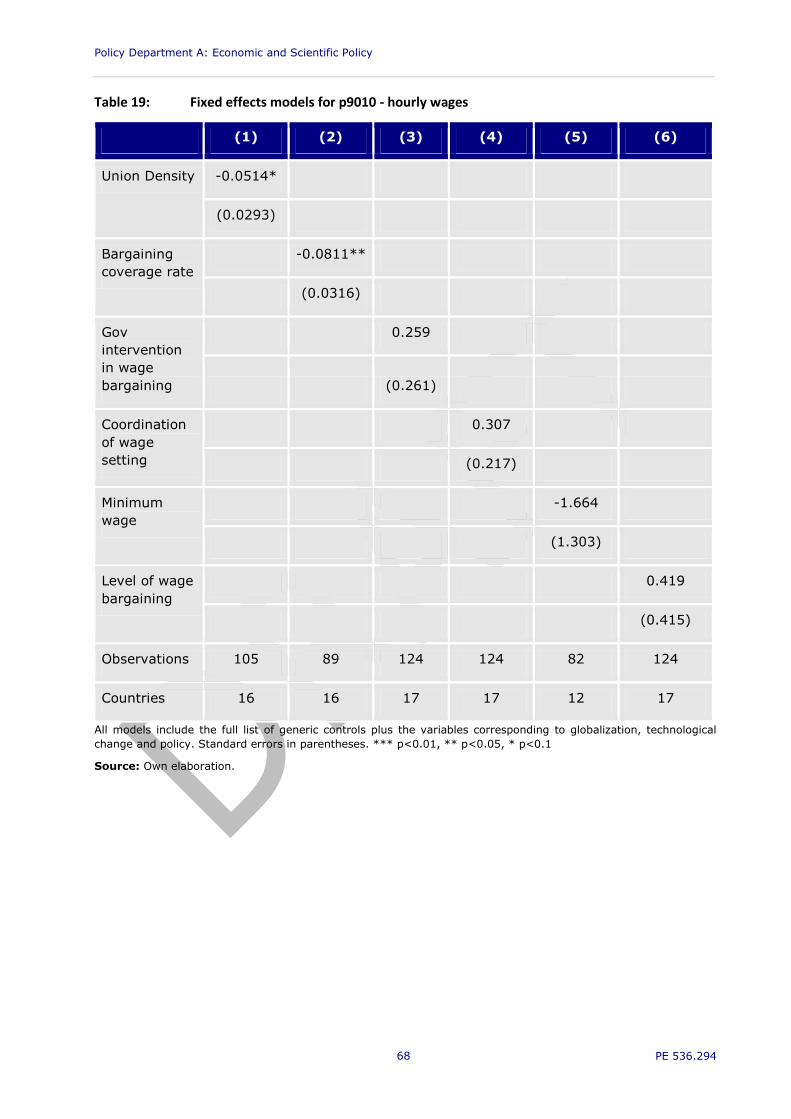
Policy Department A: Economic and Scientific Policy
PE 536.294 68
Table 19: Fixed effects models for p9010 - hourly wages
(1) (2) (3) (4) (5) (6)
Union Density -0.0514*
(0.0293)
Bargaining
coverage rate
-0.0811**
(0.0316)
Gov
intervention
in wage
bargaining
0.259
(0.261)
Coordination
of wage
setting
0.307
(0.217)
Minimum
wage
-1.664
(1.303)
Level of wage
bargaining
0.419
(0.415)
Observations 105 89 124 124 82 124
Countries 16 16 17 17 12 17
All models include the full list of generic controls plus the variables corresponding to globalization, technological
change and policy. Standard errors in parentheses. *** p<0.01, ** p<0.05, * p<0.1
Source: Own elaboration.

Income Inequality: Wage Dispersion in the EU
_________________________________________________________________________
PE 536.294 69
6. ANALYSIS OF THE RELATIONSHIP BETWEEN WAGE
INEQUALITY AND INCOME INEQUALITY
KEY FINDINGS
Changes in wage inequality explain around one fourth of the variation in changes
in overall income inequality between 2006 and 2011. A 0.1 increase in the Gini
index for wages implies an increase of 0.04 points in the Gini index for overall
income.
In fact, it is well known that wages account for a very important part of income
inequality. However, there are other sources of household income such as transfers
and capital income that can also contribute to explain trends in overall inequality.
With the aim of analysing the contribution of different sources to overall income
inequality, we have decomposed the variation in the Gini index of household
annual income from 2006 to 2011 using microdata from EU-SILC into the relative
contribution of changes in the inequality in each of the following components:
income from paid employment, income from self-employment, transfers, other
income (mainly capital) and taxes. The contribution of these components on
income inequality depends on two factors: individual components’ inequality trends
and their shares on total income. The obtained evidence shows that the income
source that has contributed more to the increase in overall income inequality is
capital income, while taxes have contributed to decrease it and transfers have
been neutral. The contribution of wage inequality has been less relevant than in
previous study due to decreasing wage shares in most eu countries, due mainly to
the fall in employment rates.
The basic results of estimating different versions of this model show a significant impact of
globalization although only in a few specifications, technological change seem to impact the
wage distribution. As expected, wage inequality is clearly pro-cyclical with output gap and it
is related to the industry mix. Improving competition in regulated network sectors has also
a robust influence in reducing wage inequality. Regarding labour market institutions, we
find a significant impact of minimum wages on inequality, being stronger on the lower part
of the distribution. The wage bargaining level does not seem to have a robust influence in
inequality (a more centralized wage setting only increases inequality in hourly wages)
although this result could be related to the high persistence of collective bargaining
systems during the considered period. Union density and the bargaining coverage rate
reduce inequality but only when analysing
Inequality in income and wages has been reinforced by recent crisis.
Wage inequality and labour market inequality are just a part of overall household income
inequality, which include other sources of income such as transfers and capital income.
Consequently, as far as labour market institutions influence wage inequality, they will also
have an impact on income inequality. Inequality in income and wages has been increasing
in almost all highly industrialised countries over the last decades. This path has been
particularly reinforced in the recent crisis, although the impact has not been the same all
Europe. Actually, both labour income inequality (among people in working age population)
and labour earning inequality (among those who earn an income from employment) widely
differ across countries. While many countries have experienced an increase in both
dimensions, it is also true that several countries have experienced a decrease in inequality

Policy Department A: Economic and Scientific Policy
PE 536.294 70
over the period, particularly in income terms. Actually, several countries display a decrease
in labour income inequality together with an increase in labour earnings inequality (United
Kingdom, the Netherlands, and Czech Republic). Figure 22 shows the relationship between
changes in Gini for annual income and Gini for annual wages during the period 2006 and
2011. We can see that both variables are positively related and, in fact, changes in wage
inequality explain around one fourth of the variation in changes in overall income inequality
between 2006 and 2011. A 0.1 increase in the Gini index for wages implies an increase of
0.04 points in the Gini index for overall income.
Figure 22: Changes between 2006 and 2011 in Gini for annual income
(vertical axis) and Gini for annual wages (horizontal axis)
Source: EU-SILC and ICTWSS.
Wages account for a very important part of income inequality.
However, there are other sources of household income such as transfers and capital income
that can also contribute to explain trends in overall inequality. With the aim of analysing
the contribution of different sources to overall income inequality, we have decomposed the
variation in the Gini index of household annual income from 2006 to 2011 using microdata
from EU-SILC into the relative contribution of changes in the inequality in each of the
following components: income from paid employment, income from self-employment,
transfers, other income (mainly capital) and taxes. The contribution of these components
on income inequality depend on two factors: individual components’ inequality trends and
their shares on total income. The obtained evidence is shown in Tables 20 and 21 and
figure 23. Figure 23 shows the value of the correlation coefficient between changes in the
Gini index for income between 2006 and 2011 and changes in the contribution to inequality
of the different sources of income. These results show that the income source that has
contributed more to the increase in overall income inequality is capital income, while taxes
have contributed to decrease it and transfers have been neutral. The contribution of wage
inequality has been less relevant than in previous studies due to decreasing wage shares in
most EU countries, a result that is clearly related to the observed fall in employment rates
due to the Great Recession.

Income Inequality: Wage Dispersion in the EU
_________________________________________________________________________
PE 536.294 71
Figure 23: Correlation coefficient between changes in the Gini index for income
between 2006 and 2011 and changes in the contribution to inequality
of the different sources of income
Source: EU-SILC.

Policy Department A: Economic and Scientific Policy
PE 536.294 72
Table 20: Decomposition of disposable income Gini variation according to the contribution of different income sources
Country Initial
Gini
Final
Gini
Diff. in
Gini
Contrib. of
employment
income
Contrib. ofself-
employment
income
Contrib. of
benefits
Contrib. of
other income
Contrib.
of taxes
AT 0.271 0.290 0.019 0.071 -0.026 -0.024 0.013 -0.015
BE 0.279 0.277 -0.002 -0.069 0.034 0.002 0.006 0.025
BG 0.341 0.336 -0.005 -0.019 -0.041 0.025 0.011 0.019
CY 0.317 0.337 0.020 0.017 -0.027 0.054 -0.003 -0.021
CZ 0.317 0.238 -0.079 0.005 0.007 -0.047 -0.014 -0.029
DE 0.286 0.285 -0.001 0.039 -0.028 0.006 -0.003 -0.015
DK 0.223 0.238 0.015 0.017 -0.016 -0.004 -0.004 0.022
EE 0.355 0.313 -0.042 -0.045 -0.022 -0.007 0.000 0.032
EL 0.345 0.310 -0.035 -0.066 -0.048 0.054 -0.007 0.032
ES 0.324 0.325 0.001 -0.046 0.015 0.025 0.003 0.004
FI 0.281 0.288 0.007 0.014 -0.015 0.001 -0.023 0.029
FR 0.274 0.313 0.039 -0.048 -0.004 0.003 0.086 0.002
HU 0.261 0.261 0.000 -0.019 -0.013 -0.010 0.000 0.043
IE 0.329 0.308 -0.020 0.005 -0.045 0.042 0.001 -0.023

Income Inequality: Wage Dispersion in the European Union
PE 536.294 73
Country Initial
Gini
Final
Gini
Diff. in
Gini
Contrib. of
employment
income
Contrib. of
self-employment
income
Contrib. of
benefits
Contrib. of
other income
Contrib.
of taxes
IT 0.318 0.328 0.010 -0.019 -0.004 0.038 0.013 -0.018
LT 0.353 0.318 -0.035 -0.083 0.001 0.001 0.005 0.041
LU 0.278 0.283 0.004 -0.048 0.006 0.038 0.007 0.001
LV 0.367 0.352 -0.015 -0.041 -0.005 0.038 0.006 -0.013
MT 0.279 0.280 0.001 0.003 0.005 0.002 0.000 -0.008
NL 0.234 0.240 0.006 0.020 0.032 -0.015 0.016 -0.045
PL 0.367 0.309 -0.058 -0.017 0.002 -0.046 -0.001 0.004
PT 0.382 0.352 -0.030 -0.042 -0.021 0.039 0.002 -0.007
RO 0.374 0.311 -0.063 -0.150 -0.030 0.096 -0.005 0.026
SE 0.223 0.249 0.026 -0.012 0.006 -0.004 0.013 0.024
SI 0.242 0.245 0.003 0.002 -0.004 -0.002 0.006 0.000
SK 0.261 0.245 -0.016 -0.035 -0.015 -0.025 0.001 0.058
UK 0.347 0.320 -0.028 -0.010 -0.033 0.017 -0.012 0.010
Source: EU-SILC.

Policy Department A: Economic and Scientific Policy
PE 536.294 74
Table 21: Variation in the Gini coefficient for income and wages and evolution of the wage share between 2006 and 2011
Country Gini 2006
Income
Gini 2011
Income
Diff. Gini
Income
Gini 2006
Wages
Gini 2011
Wages
Diff. Gini
Wages
Wage share
2006
Wage share
2011
Diff. Wage
share
AT 0.271 0.290 0.019 0.355 0.424 0.069 0.750 0.755 0.005
BE 0.279 0.277 -0.002 0.306 0.301 -0.005 0.902 0.786 -0.116
BG 0.341 0.336 -0.005 0.317 0.359 0.042 0.659 0.616 -0.043
CY 0.317 0.337 0.020 0.364 0.406 0.042 0.687 0.675 -0.013
CZ 0.317 0.238 -0.079 0.302 0.327 0.026 0.849 0.648 -0.202
DE 0.286 0.285 -0.001 0.411 0.413 0.002 0.749 0.819 0.071
DK 0.223 0.238 0.015 0.257 0.333 0.077 1.093 1.019 -0.073
EE 0.355 0.313 -0.042 0.400 0.380 -0.020 0.899 0.817 -0.082
EL 0.345 0.310 -0.035 0.379 0.327 -0.053 0.572 0.466 -0.106
ES 0.324 0.325 0.001 0.356 0.361 0.005 0.723 0.639 -0.084
FI 0.281 0.288 0.007 0.281 0.349 0.068 0.761 0.752 -0.009
FR 0.274 0.313 0.039 0.349 0.365 0.016 0.704 0.611 -0.093
HU 0.261 0.261 0.000 0.407 0.376 -0.031 0.662 0.675 0.013
IE 0.329 0.308 -0.020 0.388 0.431 0.042 0.664 0.642 -0.023

Income Inequality: Wage Dispersion in the European Union
PE 536.294 75
Country Gini 2006
Income
Gini 2011
Income
Diff. Gini
Income
Gini 2006
Wages
Gini 2011
Wages
Diff. Gini
Wages
Wage share
2006
Wage share
2011
Diff. Wage
share
IT 0.318 0.328 0.010 0.359 0.355 -0.004 0.572 0.557 -0.016
LT 0.353 0.318 -0.035 0.406 0.406 0.000 0.811 0.674 -0.137
LU 0.278 0.283 0.004 0.378 0.374 -0.004 0.804 0.753 -0.051
LV 0.367 0.352 -0.015 0.406 0.440 0.034 0.846 0.751 -0.094
MT 0.279 0.280 0.001 0.282 0.332 0.050 0.687 0.700 0.012
NL 0.234 0.240 0.006 0.351 0.375 0.024 0.995 1.023 0.028
PL 0.367 0.309 -0.058 0.406 0.358 -0.048 0.686 0.696 0.010
PT 0.382 0.352 -0.030 0.433 0.400 -0.033 0.675 0.663 -0.012
RO 0.374 0.311 -0.063 0.323 0.263 -0.060 0.730 0.587 -0.143
SE 0.223 0.249 0.026 0.331 0.347 0.016 0.946 0.891 -0.054
SI 0.242 0.245 0.003 0.341 0.354 0.013 0.904 0.850 -0.054
SK 0.261 0.245 -0.016 0.302 0.293 -0.010 0.775 0.680 -0.095
UK 0.347 0.320 -0.028 0.403 0.425 0.023 0.812 0.756 -0.056
Source: EU-SILC.
Policy Department A: Economic and Scientific Policy
PE 536.294 76
REFERENCES
Afonso O, Albuquerque AL, Almeida A (2013): Wage inequality determinants in the
European Union, Applied Economics Letters 20, 1170-1173.
Autor D, Levy F, Murnane R (2003): The skill content of recent technological change.
An empirical exploration, Quarterly Journal of Economics 118, 1279-1333.
Baumgarten D, Geishecker I, Görg H (2013): Offshoring, tasks and the skill-wage
pattern, European Economic Review 61, 132-152.
Bezzina E (2012): Population and social conditions, Eurostat Statistics in Focus
48/12.
Boeri T (2012): Setting the minimum wage, Labour Economics 19, 281–290.
Brandolini A, Rosolia A, Torrini R (2010): The distribution of employees’ labour
earnings in the EU: data, concepts and first results, Eurostat Working Paper,
European Union.
Buscher H, Dreger C, Ramos R, Surinach J (2009): The impact of institutions on the
employment performance in European labour markets, Economic Issues 14, 17-33.
Butcher T, Dickens R, Manning A (2012): Minimum wages and wage inequality:
Some theory and an application to the UK, CEP Discussion Paper 1177.
Clar M, Dreger C, Ramos R (2007): Wage flexibility and labour market institutions.
A meta-analysis, Kyklos 60, 145-163.
Crivellaro E (2014): College wage premium over time: Trends in Europe in the last
15 years, Uniiversity of Venice, Working Paper 03/2014.
Dahl CM, Le Maire D, Munch JR (2013): Wage dispersion and decentralization of
wage bargain-ing, Journal of Labor Economics 31, 501-533.
Dustmann C, Ludsteck J, Schönberg U (2009): Revisiting the German wage
structure, Quarterly Journal of Economics 124, 843-881.
Egger H, Kreickemeier U (2009): Firm heterogeneity and the labor market effects of
trade lib-eralization, International Economic Review 50, 187-216.
Feenstra RC, Hanson GH (1996): Globalization, outsourcing, and wage inequality,
American Economic Review 86, 240-245.
Flaig G, Rottmann HF (2013): Labour market institutions and unemployment:
An international panel data analysis, Empirica 40, 635-654.
Fortin N, Lemieux T, Firpo S (2011): Decomposition Methods in Economics,
Handbook of Labor Economics, Volume 4, Chapter 1, 1-102, Elsevier.
Fredriksen KB (2012): Income inequality in the European Union, OECD Economics
Department Working Papers 952.
Fournier J-M, Koske I (2012): Less income inequality and more growth. Are they
compatible? Part 7. The drivers of labour earnings inequality. An analysis based on
conditional and unconditional quantile regressions, OECD Economics Department,
Working Paper 930.
Garnero A, Kampelmann S, Rycx F (2013): Minimum wage systems and earnings
inequalities: Does institutional diversity matter? DULBEA working paper 13-06,
http://dev.ulb.ac.be/ dulbea/ documents/1554.pdf.

Income Inequality: Wage Dispersion in the European Union
PE 536.294 77
Grimshaw D, Bosch G, Rubery J (2013): Minimum wages and collective bargaining:
What types of pay bargaining can foster positive pay equity outcomes? British Journal
of Industrial Relations, forthcoming.
Goos M, Manning A, Salomons A (2009): The polarization of the European labour
market, American Economic Review: Papers and Proceedings 99, 58-63.
Goos M, Manning A, Salomons A (2010): Explaining job polarization in Europe:
The roles of technology and globalization, CEP Discussion Papers 1026, Centre for
Economic Performance, London.
Helpman E, Itskhoki O, Redding SJ (2010): Inequality and unemployment in a global
economy, Econometrica 78, 1239-1283.
Hoeller P, Journard I, Pisu M, Bloch D (2012): Less Income Inequality and More
Growth. Are They Compatible? Part 1. Mapping income inequality across the OECD,
OECD Economics Department Working Papers 924.
Jaumotte F, Lall S, Papageorgiou C (2008): Rising income inequality: Technology, or
trade and financial globalization?, IMF Working Papers 08/185.
Kang F, Peng L (2013): Labour market institutions and skill premiums: An empirical
analysis on the UK, 1972-2002, Economic Issues 47, 959-982.
Kierzenkowski R, Koske I (2012): Less income inequality and more growth – Are they
compatible? Part 8. The drivers of labour income inequality – A literature review,
OECD Economics Department Working Papers 931.
Koske I, Fournier J-M, Wanner I (2012): Less income inequality and more growth.
Are they compatible? Part 2. The Distribution of Labour Income, OECD Economics
Department Working Papers 925.
Klein MW, Moser C, Urban DM (2013): Exporting, skills and wage inequality, Labour
Economics 25, 76-85.
Laporsek S (2013): Minimum wage effects on youth employment in the European
Union, Applied Economic Letters 20, 1288-1292.
Matano A, Naticchioni P (2010): Trade and wage inequality: Local versus global
comparative advantages, World Economy 33, 1757-1787.
Michaels G, Natraj A, Van Reenen J (2010): Has ICT polarized skill demand? Evidence
from eleven countries over 25 years, NBER Working Paper 16138.
OECD (2011): Divided we stand: why inequality keeps rising, OECD publishing.
Sologon DM, O’Donoghue C (2012): Cross-national trends in permanent earnings
inequality and earnings instability in Europe 1994-2001, MERIT Working Paper Series
6/02, University of Maastricht.
Spitz-Oener A (2006): Technical change, job tasks, and rising education demand:
Looking outside the wage structure, Journal of Labour Economics 24, 235-270.
Van Reenen JM (2011): Wage inequality, technology and trade. 21st century
evidence, Labour Economics 18, 730-741.
Visser J (2013): Data base on institutional characteristics of trade unions, wage
setting, state intervention and social pacts, 1960-2011 (ICTWSS), University of
Amsterdam.
Visser J (2013): Wage bargaining institutions. From crisis to crisis, European
Commission, DG Economic and Financial Affairs, European Economy,
Economic Papers.

Policy Department A: Economic and Scientific Policy
PE 536.294 78
NOTES

Income Inequality: Wage Dispersion in the European Union
PE 536.294 79

Policy Department A: Economic and Scientific Policy
PE 536.294 80