wage dispersion in nonprofit organizations · dispersion: volunteer workers, private donations and...
TRANSCRIPT
1
WAGE DISPERSION IN NONPROFIT ORGANIZATIONS:
Do Volunteers, Donations and
Public Subsidies Have an Impact?
Astrid Haider and Ulrike Schneider
Vienna University of Economics and Business Administration
[email protected] and [email protected]
April 2009
2
Executive Summary
Little is known about wage determination and the distribution of
wages, or wage structure, in nonprofit organizations (NPOs). Research
in this area has mainly compared wage levels in the nonprofit sector
with pay levels in the for-profit sector. The aim of this paper is to
analyze wage dispersion within NPOs. We concentrate on the
characteristics of NPOs as compared to for-profit organizations and
whether three variables have a significant impact on within-firm wage
dispersion: volunteer workers, private donations and public subsidies.
We hypothesize that the wage dispersion is lower in organizations with
volunteers as compared to organizations without volunteers if
volunteers substitute for paid managers or for employees at the bottom
of the wage distribution. If voluntary work is entirely complementary to
the work of paid staff, there is less reason why volunteering should
affect the wage distribution. Higher income from donations and public
subsidies could either lead to a higher or lower wage dispersion,
depending on the relative effect of (a) relaxing budget constraints in
wage setting and (b) public scrutiny and control.
Our empirical analysis is based on Austrian matched employer-
employee data collected in 2006. This is a unique data set consisting of

a large scale descriptive survey of the characteristics of Austrian NPOs
with at least one paid employee and individual data on all paid
employees in these NPOs from tax income statistics.
Using an instrument variable regression, we find that organizations with
volunteer workers have, as expected, a smaller wage dispersion. A
more even mix between paid and unpaid staff is associated with a
lower wage dispersion. Higher donations and public subsidies lead to a
greater within-firm wage dispersion.
3
4
INTRODUCTION
Little is known about wage determination and the wage structure in nonprofit organizations (NPOs). As nonprofit organizations face growing competition from for-profit firms, research in this area has mainly compared the wage levels in the nonprofit sector with pay levels in the for-profit sector (see e.g. Leete 2001; Ruhm and Borkoski 2003; Mocan and Tekin 2003; Noguchi and Shimizutani 2007). By contrast, the aim of this paper is to analyze wage dispersion within NPOs.
In a study done in the United States using 1990 data, Leete found that the wage dispersion within NPOs is in fact more compressed than within for-profit organizations (Leete 2000). She argues that wage dispersion is less apparent in NPOs because of the higher intrinsic motivation of nonprofit employees. NPOs rely heavily on their employees‘ intrinsic motivation and identification with the organizational mission in order to achieve their goals. Therefore, NPOs try to strengthen intrinsic motivation, adherence to group norms and organizational pride partly through wage equity (Leete 2000).
Against this backdrop, our study is the first one concerned with the determinants of wage dispersion within an NPO. How do organizations differ within the nonprofit sector? In our analysis, we especially concentrate on the characteristics of NPOs as compared to for-profit organizations. More specifically, when estimating the intra-firm wage-dispersion for NPOs we do not only account for factors considered in previous studies for other industries such as the qualification, profession, work experience, tenure, age of workers and sector but also include volunteers, donations and public subsidies as influencing factors. Hence, this paper is to address the question if volunteer workers, donations and public subsidies influence the within-firm wage dispersion in nonprofit organizations.
Our empirical analysis is based on Austrian matched employer-employee data collected in 2006 – a unique data set consisting of a large scale survey of Austrian NPOs with at least one paid employee, on the one hand, and individual data of all paid employees in these NPOs from the tax income statistics, on the other hand. Instrument variable regression technique is used in the paper.
EXISTING RESEARCH
The theoretical literature provides two competing hypotheses on wage dispersion and its impact on employees. The fair-wage hypothesis states that employees are more productive and motivated if the wage dispersion is relatively small and employees perceive the wages that paid in the organization as fair (Akerlof and Yellen 1990; Levine 1991; Frank 1984). A contradictory theory is the tournament theory which states that a higher wage dispersion leads to more competition among employees and thus more productive employees (Lazear and Rosen 1981).
Machin and Manning (2004) analyze the wage dispersion of employees in nursing homes without specifying if these organizations are nonprofit, public or for-profit nursing homes, and found a low wage dispersion in this sector. They also explain that employees have a preference for equal wages. Two other studies tested the fair-wage hypothesis and the tournament theory among university faculty (Pfeffer and Langton 1993) and baseball teams (Depken 2000). Both studies found that a more equal wage dispersion leads to higher productivity, better team work and elevated job satisfaction. .
Thus far, there has been very little research concerning the wage dispersion in NPOs. Leete (2000) compared the wage dispersion in nonprofits and forprofits and, without explicitly stating or testing it, assumes that the fair-wage hypothesis prevails in nonprofits. She found lower wage dispersion in the nonprofit sector as compared to the for-profit sector. Another strand of literature compares the wage level of managers in the nonprofit and the for profit sectors (Roomkin and Weisbrod 1999; Ballou and Weisbrod 2003; Frumkin and Keating 2001; Hallock 2002; Oster 1998). This research is especially interesting for the analysis of wage dispersion because higher wages for managers influence the within-firm dispersion decisively. The studies point out that managerial pay is generally lower and less often performance-related in the nonprofit sector (Ballou and Weisbrod 2003, Frumkin and Keating 2001, Roomkin and Weisbrod 1999).
Thus, the existing research points out that wage dispersion is lower in the nonprofit sector than in the forprofit sector. One possible reason for this finding is that for NPOs equal wages are particularly important to sustain employees‘ intrinsic motivation and hence productivity. In nonprofit relevant fields of activity the fair-wage hypothesis, which states that more equal wages lead to a higher productivity among employees, seems to be more applicable than the tournament theory. One specific reason for the lower wage dispersion in the nonprofit sector could be lower pay levels for managers in NPOs.
We do not know, however, if this holds true for all nonprofits or if there are differentiating characteristics at the organizational level that influence the wage dispersion within and across nonprofit organizations. In this article, we want to test, if donations, public subsidies and volunteers have an influence on the intra-organizational wage dispersion. In the following section we present several arguments why these three characteristics of nonprofit organizations could influence their wage dispersion, before testing their impact empirically.
VOLUNTEERS, DONATIONS AND PUBLIC SUBSIDIES AND THEIR POSSIBLE INFLUENCE ON THE WAGE DISPERSION IN NPOS
Volunteers are often involved in the production of collective-type goods such as health and education and are particularly important for nonprofit suppliers of these goods (Menchik and Weisbrod 1987, p. 159; Steinberg 2003, p. 289). Volunteers frequently work in NPOs alongside paid employees. The relationship between paid staff and volunteers is complex, since volunteers’ roles are diverse
5
and not necessarily distinctive from paid workers’ roles (Handy, Mook and Quarter 2008, Netting, O'Connor, Thomas and Yancey 2005, p. 192).
From an economic perspective, volunteers can be regarded as either complements or substitutes to paid labor (Emanuele 1996). Where volunteers substitute for paid workers completely, then those wage segments are not present in the wage distribution. If they perform tasks at the upper end, (e.g. managerial tasks) or at the lower end, the wage dispersion would be smaller compared to organizations without volunteers. Wages could be more or less evenly distributed across the remaining wage segments. We expect that in the case of ‘lower end’ or ‘upper end substitution’, volunteers indicate a flat hierarchy in the organization and are more likely to smooth the distribution of wages. However, if the existence of volunteers thins out wage segments in the middle of the wage distribution, a bimodal shape of the distribution could emerge, which tends to increase measured and perceived wage inequality. For this explanation, the mix between paid und volunteer workers is relevant in explaining a difference in wage dispersion rather than the sheer number of volunteers.
The utilization of volunteers could also be indicative of an organizations’ mission. The very existence of volunteers within an organization as well as their number might be an indicator of the high degree of social desirability of the organization’s mission and thus of a high intrinsic motivation of the paid employees. If volunteering is ‘all in good cause’ this necessarily implies that volunteers commit themselves to organizations whose mission they hold to be socially desirable. In this type of organization, employees may display very high levels of intrinsic motivation which in turn means that equal pay is of particular importance for maintaining employees’ motivation (Leete 2000).
Donations and public subsidies provide needed financial resources and soften budget constraints.1 They could signficantly affect the wage dispersion permitting wage variation within an organization, depending on the extent of rent-sharing 1 practiced by its management. On the other hand higher dependence on donations and public subsidies may indicate high levels of public scrutiny. An unequal wage distribution might jeopardize the legitimacy of an NPO and adversely affect donations. High wages to managers play a vital role in the public perception of an NPO and might be especially important in the decision making process of donors. Against this backdrop, we would expect a smooth and relatively even distribution of wages. In a similar vein, one could assume that public subsidies usually imply a moderating influence of public authorities on the wage distribution of NPO. As an example, cost reimbursement schemes could tie in with compensation systems in
1. For a discussion of how government subsidies soften budget constraints see e.g. Kornai (1986;
1998). 2. A rent can be defined as return over and above the cost of supply or “the return paid to an input that is fixed in supply” (Mansfield 1997, p. A10). For an explanation of rent-sharing in a nonprofit specific context see e.g. Borjas et al (1983) and Preston (1988).
6
the public sector. In this case, NPOs would not be completely free in their wage setting process and possibly, their wage dispersion would be lower because of public sector influence.
Summing up all arguments we assume the wage dispersion to be lower in organizations with volunteers as compared to organizations without volunteers if volunteers substitute for paid managers or for employees at the bottom of the wage distribution. A small countervailing effect may occur when volunteers substituting for paid workers soften budgetary pressures and increase the leeway for rent-sharing. If voluntary work is entirely complementary to the work of paid staff, there is less reason why volunteering should affect the wage distribution. Higher income from donations and public subsidies could either lead to a higher or lower wage dispersion, depending on the relative effect of (a) relaxing budget constraints in wage setting and (b) public scrutiny and control.
MODEL
In order to test the influence of volunteers, donations and public subsidies on the wage dispersion in nonprofit organizations, we propose the following model:
j j jdisp X Y jα β γ= + + +ε
sp
(1)
In the equation represents the intra-firm wage dispersion of a NPO. Wage
dispersion within an organization ( di ) can be measured in various ways. In the existing empirical research many different measures have been used so far, each measure with different pros and cons (Canal Dominguez and Rodriguez Gutierrez 2004: p. 488). Freeman (1980), Dell’Aringa and Lucifora (1994) and Bechtel, Heinbach, Strotmann (2005) use the standard deviation of log wages, Freeman (1982: 9) as well as James and Morlock (1987, p. 971) use the variance of log wages. Pfeffer and Davis-Blake (1990, p. 44) use the coefficient of variation. Interestingly, the authors say little of why they chose the dispersion measure and hardly discuss if or how their results would change if they used a different measure. We therefore apply several measures and present results for estimation using these alternative measures in the appendix.
jdisp
j
jX is a vector of variables that describes the most important worker
characteristics of organization j . In this vector we use the age dispersion of the paid employees as well as the composition of the work force concerning sex, blue-collar/white collar worker and full-time/part-time status. Y is a vector of
variables that represent characteristics of the nonprofit organization j
j . This includes information on volunteers within the organization – which can be either described through a dummy if the organization has volunteers, the number of volunteers in relation to the paid full-time equivalents or the standard deviation of volunteers and paid staff – additionally, income of donations, public subsidies and contracts with public authorities in relation to total income, two dummy variables if the organization has a collective agreement, the activity sector of the
7
organization as well as organization size measured as the number of full-time equivalents. iε denotes the error term.
In estimating the wage dispersion we follow the approach of Canal Dominguez and Rodriguez Gutierrez (2004, p. 488) who use the log of the standard deviation of wages and add the average wage level on the right-hand side of the equation. The
reason for doing so is that they assume the coefficient of variation j
j
Vw
to be the
best statistical dispersion measure, because the dispersion is independent from the wage level of an organization. However, if you use the logarithm of the coefficient
of variation log log logjj
j
VV
w
⎛ ⎞⎜ ⎟ = −⎜ ⎟⎝ ⎠
jw follows. Consequently, the authors add the
logarithm of the average wage on the right-hand side of the equation (Canal Dominguez and Rodriguez Gutierrez 2004). However, this approach does not equal the coefficient of variation exactly. We follow this approach and add the average wage of organization j as an exogenous variable to the equation (Canal Dominguez and Rodriguez Gutierrez 2004):
j j j jdisp X Y w jα β γ δ ε= + + + + (2)
The average wage jw is added to the equation in order to account for a possible effect of the wage level on the wage dispersion. One the one hand, the addition of the average wage level of the organization to the equation can be explained statistically, because, as we just showed, it is an approximation to the coefficient of variation. On the other hand, Kahn and Curme (1987) argue, that the average wage is a proxy for the human capital in the organization (Kahn and Curme 1987, p. 603).
However, the use of the average wage level as a control variable could lead to an endogeneity problem which can be solved by using instrument variable (IV) regression. It remains unclear, if the average wage of an organization influences the wage dispersion or the other way round. We therefore instrument the average wage by the following regression:
log ij ij j ijW K Lα β γ ε= + + + (3)
log ijW is the log of the daily wage before tax, is a vector that contains variables
on the individual level, is a vector that contains organizational level variables and is the same for all individuals working within one and the same organization. More specifically, includes age, age squared, sex, a blue-collar/white-collar dummy, and two dummies indicating two specific Austrian contract types as well as a full-time/part-time dummy. comprises a dummy variable whether the organization has volunteers, the number of volunteers per paid full-time equivalent, donations per paid full-time equivalent and subsidies per full-time equivalent as well as 9 region dummies, 32 sector dummies on a 6-digit level, two
ijK
jL
ijK
jL
8
collective agreement dummies, log full-time equivalents and three variables containing information about the staff composition within an organization such as part-time workers, marginal workers and women per full-time equivalent. Donations, subsidies, the number of employees as well as the variables describing the staffing composition are all divided by the number of full-time equivalents in order to take out the size effect in these variables. There are two collective agreement dummies, one that states if an organization does not pay according to a collective agreement, but orientates itself on an existing collective agreement. A second dummy is included if an organization has no collective agreement. Organizations having one or more collective agreements form the reference category. Contrary to the vector Y in equation (2) Z includes more detailed sector information, as well as region dummies. The donations and subsidies variables are divided by full-time equivalents and not by total income.
We then estimate the following equation:
ˆ IVj j j j jdisp X Y wα β γ ε= + + +
δ + (4)
DATA
We use a unique matched employer-employee data set for Austria. Matched employer-employee datasets contain information on employees and employers and have the advantage of allowing us to test factors influencing wages on both the supply and on the demand side. Our data comprise pay slip information on employees working in nonprofit organizations and information on their employers. This implies that all nonprofit organizations in our data employ at least one paid worker. To date, in the nonprofit sector matched employer-employee data have been used only for the analysis of wages in certain industries, such as the child care sector (Mocan and Tekin 2003).
We gathered the employer information in a postal survey that was sent out in 2006 to all Austrian nonprofit organizations with at least one employee. In total 5,104 organizations2. were contacted, and 947 questionnaires were returned, representing a response rate of 18.55 per cent. We have information for diverse industries that are relevant to the nonprofit world, but the postal survey was not sent to schools. The questionnaire, while touching on a variety of issues, placed particular emphasis on employment, income, expenditure and organizational activities.
The employee data used in this analysis are for the year 2005 and are taken from the Austrian tax statistics. Using the numerical identifier for the employer,
2. Also including for-profit and public kindergartens as well as elderly care homes which serve as a
control group.
9
organizational-level data were merged with the employee records3.. The data used for this analysis refer to 3174. nonprofit organizations that were covered by our organizational study. The individual-level data provide information on income, sex, age, length of employment, working hours and whether the person was a blue-collar or white collar worker. The individual data were aggregated on an organizational level, for this we calculated means and standard deviations per organization. We excluded all organizations with only one or two paid employees.
Variables and expected results
To describe the composition of employees in an organization, we use the age dispersion, the distribution of men and women and of blue-collar and white collar workers, as well as of full-time and part-time employees. These variables are also used to control for differences in human capital. Of course, it would be desirable to have further information on the education, the exact jobs and responsibilities or the employment duration. Unfortunately, in the data we use, no such information is available. The information of each individual is used in an aggregated form on the organizational level.
In order to measure the distribution or dispersion of these variables we use the standard deviation per organization which we compute from individual-level data. Other empirical studies use percentages or average values in order to describe the composition of the workforce of an organization (see for example Bechtel, et al. 2005, Canal Dominguez and Rodriguez Gutierrez 2004, Pfeffer and Davis-Blake 1990). We prefer standard deviations because by using percentages the relation between the independent variable and the wage dispersion could be described as inversely U-shaped. Taking the distribution of men and women as an example, the wage dispersion would be highest when the employees are 50 per cent male and 50 per cent female if we assume that men are paid more than women, as is still often the case. By taking percentages and by presuming a linear relation between this variable and the wage dispersion one would assume that wage dispersion is highest if either 100% men or 100% women work in an organization, which we think is not correct. Therefore, we use the standard deviation in order to model a linear relationship between wage dispersion and the distribution of men and women. We assume the same for the remaining variables describing the composition of he work force of the organization. We expect the sign of the coefficients of the standard deviation of age, gender, blue-collar/white-collar and full-time/part-time to be
3. The data in this article are cited as ‘Matched NPO-tax data 2006’ (‘"Matched NPO-tax data 2006:
NPO postal survey by STATISTIK AUSTRIA & Wirtschaftsuniversität Wien and Statistik der
Lohnsteuer (Income tax statistics) by STATISTIK AUSTRIA " 2006)
4. The differential to the 947 returned questionnaires results from the omission of the organisations in
the control group as well as organisations that not fill out the financial information in the questionnaire
and organisations with only one or two paid employees.
10
positive. Wage dispersion rises with increasing standard deviation of these variables.
As nonprofit specific variables we want to include information about the volunteers and the income structure of an organization. For measuring volunteer activity within an NPO we have various possibilities. We could include a volunteer dummy, the number of volunteers per paid full-time equivalent or the standard deviation of volunteers and paid full-time equivalents. The first measure would simply differentiate between organizations with or without volunteer participation (model 1). The second one would measure if the relation between volunteers and paid staff mattered and by taking this measure we assume that more volunteers per paid staff lower the dispersion (model 2). The latter measure – the standard deviation - also describes the volunteer/paid staff mix. In contrast to the number of volunteers per full-time equivalent we assume here that dispersion should be lowest when the mix is even (model 3). We estimate three different models with these three measures.
We expect the presence of volunteers to have a negative influence on the wage dispersion for the reasons mentioned previously. By taking two different measures for the number of volunteers we test two different hypotheses. If we expect the number of volunteers per paid full-time equivalent to have a negative influence, we assume that more volunteers compared to paid staff lead to a lower wage dispersion. If we use the standard deviation of volunteers and paid staff and postulate a negative influence of this variable on the wage dispersion, we expect that the wage dispersion is lowest in an organization with 50% volunteers and 50% paid employees.
We also include information about the income structure of the organization: the share of donations and income from sponsoring in total income, the share of public subsidies and the share of income from contracts with public authorities in total income.
The effect of donations and public subsidies remains ambiguous since we found reasons why they either might positively or negatively influence the wage dispersion. The same is true for the variable ‘share of income of contracts with public authorities’.
The activity of the NPO is captured by using dummy variables for the Austrian NACE classification on a two-digit level in order to have enough cases by category. Health and social service serve as our reference group since this is the most important activity category in our dataset. The expected signs of the coefficients of the NACE dummies remain unclear. As an income variable, we use the yearly total labor income before tax divided by the days of employment within the organization (max. 365 days). All full-time workers earning less than €20 per day and all part-time workers with less than €5 daily income were excluded from the data set for plausibility reasons. Unfortunately the data only contain a dummy variable if a person works full-time or part-time and not the exact working hours per week. Consequently, the part-time workers are a very heterogeneous group since an individual in this group could work as little as one hour per week or as much as 34 hours per week.
11
The average wage is included by using the logarithm of the mean wage per organization. We expect the coefficient to have a positive sign. One reason is given by Kahn und Curme (1987). They argue that the mean wage can be seen as a proxy for human capital in a firm. Firms with a high average wage employ on average higher qualified personnel. Lazear and Shaw (2007) argue that firms that pay a high mean wage are expected to have a higher wage dispersion for reasons of complementarity. They illustrate their point with the following example: A law firm also needs cleaning personnel, but a cleaning firm does not necessarily need a lawyer. Another argument is of statistical nature: The wage dispersion is right-skewed in most cases meaning that wages are limited at the lower end of the distribution because of minimum wage legislation or collective agreements but have a less strict limitation at the upper end of the distribution. Consequently, firms with a high average wage have more possibilities to vary their wages as opposed to firms with a low average wage.
In addition, we add two collective agreement dummies, one that states if an organization does not pay according to a collective agreement, but orientates itself on an existing collective agreement. A second dummy is included if an organization has no collective agreement. Organizations having one or more collective agreements form the reference category. We add these two variables because it has often been shown that organizations with collective agreements have a lower wage dispersion (see e.g. Bechtel, et al. 2005; Canal Dominguez and Rodriguez Gutierrez 2004; Dell'Aringa and Lucifora 1994; Gerlach and Stephan 2005; Gerlach and Stephan 2006a; Gosling and Machin 1995; Metcalf, Hansen and Charlwood 2000; Rodriguez Gutierrez 2001).
We also add the log of paid full-time equivalents. This serves as a measure for the size of the organization. We expect bigger organizations to have a higher wage dispersion as has been shown by other authors for the for-profit sector (Lallemand and Rycx 2006; Davis and Haltiwanger 1995; Haltiwanger and Davis 1996).
Table 1 summarizes all of the variables used in the regression as well as the expected sign of the coefficients. Table 2 shows frequencies, means, standard deviations as well as minima and maxima for all variables used in the regression.
RESULTS
Public subsidies are the most important of the income variables. On average, 28% of total income is reported to stem from public subsidies, while 23% comes from public contracts, 6% and 2% come from donations . More than half of the organizations – 59% – employ volunteer workers. Most frequently, organizations are active in the fields of health, veterinary or social services followed by other public or personal services including advocacy groups and small associations. Other activity categories are ‘accommodation and housing’, ‘research and development’, ‘education’ and ‘culture, sports and entertainment’. Concerning the question if an organization has a collective agreement a good third of the organizations report to
12
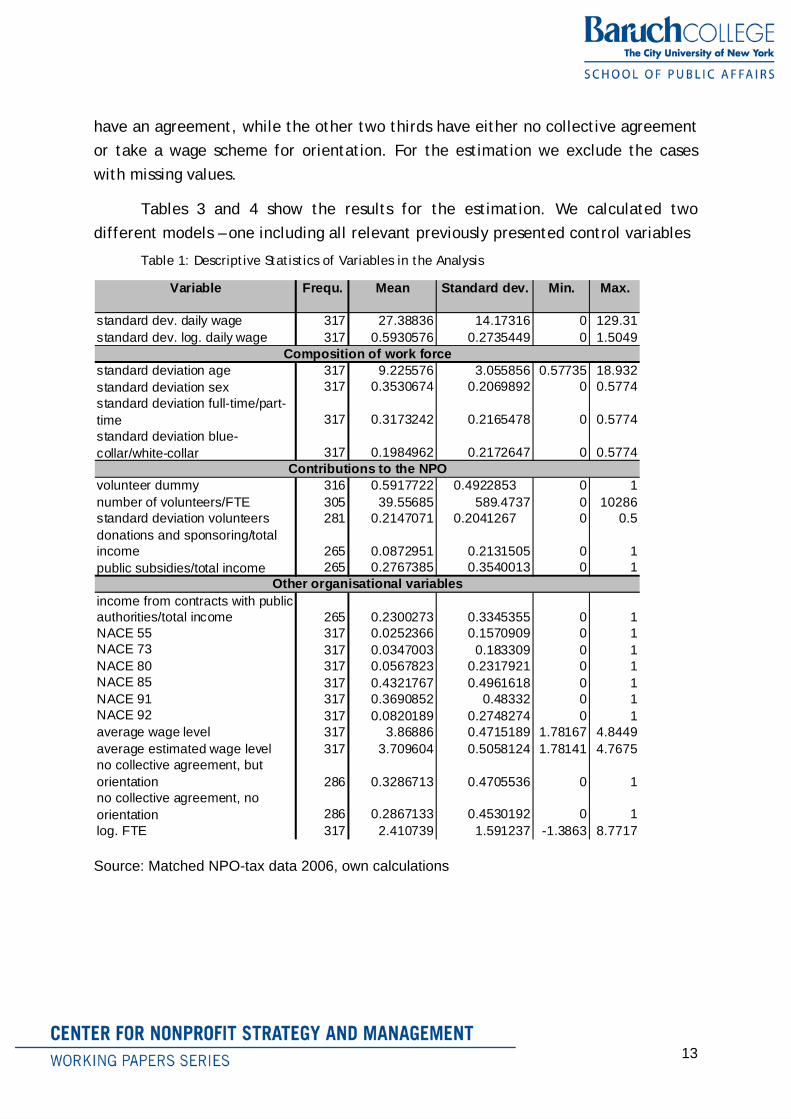
have an agreement, while the other two thirds have either no collective agreement or take a wage scheme for orientation. For the estimation we exclude the cases with missing values.
Tables 3 and 4 show the results for the estimation. We calculated two different models – one including all relevant previously presented control variables
Table 1: Descriptive Statistics of Variables in the Analysis
Variable Frequ. Mean Standard dev. Min. Max.
standard dev. daily wage 317 27.38836 14.17316 0 129.31standard dev. log. daily wage 317 0.5930576 0.2735449 0 1.5049
standard deviation age 317 9.225576 3.055856 0.57735 18.932standard deviation sex 317 0.3530674 0.2069892 0 0.5774standard deviation full-time/part-time 317 0.3173242 0.2165478 0 0.5774standard deviation blue-collar/white-collar 317 0.1984962 0.2172647 0 0.5774
volunteer dummy 316 0.5917722 0.4922853 0 1number of volunteers/FTE 305 39.55685 589.4737 0 10286standard deviation volunteers 281 0.2147071 0.2041267 0 0.5donations and sponsoring/total income 265 0.0872951 0.2131505 0 1public subsidies/total income 265 0.2767385 0.3540013 0 1
income from contracts with public authorities/total income 265 0.2300273 0.3345355 0 1NACE 55 317 0.0252366 0.1570909 0 1NACE 73 317 0.0347003 0.183309 0 1NACE 80 317 0.0567823 0.2317921 0 1NACE 85 317 0.4321767 0.4961618 0 1NACE 91 317 0.3690852 0.48332 0 1NACE 92 317 0.0820189 0.2748274 0 1average wage level 317 3.86886 0.4715189 1.78167 4.8449average estimated wage level 317 3.709604 0.5058124 1.78141 4.7675no collective agreement, but orientation 286 0.3286713 0.4705536 0 1no collective agreement, no orientation 286 0.2867133 0.4530192 0 1log. FTE 317 2.410739 1.591237 -1.3863 8.7717
Composition of work force
Contributions to the NPO
Other organisational variables
Source: Matched NPO-tax data 2006, own calculations
13
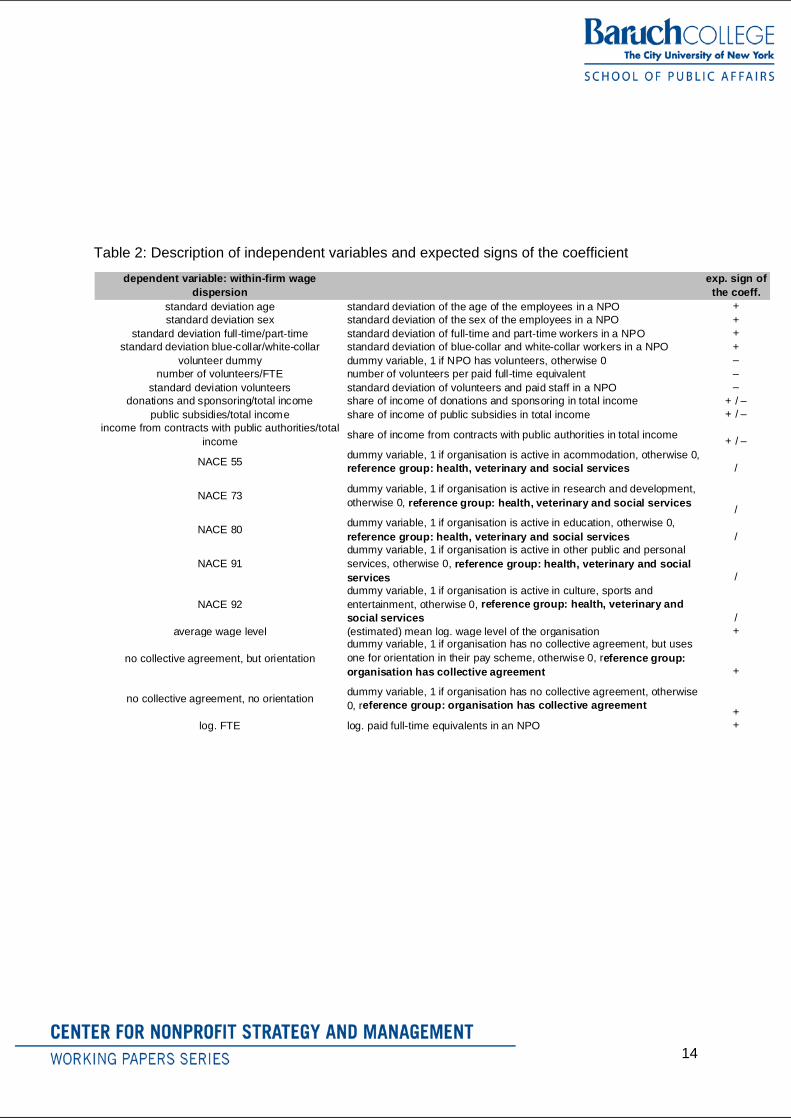
Table 2: Description of independent variables and expected signs of the coefficient
dependent variable: within-firm wage dispersion
exp. sign of the coeff.
standard deviation age standard deviation of the age of the employees in a NPO +standard deviation sex standard deviation of the sex of the employees in a NPO +
standard deviation full-time/part-time standard deviation of full-time and part-time workers in a NPO +standard deviation blue-collar/white-collar standard deviation of blue-collar and white-collar workers in a NPO +
volunteer dummy dummy variable, 1 if NPO has volunteers, otherwise 0 –number of volunteers/FTE number of volunteers per paid full-time equivalent –
standard deviation volunteers standard deviation of volunteers and paid staff in a NPO –donations and sponsoring/total income share of income of donations and sponsoring in total income + / –
public subsidies/total income share of income of public subsidies in total income + / –income from contracts with public authorities/total
income share of income from contracts with public authorities in total income + / –
NACE 55 dummy variable, 1 if organisation is active in acommodation, otherwise 0, reference group: health, veterinary and social services /
NACE 73 dummy variable, 1 if organisation is active in research and development, otherwise 0, reference group: health, veterinary and social services /
NACE 80 dummy variable, 1 if organisation is active in education, otherwise 0, reference group: health, veterinary and social services /
NACE 91dummy variable, 1 if organisation is active in other public and personal services, otherwise 0, reference group: health, veterinary and social services /
NACE 92dummy variable, 1 if organisation is active in culture, sports and entertainment, otherwise 0, reference group: health, veterinary and social services /
average wage level (estimated) mean log. wage level of the organisation +
no collective agreement, but orientationdummy variable, 1 if organisation has no collective agreement, but uses one for orientation in their pay scheme, otherwise 0, reference group: organisation has collective agreement +
no collective agreement, no orientation dummy variable, 1 if organisation has no collective agreement, otherwise 0, reference group: organisation has collective agreement +
log. FTE log. paid full-time equivalents in an NPO +
14
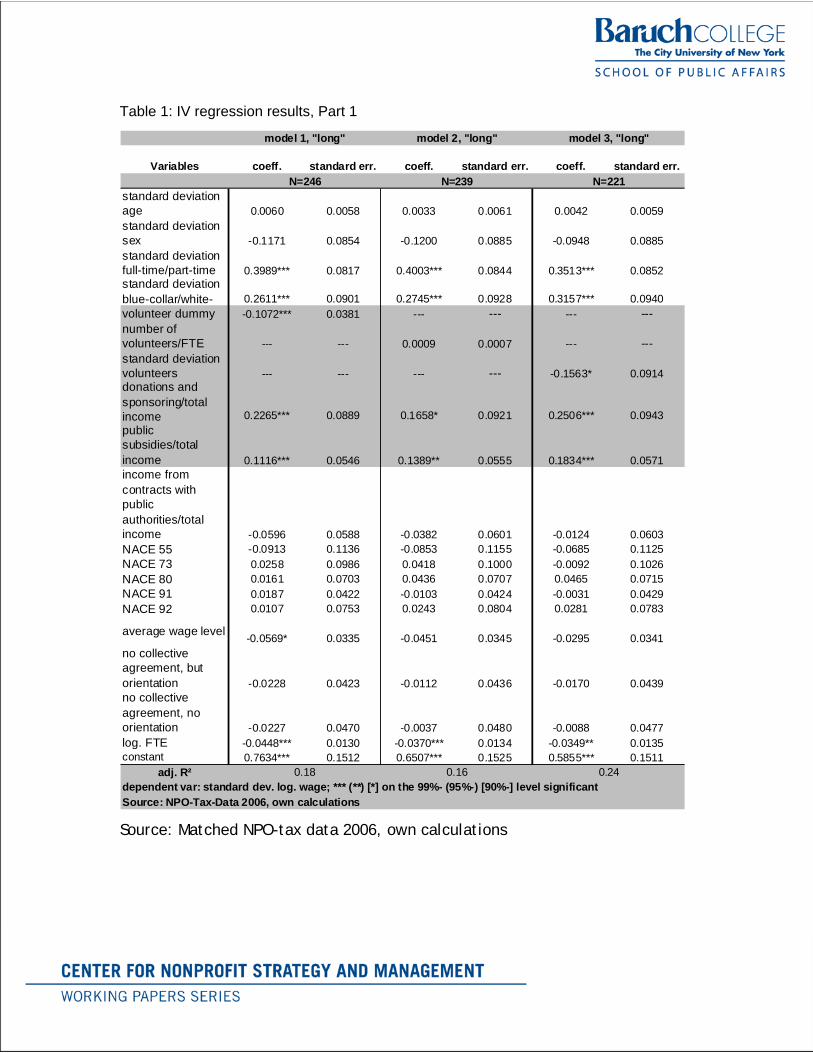
Table 1: IV regression results, Part 1
Variables coeff. standard err. coeff. standard err. coeff. standard err.
standard deviation age 0.0060 0.0058 0.0033 0.0061 0.0042 0.0059standard deviation sex -0.1171 0.0854 -0.1200 0.0885 -0.0948 0.0885standard deviation full-time/part-time 0.3989*** 0.0817 0.4003*** 0.0844 0.3513*** 0.0852standard deviation blue-collar/white- 0.2611*** 0.0901 0.2745*** 0.0928 0.3157*** 0.0940volunteer dummy -0.1072*** 0.0381 --- --- --- ---number of volunteers/FTE --- --- 0.0009 0.0007 --- ---standard deviation volunteers --- --- --- --- -0.1563* 0.0914donations and sponsoring/total income 0.2265*** 0.0889 0.1658* 0.0921 0.2506*** 0.0943public subsidies/total income 0.1116*** 0.0546 0.1389** 0.0555 0.1834*** 0.0571income from contracts with public authorities/total income -0.0596 0.0588 -0.0382 0.0601 -0.0124 0.0603NACE 55 -0.0913 0.1136 -0.0853 0.1155 -0.0685 0.1125NACE 73 0.0258 0.0986 0.0418 0.1000 -0.0092 0.1026NACE 80 0.0161 0.0703 0.0436 0.0707 0.0465 0.0715NACE 91 0.0187 0.0422 -0.0103 0.0424 -0.0031 0.0429NACE 92 0.0107 0.0753 0.0243 0.0804 0.0281 0.0783
average wage level -0.0569* 0.0335 -0.0451 0.0345 -0.0295 0.0341no collective agreement, but orientation -0.0228 0.0423 -0.0112 0.0436 -0.0170 0.0439no collective agreement, no orientation -0.0227 0.0470 -0.0037 0.0480 -0.0088 0.0477log. FTE -0.0448*** 0.0130 -0.0370*** 0.0134 -0.0349** 0.0135constant 0.7634*** 0.1512 0.6507*** 0.1525 0.5855*** 0.1511
adj. R² 0.18
model 2, "long"
Source: NPO-Tax-Data 2006, own calculationsdependent var: standard dev. log. wage; *** (**) [*] on the 99%- (95%-) [90%-] level significant
N=246 N=239
0.16
model 1, "long"
0.24
model 3, "long"
N=221
Source: Matched NPO-tax data 2006, own calculations
16
Table 2: IV Regression Results, Part 2
Variables coeff. standard err. coeff. standard err. coeff. standard err.
standard deviation age 0.0021 0.0054 0.0010 0.0056 0.0016 0.0054standard deviation sex -0.0844 0.0795 -0.0865 0.0816 -0.0704 0.0817standard deviation full-time/part-time 0.3457*** 0.0758 0.3521*** 0.0778 0.3083*** 0.0782standard deviation blue-collar/white-collar 0.2145*** 0.0792 0.2399*** 0.0812 0.2974*** 0.0821volunteer dummy -0.0787** 0.0338 --- --- --- ---number of volunteers/FTE --- --- 0.0010 0.0007 --- ---standard deviation volunteers --- --- --- --- -0.1383* 0.0835donations and sponsoring/total income 0.2585*** 0.0814 0.2135** 0.0833 0.2887*** 0.0849public subsidies/total income 0.1290** 0.0524 0.1463*** 0.0530 0.1895*** 0.0542income from contracts with public authorities/total income -0.0941* 0.0554 -0.0741 0.0565 -0.0447 0.0569NACE 55 --- --- --- ---NACE 73 --- --- --- ---NACE 80 --- --- --- --- --- ---NACE 91 --- --- --- --- --- ---NACE 92 --- --- --- --- --- ---
average wage level-0.0539* 0.0320 -0.0420 0.0328 -0.0254 0.0322
no collective agreement, but orientation --- --- --- --- --- ---no collective agreement, no orientation --- --- --- --- --- ---log. FTE --- --- --- --- --- ---constant 0.6740*** 0.1373 0.5791*** 0.1369 0.5128*** 0.1349
adj. R² 0.23
N=237
Source: NPO-Tax-Data 2006, own calculations
0.18
N=264
dependent var: standard dev. log. wage; *** (**) [*] on the 99%- (95%-) [90%-] level significant
model 2, "short"
N=256
0.17
model 1, "short" model 3, "short"
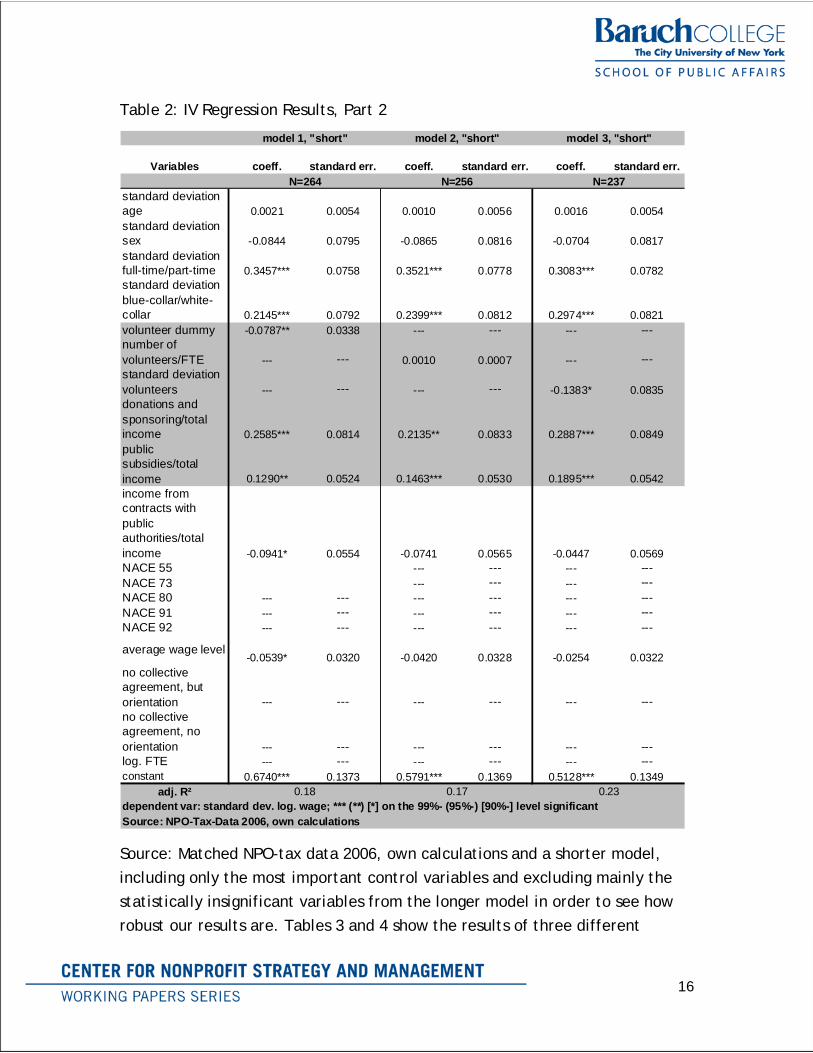
Source: Matched NPO-tax data 2006, own calculations and a shorter model, including only the most important control variables and excluding mainly the statistically insignificant variables from the longer model in order to see how robust our results are. Tables 3 and 4 show the results of three different
17
models all estimated in a ‘long” and ‘short” version. Model 1 includes a voluntary dummy, model 2 the number of volunteers per full-time equivalent and model 3 the standard deviation of volunteers and paid staff.
The shorter model does not include a number of organizational control variables. This was done in order to check how robust the results are. Comparing the results from the ‘long” and ‘short” models we detect that the results do not differ dramatically. All coefficients show the same algebraic sign, the statistical significance differs for some variables. Looking at the adjusted R² values we see that the additional organizational variables have hardly any explanatory value. Model 3 has the highest adjusted R² value.
The volunteer dummy in model 1 has a negative coefficient that is statistically different from 0. The standard deviation of the logarithms of the daily wage is approx. 0.08 (and 0.11 ‘long” model) smaller in organizations with volunteers. The relation of volunteers to paid full-time equivalents shows no statistically significant results which can be seen in the results of model 2. Model 3 also has a negative coefficient. A higher standard deviation leads to a lower wage dispersion. Put differently, a more even volunteer/paid staff mix entails a lower wage dispersion within the organization. The coefficient for the volunteer dummy is, as expected, negative. Organizations that employ volunteer workers have an approx. 10% lower wage dispersion compared to organizations without volunteers. While the results for the number of volunteers per full-time equivalent are not significant, the standard deviation exhibits a statistically significant negative result. This tells us, that wage dispersion does not get lower as the number of volunteers goes up but rather the mix between paid and unpaid workers is relevant.
A high proportion of donations of the total income raises the wage dispersion. By augmenting the share of donations on the total income by 1 percentage point, the standard deviation of the log daily wage raises between 0.17 (model 2, ‘long”) and 0.29 (model 3, ‘short”). Higher subsidies cause a higher wage dispersion. If the share of subsidies raises by 1 percentage point, the wage dispersion raises by 0.11 (model 1, ‘long”) or 0.19 (model 3, ‘short”). Donations and subsidies show a positive sign and allow for a higher variability in wages. Donations in relation to total income show a positive coefficient. Organizations that have a comparatively high part of their income from donations have a higher wage dispersion, the same is true for public subsidies, although the coefficient is much smaller than the one of the donations variable.
Results for the other control variables show that only few other variables have a significant influence on the wage dispersion. Among them are the standard deviation of the full-time/part-time workers, the standard deviation of blue-collar/white-collar workers, the logarithm of full-time equivalents, and, in model 1, the (instrumented) average wage level in the organization. The first two variables have, as expected, a positive sign. Surprisingly, the
18
latter two have negative signs, meaning that a higher average wage and more paid employees in the organization lead to a smaller wage dispersion.
Results for estimations with the alternative dispersion measures as dependent variables – the log of the standard deviation of daily wages and the 0.9/0.1 quantile ratio – can be found in the appendix.
DISCUSSION
There has been very little research on wage dispersion within nonprofit organizations. Previous research has led to the expectation that the wage dispersion is smaller in nonprofit organizations as compared to for profits. Fairness perceptions and high moral ideals of workers within this sector are often cited as reasons for this assumption. Also, hierarchies are often flat in NPOs, pay is less often performance related and managerial wages are often lower than in the for profit sector.
The distribution of wages across different groups of employees is closely related to concepts and perceptions of fairness. For mission-based organizations fairness could matter in its own right and for legitimacy reasons. The logic and mechanism behind an organization’s wage dispersion may also assume particular importance in motivating and retaining employees (e.g. Winter-Ebmer and Zweimüller 1999, Gerlach and Stephan 2006b). Most economic models on job satisfaction and quitting intentions highlight relative wages as a key factor of workplace choices (e.g. Pfeffer and Langton 1993; Rees 1993). In the specific case of NPO workers — while also considering their personal pay and career opportunities — are more likely to respond to an organization’s mission and values which are more likely to connect to concepts of solidarity and equality than in a for-profit environment (Leete 2000). As a consequence, employees in NPOs might be particularly perceptive about intra-firm wage dispersion — possibly even unusually ‘dispersion averse’ as compared to workers in the for-profit world. NPOs rely heavily on their employees‘ intrinsic motivation and identification with the organization in order to achieve their organizational goals. Therefore, NPOs try to strengthen intrinsic motivation, adherence to group norms and organizational pride partly through wage equity (Leete 2000, p. 428).
CONCLUSION
This paper analyzes if there are nonprofit-specific characteristics that influence wage dispersion in nonprofit organizations. We highlighted volunteers, donations and public subsidies as possible influences. Our hypotheses were that volunteers influence wage dispersion in a negative fashion. For the donations and public subsidies variables we found reasons both why they could positively or negatively influence wage dispersion, so that our expectations were ambiguous.
19
In order to answer the research question we used aggregated information of individuals matched with organizational data. We used the standard deviation of the log wages of workers as a dispersion measure and also alternative measures that are presented in the appendix of the paper. We estimated an instrument variable regression and found that organizations that employ volunteer workers have, as expected, a smaller wage dispersion. A more even mix between paid and unpaid staff leads to a lower wage dispersion. Donations and public subsidies augment the wage dispersion. The effect of volunteer involvement leading to a lower wage dispersion can perhaps be explained with the high importance of the mission in organizations with volunteers. High intrinsic motivation and fair wages are especially relevant in such NPOs. Volunteers can then be understood as a “measure” for the intrinsic motivation of paid employees.
Future research is might explore the nature of the, activities and jobs of both volunteers and paid employees in order to explain the effects of volunteer activities and wage dispersion in greater detail. Estimations could also be enhanced by using more detailed information about the employees such as education, employment duration or their exact position within the organization.
This paper also points out that there are different measures of wage dispersion. These differences and their effects on the results have hardly been discussed in empirical analyzes and should be in the focus of interest in future research. We also discussed another possibility to measure dispersion of exogenous variables. Instead of using percentages we took the standard deviation and also presented its advantage over using percentages.
APPENDIX
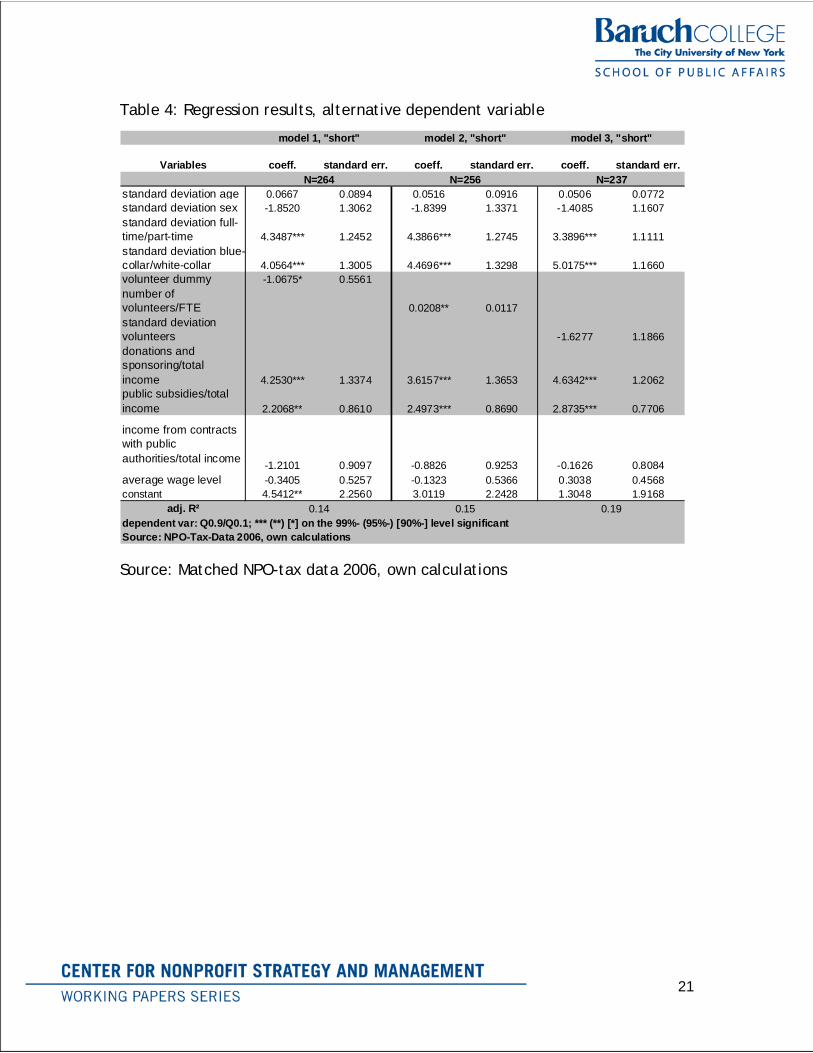
We present regression results for two alternative dependent variables (tables 5 and 6): the logarithm of the standard deviation of the daily wages and the 90th/10th quantile ratio:

20
Table 3: Regression results, alternative dependent variable
Variables coeff. standard err. coeff. standard err. coeff. standard err.
standard deviation age 0.0081 0.0118 0.0074 0.0123 0.0085 0.0122standard deviation sex 0.1342 0.1772 0.1863 0.1837 0.2303 0.1885standard deviation full-time/part-time 0.8641*** 0.1618 0.9011*** 0.1683 0.8424*** 0.1733standard deviation blue-collar/white-collar 0.4110** 0.1718 0.4731*** 0.1783 0.5352*** 0.1855volunteer dummy -0.2326*** 0.0726 -- -- -- --number of volunteers/FTE -- -- 0.0015 0.0015 -- --standard deviation volunteers -- -- -- -- -0.4098** 0.1853donations and sponsoring/total income 0.2349 0.1758 0.1068 0.1832 0.2572 0.1907public subsidies/total income 0.0789 0.1120 0.1425 0.1150 0.2085* 0.1204
income from contracts with public authorities/total income
-0.1132 0.1199 -0.0633 0.1239 -0.0238 0.1275average wage level 0.3957*** 0.1103 0.4093*** 0.1132 0.4506*** 0.1146constant 1.3303*** 0.4335 1.0777** 0.4384 0.9413** 0.4505
adj. R²dependent var: log. standard dev. wage; *** (**) [*] on the 99%- (95%-) [90%-] level significantSource: NPO-Tax-Data 2006, own calculations
model 3, "short"
N=255N=263 N=236
model 1, "short" model 2, "short"
0.150.18 0.18
Source: Matched NPO-tax data 2006, own calculations
21
Table 4: Regression results, alternative dependent variable
Variables coeff. standard err. coeff. standard err. coeff. standard err.
standard deviation age 0.0667 0.0894 0.0516 0.0916 0.0506 0.0772standard deviation sex -1.8520 1.3062 -1.8399 1.3371 -1.4085 1.1607standard deviation full-time/part-time 4.3487*** 1.2452 4.3866*** 1.2745 3.3896*** 1.1111standard deviation blue-collar/white-collar 4.0564*** 1.3005 4.4696*** 1.3298 5.0175*** 1.1660volunteer dummy -1.0675* 0.5561number of volunteers/FTE 0.0208** 0.0117standard deviation volunteers -1.6277 1.1866donations and sponsoring/total income 4.2530*** 1.3374 3.6157*** 1.3653 4.6342*** 1.2062public subsidies/total income 2.2068** 0.8610 2.4973*** 0.8690 2.8735*** 0.7706
income from contracts with public authorities/total income -1.2101 0.9097 -0.8826 0.9253 -0.1626 0.8084average wage level -0.3405 0.5257 -0.1323 0.5366 0.3038 0.4568constant 4.5412** 2.2560 3.0119 2.2428 1.3048 1.9168
adj. R²
model 1, "short" model 2, "short" model 3, "short"
N=264 N=256 N=237
0.14dependent var: Q0.9/Q0.1; *** (**) [*] on the 99%- (95%-) [90%-] level significant
0.15 0.19
Source: NPO-Tax-Data 2006, own calculations
Source: Matched NPO-tax data 2006, own calculations
22
REFERENCES
Akerlof, George A. and Janet L. Yellen (1990). The Fair Wage-Effort Hypothesis and Unemployment. The Quarterly Journal of Economics. 105(2): 255-283.
Ballou, Jeffrey P. and Burton A. Weisbrod (2003). Managerial Rewards and the Behavior of For-Profit, Governmental and Nonprofit Organizations: Evidence from the Hospital Industry. Journal of Public Economics. 87(9-10): 1895-1920.
Bechtel, Stephan, Wolf Dieter Heinbach and Harald Strotmann (2005). Tarifbindung, betriebliche Lohnöhe und Lohnstreuung im Produzierenden Gewerbe Baden-Württembergs, in: Forschungsdatenzentrum der Statistischen Landesämter (ed.), Amtliche Mikrodaten für die Sozial- und Wirtschaftswissenschaften, Beiträge zu den Nutzerkonferenzen des FDZ der Statistischen Landesämter 2005 (pp. 159 - 178). Düsseldorf: Statistische Landesämter: 159 - 178.
Borjas, George J., H. E. Frech, III and Paul B. Ginsburg (1983). Property Rights and Wages: The Case of Nursing Homes. The Journal of Human Resources. 18(2): 231-247.
Canal Dominguez, Juan Francisco and Cesar Rodriguez Gutierrez (2004). Collective Bargaining and Within-firm Wage Dispersion in Spain. British Journal of Industrial Relations. 42(3): 481-506.
Davis, Steven J. and John C. Haltiwanger (1995). Employer Size and the Wage Structure in U.S. Manufacturing. NBER Working Paper Series. 5393.
Dell'Aringa, Carlo and Claudio Lucifora (1994). Wage Dispersion and Unionism: Do Unions Protect Low Pay? International Journal of Manpower. 15(2/3): 150-169.
Depken, Craig A. (2000). Wage disparity and team productivity: evidence from major league baseball. Economics Letters. 67: 87-92.
Emanuele, Rosemarie (1996). Is there a (downward sloping) demand curve for volunteer labour? Annals of Public and Cooperative Economics. 67(2): 193-208.
Frank, Robert (1984). Are Workers Paid Their Marginal Product? American Economic Review. 74(5): 549-571.
Freeman, Richard B. (1980). Unionism and the Dispersion of Wages. Industrial and Labor Relations Review. 34(1): 3-23.
Freeman, Richard B. (1982). Union Wage Practices and Wage Dispersion within Establishments. Industrial and Labor Relations Review. 36(1): 3-21.
Frumkin, Peter and Elizabeth Keating (2001). The Price of Doing Good: Executive Compensation in Nonprofit Organizations. Hauser Center Working Paper Series. Harvard University. 8.
Gerlach, Knut and Gesine Stephan (2005). Wage Distribution by Wage-Setting Regime. IAB Discussion Paper. 9/2005.
Gerlach, Knut and Gesine Stephan (2006a). Bargaining Regimes and Wage Dispersion. Jahrbücher für Nationalökonomie und Statistik. 226(6): 629-645.
Gerlach, Knut and Gesine Stephan (2006b). Pay Policies of Firms and Collective Wage Contracts - An Uneasy Partnership? Industrial Relations. 45(1): 47 - 67.
Gosling, Amanda and Stephen Machin (1995). Trade Unions and the Dispersion of Earnings in British Establishments, 1980-1990. Oxford Bulletin of Economics and Statistics. 57(2): 167-184.
23
Hallock, Kevin F. (2002). Managerial Pay and Governance in American Nonprofits. Industrial Relations: A Journal of Economy & Society. 41(3): 377-406.
Haltiwanger, John C. and Steven J. Davis (1996). Employer Size and the Wage Structure in U.S. Manufacturing. Annales d'Economie et de Statistique. 41/42(4): 324-367.
Handy, Femida, Laurie Mook and Jack Quarter (2008). The Interchangeability of Paid Staff and Volunteers in Nonprofit Organizations. Nonprofit and Voluntary Sector Quarterly. 37(1): 76-92.
James, Robert G. and Mark J. Morlock (1987). The determinants of intra-occupational wage dispersion. Applied Economics. 19(7): 969-981.
Kahn, Lawrence M. and Michael Curme (1987). Unions and Nonunion Wage Dispersion. The Review of Economics and Statistics. 69(4): 600-607.
Kornai, Janos (1986). The soft budget constraint. Kyklos. 39(1): 3-30. Kornai, Janos (1998). The Place of the Soft Budget Constraint Syndrome in Economic
Theory. Journal of Comparative Economics. 26(1): 11-17. Lallemand, Thierry and Francois Rycx (2006). Establishment Size and the Dispersion of
Wages: Evidence from European Countries. Applied Economics Quarterly. 52(4): 309-336.
Lazear, Edward P. and Sherwin Rosen (1981). Rank-Order Tournaments as Optimum Labor Contracts. The Journal of Political Economy. 89(5): 841-864.
Lazear, Edward P. and Kathryn L. Shaw (2007). Wage Structure, Raises and Mobility: International Comparisons of the Structure of Wages Within and Across Firms, in: Edward P. Lazear & Kathryn L. Shaw (eds.), An International Comparison of the Structure of Wages: University of Chicago Press, NBER.
Leete, Laura (2000). Wage equity and employee motivation in nonprofit and for-profit organizations. Journal of Economic Behavior and Organization. 43: 423-446.
Leete, Laura (2001). Whither the Nonprofit Wage Differential? Estimates from the 1990 Census. Journal of Labor Economics. 19(1): 136 - 169.
Levine, David I. (1991). Cohesiveness, Productivity, and Wage Dispersion. Journal of Economic Behavior and Organization. 15: 237-255.
Machin, Stephen and Alan Manning (2004). A Test of Competitive Labor Market Theory: The Wage Structure Among Care Assistants in the South of England. Industrial and Labor Relations Review. 57(3): 371-385.
Mansfield, Edwin (1997). Microeconomics (9th international ed.). London, New York: W.W. Norton & Company.
Matched NPO-tax data 2006: NPO postal survey by STATISTIK AUSTRIA & Wirtschaftsuniversität Wien and Statistik der Lohnsteuer (Income tax statistics) by STATISTIK AUSTRIA (2006).
Menchik, Paul L. and Burton A. Weisbrod (1987). Volunteer Labor Supply. Journal of Public Economics. 32(2): 159-183.
Metcalf, David, Kirstine Hansen and Andy Charlwood (2000). Unions and the Sword of Justice: Unions and Pay Systems, Pay Inequality, Pay Discrimination and Low Pay. Center for Economic Performance Discussion Paper 452.
Mocan, H. Naci and Erdal Tekin (2003). An Analysis of Employer-Employee Matched Data of Child Care Workers. The Review of Economics and Statistics. 85(1): 38-50.
24
Netting, F. Ellen, Mary Katherine O'Connor, M. Lori Thomas and Gaynor Yancey (2005). Mixing and Phasing of Roles Among Volunteers, Staff, and Participants in Faith-Based Programs. Nonprofit and Voluntary Sector Quarterly. 34(2): 179-205.
Noguchi, Haruko and Satoshi Shimizutani (2007). Nonprofit/for-profit status and earning differentials in the Japanese at-home elderly care industry: Evidence from micro-level data on home helpers and staff nurses. Journal of the Japanese and International Economies. 21(1): 106-120.
Oster, Sharon (1998). Executive Compensation in the Nonprofit Sector. Nonprofit Management and Leadership. 8: 207 - 221.
Pfeffer, Jeffrey and Alison Davis-Blake (1990). Determinants of Salary Dispersion in Organizations. Industrial Relations. 29(1): 38-57.
Pfeffer, Jeffrey and Nancy Langton (1993). The Effect of Wage Dispersion on Satisfaction, and Working Collaboratively: Evidence from College and University Faculty. Administrative Science Quarterly. 38(3): 382-407.
Preston, Anne E. (1988). The Effects of Property Rights on Labor Costs of Nonprofit Firms: An Application to the Day Care Industry. Journal of Industrial Economics. 36: 337 - 350.
Rees, Albert (1993). The Role of Fairness in Wage Determination. Journal of Labor Economics. 11(1): 243-252.
Rodriguez Gutierrez, Cesar (2001). Wage dispersion within firms and collective bargaining in Spain. Economics Letters. 72: 381-386.
Roomkin, Myron J. and Burton A. Weisbrod (1999). Managerial Compensation and Incentives in For-Profit and Nonprofit Hospitals. Journal of Law Economics & Organization. 15(3): 750-781.
Ruhm, Christopher J. and Carey Borkoski (2003). Compensation in the Nonprofit Sector. Journal of Human Resources. 28(4): 992 - 1021.
Steinberg, Richard (2003). Economic Theories of Nonprofit Organizations. An Evaluation, in: Helmut K. Anheier & Avner Ben-Ner (eds.), The Study of the Nonprofit Enterprise. Theories and Approaches (pp. 277-309). New York: Kluwer Academic/Plenum Publishers: 277-309.
Winter-Ebmer, Rudolf and Josef Zweimüller (1999). Intra-firm Wage Dispersion and Firm Performance. Kyklos. 52(4): 555-572.