wis portal discussion
TRANSCRIPT
WIS Portal Strategy Discussion NWQMC – WIS MEETING 2/24/16 CHARLES KOVATCH, JIM KREFT

Overview
Recap of where we are
Mission and Vision
Portal Strategy Overview
Next steps
2

What is driving Portal Strategy?
Portal’s demonstrated success in high volume of visits and associated over 1 billion discrete result records downloaded since launched in April 2012.
3
0
500
1000
1500
2000
2500
3000
Jan-
13Fe
b-13
Ma
r-13
Apr
-13
Ma
y-13
Jun-
13Ju
l-13
Aug
-13
Sep
-13
Oct
-13
Nov
-13
Dec
-13
Jan-
14Fe
b-14
Ma
r-14
Apr
-14
Ma
y-14
Jun-
14Ju
l-14
Aug
-14
Sep
-14
Oct
-14
Nov
-14
Dec
-14
Jan-
15Fe
b-15
Ma
r-15
Apr
-15
Ma
y-15
Jun-
15Ju
l-15
Aug
-15
Sep
-15
Oct
-15
Nov
-15
Dec
-15
Jan-
16
Monthly Water Quality Portal Visits January 2013-January 2015
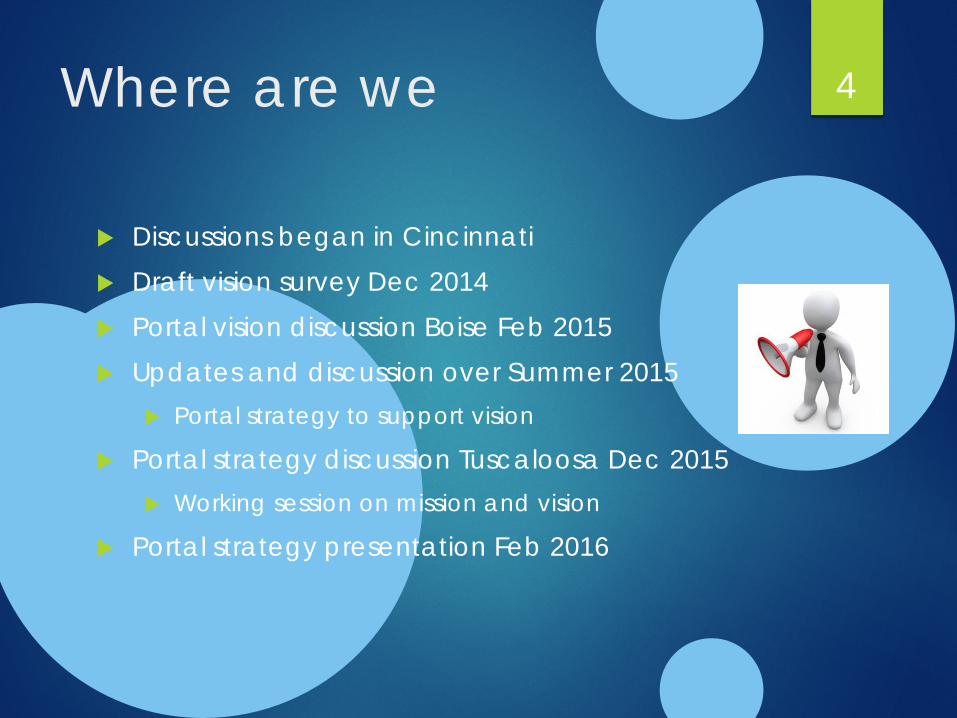
Where are we
Discussions began in Cincinnati Draft vision survey Dec 2014 Portal vision discussion Boise Feb 2015 Updates and discussion over Summer 2015
Portal strategy to support vision
Portal strategy discussion Tuscaloosa Dec 2015 Working session on mission and vision
Portal strategy presentation Feb 2016
4

Survey Takeaways
Conducted Survey Dec 2014 and discussion Boise Feb 2015
Reasons to use Portal – Search for data Challenges to using the Portal – Staff, funding,
other Like least about the Portal – the mapping and
query interface Like most about the Portal – access to data and
ease to query What want more of from the Portal – more federal
partners and simple data displays
5

Mission and Vision Vision Be the premiere source for water quality data for everyone,
everywhere. Vision: what is our desired end state? What are the major
issues or problems? What would success look like?
Mission Provide easy access to all water quality data, facilitate
improvements in data quality, and enhance data discovery and data summaries to inform sound water-quality decision making at local, state, regional, and national scales. Mission: Why we exist, Who are we, what do we do, why do
we do this work and for whom?
6

Portal Strategy
Portal Strategy Pyramid 5 sections of the Strategy Next Steps
7
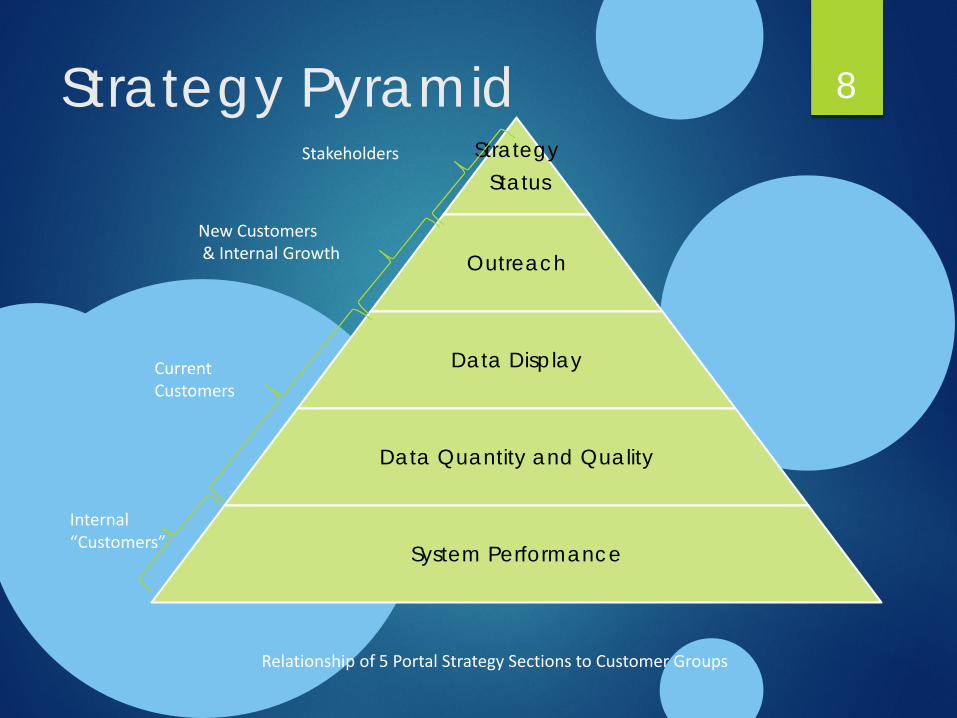
Strategy Pyramid 8 Strategy Status
Outreach
Data Display
Data Quantity and Quality
System Performance Internal “Customers”
Current Customers
New Customers & Internal Growth
Stakeholders
Relationship of 5 Portal Strategy Sections to Customer Groups

System Performance 9
The foundation of the Portal and Strategy success to deliver high quality data quickly Includes the development, operation and maintenance of
the Portal hardware (e.g. servers) Keep necessary software and system components fully
functional and up-to-date. Goals for 2016
1.1 Improve EPA delivery to Portal in STORET data transfer design plan
1.2 Evaluate Legacy data migration plan 1.3 Improve USGS delivery to Portal with expanded
BioData mapping to WQX and data from NATDB 1.4 Assess Portal platform and develop Portal system
platform update plan

Data Quantity and Quality
Quantity. Portal contains over 270 million physical, chemical and biological data records. There are still vast amounts of data from federal, state and tribal
agencies, watershed monitoring groups and other sources which are not yet available via the Portal.
The Portal currently does not serve habitat, metric, or index data.
Quality. There are still many inconsistencies in how data and metadata have been recorded by data owners including incorrect units and transcription errors.
Goals for 2016 2.1 Reduce data-in barriers by holding WQX Web training webinars
2.2 Work with states to submit biological data
2.3 Update Portal Services to serve habitat, metrics, index data.
2.4 Identify Data Quality issues, generate data quality plan and begin addressing issues.
10
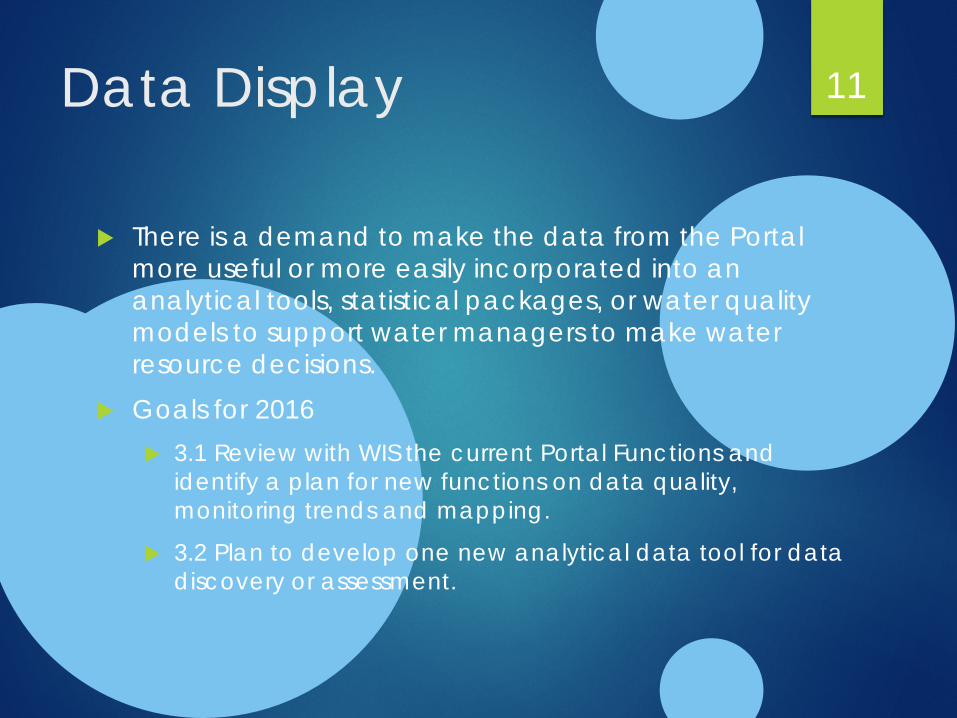
Data Display
There is a demand to make the data from the Portal more useful or more easily incorporated into an analytical tools, statistical packages, or water quality models to support water managers to make water resource decisions.
Goals for 2016 3.1 Review with WIS the current Portal Functions and
identify a plan for new functions on data quality, monitoring trends and mapping.
3.2 Plan to develop one new analytical data tool for data discovery or assessment.
11

Outreach
The full Council needs to communicate the Portal’s success in increasing the number of data records downloaded monthly, to both internal and external partners.
Goals for 2016 4.1 Increase Council Knowledge by developing outreach
plan, factsheet and conduct webinars
4.2 Identify data users and uses to develop a data user community framework and use case profiles
4.3 Identify new data suppliers, e.g. (1) new federal partner and (3) new state data suppliers
4.4 Write a peer reviewed paper on the Portal
12
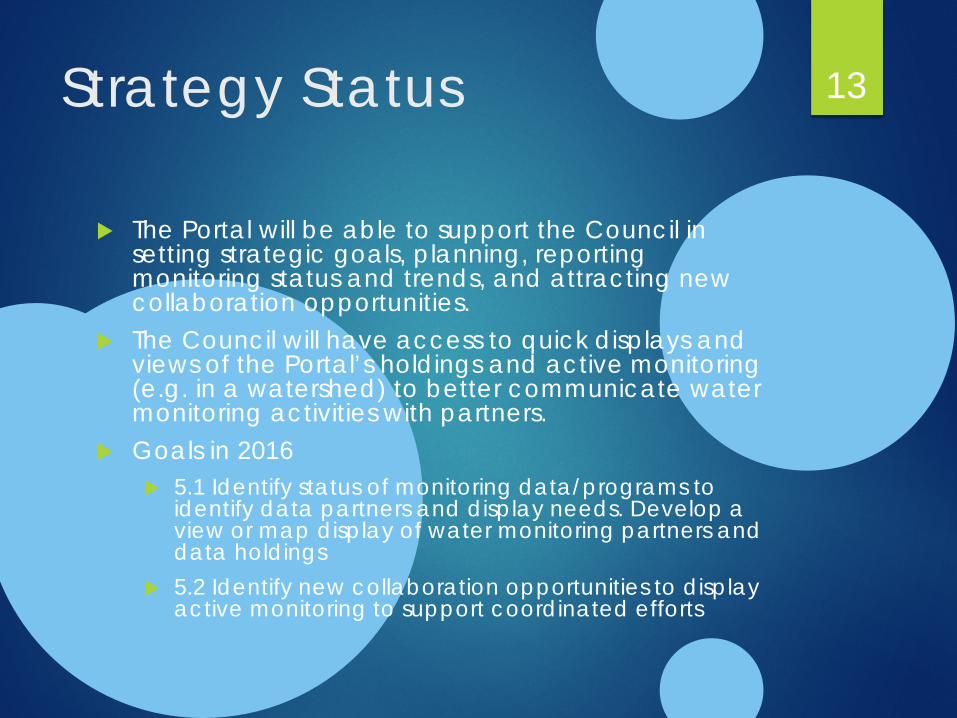
Strategy Status
The Portal will be able to support the Council in setting strategic goals, planning, reporting monitoring status and trends, and attracting new collaboration opportunities.
The Council will have access to quick displays and views of the Portal’s holdings and active monitoring (e.g. in a watershed) to better communicate water monitoring activities with partners.
Goals in 2016 5.1 Identify status of monitoring data/programs to
identify data partners and display needs. Develop a view or map display of water monitoring partners and data holdings
5.2 Identify new collaboration opportunities to display active monitoring to support coordinated efforts
13

Next Steps Feb - Hold discussions with Council on Strategy Mar - Regroup with WIS on Portal strategy Apr - Complete strategy and timeline through 2021 May - Present at NWQMC in Tampa Aug - Implement for FY2017 NWQMC and Portal
planning Dec – Revisit to evaluate performance
14