winter school mannual on waste recycling and resource
TRANSCRIPT
Winter School on “Waste recycling and resource management”-Dec. 3-23, 2014
Winter School Mannual
On
WASTE RECYCLING AND RESOURCE MANAGEMENT THROUGH RAPID COMPOSTING TECHNIQUES”
(3 rd to 23rd December 2014 )
Sponsored by
Indian Council of Agricultural Research (ICAR) New Delhi-110114
Indian Institute of Soil Science (IISS) Nabibagh, Berasia Road, Bhopal-462038 (M.P.)
1

Winter School on “Waste recycling and resource management”-Dec. 3-23, 2014
C O N T E N T S
S.No. Title Page No.
1 Urban Solid Waste Management- S.S. Khanna 3 2 Challenges and opportunities of organics on soil health sustenance-
A. Subba Rao 14
3 Potential for organic resources and their nutrient supply in India- Sanjay Srivastava
24
4 Soil Test based bio-intensive nutrient management in agriculture for achieving yield target- P. Dey
38
5 Methods for efficient recycling of different organic wastes in India and abroad- M.C. Manna
55
6 Recycling of farm wastes, municipal solid wastes and forest litter through rapid composting techniques- M.C. Manna
62
7 Recycling of Farm and Municipal Solid Wastes through Vermicomposting Technique- A.B. Singh
65
8 Soil Organic Matter: Decomposition Process and Stabilization mechanism- Pramod Jha
71
9 Nutrient enriched compost production and its role in improving crop productivity-M.C. Manna
78
10 Organic uses in Indian agriculture and paradigm shift in fertilizer policy- P.K. Ghosh, T. Kiran Kumar, Srinivasan R. and D.R. Palsaniya
91
11 Recycling of animal waste for sustainable production of forage and fodder crops- P. K. Ghosh, Srinivasan R and Manoj Chaudhary
103
12 Assessment of Crop Quality: Analytical Technique- A.B. Singh 114 13 Organic Manure in Integrated Nutrient Management for Enhancing
Productivity and Nutrient use Efficiencies in Different Cropping Systems-Muneshwar Singh
127
14 Recycling of Press Mud and Spent Wash in Agriculture-A.K. Biswas 142 15 Microbes and biogeochemical processes in organic recycling- S.R.
Mohanty 158
16 Nanotechnology in Soil Science and Plant Nutrition Studies- Tapan Adhikari
164
17 Impact of MSW Compost Application on Soil Health- Asit Mandal 178 18 Heavy metal status in different composts and their permissible
limits- J.K. Saha 189
19 Impact of Wastewater Application on Soil Health-M. Vassanda Coumar
195
20 Organics as Sources of Plant Nutrient for Improving Nutrient Use Efficiency- Brij Lal Lakaria
206
21 Microbial diversity on composting processes-M.C. Manna 214 22 Conservation Agricultural Practices for Enhancing Soil Organic
Carbon and Nutrient Availability-J. Somasundara 223
2

Winter School on “Waste recycling and resource management”-Dec. 3-23, 2014
23 Long-term Application of Manures and Fertilizers on Heavy Metals
Development in Soils-Tapan Adhikari 238
24 Biochemical Quality Assessment of Compost Prepared from Organic Wastes-A.B. Singh
252
25 Commercial Production of Vermicompost-M.C. Manna, A.B. Singh and A.K. Tripathi
265
26 Microbial Biodiversity: Present and Future of Soil Health-Asit Mandal
269
27 Mitigation options for greenhouse gas emissions from agricultural fields-S.R. Mohanty
290
28 Understanding the concept of Soil Quality Assessment-S. Kundu 303 29 Long-term use of organics on soil physical health- K. M. Hati 311 30 Efficient use of manures/ composts for crop production in organic
farming- K. Ramesh and A.B. Singh 321
31 Synchronization of nutrient release from manures and crop demand: N,P and S mineralization Characteristics of different organic manures in relation to their quality- Ashok K.Patra
337
32 Effect of use of sewage water, MSW and city wastes on crop quality parameters-Ajay
364
33 Role of microbes on greenhouse gas emission from compost-K. Bharati
403
34 Organic Manures in Integrated Nutrient Management for Enhancing Productivity and Nutrient Use Efficiency in Different Cropping System-R.H. Wanjari
410
35 Phytoremediation of heavy metals from polluted soil-S. Ramana 428 36 Impact of Industrial Waste and City Waste on Soil Quality-M.
Vassanda Coumar 434
37 Efficient use of sugar industrial waste for sustainable crop production and soil fertility- M.C. Manna and D.H. Phalke
449
38 Engineering intervention in composting-Vinod K. Bhargav and H.L. Kushwaha
456
39 Production of microbial enriched compost for higher crop yield-M.C. Manna
470
40 Green Manuring for Sustainable Agriculture-R.H. Wanjari 476 41 Recent Advances in BNF Researches-D.L.N. Rao 486 42 Recent advances in Biofertilizers Research and Applications- D.L.N.
Rao 495
3

Winter School on “Waste recycling and resource management”-Dec. 3-23, 2014
Urban Solid Waste Management
S.S. Khanna Former Planning Commission and Vice-Chancellor, NDUA&T, Faizabad
India has achieved remarkable growth in food production in the post-green revolution period by increasing from 90 MMT in 1969-70 to 247 MMT during 2013-14. But now we are witnessing the second generation problem like soil fatigue due to intensive cultivation and imbalanced use of fertilizers, declining soil organic carbon, lowering of water table, climate change and lack of plant genetic ideotype.
Of the 141 million ha of net sown area in the country, 78 million ha is rainfed, which is being regarded as a high risk venture. Moreover soil of these regions are highly deficient in plant nutrients such as nitrogen, phosphorus, zinc, copper, manganese, boron, molybdenum, zinc and others. Unabated land degradation, soil health and productivity, soil carbon, water resource and related problems are posing a great handicap in enhancing the productivity of various crops. Most recent technological approach namely Conservation Agriculture is largely based upon soil carbon and resource management on a long-term basis is being tried. In particular Integrated nutrient (INM) and farming system (IFM) approaches for higher resource use efficiency are also apart and parcel of this concept. The main idea is to enhance productivity of crops and thereby income and employment generation in rural areas. Wherever possible and market forces allow growing of high-value-low volume crops such as horticultural, medicinal aromatic, spices, plantation etc. may be cultivated. Even inclusion of livestock agroforestry and fisheries-based enterprises are necessary for supporting livelihood through simultaneous production of food, fodder, firewood and energy. Thus there is a need for redesigning support system and incentives with a better focus on natural resource management technology centered soil upon health and hi-tech agriculture which will ultimately contribute towards achieving self sufficiency and safety-nets in agricultural. Most of the Indian soils are deficient in nitrogen and phosphorus and it has been observed that soils are showing deficiency of sulphur, zinc, iron, boron molybdenum and other nutrients depending upon soil type, agro-climatic conditions. Naturally use of organics in agriculture is vital for heterotrophic organisms for providing energy and new cell formation. The cells of most micro-organism commonly contain approximately 50 per cent carbon. Since Indian soils are largely deficient in organic carbon the micro-biological activity is hindered stagnation in crop productivity is being witnessed in intensive cropping system agro-ecological zones. Not only the food production is being affected but as soil degradation and demonstration is taking place. It is therefore, vital for us to consider efficient utilization of all available organic wastes and meet the challenges for 2nd green revolution in Agriculture. Sustainable Agriculture
The rapidly increasing population in India, shrinking good quality land resource by urbanization and industrialization and environmental degradations have been a cause of concern for developing an agricultural system to be sustainable. Worldwide, this aspect scientifically is being discussed and examined. The Food and Agricultural Organization (FAO) of the United Nation, International Research Institutes and National Agricultural Research System (NARS) are deeply concerned of declining soil fertility and productivity, climate change, shortage of irrigation water, depletion of mineral resources and high cost of energy and inputs.
4

Winter School on “Waste recycling and resource management”-Dec. 3-23, 2014
Types of Rural and Urban Wastes
Following types of wastes are available from
(i) Human and Animal : Urine and excreta, bones and dead bodies
(ii) Agricultural Waste : Crop residues, dried plants, wild plants, trees pruning and felling
(iii) Environmental waste : Rainwater, wind and sunshine
(iv) House-hold waste : Kitchen waste, paper, plastic bottles, iron goods, sewage and sludge, used clothes and furniture and rags rubber coal
(v) Industrial waste : Marble waste, distillery effluent, spent wash, plastic coir pith, press mud etc.
(vi) Building and Road Sweeps : Stones, broken brick, silt, sand, paints, broken sanitary filling etc.
(vii) Garden, Park waste : Largely hard wooden, plant origin material
(viii) Mandi Waste : Vegetables
(ix) Electronic waste
(x) Hospital waste
Municipal Waste India’s population has expanded from 342 million in 1947 to 125 billion in 2014. Town planning, waste management, public hygiene and public health had not received due and required attention. Continued urban migration/ congregation of poor in city slums without safe water supply, toilets and sanitation have agrainted the problem, particularly that of sanitation. Thus urban solid wastes management (USWM) has remained one of the most neglected areas and also lack of land for safe disposal, financial and infrastructural support have been apathing at all levels namely people’s participations, local urban bodies, stage and central governments. In most cities nearly half of SWM generated remains unattended. This gives rise to unsanitary conditions which has resulted in an increase in morbidity and mortality especially that of children, women and senior citizens. Periodic out breaks of food borne, water borne and vector borne diseases occur in all cities. It is to be appreciated that our Hon’ble Prime Minister Sh. Narendra Modi Ji has launched “Swachha Bharat Abhiyan” on a large scale in the country. In fact, management of solid urban waste is not a problem, it is an opportunity if we handle this with a “ZERO” Garbage Concept” Scientifically and Systematically handle this vital
5
Winter School on “Waste recycling and resource management”-Dec. 3-23, 2014
asset and convert this problematic garbage into “Black Gold”. At the Indian Soil Science Institute, the technology developed can be easily implemented, if there is a will to do so. This technology is meets all parameters, namely; Technically feasible, economically viable, socially acceptable and eco-friendly. The aim of our present Govt of India: City Clean, Field Green target shall be achieved. Let us put on record that SWM consists of about 40 per cent biodegradable segment, 30 per cent of broken debris of houses, soiled clothes, sand, silt etc, and also being highly moist it is certainly not suitable for thermal technology. Experience and endeavour at Kanpur and Sukhdev Vihar, Delhi have not been fruitful. In 1986 waste-to-energy plant opened in Delhi at a cost of $ 10 million but it also failured. The National Green Tribunal has reported that Delhi is staring at a major management crises in 12th November 2014. Following are the in major recommendations: (i) Delhi has to start segregation of garbage at source
(ii) 50% of waste is fit for composting
(iii) 20% of the waste would reach landfills after segregation
(iv) Delhi waste is 9,200 tonnes daily
(v) Use manure for plants
(vi) Collect all paper and cardboard trash and sell them
(vii) Reuse as much plastic and glass as is possible
(viii) Avoid sachets, aluminium foil etc.
In other words, segregation at source, do recycling as much as possible, ensure sale of manure, check ground, air, water pollution at landfills and no burning of garbage for waste-energy plant.
Such orders are also to be executed in other metropolitan cities.
Report of the High Powered Committee On
Urban Solid Waste Management In India
Planning Commission, Government of India 1995
However, urban solid waste from Indian cities has low calorific value and high moisture content with high percentage of non-combustible material, hence it is generally unsuitable for thermal technologies. Systematic Composting Process
6

Winter School on “Waste recycling and resource management”-Dec. 3-23, 2014
During composting, biodegradable segment after being well segregated is decomposed by diverse microbes is the thin liquid films (biofilms on the surface of the organic particles). The composting process under optimal conditions can be divided into 7 stages:
Segregation of the garbage is most vital component of this process. This heterogeneous
and unsegregated waste is a mixture of biodegradable and non-biodegradable materials consisting of virtually very disposable time such as paper, plastics, metals, rubber, glass, medical disposable, tyre and tubes, ceramic/earthen pots, waste from construction activities (10-30), etc. It contains about 35-42% biodegradable compostable, 2-5% plastics, 0.5% rubber and leather, Rag-2.8%, glassware 4.5%, stone/soil – 31%, Tyre/tubes 3.3%, others (ceramics, earthenpots etc-14 %.
To the biodegradable material add microbial community including mesophillic fungi, and
keep moisture at 55-60% by volume and ensure aerobic condition. The proliferation of fungi and bacteria yield yeast and the temperature rises to 40º C. An increase in pH is favourable for bacteria that subsequently outcome fungi in this few hours or days. Actinomycetes develop more slowly than most bacteria and fungi and are ineffective competitors when nutrient levels are high. A wide range of proreanyotes produce analyse which is also important during the initial phase for degradation of starch.
Major microorganisms is the Mesophillic stage
Bacteria Fungi
Bacillus Sp Aspergillus
Cellumonas Fusarium
Thiobacillus Sps. Tricoderma
Pseudomonas Sps. Mucor
Helminthosphorium
(i) Thermophillic Phase
This phase is highly important not only for decomposing cellulose but also for killing the pathogenic and disease contaminants. Thermophillic phase of composting is initiated by microorganisms metabolizing proteins, increasing liberation of ammonium and causing subsequent ascalinization. Decrease in moisture and temperature rise between 40º– 60º C. Whereas the numbers and species diversity of thermophillic organisms in particular actinomycetes and fungi increase.
Major Organisms
7

Winter School on “Waste recycling and resource management”-Dec. 3-23, 2014
Bacteria Actinomycetes
Bacillus Sp Micro-monosperma
Strepto-thermophillus Nocardia
Fungi Streptomyces
Humicolla Termospora
Absidia Chectonium Thermopolyspora
(ii) Cooling/ Second Mesophillic Phase
After the thermophillic process ceases due to depletion of substrate the re-colonization of microbes take place and the bacteria decrease by 1-2 orders of amagnitude. Again the maturation bacteria are either introduced by inoculation or appear again. Their function gets involved in hydrogen, ammonium nitrite and sulphur-oxidation, nitrogen-fixation, exospolysaccharide production and nitrite production from ammonium under heterotrophic condition. High numbers of diverse mesophillic and thermotolerant actinomycetes and yeast reappear.
Fall of temperature lower water content and their ability to attend either degrade natural complex polymers (e.g. cellulose, hemicelluloses, lignocelluloses, lignum and favour mesophillic and thermophillic-tolerant fungi during the cooling phase.
(iii) Maturation Phase
During the naturation phase main activity main activity which takes place is degradation of the more resistant compounds and getting them parts transformed into humus. These compounds are lignis, lignocellulose and other recalcitrant compound of tree bard, yard wastes, agricultural hardy wastes etc. Paper may contain 20% of lignin. Most of the fungi are active and through enzymatic action attack at a low water content.
(iv) Humus Synthesis Phase
The end product of composting is Humus formation, in which compounds of natural origin are partially transformed into relatively stable substances. Humus is a black to dark brown compound, which has high molecular weight, very high CEC and is a store house of plant nutrients.
• Mature humified compost is characterized by • high content of stable organic matter rich in aromatic noleties. • refeading of soil with humus into soil microbes. • high nutrient supplying capacity • support better plant growth and health • minimum content of pollutant
(v) Composition of Humus
8
Winter School on “Waste recycling and resource management”-Dec. 3-23, 2014
The humus should contain the following minimum composition. Specifications as
mention in FCO (Annexure I).
(vi) Packing and Forwarded
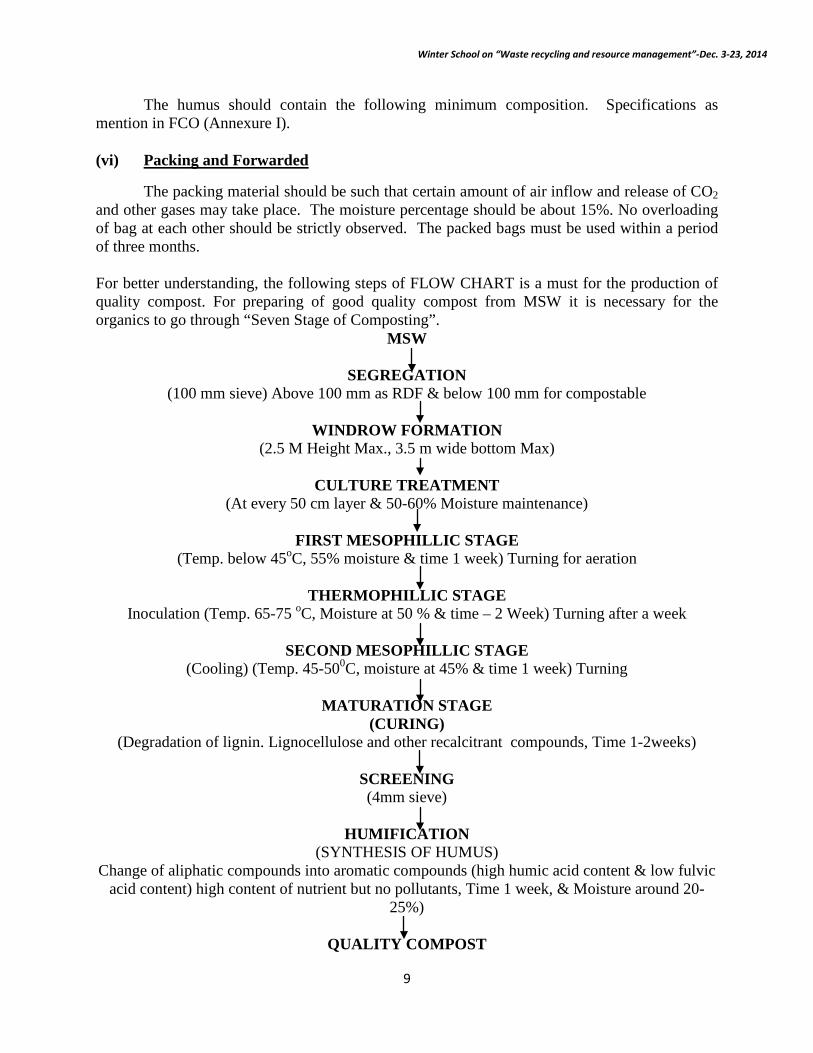
The packing material should be such that certain amount of air inflow and release of CO2 and other gases may take place. The moisture percentage should be about 15%. No overloading of bag at each other should be strictly observed. The packed bags must be used within a period of three months. For better understanding, the following steps of FLOW CHART is a must for the production of quality compost. For preparing of good quality compost from MSW it is necessary for the organics to go through “Seven Stage of Composting”.
MSW
SEGREGATION (100 mm sieve) Above 100 mm as RDF & below 100 mm for compostable
WINDROW FORMATION
(2.5 M Height Max., 3.5 m wide bottom Max)
CULTURE TREATMENT (At every 50 cm layer & 50-60% Moisture maintenance)
FIRST MESOPHILLIC STAGE
(Temp. below 45oC, 55% moisture & time 1 week) Turning for aeration
THERMOPHILLIC STAGE Inoculation (Temp. 65-75 oC, Moisture at 50 % & time – 2 Week) Turning after a week
SECOND MESOPHILLIC STAGE
(Cooling) (Temp. 45-500C, moisture at 45% & time 1 week) Turning
MATURATION STAGE (CURING)
(Degradation of lignin. Lignocellulose and other recalcitrant compounds, Time 1-2weeks)
SCREENING (4mm sieve)
HUMIFICATION
(SYNTHESIS OF HUMUS) Change of aliphatic compounds into aromatic compounds (high humic acid content & low fulvic
acid content) high content of nutrient but no pollutants, Time 1 week, & Moisture around 20-25%)
QUALITY COMPOST
9

Winter School on “Waste recycling and resource management”-Dec. 3-23, 2014
(AS PER FCO STANDARDS)
To achieve this above mentioned time frame and along with essentials inoculants and aeration shall be kept in mind. We have Indigenous & Effective Microbial culture as inoculants shall be effectively used. Turning for aeration should be ensured. This time frame of 8-10 weeks is sufficient for production of compost from biodegradable segment of MSW.
In case of agricultural waste recycling about 100 to115 days (30-45 days more time frame) is required for production of mature compost. Segregation step is not required for recycling of agricultural waste. Constraints
Since during scientific processing and composting the labour, energy and culture cost are greatly involved for the preparation and manufacturing of the good quality compost, the cost become unaffordable by small and marginal farmers. The Government of India and State Government should bear 50% of its cost of processing and marketing. If it is not implement this is an handicap.
Total subsidy will be around Rs.5,000 crore a year, while the Government of India is
bearing Rs.65,000 crore subsidy each year. Biodegradable waste
Biodegradable organic wastes such as crop residues, agro industrial organic wastes, city garbage and forest litter have wide C/N ratios ranging from 80 to 110, and low concentration of available plant nutrients particularly N, P and K. On the basis of crop production levels, it is estimated that ten major crops (rice, wheat, sorghum, pearl millet, barley, finger millet, sugarcane, potato tubers and pulses) of India generate about 792 Mt of crop residues, in which 201 million tonnes is actually available that has nutrient potential of about 4.865 million tonnes of NPK. The potential availability of all animal excreta is about 792 million tonnes of which 287.45 million tonnes is actually available that potentially supply 3.474 million tonnes of plant nutrients.
India's population has expanded from 342 million in 1947 to 1082.2 million by 2006 and expected to be 1250 million by 2015 AD. The population in 23 or more metro cities, having a population in excess of one million, account for more than one third of the total urban population. Indian cities will be among the most densely populated among the cities of the world. Metropolitan cities of India generated about 64.8 Mt of city refuse during 2010. These had a potential to prepare 9.1 Mt of compost. The production of MSW is expected to increase to 107 Mt by 2030. Big cities like Delhi, Mumbai and Kolkata with population greater than 10 million are generating 6,000 to 7,000 tonnes of MSW daily. Other cities such as Bhopal, Nagpur, Chennai, and Bangalore are producing about 3,000 tonnes of MSW/daily.
Urban Solid Waste is one of the most neglected areas of urban development in India. In most cities nearly 2/3rd of solid waste generated remains unattended. It is therefore imperative to improve urban solid waste management, so that the adverse health and environmental consequences of the rapid urbanization are minimized. Although about 40% of matter in MSW is considered to be biodegradable, only 14% (9.1 Mt) of the MSW were composted in 2010.
10
Winter School on “Waste recycling and resource management”-Dec. 3-23, 2014
It is a paradox that organic solid wastes generated by agriculture, domestic,
commercial and industrial activities are often indiscriminately disposed off on the land on nearby areas of the country. The disposal pattern of wastes also varies from season to season. However, under ordinary conditions of storage, there are tremendous losses of plant nutrients either by burning, using as fuel cake, leaching or volatilization when manures remain exposed to sun and rain. Thus, proper composting is a microbiological, non-polluting and safe method for disposal and recycling of these wastes by converting them into organic fertilizer. It is also known that the composts produced in India is of nutritionally low-grade quality. If a sound technology is adopted to improve the quality of compost in the shortest possible time, even farmers can prepare the compost easily and improve its nutritional quality by an addition of cheap amendment such as rock phosphate.
Indian Rock Phosphate In India, about 260 million tonnes of rock phosphate deposit has been estimated at
present. Rock phosphate (11-32 % P2O5) is available in different states of India such as, Udaipur (Rajasthan), Jhabua (Madhya Pradesh), Visakhapattanam (Andhra Pradesh), Purulia (West Bengal), Mussori (Uttaranchal) etc. Low-grade rock phosphate is used as a source of P for crop production. The other amendments such as pyrites (22% Fe and 22.5 % S), is available in large scale at Amjer (Jharkhand).
11

Winter School on “Waste recycling and resource management”-Dec. 3-23, 2014
1. Potential of rock phosphate use in India
Out of the total reserves of 305.3 million tonnes of Rock phosphates in India, around 1.9 million (FAI, 2012-13) tonnes are mined every year. Out of this, around 1.7 million from Jhamarkotra, Rajasthan is neing applied as largely in red and yellow soils having pH 6.0 direct application. Besides, around 7.3 million tonnes of rock phosphates are imported every year, mainly from Jordon, Egypt, and Morocco. Around one million tonnes of rock phosphate shall be used for making of enriched compost by pooling from indigenous and imported rock phosphates. It is because the rock phosphate which is hitherto being used as direct application can be made more efficient in terms of P nutrient supplier when supplied through enriched compost. 2. Potential of enriched compost use in India
For 1000 kg of enriched compost production by heap method, the total quantity of biodegradable waste, fresh cow dung, urine, rock phosphate, pyrites, urea and inoculants soil, will be 5000, 200,50, 328, 120, 13 and 100 kg, 20 kg respectively.
As per conservative estimation, the availability of crop residue is 201 million tonnes, and the availability of fresh cow dung is 72 million tonnes out of 144 million tonnes since a large part has to invariably go in the making of dung cakes.
Hence, as per the above mentioned treatment, it is the rock phosphate which is a vital input for the manufacture of enriched compost. With an assumed value of one million tons of rock phosphate that can be made available for making enriched compost, 1.0 million of enriched compost shall be produced. 3. Potential to substitute inorganic P fertilizers in India
The computation showed that the approximate enriched compost generated would be about 10 million tonnes per year that would be equivalent to about 1.89 million tonnes of P2O5 (enriched compost content about 6.30 % P2O5), which is equivalent to 11.81 million tonnes of single supper phosphate (SSP) and 3.94 million tonnes of di-ammonium phosphate (DAP). It is stipulated that the phosphor-compost can substitute 24% of chemical fertilizers in terms of P requirement. This would result in to reducing the subsidy on P fertilizers to about 24%. 4. Composition of enriched phosphocompost
After 110 days of decomposition (crop residues) enriched compost should contains 3.2 to 4.2 % P and 1.5 to 2.3 % N. The content of NH4-N and NO3-N would be 0.12 to 0.54 and 0.28 to 0.90 g kg-1, respectively. Citrate-soluble P in phosphocompost ranged from 0.23 to 0.98 %. Because of the addition of rock phosphate, pyrites and bio-solids the manurial value is markedly enhanced as compared to FYM and ordinary compost. Since Indian soils are developing multi-nutrient deficiencies, an effort has to be made to enrich manurial value particularly in respect of phosphorus, sulphur and N content.
12
Winter School on “Waste recycling and resource management”-Dec. 3-23, 2014
5. Scope of enriched phosphocompost use in India
The scope of enriched compost is for application on pan Indian scale since this product would not have limitations of applying it to only acidic soils, but also to normal soils. However, it would be more economical to apply the enriched compost in those soils that are low in available organic carbon. Such soils exist in large parts of Alluvial soil zone i.e. in most of the Indo- Gangetic plains. However, once the manufacture starts, even the imported rock phosphates can be used in making enriched composts and used in black, red and yellow soils of the country in later years.
6. Field trials results and economics of enriched composts
In a three-years field study on soybean-wheat system, application of 100% NPK through enriched compost to soybean and 50% NPK to succeeding wheat produced the highest yield and saved 25 kg N and 39.2 Kg P/ha.
A five years-field study on Vertisols revealed that compost application @ 5 t ha-1 in combination with 75% NPK to soybean followed by 75% NPK applied to wheat produced higher productivity in soybean-wheat, sorghum-wheat and soybean +sorghum-wheat system compared to 100% NPK treatment and saved 37 kg N, 30 kg P and 15 kg K.
To improve soil biological activities phospho-sulpho-nitro compost along with chemical fertilizer application is a better option compared to inorganic fertilizer alone.
Phospho-sulpho-nitrocompost contains relatively higher amounts of available plant nutrients compared to conventional compost.
Thus, phosphor-sulpho-nitro compost helps to produce higher yields of crops, quality of produce and maintain fertility status of soils. The use of enriched manure in field crops is also economically viable and safe to the environment. The residual effect and also improvement in soil quality are other aspect of worth consideration.
7. Economic advantage of MSW compost
Enriched MSW compost can be prepared in 75 days. Enriched MSW compost contains relatively higher amounts of available plant nutrients as compared to ordinary (uninoculated) MSW compost. The heavy metals can be reduced by improving the quality of compost. Thus, microbial enriched compost helps to produce higher quality manure, shorten the usual period of composting from 6 months to 2.5 months. The prospect exists to enrich compost in urban peripherals and use it in crop production and the compost is safe to the environment. Indiscriminate exploitation of natural resources without considering the carrying capacity and non-judicious use of agriculture input to fetch higher production had generated serious problem
13

Winter School on “Waste recycling and resource management”-Dec. 3-23, 2014
on sustaining agricultural productivity and soil quality. Degradation of quality of soil through organic matter depletion, nutrient losses, and decrease in soil organisms etc., the process may be reversed when cultivation is managed and these soil health attributes may begin to change. Thus, inter disciplinary and participatory mode, collaboration with Central government ( ICAR), Non-Governmental Organization and farmers participatory approach to recycle the MSW for improving nutrient use efficiency, sustaining productivity and soil health under farmers field is urgently needed.
14

Winter School on “Waste recycling and resource management”-Dec. 3-23, 2014
Challenges and opportunities of organics on soil health sustenance
A. Subba Rao
Indian Institute of Soil Science, Nabibagh, Berasia Road, Bhopal-462038
The long-term sustainability of the productivity of crops and cropping systems is directly related to maintenance of an adequate level of soil organic matter. Indian soils contain organic carbon about 0.1% in desert/ sandy soils to 1% in foothill soils. The maintenance of soil organic matter in agricultural soils, particularly of semi-arid and subtropical regions of India, is generally governed by annual temperature, precipitation and many interacting factors such as soil types, tillage, application of fertilizers, quality and quantity of organics returned to soil, and the method of residue management. In India most crop residues are used as feed and fuel and one third of crop residues is returned to soil as a source of organic matter. Continuous use of the same crop in the cropping system, imbalanced and inappropriate use of chemical fertilizer, and minimum or no use of organic matter year after year are major constraints to soil organic carbon accumulation in soil. Soil organic matter improve soil physical properties such as water holding capacity, bulk density, water stable aggregates, maintain soil temperature etc. Similarly it improves soil chemical and biological properties.
As agriculture became more settled, with a permanent land base, and as cultivation practices intensified, soil fertility became severely depleted. In the early 1960s the industrial model of agriculture was adopted in the developed countries, and chemical fertilizer was comparatively inexpensive. It was also in the same period (1966) that the green revolution took place in India and intensive use of chemical fertilizers started. Initially, the results of chemical fertilizers application were really spectacular, but later, unfavorable effects emerged: decreasing productivity, huge neglected areas of poor soils and water resources, and environmental impact of fertilizer use. During the 1970s, the adverse effects of high input agriculture were felt both in developed and in the developing countries. Ironically, this same period also marked the beginning of a massive global loss of soil organic carbon (SOC) associated with the rapid expansion of agriculture on to grassland and forest soils. In India, decline in SOC as a result of continuous cropping without application of fertilizer and manure was confirmed through long-term fertilizers experiments conducted over 35 years in different agro-ecoregions (Table 1) involving a number of cropping systems and soil types (Inceptisols, Vertisols, Mollisols and Alfisols). Long-term fertilizer experiments also proved that balanced use of NPK fertilizer either maintain or slightly enhanced the SOC content over the initial values and application of farmyard manure improved SOC, which was associated with increased crop productivity. Assessing of soil organic carbon accretions/sequestration under intensive cropping with different management system plays an important role in long-term maintenance of soil quality.
"Sustainable agriculture" is an important issue worldwide. The food and Agriculture Organization of the United Nations, International Research Institutes such as International Rice Research Institute (IRRI), International Maize and Wheat Improvement Centre (CIMMYT),
15

Winter School on “Waste recycling and resource management”-Dec. 3-23, 2014
International Crop Research Institute for Semi-Arid and Tropics (ICRISAT) etc., and National Agriculture Research Systems (NARS) all over the world are deeply concerned with sustainability of the intensive agricultural system prevalent in several parts of the world. The rapidly increasing population, shrinking good quality land resources for crop production and increasing concern for declining soil fertility and environmental degradation create awareness that resources are limited and highlight the urgency of continuously enhancing and sustaining productivity of land in India. For example, before the green revolution era, when generally monocropping was practiced and the yield potential of the then prevalent varieties was low, the sustainability of the age-old practiced agricultural systems was not raised. However, with the introduction of short duration, high yielding varieties of cereals, the shift to double cropping in the irrigated regions of the country with a production potential of 5-15 Mg ha-1 year-1, and the associated heavy depletion of plant nutrients, even the fertile Indo-Gangetic alluvial belt of India started showing the sign of fatigue. Judicious management of renewable native soil and water resources, and accelerated use of inputs like chemical, and organic and biological fertilizers resources may meet this challenge. An agriculture system to be sustainable must meet the changing food, fibre, fodder, and fuel needs of a nation and should not be detrimental to its natural base. A sustainable agriculture system should rather improve the resource base of a nation.
India has vast resources of crop residue and farm wastes such as rice and wheat straw, rice husk, sugarcane trash, potato haulms, non-edible cakes such as neem (Azadiracachta indica), mahua (Madhuca indica), mustard (Brassica juncea) oil cakes etc., tobacco and tea wastes, cotton wastes, forest litter, water hyacinth etc. It is estimated that 300, 375 and 16.5 million tonnes of crop residues, livestock dung and human excreta per annum, respectively are available in the country. Of this, around one third of crop residues, half of livestock dung and 80 % of human excreta are available for use in agriculture. The greater use of these materials in agriculture can ensure better SOC restoration and sustained soil productivity. It is estimated that every million tonne increase in food grain production will produce 1.2-1.5 million tonnes of crop residue and every million increase in cattle population will provide additional 1.2 million tonnes of dry dung per annum. Thus the estimated NPK supply from all the wastes including crop residues is 5.0, 6.25 and 9.25 million tonnes, respectively during 1991, 2011 and 2025. It is, therefore, extremely important that the huge quantity of agro-based industrial waste, solid city garbage and natural weed biomass available be explored for maintaining soil organic matter.
Jhum (shifting cultivation) system practiced in northeastern is the common mode of farming on hill slope. In the jhum ecosystem losses of SOC are high (702.9 kg ha-1 year-1) mainly through large scale land and environmental degradation resulting in soil erosion in the hills, silting of river beds, and volatilization of C and N during burning process, leading to a reduction in the quantity of elements in the surface soil layers. Over several jhum cycles, the extent of SOC depletion depends upon the length of the cropping period and the ratio of the cropping to the fallow period.
16

Winter School on “Waste recycling and resource management”-Dec. 3-23, 2014
Integrated nutrient management (INM) is an alternative to maintain and to enhance
organic matter status of Indian soils. Though it is an age-old practice, its importance was not very much realized in the pre-green revolution era due to the low nutrient demand of the existing subsistence agriculture. This approach of nutrient management aims at efficient and judicious use of all the major source of plant nutrients in an integrated manner, so as to maintain and improve SOC for sustained crop productivity without any deleterious effect on physico-chemical and biological properties of the soil on a long-term basis. The major components of integrated nutrient supply system are fertilizers, farmyard manure (FYM)/compost, green manure, crop residues/recyclable wastes and biofertilizers. These components possess great diversity in terms of chemical and physical properties, nutrient release efficiencies, positional availability, and crop specificity and farmer acceptability. Therefore, the combination of different components to ensure optimum nutrient supply of a production system may depend on land use, ecological, and socio-economic condition.
SOIL QUALITY AND SOIL HEALTH The term soil quality and soil health are often used interchangeably in the scientific
literature and in general, researchers preferring “soil quality” and producers preferring “soil health”. “Soil quality” is the capacity of a specific kind of soil to function within ecosystem and land-use boundaries, to sustain biological productivity, maintain environmental quality, and sustain plant, animal, and human health. “Soil health” is defined as being a state of dynamic equilibrium between flora and fauna and their surrounding soil environment in which all the metabolic activities of the former proceed optimally without any hindrance, stress or impedance from the latter . Soil health is considered as the state of the soil at a particular time, equivalent to the dynamic soil properties that change in short term, while soil quality may be considered as soil usefulness for a particular purpose over a long time scale, equivalent to intrinsic or static soil properties. Soil quality performs at least six diverse simultaneous functions that must be optimized to achieve high rating of soil quality, to sustain (i) plant and (ii) animal productivity, maintain or enhance (iii) water and (iv) air quality, and support (v) human health and (vi) habitation. The perception that soil is a “living” system results from the observation that number of living organisms in a fertile soil (10 g) can exceed nine billion, which is one and one-half times of the human population of the earth. Soils form slowly, with an average of 100-400 years per centimeter of topsoil, through the interaction of climate, topography and a myriad of living organisms (bacteria, fungi, algae, nematodes, earthworms, insect, animals, plants, human etc.). Thus, the physical and chemical attributes of soil regulate biological activity and interchanges of molecules/ions between the solid, liquid and gaseous phases, which influence nutrient cycling, plant growth, and organic matter decomposition. The inorganic components of soil play a major role in retaining cations through ion exchange and non-polar organic compounds and anions through sorption reactions. CAUSES FOR POOR SOIL HEALTH
The major reason for poor soil health are: (1) wide gap between nutrient demand and supply; (2) high nutrient turnover in soil plant system coupled with low and imbalanced fertilizer use; (3) emerging deficiency of secondary and micronutrients due to improper use of inputs such as water, fertilizers, pesticides etc.; (4) insufficient use of organic inputs; (5) acidification and Al3+ toxicity; (6) development of salinity and alkalinity in soils; (7) development of adverse soil condition such as heavy metal toxicity; (8) disproportionate growth of microbial population
17

Winter School on “Waste recycling and resource management”-Dec. 3-23, 2014
responsible for soil sickness, and (9) natural and man-made calamities such as erosion, deforestation occurring due to rapid industrialization, urbanization etc.
Nutrient demand and supply
The growth in fertilizer consumption has come down during 1990’s and there is stagnation in consumption observed in the last 4-5 years. At present level of crop production, there exists a negative balance of 10 million ton between the nutrient uptake (NPK) removal by crops and addition through fertilizers annually. The stagnation in fertilizer consumption and higher negative nutrient balance are posing a threat to soil health and sustainable agriculture (Subba Rao and Reddy, 2005). Further they concluded that deteriorating soil quality and the emerging deficiencies in secondary and micronutrients aside from major nutrients appears to be the major factors of stagnation in fertilizer consumption.
Imbalanced use of fertilizer
Fertilizer consumption in India is generally imbalanced due to intensive crop production system. It is tilted more towards N followed by P and K. In many areas in India the imbalanced fertilization is the root cause of poor crop yield . The negative yield trends were observed under long-term imbalanced N and NP fertilization in rice-wheat-jute, soybean-wheat and sorghum–wheat system in Inceptisol, Alfisol and Vertisol, respectively . The reason for yield decline is mostly location specific but depletion of soil organic carbon (SOC) seems to be general cause.
Deficiency of secondary and micronutrients In India, soils have been classified deficient, if these contained less than critical limits
4.5, 2.0, 0.6 and 0.2 ppm DTPA extractable iron, manganese, zinc and copper, respectively (Lindsay and Norvell 1978). Such limit for hot water soluble B and acidified ammonium oxalate extractable Mo are 0.5 and 0.2 ppm respectively. Micronutrients deficiencies in soils are also emerging as yield limiting factors. Analysis of 1.5 lakhs of soils samples of different regions of the country indicated that about 47% soils are deficient in available Zn, 20% samples deficient in available B, 18% samples deficient in Mo, 12% samples deficient in available Fe and 5% deficient in available Cu (Subba Rao and Reddy, 2005). As food production increased over the period, the number of elements becoming deficient in soils . When only N was applied the P and K status in soils have gone down. When nitrogen and phosphorus were applied then the soil K status declined more in alluvial soils followed by terai soils and laterite soils (Subba Rao and Reddy, 2005).
Insufficient use of organic inputs
Continuous application of balanced NPK fertilizer alone minimized the crop yield and soil quality parameters. It was observed that decline in yield is more pronounced with concomitant decrease in SOC content under imbalanced fertilizer application. Long-term application of NPK and NPK+FYM maintained or improved SOC content over initial. Further they reported that active fractions of SOC viz., particulate organic carbon, water-soluble carbon and hydrolysable carbohydrates, soil microbial biomass C and N were improved significantly with the application of NPK and NPK+FYM over control both in case of Inceptisol and Vertisol. The microbial biomass is considered a significant reservoir of plant nutrients, specially N and P
18
Winter School on “Waste recycling and resource management”-Dec. 3-23, 2014
and also active fraction of organic matter. The more labile component of soil organic matter fractions are soluble phase of carbon and carbohydrates acts as source of plant nutrients better than most other fractions (passive pool of carbon). Thus, important approach to characterize soil biological health may be presented by inherent fluxes at which the soil microbial biomass would transmit the organic and inorganic growth stimulants, including the nutrients supply to the growing crops. Soil organic matter
Soil organic matter is one of the most complex and heterogeneous components of soils and is considered as one of the most important indicators of soil health. Hence any effort to improve soil quality or soil health needs to start with restoring soil organic matter. It affects the chemical and physical and biological properties of the soil and improves its overall health. Soil organic matter serves as a reservoir of nutrients for crops, provides soil aggregation, increases nutrient exchange, retains moisture, reduces compaction, reduces surface crusting, and increases water infiltration into soil. As soil organic matter drives the majority of soil functions, decreases in soil organic matter can lead to a decrease in fertility and biodiversity. Therefore an active management plan is important to build soil organic matter, to create and maintain productive, biologically active soils. To evaluate sustainability of agricultural practices, the assessment of soil health using various indicators of soil quality is needed. Soil organic matter is also represented by soil organic carbon that has maximum weightage for assessing soil health. Soil organic carbon restoration process could be improved by a set of management practices in long-run.
Soil acidity
Acidification in soils resulted in loss of exchangeable Ca2+ and Mg2+, a decrease in effective cation exchange capacity, and an increase in exchangeable Al3+. Long-term application of imbalanced nutrients and sub-optimal or no use of organic and inorganic fertilizer into soil are the main reasons for lowers the active pools of C and N in acid soils. Suitability of Al, Fe and Mn being high in acid environment, these elements are available quite in excess at times causing toxicity to microbes. Ordinarily, B should be available under acid conditions but porous nature of topsoil allows the soluble B to leach down in the profile beyond the reach of the plant roots (Panda, 1998). Excess of Al in soil solution reduce the uptake and transport of P in plants.
Soil Salinization and alkalization
Salts in the soil and ground waters in a part of north and western India are of fossil origin and have under favorable conditions, accumulated at or near the surface rendering many productive soils into barren lands. The salt affected soils of Indo-Gangetic plains are characterized by the presence of electrolytes capable of alkaline hydrolysis with or without the presence of dominant neutral salts and often impregnated with calcium carbonate at some depth in soil profile (Abrol et al, 1988). The other major occurrence of salt affected soils is the inland saline soils mostly in arid and semi-arid regions of the country including areas affected by secondary salinization in different canal command areas. The third important group of soils is coastal salt affected soils which are subjected to inundation by sea water during high tides. Excessive amounts of salts present in the soil have an adverse impact on soil microbial biomass, soil respiration and dehydrogenase activity. The decrease of microbial biomass C was evident at EC > 32 and 19 dS m-1 in the 0-15 cm and 0-30 cm soil layer. Dehydrogenase activity was
19

Winter School on “Waste recycling and resource management”-Dec. 3-23, 2014
decline by 71 to 87% at EC of 28 and 40.8 dS m-1 (Batra and Manna, 1997). It was shown that soil microbial activities in alkaline soil suffer due to carbon stress, and in high saline soils low biological activity is predominantly due to ex-osmosis in microbial cell (Batra and Manna, 1997; Batra et al, 1997). In practical, growing of Karnal grass (Leptochloa fusca) is a better biological reclamation than chemical reclamation by applying gypsum in alkaline soils due to the higher organic C improvement (through greater biomass accumulation) that enhances the greater biological biomass (Table 4). Nitrogen is the most limiting nutrient in these soils because of low inherent fertility, low amounts of organic matter, poor symbiotic N-fixation and higher volatilization losses leading to low efficiency of applied fertilizer N.
Development of heavy metal toxicity Heavy metal and toxic element contamination is generally more identifiable as soil
biological health problem due to the reason for toxicity to microorganism and microbial processes in agricultural soil. Heavy metal contamination in soil may results from geological factors such as high natural occurrence of the elements of interest in bedrock, or be related to poor agricultural management practices. Application of sewage possess excellent manurial value and act as a good source of organic matter, these being rich in toxic metals that have the potentialities of transmitting and accumulating substantial amount of these metals in soil. Continuous application of the heavy metals rich sewage might be responsible for deterioration of soil biological activity and soil quality. However application of sewage with crop residue during decomposition counteracts the toxicity of heavy metals.
Disproportionate growth of microbial population
‘Soil sickness’ has often been defined as the malfunctioning of the soil due to imbalance in biological activity. Soil organisms must be acknowledged as key architects in nutrient turnover, organic matter transformation, and physical engineering of soil structure. The microbial populations of the soil alone encompass an enormous diversity of bacteria, algae, fungi, protozoa, viruses and actinomycetes. The C and N mineralization rate constant often increased in the order of macro aggregates (2000µm) > micro aggregates (53-250 µm)> mineral–associated organic matter in Inceptisol and Alfisol. Such treatment differ in each aggregate size class due to initial non-soluble C/N ratio and changes of microbial species owning to changes in substrate quality and quantity such as light fraction of C and N and heavy fraction of particulate organic matter (Manna et al. 2006).
Soil tillage The degree of soil resilience and stability that develops over time is an outcome of soil
functions of living microbial community present in the soil. Changing soil physical condition by tillage influences soil biological activity and stability which is also a function of soil resilience. In India, the paucity of information is available on soil tillage and soil biological activity interaction. With no tillage system there was a trend towards greater production of soil microbial biomass along with enhanced organic matter as well as carbon compares to ploughed system (Table 5). This microbial biomass may be used as an early indicator of soil health.
20

Winter School on “Waste recycling and resource management”-Dec. 3-23, 2014
SOIL ORGANIC MATTER AND ITS SIGNIFICANCE IN INFLUENCING SOIL QUALITY
Soil organic matter is an important attribute of soil quality. It influences soil physical, chemical and biological properties and processes. It regulates energy and nutrients for soil biota, aggregate stability, water retention, hydraulic properties, resistance or resilience to compaction, buffering capacity, cation exchange capacity, and formation of soluble and insoluble complexes with metals. The most important biological properties of organic matter are i) its role as a reservoir of metabolizable energy for soil microbial and faunal activities, ii) its effects in stabilizing enzyme activities and iii) its values as a source of plant nutrition through mineralization. Soil organic matter attributes (microbial biomass C and N) are very sensitive to changes in total soil organic matter and could be utilized, based on their relative simple and straightforward methodology, as indicators of soil health. More recently, a greater range of labile soil organic matter attributes such as light fraction of organic matter (LF), particulate organic matter (POM, <53µm), water soluble carbon, acid hydrolysable carbohydrates and potentially mineralizable fraction of carbon are more sensitive to changes in management practices. Little attention has been paid towards labile pools of carbon as compared to total organic carbon in most agricultural soils. Typically, organic matter levels decline rapidly when soil under native vegetation is converted to arable agriculture in the first 10-20 years and then stabilize at a new equilibrium level. Many factors contribute to loss of SOM levels such as lower allocation of carbon to the soil, removal or burning of crop residues, tillage induced aggregates disruption, more favorable condition for decomposition and greater losses of surface soil by water erosion.
Factors that increase organic matter under arable agriculture include a decreasing
proportion of fallow in rotation, an increase in the proportion of cereal as compared to root crops, an increasing proportion of perennial crops in rotation, return of crop residue rather than burying or removal, improve root biomass and crop growth with better fertilizer and irrigation conditions, and addition of organic manure or other organic wastes. Similarly, perturbations to the soil system such as conversion of native vegetation to arable agriculture cause large changes in SOM content in soil. These are reflected in labile and stabilize SOM fractions in soil. In addition labile fraction has a disproportionately large effect on nutrient supplying capacity and structural stability of soil. In agricultural soil, the light fraction typically contains 20-30% C and 5-20% N and 18-22% of total C and 1-16% of total N in the whole soil. Particulate organic matter contains 20-45% of TOC and 13-40% of TN in the whole soil. Particulate organic carbon is the precursor for formation of soil microbial biomass carbon, soluble fraction of carbon, humic and non-humic fraction of carbon in soil and thus it is a key attribute of soil quality. It is the major source of cellular C and energy for the heterotrophic microorganisms. The POM accumulation is also the major pathway by which nutrients are recycled from crop residues back to the soil and release nutrients by mineralization during decomposition of POM. The large POM maintains soil structure and macro-aggregation. The large amount of microbial community associated with the decomposing POM produces binding agent such as exocellular mucilaginous polysaccharides. It acts as a major food and energy for endogenic soil fauna. Thus, POM is associated with a multitude of soil process and functions and is therefore, a key attribute of soil quality. Acid hydrolysable carbohydrate (AHC) (32-37% of TOC) is a labile C fraction and has been found more rapidly in response to changes in management than TOC contents. The KMnO4–oxidizable C fraction accounts for 5-30% of organic C. This oxidizable fraction usually is more sensitive to soil management than TOC. Simple measurement of soil aggregate stability, POM, light fraction
21

Winter School on “Waste recycling and resource management”-Dec. 3-23, 2014
of carbon, acid hydrolysable carbohydrates have been evaluated on their sensitivity to change in different soils and crop management systems.
Soil organic matter serves many soil functions, so the critical value or range would vary
according to function. The critical level could be established for specific soil types or site specific and soil management scenarios, related to a single soil process or function, and based on a range rather than a set value. Generally, at present, two main approaches are utilized to establish critical levels.
(a) Use of average or base line SOM values under local soil conditions and soil types to
establish an initial reference level of threshold based on general consensus. (b) Characterize to critical levels for SOM based on empirically derived relations between
SOM and specific soil process and conditions. Close relationship should be quantified between SOM and soil fertility indices, crop productivity, soil erodability and soil aggregation.
Factors that regulate SOM functioning in soil are related to i) organic matter addition or
inputs, which influence particulate or macro-organic matter, and ii) the relation between SOM and soil aggregates. Functions of SOM are differentiated on the basis of total SOM or aggregated SOM. Monitoring is important, but the usefulness of the data will only be realized if it is used in management decisions to correct deficiencies or improve the quality of the soil resources. Addition of organic matter to the soil, in the form of crop residues or organic amendments has increase the level of low-density macro organic matter.
Opportunity for waste recycling
Large quantities of municipal solid wastes(MSW) are simply dumped on the ground that occupy the valuable land and pose a threat to the environment, besides causing health hazards to the citizens. About 188.5 thousand tonnes waste generated in urban India per day ( t d-1) i.e. 68.8 million tonnes per year (M t y-1). In India, 366 cities, which represent 70% of India's urban population, generate 47.2 M t y-1 at a per capita waste generation rate of 500 g d-1. At this rate, the total urban MSW in 2041 would be 230 M t y-1 (630000 t d-1). Soil scientists must play a vital role in converting these wastes into valuable manures through proper composting technology. Organic wastes are increasingly finding their use in power generation and alternative uses. At the present level of crop production, crops remove around 31 million tonnes of NPK, whereas the consumption of fertilizer is around 28 million tonnes with a gap of 3 million tonnes. The increase in the food grain production to 457 million tonnes by 2050 would remove about 58 million tonnes of NPK. This is potential threat to the soil quality and sustainable agriculture, implying the need to develop to recycle the organic wastes produced in agriculture.
Opportunity for organic farming
India has 15% of the world's livestock population and a great opportunity lies ahead for organic farming in the regions where the livestock density is higher. According to Agricultural and Processed Food Products Export Development Authority (APEDA), a nodal agency involved in promoting Indian organic agriculture, about 6,792 tonnes of organic produces worth 712 million rupees are being exported from India (www.apeda.com). Ascertaining the scope of
22
Winter School on “Waste recycling and resource management”-Dec. 3-23, 2014
organic farming in the country for geographical advantages and export potential of crops, with special reference to annual crops should receive top priority. This market of organic products is expected to grow globally in the coming years and high growth rates over the medium term (from 10-15 to 25-30 %) are expected. Organic farming is being recommended in certain areas and selected crops having export potential. Opportunities exist to devise organic produce protocols and package of practices for different agro-ecoregions. Organic agriculture offers trade opportunities for farmers in the developing and developed countries. This market of organic products is expected to grow globally in the coming years and high growth rates over the medium term are expected. Thus there is a scope to improve SOC restoration under such environment under modern technological approaches.
Residue management in conservation agriculture
Conservation agriculture is based on the principle of providing continuous soil cover (crop residues, cover crops), minimum soil disturbance, and crop rotations and has a high potential to increase productivity while protecting natural resources and environment. It is practiced on more than 75 million ha worldwide in more than 50 countries. It is estimated that over the past few years adoption of zero-tillage has expanded to cover about 2 M ha in India. Thus conservation tillage practices affecting better C sequestration in C depleted soils of India. Tillage and other mechanical disturbance of soil have been found to decrease aggregate stability that may result in increase susceptibility to decomposition of physically protected organic matter. Carbon loss by tillage is about 20-25 % in the semi-arid regions of India and is caused by greater oxidation of SOC. In the humid and sub-humid region, mechanical tillage has more adverse effects than beneficial. On the other hand, in the arid and semi-arid tropics, mechanical tillage is often beneficial. However, higher C storage has been reported in a number of field experiments under no-till compared to tilled soil. The potential of C sequestration in C depleted soils of India is high with adoption of conservation tillage. It is also estimated that most parts of the country will receive higher rainfall in 2020, 2050 and 2080 than the current value, so this changing scenario can be converted to suitable opportunities in conserving and sequestering C and improving soil health. There is a great scope for residue management in conservation agriculture to improve soil health.
Opportunity under different cropping systems
Alternate land use systems, viz., agro-forestry, agro-horticulture, and agro-silviculture, are more remunerative for SOC restoration as compared to sole cropping system. Leaflitter, root biomass and rhizodeposition is the major souce of soil carbon after decomposition in soil. An agricultural practice with a profound positive effect on SOC is water management, soil fertility, tillage, land-use management and cropping systems. On the other hand, agriculture activities such as deforestration, burning, plowing and intensive grazing contribute considerably to the atmospheric C pools. Thus, recycling of insitu forest-litter under different landuse and management practices have tremendous impact on improving plant biomass production and increasing SOC in semi-arid and tropic regions.
23

Winter School on “Waste recycling and resource management”-Dec. 3-23, 2014
Table 1: Depletion in organic carbon status over years (1971-85) under intensive cropping systems
Location Cropping system Organic carbon%
Initial ---------------------Treatments*--------------------
Control N
(100%)
NP
(100%)
NPK
(100%)
NPK
(100%)
Pantnagar
(1972-96)
Rice-wheat-cowpea 1.48 0.60 0.97 0.67 0.90 1.14
Barrackpore
(1972-96)
Rice-wheat-jute 0.71 0.42 0.48 0.45 0.45 0.47
Bangalore
(1986-96)
Fingermillet-maize-
cowpea
0.55 0.34 0.39 0.45 0.45 0.51
Ranchi
(1973-96)
Soybean-potato-wheat 0.45 0.35 0.33 0.35 0.38 0.35
*NPK applied on recommend dose of crops, Source: Nambiar, (1994)
24

Winter School on “Waste recycling and resource management”-Dec. 3-23, 2014
Potential for organic resources and their nutrient supply in India
Sanjay Srivastava Indian Institute of Soil Science Nabi Bagh,Berasia Road Bhopal – 462 038 (M.P)
India hosts 15% of the animal population, which, apart from supplying milk and draught power in agricultural operations, also contribute valuable plant nutrients acting as supplement to the fertilizer nutrients. Indian cattle, however, has different genetic make up compared to the ones reared in developed countries. They are smaller in size with lower body weight, are low in milk production and adapted to the different climatic conditions and different feeding situations besides their different heritage. Consequently, the different types of manures, derived under such varying environments do differ in their physical and chemical composition. Manure composition differs due to the difference in the type of animal used to produce dung, animal density, nutrient density of the feed material, type of work an animal is put to use and management factors. This calls for a need to develop a database of actual dung and manure availability depending upon the livestock and other animal density in different regions, also the actual manure availability and its composition. India is endowed with variable climates, different strata of farmers ranging from marginal to large practicing variable crop and nutrient management options. These factors change the nutrient recovery from the applied manure. The first year nutrient recovery coefficients have been reported to be 0.5 and 0.75 for N and P, respectively. It is also reported that the recovery coefficients vary with the method of manure management being higher with soil incorporation and lower with surface application (barker and Zublena, 1993). Hence there is a need to compile the manure preparation and handling practices in different part of the country specific to different situations. The amount and type of the animal feed is important w.r.t. the milk yield and manure nutrient composition. A compilation of the crop residues and its composition used as cattle feed, the availability of concentrated feed material (manufactured and imported) and composition of different cattle feed, the region-specific availability of grazing land and amount and type of pasture, the amount of feed depending upon the type and age of animal is important for determining not only the quantity and quality of manure but also will be helpful in computing enteric methane emission coefficients from animals and methane emission potential of manures.
Availability of organic wastes
Crop residue can be an important source of nutrients to subsequent crops. It is well documented that different quantities of N, P, K and other nutrients are removed from and returned to the soil depending on crop species concerned. The quantity and quality of crop residues will
25

Winter School on “Waste recycling and resource management”-Dec. 3-23, 2014
greatly influence the build up of soil organic matter. Cereals straw contains only around 35 kg N/ha compared to more than 150 kg N/ha for some vegetable crop residue. Residues also contain variable amounts of lignin and polyphenols, which influence decomposition and mineralization rates. Incorporation of N rich, low C: N ratio residues leads to rapid mineralization and a large rise in soil mineral N, while residues low in N such as cereal straw can lead to net immobilization of N in the short to medium term. The latter can be advantageous in preventing N leaching from soil between crops. The inclusion of crops with a diverse range of C: N ratios can help to conserve N within the system (Watson et al, 2002).
Crop residues, which are not fed to animals or in excess on the farm such as straw of cereals, oilseeds etc can supply about 1.13, 1.41 and 3.54 million tonnes of nitrogen, phosphorus and potassium, respectively. On the basis of crop production levels it is estimated that ten major crops (rice, wheat, sorghum, pearl millet, barley, finger millet, sugarcane, potato tubers and pulses) of India generate about 312.5 Mt of crop residues that have nutrient potential of about 6.46 million tonnes of NPK. It has been estimated that all animal excreta can potentially supply 17.77 million tonnes of plant nutrients. But only 1/3rd of it is used as manure. Annually, most of the metropolitan cities of India are generating about 150 million tonnes of city refuse (Table 2) that have nutrient potential of about 1.72 million tonnes of N, P and K. It was estimated that about 57 million tonnes of city wastes is being generated every year from different cities of India that is expected to will be increased to 104 million tonnes per year during 2025. About 41% of these wastes contain biodegradable matter, but only 8.6 % of the municipal solid wastes are composted which is about 8.9 million tonnes per year. This could be increased to 20.8 million tonnes per year during 2025 by improved technologies. By adopting the efficient composting techniques, the produced compost will have high nutrient value compared to conventional compost. The chemical analysis of municipal solid waste (Table 4) showed that the contents of N, P2O5 and K2O is about 2.85 lakhs tonnes that would be about 5.4 lakh tonnes during 2025.
Table 1: Nutrient potential of crop residue
Crop Residues N (%) P2 O5 (%) K2O (%) Total Tonne / Tonne residue
Rice 0.61 0.18 1.38 2.17 0.0217
Wheat 0.48 0.16 1.18 1.82 0.0182
Sorghum 0.52 0.23 1.34 2.09 0.0209
Maize 0.52 0.18 1.35 2.05 0.0205
Pearl millet 0.45 0.16 1.14 1.75 0.0175
26

Winter School on “Waste recycling and resource management”-Dec. 3-23, 2014
Barley 0.52 0.18 1.30 2.00 0.0200
Finger millet 1.00 0.20 1.00 2.20 0.0220
Pulses 1.29 0.36 1.64 3.29 0.0329
Oilseeds 0.80 0.21 0.93 1.94 0.0194
Groundnut 1.60 0.23 1.37 3.20 0.0320
Sugarcane 0.40 0.18 1.28 1.86 0.0186
Potato tuber 0.52 0.21 1.06 1.79 0.0179
Total 8.71 2.48 14.67 26.16 0.2616
Source: Tandon, 1997.
Table 2: Organic resources and their nutrient supply potential
Agricultural/animal /city wastes Quantity (Mt)
N (Mt)
P2O5 (Mt)
K2O (Mt)
Rice 110.5 0.61 0.18 1.38
Wheat 82.6 0.48 0.16 1.18
Sorghum 21.0 0.52 0.23 1.34
Sugarcane 40.9 0.40 0.18 1.28
Pulses 13.7 1.60 0,51 1.75
Cattle dung 1227.8 1.84 1.23 0.61
Animal urine 800 1.60 0.08 1.60
Sheep and goat 45 0.27 0.06 0.45
Poultry wastes 1.00 2.17 2.00 2.20
Horses 0.48 1.51 0.35 1.80
City refuse 150 0.75 0.34 0.63
Sewage sludge water 1460 Mt m2 year-1
0.04 0.01 0.18
27

Winter School on “Waste recycling and resource management”-Dec. 3-23, 2014
Total 3952.98 11.79 5.33 14.4
Table 3: Nutrient content (%) in dung of different animals
S. No. Animal dung N
(%)
P
(%)
K
(%)
Total
1 Cattle dung 0.50 0.20 0.50 1.20
2. Buffalo dung 0.50 0.20 0.50 1.20
3. Sheep dung 0.65 0.50 0.03 1.18
4. Goat dung 0.65 0.50 0.03 1.18
5. Pig dung 0.60 0.50 0.40 1.50
6. Poultry dung 1.80 2.30 1.40 5.50
Source: Tripathi et al, 2003
Table 4: Availability of rural compost and urban compost in India
Rural Compost (Lakh tonnes) Urban Compost (Lakh tonnes)
Sr.No. State/U Ts 1994-95 2002-03
Avg. Nutrient value
1994-95
2002-03
Avg. Nutrient value
1. Andhra Pradesh
76.790 135.00 105.89 1.482 3.150 3.150 3.150
2. Arunchal Pradesh
0.091 0.15 0.120 0.0016 Nil Nil Nil Nil
3. Assaam 0.100 0.01 0.055 0.0007 --- ----
4. Bihar 14.786 6.12 10.453 0.1463 0.240 0.05 0.125 0.0043
5. Goa 2.522 2.42 2.471 0.0345 ---
6. Haryana 90.521 103.53 97.02 1.358 0.258 0.00 0.129 0.0045
7. Himachal Pradesh
34.195 30.25 32.22 0.4510 0.086 0.91 0.498 0.0174
28

Winter School on “Waste recycling and resource management”-Dec. 3-23, 2014
8. Karnataka 212.876 587.17 400.02 5.600 21.477 132.70 77.08 2.6970
9. Kerala 5.028 0.00 2.519 0.035 0.062 0.02 0.041 0.0014
10. Madhya Pradesh
30.860 32.00 31.430 0.440 5.756 1.70 3.728 0.1304
11. Maharastra 9.304 17.83 13.582 0.1901 5.879 24.66 15.26 0.5341
12. Mizoram 0.137 0.12 0.128 0.0017 ---- ----
13. Nagaland 0.001 0.01 0.005 0.00007 0.002 ---- 0.001 0.00003
14. Orissa 121.774 127.05 124.412 1.741 0.155 0.03 0.092 0.0032
15. Punjab 326.100 322.00 325.05 4.550 2.100 1.97 2.035 0.0712
16. Rajasthan 59.450 62.13 60.79 0.851 8.040 8.88 8.46 0.2961
17. Tamilnadu 3.685 4.23 3.95 0.055 2.260 0.77 1.515 0.0530
18. Uttar Pradesh
950.00 12.92 481.46 6.740 16.500 Nil 8.25 0.2887
19. West Bengal 275.00 20.10 147.55 2.065 0.017 0.16 0.016 0.0005
20. Daman & Deep
0.1 Nil ---- Nil Nil Nil
21. Delhi --- 0.15 0.15 0.0021 0.039 0.04 0.039 0.0013
22. LakshDweep 0.006 Nil 0.006 0.00008 ------ Nil Nil Nil
23. Pondichery --- Nil 0.654 Nil 0.327 0.0114
24. Uttranchal --- Nil ----
Total 2224.319 1463.24 1843.77 25.81
2.56(mt)
69.002 175.01 122.00 4.27
(0.427mt)
Source: Agricultural Statistics at a Glance, 2004
Nutrient content of rural compost
0.4% N, 0.3% P2O5, 0.7% K2O, 1.4% (NPK) Nutrient content of urban compost
1.0% N, 1.0% P2O5, 1.5% K, 3.5% (NPK)
29

Winter School on “Waste recycling and resource management”-Dec. 3-23, 2014
2. Availability of organic manures
An assessment of the potential and actual availability of nutrients (N, P, and K) from different organic resources was done with district as the unit for different states in India. This assessment is based on a survey done under an institute project and based on the secondary data published in different scientific and semi-scientific reports from different agencies.
We computed the availability of nutrients from Farmyard manure, crop residues, biological nitrogen fixation from green manure crops and urban compost.
2.1 Computation of FYM
While making assessment we found a great variability in the type of animals available in different parts of the country and their dung production per day differs considerably. We first consolidated the entire data in six heads:
1. Indigenous cows adult 2. Indigenous cows calf 3. Hybrid cows adult 4. Hybrid cows calf 5. Buffalo adult 6. Buffalo calf
Next we assumed that two calves would produce dung equivalent to one adult.
Hence our final categories were:
1. Indigenous cows adult 2. Hybrid cows adult 3. Buffalo adult
We took the representative figures of dung produced per day for these animals and that gave the potential availability of dung district-wise. Next, based on our survey data of nine states (Punjab, Haryana, Gujarat, Madhya Pradesh, Rajasthan, TN, AP, Kearala, and Karnataka) and based on the reported data on the competing use of dung in different states of India, we arrived at the figures of the percentage of dung that goes into the farmyard manure pits in different states. We took the state figure for computing the dung availability for making farmyard manure for all the districts of that particular state. That is how we arrived at the actual availability of dung in different districts of India. Next we arrived at the farmyard manure produced by taking into consideration that 50% of biomass is lost during decomposition process. It is apparent that our computation did not include some of the left over cattle feed that is also added in the farmyard manure pits. Hence our figures of FYM availability could be further increased by 5 to 10%.
We took the figure of 0.7 %N, 0.2 %P, and 0.7% K for computing the nutrient availability from dung manure. We arrived at these figures based on our savvy and our analysis of 200 manure and dung samples from nine states in India. We also took into consideration the recent reported literature on nutrient concentration in manures.
30

Winter School on “Waste recycling and resource management”-Dec. 3-23, 2014
2.2 Computation of crop residues We took the reported crop yield data of 2006-07 since the district-wise data of latter years is not availably. We computed the straw production based on standard harvest index. We assumed that only 5% of the straw is recycled as crop residue. This is also based on the reported literature. Next we computed the N, P, and K availability from residues based on the representative N, P, and K content in straw of different crops, as available from the literature.Ninety five percent of the straw goes to cattle feed, out of which 15% is assumed to reach the FYM pit.
2.3 Computation of nitrogen from green manures
It is assumed that green manure crops add 30 kg N/ha (Pathak et al., 2010). We have multiplied the area under green manure crops in every district by 30 and that is the addition of N through green manure.
2.4 Computation of crop uptake and nutrient balances
The first estimate of nutrient removal by crops was made by National commission on Agriculture (NCA) which published its report in 1971. Tandon and Narayan, 1990, taking the nutrient removal data of NCA, stated a net negative balance of N, P2O5, and K2O of 8-10 million tones/annum. They took into consideration of the nutrient inputs from fertilizers and output through crop uptake. Nutrient additions from organic manures were not taken into consideration. However, their estimates were based on actual data for 1961, 1971, and 1986 whereas for the year 1989 and 2000, the balances were based on projected figures of fertilizer consumption and crop production. They predicted a foodgrain production of 240 million tones in the year 2000 and estimated a figure of 30 million tones of total N, P2O5, and K2O consumption by all crops. With a projected figure of consumption of fertilizer N, P2O5, and K2O at 22 million tones a net negative balance of 8 million tones could be obtained. But the actual foodgrain production did not increase as expected (It was only 196.81 million tones) whereas actual fertilizer consumption was same as expected in 2000. We have calculated the total nutrient removals per tonne of economic yield by individual crops in a district and summed the data for all crops in a district to arrive at the district figure.
2.5 Addition and removal by other natural processes
Besides additions through fertilizers and organics and removals through crop uptake, other forces of nature also influence the nutrient budget. For example rainwater and irrigation water also contribute in nutrient additions and leaching and volatilization losses result in nutrient losses especially nitrogen and potassium. But very meager information is available on these issues. We have used the following formula for nutrient additions and removals.
Rain N = amount of rain* N concentration in rainwater (1 mg N/litre, Pathak et al., 2010)
31

Winter School on “Waste recycling and resource management”-Dec. 3-23, 2014
Irrigation N = Irrigation water used * N concentration in irrigation water (2 mg N/litre)
Rain P = amount of rain* P concentration in rainwater (0.1 mg P/litre)
Irrigation P = Irrigation water used *P concentration in irrigation water (0.05 mg K/litre)
Rain K = amount of rain* K concentration in rainwater (0.1 mg K/litre)
Irrigation K = Irrigation water used *P concentration in irrigation water (0.05 mg K/litre)
Nitrogen losses are taken as 40% of additions and K losses are taken as 15% of fertilizer K additions.
2.6 Creation of database
The database can be queried as per the information sought by the user and the result was displayed. The data is organized following the RDBMS principles for better data management in which the data redundancy, inconsistency and relationship among data will be properly taken care of. With data so structured, it may be used in many different ways to give the information to the user easily.
3. Results
3.1 Type of animals in different states
The availability of dung was in proportion to the number of animals. However, the type of animal also had an influence in the overall estimates. A highly skewed distribution w.r.t. “Number of crossbred cows per 1000 indigenous cows” and “Number of buffaloes per 1000 cows” was observed in the country. Some states had much lower population of crossbred cows in comparison to indigenous cows as against those that had high values for the same. Similar skewed distribution was also observed in buffalo:cow ratio in different states of India.
32
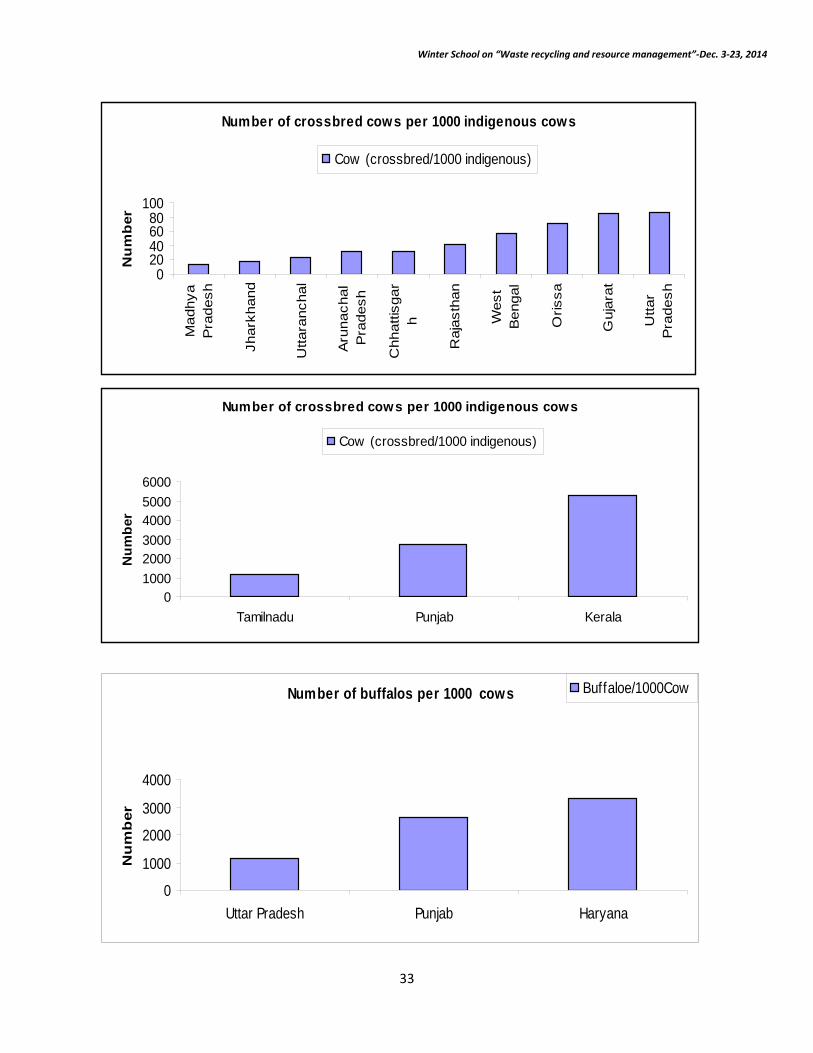
Winter School on “Waste recycling and resource management”-Dec. 3-23, 2014
Number of crossbred cows per 1000 indigenous cows
020406080
100M
adhy
aP
rade
sh
Jhar
khan
d
Utta
ranc
hal
Aru
nach
alP
rade
sh
Chh
attis
gar
h
Raj
asth
an
Wes
tB
enga
l
Oris
sa
Guj
arat
Utta
rP
rade
sh
Nu
mb
er
Cow (crossbred/1000 indigenous)
Number of crossbred cows per 1000 indigenous cows
0100020003000400050006000
Tamilnadu Punjab Kerala
Num
ber
Cow (crossbred/1000 indigenous)
Number of buffalos per 1000 cows
0
1000
2000
3000
4000
Uttar Pradesh Punjab Haryana
Nu
mb
er
Buffaloe/1000Cow
33

Winter School on “Waste recycling and resource management”-Dec. 3-23, 2014
Number of buffalos per 1000 cows
0
20
40
60
80
100
Kerala West Bengal Arunachal Pradesh
Num
ber
Buffaloe/1000Cow
3.2 Animal population and dung manure
The estimates of dung manure available in the country are given below. The difference between earlier estimates and our estimate is that earlier estimate are for theoretical dung manure availability whereas we have taken the actual manure availability. Another difference is that earlier estimates only took into account the dung biomass whereas we have assumed the enhanced biomass on account of additions through left over feed materials, bedding materials etc. Third, earlier estimates took a representative value for cow and buffaloe dung and then multiplied by number irrespective of the age or breed of animal. We have taken two calves as one adult but we have taken separate values of indigenous and crossbred cows. This is important considering the phenomenal difference across the states with respect to the relative number of indigenous and crossbred cows. The availability dung manure comes out to be 293 million tones.
Animal census (millions) and dung manure estimates (million tonnes)
1982 1991 1997 2003
Animals Population Dung manure
Population Dung manure
Population Dung manure
Population Dung manure
Cattle 192 211 198 218 198 185
Buffaloe 70 94 77 104 89 98
34
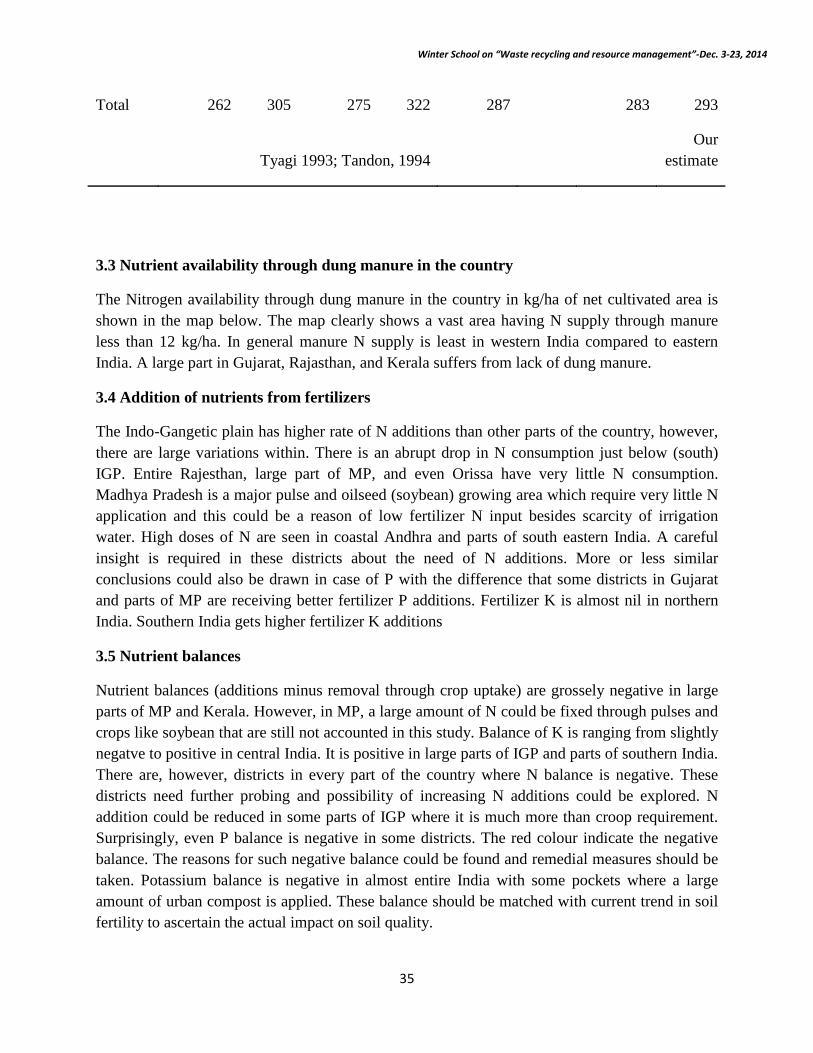
Winter School on “Waste recycling and resource management”-Dec. 3-23, 2014
Total 262 305 275 322 287 283 293
Tyagi 1993; Tandon, 1994 Our
estimate
3.3 Nutrient availability through dung manure in the country
The Nitrogen availability through dung manure in the country in kg/ha of net cultivated area is shown in the map below. The map clearly shows a vast area having N supply through manure less than 12 kg/ha. In general manure N supply is least in western India compared to eastern India. A large part in Gujarat, Rajasthan, and Kerala suffers from lack of dung manure.
3.4 Addition of nutrients from fertilizers
The Indo-Gangetic plain has higher rate of N additions than other parts of the country, however, there are large variations within. There is an abrupt drop in N consumption just below (south) IGP. Entire Rajesthan, large part of MP, and even Orissa have very little N consumption. Madhya Pradesh is a major pulse and oilseed (soybean) growing area which require very little N application and this could be a reason of low fertilizer N input besides scarcity of irrigation water. High doses of N are seen in coastal Andhra and parts of south eastern India. A careful insight is required in these districts about the need of N additions. More or less similar conclusions could also be drawn in case of P with the difference that some districts in Gujarat and parts of MP are receiving better fertilizer P additions. Fertilizer K is almost nil in northern India. Southern India gets higher fertilizer K additions
3.5 Nutrient balances
Nutrient balances (additions minus removal through crop uptake) are grossely negative in large parts of MP and Kerala. However, in MP, a large amount of N could be fixed through pulses and crops like soybean that are still not accounted in this study. Balance of K is ranging from slightly negatve to positive in central India. It is positive in large parts of IGP and parts of southern India. There are, however, districts in every part of the country where N balance is negative. These districts need further probing and possibility of increasing N additions could be explored. N addition could be reduced in some parts of IGP where it is much more than croop requirement. Surprisingly, even P balance is negative in some districts. The red colour indicate the negative balance. The reasons for such negative balance could be found and remedial measures should be taken. Potassium balance is negative in almost entire India with some pockets where a large amount of urban compost is applied. These balance should be matched with current trend in soil fertility to ascertain the actual impact on soil quality.
35

Winter School on “Waste recycling and resource management”-Dec. 3-23, 2014
Nutrient budget (All India)
Overall balance for whole India is given in table given below. Balance 1 is positive for N and P while its is negative for K. However, when additions due to rain and irrigation water are accounted the balance becomes negative for N also. P balance is also only slightly positive. The total N, P2O5, and K2O removal through crop uptake comes out to be 10, (1.83*2.29=4.19), and (10.3*1.2=12.36), respectively which adds up to 26.55 million tones. This figure is obtained the year 2006-07 with the total foodgrain production of 217 million tones. Assuming that the nutrient content of the crops would remain same, this works out to be 29.4 million tones for a foodgrain production level of 240 million tones (assumed current situation). Our estimate tally well with the projected estimate of Tandon and Pratap Narayan 1985 who projected a removal of 30 million tones at the foodgrain level of 240 million tones based on the nutrient removal figure of National Commission on Agriculture (1971). But their estimates of nutrient balances were purely based on nutrient additions through fertilizers and nutrient removal through crop uptake. With these consideration they projected a constant year to year negative balance of N, P2O5, and K2O at 8-10 million tones. However, there have some deviations than what was assumed around two decades back. First the nutrient removals have not increased as expected because of a slower than expected growth rate in agricultural production. Second, nutrient addition through fertilizers have increased at a faster rate than expected. Third, we have also added the addition of nutrients through organics. The combined affect of these have resulted into a positive balance for nitrogen and not so negative balance for potassium. Our balance for nitrogen would become even more positive if we included the contribution of legumes like soybean, gram, pigeonpea, groundnut etc. These estimates clearly indicate that Indian soils are not less fertilized but regional distribution warrants a more serious though for the region specific management of nutrients. Also nitrogen loss through volatilization and leaching appears a prominent phenomenon that converts a positive balance into negative. There is need to precisely measure such losses in different system and upscale the data at district and state level. The contribution of crop residues have been taken as only 5% of the total. Obviously the diffusion of LPG in the hinterland would make these residues available for composting in years to come provided they are not channelized in other uses. There is vast potential in terms of human excreta in terms of nutrient contribution that need attention.
N (Million tones) P (Million tones) K (Million tones) Addition through FYM
1.42 0.41 1.42
Addition through Fertilizers
14.47 2.47 2.52
Addition through Crop residues
0.22 0.07 0.30
Addition through Green manure
0.11 0 0
36

Winter School on “Waste recycling and resource management”-Dec. 3-23, 2014
Removal through crop uptake
8.4+1*+0.6**=10 1.53+0.2*+0.1**=1.83 8.7+1*+0.6**=10.3
Balance (1) 6.22 0.12 -6.06 Addition through Deposition
2.30 0.35 2.1
Removal through leaching and volatilization
8.40 0 1.23
Balance (2) -1.10 +0.47 -5.19
Creation of database
The database for the above work has been generated in MS access. This database can be accessed by user friendly queries. To access the data one has to open the file Nutrientdatabase.mdb and then click queries. The user will find several queries which when clicked will ask the name of state, district, crop, manure type for which the information is desired. When user feeds the desired name, he will get the nutrient data.
Following queries have been prepared:
1. Enter district name for crop data 2. Enter state name for N balance 3. Enter state name for P balance 4. Enter state name for K balance 5. Enter district name for N balance 6. Enter district name for P balance 7. Enter district name for K balance 8. Enter district name for crop data 9. Enter manure name for recovery 10. Enter state name for manure availability
4. Conclusion and future line of work
The total availability of manure N, crop residue N, and Green manure N is is 1.42, 0.216, and 0.112 mt, respectively. The total consumption of fertilizer N is 14.47 mt. This means around 10% of total N consumption is presently met by organic manures. Around 15% of P need is met by organic sources, whereas the figure for K are more encouraging. Around 60% of K consumption is met by organic sources. This is when only 40% of the organic is going in farmyard manure pits. This actual supply may be increased by 50% if the available organic resources are channeled in agriculture.
Manure nutrient recovery coefficients were computed for different manure types for different crops. In rice, N Ranged from 16-86% with a mean and median 31 and 23, respectively. For P the range was 6-65% with mean and median 24 and 17%, respectively. For potassium the range
37

Winter School on “Waste recycling and resource management”-Dec. 3-23, 2014
was 9-154%, with mean and median 49 and 32, respectively. The values above 100 indicate the enhanced availability of soil and fertilizer nutrients in presences of manures. The mean and median values of recovery of N, P and K in case of wheat were 28 & 21, 11 & 10, and 17 & 36%, respectively.
The nutrient recovery coefficients for maize, bajra, barley, ragi, groundnut, onion, soybean, tapioca, sweet potato, cauliflower, tomato, guar, cabbage have also been compiled and fed to database. The nutrient recovery coefficients were also arranged according to types of manure. The mean N recovery from FYM was 39% with a median of 21%. For P and K, the corresponding values were 20 & 17%, and 41 & 32%, respectively. This shows the recovery of K from FYM is highest followed by N and P. The compost prepared primarily from plant trashes had the mean recovery values of N, P, and K 20, 14, and 34%, respectively, a relatively lower values than FYM.
The recovery coefficients from other manures like bio gas slurry, poultry manure, Azospirillum, oilcakes, press-mud have also been compiled and fed into the database.
The information generated in the project has revealed that there are some districts, mainly in central India, where current N budget is negative, whereas there are some areas in south India and in IGP the balance is grossly positive. The details of the actual data alongwith the district names can be accessed from the database. P balance is generally positive but K balance is negative in several central and western districts. More nutrients need to be allocated in these areas.
The main constraint is the availability of districtwise crop area, production, and productivity data. The data for the states of Jharkhand, and Uttarakhand was not available. Also the latest data available was for the year 2006-07. Hence we have used the fertilizer consumption data also for the same year. But this puts a constraint that the database is not up to date.
The quality of data is another concern. There could be overlap between farmyard manure and rural compost as published by (FAI 2007-08). Also the consumption of nutrients in each district should be actual consumption. In some districts it appears overestimated as the sales figures are very high and might being consumed in adjoining districts.
The regionwise content of nutrients in rain and irrigation water is not available. Hence we had to take one representative figure for the whole country. Also the amount of irrigation water used in different regions is not available with precision.
38

Winter School on “Waste recycling and resource management”-Dec. 3-23, 2014
Soil Test based bio-intensive nutrient management in agriculture for achieving yield target
P. Dey
Indian Institute of Soil Science, Nabibagh, Berasia Road, Bhopal-462038
The major challenges in 21st century are food security, environmental quality and soil health. Besides, shrinking land holdings and increasing cost of inputs in India merit adoption of scientific use of plant nutrient for higher crop productivity. The soil fertility and fertilizer use project initiated in 1953 following a study by Stewart in 1947 which was the first systematic attempt in India to relate the knowledge of the soils to the judicious use of chemical fertilizers. The soil testing programme was started in India during the year 1955-56 with the setting up of 16 soil testing laboratories under the Indo-US Operational Agreement for “Determination of Soil Fertility and Fertilizer Use”. In 1965, five of the existing laboratories were strengthened and nine new laboratories were established to serve the Intensive Agricultural District Programme (IADP) in selected districts. Chemical indices of nutrient availability chosen for use in the soil testing laboratories consisted of organic carbon or alkaline permanganate oxidizable nitrogen, as a measure of available nitrogen, sodium bicarbonate (Olsen’s extractant) extractable phosphorus, as a measure of available phosphorus and neutral normal ammonium acetate extractable potassium, as a measure of available potassium. Muhr and coworker describe sets of critical values that characterized the estimates as low, medium or high in a monograph on soil testing in India in 1965. Background research for the choice of critical values consisted of a few pot culture and field experiments with paddy and wheat, carried out in the Division of Soil Science & Agricultural Chemistry at Indian Agricultural Research Institute, New Delhi. Taking a simplistic view of the situation, the differences among soil groups in the range of properties, which influence the susceptibility to absorption by plants of native and applied nutrients, were ignored. The generalized recommendations of fertilizer use developed for the soil testing laboratory area were thought applicable to the medium category of soil testing estimates with an arbitrary adjustment (decrease or increase by 25-50 per cent) for high and low categories of soil test estimates. The ICAR project on soil test crop response AICRP (STCR) has used the multiple regression approach to develop relationship between crop yield on the one hand, and soil test estimates and fertilizer inputs, on the other. Nutrient supplying power of soils, crop responses to added nutrients and amendment needs can safely be assessed through sound soil testing programme. Soil test calibration that is intended to establish a relationship between the levels of soil nutrients determined in the laboratory and crop response to fertilizers in the field permits balanced fertilization through right kind and amount of fertilizers.
Liebig’s law of minimum states that the growth of plants is limited by the plant nutrient
element present in the smallest amount, all others being in adequate quantities. From this, it follows that a given amount of a soil nutrient is sufficient for any one yield of a given percentage nutrient composition. Ramamoorthy and his co-workers in the year 1967 established the theoretical basis and experimental proof for the fact that Liebig’s law of the minimum operates equally well for N, P and K. This forms the basis for fertiliser application for targeted yields, first
39

Winter School on “Waste recycling and resource management”-Dec. 3-23, 2014
advocated by Truog in the year 1960. Among the various methods of fertiliser recommendation, the one based on yield targeting is unique in the sense that this method not only indicates soil test based fertiliser dose but also the level of yield the farmer can hope to achieve if good agronomic practices are followed in raising the crop. Basic data requirement
The essential basic data required for formulating fertiliser recommendation for targeted yield are
• Nutrient requirement in kg/q of produce, grain or other economic produce • The per cent contribution from the soil available nutrients • The per cent contribution from the applied fertiliser nutrients
The above mentioned three parameters are calculated as follows.
Nutrient Requirement of N, P and K for Grain Production: kg of nutrient/q of grain =
Contribution of nutrient from soil =
Contribution of nutrient from fertilizer: Contribution from fertilizer (CF) = Total uptake of nutrients in treated plots – (Soil test value of nutrients in fertilizer treated plots × CS) % Contribution from Fertilizer = × 100
Calculation of fertilizer dose: The above basic data are transformed into workable adjustment equation as follows: Fertilizer dose = × 100 × T - × soil test value = a constant × yield target (q/ha) – b constant × soil test value (kg/ha)
The differentiation of significant multiple regression equations provides a basis for soil test-fertilizer requirement calibration for maximum yield per hectare, maximum profit per hectare and maximum profit per rupee investment on fertilizer. The resultant fertilizer adjustment equations have been tested in follow up and frontline demonstrations conducted in different parts of the country. In these trials soil test based rates of fertilizer application helped to
40

Winter School on “Waste recycling and resource management”-Dec. 3-23, 2014
obtain higher response ratios and benefit: cost ratios over a wide range of agro-ecological regions (Dey and Srivastava, 2013).
IPNS based bio-intensive nutrient management in agriculture for achieving yield target
In this technology, the fertilizer nutrient doses are adjusted not only to that contributed from soil but also from various organic sources like FYM, green manure, compost crop residues and bio-fertilizers like Azospirillum and Phosphobacteria. As the present requiment of chemical fertilizers is 32 million tonnes and only 22 million tonnes of chemical fertilizers are being used, a shortage of 10 million tonnes is occurring and hence combined use of chemical fertilizers along with organics becomes inevitable. In addition to this, addition of organics will help in sustaining the soil productivity and maintaining the soil health by way of improvement of soil physical, chemical and biological properties.
Methodology of IPNS based Bio-intensive nutrient management using STCR calibration
It is same as described in previous section. Apart from determination of nutrient requirement (NR) in kg q-1 of economic produce, per cent availability of soil available nutrients (CS) as measured by soil tests, and per cent availability of the fertilizer nutrients (CF), and contribution from organic nutrients (CO) were also computed using following equation: Contribution of N or P2O5 or K2O from Organics (CO)= [Total uptake of N or P2O5 or K2O in organic plots in kg/ha STV of N or P x 2.29 or K x 1.21 in organic plots in kg/ha x mean Cs of N or P2O5 or K2O] / [Amount of N or P2O5 or K2O added as organics in kg/ha] The calculated parameters are transformed into the fertilizer adjustment equation as given below.
F = T x NR/ CF – CS x STV/ CF - CO x M/ CF
Where,
F = Fertilizer dose of N, P2O5 or K2O in kg ha-1
T = Yield target in q ha-1
NR = Nutrient requirement of N, P2O5 (P x 2.29) or K2O (K x 1.21) in 100 /kg for economic produce.
CS = Contribution from soil nutrients in fraction
CF = Contribution from fertilizer nutrients in fraction
CO = Contribution from organic nutrients in fraction
STV = Soil available nutrients [N, P2O5 (P x 2.29) or K2O (K x 1.21)] determined through soil analysis
41

Winter School on “Waste recycling and resource management”-Dec. 3-23, 2014
M = Nutrient content in organic matter [N, P2O5 (P x 2.29) or K2O (K x 1.21)] determined through organic matter analysis × FYM
Given below a state-wise listing of crops and vatieties for which fertilizer and manure prescription equations with IPNS based bio-intensive nutrient management approach are available:
State IPNS-STCR fertiliser prescription equations developed for crop/variety
Andhra Pradesh
Rice (NLR -9672), Rice (MTV -5182), Rice (Tella hamsa), Rice (MTU -2067), Rice (Pothana), Rainfed Jowar (CHS-9), Sugarcane (87A-298), Colocassia (KCS-2), Tomato (Pusa rabi), Onion (Nasic Red), Muskmelon (Maduras), Foxtail millet (Krishnadevaraya), Soybean (JS-335), Senna (CIMAP collection),
Maharashtra Soybean (JS-335), Okra (Arka anamika), Cauliflower (Namdhari No.90), Potato (Khufri Jyoti),Potato (Dhanshree), Turmeric (Salem), Chilli (Phule Jyoti)
Himachal Pradesh
Wheat, Soybean, Turmeric (Palam Pitamber), Frenchbean (Laxmi), Onion (Nasik red), Pea (PB 89), Garlic (GHC-1)
Karnataka Rice (Rasi), Groundnut (TMV-2), Soybean (Improved varieties), Brinjal (Arka Ananda), Carrot (New Karoda)
Chhattisgarh Rice (Indira-9), Hybrid rice (Pro agro-6444), Hybrid rice (Indira Sona), Rice (MTU-1010), Sugarcane (Co- JN-14186), Sunflower (Jwalamukhi), Sunflower (JSF-1), Chickpea (Vijay), Cauliflower (Sungro Pusi-OP), Brinjal (Mukta kesi)
Delhi and Uttar Pradesh
Wheat, Maize, Pearl millet, Mustard, Soybean
Uttarakhand Maize (D-765,Ganga-2,Pragati), Mustard (Kranti, PYS-I), Onion (Nasik Red)
Bihar Wheat
Tamil Nadu Maize (CO-1), Cotton (MCU 5), Sugarcane (CO6304), Sugarcane (COC 671), Sunflower (Morden), Cabbage (Hybrid-Questo), Onion (CO 4), Hill Wheat (HW 2044), Plains wheat (CoW-W-1), Sorghum (CSH 5), Sorghum (CO 24), Ragi (CO 11), Groundnut (POL 2), Bhendi (Arka Anamica), Cauliflower (Hybrid Pawas),
42

Winter School on “Waste recycling and resource management”-Dec. 3-23, 2014
Potato (Kufri Thenmalai), Carrot (Kuruda Super), Beetroot (Ruby Queen), Radish (Pusa Chetki long), Tapioca (H 226), Turmeric (BSR 2), Ashwagandha (JA 20)
West Bengal Boro rice (IET-4786), Cabbage (Green express)
Haryana Wheat (WH711), Durum Wheat (WH912), Barley (BH 393), Bajra (HHH 94), Raya (Luxmi), Bt Cotton (MRC 6304)
Rajasthan Wheat (Raj.-3077), Groundnut (M-13), Clusterbean vegetable (M-83), Cumin (RZ-209), Isabgol (RI-89), Fennel (RF-125), Bajra (HHB-67), Egg plant (F1 hybrid Kanhaya), Cotton (Bt), Okra (Arka Anamica)
Madhya Pradesh
Lentil (JL-1), Pea (JP-885), Garlic (G-323),Sunflower (Modern)
Kerala Sweet Potato (Varun ), Ash Gourd (KAU local)
Use of Targeted Yield Equation and Development of Prediction Equation for Cropping Sequence
Nutrient availability in the soil after the harvest of a crop is much influenced by the initial soil nutrient status, the amount of fertilizer nutrients added and the nature of the crop raised. But recently, the monoculture is replaced by cropping sequence approach. To apply soil test based fertilizer recommendations, the soils are to be tested after each crop, which is not practicable. Hence it has become necessary to predict the soil test values after the harvest of the crop. It is done by developing post-harvest soil test value prediction equations making use of the initial soil test values, applied fertilizer doses and the yields obtained or uptake of nutrients following the methodology outline by Ramamoorthy and coworkers in 1971. The post-harvest soil test values were taken as dependent variable and a function of the pre-sowing soil test values and the related parameters as yield/uptake and fertilizer nutrient doses. The functional relationship is as follows:
Prediction Equation for Cropping Sequence:
The method of calculation for prediction of post harvest soil test values for cropping sequences is given below for use by each center:
YP/H = f (F, IS, yield/nutrient uptake) Where, YP/H is the post harvest soil test value, F is the applied fertilizer nutrient and IS is the initial soil test value. The mathematical form is
43

Winter School on “Waste recycling and resource management”-Dec. 3-23, 2014
YP/H = a + b1F + b2 IS + b3 yield/uptake
Where, a is the absolute constant and b1, b2 and b3 are the respective regression coefficients. Prediction equations for post-harvest soil test values were developed from initial soil test values, fertilizer doses applied and yield of crops/uptake of nutrients to obtain a basis for prescribing the fertilizer amounts for the crops succeeding the first crop in the cropping sequence.
During last fifteen year, the different centres of AICRP on STCR developed prediction equation by using the targeted yield equation for different cropping sequence like rice-rice, rice-maize, rice-wheat, maize-tomato, maize-wheat, potato-yellow sarson, paddy-ragi, maize-Bt. Cotton, wheat-groundnut, okra-wheat, paddy-chick pea, soybean-wheat, rice-pumpkin, bajra-wheat, cotton-maize and soybean-onion. The predicted values can be utilized for recommending the fertilizer doses for succeeding crop thus eliminating the need of soil test after each crop. This provides the way for giving the fertilizer recommendations for whole cropping sequence based on initial soil test values. For example, in Potato– Yellow Sarson cropping sequence:
Potato (Kufri Jyoti) PHN = 104.94 + 0.28 FN – 0.041 SN – 0.11 Y (R2 = 0.35**) PHP = -2.74 + 0.091 FP + 0.84 SP + 0.013 Y (R2 = 0.78**) PHK = 31.28 + 0.71 FK + 0.45 SK – 0.17 Y (R2 = 0.70**)
Yellow Sarson (PYS-I)
PHN = 107.91 + 0.36 FN – 0.08 SN – 0.79 Y (R2 = 0.72**) PHP = 23.19 + 0.26 FP + 0.011 SP + 0.24 Y (R2 = 0.70**) PHK = 153.25 + 0.42 FK + 0.02 SK – 0.54 Y (R2 = 0.56**)
Scheduling Fertiliser Dressings in Cropping Sequences
Nutrient availability in soil after the harvest of a crop is much influenced by the initial soil nutrient status, the amount of fertiliser nutrients added and the nature of the crop raised. Of late the monoculture is replaced by cropping sequence. For soil test based fertiliser recommendations the soils are to be tested after each crop which is not practicable. Hence it has become necessary to predict the soil test values after the harvest of a crop. It is done by developing post-harvest soil test value prediction equations making use of the initial soil test values, applied fertiliser doses and the yields obtained or uptake of nutrients (3). The functional relationship is as follows:
YPH = f(F, IS, yield/nutrient uptake)where, YPH is the post-harvest soil test value, F is the applied fertiliser nutrient and IS is the initial soil test value. The mathematical form is YPH = a + b1F + b2 IS + b3 yield/uptake
44

Winter School on “Waste recycling and resource management”-Dec. 3-23, 2014
where, a is the absolute constant and b1,b2 and b3 are the respective regression coefficients. Benefits of Soil Test based targeted yield approach
During the last more than four decades the STCR project has generated numerous fertilizer adjustment equations for achieving targeted yields of important crops on different soils in different agro ecological regions of the country. These fertilizer adjustment equations have been tested in follow up and frontline demonstrations conducted in different parts of the country. In these trials soil test based rates of fertilizer application helped to obtain higher response ratios and benefit: cost ratios (Table 1 and 2) over a wide range of agro-ecological regions (Dey, 2012; Dey and Santhi, 2014). It is evident from above tables that STCR based approach of nutrient application has definite advantage in terms of increasing nutrient response ratio over general recommended dose of nutrient application. Yields and response ratios can be increased if the fertilizer prescriptions are made as per the table 1 for specified crops and locations.
Table 1. Response Ratios in existing and improved practice for different crops at different sites in India: Results from AICRP on STCR
Crop Location/
AER
Soil type Fertilizer Response Ratio (kg grain/kg nutrient)
Present practice
Improved practice
Fertilizer dose
RR Fertilizer dose
RR
Type of intervention
Rice Coimbatore/8.1, Hot dry semi-arid
Alfisol GRD: 120-38-38
16.5 STCR: 7 t/ha
185-51-19
STCR: 7 t/ha under IPNS (GM @ 6.25 t/ha
17.0
19.7
Soil test based fertilizer recommendation under IPNS
45

Winter School on “Waste recycling and resource management”-Dec. 3-23, 2014
and Azospirillum @ 2 kg/ha
150-67-10
Rice Coimbatore/8.1, Hot dry semi-arid
Alfisol GRD: 120-38-38
15.4 STCR: 7 t/ha
179-71-19
16.1
Soil test based balanced fertilization
Rice Hisar, Haryana/ 2.3 Hot typic arid
Podzolic Farmers’ Practice
75-30-0
18.31 2
STCR: 7 t/ha
139-63
23.49 2
Soil test based balanced fertilization
Rice Jabalpur/ 10 Hot sub-humid
Medium black
GRD: 80-70-40
8.47 STCR: 3.5 t/ha
76-66-0
11.13
Soil test based balanced fertilization
Rice Kalyani, WB/ 15.1 Hot moist sub-humid
Deep loamy to clayey alluvial
80-40-40
8.02 Soil test based
62.5-28-62 + 7.5 t/ha FYM
13.19
Soil test based fertilizer recommendation under IPNS
Rice Narsinghpur, MP
GRD: 80-70-40
11.45**
STCR: 4 t/ha
19.07**
Soil test based balanced
46
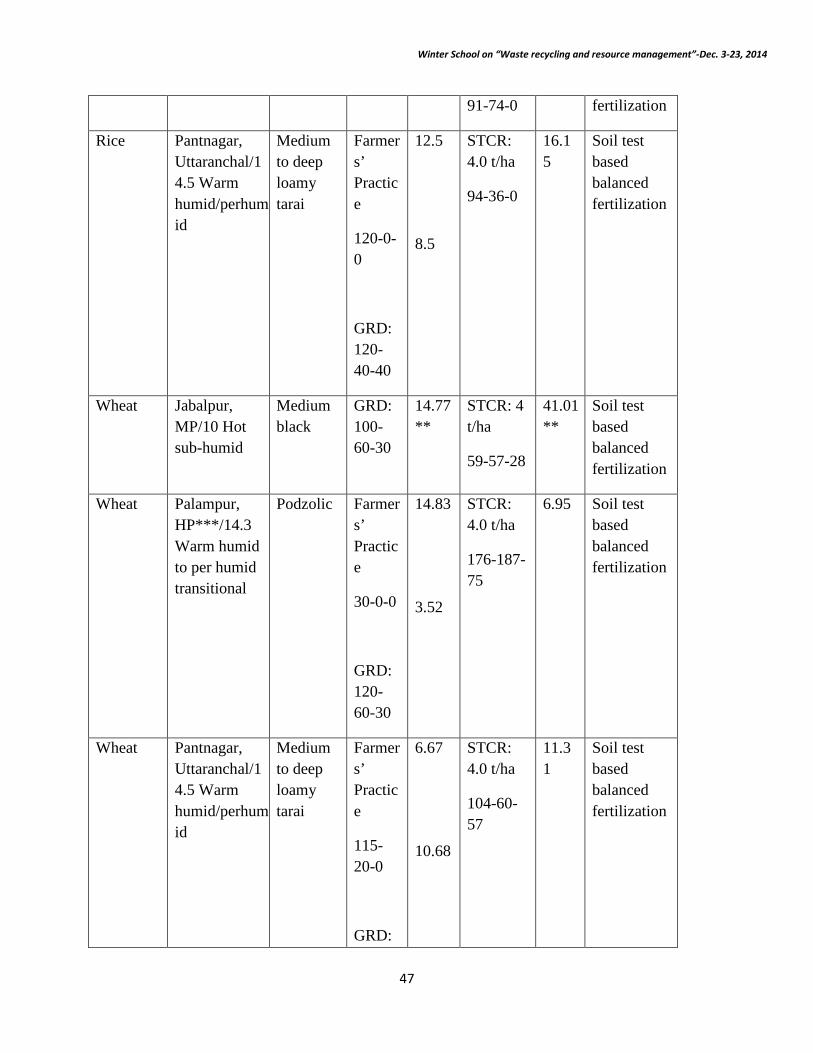
Winter School on “Waste recycling and resource management”-Dec. 3-23, 2014
91-74-0 fertilization
Rice Pantnagar, Uttaranchal/14.5 Warm humid/perhumid
Medium to deep loamy tarai
Farmers’ Practice
120-0-0
GRD: 120-40-40
12.5
8.5
STCR: 4.0 t/ha
94-36-0
16.15
Soil test based balanced fertilization
Wheat Jabalpur, MP/10 Hot sub-humid
Medium black
GRD: 100-60-30
14.77**
STCR: 4 t/ha
59-57-28
41.01**
Soil test based balanced fertilization
Wheat Palampur, HP***/14.3 Warm humid to per humid transitional
Podzolic Farmers’ Practice
30-0-0
GRD: 120-60-30
14.83
3.52
STCR: 4.0 t/ha
176-187-75
6.95 Soil test based balanced fertilization
Wheat Pantnagar, Uttaranchal/14.5 Warm humid/perhumid
Medium to deep loamy tarai
Farmers’ Practice
115-20-0
GRD:
6.67
10.68
STCR: 4.0 t/ha
104-60-57
11.31
Soil test based balanced fertilization
47

Winter School on “Waste recycling and resource management”-Dec. 3-23, 2014
120-60-40
Finger millet
Kolhapur, Maharashtra
Rainfed submontain zone
Black soil
GRD: 60-30-0
10.1 STCR: 1.6 t/ha
45-34-17
10.9 Soil test based balanced fertilization
Maize Palampur, HP***/14.3 Warm humid to per humid transitional
Podzolic Farmers’ Practice
40-0-0
GRD: 120-60-40
13.1
7.14
STCR: 4.0 t/ha
189-0-73
8.91 Soil test based balanced fertilization
Chickpea Durg, Chattisgarh/11 Hot/moist/dry sub humid transitional
Vertisol Farmers’ Practice
10-30-0
GRD: 20-50-20
2.78
2.76
STCR: 1.2 t/ha
20-0-0
7.90 Soil test based balanced fertilization
Chickpea Jabalpur/ 10 Hot sub-humid
Medium black
GRD: 20-60-20
9.00 STCR: 1.5 t/ha
22-36-0
12.76
Soil test based balanced fertilization
Urid Jabalpur/ 10 Hot sub-
Medium black
GRD: 20-50-
0.361** (Mea
STCR: 1.2 t/ha
0.464**
Soil test based balanced
48

Winter School on “Waste recycling and resource management”-Dec. 3-23, 2014
humid 20 n of
three trials)
25-35-0 fertilization
Groundnut
Coimbatore, north western zone of TN/8.1, Hot dry semi-arid
Red soil, Irugur series
GRD: 18-36-54
4.62 STCR: 2.5 t/ha
55-55-71
STCR: 2.5 t/ha with 12.5 t/ha FYM
17-37-31
5.5
5.92
Soil test based fertilizer recommendation under IPNS
Groundnut
Kakapalayam, TN/8.1, Hot dry semi-arid
Red soil, Irugur series
GRD: 18-36-54
6.7 STCR: 2.5 t/ha
50-43-72
STCR: 2.5 t/ha with 12.5 t/ha FYM
15-25-32
6.9
7.4
Soil test based fertilizer recommendation under IPNS
Groundnut
Kolhapur, Maharashtra
Typic haplustert
GRD: 25-50-0
20.9 STCR: 2.5 t/ha
55-62-24
13.8 Soil test based balanced fertilization
Groundnut
Tumkur, Karnataka
GRD: 25-75-38
5.50 STCR: 2.0 t/ha
16-144-53
6.20
Soil test based balanced fertilization
49

Winter School on “Waste recycling and resource management”-Dec. 3-23, 2014
Linseed Jabalpur, MP/10 Hot sub-humid
Medium black
GRD: 60-40-20
5.21 STCR: 2.0 t/ha
89-51-19
8.29
Soil test based balanced fertilization
Mustard Durg, Chhattisgarh
Vertisol Farmers’ Practice
60-40-0
GRD: 120-80-40
2.71
6.53
STCR: 1.3 t/ha
103-83-0
6 Soil test based balanced fertilization
Mustard Jabalpur, MP/10 Hot sub-humid
Medium black
GRD50-30-20
4.38 STCR: 1.6 t/ha
68-42-16
5.44
Soil test based balanced fertilization
Mustard Jabalpur/ 10 Hot sub-humid
Medium black
GRD: 50-30-20
2.29 STCR: 2 t/ha
88-46-35
2.34 Soil test based balanced fertilization
Mustard New Delhi/ 4.1 Hot semi-arid
Alluvial soils
Farmers’ Practice
60-57-0
GRD: 80-40-
6.4 1
7.8 1
STCR: 2.5 t/ha
90-43-48
8.6 1 Soil test based balanced fertilization
50
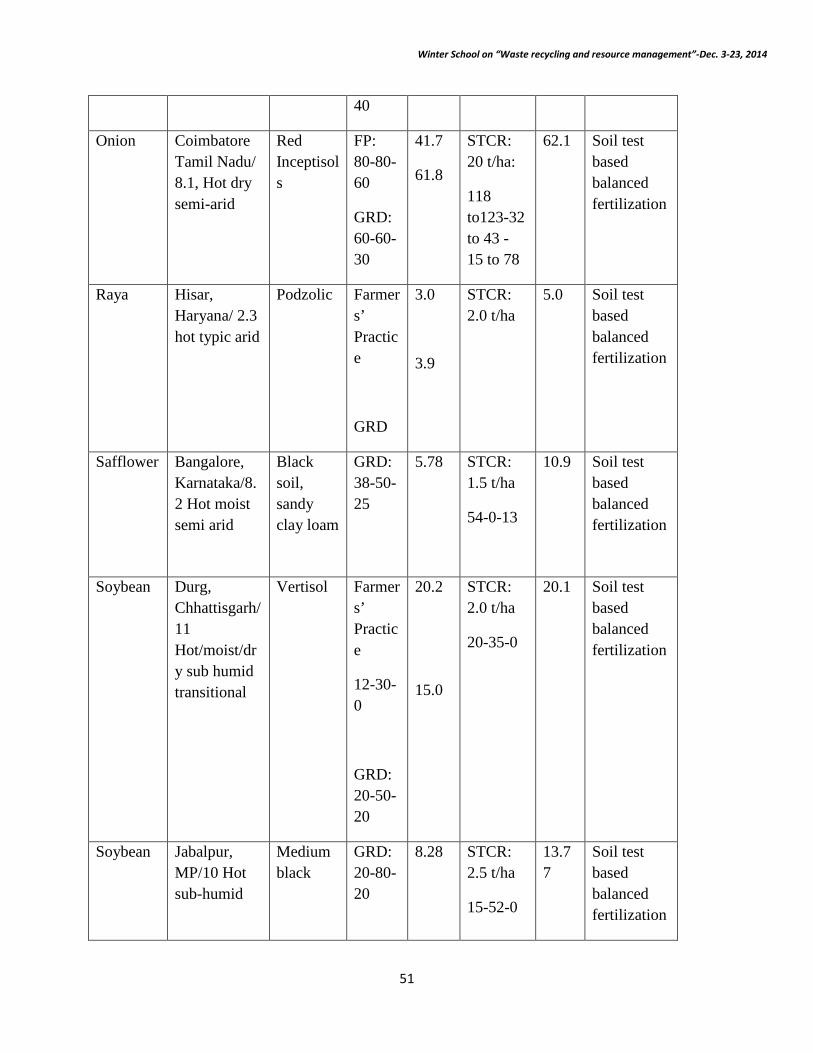
Winter School on “Waste recycling and resource management”-Dec. 3-23, 2014
40
Onion Coimbatore Tamil Nadu/ 8.1, Hot dry semi-arid
Red Inceptisols
FP: 80-80-60
GRD: 60-60-30
41.7
61.8
STCR: 20 t/ha:
118 to123-32 to 43 - 15 to 78
62.1 Soil test based balanced fertilization
Raya Hisar, Haryana/ 2.3 hot typic arid
Podzolic Farmers’ Practice
GRD
3.0
3.9
STCR: 2.0 t/ha
5.0 Soil test based balanced fertilization
Safflower Bangalore, Karnataka/8.2 Hot moist semi arid
Black soil, sandy clay loam
GRD: 38-50-25
5.78 STCR: 1.5 t/ha
54-0-13
10.9
Soil test based balanced fertilization
Soybean Durg, Chhattisgarh/11 Hot/moist/dry sub humid transitional
Vertisol Farmers’ Practice
12-30-0
GRD: 20-50-20
20.2
15.0
STCR: 2.0 t/ha
20-35-0
20.1 Soil test based balanced fertilization
Soybean Jabalpur, MP/10 Hot sub-humid
Medium black
GRD: 20-80-20
8.28 STCR: 2.5 t/ha
15-52-0
13.77
Soil test based balanced fertilization
51

Winter School on “Waste recycling and resource management”-Dec. 3-23, 2014
Sunflower
Coimbatore, north western zone of TN/8.1, Hot dry semi-arid
Red soil, Irugur series
GRD: 60-40-40
4.34 STCR: 2.0 t/ha
87-63-13
STCR: 2.5 t/ha with 12.5 t/ha FYM
52-45-0
7.05
7.57
Soil test based fertilizer recommendation under IPNS
Sunflower Jabalpur/ 10 Hot sub-humid
Medium black
GRD: 80-40-25
4.31 STCR: 2 t/ha
197-27.4-0
5.10 Soil test based balanced fertilization
Sunflower Kalipalayam, TN/8.1, Hot dry semi-arid
Mixed black (Inceptisol)
FP: 50-40-50
GRD: 40-20-20
4.76
6.26
STCR: 2 t/ha
92-28-10
STCR: 2 t/ha with 12.5 t/ha FYM
62-13-5
6.86
7.33
Soil test based balanced fertilization
Bhendi Kalipalayam, TN/8.1, Hot dry semi-arid
Mixed black (Inceptisol)
FP: 100-60-60
GRD: 40-50-30
30.7
25.4
STCR: 1.5 t/ha
72-21-15
77.9 Soil test based balanced fertilization
52

Winter School on “Waste recycling and resource management”-Dec. 3-23, 2014
Bhendi Suradevanap
ura, Bangalore/ 8.2 Hot moist semi-arid
Medium to deep red laom
125-62.5-62.5
17.88 STCR: 8 t/ha
91-74-56
24.25
Soil test based balanced fertilization
Brinjal Rahuri, Maharashtra/ 6.1 Hot dry semi-arid
Typic ustorthent
GRD: 150-75-75
73.3 STCR: 5 t/ha
140-20-110
124.9 Soil test based balanced fertilization
Cabbage Rahuri, Maharashtra/6.1 Hot dry semi-arid
Ustorthent
GRD: 180-80-60
6.88 STCR: 3.5 t/ha
256-129-193
5.33 Soil test based balanced fertilization
Chilli Thirumalayampalayam,
Madukarai Block. Coimbatore, TN/8.1, Hot dry semi-arid
Red Inceptisol
GRD: 75-35-35
3.7 STCR: 2 t/ha
108-62-68
4.1 Soil test based balanced fertilization
IPNS = Integrated Plant Nutrient Supply; STCR = Soil Test Crop Response; * Higher yield obtained with lesser fertilizer dose than farmers’ practice; ** Response ratio calculated over farmers’ practice; 1 Average of two demonstrations; 2 Average of four demonstrations; *** In case of wheat and maize at Palampur the high response ratio in farmers’ practice is due to very low rates of fertilizer application. Even though the response ratio is high the level of yields the farmers are getting is very poor. In STCR technology the response ratio is not as high as in farmers’ practice but the yields are very good.
53

Winter School on “Waste recycling and resource management”-Dec. 3-23, 2014
Table 2: Average Response Ratios (kg grain/kg nutrients) Crop No. of trials Farmer’s practice STCR- IPNS recommended practice
Rice 120 11.4 16.8
Wheat 150 10.3 14.2
Maize 35 12.7 17.7
Mustard 45 8.0 8.2
Raya 25 4.8 7.6
Groundnut 50 5.1 6.8
Soybean 17 9.6 12.2
Chickpea 35 6.1 9.4
. On-line fertilizer recommendation systems developed by AICRP (STCR) http://www.stcr.gov.in
All India Coordinated Research Project on Soil Test Crop Response (AICRP-STCR) based at Indian Institute of Soil Science has developed a computer aided model that calculates the amount of nutrients required for specific yield targets of crops based on farmers’ soil fertility (Majumdar et al. 2014). It is accessible on Internet (http://www.stcr.gov.in). This software program reads data, performs calculations and generates graphical and tabular outputs as well as test reports. This system has the ability to input actual soil test values of the farmers’ fields to obtain optimum dose of nutrients. The application is a user friendly tool. It will aid the farmer in arriving at an appropriate dose of fertilizer nutrient for specific crop yield for given soil test values. Efforts are on way in developing bioinformatics, E-choupals, digital libraries and e Governance that can benefit agriculture immensely by way of providing information and assisting the users in adopting the newer technologies.
Computer software, including spreadsheets, databases, geographic information systems
(GIS), and other types of application software are readily available. The global positioning system (GPS) has given the farmer the means to locate position in the field to within a few feet. By tying position data in with the other field data mentioned earlier, the farmer can use the GIS capability to create maps of fields or farms. Sensors are under development that can monitor soil properties, crop condition, harvesting, or post harvest processing and give instant results or feedback which can be used to adjust or control the operation.
54

Winter School on “Waste recycling and resource management”-Dec. 3-23, 2014
DSSIFER
Decision Support System for Integrated Fertiliser Recommendation (DSSIFER) is a user friendly software and the updated version (DSSIFER 2010) encompasses soil test and target based fertiliser recommendations through Integrated Plant Nutrition System developed by the AICRP-STCR, Department of Soil Science and Agricultural Chemistry, TNAU, and the recommendations developed by the State Department of Agriculture, Tamil Nadu. If both recommendations are not available for a particular soil – crop situation, the software can generate prescriptions using blanket recommendations but based on soil test values. Using this software, fertilizers doses can be prescribed for about 1645 situations and for 190 agricultural and horticultural crops along with fertilisation schedule. If site specific soil test values are not available, data base included in the software on village fertility indices of all the districts of Tamil Nadu will generate soil test based fertiliser recommendation. Besides, farmers’ resource based fertilizer prescriptions can also be computed. Therefore, adoption of this technology will not only ensure site specific balanced fertilisation to achieve targeted yield of crops but also result in higher response ratio besides sustaining soil fertility. In addition, the software also provides technology for problem soil management and irrigation water quality appraisal. Moreover, STLs of all the organisations can generate and issue the analytical report and recommendations in the form of Soil Health Card (both in English &Tamil) which can be maintained by the farmers over long run.
Epilogue
Among the various methods of formulating fertilizer recommendation, the one based on IPNS based bio-intensive nutrient management for yield targeting has found popularity. This method not only indicates soil test based fertilizer dose but also the level of yield the farmer can hope to achieve if good agronomy is followed in raising the crop. It provides the scientific basis for balanced fertilization not only between the fertilizer nutrients themselves but also that with the soil available nutrients.
References
Dey, P. (2012). Soil-Test-Based Site-Specific Nutrient Management for Realizing Sustainable Agricultural Productivity. In: Book- International Symposium on “Food Security Dilemma: Plant Health and Climate Change Issues(Eds. Khan et al.), held at FTC, Kalyani on December 7-9, 2012, pp. 141-142.
Dey, P. and Santhi, R. (2014). Soil test based fertiliser recommendations for different investment capabilities. In Soil Testing for Balanced Fertilisation – Technology, Application, Problem Solutions (H.L.S. Tandon ed.), pp. 49-67
Dey, P. and Srivastava, S. (2013). Site specific nutrient management with STCR approach. In Kundu et al. (Eds): IISS Contribution in Frontier Areas of Soil Research, Indian Institute of Soil Science, Bhopal, 259-270.
Majumdar, Kaushik, Dey, P. and Tewatia, R.K. 2014. Current nutrient management approaches: Issues and Strategies. Indian J. Fert. 10(5): 14-27.
55
Winter School on “Waste recycling and resource management”-Dec. 3-23, 2014
Methods for efficient recycling of different organic wastes in India and abroad
M.C. Manna
Indian Institute of Soil Science, Nabi Bagh, Berasia Road, Bhopal.
The history of composting dates back to the history of early agriculture. Modern composting got
its start in India where, Sir Albert Howard (1921), a government agronomist, developed the so
called Indore method of composting. His method called for three parts garden clippings to one
part manure or kitchen waste arranged in layers and mixed periodically. Howard published his
ideas in 1940 in the book “An Agricultural Testament”. The first articulate advocate of Howard's
method in the United States was J.I. Rodale (1971). This chapter describes conventional compost
production technologies, vermicomposting, composting of municipal solid wastes (MSW),
mechanical composting and rapid composting in which no external microbial interventions serve
as inputs.
Major Features of and Steps in the Composting Process
The distinguishing features of composting are: (a) It is a truly batch process and can not be made
even semi-continuous. Once composting has begun in a pile, no fresh substrate should be added to
it as it would only hinder the ongoing process, (b) Mechanical turning of contents at periodic
intervals is essential for composting to be complete and (c) The process accompanies sharp rise in
temperature which is essential to destroy most of the pathogens and seeds of weed plants.
Composting consists of the following steps:
i. Setting up windrows in which the matter (substrate) to be composted is laid out in layers of
about 15 cm thick which are alternated with thinner layers (5 cm) of a microorganism-rich
material such as cow dung.
ii. Providing adequate moisture (60% of the reactant mass) through sprinkling of water over the
windrow, and a passive or active means of aeration.
iii. Covering of the windrow with layers of cohesive clay or open plastic sheets.
iv. This sets the process of composting through aerobic decomposition of the substrate in
motion. The process being exothermic, it gradually lifts the temperature of the pile to 55°C or
higher. Then, as the availability of the substrate in the aerated zones as also oxygen in those
zones declines, further decomposition is reduced and the temperature begins to fall. In forced
air composting systems, the aeration is shut off once the temperature goes beyond 55°C and,
56

Winter School on “Waste recycling and resource management”-Dec. 3-23, 2014
instead, a blower is used to push off hot gases so that the pile temperature does not shoot up
so high as to kill most of the microorganisms other than thermophiles. If that is allowed to
happen, the composting would be incomplete and the product will be unsatisfactory.
v. Turning the windrow to rejuvenate the process by bringing in previously un-decomposed or
partially decomposed substrate in contact with microorganisms and air. This is done either manually
with shovels or through turning machines. In forced air composting system, the substrate is not
turned but aeration is restarted once the blower cools the pile to near ambient temperature. In 50-
70 days, depending on the nature of substrate and efficiency of process operation, the peak pile
temperature falls to about 40°C.
vi. Completion of the predominantly microbial decomposition phase, which occurs after the steps ii to
iv have been repeated 3-4 times or more and the pile temperature becomes more or less constant.
vii. The 'curing' phase wherein the compost pile is left undisturbed for 2-4 weeks. This phase
provides the time required for degradation of the more refractory organics and for overcoming
the 'slowing' effects imposed by kinetic rate limitations
viii. Re-establishing of microbial populations at lower temperature, which may be beneficial in
'maturing' the compost, metabolizing phytotoxic compounds, and suppressing plant pathogens
because of the pathogens destroyed at higher temperature about 600C during thermophilic stage.
Rural wastes (farmyard waste, household waste, agricultural wastes etc) are composted by any of
the following three methods: (1′ = 30 cm)
Pit method (15′x 6′ x 6′: L x W x H),
Trench method (15′x 6′x 3′: L x W x H)
Heap method (30′ x 6′ x 3′: L x W x H).
The size of the pits depends upon the material availability. The compost is usually ready
in about 6-7 months after 2-3 turnings at 15 days intervals. There are various methods,
traditional as well as modern, manual as well as mechanical which are scientifically designed
and tested for good quality compost production. Some methods of composting and their salient
features are described below.
Indore Method of Composting
Howard and Wad (1931) developed this method in which following are the major steps and
operations:
57

Winter School on “Waste recycling and resource management”-Dec. 3-23, 2014
• A pit of 9' Long (L) x5' Wide (W) x3' H (high) is prepared (1 ft = 30 cm). This pit is
partitioned into 3 equal parts of which, two parts are filled and third part is left empty
for turning.
• Inputs include dry and green agricultural waste, grasses, etc. soaked with water and
cattle-dung slurry followed by cattle-dung and soil is spread in a 1-2 inches thick
layer.
• Only two parts of the pit is filled layer by layer up to the height of 4 feet, keeping
third part empty for turning. After filling, the tank is sealed with 3" thick layer of soil
covered with cow dung and mud plaster. The process is accelerated by turnings,
whereby aeration, mixing of composting materials and moistening is done. (if
necessary).
This results in almost total decomposition of the matter, yielding brown homogeneous compost
in about three months. The compost resembles the traditional FYM in appearance and properties.
The average nutrient content of compost prepared by this method is 0.8 % N, 0.3-0.5% P2O5 and
1-1.5% K2O.This method of composting however, involves a considerable labour in building up
the heap/pit to proper shape and periodical turnings rendering it impracticable and expensive,
where large quantities of materials have to be processed. A major disadvantage of this process is
the heavy losses of organic matter and nitrogen (40-50 % of the initial).
Bangalore Method of Composting: This method was developed by Acharya and Subramanian
(1939). It is a heat fermentation method for the composting of city garbage and night soil in pit
method. The method is initially aerobic but later anaerobic and attempts at greater conservation
of nutrients as compared to the Indore method. It involves the following steps:
• The city refuse and night soil are spread in alternate layers of 15 cm and 5 cm with a
final layer of refuse on the top. The materials are then covered with a thin layer of
soil. Heaps are prepared as in the Indore method except that each heap is sealed with
a mud plaster which increased the temperature due to anaerobic fermentation.
• The decomposition is mostly anaerobic and comparatively slow. The major
disadvantage is turning. There is a reduction of C/N ratio to less then 20:1
• After four months , the compost may be ready for use, although some workers place a
much longer time frame of 32 weeks (Gaur and Singh, 1950).
58

Winter School on “Waste recycling and resource management”-Dec. 3-23, 2014
NADEP Method of Composting
This method was developed by N.D. Pandharipande after whom it is named and abbreviated as
NADEP. The methods are described below:
NADEP compost is prepared in an aerobic tank made of bricks and cement. The size of the tank
is 12′ x5′ x3′ (L xW xH) (1′ = 30 cm). All the four walls of the tank are provided with 6" vents
by removing every alternate brick after the height of 1 ft. from bottom for aeration. Tank can be
constructed of mud or cement mortar
Before filling, the tank is plastered with dilute cattle dung slurry to facilitate bacterial activity
from all four sides. It is then filled in definite layers consisting of the following sub-layers
Sub-layer 1: 4 to 6" thick layer of fine sticks or stems of pigeonpea/tur/arhar stalks or cotton
stalks. This is provided for the initial layer only to facilitate aeration, followed by 4 to 6" layer of
dry and green biomass (material to be composted).
Sub-layer 2: Approximately 4 kg cattle-dung is mixed with 100 litres of water. This slurry is
sprinkled thoroughly on the agricultural waste to facilitate microbial activity. It is used only as
a bacterial inoculum.
Sub-layer 3: Approximately 60 kg of soil is sprinkled uniformly over the biomass layer.
Addition of soil serves three purpose (i) retention of moisture (ii) soil micro-flora helps in
biodegradation and (iii) it acts as buffer and controls pH of the medium during decomposition.
As the tank height is approximately 3′ of 10-12 layers (sub layers 1-3 in each layer) can
be accomodated in a tank. After filling the tank, biomass is covered with 3" thick layer of soil
and sealed with cattle-dung and mud plaster. After 15-30 days of filling, the organic biomass in
the tank gets automatically reduced to 2 ft. At this time, without disturbing the initial sealing
layer, tank is refilled by giving 2-3 similar layers over it and is resealed. After this filling, the
tank is not disturbed for 3 months, except that it is moistened every 6-15 days according to the
weather conditions. From each tank, approximately 2.5 tonnes of compost is prepared within
3-4 months.
59

Winter School on “Waste recycling and resource management”-Dec. 3-23, 2014
ADCO process: Hutchinson and Richards (1921) have developed this process in Agricultural
Development Company (ADCO).
The size of the pits used is 15′ x 6′ x 6′ (L x W x H): In this process, nitrogen fertilizers such
as ammonium sulphate or urea are utilized for the decomposition of carbonaceous (wide C: N
ratio) materials. This reduces the C:N ratio to about 30-40:1 and then is allowed to
decompose for 5-6 months in the pit. Super phosphate may be added to fortify the
concentration of the manure. 2-3 turnings are required in this process. After six months, the
compost is ready use.
Modified Indore process (USA): In USA, all refinements and changes in the original Indore
process were summarized (Wiley, 1967 and Poincelot and Day, 1973). Main features of the
modified process are:
• On a leveled and well drained site, a typical pit is built which is about 7′ or more in
length. 7′ wide at the base and 5′ high. A container is built around the pile to cover it
and protect it from the wind, which tends to dry the pile from outside.
• Piling is often started with an 8 inches layer of carbonaceous wastes such as leaves,
hay, straw, sawdust, woodchips, waste newspaper having wider C:N ratio followed
by 4 inches of N-rich materials such as fresh grass, weeds or garden plant residues,
fresh or dry FYM and sewage sludge. The different layers of carbonaceous materials
are required for efficient decomposition of the piles
• Proper aeration should be facilitated for rapid decomposition and quick development
of high temperature.
• Compost will be ready after 3 months, if the pile is started in the spring or summer. .
Windrow method: In Connecticut, USA, the most successful municipal composting has been
done with leaf windrows method (Randazzo 1970, Rodale 1971).
Pile of any convenient length, about 8-12′ wide and 4 – 8′ high is required. If the pile is too
high, it will become compact and reduce pore space. A height of 8′ is optimal for heat
retention. Compressed pile requires increased turnings to combat anaerobic conditions for
raising the temperature. Studies at University of California, Berkley (1953) showed that this
method was satisfactory for composting of city fresh garbage in 4 months.
60

Winter School on “Waste recycling and resource management”-Dec. 3-23, 2014
Beccari process: This process is presently used in Italy, France and USA. Rodale and staff
(1971) improved this method with a chimney for continuous loading. In this device, one air valve
is fixed on the top and unloads from the front. Initially the material is digested anaerobically at
65º C and the process becomes partially aerobic after about 18 days. Compost can be prepared
within 35 to 40 days.
Vuil-Afvoer-Maatschappij process: This process has been used for some times in the
Netherlands. Refuse is delivered by rail for final product from composting municipal wastes,
takes 3 to 5 months. The decomposed materials can be shredded and then screened to remove
stone and debris before use.
Chinese high temperature stack: A high temperature system has been developed by this
method in China where a considerable quantity of night soil is returned to agriculture.
This technique involves a number of air channels by using bamboo poles and covering
the outside of the heap with a thin layer of soil. The length, height and width of the heap are 18-
21′x 3-5′x6-10′ respectively. After 24 hours the heap is turned up and settles slightly. The
bamboo poles are then carefully with drawn to create aeration passages. When the internal
temperature reaches 60-70ºC (after 4-5 days), the ventilation holes are often blocked. The heap is
usually turned after 14 days to ensure good mixing of the materials. The compost is normally
ready in 8 weeks.
Ecuador on-farm composting: Under this method, the raw materials utilized for compost
making are animal manure, crop residues, weeds, agro-industrial wastes, ash, phosphate rock,
wood cuttings, top soil from the forest or from an uncultivated or sparingly cultivated area and,
freshwater. The raw materials are put in layers in the following sequence in a heap which should
6′ × 3-4′ × 3-4′ (LxWxH).
A layer of crop residues (20 cm) followed by a layer of topsoil (2 cm), followed by a
layer of manure (5-10 cm), followed by a spreading of ash or phosphate rock (50 g/m2) on the
surface, and finally freshwater is sprinkled on the material. These steps are repeated until a
height of 3-4′.
61

Winter School on “Waste recycling and resource management”-Dec. 3-23, 2014
It is recommended to begin the heap by constructing a lattice of old branches, and to
place two or three woodcuttings vertically along the lattice in order to facilitate ventilation. Once
a week water should be added to the heap. However, too much water could lead to the leaching
of nutrients. After three weeks, the heap must be mixed to ensure that all materials reach the
centre. During the process, the temperature rises to 60-70°C, and most weed seeds and pathogens
are killed. It may take 2-3 months to prepare the compost in a warm climate and 5-6 months in
colder regions.
62

Winter School on “Waste recycling and resource management”-Dec. 3-23, 2014
Recycling of farm wastes, municipal solid wastes and forest litter through rapid
composting techniques
M.C. Manna
Indian Institue of Soil Science, Nabi Bagh, Berasia Road, Bhopal-462038
North Dakota State University hot composting: This is some time known as rapid composting
technique. In this method, compost piles with a height of 6 feet (1.8 m) are raised. If bins are
constructed, the dimensions of 5′ x5′ x6′ (Lx Wx H) will yield 150 cubic feet (4.3 cu. m) of
compost. This is a respectable volume of compost to be produced in 4-6 weeks. The maximum
size of the organic matter pieces should be 6-9 inches (15-23 cm) long.. To keep the aerobic
bacterial population high and active, 0.12 kg of an N fertilizer should be added/cubic ft of dry
matter and 4-5 holes punched into the centre of the pile.
This is best done in phases or stages as the compost pile is building up. For example, for 150
cubic feet of dry matter, if the pile is built up in three stages (at 2′, 4′ and 6′, 5.7 kg of a N-
fertilizer should be added at each stage. The total amount of fertilizer for the entire pile should be
about 17-18 kg.
In this high temperature bacterially active system, it is best to turn the composting material
every 3-4 days. Once activated, the temperature ranges between 49-710C. The decomposition is
faster in summer (as short as 3-4 weeks) and takes longer in the spring and fall. Once the
compost is no longer hot and is an odour-free, crumbling material, it is ready for use.
The Berkeley Rapid Composting Method: This method was developed at the University of
California, Berkeley in 1953 and is perhaps the only method which claims to produce quality
compost in two weeks. This method was also called as “Two weeks” method because it required
several turnings on a fairly rigid schedule. This method can be carried out during the spring,
summer or fall. It corrects some of the problems associated with the old type of composting such
as nutrient leaching, survival of weed seeds and insects problem. Main components of this
technology are summarized below:
Compost material and size: Green material used consist of grass clippings, old flowers, green
prunings, weeds, fresh garbage, fruit, and vegetable wastes. Dried material used are dead, fallen
leaves, dried grass, straw and somewhat woody materials from prunings. The harder or the more
63

Winter School on “Waste recycling and resource management”-Dec. 3-23, 2014
woody the tissues, the smaller they need to be divided to decompose rapidly. Desired particle
size of the matter to be composted is 0.5-1.5 inches.
Desired C:N (30:1): Mixing equal volumes of green plant material with equal volumes of
naturally dry plant material will give approximately a 30:1 C:N ratio. If the C/N ratio is less than
30/1, the organic matter will decompose very rapidly but there will be a loss of nitrogen. This
will be given off as ammonia and if this odor is present in or around a composting pile, it means
that valuable nitrogen is being lost in the air. The addition of some sawdust to that part of the pile
where there is an ammonia odor can check this loss. If the N content is low (high C:N ratio), this
can be corrected by adding materials rich in N such as ammonium sulphate, grass clippings,
fresh chicken manure or urine diluted 1: 5.
Desired moisture content in the pile (about 50 %): Too much moisture will make a soggy mass,
and decomposition will be slow and will smell. If the organic material is too dry, decomposition
will be very slow or will not occur at all.
Prevention of heat loss: The respiration of the microorganisms supplies heat, which is very
important in rapid composting, as they break down the organic materials. A pile will heat to high
temperatures within 24 to 48 hours. If it does not, the pile is too wet or too dry or there is not
enough green material (or nitrogen) present. If too wet, the material should be spread out to dry.
If too dry, add moisture. To prevent heat loss and to build up the amount of heat necessary, a
minimum volume of material is essential. A pile of at least 36" x 36" x 36" is recommended. If
less than 32", the rapid process will not occur. Heat retention is better in bins than in open piles,
so rapid composting is more effective if bins are used. High temperatures favor the
microorganisms which are the most rapid decomposers; these microorganisms function at about
71 °C.
Frequent turning to prevent over heating: By turning, the pile will not overheat and it will also
be aerated. Both are necessary to keep the most active decomposers functioning. The pile should
be turned so that material which is on the outside is moved to the center. In this way, all the
material will reach optimum temperatures at various times. After the compost is turned, the
plastic is placed directly on the top of the compost and is tucked in around the edges. Bins with
covers retain the heat better than do those having no covers. Once the decomposition process
starts, the pile becomes smaller and because the bin is no longer full, some heat will be lost at the
top. This can be prevented by using a piece of polyethylene/plastic slightly larger than the top
64
Winter School on “Waste recycling and resource management”-Dec. 3-23, 2014
area of the bins. If the temperature it gets much above 160°F (71oC), the microorganisms are
killed and the pile will cool. Thus, thermophilic organisms are required as bioinoculum for
faster decomposition.
Indication of rapid decomposition: If the material in the pile is turned every day, it will take 2
weeks or a little longer to compost. If turned every other day, it will take about 3 weeks. The
longer the interval between turnings, the longer it will take for the composting to finish. It takes a
certain length of time for the material to break down and anything added has to start at the
beginning, thus lengthening the decomposition time for the whole pile. Therefore, once a pile is
started, do not add anything.
Satisfactory rapid decomposition is indicated by a pleasant odor, by the change in color of
the materials to dark brown, by the heat produced (this is even visible in the form of water vapor
given off during turning of the pile), by the growth of white fungi on the decomposing organic
material, and by a reduction of volume. As composting nears completion the temperature drops
and, finally, little or no heat is produced. The compost is then ready to use. If in the preparation
of the compost, the material was not chopped in small pieces, screening the material through 1-
inch-mesh chicken wire will separate such pieces.
Curing of the Compost Before Use
This section is common to most of the conventional composting methods, hence given in a
separate box here. Before the compost is sent out for field use, the compost pile is left
undisturbed for 2-4 weeks. This is the curing phase which provides the time required for
degradation of the more refractory organics and for overcoming the 'slowing' effects imposed by
kinetic rate limitations. Curing is a very important stage in composting process as a variety of
microbes operate during this stage and are involved in degradation of complex polymers such
as cellulose, lignin and hemicelluloses etc. The microbial population at this stage varies from
108-109 cells/g material with bacteria representing 80% of the population. Most of the
population is involved in proteolytic, ammonifying, amylolytic and aerobic cellulolytic
capacities. Free living N-fixers (Azotobacter spp.), denitrifiers (Pseudomnas spp., Thiobacillus
spp) , sulphate reducers (Desulphovibio spp. etc) and sulphur-oxidizers ( Chromatium spp,
Thiothrix spp. etc.) are important constituents of the microbial population in the compost.
65

Winter School on “Waste recycling and resource management”-Dec. 3-23, 2014
Recycling of Farm and Municipal Solid Wastes through Vermicomposting Technique
A.B. Singh Indian Institute of Soil Science, Nabi Bagh, Berasia Road, Bhopal-462038
Management of solid wastes has become one of the biggest problems we are facing
today. The rapid increase in the volume of waste is one aspect of the environmental crisis, accompanying recent global development (Rapid urbanization, encroachment of fertile area and booming population is leading to generation of massive amount of waste). Solid waste is defined as the organic and inorganic waste materials produced by different sources and have lost value in the eye of their owner. It has been estimated that India as a whole, generates as much as 25 million tonnes of urban solid waste of diverse composition per year. But per capita waste production in India is minisculous compared the per capita production of wates in the industrialized countries. It is estimated that the per capita waste generated in India is about 0.4 kg/day with the compostable matter approximately 50-60 %. The recycling of crop residues and organic wastes through composting methods is the key technology for disposal and production of organic manures and minimization of environmental pollution. A technology for recycling of organic wastes by earthworms was developed. Addition of earthworms accelerates the breakdown of organic wastes by providing the right environment for the organisms in the compost pile and it is possible to produced excellent compost in the shortest possible time within 3 to 3.5 months. Vermicomposting is essentially an environment friendly technology generating wealth from waste.
Availability of organic wastes
Crop residue can be an important source of nutrients to subsequent crops. It is well documented that different quantities of N, P, K and other nutrients are removed from and return to the soil depending on crop species involved. The quantity and quality of crop residues incorporation will greatly influence the build-up of the soil organic matter. Cereals straw contains only around 35 kg N/ha compared to more than 150 kg N/ha for some vegetable crop residue. Incorporation of N rich, low C: N ratio residues leads to rapid mineralization and a large rise in soil mineral N, while residues low in N such as cereal straw can lead to net immobilization of N in the short to medium term. The latter can be advantageous in preventing N leaching from soil between crops. The inclusion of crops with a diverse range of C: N ratios can help to conserve N within the system (Watson et al, 2002).
On the basis of crop production levels, it is estimated that ten major crops (rice, wheat, sorghum, pearl millet, barley, finger millet, sugarcane, potato tubers and pulses) of India generate about 312.5 Mt of crop residues that have nutrient potential of about 6.5 million tonnes of NPK. It has been estimated that all animal excreta can potentially supply 17.77 million tonnes of plant nutrients. According to a conservative estimate around 600 to 700 million tonnes of agricultural waste is available in the country every year, but most of it is not used properly. India produces about 1800 million tonnes of animal dung per annum. Even if two-third of the dung is used for biogas generation, it is expected to yield biogas not less than 120 m m3 per day. In addition the manure
66

Winter School on “Waste recycling and resource management”-Dec. 3-23, 2014
produced would be about 440 mt per year, which is equivalent to 2.90 m t N, 2.75 m t P2O5 and 1.89 m t K2O ( Ramaswami, 1999).
Annually, most of the metropolitan cities of India are generating about 150 million tonnes of city refuse that has nutrient potential of about 1.72 million tonnes of N, P and K. It was estimated that about 57 million tonnes of city wastes is being generated every year from different cities of India that is expected to increase to 104 million tonnes per year by 2025. The chemical analysis of municipal solid wastes that showed that the N, P2O5 and K2O content is about 2.85 lakhs tonnes that would be about 5.4 lakh tonnes by 2025.
Vermicomposting
Vermicomposting is a method of composting with worms and differs from conventional composting in several ways. In vermicomposting, there is a saving of nearly two months in composting time compared to conventional compost. Vermicompost is rich in nutrients, microbial activity and enzymes. Vermicompost can be prepared in different ways:
Vermicomposting in pit or heap method
For production of vermicompost, open permanent pits of 10 feet length X 3 feet width X 2 feet deep were constructed under the tree shade, which was about 1 feet above ground to avoid entry of rainwater into the pits. Brick walls were constructed above the pit floor and perforated into 10 cm diameter 5-6 holes in the pit wall for aeration. The holes in the wall are blocked with nylon screen (100 meshes) so that earthworms may not escape from the pits. Partially decomposed dung was spread on the bottom of the pits to a thickness of about 3-4 cm. Two species of epigeic earthworm viz., Eisenia foetida and Perionyx excavatus were inoculated in the pit. Moisture content was maintained at 60-70% through- out the decomposition period. Jute bags (gunny bags) were spread uniformly on the surface of the materials to facilitate maintenance of suitable moisture regime and temperature conditions. Earthworms were inoculated in the pit or heap with 10 adult earthworm per kg of waste material to each pit or heap. The materials were allowed to decompose for 110 days. The forest litter was decomposed much earlier (75 to 85 days) than farm residue (110 + 10 days).
P- Enriched Vermicompost
In India, about 260 million tonnes of rock phosphate deposits have been estimated at present. Low-grade rock phosphate is used as direct source of P for crop production, especially in acid soil and long-duration plantation crops only. However, there is very little experimental work available on the effect of mixing rock phosphate with different qualities of organic sources and their application in neutral or alkaline soils. For production of P enriched vermicompost, earth worms species viz., Eisenia fetida and Perionyx excavatus were inoculated in the pit. Moisture content was maintained at 60-70% through-out the decomposition period. Jhabua rock phosphate (30-32% P2O5) is used @ 2.5 % P2O5 of waste material with the same dimension of pit or heap as mentioned earlier. Jute bags (gunny bags) were spread uniformly on the surface of the materials to facilitate maintenance of suitable moisture regime and temperature conditions. Earthworms were inoculated in the pit or heap with 10 adult earthworms per kg of waste material and a total of 500
67
Winter School on “Waste recycling and resource management”-Dec. 3-23, 2014
worms were added to each pit or heap. Around 110+10 days required for converting the organic wastes in to vermicompost.
Silpaulin Portable Vermi-bed
For production of vermicompost, silpaulin portable vemi-bed of 12 feet length X 4 feet width X 2 feet deep were kept under the tree shade, which was about ½ feet above ground to avoid entry of rainwater into the beds. In portable vermi-bed, partially decompose organic wastes was added crop residues and dung in the ratio of 1:1 (w/w). Two species of earthworms viz., Eisenia foetida and Perionyx excavatus were inoculated in the bed. Moisture content was maintained at 60-70% through- out the decomposition period. Jute bags (gunny bags) were spread uniformly on the surface of the materials to facilitate maintenance of suitable moisture regime and temperature conditions.
Preparation of vermicompost under tree shade:
Open permanent pits of 10 feet length X 3 feet width X 2 feet deep were constructed under the tree shade, which was about 2 feet above ground to avoid entry of rainwater into the pits. Brick walls were constructed above the pit floor and perforated into 10 cm diameter 5-6 holes in the pit wall for aeration. The holes in the wall were blocked with nylon screen (100 meshes) so that earthworms may not escape from the pits. Partially decomposed dung (dung about 2 months old) was spread on the bottom of the pits to a thickness of about 3-4 cm. This was followed by addition of layer of litter/residue and dung in the ratio of 1:1 (w/w). A second layer of dung was then applied followed by another layer of litter/crop residue in the same ratio up to a height of 2 feet. Two species of epigeic earthworm viz., Eisenia fetida and Perionyx excavatus were inoculated in the pit. Moisture content was maintained at 60-70% through-out the decomposition period. Jute bags (gunny bags) were spread uniformly on the surface of the materials to facilitate maintenance of suitable moisture regime and temperature conditions. Watering by sprinkler was often done. The materials was allowed to decompose for 15-20 days to stabilize the temperature because to reach the mesophilic stage, the process has to pass the thermophilic stage, which comes in about 3 weeks. Earthworms were inoculated in the pit or heap. One kg worms were added to each pit or heap. The materials were allowed to decompose for 110 days. The forest litter was decomposed much earlier (75 to 85 days) than farm residue (110 + 5 days).
Vermiwash:
Advances in vermiculture technology have recently led to novel products like vermiwash. This product has now not only caught the attention of commercial vermiculturists but also the farmers. Farmers in their own way have started collecting vermiwash for foliar application. For preparation of vermiwash, one-kilogram adult earthworms devoid of casts (approximately numbering 1000-1200 worms) is released into a trough containing 500 ml of lukewarm distilled water (37oC-40oC) and agitated for two minutes. Earthworms are then taken out and again washed in another 500 ml at room temperature (+ 30oC) and released back into the tanks. The agitation in lukewarm water makes the earthworms to release sufficient quantities of mucus and body fluids. Transferring into
68

Winter School on “Waste recycling and resource management”-Dec. 3-23, 2014
ordinary water is to wash the mucus sticking still on to their body surface and this also helps the earthworms to revive from the shock
Vermicast:
The food material after passing through the alimentary canal of the earthworms, emerges as compact concentrated mass termed as “Vermicasting”. The earthworms casts contain more microorganisms, organic matter and inorganic minerals in a form that can be used by plants. Vermicasts are rich in vitamins, antibiotics and enzymes. These enzymes continue disintegration of organic matter after excretion from the worms as casts.
Vermiculture:
The following steps may be taken care during the production of earthworms.
Location and size of pit:
Generally pits or heaps are located under the tree shadow or at the vicinity of the cattle shed where there is shadow with favourable ambient temperature.
A source of water should exist near the pit.
All the pits or heaps should be under the shade and also above the ground to avoid the entry of rainfall and also to prevent from extreme temperatures.
The pits are of two types. One Cemented or wooden bin of the size 4x2x2 ft.
The second type is pit of the same dimension with brick or stone lining at the bottom.
Avoid excess moisture and extreme temperature that is likely to cause the mortality of the worms.
The size and dimension of pit is very important from the point of view of the tremendous rate of multiplication of worms.
It has been experienced that 1 kg worm can multiply as much as 2-3 kg within a period of 3-4 months.
Epigeic earthworms: Earthworms of this group cannot make burrows in the soil. They can only move through the crevices of the surface. They are found in aggregates in litter heaps or in loose soil with high level of nitrogen. They feed exclusively on decomposing organic wastes. They remain active throughout the year if conditions are favourable in the environment. Eudrillus euginea and Eisenia fetida are being used as prominent composting earthworms, two more species namely; Perionyx excavatus and Perionyx sansibaricus are also used for the purpose.
Endogeic earthworms: They are subsoil dwellers. They make horizontal burrows than vertical. These burrows are not permanent and thus are disturbed easily during rains. Secretions of body wall of earthworms cement and smoothen the walls of burrows and protect the wall from collapsing easily. They move below 30 cm or more in the soil.
69

Winter School on “Waste recycling and resource management”-Dec. 3-23, 2014
Anecic earthworms: They are found in soil, which is not frequently disturbed. They make very complicated burrows in the soil and they firmly pack their burrow walls with their castings. When this feed material gets softened in the burrow by microbial activity, they fed on it. The anecic earthworms like epigeic earthworms are commonly found in temperate countries. In the tropics they are found disturbed in forest and plantation. These are very large in size. They have very slow growth rate and long life cycles. They come out from the burrows and drag the ground cover litter into their burrows. They move within 30 cm depth from the surface.
Feeding materials:
Feeding materials for Earthworms are reared using partially decomposed organic matter viz., partially decomposed cattle dung, vegetable wastes, soft plant leaves etc. The worms are likely to die if fresh organic materials are used in the culture pit due to the liberation of organic acids. Worms also like to grow and multiply in the jute material. Jute gunny material is used as wall lining, bottom lining and cover of the pit from upper surface.
Addition of worms in the pit:
The earthworms directly or cocoons are inoculated in the pit in layers. They are spread over by hand in the small channels made by hand on the surface of food materials, that is, partially decomposed organic matter. The channels are covered by hand. Another layer of organic matter is added and so on. There are alternate layers of organic matter and cocoon worms in the pit. Moisture and temperature should be maintained between 50-60% and 28-32oC, respectively.
Precaution during vermiculture:
Some of the important point may be taken-care during worm production. Maintenance of moisture at 50-60% level in the pit, temperature between 25-28oC, base material (FYM) should be partially decomposed organic matter and proper aeration should be provided without disturbing the worms.
Advantages of vermicompost:
Productive utilization of organic wastes materials such as agricultural waste, animal droppings, forests litter and agro-based-industrial wastes for production of vermicompost.
Vermicompost is store house of plant nutrients.
Improve physical, chemical and biological properties of soils and better crop productivity. The beneficial role played by earthworms in improving the soil fertility, soil structure and organic matter decomposition is well established.
Earthworms effectively harness the beneficial soil micro flora, destroy soil pathogens and converts organic wastes into vitamins, enzymes, antibiotics, growth hormones, protein rich products and other organic compounds.
Earthworms are an important link in the natural food chain. In addition to their role in soil processes, they can accumulate and transfer beneficial and potentially hazardous materials.
70
Winter School on “Waste recycling and resource management”-Dec. 3-23, 2014
Vermicompost is becoming important alternative to conventional compost and FYM sources for organic farming due to shortage in supply of dung.
References:
Agricultural Statistics at a Glance (2004). Agricultural Statistics Division, Directorate of Economics R Statistics, Dept. of Agriculture, Govt. of India p 1-221.
Manna M C and Ganguly T K (1998). Recycling of organic wastes: Its potential turnover and maintenance in soil- A review. Agric.Review 19 (2): 86-104.
Ramaswami, P.P (1999). Recycling of agricultural and agro-industry wastes for sustainable agricultural production. Journal of Indian Society of Soil Science, 47:661-
665.
Singh, AB, Manna, MC, Ganguly, TK and Tripathi AK (2005). Vermicomposting: A technology for recycling of organic wastes. Bulletin No 1/2005.pp 1-13.
Tandon H L S (1997). Fertilizers, organic manures, recycling wastes and bio- fertilizers. Fertilizer Development and consultation Organization, New Delhi
Tripathi SB, Yadav RB and Pathak PS (2003). Nutrient Mining in Bundelkhand Agro- climate zone of Uttar Pradesh. Fertilizer News Vol. 48(II), pp 33-50.
Watson C.A, D. Atkinson, P Gosling, LR Jackson and F. W. Rayns (2002). Managing soil fertility in organic farming systems. Soil use and Management, 18: 239-247.
71

Winter School on “Waste recycling and resource management”-Dec. 3-23, 2014
Soil Organic Matter: Decomposition Process and Stabilization mechanism Pramod Jha
Indian Institute of Soil Science, Nabi Bagh, Berasia Road, Bhopal-462038 Carbon (C) stabilization in soil is a critical process influencing global C cycle. The amount of soil C storage is controlled primarily by two fundamental factors: input by net primary production (its quantity and quality) and its decomposition rate. Decomposition of native organic matter in soil is mainly governed by soil microbes, with about 10-15% of the energy of organic C utilized by soil animals (Wolters, 2000). Evolution of CO2 during decomposition of organic matter is chiefly regulated by soil moisture and temperature. Under the temperate environment, it is governed mostly by soil temperature whereas under the tropical environment it is affected more by soil moisture availability. Sollins et al., (1996) presented a conceptual model of the processes by which plant leaf and root litter is transformed to soil organic C and CO2. Stability of the organic C in soil is the result of three general sets of characteristics. Recalcitrance comprises molecular-level characteristics of organic substances, including elemental composition, presence of functional groups, and molecular arrangement, that influence their degradation by microbes and enzymes. Interactions refers to the inter-molecular interactions between organics and either inorganic substances or other organic substances that alter the rate of degradation of those organics or synthesis of new organics. Accessibility refers to the location of organic substances with respect to microbes and enzymes.
Depending upon how soil is managed, it can serve as a source or sink for atmospheric carbon dioxide (CO2). As the atmospheric CO2 concentration continues to increase globally, more attention is being focused on the soil as a possible sink for atmospheric CO2. Most SOC models assume a linear increase in C content with C input; suggesting that C sequestration can continue regardless of the amount of organic carbon already contained in each SOC pools. In contrast, many long term experiments soil rich in C have not shown any further increase in SOC following an enhanced C input. These findings suggest existence of soil carbon saturation limit. The difference between a soil’s theoretical saturation level and the current carbon content of the soil is defined as saturation deficit (Stewart et al., 2007). The proportion of carbon stabilized would be greater in samples with larger carbon saturation deficits and the relative stabilization efficiency would decrease as carbon input level increased. Further a soil from saturation level, the greater the soil carbon storage potential. Therefore, it is not very well known if and how quickly newly incorporated C is stabilized by different mechanisms. For soils to act as a sink, however, organic C needs to be stabilized in stable pools (Paustian et al., 1997).
72

Winter School on “Waste recycling and resource management”-Dec. 3-23, 2014
Effect of long-term fertilization and manuring on soil carbon stability Long-term adoption of an integrated approach (NPK+FYM) resulted in an increase in carbon content of the resistant pool (Cr) in all the sites. As the organic carbon content of soils increased more under the treatment of NPK, NPK+FYM and FYM alone, the absolute amount of carbon also increased in the resistant and acid-hydrolyzable pools. TOC in the resistant and acid-hydrolyzable pool ranged from 26-66 and 34-74% across different sites of LTFE, respectively. In Jabalpur (Vertisol), a significant difference in carbon content of the resistant pool was recorded among the treatments of control, NPK and NPK+FYM. However, these treatments did not significantly affect the carbon content of the slow pool of TOC. In Vertisol (Jabalpur) of central India, the carbon content of the resistant pool of SOC was always higher than the carbon in the acid-hydrolyzable pools (active (Ca) + slow (Cs)). The proportion of carbon in the stable pool was 52, 65 and 66% under the treatments of control, NPK and NPK+FYM. In Palampur and Ranchi, long-term fertilization and integrated approach had a variable effect of soil carbon stability. Fraction of TOC in the resistant and acid-hydrolyzable pool under the treatments of control, NPK and NPK+FYM was 48, 41, 52 and 35, 26, 42%, respectively at Ranchi (Alfisol) and Palampur (Alfisol). Here, NPK did not significantly affect the carbon content of the resistant pool of TOC in comparison to control. In contrast, it significantly affected the carbon content of the slow pool of TOC. Here, the application of FYM along with NPK did not significantly affect the carbon content of the slow pool of TOC. However, it significantly affected the carbon content of the resistant pool of TOC. In PMT of Ranchi, soil carbon in the resistant pool surpassed carbon content in the acid-hydrolyzable pool under the treatment of FYM alone (54 years). The MRT of the active and slow carbon pool ranged from 4-19 days and 2-36 years under
73

Winter School on “Waste recycling and resource management”-Dec. 3-23, 2014
different treatments at LTFE sites (derived from the decay constant of carbon pools). The MRT of the slow carbon pool was the lowest in Vertisol of Jabalpur. There was no significant difference in MRT of the slow carbon pool among the treatments on the Jabalpur (Vertisol) site. A similar trend was observed at the Palampur (Alfisol) site here MRT ranged from 5-8 years. At Ranchi (Alfisol) under LTFE, MRT of the slow carbon pool under the treatment of control was significantly higher (11 years) than the NPK (3 years) and NPK+FYM treatments (5 years).
Table 1 depicts the percent contribution of increased carbon content of soil due to chemical fertilization (NPK) and integrated approach (NPK+FYM) towards different carbon pools. In Vertisol of Jabalpur, there was 60% depletion in carbon content of the slow pool of TOC over the control of the treatment of chemical fertilization (NPK). There was an increment of 1.61 times in carbon content of the resistant pool under the treatment of chemical fertilization (NPK) as compared to the control. When FYM was applied along with NPK, there was no change in carbon content of the slow pool in comparison to control. Integrated approach (NPK+FYM) accrued majority of carbon towards the resistant pool in Vertisol (Jabalpur). Integrated approach further increased carbon content of the active, slow and the resistant pool to the magnitude of 8, 23 and 69%, respectively in comparison to NPK treatment. In case of Alfisols (Palampur and Ranchi), long-term application of chemical fertilizer contributing more towards enhancement of carbon in a slow pool as compared to control. In these sites, long-term chemical fertilization did not influence the carbon content of the resistant pool of TOC as compared to control. Further application of FYM (integrated approach) contributing more towards (54-60%) the carbon content of the resistant pool in comparison to control despite the contribution towards the slow carbon pool was reduced. Here also, application of NPK+FYM resulted in a buildup of carbon in the resistant pool in comparison to NPK alone. In PMT at Ranchi, long-term application of FYM increased carbon content by 92% in the resistant pool of TOC over NPK. Table 1. Per cent contribiution of increased soil organic carbon towards carbon pools at different
LTFE sites
Locations % change over control % change due to FYM over NPK
Ca Cs Cr Ca Cs Cr
Jabalpur (Vertisol)
NPK -7 -18 41
NPK+FYM 86 0 87 99 22 33
Palampur (Alfisol)
NPK 157 31 3
NPK+FYM 179 41 71 9 8 66
Ranchi LTFE (Alfisol)
NPK -43 52 -4
74
Winter School on “Waste recycling and resource management”-Dec. 3-23, 2014
NPK+FYM 14 46 95 99 -4 103
Ranchi (PMT) (Alfisol)
NPK - - -
FYM - - - 1 7 92
Soil carbon stability influences recovery of Walkley and Black Carbon Measurement of soil organic carbon is the substitution of measurement of soil organic matter due to the ease associated with determination of soil organic carbon. Different procedures are available for the determination of soil organic C. In the past few decades, a range of analytical techniques have been used to measure soil organic carbon. All these techniques showed differential recovery percentage of TOC. Amongst all, Walkley-Black method is the most common, rapid and most widely used procedure, which requires minimum equipment, compared with other wet or dry combustion methods. The Walkley-Black method, however, gives variable recovery of soil organic C. A general standard conversion factor of 1.32 for incomplete oxidation of organic carbon is commonly used to convert Walkley-Black carbon to the total organic-C content, although true factors vary greatly between and within soils because of differences in the nature of organic matter with soil depth and vegetation type. Table 2 shows the WBC recovery percentage and conversion factor of WBC to TOC under different soil orders. Under Vertisols of central India (Jabalpur and Bhopal), Walkley-Black method recovery percentage was ranged from 43.6-69.7% of the TOC. The mean value was 56.2%. In case of Alfisols of Palampur and Ranchi, the recovery percentage ranged from 53.37-74.8% of TOC. In case of Inceptisols of Delhi and Mollisols of Pantnagar, the recovery percentage ranged from 46.3-61.0 and 52.2-77.3% of TOC, respectively. In general, the mean recovery percentage was found maximum (67.3%) in Mollisols and the lowest (56.0%) in Inceptisols which was at par with Vertisols. The data revealed that the organic C recovery percentage with the Walkley-Black method was lower than the assumed percentage (76%). As the organic C recovery was lower than the assumed recovery with the Walkley-Black method, the correction factor of 1.32 would underestimate the organic C contents of Indian soils. Similarly, the conversion factor of WBC to TOC ranged from 1.34 to 2.30 under different soil orders. It is interesting to note that no definite relationship was observed between WBC and TOC in any of the soil orders. Extensive literature is available on WBC recovery, that too the reports are conflicting in nature. Like in our study, some authors came up with no correlation between WBC recovery and land use, texture and concluded that universal corrections for WBC to TOC could be an unrealistic expectation. In our case, the recovery appears to be less than the standard value of 76% and additionally it depends upon absolute value of WBC content, texture and MAR. Lettens et al (2007) observed different correction factors for different soil depths and vegetation types and they attributed this variation to land use, texture and soil depth. The amount of carbon in different pools (active, slow and resistant) determines the recovery percentage of WBC. Higher the amount of carbon in stabilized pool lesser will be chance of WBC recovery. It is also important to note that within the same soil type and climate, as the WBC content of soil increased the correction factor of WBC to TOC decreased. The reduction in percentage of recovery of WBC with lower content can be attributed to changes in organic matter composition.
75

Winter School on “Waste recycling and resource management”-Dec. 3-23, 2014
It suggests that if the soil carbon content is at the minimum threshold value, the Walkley-Black procedure will recover only a small fraction of TOC and majority of carbon left over were probably in resistant pool. As the soil carbon content increased, the size of active and slow pool also increases, which affects the recovery efficiency of Walkley-Black carbon. Kamara et al
(2007) reported correction factors for samples collected from Ultisol between 1.10 to 1.33 and averaged 1.2. Such lower correction factor would probably be due to high WBC content of those soils, which were at higher level of C saturation. The degradation of organic matter in the environment is a continuous process that gradually and selectively modifies the chemical character of soils. As decomposition proceeds, less reactive structures become more dominant in soil organic matter. Baker reported that Walkley-Black recovery of starches, hemicelluloses and celluloses (non lignified matter) is almost 100% and therefore the lignin and lignin like materials must account for the average recovery of 76%. Another factor which affects WBC is the silt+clay content of soil. We observed that as the amount of silt+clay content increased the conversion factor of WBC to TOC also increased. Soil organic matter can be stabilized against decomposition by association with minerals, by its inherent recalcitrance and by occlusion in aggregates. It suggests that protective capacity of soil increases as the finer fractions of soil separates increas. Six et al (2002) proposed a whole-soil C saturation limit with respect to soil C input levels at steady-state comprised of silt+clay protected, physically protected and bio-chemically protected carbon pools, including a non-protected C pool. According to Hassink and Whitemore (1997) the capacity of soil to protect C was primarily based on the silt+clay protective capacity and TOC accumulation in excess of the silt+clay protective capacity would be subject to higher rates of decomposition.
Table 2. Summary of data used for development and validation of relationship (model) between TOC and WBC.
TOC (%) WBC (%) WBC recovery (%)
Conversion factor
of WBC to TOC Jabalapur and Bhopal (Vertisols)
Minimum 1.06 0.57 43.63 1.44 Maximum 2.00 1.40 69.65 2.29 Mean 1.40 0.79 56.22 1.80 Palampur and Ranchi (Alfisols)
Minimum 0.66 0.39 53.37 1.34 Maximum 2.85 2.13 74.79 1.87 Mean 1.36 0.90 64.10 1.57 Delhi (Inceptisols) Minimum 0.55 0.30 46.28 1.53 Maximum 0.94 0.57 60.97 1.96 Mean 0.76 0.42 55.93 1.79 Pantnagar (Mollisols)
76

Winter School on “Waste recycling and resource management”-Dec. 3-23, 2014
Minimum 1.42 0.90 52.15 1.29 Maximum 2.18 1.46 77.26 1.92 Mean 1.70 1.15 67.73 1.48 n=160
TOC-Total soil organic carbon, WBC-Walkley-Black carbon (uncorrected), SICL-Silt+Clay, MAR-Mean annual rainfall, STDEV- Standard deviation, n-no of samples,
We developed relationship between WBC and TOC by taking into account of silt+clay content (SICL) of soil and mean annual rainfall (MAR) of the region (Adj. R2= 0.99, n=100). We clearly demonstrated that a universal correction factor for WBC to TOC is an unrealistic proposition and could lead to error in TOC determination. The present study gives an easy approach to measure TOC by easily available data sets (WBC, SICL and MAR) thereby eliminating the use of sophisticated instrument like TOC/CHNS analyzer. Furthermore, using this relationship, computation of soil carbon stock that was done earlier with WBC values could be revisited and improved for climate change and carbon sequestration related studies. A linear relationship between WBC and TOC was found for the complete data set (R2= 0.963, P<0.001).
Predicting carbon in resistant pool by simple measurable soil parameters Simulation accuracy of global bio-geochemical carbon model depends on the initial carbon content of soil and their relative distribution of soil carbon pools. The availability of reliable measurements of total SOC may not be sufficient to properly initialize soil C models. We developed an empirical equation for predicting the amount of carbon in resistant (acid un-hydrolysable) and mineralizable carbon (acid hydrolysable) pools by using the soil samples collected from different agro-ecological regions of the country. We determined total organic carbon, acid non-hydrolyzable carbon (resistant carbon pool) and silt and clay content of soil for developing this relationship. We observed that the amount of carbon in resistant pool was the function of silt and clay content of soil. We used separate dataset for model development and model validation. The following empirical equation was developed for determining the amount of carbon in resistant pool. Subtracting the amount of carbon in resistant pool from total organic carbon would give the amount of carbon in mineralisable pool (active + slow pool). Log10(Cr) = 1.27274*log10(TOC %)+0.50439*log10*(Silt+Clay content%)-1.13814 (Adj. R2=
0.945, p=0.001) Here, Cr is carbon in resistant pool and TOC is total organic carbon content of soil. The model was validated by using the samples other than that were used for development of model ()
Soil carbon stability determines carbon sequestration rate The long term experiments conducted at several locations of country suggests that soil carbon sequestration rate varies as the climate, soil and net primary productivity changes. We observed that soil carbon sequestration rate is governed by the principle of soil carbon saturation theory, which suggests soil carbon sequestration rate decreases as the soil carbon content increases and
77

Winter School on “Waste recycling and resource management”-Dec. 3-23, 2014
vice-versa. Most of the existing soil carbon models are complex and require large number of parameters for both the rate constants and the proportions of plant and organic carbon allocated into each of the compartments. The fact that these parameters are often unavailable makes it necessary to estimate their values. As a result, considerable knowledge and training is required for the successful application of these models. We developed a relationship which determines the relative allocation of carbon in different pools. We clearly demonstrated that soil carbon sequestration rate is the function of soil carbon content, net primary productivity, soil texture and soil function. Furthermore, the amount of carbon in stable pool has pronounced effect on soil carbon sequestration rate. We have proposed a simplified carbon sequestration framework, based on the experience gained from different long term fertilizer experiments of the country.
78

Winter School on “Waste recycling and resource management”-Dec. 3-23, 2014
Nutrient enriched compost production and its role in improving crop productivity
M.C. Manna
Indian Institute of Soil Science, Nabi Bagh, Berasia Road, Bhopal-462038
The principal requirement of compost for safe and efficient use in crop production is its
degree of stability or maturity which implies decomposed manure with high degree of humification
and so contained less phytotoxic materials and pathogens. A review of the past work conducted
that adequate decomposition is essential for obtaining better quality of organic matter not only by
way of crop production but also to improve soil quality and productivity.
Most of the wastes available with farmers in India are farm residues such as rice, wheat
soybean, mustard, chickpea, mai/c stalk, sorghum stalk, pigeon pea straw etc.. city garbage, and
forest litters which have wide C/N ratios typically from 80 to 110: 1 and low content of macro
nutrients (0.5. 0.2 and 0.4 % of N. P and K, respectively) in particular. In true sense, few of
organics such as bone meal, fish meal, leather meal, guano etc. which content considerable
amount of macronutrients typically more than 5 % (total N, P and K) that may use directly into
agriculture. Keeping in view, the wastes which are not fed to animal or excess in farm, and the
city rubbish are generated daily from all metropolitan cities of India could be improve their
nutritional quality by low cost technique using of chemical amendments. There are no specific
guidelines are available for producers and users in India whereas other countries (USA, Canada
and in Europe) always follow the specific norms of their compost produce quality. Thus, in this
paper we have reviewed various specifications outlined by researchers/producers and users in
India and abroad.
Generally, there are rigid standards for essential quality parameters use for both compost
producers and users that include minimum organic matter content, and nutrients content (NPK).
maximum levels of trace element, maximum levels of man-made inerts (which can be separated out
by usual sorting process), free from human pathogens, odorless, biologically stable and better
plant growth response. A major problem in compost guideline development or the development
79
Winter School on “Waste recycling and resource management”-Dec. 3-23, 2014
of quality standards for compost is the difference in perspective between researchers, compost
producers and compost users. The United States of Composting Council had developed a
comprehensive publication describing procedures for compost sampling, testing, and Test
Methods for the Examination of Composting and Compost.
Biological aspects for accelerate the decomposition of compost
The rate decomposition different residues can be expressed as function of the
concentration of one or more of the substrate being degrades. Recycling of the waste has been
adopted by different methods of decomposition. But for their stability, adequate techniques are
not available. There fore, maturity level of different type of compost as well as predictable
quality such as chemical an microbiological properties of the container media can be divided
into three phases. Namely (i) initial phase, (ii) intermediate phase, and (iii) stabilization phase.
During initial phase (1-2 days) readily biodegradable compounds are decomposed. In
intermediate phase (lasting months) a ihcrmophilic phase is creased and large number of
cellulose is degraded. During stabilization phase the temperature declined. And the rate of
decomposition becomes narrow down. And in mesophilic phase organic recolonize again in the
container media. During aerobic decomposition of the waste microflorai population changes. A
typical pattern of fungi and acid producing bacterial appear during the mesophilic stage. As the
temperature increase above 40°C, these are replaced by thermophilic organisms such as bacteria
(Bacillus, steurolhermophilus), _ acdnomycefes. (Micro-monospuora, Nocardia, Streptomyces,
Termonospora, Thermopolyspora), and fungi (Humicola, Absidia. Chectonium). The mesophilic
organism such as bacteria (Bacillus spp, Celhimoncts folia, Thiobacillus spp, Fseudornonas),
fungi (Aspergillu.s, Fusarium, Tricoderma, Nucor, Ifcltninthosporium) protozoa, nematodes, ants
springtails millipedes an worms are also present at later stage. The mesophilic organic consumes
the most readily decomposable carbohydrates and proteins. The thermophilic organisms initially
decompose the protein and non-cellulose carbohydrate component in compost. These organisms
also attack the lipid, hemi cellulose fractions of the compost.
80

Winter School on “Waste recycling and resource management”-Dec. 3-23, 2014
ASSESMENT OF COMPOST QUALITY PARAMETERS
The stability or maturity of compost prepared from different farm wastes, municipal city
wastes and forest litters are to be assessed through physical, chemical and biological assays,
nutritionally enriched compost evaluation in terms of total and available form of nutrients
content (N and P in particular), minimum content of phytotoxic is thought to be related to heavy
metals and salt contents. The stepwise quick test for approximate of compost product quality are
given below:
SAMPLING
Compost sampling Compost sampling is perhaps the most critical phase of compost analysis. A
compost sample that accurately represents the compost product is essential Best results from
compost testing come from carefully planned sampling/deciding what test are needed and what
laboratories will do the analysis is the first step in designing a sampling plan. If compost is
purchased, tell the supplier what components of compost quality are essential for the intend use.
Mow and when the compost is sampled, to make sure the analysis reflects "as delivered" quality. The
generalized sampling protocol described here under which is applicable to samples collected for all
analyses except for microbiological analyses. A sterile sample collection and preservation technique
is needed for microbiological testing.
Generalized protocol for sampling compost
* Sample size: A bulk composite sample (2.5 kg. moist) is usually needed for a complete
chemical, physical and biological analysis. Other countries are usually followed for 12 kg
moist sample.
* Number of locations Randomly selects six locations alongwith a cross section of a pile. Then
collect 3 samples per location at least a total of 18 sub-samples. Mix the sub-samples
from each sampling location. Further, mix all samples together as a composite sample.
Reduce sample size by repeated mixing, quartering and sub-sampling. Final sample
volume to submit the laboratory = 2.5 kg (moist) per replication. Other countries have
recommended 12-15 kg moist sample from large windrows.
81

Winter School on “Waste recycling and resource management”-Dec. 3-23, 2014
* Sample storing Sample should be arrived with in 24 hours at the laboratory and stored at 4°C.
* Time of sampling: The best time to collect a composite sample is immediate after a pile
has been thoroughly turned or mixed. Because within days or hours after turning a pile
develops gradient in moisture, aeration, biological stability and bacterial populations.
LABORATORY ANALYSIS
Physical properties
(i) Free-flow -The moisture content of decomposed compost will be not more than 20-25
% ( w/w). Because high moisture content is unpleasant to handle and activate the
biological process in a long-run, so that it degrade the quality of compost particularly
the content of C.
(ii) Hulk density- Bulk density of the compost is most important when compost
comprises a large portion of the growing media (e.g. pottin media, bagged media etc.)
As bulk density increased, drainage and air-filled porosity of growing media are
reduced, and water-holding capacity is increased. Bulk density is affected by moisture
content, ash content, particle size distribution and the degree of decomposition. Bulk
density usually increased with composting time, as ash content increases and as
particle size is reduced by decomposition, turning and screening. Most of the
decomposed materials bulk density will be of 500 -700 kg m3 (about 900-12001bs
yd3).
(iii) Water-holding capacity-Water holding capacity is the amount of water hold in pores
after gravitational loss for a specific time. These measurements arc of limited
importance for field compost use.
(iv) Particle size-and man-made inters- Particle size provides a number of critical
indicators for the potential users. Large particles (>12mm screen) prevent efficient
spreading for some field applications). Screening can remove larger compost
particles. Small particles size may also l imit use for applications such as potting
mixes, where rapid drainage is important. Too many fine compost particles are
82

Winter School on “Waste recycling and resource management”-Dec. 3-23, 2014
undesirable in a mulch application, because they can retain enough water to induce
weed seed germination as mentioned by TMCC recommendation. Most researchers of
India recommended the particle size of decomposed organics should be <2mm.
Man-made inert such as glass and plastic wares arc seldom problem derived from
municipal solid wastes. This is highly restricted for nursery and bagged media.
(v) Odorless-The decomposed organics are earthy odor where as undecomposed organics or
partial decomposed organics under anaerobic conditions give ordor problem because of
CH3-S, H2S and other sulfur reducing compounds contents in compost, particularly in
city garbage compost and poultry manure. However, potential odour compounds are
formic acids, acetic acids, ammonia, volatile amines, propionic acids, iso-buteric acids,
indoles, phenols, caproic, iso-caproic compounds etc. produced by the bacterial genera
such as Streptococcus, Lactobacillus, Eubacterium, Lactobacilllus, Escheria,
Clostridium, propionibacterium. Bacteroids and Megasphaera. These organisms unable
to survive at >69°C for 7 days.
(vi) Color- Dark black color or deep brownish-yellow colors is the indicator of decomposed
organics. While straw or light brown color indicates more time frame is required to
decompose the composts. The light color is due to higher content of water soluble carbon
and carbohydrates in the immature materials compared to decomposed one.
(vii) Temperature -The stability of temperature is one of the most important criteria to
evaluate the maturity of compost. This temperature range is around 20-25 'C after
reheated.
Chemical properties
The parameters which could be easily analyzed, cost effective, data reproducible and commonly
using in Indian and worldwide researchers and producers have been reviewed which considered as
an index of maturity. Morle et al. (1979) proposed that Biodegradability index (BI) is the function of
total organic carbon (TOC) and water soluble carbohydrate (SC) with a course of times'.
BI = 3.166 + 0.039 TOC - 0.832 SC - 0.011 day
83

Winter School on “Waste recycling and resource management”-Dec. 3-23, 2014
During the past two decade a significant body of research has been published on composting but
knowledge of maturity of composts and their microbiology study sill is inadequate. We have
summarized hereunder some important chemical properties of matured compost as used most of
producers/researchers.
(i) TOC- The total organic C is generally measured by dry combustion method using 0.1 to
2 g materials (Waggoner 1974). However, some producers using Walkely and Black
(1934) method, which is not give satisfactory results to composting (Table 3). The
carbon content must be 25 to 30 %.
(ii) TIN- Total nitrogen estimation in the decomposed manure help for computation of C/N
ratios (10- <20: 1). The acid-digestion and kjeldhal distillation is suitable and
commonly used for total N in soil as well as compost.
(in) Ash content- The portion of the sample lost in high temperature (550°C) and remaining
after combustion is ash. It is a good indicator of composting provided no-man-made
inert is mixing (such as soil, broken bricks or sand, clay or others) because it reflects on
conversion factor. Thus we, are not mentioning the content of ash for standard compost.
(iv) Cation exchange capacity-CEC determination at pH 7. Is adequate for most composts
(Brink el al. 1960). This value must be >65c mol (p+)/kg of compost.
(v) PH- saturated paste or volume addition methods because large volume of water changes
pH. Usually, pH by volume addition is 0.1 to 0.3 units higher than saturated paste. In
general, it goes >7.5.
(vi) EC- Electrical conductivity estimates soluble salt concentrations. EC determined on
saturated paste extract. Sample is saturated with water, vacuum filtered, and EC of
extract is measured. It should be >3 dSm-1 .
(vii) Water soluble C and carbohydrates- Hot water soluble carbon is most sensitive
indicator of decomposed organics.
84

Winter School on “Waste recycling and resource management”-Dec. 3-23, 2014
(viii) Respiration- Compost respiration is also one of the important indexes of compost
maturity, which could be measured by alkaline trapping. The respiration rate would be
<500 mg CO2/100 TOC/d.
(ix) Mineral-N Mineral N particularly NH4-N and NO3-N of the decomposed materials
should have specific limit. In decomposed manure NH4-N is always lesser than N03-N.
If the materials content < l00ppm NO3-N more additional N fertilizer is required to
enhance the decomposition process. In unstable compost have higher NH4-N, which
decreases during the decomposition process. There is a need for higher aeration to
convert NO3-N to reduce the pH and NH4-N concentration
(x) Short chain acid compounds These compounds can be determined quantitatively with
sophisticated laboratory such as gas or ion chromatography procedures (Brinton, 1998, Liao et
al, 1994). Brinton (1998) reported that mean short chain organic acid concentrations of 4385
mg kg-1 and a range of 75 Io51, 474 mg/kg. Phytotoxic concentrations of acetic acid can be as
low as 300 mg kg-1.
In recent year, Garcia et al. (1992) proposed simple chemical parameters as a threshold value
of maturity of compost, which arc given in Table 4.
Table 1. Maturity index as proposed by Garcia et al. (1992)
----------------------------------------------------------------------------------------------------------
Parameters Optimum value
----------------------------------------------------------------------------------------------------------
1. Total organic carbon/Total nitrogen ratio 10:1-15:1
2. Water soluble carbon <0.5%
3. Water soluble carbohydrates <0.1 %
4. mg of C evolved as(mg CO2/100 TOC/38 d) <500
5. Cation exchange capacity/TOC >3.5:1
6. Biodegradahility index (BI) <2.0
-----------------------------------------------------------------------------------------------------------
85

Winter School on “Waste recycling and resource management”-Dec. 3-23, 2014
Biological assays
The biological assay for compost quality evaluation is very critical when city garbage or
sewage-sludge is being used for composting. Most of the pathogens could not survive under
aerobic decomposition. Though, in Bangalore method, anaerobic decomposition help to
conserve nutrient but rest of the country, mostly, follow aerobic method. In aerobic method this
problem could be avoided. Because in aerobic composting process mesophilic stage had to pass
through thermophilic phase. In thermophilic phase the temperature raise upto 70 to 80°C
where most of the harmful organisms disappeared (1-AO, 1976). However, total Coliforms,
Salmonella sp. and Shigella sp. should be minimum or nil.
Heavy metals limit According to Bureau Standard of India (BSI), the following metals limit
are given (Table 2).
Table 2. Maximum permissible limit of heavy metals
S.No.
Parameters
Concentration not to
be exceed (mg/kg dry
1
As
10
AOAC
method 1988. 1987,
2
Cd
5
3
Cr
50
4
Cu
300
5
Pb
100
6
Hg
0.15
7
Ni
50
8
Zn
1000
Nutrient enrichment techniques for improving quality of composts
In India, researchers have conducted on hastening the period of decomposition and
improved their nutritional quality through enrichment techniques from different crop residues
and city wastes using either through microbial enrichment or phosphocompost technique to
86

Winter School on “Waste recycling and resource management”-Dec. 3-23, 2014
convert them into valuable organic fertilizer. Gaur (1987) reported that the efficient cellulolytic
cultures such as Aspergillus, Tricodcrma and Fenicillium accelerate the recycling process and
reduced the composting period. Different organic materials were treated with mineral
amendments and bioinoculum to prepare Phospho-sulfo-nitro compost and microbially enriched
compost followed by evaluation of the quality and maturity.
With farm Waste and City Garbage
For preparation of Phospho-sulfo-nitro compost, cereals, legumes and oil-seeds residues
were mixed with fresh cowdung in the ratio of 1:1/ indigenous rock phosphate at the rate of 2.5%
P2O5, 10 % pyrites and 0.5% urea N were added on dry weight basis and mixed thoroughly with
cowdung slurry (60-70% moisture). For proper aeration, perforated polyvinyl chloride popes
were inserted into the pits vertically and horizontally. In Microbially enriched phosphocompost
techniques, all ingredients were applied in same quality and bioinoculum was applied at 3 and 30
days of decomposition to hasten the decomposition process. The organisms used were cellulose
decomposers (Paecilomyces fusisporns, Aspergillns niger), P-solubilizers (Bacillus polymyxa,
Pseudomonas striata) and free-living N2 fixer (Azotohaclor chroococcum). Judging by his
criteria it was found that the city garbage decomposed most quickly followed by chickpea straw,
wheat straw, soybean straw and mustard straw. Mustard straw required more time to reach the
maturity level as compared to other farm wastes (Table3).
With forest Utter
Microbially enriched phosphocompost technique was used to convert deciduous forest litter into
enriched phosphocompost (Table 4). Dried leaves of teak and palas were treated with same
ingredients as mentioned earlier. The maturity index parameters obtained in this study from
different waste materials were compared with the standard threshold values to judge the degree of
maturity of the prepared compost. It was also observed that compost from forest litter reached the
maturity level within 90 days of decomposition. However, palas leaves decomposed slowly as
compared to teak leaves. Considering the maturity index parameters, both the techniques were found
to be equally efficient to shorten the period of decomposition from 6 to 4 months and produced
compared with more mineralizable plant nutrients for agricultural use.
87
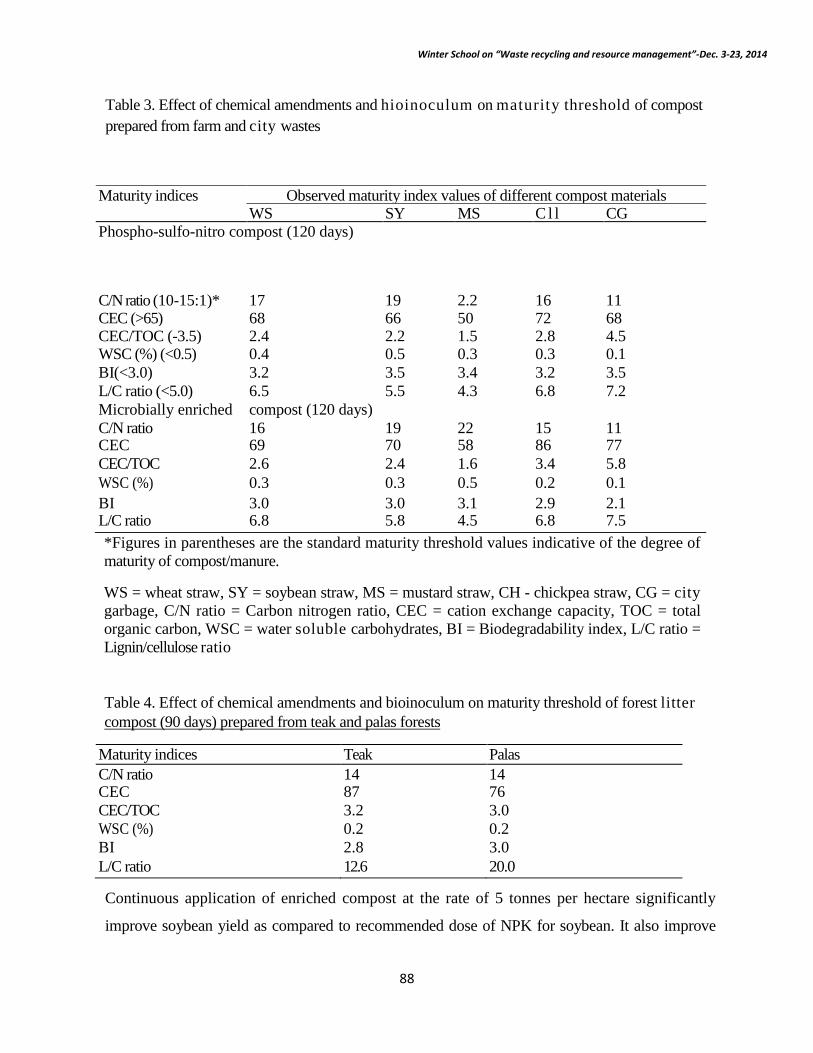
Winter School on “Waste recycling and resource management”-Dec. 3-23, 2014
Table 3. Effect of chemical amendments and hioinoculum on maturity threshold of compost prepared from farm and city wastes
Maturity indices Observed maturity index values of different compost materials WS SY MS C l l CG
Phospho-sulfo-nitro compost (120 days)
C/N ratio (10-15:1)*
17
19
2.2
16
11
CEC (>65)
68
66
50
72
68
CEC/TOC (-3.5)
2.4
2.2
1.5
2.8
4.5
WSC (%) (<0.5)
0.4
0.5
0.3
0.3
0.1
BI(<3.0)
3.2
3.5
3.4
3.2
3.5
L/C ratio (<5.0)
6.5
5.5
4.3
6.8
7.2
Microbially enriched
compost (120 days)
C/N ratio
16
19
22
15
11
CEC
69
70
58
86
77
CEC/TOC
2.6
2.4
1.6
3.4
5.8
WSC (%)
0.3
0.3
0.5
0.2
0.1
BI
3.0
3.0
3.1
2.9
2.1
L/C ratio
6.8
5.8
4.5
6.8
7.5
*Figures in parentheses are the standard maturity threshold values indicative of the degree of maturity of compost/manure.
WS = wheat straw, SY = soybean straw, MS = mustard straw, CH - chickpea straw, CG = city garbage, C/N ratio = Carbon nitrogen ratio, CEC = cation exchange capacity, TOC = total organic carbon, WSC = water soluble carbohydrates, BI = Biodegradability index, L/C ratio = Lignin/cellulose ratio
Table 4. Effect of chemical amendments and bioinoculum on maturity threshold of forest litter compost (90 days) prepared from teak and palas forests
Maturity indices
Teak
Palas
C/N ratio
14
14
CEC
87
76
CEC/TOC
3.2
3.0
WSC (%)
0.2
0.2
BI
2.8
3.0
L/C ratio
12.6
20.0
Continuous application of enriched compost at the rate of 5 tonnes per hectare significantly
improve soybean yield as compared to recommended dose of NPK for soybean. It also improve
88

Winter School on “Waste recycling and resource management”-Dec. 3-23, 2014
soil biological activities many fold better than chemical fertilizer application in soybean-wheat
system.
Relative importance of compost quality assessments for users
The most critical compost quality factors depend on the planned compost end use (Table 5). For
most applications, plant growth response is the ultimate indicator of compost quality. Compost
maturity and biological stability is applicable highly for nursery crops, sales to bagged, and field
crops, and medium importance to fruit crops and less importance to mulching operation. Because, in
mulch operation finer particle size of the decomposed organics retain more water holding capacity
which may help to generate weed germination. Compost nutrient content, especially plant-available
nitrogen is most important for field crops and medium importance for vegetable, fruit crops and less
importance for nursery and mulch operation. Restriction of salt content and pH is highly advisable
for nursery crops and bagged crops, but it is less importance for vegetables, fruit and field crop and
least importance for mulching. Soluble salts content of matured compost should be 2.5 to 6 dS m-1
for vegetables and plantation crops, and <3 dSm-1 for potting media. Odorless or colour less of
mature compost has less importance no importance for most of the crops except to the general
public requirement in bagged crop. Man-made inert (soils, glass, plastic) is highly importance for
nursery. It should be content very less amount < 10 %. Particle size of the matured compost is
highly importance for nursery because of proper drainage requirement of nursery always improve
by the particle size of > 13mm screen and for mulch passes 10 mm screen. The proposed index of
compost quality is given in Table 6. Producers/researchers and users may commonly use this.
Table 5. Proposed index of compost quality for users
Quality parameters
Nursery crops
Sales to general public; Bagged
Vegetables and fruit crops
Field crops
Mulch
Maturity and biological
++
++
+
++
+
Nutrient content
-
+
+
++
-
pH, and soluble salts
++
++
+
-
-
Sensory color and odor
_
++
-
-
-
89
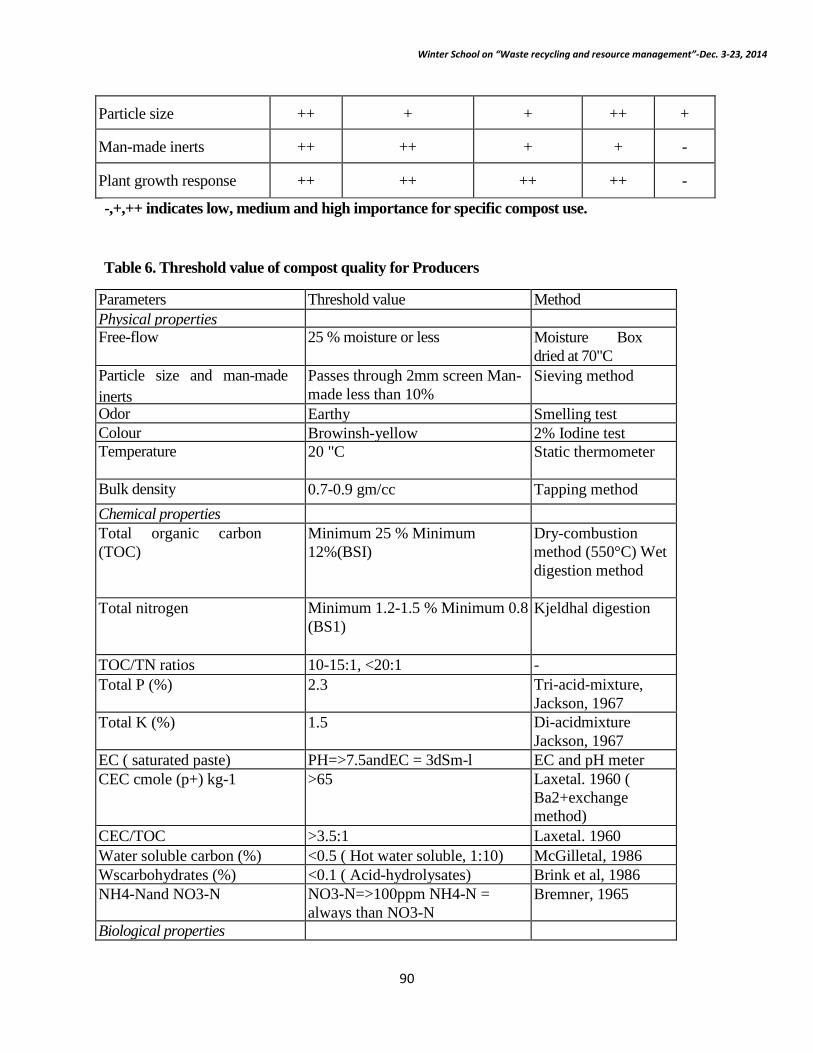
Winter School on “Waste recycling and resource management”-Dec. 3-23, 2014
Particle size
++
+
+
++
+
Man-made inerts
++
++
+
+
-
Plant growth response
++
++
++
++
-
-,+,++ indicates low, medium and high importance for specific compost use.
Table 6. Threshold value of compost quality for Producers
Parameters
Threshold value
Method
Physical properties
Free-flow
25 % moisture or less
Moisture Box dried at 70"C
Particle size and man-made inerts
Passes through 2mm screen Man-made less than 10%
Sieving method
Odor
Earthy
Smelling test
Colour
Browinsh-yellow
2% Iodine test
Temperature
20 "C
Static thermometer
Bulk density
0.7-0.9 gm/cc
Tapping method
Chemical properties
Total organic carbon (TOC)
Minimum 25 % Minimum 12%(BSI)
Dry-combustion method (550°C) Wet digestion method
Total nitrogen
Minimum 1.2-1.5 % Minimum 0.8 (BS1)
Kjeldhal digestion
TOC/TN ratios
10-15:1, <20:1
-
Total P (%)
2.3
Tri-acid-mixture, Jackson, 1967
Total K (%)
1.5
Di-acidmixture Jackson, 1967
EC ( saturated paste)
PH=>7.5andEC = 3dSm-l
EC and pH meter
CEC cmole (p+) kg-1
>65
Laxetal. 1960 ( Ba2+exchange method)
CEC/TOC
>3.5:1
Laxetal. 1960
Water soluble carbon (%)
<0.5 ( Hot water soluble, 1:10)
McGilletal, 1986
Wscarbohydrates (%)
<0.1 ( Acid-hydrolysates)
Brink et al, 1986
NH4-Nand NO3-N
NO3-N=>100ppm NH4-N = always than NO3-N
Bremner, 1965
Biological properties
90

Winter School on “Waste recycling and resource management”-Dec. 3-23, 2014
Respiration rate (mg CO2-C/100g/day)
<500mg/100gTOC/d
Garciaetal, 1992
Salmonella sp.
Nil
Shegella sp.
Nil
Coliforms sp.
Nil
91

Winter School on “Waste recycling and resource management”-Dec. 3-23, 2014
Organic uses in Indian agriculture and paradigm shift in fertilizer policy
P. K. Ghosh, T. Kiran Kumar, Srinivasan R. and D. R. Palsaniya Indian Grassland and Fodder Research Institute, Jhansi, U.P. – 284003
India is mainly an agricultural country, where agriculture supports over 58 percent of nation’s population for livelihood. The intensive agriculture practices were introduced in India in the 1960s as a part of green revolution. Recent experience shows that the successful food grains production strategy based on HYVs of seed, fertilizer, irrigation and other modern inputs of the earlier decades is unlikely to sustain agricultural growth in the longer term. There is rapid degradation of water and land resources leading to reduction of use efficiency of fertilizer, irrigation, tillage etc, along with rising emission of pollutants and green house gases, and agricultural release of toxic chemicals, contamination of food stuffs and associated health problems. Environmental and health problems associated with modern intensive agriculture are well documented around the world. Increasing consciousness about conservation of environment and health hazards caused by various agrochemicals has brought a shift in consumers’ preference towards organic products which are safe. Use of diverse organic source of plant nutrients becoming popular in traditional Indian agriculture with organic manures and composts are important components in their farming. Organic agriculture largely avoids or excludes the use of synthetic fertilizers, pesticides, growth regulators and livestock feed additives, crop residue retention, animal manures, green manures, off-farm organic wastes, crop rotations, leguminous crops to maintain soil productivity. For ensuring a sustainable system, use of organics in agriculture with integrated production management system, which is supportive to environmental health and sustainability.
Fertilizer was considered an important tool to augment food production in India since independence. The true role of fertilizes in augmenting food production in India was realized only with the introduction of high yielding dwarf varieties of wheat (and other cereals) during 1966–68, the ‘Green Revolution’ era. With a consumption of 14.4 Tg N, 5.5 Tg P2O5, and 2.6 Tg of K2O in 2007–08, India now occupies the second position (neck to neck with USA) after China in N and P consumption. In K consumption, India occupies the fourth position. India also occupies the second position in fertilizer N production (10.9 Tg in 2007–08) and third position in phosphate fertilizer production (3.7 Tg in 2007–08; FAI, 2008). However, the fertilizer use efficiency is not only low in Indian agriculture but has also been declining over the years. The efficiency of N is only 30-40 percent in rice and 50-60 percent in other cereals, while the efficiency of P is 15-20 percent in most crops. The efficiency of K is 60-80 percent, while that of S is 8-12 percent. As regards the micronutrients, the efficiency of most of them is below 5 percent (National Academy of Agricultural Sciences, 2006). In India, there are large variations in fertilizer use across the states. Among the major states, Punjab stands first in fertilizer consumption with 213 kg per hectare of gross cropped area followed by Andhra Pradesh with 208 kg/ha, 193 kg/ha in Tamil Nadu and Haryana with 187 kg/ha. The states like Kerala,
92

Winter School on “Waste recycling and resource management”-Dec. 3-23, 2014
Madhya Pradesh, Chhattisgarh, Maharashtra, Rajasthan, Goa, Uttarakhand, Himachal Pradesh, Jammu and Kashmir, Jharkhand, Orissa and north-eastern states have witnessed fertilizer use level below the national average of 119 kg/ha. The states which use more than the national average are Punjab, Andhra Pradesh, Tamil Nadu, Haryana, Karnataka, Gujarat, Uttar Pradesh, Bihar and West Bengal. As there are considerable differences in area under irrigation across the regions, the consumption of chemical fertilizers across regions also show similar patterns. The fertilizer consumption per hectare varies from 1.74 kg in Nagaland (north-eastern region) to 168.21 kg in Punjab (northern region). Most of the states in southern and northern regions consume fertilizers at levels above the national average. Both the area under irrigated and fertilizer consumption are high in the southern and northern regions. The state wise application of N, P and K per hectare of gross cropped area shows that there are larger variations in the use of different fertilizers across states. Punjab ranks the top in use of N and second in P but the use of K is much lower than the national average. Haryana ranks second in per hectare use of N and P, but the use of K in this state is very low. Tamil Nadu stands first in the use of K followed by West Bengal. It is interesting to note that per hectare application of K in southern states is higher than the use of K in other states except West Bengal. The lowest use of all three plant nutrients (N, P and K) is observed in the north east region. The information thus confirms that there are imbalances in the use of fertilizers in the country as well as across different states. As there is significant variation in the status of soil fertility in various parts of the country, the imbalances at the micro level can be better understood and addressed by developing location specific norms for balanced use of fertilizer (Chand and Pandey, 2008). Moreover, the imbalances in fertilizer use are also attributed to prices and subsidies available to the farmers in addition to farm and household specific characteristics.
The long-term sustainability of any system requires complicated trade-offs between benefits and losses. However, almost always there are ways of minimizing losses while retaining benefits. In order to minimize the negative impacts of fertilizer use in India, farmers needs to be imparted with knowledge and education on appropriate fertilizer products, dosage, and time and method of application and also support services in the form of field demonstrations and better soil testing facilities. Moreover, policy reforms are needed not only to eliminate the bias of subsidy policy towards nitrogenous fertilizers but also to divert some subsidy towards the use of organic fertilizers, efficient forms of fertilizers, and higher application of secondary and micronutrients.
Organic sources in agriculture
Animal manure / Organic manure
Livestock is an integral component of an eco-friendly farming contributing to the livelihood security of the farmer in rural areas. Cattle urine is a rich source of Nitrogen, besides most of the 12 other essential elements of nutrients including trace elements. It is helpful in pest management as well.
The major contributors of organic source of nutrients are animal dung, crop residues and sewage sludge etc. These organic sources generate about 17 million tonnes of plant nutrients (N + P2O5
93

Winter School on “Waste recycling and resource management”-Dec. 3-23, 2014
+ K2O). The share of organic manures in total nutrient supply got drastically curtailed after the introduction of chemical fertilizers. But high price of chemical fertilizers coupled with their limited production, deficiency of secondary and micronutrients and deterioration of other soil properties have led to a renewed interest in the use of organic manure.
In organic systems, it is particularly important to conserve manure nutrients for both economic and environmental reasons. Among the on farm resources, conventional compost or farm yard manure (FYM) is still the predominant source of organic manure followed by vermicompost, biogas slurry, green manure legumes etc. Bone meal, Poultry manure, neem cake are some of the popular off-farm resources. Organic manure act in many ways in augmenting crop growth and soil productivity. The direct effect of organics relates to the uptake of humic substances or its decomposition products affecting favorably the growth and metabolism of plants. Indirectly, it augments the beneficial soil microorganisms and their activities and thus increases the availability of plant nutrients for higher yields.
Compost
All organic farm wastes, stubbles of crops waste straw, sweepings, threshing floor collection, dry weeds etc. may all be collected and used for augmenting the organic matter supplies they cannot be used directly as manure in most cases. Straws usually contain high C : N ratio. They need to be decomposed before application. The process of decomposing wastes is called composting and the decomposed material is called compost. It is like well decomposed cattle manure, more powdery and lighter in colour. Traditional composting takes as long as 6-8 months to produce finished compost. Efficient composting techniques offer possibilities for reducing the processing period up to 3 months. Some of the most popular ones like vermicomposting, phosphocompost, microbial enriched compost etc.
Crop residues
Crop residues are good source of plant nutrients and are important components of integrated nutrient management. In regions where mechanical harvesting is done, sizeable quantities of residues are left in the field. Similarly major portion of the residues is used as animal feed and about 33% of these residues are available for direct use. About 200 million tonnes of crop residues are produced from different crops annually. The potential of these has been estimated to be around 100 million tonnes annually for recycling in agriculture. The leguminous plant residues are degraded at a faster rate than cereal crop residues having wide C: N ratio. The uses of residues are generally most effective for water conservation when managed as surface mulch. Green manuring consists of turning over a fast growing legume crop mainly to improve soil fertility and soil physical conditions. It is one of the most effective and environmentally sound methods of organic manuring that offers an opportunity to cut down the dose of chemical fertilizers.
94
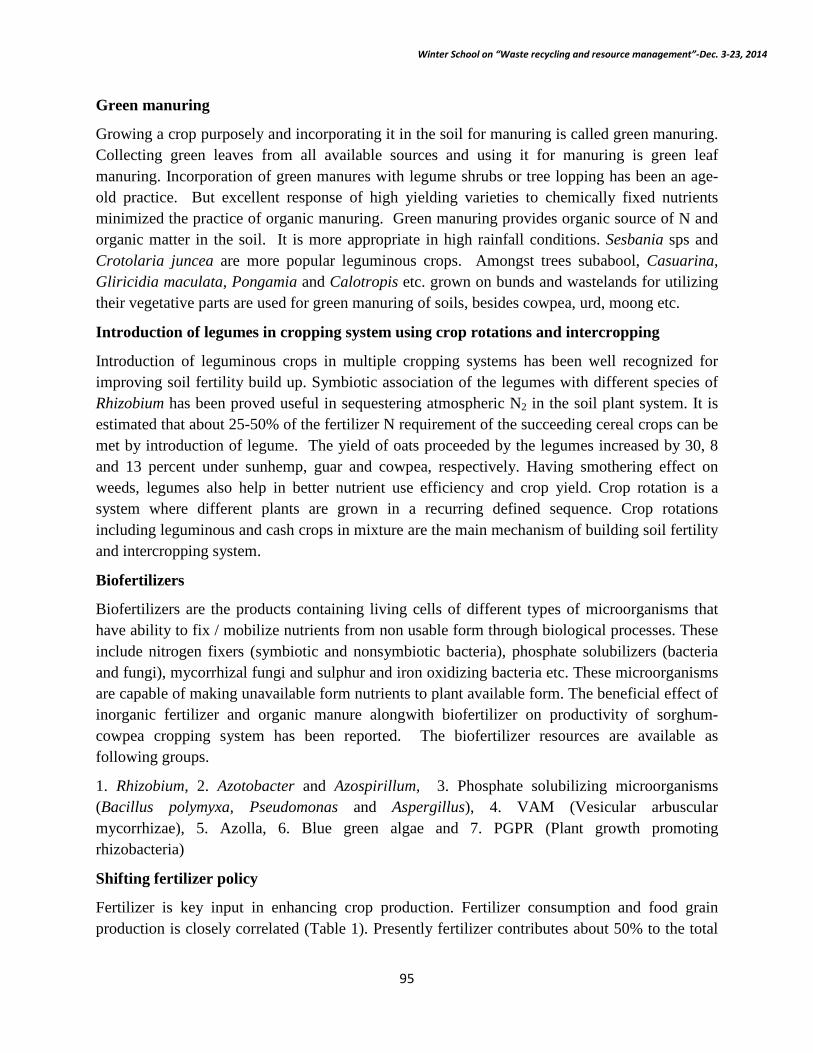
Winter School on “Waste recycling and resource management”-Dec. 3-23, 2014
Green manuring
Growing a crop purposely and incorporating it in the soil for manuring is called green manuring. Collecting green leaves from all available sources and using it for manuring is green leaf manuring. Incorporation of green manures with legume shrubs or tree lopping has been an age-old practice. But excellent response of high yielding varieties to chemically fixed nutrients minimized the practice of organic manuring. Green manuring provides organic source of N and organic matter in the soil. It is more appropriate in high rainfall conditions. Sesbania sps and Crotolaria juncea are more popular leguminous crops. Amongst trees subabool, Casuarina, Gliricidia maculata, Pongamia and Calotropis etc. grown on bunds and wastelands for utilizing their vegetative parts are used for green manuring of soils, besides cowpea, urd, moong etc.
Introduction of legumes in cropping system using crop rotations and intercropping
Introduction of leguminous crops in multiple cropping systems has been well recognized for improving soil fertility build up. Symbiotic association of the legumes with different species of Rhizobium has been proved useful in sequestering atmospheric N2 in the soil plant system. It is estimated that about 25-50% of the fertilizer N requirement of the succeeding cereal crops can be met by introduction of legume. The yield of oats proceeded by the legumes increased by 30, 8 and 13 percent under sunhemp, guar and cowpea, respectively. Having smothering effect on weeds, legumes also help in better nutrient use efficiency and crop yield. Crop rotation is a system where different plants are grown in a recurring defined sequence. Crop rotations including leguminous and cash crops in mixture are the main mechanism of building soil fertility and intercropping system.
Biofertilizers
Biofertilizers are the products containing living cells of different types of microorganisms that have ability to fix / mobilize nutrients from non usable form through biological processes. These include nitrogen fixers (symbiotic and nonsymbiotic bacteria), phosphate solubilizers (bacteria and fungi), mycorrhizal fungi and sulphur and iron oxidizing bacteria etc. These microorganisms are capable of making unavailable form nutrients to plant available form. The beneficial effect of inorganic fertilizer and organic manure alongwith biofertilizer on productivity of sorghum-cowpea cropping system has been reported. The biofertilizer resources are available as following groups.
1. Rhizobium, 2. Azotobacter and Azospirillum, 3. Phosphate solubilizing microorganisms (Bacillus polymyxa, Pseudomonas and Aspergillus), 4. VAM (Vesicular arbuscular mycorrhizae), 5. Azolla, 6. Blue green algae and 7. PGPR (Plant growth promoting rhizobacteria)
Shifting fertilizer policy
Fertilizer is key input in enhancing crop production. Fertilizer consumption and food grain production is closely correlated (Table 1). Presently fertilizer contributes about 50% to the total
95
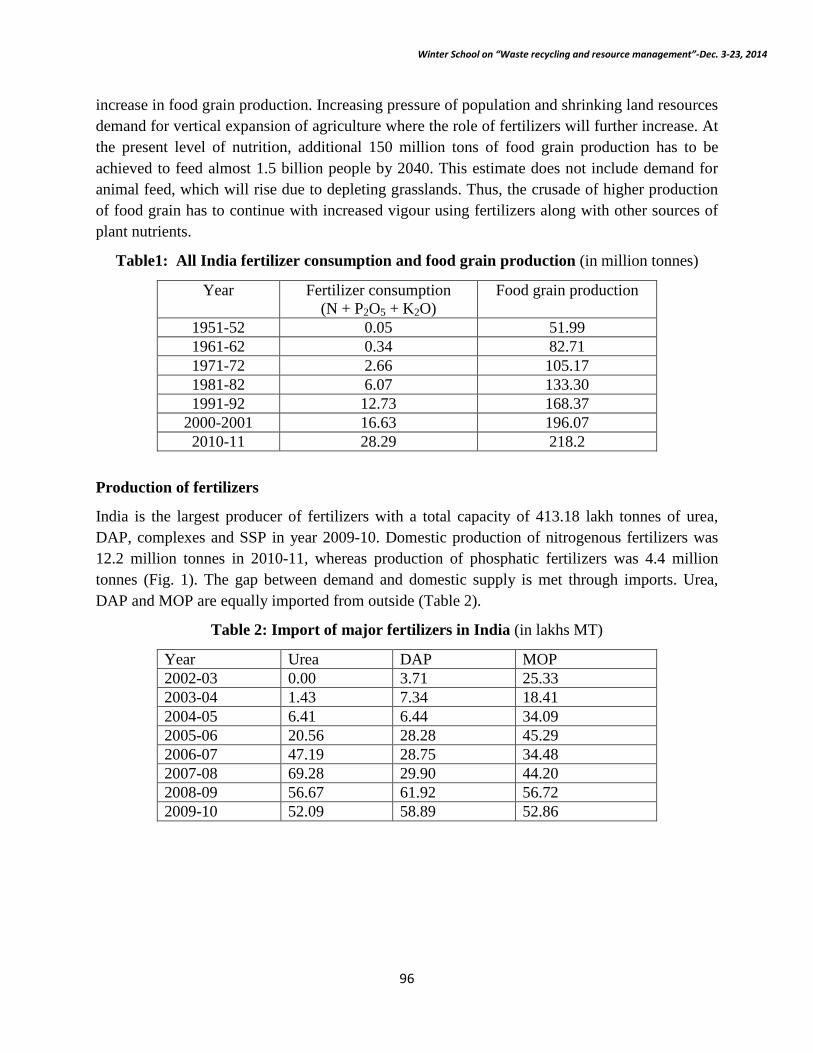
Winter School on “Waste recycling and resource management”-Dec. 3-23, 2014
increase in food grain production. Increasing pressure of population and shrinking land resources demand for vertical expansion of agriculture where the role of fertilizers will further increase. At the present level of nutrition, additional 150 million tons of food grain production has to be achieved to feed almost 1.5 billion people by 2040. This estimate does not include demand for animal feed, which will rise due to depleting grasslands. Thus, the crusade of higher production of food grain has to continue with increased vigour using fertilizers along with other sources of plant nutrients.
Table1: All India fertilizer consumption and food grain production (in million tonnes)
Year Fertilizer consumption (N + P2O5 + K2O)
Food grain production
1951-52 0.05 51.99 1961-62 0.34 82.71 1971-72 2.66 105.17 1981-82 6.07 133.30 1991-92 12.73 168.37
2000-2001 16.63 196.07 2010-11 28.29 218.2
Production of fertilizers
India is the largest producer of fertilizers with a total capacity of 413.18 lakh tonnes of urea, DAP, complexes and SSP in year 2009-10. Domestic production of nitrogenous fertilizers was 12.2 million tonnes in 2010-11, whereas production of phosphatic fertilizers was 4.4 million tonnes (Fig. 1). The gap between demand and domestic supply is met through imports. Urea, DAP and MOP are equally imported from outside (Table 2).
Table 2: Import of major fertilizers in India (in lakhs MT)
Year Urea DAP MOP 2002-03 0.00 3.71 25.33 2003-04 1.43 7.34 18.41 2004-05 6.41 6.44 34.09 2005-06 20.56 28.28 45.29 2006-07 47.19 28.75 34.48 2007-08 69.28 29.90 44.20 2008-09 56.67 61.92 56.72 2009-10 52.09 58.89 52.86
96

Winter School on “Waste recycling and resource management”-Dec. 3-23, 2014
(Source: www.indiastat.com)
Fertilizer nutrients (N+P2O5+K2O) consumption in India, in the past 50 years, has increased manifold and reached a record level of 28.3 million tons during 2009-10 (Fig.1). Urea, DAP and MOP are the most popular fertilizers, accounting for 86.5, 70 and 73.6 per cent respectively, of the total fertilizer material consumed in the country during 2011-12 (Table 3). Fertilizer use in India is mainly limited to Urea, DAP, MOP and SSP. Elsewhere in the world the specialty products such as completely soluble solid fertilizers for drip irrigation and efficient products like USG, Coated urea etc. are used. New research and development activities are required to be encouraged in the areas of new product, energy saving, alternate feedstock etc. Without R & D efforts Indian fertilizer industry will continue to employ stereo type operations and there will be little innovation.
Table 3: Percent share of major fertilizer products in total consumption of N, P and K nutrients
Year Share of urea in total N
Share of DAP in total P
Share of SSP in total P
Share of MOP in total K
2005-06 80.6 59.8 8.5 67.9
2006-07 81.3 61.2 8.4 66.4 2007-08 82.8 63.0 7.0 65.6 2008-09 81.2 65.3 6.4 73.9
2009-10 78.8 66.0 6.0 76.5
97

Winter School on “Waste recycling and resource management”-Dec. 3-23, 2014
2010-11 84.3 67.6 6.7 75.0 2011-12 86.5 70.0 7.1 73.6 Average 82.29 64.7 7.16 71.27
The ideal N : P : K ratio, aggregated for the country as a whole, is 4 : 2 : 1. However, during 1992 - 93, after decontrol of phosphatic and potassic fertilizers, the NPK consumption ratio distorted to 9.5 : 3.2 : 1. The ratio continues to be quite wide at 7.0 : 2.7 : 1 in 2001 and it has shown decline 4.3 : 2.0 : 1 during 2009-10 (Table 4). Such imbalance application of fertilizer is bound to affect the crop productivity and soil fertility in the long run. The crop response to fertilizer use, which was estimated at 12 kg food grain per kg of nutrient use is now restricted to 8 kg food grain per kg of nutrients. The crop response is likely to go down further to six kg per kg of nutrient use. The losses of nutrients occur through leaching, volatilization, run off, fixation etc. The losses have to be arrested by adopting best method of agriculture packages or precision farming.
Table 4: NPK Consumption ratio
Year N P2O5 K2O 1951-52 7.9 0.9 1.0 1961-62 8.9 2.2 1.0 1971-72 6.0 1.9 1.0 1981-82 6.0 1.9 1.0 1991-92 6.0 2.9 1.0 2000-01 7.0 2.7 1.0 2005-06 5.3 2.2 1.0 2009-10 4.3 2.0 1.0
Besides imbalance in use of NPK, deficiencies of other secondary and micronutrients are also becoming apparent now. The concept of balanced fertilizer application therefore has to consider these elements, particularly sulphur, zinc and iron. Low organic matter content in Indian soils and lack of adequate sources for micronutrients make it imperative to increase use of organic sources like FYM, green manure, bio-gas slurry etc. There is a need to practice Integrated Plant Nutrient Supply system (IPNS) to bring back the balance in soil fertility and fertilizer use.
In India, fertilizer industry has been subjected to various government controls primarily due to its important role in increasing agriculture production in the country. The Government of India established the “Central Fertilizer Pool (CFP)” in 1944 mainly to achieve equitable distribution of fertilizer throughout the country at fair prices. The pooled fertilizers were then distributed to various parts of the country mainly through agricultural cooperatives and outlets of the state department of agriculture. Realising the importance of fertilizers in the agriculture sector, fertilizer has been considered as an essential commodity through enactment of Fertilizer Control Order (FCO) in March 1957 under the Essential Commodities Act (ECA) 1955. Under these
98
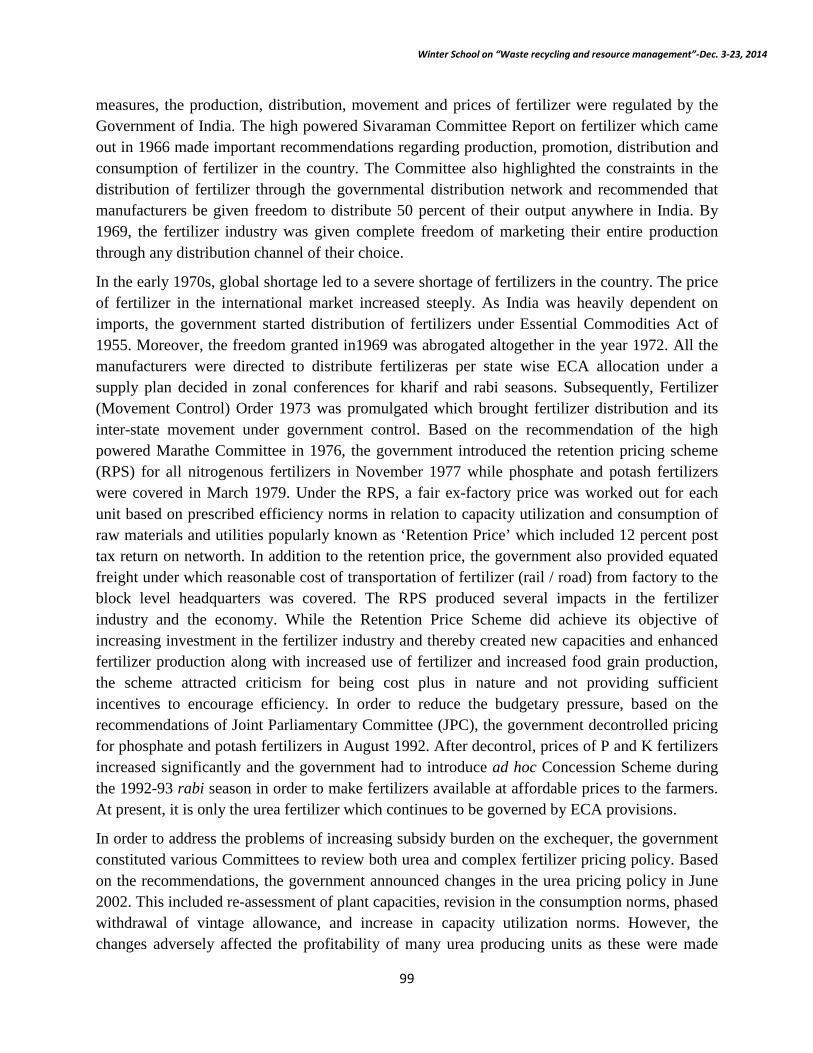
Winter School on “Waste recycling and resource management”-Dec. 3-23, 2014
measures, the production, distribution, movement and prices of fertilizer were regulated by the Government of India. The high powered Sivaraman Committee Report on fertilizer which came out in 1966 made important recommendations regarding production, promotion, distribution and consumption of fertilizer in the country. The Committee also highlighted the constraints in the distribution of fertilizer through the governmental distribution network and recommended that manufacturers be given freedom to distribute 50 percent of their output anywhere in India. By 1969, the fertilizer industry was given complete freedom of marketing their entire production through any distribution channel of their choice.
In the early 1970s, global shortage led to a severe shortage of fertilizers in the country. The price of fertilizer in the international market increased steeply. As India was heavily dependent on imports, the government started distribution of fertilizers under Essential Commodities Act of 1955. Moreover, the freedom granted in1969 was abrogated altogether in the year 1972. All the manufacturers were directed to distribute fertilizeras per state wise ECA allocation under a supply plan decided in zonal conferences for kharif and rabi seasons. Subsequently, Fertilizer (Movement Control) Order 1973 was promulgated which brought fertilizer distribution and its inter-state movement under government control. Based on the recommendation of the high powered Marathe Committee in 1976, the government introduced the retention pricing scheme (RPS) for all nitrogenous fertilizers in November 1977 while phosphate and potash fertilizers were covered in March 1979. Under the RPS, a fair ex-factory price was worked out for each unit based on prescribed efficiency norms in relation to capacity utilization and consumption of raw materials and utilities popularly known as ‘Retention Price’ which included 12 percent post tax return on networth. In addition to the retention price, the government also provided equated freight under which reasonable cost of transportation of fertilizer (rail / road) from factory to the block level headquarters was covered. The RPS produced several impacts in the fertilizer industry and the economy. While the Retention Price Scheme did achieve its objective of increasing investment in the fertilizer industry and thereby created new capacities and enhanced fertilizer production along with increased use of fertilizer and increased food grain production, the scheme attracted criticism for being cost plus in nature and not providing sufficient incentives to encourage efficiency. In order to reduce the budgetary pressure, based on the recommendations of Joint Parliamentary Committee (JPC), the government decontrolled pricing for phosphate and potash fertilizers in August 1992. After decontrol, prices of P and K fertilizers increased significantly and the government had to introduce ad hoc Concession Scheme during the 1992-93 rabi season in order to make fertilizers available at affordable prices to the farmers. At present, it is only the urea fertilizer which continues to be governed by ECA provisions.
In order to address the problems of increasing subsidy burden on the exchequer, the government constituted various Committees to review both urea and complex fertilizer pricing policy. Based on the recommendations, the government announced changes in the urea pricing policy in June 2002. This included re-assessment of plant capacities, revision in the consumption norms, phased withdrawal of vintage allowance, and increase in capacity utilization norms. However, the changes adversely affected the profitability of many urea producing units as these were made
99

Winter School on “Waste recycling and resource management”-Dec. 3-23, 2014
retrospectively. The Government of India constituted an ‘Expert Group on Phosphatic Fertilizer Policy’ to review the phosphatic fertilizer environment, examine international and Indian phosphate fertilizer scenario and suggest alternative to existing methodology of phosphatic fertilizer pricing and costing. It had suggested that the subsidy on DAP should form the basis for deriving subsidy on complex fertilizers. Further, a formula proposed by the Expert Group was adopted for working out the price of phosphoric acid for computation of quarterly escalation / de-escalation claims in the concession rates of DAP / NPK fertilizers in place of negotiated prices of phosphoric acid. The formula, however, was adopted only for the year 2006-07. The government established the Fertilizer Monitoring System (FMS) in January 2007 to monitor movement of fertilizers up to the district level and to ensure availability of fertilizers in the interior parts of the country.
In order to maintain adequate stock for urea in the field warehouses, the government also introduced the buffer stocking scheme since the 2007 kharif season. The Scheme is being operated through the Lead Fertilizer Suppliers (LFS). The LFS holds urea under the buffer stock in their warehouses at designated locations approved by the government. The Scheme helps the State Governments to tide over sudden spurts in demand / shortage in any part of the country. However, the LFSs maintaining the buffer warehouses have not yet been paid on time in spite of submission of requisite data to the government. To achieve balanced use of fertilizers, the government formulated guidelines for production and use of ‘Customised Fertilizers’ which are crop specific, climate specific, and soil specific. All subsidized fertilizers can be used for manufacturing of customized fertilizers. As of now, 24 grades of customized fertilizer have been notified. A policy for encouraging production and availability of ‘Fortified and Coated Fertilizers’ was introduced in 2008. The process of fortification involves enriching a regular fertilizer product with micronutrients like zinc or boron. The manufacturers/producers were allowed to sell Fortified/Coated Fertilizers, expect for zincated urea and boronated SSP at a price above the MRP of the fertilizer covered under subsidy. The government announced the continuation of Concession Scheme on Decontrolled Phosphate and Potassic (P and K) fertilizers in July 2008 and it was implemented in April 2008. The price of urea, DAP and MOP as well as the prices of phosphoric acid and ammonia started increasing in the beginning of 2008 in the international market. There had been unprecedented rise in the international prices of fertilizers, raw material and intermediates during April - September 2008. Moreover, the availability of the fertilizers and raw materials became inadequate in the international market. With a view to making fertilizer available to the farmers in 2008-09 rabi season, the government directed the manufacturers to tie up imports as well as finished goods. It was assured that the concession will be paid to the manufacturers/importers on the basis of receipt of material in the districts. However, the prices of DAP and raw materials started to fall during October - December 2008 in the international market and consequently, the concession payable to the manufacturers / importers also came down from Rs. 51,560 per ton during October 2008 to Rs.25,680 per ton during December 2008.
100
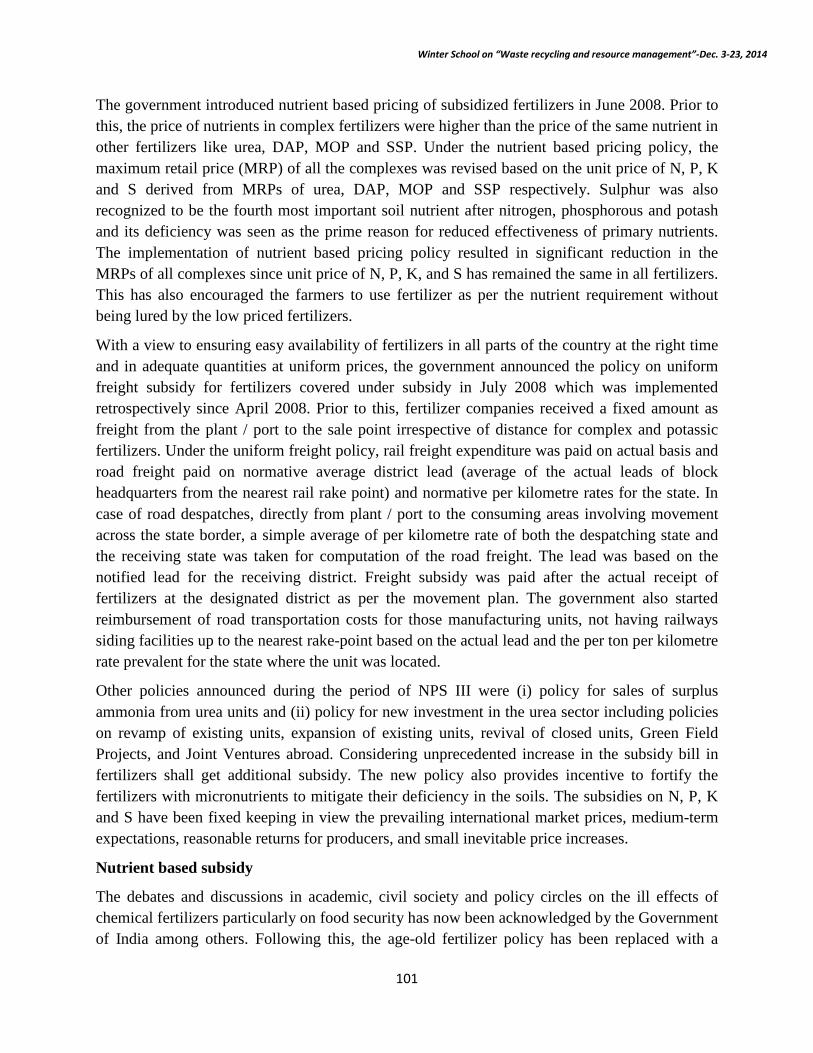
Winter School on “Waste recycling and resource management”-Dec. 3-23, 2014
The government introduced nutrient based pricing of subsidized fertilizers in June 2008. Prior to this, the price of nutrients in complex fertilizers were higher than the price of the same nutrient in other fertilizers like urea, DAP, MOP and SSP. Under the nutrient based pricing policy, the maximum retail price (MRP) of all the complexes was revised based on the unit price of N, P, K and S derived from MRPs of urea, DAP, MOP and SSP respectively. Sulphur was also recognized to be the fourth most important soil nutrient after nitrogen, phosphorous and potash and its deficiency was seen as the prime reason for reduced effectiveness of primary nutrients. The implementation of nutrient based pricing policy resulted in significant reduction in the MRPs of all complexes since unit price of N, P, K, and S has remained the same in all fertilizers. This has also encouraged the farmers to use fertilizer as per the nutrient requirement without being lured by the low priced fertilizers.
With a view to ensuring easy availability of fertilizers in all parts of the country at the right time and in adequate quantities at uniform prices, the government announced the policy on uniform freight subsidy for fertilizers covered under subsidy in July 2008 which was implemented retrospectively since April 2008. Prior to this, fertilizer companies received a fixed amount as freight from the plant / port to the sale point irrespective of distance for complex and potassic fertilizers. Under the uniform freight policy, rail freight expenditure was paid on actual basis and road freight paid on normative average district lead (average of the actual leads of block headquarters from the nearest rail rake point) and normative per kilometre rates for the state. In case of road despatches, directly from plant / port to the consuming areas involving movement across the state border, a simple average of per kilometre rate of both the despatching state and the receiving state was taken for computation of the road freight. The lead was based on the notified lead for the receiving district. Freight subsidy was paid after the actual receipt of fertilizers at the designated district as per the movement plan. The government also started reimbursement of road transportation costs for those manufacturing units, not having railways siding facilities up to the nearest rake-point based on the actual lead and the per ton per kilometre rate prevalent for the state where the unit was located.
Other policies announced during the period of NPS III were (i) policy for sales of surplus ammonia from urea units and (ii) policy for new investment in the urea sector including policies on revamp of existing units, expansion of existing units, revival of closed units, Green Field Projects, and Joint Ventures abroad. Considering unprecedented increase in the subsidy bill in fertilizers shall get additional subsidy. The new policy also provides incentive to fortify the fertilizers with micronutrients to mitigate their deficiency in the soils. The subsidies on N, P, K and S have been fixed keeping in view the prevailing international market prices, medium-term expectations, reasonable returns for producers, and small inevitable price increases.
Nutrient based subsidy
The debates and discussions in academic, civil society and policy circles on the ill effects of chemical fertilizers particularly on food security has now been acknowledged by the Government of India among others. Following this, the age-old fertilizer policy has been replaced with a
101

Winter School on “Waste recycling and resource management”-Dec. 3-23, 2014
Nutrient Based Subsidy (NBS) system for fertilizers with effect from 1 April 2010 “to eliminate the fertilizer use anomaly, arrest soil degradation due to imbalance use of chemical fertilizers and to ensure sustainable production with good soil health. Under the regime the Government also proposes soil test based, cropping system specific fertilizer uses in conjunction with organic and biofertilizers”. The new system of a fixed subsidy based on the nutrient content will do away with the vulnerabilities associated with fluctuations in the international market prices. This move will also appease the industry as the fertilizer prices (except for urea prices) are decontrolled and the industry can decide on the prices. Immediately after the NBS was made effective, industry raised the price of Di-ammonium phosphate (DAP) and Muriate of Potash (MOP) by Rs 600 a tonne. The impact of this price rise along with the 10% hike in urea prices on soil health and its socioeconomic implications on the farmers need to be assessed. Decline in soil organic matter and deficiency of secondary and micro-nutrients was a major issue which led to yield stagnation. The new policy doesn't address these concerns. The NBS is applicable only for the three macro nutrients – nitrogen (N), phosphorous (P) and potassium (K), one secondary nutrient – sulphur (S) – and only two micro nutrients – zinc (Zn) and boron (B). Organic fertilizers are not eligible for subsidy, whereas an investment in organic fertilization practices could have solved both the issues.
The major principles of fertilizer policy since 1977 include: (i) ensuring availability of fertilizers to farmers at every corner of the country and at affordable prices; (ii) enable balanced fertilizer application (phosphorus decontrol in 1992 disturbed the balance); (iii) ensure viability of domestic industry and promote investments in the sector; and (iv) provide incentives for technological developments, efficiency and competitiveness.
Conclusion
It is often argued that one of the ways to reduce the adverse environmental impacts of fertilizer is through increasing the use of organics as fertilizer. The use of organic fertilizer brings about improvements in the structure and texture of the soil, enhances its water-holding capacity, supplies micro elements required by crop plants, improves the physical properties of the soil by reducing the use of chemical fertilizers, and promotes better waste management. Traditional chemical fertilizers provide nutrients in forms that are highly water soluble so they quickly move into the soil and be predictably available to the plant. Organic fertilizers typically need to undergo some type of microbially mediated reaction and be converted to the same chemical forms to be available to the plant. Ultimately the plant takes up the nutrients in the chemical form whether they are applied as an organic or chemical fertilizer. In order to address the issue of food security, increasing population in India, is destined to stay dependent on fertilizer use to increase food production. However, the negative impacts of fertilizer on the environment pose a threat to the sustainability of the agriculture system. So, it is now imperative to ensure balanced and efficient use of organic and inorganic fertilizers through improved soil management practices and policy making so that the primary nutrients, secondary nutrients, and various micronutrients
102

Winter School on “Waste recycling and resource management”-Dec. 3-23, 2014
are available in the soil in correct amounts for proper nutrient intake by crop plants and that thereby minimize negative effects on the environment.
References
Chand, Ramesh and L. M. Pandey, 2008. Fertilizer Growth, Imbalances and Subsidies: Trends and Implications, Discussion Paper: NPP 02/2008, National Centre for Agricultural Economics and Policy Research, New Delhi.
Ministry of Chemicals and Fertilizers, Government of India, 2010. Indian fertilizer scenario.
National Academy of Agricultural Sciences, New Delhi, May 2006. Policy paper 35. Low and declining crop response to fertilizers. www.indiastat.com
103

Winter School on “Waste recycling and resource management”-Dec. 3-23, 2014
Recycling of animal waste for sustainable production of forage and fodder crops
P. K. Ghosh, Srinivasan R and Manoj Chaudhary
Indian Grassland and Fodder Research Institute, Jhansi, U.P. - 284003 India ranks first in having the largest livestock population in the world. It has 56.7% of world’s buffaloes, 12.5% cattle, 20.4% small ruminants, 2.4% camel, 1.4% equine, 1.5% pigs and 3.1% poultry. Livestock plays an important role in the national economy as well as in the socio-economic condition. Livestock sector contributes approximately 4% to GDP and 27% to agriculture GDP (International Poultry & Livestock Expo-2014). Average-size cattle produce 4 to 6 tonnes of fresh dung per year. In India and some other developing nations, a significant fraction of cattle dung is used as cooking and heating fuel after making its bricks. With per capita land area decreasing consistently, various measures is being adopted to increase the agricultural production from these shrinking resources to meet the emergent demand of escalating population. However, sustaining the crop production from these decreasing land areas depends largely on one factor, maintenance of soil health at high levels for encouraging good growth of plants. The recent trend of consistently reducing use efficiency of mineral fertilizers under high productive systems associated with the problems of gradual deterioration of soil health due to indiscriminate use of fertilizers is raising frequent questions about over dependence on mineral fertilizers in sustaining the health and consequently, the productivity of the arable soils of this continent. It also leads to loss of soil fertility due to imbalanced use of fertilizers that has adversely impacted agricultural productivity and causes soil degradation. Mineral fertilizers can only supply plant nutrients to the soils but they cannot take care of other physical, chemical and biological attributes of soil health. On the other hand, organic materials play a much more positive role in this respect. Under this context, the concept of integrated plant nutrition system involving both inorganic and organic sources of nutrients has been conceived and gaining momentum (Chattopadhyay 2005). It has been estimated that about 679.3, 561.9 and 64.8 million tonnes of crop residues, animal dung and urban solid wastes, respectively are produced annually. Out of these, around one third of crop residues, half of the animal dung and 14% of urban wastes are available for recycling and use in agriculture, including horticulture, plantations and fodder production. Number of organisms (micro and macro) capable of converting animal waste into valuable resources containing plant nutrients and organic matter, which are critical for maintaining soil productivity are found in nature. They are important to maintain nutrient flows from one system to another and also minimize environmental degradation. So recycling of animal waste is one of the techniques to tackle the problem of safe disposal of waste as well as convert the waste into valuable organic fertilizer required for sustainable productivity. For forage crops, as with other crops, manures should be applied with the aim of balancing nutrient supply and demand, topping up with inorganic fertiliser as necessary.
104
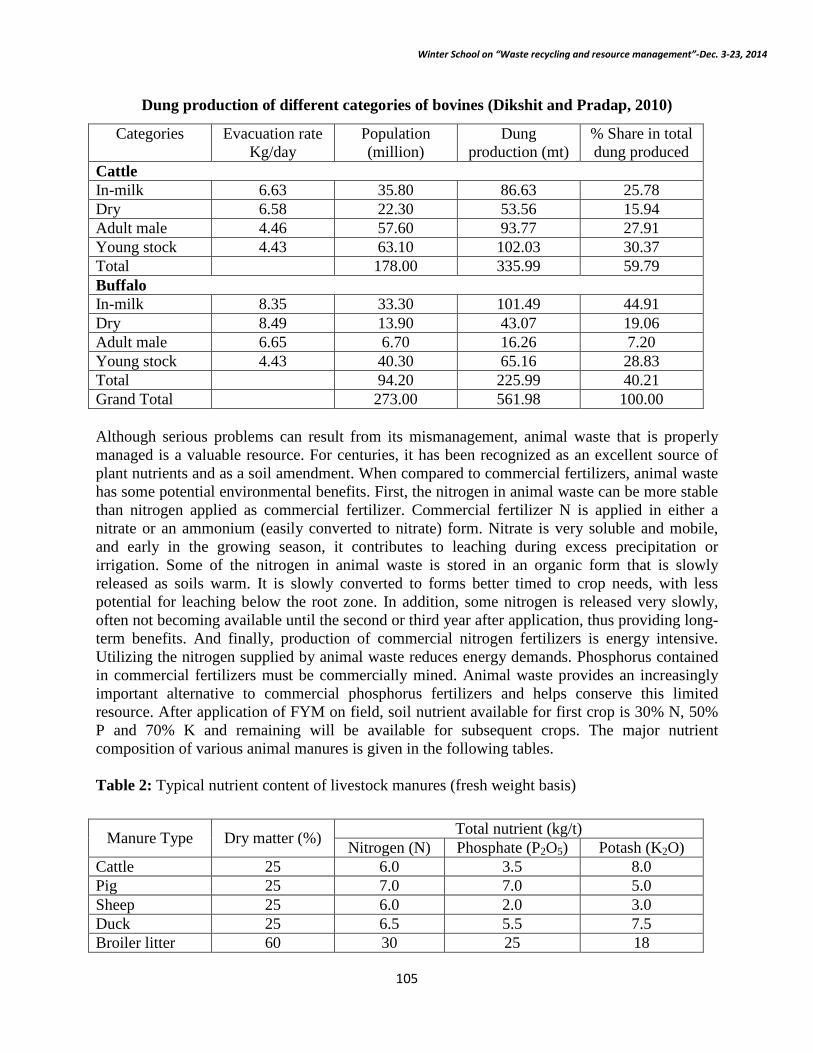
Winter School on “Waste recycling and resource management”-Dec. 3-23, 2014
Dung production of different categories of bovines (Dikshit and Pradap, 2010)
Although serious problems can result from its mismanagement, animal waste that is properly managed is a valuable resource. For centuries, it has been recognized as an excellent source of plant nutrients and as a soil amendment. When compared to commercial fertilizers, animal waste has some potential environmental benefits. First, the nitrogen in animal waste can be more stable than nitrogen applied as commercial fertilizer. Commercial fertilizer N is applied in either a nitrate or an ammonium (easily converted to nitrate) form. Nitrate is very soluble and mobile, and early in the growing season, it contributes to leaching during excess precipitation or irrigation. Some of the nitrogen in animal waste is stored in an organic form that is slowly released as soils warm. It is slowly converted to forms better timed to crop needs, with less potential for leaching below the root zone. In addition, some nitrogen is released very slowly, often not becoming available until the second or third year after application, thus providing long-term benefits. And finally, production of commercial nitrogen fertilizers is energy intensive. Utilizing the nitrogen supplied by animal waste reduces energy demands. Phosphorus contained in commercial fertilizers must be commercially mined. Animal waste provides an increasingly important alternative to commercial phosphorus fertilizers and helps conserve this limited resource. After application of FYM on field, soil nutrient available for first crop is 30% N, 50% P and 70% K and remaining will be available for subsequent crops. The major nutrient composition of various animal manures is given in the following tables. Table 2: Typical nutrient content of livestock manures (fresh weight basis)
Categories Evacuation rate Kg/day
Population (million)
Dung production (mt)
% Share in total dung produced
Cattle In-milk 6.63 35.80 86.63 25.78 Dry 6.58 22.30 53.56 15.94 Adult male 4.46 57.60 93.77 27.91 Young stock 4.43 63.10 102.03 30.37 Total 178.00 335.99 59.79 Buffalo In-milk 8.35 33.30 101.49 44.91 Dry 8.49 13.90 43.07 19.06 Adult male 6.65 6.70 16.26 7.20 Young stock 4.43 40.30 65.16 28.83 Total 94.20 225.99 40.21 Grand Total 273.00 561.98 100.00
Manure Type Dry matter (%) Total nutrient (kg/t) Nitrogen (N) Phosphate (P2O5) Potash (K2O)
Cattle 25 6.0 3.5 8.0 Pig 25 7.0 7.0 5.0 Sheep 25 6.0 2.0 3.0 Duck 25 6.5 5.5 7.5 Broiler litter 60 30 25 18
105

Winter School on “Waste recycling and resource management”-Dec. 3-23, 2014
Table 3: Sulphur and magnesium content of livestock manures (kg/t or kg/m3)
Because it contains organic matter, animal waste applied to the soil can improve soil productivity. Most nutrients that enter the plant root zone need to be converted to plant-available forms by microorganisms. The organic matter in animal waste serves as a source of energy for the soil microorganisms that both stabilize nutrient sources and make those nutrients available to crops. Organic matter in animal waste also increases the infiltration, nutrient retention, and water-holding capacity of a soil, while it reduces soil erosion. Recycling of animal wastes Recycling is a process of changing the waste materials into new products which may be used as input, also to reduce energy usage, reduce air pollution and water pollution by reducing the need for "conventional" waste disposal, and lower greenhouse gas emissions. Recycling of organic wastes such as dung, urine from domesticated animals can be done to develop value added compost which can be used as manure. Material not suitable for direct application can be better utilized by following composting and vermicomposting processes. Livestock waste can be recycled by many modern ways in order to combat rising energy prices, sustainable agricultural and reduce the environmental threats from traditional livestock waste management practices. Method of recycling Animal waste recycling is performed generally by composting. Composting has been described as a biological process for converting solid waste into a stable, humus-like product, which is used as a soil conditioner. Well composted manure has the odor of humus. Because of the heat produced during composting, well-controlled composting results in the destruction of both pathogens and weed seeds. There are two types of composting practices are generally followed. They are, i) Aerobic composting Aerobic composting is a scientific process where the duration of composting is drastically reduced by aerobic decomposition process which is performed by turning materials at particular intervals to enhance aeration. Several aerobic methods exist today. Some of them are NADEP, Vermicomposting, composting by adding effective microorganisms, etc. Biodung composting is a very interesting method, which is partially aerobic and anaerobic. This method is generally applied as a prerequisite to vermicomposting. The reason is that the biodung method can destroy parasites and pests and viable seeds of weeds etc. in farm waste due to increased thermal activity in the heap or pile. These temperatures may reach as high as 65 to 75°C. After 30 days with one
Manure Type Dry matter (%) Total S as SO3 Total Mg as MgO Cattle 25 1.8 0.7 Pig 25 1.8 0.7 Poultry layer 30 3.8 2.2 Broiler litter 60 8.3 4.2 Cattle slurry 10 1.1 1.0 Pig slurry 6 0.9 0.5
106

Winter School on “Waste recycling and resource management”-Dec. 3-23, 2014
or two turnovers of the pile the material can be used for vermicomposting. Vermicomposting utilises earthworms for the purpose of producing value added manure. ii) Anaerobic composting Anaerobic composting has been practiced in India from the past, where pits are made into which the wastes are dumped and the pit closed. On completion of six months the manure is excavated and put to use. Common composting methods
a) The Indian Bangalore Method This method of composting was developed at Bangalore in India by Acharya (1939). The method is basically recommended when night soil and refuse are used for preparing the compost. The method overcomes many of the disadvantages of the Indore method such as problem of heap protection from adverse weather, nutrient losses due to high winds / strong sun rays, frequent turning requirements, fly nuisance etc. but the time involved in production of finished compost is much longer. The method is suitable for areas with scanty rainfall. b) Indore Method This method of composting in pits involves filling of alternate layers of similar thickness as in Bangalore method. However, to ensure aerobic condition the material is turned at specific intervals for which a 60 cm strip on the longitudinal side of the pit is kept vacant. For starting the turning operation, the first turn is manually given using long handled rakes 4 to 7 days after filling. The second turn is given after 5 to 10 more days. Further turning is normally not required and the compost is ready in 2 to 4 weeks. Aerobic composting of wastes is commonly carried out in windrows. The Indore method stabilises the material in shorter time & needs lesser space. As no odourous gases are generated in this process, it is environment friendly & hence commonly preferred. Vermicomposting is basically a managed process of worms digesting organic matter to transform the material into a beneficial soil amendment. As per the USDA guidelines for compost practices (with effect from Oct 21, 2002), vermicomposts are defined as organic matter of plant and/or animal origin consisting mainly of finely-divided earthworm castings, produced non-thermophilically with biooxidation and stabilization of the organic material, due to interactions between aerobic microorganism and earthworms, as the materials pass through the earthworm gut. The process of composting crop residues / animal wastes using earthworms comprises spreading the agricultural wastes and cow dung in gradually built up shallow layers. The pits are kept shallow to avoid heat built-up that could kill earthworms. To enable earthworms to transform the material relatively faster a temperature of around 30°C is maintained. The final product generated by this process is called vermicompost which essentially consist of the casts made by earthworms eating the raw organic materials. The process consists of constructing brick lined beds generally of 0.9 to 1.5 m width and 0.25 to 0.3 m height are constructed inside a shed open from all sides. For commercial production, the beds can be prepared with 15 m length, 1.5 m width and 0.6 m height spread equally below and above the ground. While the length of the beds can be made as per convenience, the width and height cannot be increased as an increased width affects the ease of operation and an increased height
107

Winter School on “Waste recycling and resource management”-Dec. 3-23, 2014
on conversion rate due to heat built up. Cow dung and farm waste can be placed in layers to make a heap of about 0.6 to 0.9 m height. Earthworms are introduced in between the layers @ 350 worms per m3 of bed volume that weighs nearly 1 kg. The beds are maintained at about 40-50% moisture content and a temperature of 20–30° C by sprinkling water over the beds. Composting period is longer as compared to other rapid methods and varies between six weeks to twelve weeks. Management of animal wastes If used properly, animal manures are valuable source of plant nutrients. Some of the beneficial effects of manure use are:
• A source of plant available NH4+
• Increase mobility and availability of P and micronutrients due to OM complexation • Increase soil OM • Increase soil moisture retention • Improved soil structure, decreased soil bulk density and increase infiltration rate • Increase buffer capacity • Reduced Al3+ toxicity in acid soils by complexation with OM, and • Increased CO2 in the plant canopy, particularly plant stands with restricted air circulation.
Maximizing crop recovery of soil applied manure nutrients depends on: • Manure nutrient content • Application method and time, and • Short and long term availability of manure nutrients.
Manure nutrient content depends on: i. Source of Excreta - Sheep and poultry excreta are richer than those of cow, horse and pig.
Urine of cow, bullock and horse contain nil or trace amount of P2O5. ii. Food of animal - Manure from cattle fed on cereal straws and grass hay, is much less
valuable than that from animal fed on legume hays, grains and concentrates. iii. Age and condition of animal - Young and healthy animals consume more nutrients from
the fodder fed than mature. Therefore, FYM prepared from the dung of latter is richer than former.
iv. Function of animal - Animal producing milk and wool consume more nutrients from their feed than animal at rest or working. FYM prepared from milking animal having low nutrient value.
v. Manner of storage - If the cattle shed is having mud flooring, most of the N in urine lost due to leaching.
Application of recycled animal wastes in forage production Highly productive legume and forage crops use much more N than cereal crops and oilseeds. Although legumes can meet their N requirements by fixing atmospheric N they are also capable of withdrawing N from soil, manure or commercial fertilizer. As such, some legumes such as alfalfa are good recipients for manure because they are high nutrient users. Other legumes which are poor fixers of nitrogen such as dry beans (e.g. kidney bean) may also benefit from manure application. There are some potential disadvantages of fertilizing legumes with manure. For example, elevated levels of available N early in the season may inhibit nodulation and reduce N-fixing capacity. Some high yielding forage and legume crops also use more P than annual cereal
108

Winter School on “Waste recycling and resource management”-Dec. 3-23, 2014
crops and oilseeds. If soils have elevated P levels and reduction is desired, crops with high P removal rates can be added to the rotation and fertilization practices adjusted accordingly. Manure application may have to be rotated with only commercial N fertilizer to adequately reduce soil P build-up. There are number reports available supporting the application of recycled animal waste in fodder production and enhancing yield. Some of the examples are discussed here. A study conducted to find rate of composting had revealed that vermicompost either made up of 100% dung or replacement of 50% dung by sugarcane trash, subabul or banana pseudo stem and found almost similar yield per bed, similar process time and economically profitable in all combinations with 50% dung, but highest BCR was observed in 100% dung treatment (Anonymous 2011). However, the mixture of other biomass with dung slows down the process. As 100% cow dung took only 19 days to complete the cycle, it was prolonged up to 27, 40 and 70 days in case of dung replaced by 50, 70 and 100 %, respectively (Sinha et al. 2005). The treatment receiving inorganic fertilizer at the rate of 75:60 kg ha-1 produced significantly higher green fodder sorghum yield (46 t ha-1) than the rest of the treatments followed by treatment T5 (43 t ha-1) which received 50% NP and 50% Poultry Manure. The minimum (20.90 t ha-1) green fodder yield was recorded in control (Ahmad et al., 2007). An experiment was carried out to study the effect of cattle slurry on maize fodder (Zea mays) production. Maize fodder was produced at 4 cattle slurry levels T0 (0 ton/ha), T1 (10 ton/ha), T2 (12 ton/ha) and T3 (14 ton/ha). The highest biomass yield (p<0.01) of maize fodder was observed in T2 (44.0 ton/ha). Application of 12 tons of cattle slurry/ha was optimal for production of biomass and nutrient content (CP) of maize fodder (Rahman et al. 2008). Integrated nutrient management in forage based cropping systems: Sorghum + Cowpea - berseem (pooled result from 2005-06 to 2009-10)
Treatments Green fodder yield (q/ha/yr) Jhansi Jabalpur Mean
T1 - Control 502.62 (91.32)
707.7 (114.8)
605.16 (103.06)
T2 - 100%NPK 946.84 (167.94)
1518.0 (274.3)
1232.42 (221.12)
T3 - 25% through FYM+75% NPK (Inorg.) 995.3 (177.4)
1445.3 (255.3)
1220.3 (216.27)
T4 - 50% through FYM + 50% NPK (Inorg.) 1038.64 (184.18)
1446.5 (256.5)
1242.57 (220.34)
T5 - 50% NPK (Inorg.) + Biofertilizer* 812.46 (141.86)
1183.8 (204.7)
998.13 (173.28)
T6 - 25% throughFYM+50% NPK (Inorg.) + Biofertilizer
981.88 (177.26)
1300.6 (227.5)
1141.24 (202.38)
T7 - 75% NPK (Inorg.) + Biofertilizer 842.72 (151.64)
1374.4 (240.8)
1108.56 (196.22)
109

Winter School on “Waste recycling and resource management”-Dec. 3-23, 2014
Biofertlizer*: Azotobacter / Rhizobium; Figures given in parenthesis are dry matter yield (q/ha/yr) (Source: AICRP on Forage Crops, 2011)
Application of 100% recommended dose of fertilizers to the crop sequence sorghum + cowpea - berseem recorded maximum green fodder (1518q/ha/yr) and dry matter yield (274.3 q/ha/yr) which was closely followed by 50% RDF + 50% NPK through FYM at jabalpur. The absolute control recorded lowest green fodder and dry fodder yields (707.7 and 114.8 q/ha/yr) among all the treatment. At Jhansi, application of FYM 25% N + 75% NPK through inorganic fertilizers resulted in maximum green fodder (1038.64 q/ha/yr) and dry matter yield (184.18 q/ha/yr) over rest of treatments. Soil fertility as influenced by INM in forage based cropping systems: Sorghum + Cowpea - berseem (pooled result from 2005-06 to 2009-10)
Biofertlizer*: Azotobacter / Rhizobium (Source: AICRP on Forage Crops, 2011) The final fertility status after five years of sorghum + cowpea – berseem cropping sequence improved over initial status except absolute control. The organic carbon content in soil after cropping sequence had recorded highest (0.62% at Jabalpur and 0.47 at Jhansi) under INM level
Treatments Available Nutrient after harvest (Kg/ha)
Jhansi Jabalpur
OC% N P K OC% N P K
T1- Control 0.31 195.6 15.9 260.6 0.45 208.2 15.1 380.5
T2 - 100% NPK 0.39 215.7 16.5 281.3 0.58 262.3 16.5 408.5
T3- 25% through FYM + 75% NPK (Inorg.)
0.42 221.8 16.7 284.7 0.60 260.2 16.8 412.5
T4 - 50% through FYM + 50% NPK (Inorg.)
0.47 235.9 18.9 285.3 0.62 286.5 18.2 430.5
T5 - 50% NPK (Inorg.) + Biofertlizer*
0.40 220.0 16.8 278.5 0.49 250.6 16.0 405.0
T6 - 25% through FYM + 50% NPK (Inorg.) + Biofertilizer
0.43 230.7 17.4 280.5 0.58 260.4 16.8 410.5
T7 - 75% NPK (Inorg.) + Biofertilizer 0.39 218.4 17.2 279.0 0.49 252.5 16.6 406.0
Initial 0.38 212.5 16.4 277.3 0.50 227.0 16.2 395.0
110

Winter School on “Waste recycling and resource management”-Dec. 3-23, 2014
FYM 50% N + 50% NPK applied through inorganic fertilizer and lowest being with absolute control (0.45% and 0.31%, respectively) as compared to initial level (0.50% at Jabalpur and 0.38% at Jhansi). The influence of INM levels recorded enhancement in available N (10.40 to 26.21%), P (1.85 to 12.35%) and K (2.53 to 8.99%) over initial level at Jabalpur and N (2.63 to 23.68%), P (0 to 15.24%) and K (0.61 to 2.88%) over initial level at Jhansi. In another study, Chicken manure resulted in an increase in growth attributes as well as forage sorghum yield. Chicken manure (5 tons/ha) produced higher fresh and dry forage at harvest than the other treatments as shown in the following table (Ismaeil et al., 2012).
Effect of chicken manure on fresh and dry weight of forage sorghum Treatments Fresh weight Dry weight 30 days 60 days At harvest 30 days 60 days At harvest C0 3.13 7.16 9.56 1.69 2.21 3.76 C1 4.15 9.16 12.13 1.90 2.56 4.76 C2 4.95 10.13 15.03 2.72 3.18 6.13 C3 6.60 13.11 19.50 3.20 5.63 8.66 LSD 0.77 1.45 1.66 0.82 0.74 0.86 CV% 10.19 9.16 7.38 21.44 13.57 9.24 Forage production and nutrient management with addition of manure
Crops Applied FYM (t/ha)
Inorganic Fertilizer N-P-K (kg/ha)
Green Fodder Yield (t/ha)
Fodder Sorghum 10 90:30:30 (single cut) 120:60:60 (multi-cut)
35-40 45-65
Pearl millet 10 80:30:30 (single cut) (multi-cut)
35-40 55-100
Maize 12-15 80-100:40:0 30-80 Oat 15 120:40:40 (two cut)
180:60:40 (multi-cut) 40-60
Napier-Bajra hybrid 20-25 240:50:40 70-450 Guinea grass 20-25 60:50:40 (40 kg N after each cut) 60-280 Setaria grass 10-15 40:40:40 (20 kg N after each cut) 40-70 Anjan grass 5 60:20:0 - Stylo 5-8 20:40:40 20-30 Lucerne 20-25 20:60-75:40 65-100 Berseem 20 20:80:0 100-120 Source: Handbook of Agriculture (ICAR) and Forage crops and their management (2012) A study was conducted to evaluate Napier grass production using manure that was obtained from dairy cows fed on Clitoria, Mucuna and Gliricidia forage legumes as protein supplement to Napier grass or maize stover basal diets. Manure chemical composition did not manifest in Napier grass DM yield under field conditions. Manure from cows fed different basal diets and legumes supplement was equally suitable for Napier grass production (Njunie and Ali, 2012).
111

Winter School on “Waste recycling and resource management”-Dec. 3-23, 2014
Grazed forage land and pastures Pastures generally respond well to manure application because their soil N fertility is often depleted after years of grazing with little or no N supplementation. However, in contrast to mechanically harvested forage lands, crop P removal from pastures is low as the P consumed is re-deposited on the field by the grazing livestock. Soil P build-up on pasture lands should be monitored where manure is regularly applied. It may become necessary to rotate manure application with commercial N fertilizer to reduce soil P build-up or to harvest the forage mechanically on grazed fields with rising P levels. Manure Management Strategies Manure management is an important tool that strives to ensure that the balance between the beneficial and detrimental effects of land application of manure is shifted toward the benefits. Along with the increased productivity and economic gains that may be expected from manure application in agriculture, due consideration must also be given to its effects on environment quality in the short and long-term. This leads to the need for development and establishment of manure management strategies for safe and sustained utilization of manure for optimum crop production. Perception amongst society towards the material, not the least of which is issues related to odour control. Manure is also variable in its moisture content and nutrient content, which makes it difficult to determine exactly how much of a nutrient is being applied. Nonetheless, its agronomic importance as a source of plant nutrients is widely accepted. When available in close vicinity to farms, manure contributes to reducing the cost of production by enabling farmers to cut back the amount of commercial fertilizer needed on land. Schoenau et al. (2000) indicated some of the challenges in effectively using manure as a nutrient source for crop production. The challenges include:
• variability in nutrient content and form which makes it difficult to determine appropriate rates of application to meet crop nutrient requirements;
• that manure is not an "off-the-shelf " source of nutrients and may not match the crop’s relative requirement (example: manure with more phosphorus relative to nitrogen than the crop can use); and
• Low nutrient content per unit volume limits the distance to which manure can be transported economically.
The benefits of using compost for mitigating climate change As for as the methane emissions from manure in India is concerned, the data of US Environment Protection Agency (USEPA) have been taken as they have given information for many countries of the world, therefore, it would bring uniformity in estimation. It has given the methane emissions in carbon dioxide equivalent for various countries and also as projected the emission till 2020. Mitigation by means of sequestering soil carbon Composting of animal manures reduces volume, limits odours, stabilises nutrients, kills weed seeds and pathogens, and reduces volatile organic compounds. Composting of manure also induces chemical changes that affect carbon cycling processes in the soil. Composting of cattle manure for 100 days, for example, doubled the proportion of humic substances from 35% before composting to 70% at the end of composting. Overall, it can be said that carbon in manures is lost during composting and transformed into more stable carbon forms, and because of this, the
112

Winter School on “Waste recycling and resource management”-Dec. 3-23, 2014
remaining carbon is less decomposable when applied to land. Unfortunately, considerable proportions of nitrogen are also frequently lost during the composting of manures. For example, composting of feedlot cattle manure resulted in 51±9% loss of carbon, and 31±12% loss of nitrogen, while composting of poultry litter for 65 days resulted in 16% loss of carbon, and 49% loss of nitrogen. Organic farming Organic farming systems rely on high internal or external organic matter inputs, and on carbon and nutrient cycling for maintaining soil quality and productivity. Although it can be assumed that composted organic residues are often used in organic farming systems, reported carbon sequestration, changes in nitrous oxide emissions, and the overall potential for organic farming to reduce GHG emissions are by no means due to compost use alone, but a wide range of farm management practices. Conclusion Animal waste is an alternative to commercial fertilizer after recycling that can be integrated into most cropping systems. Forage crops, particularly forage maize, provide an opportunity to apply manures prior to drilling in late spring but they must not be regarded as a convenient ‘dumping ground’ for large amounts of slurry, FYM and compost. Although maize can apparently tolerate heavy applications of manures, without adverse effects on the crop, nutrient losses via surface runoff and leaching are likely to occur. For forage crops, as with other crops, manures should be applied with the aim of balancing nutrient supply and demand, topping up with inorganic fertiliser as necessary. References Beauchamp, E.G. 1983. Response of corn to nitrogen in preplant and sidedress applications of liquid dairy cattle manure. Can. J. Soil Sci. 63:377-386. Chang, C., T.G. Sommerfeldt, and T. Entz. 1991. Soil chemistry after eleven annual applications of cattle feedlot manure. J. Environ. Qual. 20: 475-480. Dormaar, J.F., and C. Chang. 1995. Effect of 20 annual applications of excess feedlot manure on labile soil phosphorus. Can. J. Soil Sci. 75:507-512. Egrinya, E.A., S. Yamamoto, and T. Honna. 2001. Rice growth and nutrient uptake as affected by livestock manure in four Japanese soils. J. Plant Nutr. 24 (2): 333-343. Olson, B.M., E.R. Bennett, R.H.McKenzie, T. Ormann, and R.P. Atkins. 1998.Manure nutrient management to sustain ground water quality near feedlots. CAESA. Schoenau, J.J., K. Bolton, and K. Panchuk. 2000. Managing Manure as a Fertilizer. Farm Facts. Saskatchewan Agriculture and Food. ISSN 0840-9447. Sunil Kumar, Agrawal RK, Dixit AK, Rai AK, Singh JB and Rai SK 2012. Forage production Technology for Arable Lands. Indian Grassland and Fodder Research Institute, Jhansi-284003
113

Winter School on “Waste recycling and resource management”-Dec. 3-23, 2014
White, R.K., and Safley, Jr. L. M. 1984. Optimum Utilization of Manure. Transactions of the ASAE. Special Edition. pp. 520-524.
K. Jayathilakan & Khudsia Sultana & K. Radhakrishna & A. S. Bawa. Utilization of byproducts and waste materials from meat, poultry and fish processing industries: a review. J Food Sci Technol (May–June 2012) 49(3):278–293.
http://www.icar.org.in/files/forage-and-grasses.pdf
Njunie and Ali, 2012. Effects of dairy cattle diet on quality of manure and fodder production. In 11th KARI Biennial scientific conference, 10-14 November 2008, KARI, Mtwapa, Kenya. Azraf-ul-Haq Ahmad, Imran Qadir and Naeem Mahmood. 2007. Effect of integrated use of organic and inorganic Fertilizers on fodder yield of sorghum (Sorghum bicolor l.). Pak. J. Agri. Sci., Vol. 44(3):415-421. S. M. E. Rahman, M. A. Islam, M. M. Rahman and Deog-Hwan Oh (2008) Effect of Cattle Slurry on Growth, Biomass Yield and Chemical Composition of Maize Fodder. Asian-Aust. J. Anim. Sci. 21(11):1592-1598.
114

Winter School on “Waste recycling and resource management”-Dec. 3-23, 2014
Assessment of Crop Quality: Analytical Technique
A.B. Singh
Indian Institute of Soil Science, Bhopal Introduction
Quality parameters of food grains/seeds, fruits and vegetables are generally controlled genetically but agricultural practices, like use of fertilizers, irrigation, tillage operations, climatic conditions and soil conditions during the growing season, weather conditions at harvest and harvesting techniques influence the produce quality. Quality of the agricultural produce, particularly fruits and vegetables improves when the nutrients are supplied through organic manures than in the form of fertilizers. This is because of the supply of the all the growth principles substances like enzymes, hormones, growth regulators etc., besides, all the essential plant nutrients from the organic manures. As a result, the metabolic function get regulated more effectively resulting in better synthesis of proximate constituents and consequent improvement in the produce quality.
Healthy soils equal healthy food equals healthy people is a fundamental tenet of many ecological farming systems. A clear understanding of the relationships between farming systems and crop nutritional quality is very important for designing agricultural management strategies which enhance environmental quality and sustainability while improving consumer’s health. It is well known fact that fertilizers and organic manures are not substitute for each other however, their role is complementary. The accurate measurement of quality is essential for meeting both regulatory requirements and the consumers need. Growers often enquire for data on the nutritional quality of organic food (grains, fruits, vegetables) to that of conventionally raised food.
According to Soil Association in England the six Aspects of Food Quality are:
Sensual: how good it feels to eat. Taste, smell, texture, look, feel; that wonderful blend of sensations when you bite into a freshly picked apple.
Authenticity: the food which consumers expect. Food which has not been synthesized or adulterated in production, processing or storage. Bread, where the browness is real, not an added ingredient to white bread.
Functional: how appropriate food is to its specific purpose. For example, the way different varieties of potatoes are more or less suitable for boiling, baking, roasting or frying.
Nutritional: how it contributes to a balanced diet. Recognizing individual food’s value by the vitamins, protein or trace elements present.
115
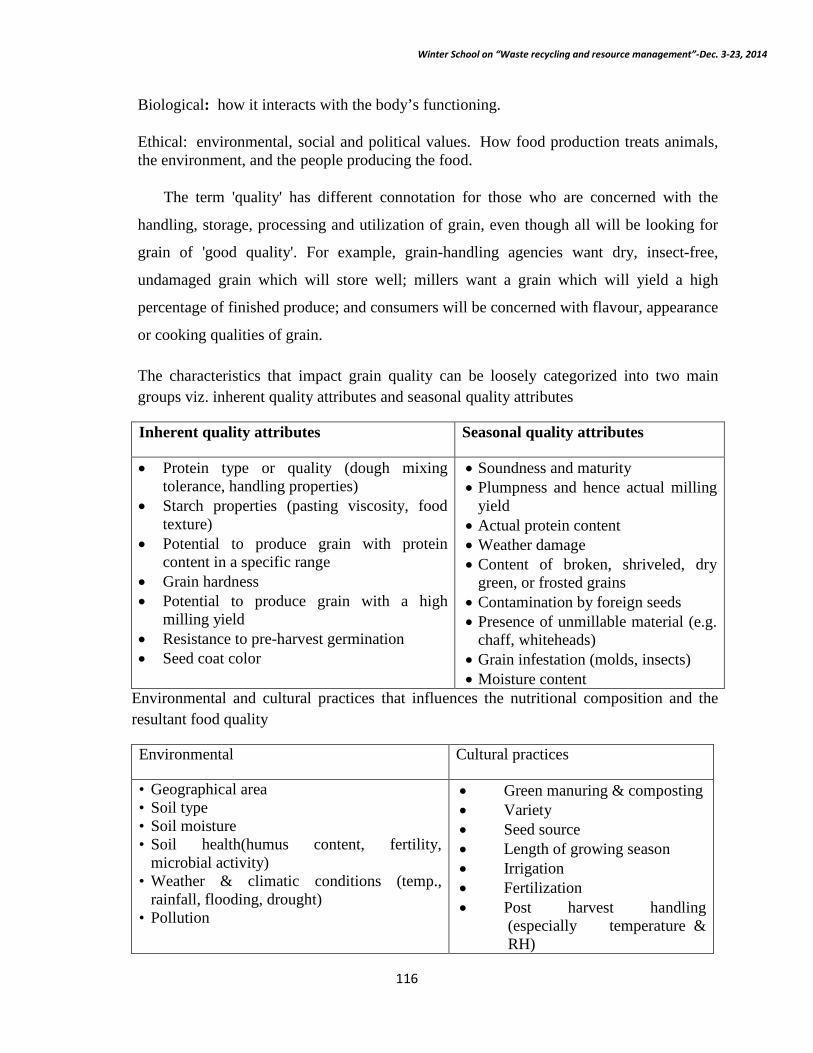
Winter School on “Waste recycling and resource management”-Dec. 3-23, 2014
Biological: how it interacts with the body’s functioning.
Ethical: environmental, social and political values. How food production treats animals, the environment, and the people producing the food.
The term 'quality' has different connotation for those who are concerned with the
handling, storage, processing and utilization of grain, even though all will be looking for
grain of 'good quality'. For example, grain-handling agencies want dry, insect-free,
undamaged grain which will store well; millers want a grain which will yield a high
percentage of finished produce; and consumers will be concerned with flavour, appearance
or cooking qualities of grain.
The characteristics that impact grain quality can be loosely categorized into two main groups viz. inherent quality attributes and seasonal quality attributes
Inherent quality attributes Seasonal quality attributes
• Protein type or quality (dough mixing tolerance, handling properties)
• Starch properties (pasting viscosity, food texture)
• Potential to produce grain with protein content in a specific range
• Grain hardness • Potential to produce grain with a high
milling yield • Resistance to pre-harvest germination • Seed coat color
• Soundness and maturity • Plumpness and hence actual milling
yield • Actual protein content • Weather damage • Content of broken, shriveled, dry
green, or frosted grains • Contamination by foreign seeds • Presence of unmillable material (e.g.
chaff, whiteheads) • Grain infestation (molds, insects) • Moisture content
Environmental and cultural practices that influences the nutritional composition and the resultant food quality
Environmental Cultural practices
• Geographical area • Soil type • Soil moisture • Soil health(humus content, fertility,
microbial activity) • Weather & climatic conditions (temp.,
rainfall, flooding, drought) • Pollution
• Green manuring & composting • Variety • Seed source • Length of growing season • Irrigation • Fertilization • Post harvest handling
(especially temperature & RH)
116

Winter School on “Waste recycling and resource management”-Dec. 3-23, 2014
A report appeared in Agricultural Outlook 2003, showed that there is change in the
consumption pattern of consumers over the years. Consider quality more than the price and
sweetness, freshness and price are in the order. Fruits with high sugar content are much
appreciated in the market.
Table 1: Consideration factors of consumers in purchasing fruits
Year Sweet- ness
Fresh-ness
Price
Safety
Place of origin
size
Colour Shape
Nutrition
1993
29.0
27.2
26.5
10.0
-
2.4
1.2
0.3
3.5
2003 47.3
28.6
15.1 2.61 1.8 1.6 1.5 0.9 5.5
Agricultural outlook (2003)
There are various methods/ techniques for determining quality of grains/seed. It can be broadly classified as destructive or non-destructive depending on the type of quality test. They can also be classified as physical, chemical and biochemical methods.
Physical method:
1. Grain appearance: Attributes of interest to the consumers are visual appearance, size, shape and color. Bold grain with attractive color, shape and luster fetch higher price in the market. Portable mini spectrometers are used to measure the colour of fruits and vegetables. Other equipments used are penetrometer (measures firmness), texture analyser (texture), callipers (size) etc.
2. Vitreous kernel: It is often related to hardness of the grain, which in turn is a rough index of protein and gluten content in the grain. Using X ray film, viewer can check the vitreousness in the grain and video densitometry can also be used.
3. Sieves are used for the assessment of foreign matter from the grain. Damaged and infected kernel and foreign matter affect the overall quality of product.
4. Test weight: It contributes to milling quality of wheat. Grain weight considered being a function of grain size and its density while test weight determines the plumpness of the grain. Electronic counter is used to measure test weight i.e. weight of 1000 grains.
117

Winter School on “Waste recycling and resource management”-Dec. 3-23, 2014
5. Hardness: Hardness of grain mainly contributes to the quantity of flour. Hard grain gives
more flour than the soft grain. In case of wheat, the flour derived from hard grain absorbs more water than soft one which influences crumb softness and shelf life of the product. Wheat hardness Index can be calculated by using barbender hardness tester. Near infrared reflectance (NIR) is extensively used in U.K. for testing the hardness of grain.
6. Moisture content: The standard test method (ISO 712) for the determination of moisture content in cereals is by moisture loss in a hot-air oven.
7. Bulk density: The bulk density of grain is the weight per unit volume. Moisture content and presence of foreign matter has an appreciable effect on the bulk density. Consequently it is standard practice to remove as much foreign matter as possible by sieving samples before carrying out bulk density determinations.
8. Ash content: High ash content (>0.4 %) in flour adversely affects the quality of end product. It can be determined by heating the sample in Muffle furnace with temperature regulator up to temperature 500 0C – 550 0C.
Chemical and biochemical Methods
carbohydrate, proteins, fats/lipids, vitamins, antioxidants, anti- nutrients and pigments are important constituents of quality parameters of grain/ seeds.
Carbohydrates
The quality of carbohydrate in food is measured based on glycemic index (GI). GI of
food is a ranking of foods based on their immediate effect on blood glucose (blood sugar) levels.
Choosing low GI carbs - the ones that produce only small fluctuations in our blood glucose and
insulin levels - is the secret to long-term health reducing risk of heart disease and diabetes and is
the key to sustainable weight loss. Carbohydrate in food that breakdown quickly during digestion
have the highest GI e.g. Fructose 23, Glucose 100, Honey 58, Lactose 46, Maltose 100
and Sucrose 65, amongst the above sugars fructose with low GI is the best sugar.
Table 2: Glycemic index (GI) of grains, fruits and vegetables
Food GI Food GI
Cereals Vegetables
Basmati Rice 58 Beets 69
118

Winter School on “Waste recycling and resource management”-Dec. 3-23, 2014
Brown Rice 55 Cabbage 10
Long grain white rice 56 Carrots 49
Short grain white rice 72 Onions 10
Fruits Pumpkin 75
Banana 55 Beans
Cherries 22 Broad beans 79
Grapes 46 Chick peas 33
Mango 55 Red kidney beans 27
Papaya 58 Soya beans 18
Pine apple 66 White beans 31
Water melon 103 Broccoli 10
Apple 38 Lettuce 10
Orange 44 Green peas 48
Kiwi 52 Sweet potato 54
Amongst the rice brown rice followed by basmati is best for consumption. Cherries have low GI value while it is highest in watermelon. Onions, lettuce, broccoli have lower GI.
Proteins
Protein content in foods vary according to their origin, their amino acid composition (particularly content of essential amino acids), their digestibility, texture, etc. Good quality proteins are those that are readily digestible and contain the essential amino acids in quantities that correspond to human requirements. Protein quality can be assessed by following methods:
• Protein Digestibility Corrected Amino Acid Score (PDCAAS): is a method of evaluating protein quality based on the amino acid requirement of the humans being.
• Biological value (BV): is a measure of the proportion of absorbed protein from a food which becomes incorporated into the proteins of the organism’s body.
119

Winter School on “Waste recycling and resource management”-Dec. 3-23, 2014
• Protein efficiency ratio(PER): is based on the weight gain of a test subject divided by its
intake of a particular food protein during test period. PER= gain in body mass (g)/ protein intake (g)
N absorbed
TD (True digestibility) = ×100
N intake
N retained
BV (Biological value) = ×100
N absorbed
TD × BV
NPU (Net protein utilization) =
100
NPU × protein %
UP (Utilizable protein) =
100
BV = 102 -0.6348 x
x= % methionine defficiency in to samples with reference to whole egg protein
x = 100- % chemical score
methionine (g/16 g N) ×100
% Chemical score =
3.36 (egg methionine g/16g N)
For tryptophan 4.0 and cysteine 2.24 g/16 g N (Block and Mitchell (1946).
120

Winter School on “Waste recycling and resource management”-Dec. 3-23, 2014
Protein estimation can be determined by estimating nitrogen content in the sample by
following the method of A.O.A.C. (1970). The protein content in the composts will be calculated by multiplying the nitrogen content with factor 6.25.
Principle:
A known quantity of the samples is digested with concentrated sulphuric acid to convert the organic form of nitrogen in to ammonium sulphate, which is then distilled with excess of alkali and the ammonia liberated is collected in known volume of standard acid. The uncreated acid is back titrated with a standard alkali (NaOH).
Reagents:
(i) Copper sulpahate
(ii) Concentrated sulphuric acid
(iii) Potassium sulphate
(iv) 40% Sodium hydroxide
(v) 0.1 N Sulphuric acid
(vi) 0.1 N Potassium hydroxide and
(vii) Methyl red indicator
Procedure:
Take one gram of the vermicompost or vermiwash in a Kjeldahl flask. Add 0.5g digestion
mixture (potassium sulphate+copper sulphate in the 9:1 ratio and 30 ml of concentrated
sulphuric acid. Digest the contents over a heater till a light sea greenish colour is obtained.
Transfer the cooled and diluted digested extract by repeated washing into a distillation
flask. Add 20 ml of 40% sodium hydroxide in the distillation flask. Distill the contents by
heating the flask and collect the distillate in 0.1 N sulphuric acid (methyl red indicator added)
kept at the end of the distillation flask.
Collected distillate in the conical flask will be titrated with 0.1 N sodium hydroxide. The end point is the change of colour from pink red to straw yellow.
Observation and Calculation:
Percentage of nitrogen = V × N × Me × W-1 × 100
Where,
121

Winter School on “Waste recycling and resource management”-Dec. 3-23, 2014
V = Volume of sulphuric acid actually consumed (ml)
N = Normality of sulphuric acid
Me = Milli equivalent weight of Nitrogen i.e. (0.014g)
W : Weight of the sample taken
Percentage of crude protein = N % × 6.25
Fats/lipids
Fatty acid composition depends on the sources of the oils. Oils with high unsaturated fatty acids are best for consumption. The unsaturated to saturated fatty acid ratio was The highest in safflower oil followed by sunflower oil. It was the least in coconut oil. • Temperature : higher linoleic : Oleic in sunflower at low temperature during rabi • Light: higher linoleic : Oleic in rapeseed under low light • Fertilizer: Cotton seed oil, acid saponification and iodine values decreased with
increased nitrogen There are many indispensable vitamins, which we mainly get from grains/seeds. Thus
estimation of vitamins is very important to know the nutritional value of particular grain/seeds Estimation of total Ash
Take a known weight of the oven-dried sample in a freshly ignited, cooled and free
weighed silica crucible. Then heat it first on a burner at a low flame and when the
substance burned, transfer it in to the muffle furnace and heat upto the temperature
(450-550ºC) till a white ash is obtained. Then after cooling the crucible kept in a
dessicator, and recorded the weight and calculate the percentage of ash in the sample on
oven dry basis:
W -W1
Percentage of Ash = x100
W2
Where W = weight of samples + crucible
W1 = weight of Ash +crucible
W2 = weight of sample
122

Winter School on “Waste recycling and resource management”-Dec. 3-23, 2014
Total amino acids:
Amino-acids are colorless ionic compounds that forms the basic building block of
proteins. Amino-acids are analysed by adopting the procedure as described by Moore and
Stein (1948). Some important essential amino-acids can be analyzed by following the
methods for estimation of Tryptophan (Spies and Chamber, 1949), Methionine (Horn et al,,
1946), Cysteine and Cystine (Leach, 1966), Proline (Bates et al, 1973) and Lysine (Felker
et al 1978).
Principal:
Ninhydrin is a powerful oxidizing against, decarboxylates the alpha amino acids and yield
bluish purple coloured product, which is colorimetrically measured at 570 nm.
Regents:
(i) Ninhydrin: dissolve 0.8 g stannous chloride (Sncl2 2H2O) in 500 ml of 0.2 M citrate
buffer (pH 5.0). Add this solution to 20g of ninhydrin in 500ml of methyl solution (2
methoxy ethanol).
(ii) 0.2M citrate buffer.
(iii) Diluent solvent: mix equal values of water and n-phopanol.
(iv) Arsenomolybdate Colour Reagent: 25 g of ammonium molybdate will be dissolved in
450 ml of distilled water and 21 ml of concentrated sulphuric acid will be add to it and
mixed. An aqueous solution of sodium arsenate will add and mixed with the above
solution and subsequently placed in an incubator for 48 hours at 37oC.
(v) Copper Carbonate- Tartarate (Somogyi’s Reagent): 24 g anhydrous sodium carbonate
and 12 g of Rochelle salt will be dissolved in 250 ml of distilled water. Then 40 ml of
10% solution of copper sulphate may add to the above solution with stirring. This will
followed by the addition of 16 g of sodium bicarbonate. In another beaker, 18 g of
sodium sulphate will be dissolved in 500 ml of hot water and boil to expel air. After
cooling both these solution will be mixed and diluted to make the 1000 ml.
123
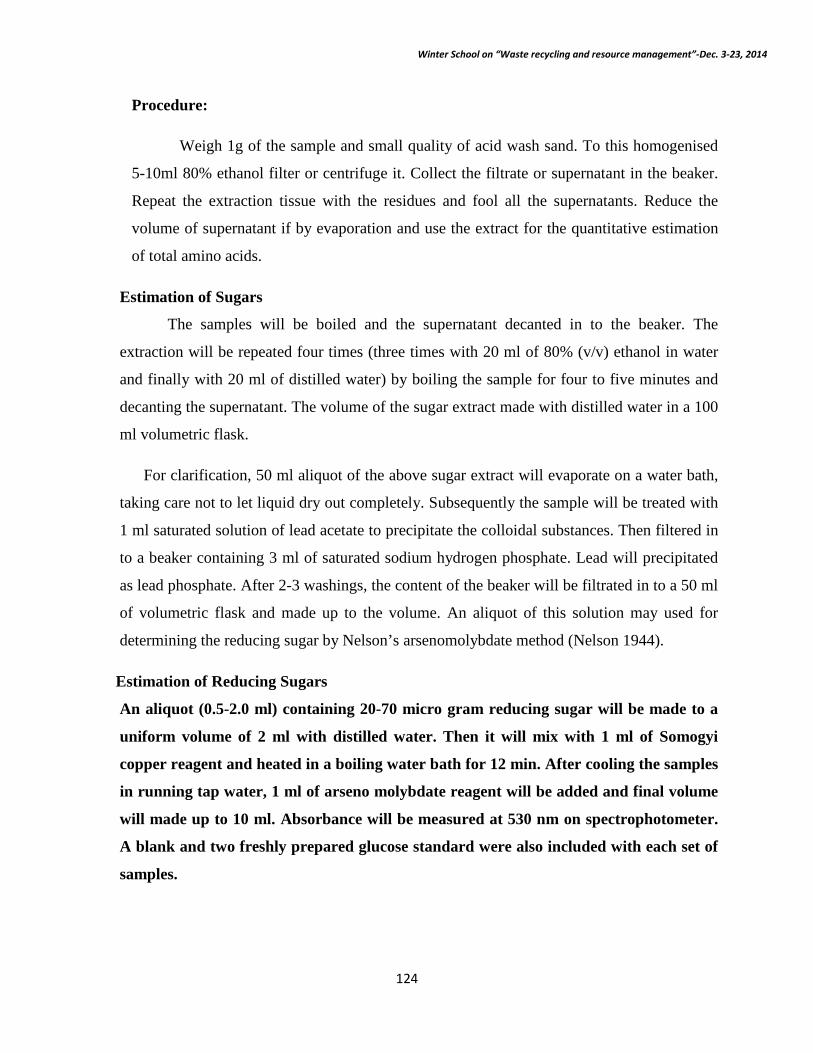
Winter School on “Waste recycling and resource management”-Dec. 3-23, 2014
Procedure:
Weigh 1g of the sample and small quality of acid wash sand. To this homogenised
5-10ml 80% ethanol filter or centrifuge it. Collect the filtrate or supernatant in the beaker.
Repeat the extraction tissue with the residues and fool all the supernatants. Reduce the
volume of supernatant if by evaporation and use the extract for the quantitative estimation
of total amino acids.
Estimation of Sugars
The samples will be boiled and the supernatant decanted in to the beaker. The
extraction will be repeated four times (three times with 20 ml of 80% (v/v) ethanol in water
and finally with 20 ml of distilled water) by boiling the sample for four to five minutes and
decanting the supernatant. The volume of the sugar extract made with distilled water in a 100
ml volumetric flask.
For clarification, 50 ml aliquot of the above sugar extract will evaporate on a water bath,
taking care not to let liquid dry out completely. Subsequently the sample will be treated with
1 ml saturated solution of lead acetate to precipitate the colloidal substances. Then filtered in
to a beaker containing 3 ml of saturated sodium hydrogen phosphate. Lead will precipitated
as lead phosphate. After 2-3 washings, the content of the beaker will be filtrated in to a 50 ml
of volumetric flask and made up to the volume. An aliquot of this solution may used for
determining the reducing sugar by Nelson’s arsenomolybdate method (Nelson 1944).
Estimation of Reducing Sugars
An aliquot (0.5-2.0 ml) containing 20-70 micro gram reducing sugar will be made to a
uniform volume of 2 ml with distilled water. Then it will mix with 1 ml of Somogyi
copper reagent and heated in a boiling water bath for 12 min. After cooling the samples
in running tap water, 1 ml of arseno molybdate reagent will be added and final volume
will made up to 10 ml. Absorbance will be measured at 530 nm on spectrophotometer.
A blank and two freshly prepared glucose standard were also included with each set of
samples.
124

Winter School on “Waste recycling and resource management”-Dec. 3-23, 2014
Estimation of Total Sugars
5 ml of extract will hydrolysed by boiling with half volume of 0.5 N HCl for 30 minutes
in a water bath and later neutralized to slightly acidic side with NaOH and made the volume
up to 10 ml. The solution will be used for the determination of total sugars. An aliquot of this
will analyzed for sugars as described by Dubois et al (1956).
Total phenol
Total phenol content in compost can be analysed by following the procedure as
described by Bray and Thorpe (1954). Take 0.5 to 1.0 g sample in a centrifuge tube. Add 10
ml of 80% ethanol in centrifuged tube, then the material will centrifuged for 20 minutes at
10,000 rpm. Supernatant will be collected and again extracted with 5 ml, 80% ethanol. This
will carry out for five times. The supernatant will evaporated to dryness on a water bath. The
residue will dissolve with a known volume of distilled water. Then 0.2 to 2 ml of aliquot will
pipette out in the test tube. The volume will made- up to 3 ml with distilled water. Then 0.5
ml phenol reagent will be added. After 3 minutes, 2 ml of 20% Na2Co3 mix thoroughly and
then tubes will kept on boiling water bath for one minute and then cool it and record the optical
density at 650 nm on spectrophotometer.
Nutritional aspects of produce quality
The quality of harvested crop can be categorized according to the purpose for which the crop was produced.
Nutritive value: The content and composition of constituents are used as criteria. Processing quality: It is determined the appearance of the produce and the content of
certainconstituents, which positively affect recoverability. Marketability: It consists mainly of organoleptic as well as visible characteristics e.g.
shape, taste, colour etc. Transportability/storability: It is closely related to marketability of the produce. Conclusions:
Understanding how environment, crop management and other factors particularly soil
fertility influence the composition and quality of food crops is necessary for the production of
high quality nutritious foods. Healthy soils equals’ healthy food equals healthy people” is a
fundamental tenet of many ecological farming systems. It would be useful to study the quality
125

Winter School on “Waste recycling and resource management”-Dec. 3-23, 2014
index of variety of field crops, fruits and vegetables in relation to balance nutrition and economic
upliftment of the farmers.
Reference
A.O. A.C. (1970). Official methods of the analysis of the association of official Agricultural Chamists, Washington, D.C.
Bates L S, Waldren R P and Leare L D (1973). Rapid determination of free proline for water stress studies. Plant Soil 39: 205-208.
Bray, H.G. and Thorpe, W.V. (1954). Analysis of phenolic compounds of interest in metabolism. Methods of Biochemical Analysis. 1: 27-52.
Block R J and Mitchell H H (1946). The correlation of amino-acid composition of protein with their value. Nut. Review. 16: 249.
Dubois M, Gilles K AHamilton J R Pebers P A and Smith F C (1956). Anal. Chem, 28: 350.
Felker P, Labnauskas K and Wainev G (1978). Crop Science 18 (3): 489-490.
Horn J M, Jones D B and Blum A S (1946). Colourimetric determination of methionine in
protein and foods. J. Biol. Chem. 116: 313.
Leach S J (1966). A Laboratory manual of analytical method of protein chemistry (P. Alexander and H P Lundgram Eds), Pergamen Press, Oxford 4:1
Moore, S. and Stein, W.H. (1948). In: methods in enzymology (eds. Colowick, S.P. and Kaplan, N.D.). Academic Press New York - 3468.
Nelson, N. (1944). A photometric adaptation of the somyogi method of determination of glucose. J. Biol. Chem, 243: 6281-6283.
Spies J T and Chamber D C (1949). Chemical determination of tryptophan in proteins. Analy. Chem. 21:1249.
126

Winter School on “Waste recycling and resource management”-Dec. 3-23, 2014
Organic Manure in Integrated Nutrient Management for Enhancing Productivity and
Nutrient use Efficiencies in Different Cropping Systems
MUNESHWAR SINGH
Indian Institute of Soil Science, Bhopal
Abstract: The research carried out in the country proved that with out using the chemical fertilizer we can’t keep the pace in productivity to meet the demand of the people of this country. However, increasing use of fertilizer especially nitrogenous is becoming important to consider the fertilizer induced groundwater pollution in heavily fertilized area. To reduce the risk of pollution, increase in the nutrient efficiency (NUE) and the productivity is most suited alternatives. Integrated nutrient management is one of the most appropriate options for sustaining the productivity and reducing the nutrient losses by increasing the nutrient use efficiency. The reports indicated that integrated nutrient management (INM) improved the nutrient use efficiency in addition to productivity irrespective of cropping system and the soil. The INM practice becomes more important in the soil having low buffering capacity like Afisols. In Alfisols even balanced use of NPK along with lime increased the nutrient use efficiency to great extent and minimized the possibility of losses of nitrogen from the system which other wise would have been lost from the system either through leaching or surface runoff and would have polluted the groundwater and surface water bodies.
With the introduction of high yielding varieties and use of high analysis fertilizer in intensified agriculture under irrigation condition resulted in green revolution in our country. But continuous use of chemical fertilizer in indiscriminate manner without assessing soil also had adverse affect on productivity and environment. Though use of high analysis fertilizer ensured the high production but also resulted in acceleration of mining of native sources of nutrient. This has led to appearance of hidden hunger of several other essential nutrients and sustainability of our agriculture has become venerable. High analysis fertilizer (NPK) resulted in deficiency of Zn and S, in Indo-Gangatic Plain (IGP) and caused decline in productivity. The ever increasing population and shrinking natural resources (land and water) are building pressure on us to produce more and more from a unit quantity in a unit time. The pressure on natural resources in Indian context could be assessed from the fact that it supports 18 percent of human and over 15 percent of live stock of the world from 2.3 percent of world’s geographical area. The over stressing on natural resources by disproportionate human and live stock populations led to non sustainability of many agro-systems. Therefore, it has become essential not only to sustain our agro-system but also to keep the pace of acceleration with increasing demand of food and fiber.
127
Winter School on “Waste recycling and resource management”-Dec. 3-23, 2014
Under present scenario it is beyond imagination to sustain the productivity without
fertilizer input. But due to over mining of the nutrient, Indian soils are working with negative nutrient balance to the tune of 12-14 m tons yr-1 and the negative balance is likely to increase in future even after using the full potential of fertilizer industry. The increase in nutrient efficiency not only would help in reducing the negative nutrient balance but also curtail the input cost and acts as key to safe ground the environmental. The nutrients use efficiency (NUE) and productivity goes hand in hand compliments each other. Under this situation integrated nutrient management not only reduce the nutrient gap between addition and removal but also ensures the higher nutrient use efficiency, sustainability of the system and minimize the environmental pollution. In this paper, attempts is made to have an over view of integrated nutrient management on productivity and nutrient use efficiency.
What is Integrated Plant Nutrient Supply System (IPNS)
The survey of literature revealed that to convey the meanings of integrated plant nutrient different terms are beings used. Integrated plants nutrient supply system (IPNS), integrated nutrient management (INM), balance nutrient etc. The basic principal of IPNS is based on nutrient supply through different sources FYM, crop residue, organic manure and fertilizer to plant for sustaining the productivity. To define IPNS number workers attempted taking into account, productivity, maintaining living organism and social economic environment.
1. IPNS is defined as maintenance or adjustment of soil fertility and of plant nutrient supply to an optimum level for sustaining the desired crop productivity through optimization of benefit from all possible resources of plant nutrient in an integrated manner (Roy and Ange, 1991).
2. Integrated Plant Nutrition System (IPNS): IPNS is used to maintain or adjust soil fertility and plant nutrient supply to achieve a given level of crop production. This is done by optimizing the benefits from all possible sources of plant nutrient (FAO, 1998).
3. Integrated Nutrient Management (INM): INM it actually the technical and managerial component of achieving the objective of IPNS under farm situations. It takes into account of all factors of soil and crop management including management of all other inputs such as water, agrochemicals amendment etc besides nutrients (Goswami, 1998).
I. Potential Source of Organic Material
The annual potential of organic resources in the country available for use through excreta of live stock and human, crop residue, and sewage sludge, municipal waste etc is estimated to be around 20 m tons currently expected to be around 28 m tons together N, P2O5 and K2O exclusive
128

Winter School on “Waste recycling and resource management”-Dec. 3-23, 2014
of micronutrient (Bhardwaj and Gaur 1985). In addition to this following source are also available.
a. Organic Manure: Organic manures like FYM and composts are the important component of IPNS and should be assessed for the quantity available. According to one estimate nearly 800 m tons of organic manure available which comes out tube 2.5 t ha-1 yr-1 on an average if spread over 329 mha-1 geographical area of the country. The cattle and waste from house and cattle sheds are major components of the FYM and compost. But a major portion of cattle dung is used as domestic fuel and crop residue for cattle feed. Survey conducted by IISS indicated more than half (52%) cow dung is used for making dung cake for fuel purpose and the remaining is used for making compost (Dalal et al., 2003).
b. Press mud: Sugarcane industry is the main sources of press mud which contains 1-0-2.5% N, 0.25 to 0.65% P and 0.4 to 0.85% K but being acidic in nature and can be applied to alkaline soils. However, other type of press mud which is obtained from carbonation process contains lime and can be used in acidic soils. Nearly 2.7 m tons press mud is produced every year in our country.
c. Green Manure and BGA: Green manure is a good source of biologically fixed N and organic carbon. Several green manure crops are grown in our country sesbania, crotalaria juncea, tephorosea purpussa and sunhemp etc. A 40-45 days old crop can supply 100-125 kg N which is almost equal to average N applied in Indian agriculture. However, green manure is suited for rice based system. But practicing of green manure is restricted to a limited area where water is available during summer season like Kerala and North East part of the country. In North though water is available but farmer prefer to grow summer mung rather than growing green manure crop. In addition to green manure crop, growing of legume trees on bund or outside the field for the purpose of green manure is also practiced in pocket. Blue green algae (BGA) are also component of INM which is practiced in rice based cropping system. BGA is being practiced in Eastern and North Eastern part of the country.
d. Legume Residue: As discussed in previous section in North Western part of the country short duration summer mung is grown in between rice-wheat during fallow period. After harvesting pod, the C residue is incorporated which save 60 kg N (Rekhi and Meelu, 1983) and (Singh and Dwivedi, 1996).
129

Winter School on “Waste recycling and resource management”-Dec. 3-23, 2014
II. Integrated Nutrient Management and Productivity of the System
Since ages Indian farmers are firm believers of INM and were using all possible sources of nutrient including pond silt and earth scraping of fig tree in addition to FYM. The introduction of chemicals fertilizer had break on use of organic manure for a short period but increasing cost of fertilizer farmer again started using organic manure to supplement the nutrient and to reduce dependence on chemical fertilizer. A large volume of work scanned and package of INM made available for different agro-system. (IISS Bulletin No. 2, 1998). Enhancing the productivity is prime objective and priority of Indian agriculture to feed the ever growing population from shrinking natural resources. Inclusion of various components to supply the nutrient under INM depends on cropping system and availability of resources in a particular location. To study the input of INM productivity and NUE requires long term fertilizer experiment. Productivity and NUE are directly related to each other, therefore impact of INM on productivity is essential before assessing NUE. Long -term studies give an opportunity to evaluate the impact of INM on productivity of the system.
a. Rice- Wheat: Rice-wheat is most predominant cropping system of the country and contributes major portion of food basket. The yield data (Table 1) of Pantnagar (Mollisols), Barrackpore (Inceptisols) and Raipur (Vertisols) indicated that integration of nutrients resulted increase in productivity of the system at all the three places and incorporation FYM further enhanced the productivity. At Pantnagar application of 100% N alone for 34 years, average yields of rice and wheat recorded were 4780 and 3115 Kg ha-1. Integration of P with N and K with NP resulted in increase in yield of rice to 4865 and 5095 Kg ha-1 and of wheat to 3779 and 3794 Kg ha-1 respectively. Incorporation of FYM with NP K further increased productivity of rice and wheat to 5788 and 4497 Kg ha-1 respectively. The similar trend in yield on integration of nutrient was also noted at other two locations differing level of magnitude in productivity because of climatic condition. Increase in yield on incorporation of FYM is not only due to additional supply of major nutrients but also ruled out the hidden hunger of Zn and secondary nutrient at many places. Moreover, organic manure also helped in turnover process of nutrients in soil which is responsible for nutrient transformation in soil.
To evaluate the INM practice on productivity of rice and wheat number of trials were conducted through out the country under AICRP Agronomy. The data summarized in table2 indicated that combined use of fertilizer and organic manure (FYM) result in larger productivity of the system with residual effect on subsequent wheat crop (Singh and Singh 1998). Eight years study on integrated nutrient management in rice-wheat in Vertisols (Singh et al., 2001) at Jabalpur revealed that conjunctive use of 5t FYM and 6 t green manure (Parthenium) with 90 kg N not only sustained the productivity but also saved nearly 90-100kg ha-1 fertilizer N annually. In additional to saving of nitrogen INM practices also improved the SOC and nutrient status of soil (Table-3).
130
Winter School on “Waste recycling and resource management”-Dec. 3-23, 2014
b. Soybean Wheat: Soybean-wheat is predominant cropping system of MP and becoming popular in Rajasthan and Maharastra. Thirty five years data summarized in table 4 clearly indicated that integration of N, P and K sustained the yield at a higher level compared to application of N and NP. However, the maximum average productivity is recorded with conjunctive use of NPK and FYM. The impact of INM on productivity scenario recorded at Ranchi (Alfisols) is different. Continuous application of N alone compared to control indicates that N has adverse effect on productivity. Integration of P and PK with N resulted increase in yield of soybean from 296 Kg ha-1 (100% N alone) to 861 and 1496 Kg ha-1 respectively and the corresponding yields of wheat recorded were 1049 (100% N) 2432 Kg ha-1 and 2789 Kg ha-1. (Table 4) It is interesting to note that integration of NPK with FYM further increased the yield of both soybean and wheat. At Ranchi use of lime as a component of INM also improved the productivity significantly. Thus big jump in yield indicates that integrated nutrient management becomes more important in soils which have poor buffering capacity.
Seven years study on soybean-wheat at IISS farm also demonstrated that integration of nutrient (FYM and fertilizer) sustained the yield at larger level compared to sole application of either organic or fertilizer ( Rao et. al. 1998). Similarly, trials conducted at farmers’ field of Sehore and Bhopal districts for three years (Table 5) further confirmed that integration nutrient management is best option as for as productivity and profit of the farmers are concerned (Singh et., al 2008).
c. Maize-Wheat: Maize-wheat is another important cropping system of North-West India. The yield data of 36 years old maize-wheat cropping system at Ludhiana and 10 years old experiment at Udaipur and Delhi indicated that integration of P and K with N enhanced the productivity of the cropping system. Integration of P with N resulted increase in yield of maize from 1771 Kg ha-1 (N alone) to 2209 and wheat from 2932 Kg ha-1 to 4108 Kg ha-1 At Ludhiana. Addition K and incorporation of FYM further enhanced the productivity (Table 6). At Palampur (Alfisols) continuous application N resulted sharp decline in yield with time and at present there was zero yields in this particular plot. However integration of PK along with FYM/lime sustained the productivity of the system over last 36 years. (Table 4)
d. Finger Millet-Maize: Finger millet-maize covers large area in southern India. The yield data of both finger millet and maize indicate that integration of all the three major nutrients (NPK) always had the larger productivity compared to application of N and NP. Integration of FYM with NPK further boosted the productivity of the system (Table 7 ). Rice-Rice is quite common in some parts of southern and eastern states of the country. The 10 year average yield data (Table 7) indicated that integrated nutrient management is the only option to sustain productivity
131
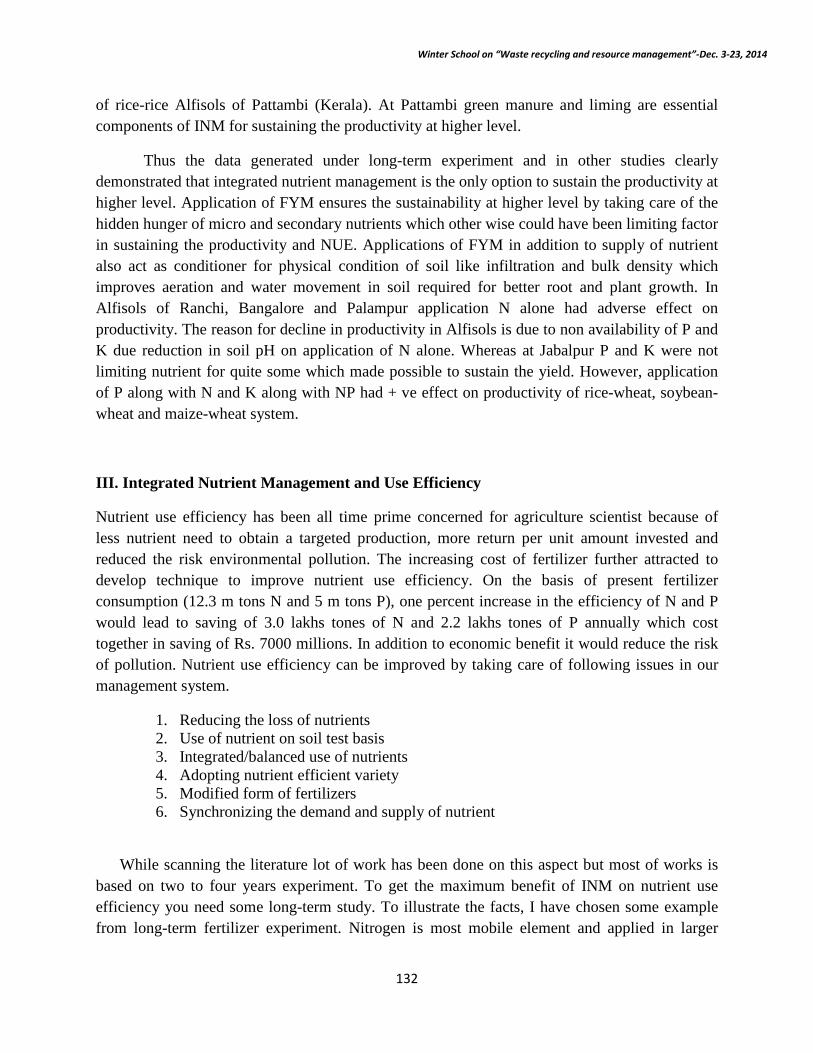
Winter School on “Waste recycling and resource management”-Dec. 3-23, 2014
of rice-rice Alfisols of Pattambi (Kerala). At Pattambi green manure and liming are essential components of INM for sustaining the productivity at higher level.
Thus the data generated under long-term experiment and in other studies clearly demonstrated that integrated nutrient management is the only option to sustain the productivity at higher level. Application of FYM ensures the sustainability at higher level by taking care of the hidden hunger of micro and secondary nutrients which other wise could have been limiting factor in sustaining the productivity and NUE. Applications of FYM in addition to supply of nutrient also act as conditioner for physical condition of soil like infiltration and bulk density which improves aeration and water movement in soil required for better root and plant growth. In Alfisols of Ranchi, Bangalore and Palampur application N alone had adverse effect on productivity. The reason for decline in productivity in Alfisols is due to non availability of P and K due reduction in soil pH on application of N alone. Whereas at Jabalpur P and K were not limiting nutrient for quite some which made possible to sustain the yield. However, application of P along with N and K along with NP had + ve effect on productivity of rice-wheat, soybean-wheat and maize-wheat system.
III. Integrated Nutrient Management and Use Efficiency
Nutrient use efficiency has been all time prime concerned for agriculture scientist because of less nutrient need to obtain a targeted production, more return per unit amount invested and reduced the risk environmental pollution. The increasing cost of fertilizer further attracted to develop technique to improve nutrient use efficiency. On the basis of present fertilizer consumption (12.3 m tons N and 5 m tons P), one percent increase in the efficiency of N and P would lead to saving of 3.0 lakhs tones of N and 2.2 lakhs tones of P annually which cost together in saving of Rs. 7000 millions. In addition to economic benefit it would reduce the risk of pollution. Nutrient use efficiency can be improved by taking care of following issues in our management system.
1. Reducing the loss of nutrients 2. Use of nutrient on soil test basis 3. Integrated/balanced use of nutrients 4. Adopting nutrient efficient variety 5. Modified form of fertilizers 6. Synchronizing the demand and supply of nutrient
While scanning the literature lot of work has been done on this aspect but most of works is based on two to four years experiment. To get the maximum benefit of INM on nutrient use efficiency you need some long-term study. To illustrate the facts, I have chosen some example from long-term fertilizer experiment. Nitrogen is most mobile element and applied in larger
132

Winter School on “Waste recycling and resource management”-Dec. 3-23, 2014
quantity. The residual effect of nitrogen is very low as it does not stay in the system. The efficiency of a nutrient depends on the adequacy of other essential nutrient. Perusal of data on nutrient use efficiency calculated on the basis of 32 years study indicated that as we integrate the nitrogen with other nutrient (P&K) and organic manure, increase in use efficiency of N was recorded irrespective of crop and soil. For instances, in Inceptisols at Ludhiana, the N use efficiency in maize recorded in 100% N (alone) was 16.7% which increased to 23.5, 36.4, 40.2 percent on integration with P, PK, and FYM, respectively. (Table 8). Similar trend was noted in Mollisols of Pantnagar in rice and wheat crop sequence. The N use efficiency recorded in 100% N treatment was 37.5 percent which increased to 40.7%, 44.4% and 61.2 percent in the plots received 100% NP, 100% NPK and 100% NPK+FYM, respectively. Similar effect of nutrient management was also observed in subsequent wheat crop.
Integrated nutrient management also led to increase P and K use efficiency. The data presented in Table- 9 indicated that integrated nutrient management resulted in increase in use efficiency of P and K at all the locations and in all the cropping systems. For instance, the P use efficiency recorded in maize at Ludhiana (Inceptisols) and Palampur (Alfisols) in NP treatment was 10.3 and 21.8 percent, respectively. On addition of K and organic manure the corresponding values of P use efficiency observed were 21.4 and 35.6 percent, respectively. The greater P use efficiency at Palampur is due to jump in yield on application of K and FYM and little decline in yield over the years in control treatment. Moreover, these soils are low in K and application of K and FYM has additive effect on crop productivity.
Though in the begning many places crop did not response to applied K because of high status. The data indicate that application of organic manure irrespective of soil and cropping system induced K use efficiency. The K use efficiency in rice at Pantnagar in NPK treatment recorded was 34.5% which increased from to 108.3% on incorporation of FYM. Whereas increase K use efficiency in wheat increased from 13.7 to 35.8 percent. Recording of more than 100% in K use efficiency is due to application of less amount of K and proportionately more mining of K by crop on application of FYM. Plant also takes more K for luxury consumption. In problematic soils (an acidic) for minimize the nutrient use efficiency, there is need to get rid of with the cause of problem. To sustain the productivity in acid soil (Alfisols) there is need to raise the pH of the soil by liming. The results of long term fertilizer experiment clearly indicated that application lime has positive effect on productivity and nutrient use efficiency as well. The data generated (Table 7) in 18 years old experiment clearly demonstrated that application of lime significantly improved the productivity which would result in increase in efficiency of nutrient.
133

Winter School on “Waste recycling and resource management”-Dec. 3-23, 2014
Table-1 Effect of integrated nutrient management on average productivity of rice-wheat
(kg ha-1) cropping system under LTFE at different locations
Treatments Pantnagar Barrackpore* Raipur
1972 to 2006-07 1972 to 2006-07 1999-2006-07
Crop Rice Wheat Rice Wheat Rice Wheat
Control 2.93 1450 1507 747 2382 1057
100 % N 4.78 3115 3194 1962 3678 1544
100 % NP 4.86 3779 3573 2206 5095 2210
100 % NPK 5.09 3794 3719 2321 5158 2239
NPK + FYM 5.78 4497 3515 3620 5541 2697
100% NPK + GM - - - - 4666 1744
50% NPK + BGA - - - - 4225 1624
CD 5% 611 448 265 316 328 346
Saha et al., (2008)
Table-2 Effect of combined use of organic and inorganic fertilizer average crop yields (t ha1) in rice-wheat at different location
Treatment Location
Bhagalpur(87 trails) Manipur (96 trails) Ludhiana (5 years)
Rice Wheat Rice Wheat Rice Wheat Rice Wheat
FoN60 FoN60 4.21 2.75 441 1.04 5.6 2.8
aF12 N60 F12 N60 4.14 2.95 5.44 1.33 5.7 3.9
At Ludhiana a= N80 to rice and N90 to wheat Singh and Singh (1998)
134
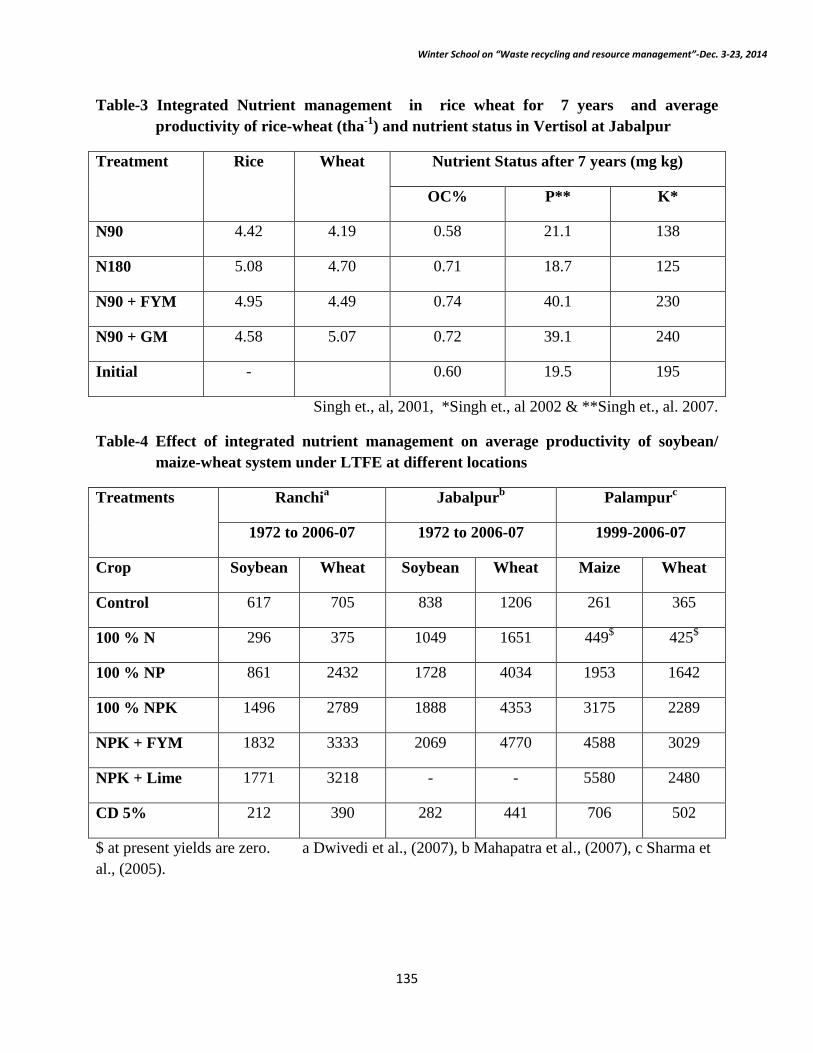
Winter School on “Waste recycling and resource management”-Dec. 3-23, 2014
Table-3 Integrated Nutrient management in rice wheat for 7 years and average
productivity of rice-wheat (tha-1) and nutrient status in Vertisol at Jabalpur
Treatment Rice Wheat Nutrient Status after 7 years (mg kg)
OC% P** K*
N90 4.42 4.19 0.58 21.1 138
N180 5.08 4.70 0.71 18.7 125
N90 + FYM 4.95 4.49 0.74 40.1 230
N90 + GM 4.58 5.07 0.72 39.1 240
Initial - 0.60 19.5 195
Singh et., al, 2001, *Singh et., al 2002 & **Singh et., al. 2007.
Table-4 Effect of integrated nutrient management on average productivity of soybean/ maize-wheat system under LTFE at different locations
Treatments Ranchia Jabalpurb Palampurc
1972 to 2006-07 1972 to 2006-07 1999-2006-07
Crop Soybean Wheat Soybean Wheat Maize Wheat
Control 617 705 838 1206 261 365
100 % N 296 375 1049 1651 449$ 425$
100 % NP 861 2432 1728 4034 1953 1642
100 % NPK 1496 2789 1888 4353 3175 2289
NPK + FYM 1832 3333 2069 4770 4588 3029
NPK + Lime 1771 3218 - - 5580 2480
CD 5% 212 390 282 441 706 502
$ at present yields are zero. a Dwivedi et al., (2007), b Mahapatra et al., (2007), c Sharma et al., (2005).
135

Winter School on “Waste recycling and resource management”-Dec. 3-23, 2014
Table-5 Effect of INM on productivity of soybean wheat (tha-1) and economics.
Treatment Soybean Wheat Total output cost*
FYM 1.81 3.87 45631
PM 1.90 3.69 46390
IPNS 1.97 4.32 50392
Conventional 1.74 3.98 45617
CD (5%) NS 0.39 -
*The cost of output was calculated on the basis of price prevailed during that period.
Table-6 Effect of integrated nutrient management on average productivity (Kg/ha-1) maize-wheat system and LTFE.
Treatments Ludhiana New Delhi Udaipur
1972 to 2006-07 1995-96 to 2006-07 1997-98-2006-07
Crop Maize Wheat Maize Wheat Maize Wheat
Control 783 1141 1182 2403 2000 1941
100 % N 1771 2932 1577 3564 2550 3206
100 % NP 2209 4108 1793 3785 2897 3683
100 % NPK 2927 4739 2151 4514 3064 3909
NPK + FYM 3601 4949 2551 4959 3390 4357
CD 5% 244 266 192 286 223 242
136
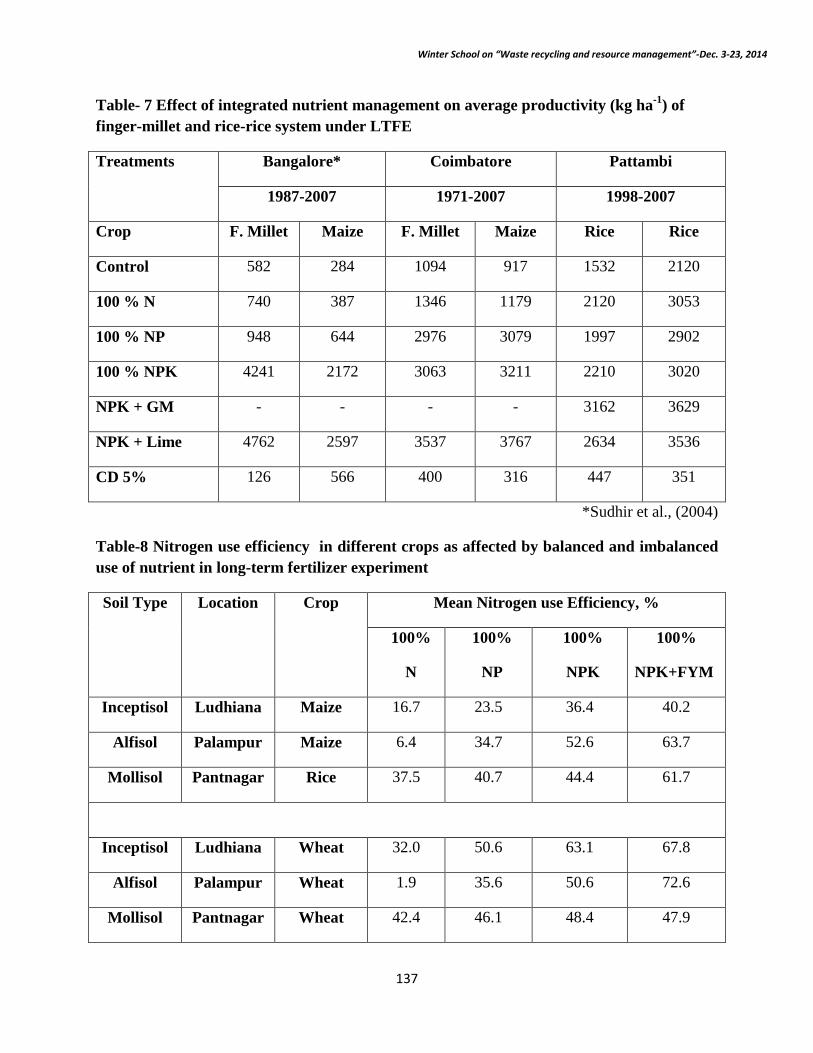
Winter School on “Waste recycling and resource management”-Dec. 3-23, 2014
Table- 7 Effect of integrated nutrient management on average productivity (kg ha-1) of finger-millet and rice-rice system under LTFE
Treatments Bangalore* Coimbatore Pattambi
1987-2007 1971-2007 1998-2007
Crop F. Millet Maize F. Millet Maize Rice Rice
Control 582 284 1094 917 1532 2120
100 % N 740 387 1346 1179 2120 3053
100 % NP 948 644 2976 3079 1997 2902
100 % NPK 4241 2172 3063 3211 2210 3020
NPK + GM - - - - 3162 3629
NPK + Lime 4762 2597 3537 3767 2634 3536
CD 5% 126 566 400 316 447 351
*Sudhir et al., (2004)
Table-8 Nitrogen use efficiency in different crops as affected by balanced and imbalanced use of nutrient in long-term fertilizer experiment
Soil Type Location Crop Mean Nitrogen use Efficiency, %
100%
N
100%
NP
100%
NPK
100%
NPK+FYM
Inceptisol Ludhiana Maize 16.7 23.5 36.4 40.2
Alfisol Palampur Maize 6.4 34.7 52.6 63.7
Mollisol Pantnagar Rice 37.5 40.7 44.4 61.7
Inceptisol Ludhiana Wheat 32.0 50.6 63.1 67.8
Alfisol Palampur Wheat 1.9 35.6 50.6 72.6
Mollisol Pantnagar Wheat 42.4 46.1 48.4 47.9
137

Winter School on “Waste recycling and resource management”-Dec. 3-23, 2014
Table 9 Phosphorus and K use efficiency as affected by integrated use of nutrient.
Soil Type Location Crop P use Efficiency (%) K use Efficiency (%)
100% NP 100% NPK
100%NPK
+FYM
100% NPK
100%NPK
+FYM
Ludhiana Inceptisol Maize 10.3 21.4 26.3 43.8 58.2
Palampur Alfisol Maize 21.8 35.6 51.1 23.0 38.9
Pantnagar Mollisol Rice 18.2 23.3 53.0 34.5 108.3
Ludhiana Inceptisol Wheat 20.6 30.7 34.8 88.1 112.8
Palampur Alfisol Wheat 10.7 15.2 24.6 22.6 66.8
Pantnagar Mollisol Wheat 11.2 10.4 23.3 13.7 35.8
Nutrient use and soil health
Soil Organic C
Data depicted in Fig. 1 on soil organic carbon (SOC) revealed that continuous balanced nutrients application maintained SOC whereas incorporation of FYM resulted in build-up in SOC in Alfisols of Bangalore and Palampur. At Rachi, only NPK+FYM could maintain SOC whereas in all other treatments decline in SOC is recorded. Thus, results indicate that under high rainfall incorporation of FYM is essential to sustain soil productivity.
138

Winter School on “Waste recycling and resource management”-Dec. 3-23, 2014
ORGANIC CARBON STATUS IN ALFISOLS
0.0
0.2
0.4
0.6
0.8
1.0
1.2
1.4
Initial Control 100% N 100% NP 100% NPK 150% NPK 100%NPK+Lime
100%NPK+FYM
OC
(%)
PalampurBangaloreRanchi
Fig. 1. Organic C status after 34 years in different treatments under long-term fertilizer in Alfisols
Organic carbon data in Inceptisol of Ludhiana and Vertisol of Jabalpur and Alfisol of Bangalore revealed that balanced application of fertilizer maintained the soil organic carbon (Table 4 & 5) and the yields are also sustained.
Table 4: Organic carbon (g/kg soil) in different soils as affected by continuous application of manure and fertilizer
Treatment Inceptisol (Udaipur) Inceptisol (Ludhiana) Vertisol (Jabalpur)
Control 6.83 2.6 5.3
N 7.23 3.2 5.9
NP 7.13 3.2 6.9
NPKS 8.10 3.7 8.0
NPK+FYM 9.92 5.2 9.4
CD (5%) 0.5 0.4
Initial 8.0 3.1 5.4
139

Winter School on “Waste recycling and resource management”-Dec. 3-23, 2014
year after 9.5 34 34
Table 5 :Organic carbon (g/kg soil) content in soil in Alfisol
Treatment Vertisol (Bangalore)
Finger millet-maize
Alfisol (Ranchi)
Soybean-wheat
Control 4.06 2.9
N 4.39 3.6
NP 4.83 4.0
NPKS 5.01 4.3
NPK+FYM 5.97 4.6
Initial 4.6 4.5
Year after 17 34
From the above results and discussion it is clear that to sustain the yield, maintenance of soil organic carbon is essential. Therefore, an attempt was made to quantify the soil organic carbon in an 7 years old experiment on soybean-wheat system in vertisols by quantifying C input and output and their relationship.
Nutrient status
Perusal of data given in table 6 revealed that the available status of N in all the soils except at Palampur remained more or less same. It is because of application of all the three major nutrients which are responsible for good yield and thereby incorporating good amount of organic material to soil through root biomass. The increase in Availble N is because of soybean which adds nealy 2000kg C and nealy 30 kg N to soil. Continuous application of P resulted increase in P status at all place though differ in magnitude, may because of inherent P fixation capacity of soil and crop requirement. The build up P in soil is expected as the the amount of P applied is larger than the uptake. On contrary to p , significant decline in available k was observed in all the soil . Obviously it is due to larger uptake of K from than applied.
140

Winter School on “Waste recycling and resource management”-Dec. 3-23, 2014
Table 6: Available N, P and K status in 100% NPK treatments at various LTFEs centres after 2005-06
Center Cropping
sequence
Initial status Avail. Status, kg/ha
N P K N P K
Bangalore F.millet-Maize 257 34 123 258 86 148
Coimbtore Fmillet-Maize 178 11 810 190 29 584
Ludhiana Maize-Wheat 100 9 100 107 82 91
Delhi Maize-Wheat 210 16 155 225 25 291
Palampur Maize-Wheat 729 12 194 328 126 164
Udaipur Maize-Wheat 245 22 671 255 23 647
Ranchi Soyb.-Wheat 236 12 158 351 77 137
Jabalpur Soyb.-Wheat 226 8 370 240 29 278
Pantnagar Rice-Wheat 392 18 125 229 18 129
141

Winter School on “Waste recycling and resource management”-Dec. 3-23, 2014
Recycling of Press Mud and Spent Wash in Agriculture
A.K. Biswas Indian Institute of Soil Science, Bhopal
Modern agriculture the world over depends upon the external application of plant
nutrients to meet crop needs. This is because the soil reserves of plant nutrients or natural
recycling can not provide the very large amount of nutrients needed year after year to produce
food, fodder, fibre and fuel for the burgeoning population of a country like India with a shrinking
land: man ratio.
It is now abundantly clear that no single source of plant nutrients, be it fertilizer, organic
manure, crop residues or biofertilizer, can meet the ever-increasing nutrient needs of modern
intensive agriculture. It is also being increasingly recognized that sustainable agriculture should
ideally be based on integrated plant nutrient supply systems (IPNS), which is not needed to any
of the extreme approaches like organic farming, chemical farming, etc. IPNS aims to make use
of chemical fertilizers, organic manures, crop residues, other recyclable materials and bio
fertilizers in an integrated manner.
Recycling of wastes in agriculture brings in the much-needed organic and mineral matter
to the soils and helps in bridging the gap between supply and demand for plant nutrients. Since
most recyclable wastes are organic, they directly add organic matter and the plant nutrients
contained in it. While the nutrients input improves soil fertility, the organic input has a profound
and vital role to play in improving soil physical properties, such as, tilth, water holding capacity
and providing a more favourable environment for root growth. Thus waste recycling leads to an
improvement in overall soil productivity. In the entire areas of waste recycling, composting
emerges as the most widely accepted process of handling diverse wastes. A wide variety of crop
residues and nutrients-depleted wastes as also human, animal wastes agro industrial wastes like
press mud, distillery effluents, etc can be composted and may be converted into useful organic
manures for crop production. In this lecture we will discuss on recycling of two important wastes
of sugar-cane based agro-industries, namely press mud and spent wash, for land improvement
and gainful utilization of the by products generated by industry.
142

Winter School on “Waste recycling and resource management”-Dec. 3-23, 2014
The sugarcane crop supports several industries directly and indirectly. Sugar mills and
molasses based distilleries are the most important agro-based industries. During the commercial
production of various commodities, solid and liquid organic wastes are generated which can be
composted. The most voluminous solid waste fit for composting is known to be press mud. In the
last decade, composting of press mud along with sugar mill effluents and distillery effluents has
become extremely popular (Table 1). It serves dual purpose of treating the solid and liquid
organic wastes of these industries thus protecting the environment on one land and generating
valuable organic manure as a byproduct on the other.
Table 1: Sugarcane based bio-compost production potential in India
Sl. No. Particulars Statistics
1. Area under sugarcane cultivation 4 million ha
2. Number of sugar mills 536
3. Number of distilleries 285
4. Total cane crushed per annum 177 million tonnes
5. Press mud produced 6.4 million tonnes
6. Spent wash may be consumed 22.4 million m3
7. High quality organic manure may be produced
3.2 million tonnes
8. Land area which may receive-organic manure
3.2 million acre
9. Savings on fertilizer Rs. 700/acre/annum
10 Total savings on economy of chemical fertilizers
Rs. 2240 million/annum
143

Winter School on “Waste recycling and resource management”-Dec. 3-23, 2014
Press mud - Properties, Potential and Utilization
Press mud is a waste product obtained during sugar production. It is also known as filter
cake. The raw sugarcane juice obtained during milling contains 77 to 88% water, 8 to 20%
sucrose, 0.3 to 3.0% reducing sugars, 0.5 to 1.0% organic compounds and 0.2 to 0.6% inorganic
compounds. The suspended impurities in raw juice include the dispersed soil, bagasse particles,
wax, fats, proteins, gums, pectin, tannins, etc. The dissolved impurities present in the cane juice
are glucose, fructose and inorganic salts of Na, K and P, etc. The suspended and dissolved
impurities are removed from the juice to obtain sugar crystals. Sulphitation and carbonation
processes are commonly used to purify the cane juice (Fig. 1). The clarification of cane juice in
the sulphitation process is carried out with the help of lime and sulphur dioxide (SO2). CaSO3 is
precipitated along with other impurities in the form of sulphitation press mud (SPM). In the
carbonation process, lime and CO2 are used to get the clear cane juice. Here, calcium carbonate
along with impurities is precipitated which is known as carbonation press mud (CPM). The
production of sulphitation and carbonation press mud is about 3% and 7%, respectively, of the
quantity of cane crushed in a sugar factory.
Sugarcane
Preparatory devices and mills
Bagasse (Fuel)
Cane juice with impurities
Lime
Heat
SO2 or CO2
144

Winter School on “Waste recycling and resource management”-Dec. 3-23, 2014
Juice with CaSO3 or CaCO3
Precipitate
Clear Juice
Evaporation
Syrup
Fig.1: A flow diagram of the process of sugar production from sugarcane
Press mud is a soft, spongy, amorphous and brownish white to dark brown material
containing sugar, fibre, coagulated colloids including wax, albuminoids, inorganic salts and soil
particles. The composition and properties of press mud, however, vary depending upon the
quality of cane and the process followed for the clarification of cane juice (Table 2). In general,
SPM is more useful for crop production as compared to CPM.
CaSO3 (SPM)
CaCO3 (CPM)
Sugar Molasses
145
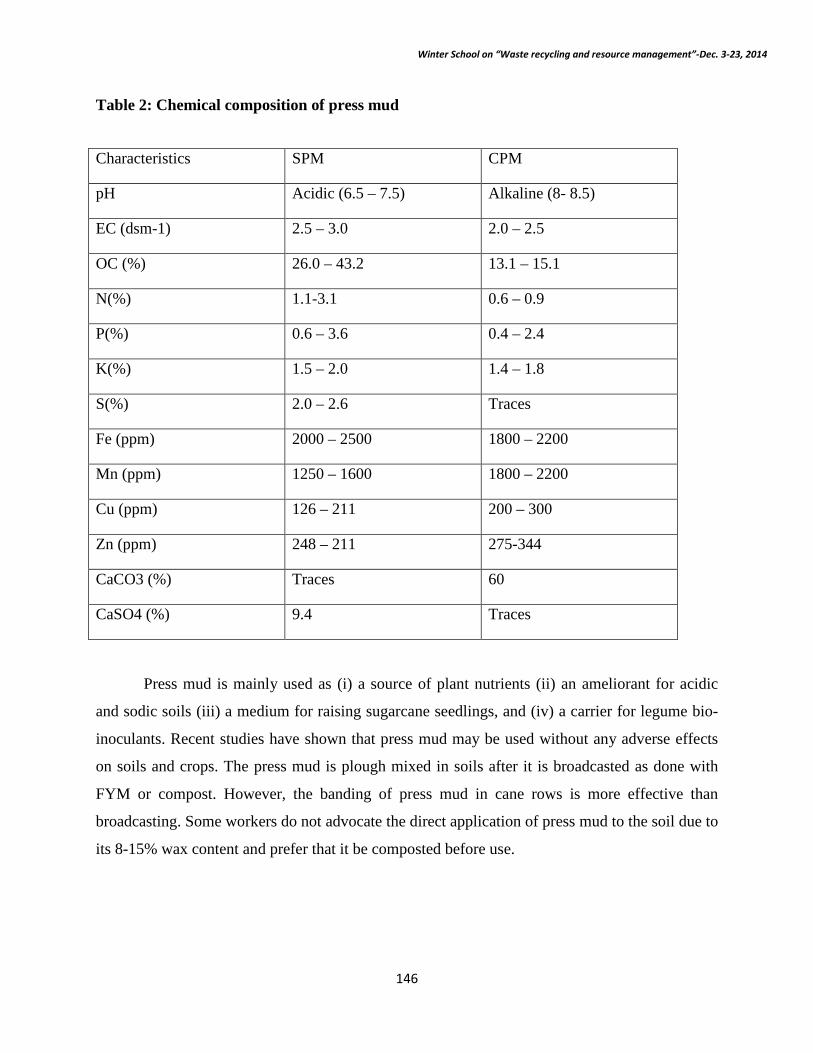
Winter School on “Waste recycling and resource management”-Dec. 3-23, 2014
Table 2: Chemical composition of press mud
Characteristics SPM CPM
pH Acidic (6.5 – 7.5) Alkaline (8- 8.5)
EC (dsm-1) 2.5 – 3.0 2.0 – 2.5
OC (%) 26.0 – 43.2 13.1 – 15.1
N(%) 1.1-3.1 0.6 – 0.9
P(%) 0.6 – 3.6 0.4 – 2.4
K(%) 1.5 – 2.0 1.4 – 1.8
S(%) 2.0 – 2.6 Traces
Fe (ppm) 2000 – 2500 1800 – 2200
Mn (ppm) 1250 – 1600 1800 – 2200
Cu (ppm) 126 – 211 200 – 300
Zn (ppm) 248 – 211 275-344
CaCO3 (%) Traces 60
CaSO4 (%) 9.4 Traces
Press mud is mainly used as (i) a source of plant nutrients (ii) an ameliorant for acidic
and sodic soils (iii) a medium for raising sugarcane seedlings, and (iv) a carrier for legume bio-
inoculants. Recent studies have shown that press mud may be used without any adverse effects
on soils and crops. The press mud is plough mixed in soils after it is broadcasted as done with
FYM or compost. However, the banding of press mud in cane rows is more effective than
broadcasting. Some workers do not advocate the direct application of press mud to the soil due to
its 8-15% wax content and prefer that it be composted before use.
146

Winter School on “Waste recycling and resource management”-Dec. 3-23, 2014
Press Mud as a Source of Plant Nutrients
Press mud contains all the macro and micro-nutrients, though in small amounts. All these
nutrients become available to the growing plants after the degradation of press mud added to
the soil. The use of press mud has benefited the growth and yield of many crops through
direct, residual and cumulative effects.
Press mud has been reported to increase the yield and quality of several crops, such as
sugarcane, sugar beet, mustard, maize, wheat, barley, rice, soybean and peas in normal as
well as in problem soils. This effect of press mud is a net combined effect of all its chemical
and physical attributes and it is unrealistic to credit it exclusively to its plant nutrient content,
let alone to any particular nutrient. In recent studies on the alluvial soils at Lucknow,
application of SPM alone produced a yield increase of 12.8 t cane/ha. In terms of direct
equivalence, 30t press mud was as effective as 75 kg fertilizer N. Sugar beet yield was also
favourably affected by press mud application with that obtained form the sulphitation process
excelling farmyard manure as well as carbonation press mud (Table 3).
Table 3: Effect of press mud and FYM on the yield of sugar beet in a sandy loam soil of pH.
Rate Sugar beet yield, t/ha
T/ha SPM CPM FYM
0 42.0 42.0 42.0
10 51.6 48.6 48.7
20 60.4 52.5 55.2
Besides the benefits which accrued form the direct application of press mud, their
residual effects through higher soil fertility also improved the yield of first ratoon of sugarcane,
wheat and pea in acid soils and rice and wheat in sodic soils.
Chemical fertilizers or organic manures alone cannot sustain productivity in highly
intensive agricultural systems. This calls for a well-developed integrated nutrient supply system
through recycling of all available resources if they are suitable. Some efforts were made in this
direction and encouraging results have been obtained on the integrated use of press mud with N
147

Winter School on “Waste recycling and resource management”-Dec. 3-23, 2014
and P fertilizers. Allocation of 30t/ha SPM with 150 kg N/ha increased the yield of sugarcane by
65.6% (Table 4).
Table 4: Effect of sulphitation press mud combined with fertilizer nitrogen on yield and nitrogen recovery in sugarcane in a clay loam soil Nitrogen added kg/ha
Press mud (80% moisture) t/ha
0 10 20 30 Mean 0 10 20 30 Mean
Sugarcane yield (t/ha) Apparent nitrogen recovery (%)
0 47.1 53.2 58.2 59.9 54.6 - 62 55 40 52
75 60.1 66.6 69. 71.9 67.0 34 38 36 37 36
100 61.6 69.6 70.7 72.6 68.6 42 50 45 43 45
150 65.2 72.8 74.2 78.0 72.6 32 31 36 45 36
Mean 58.5 65.6 68.1 70.6 - 36 45 43 41 -
Effect on Soil Properties Press mud, like any other organic manure affects the physical, chemical and biological
properties of the soils. The content of organic carbon, available N, P, K, Zn and Mn increased
with increasing rate of application of SPM. Sulphitation press mud increases the electrical
conductivity of clay loam soil but decreases it and sodium saturation in calcareous saline-sodic
soils (Table 5). It also helps to increase water stable aggregates in soils. In contrast to
sulphitaiton press mud, carbonation press mud increase soil pH and exchangeable Ca and Mg in
acid soils. In a silty clay loam soil, it increased pH, organic carbon and available K, but deceased
the availability of P. Carbonation press mud is also found to decrease the electrical conductivity
of soils.
148

Winter School on “Waste recycling and resource management”-Dec. 3-23, 2014
Table 5: Effect of sulphitation press mud on soil properties and sugarcane in calcareous sandy loam saline-sodic soil.
Amendments and rate
pH EC (dS/m)
ESP Available P2O5
(kg/ha)
Yield t/ha Sucrose % cane
Pyrite (4) 8.2 3.10 7.2 39.4 58.9 7.51 12.75
SPM (20) 8.0 2.80 6.9 45.7 60.0 7.29 12.14
Control 8.7 5.10 15.6 35.7 39.5 4.45 11.16
CD(5%) 0.2 0.36 1.08 3.8 8.7 - -
Press Mud as an Ameliorant for Problem Soils The presence of large amounts of organic matter, calcium carbonate, Ca and S in press
mud suggests that it may serve as an ameliorant for acidic and saline-sodic soils. Carbonaiton
press mud contains 60-70% CaCO3 and therefore, it has been used for liming acid soils.
Broadcasting of 2.0 t/ha CPM 15 days before the sowing of maize and wheat increased the yield
of maize by 129.4% and of wheat by 100.8%.As early as 1936, the beneficial role of SPM in the
reclamation of alkali soils has been reported. Results of this study indicated that from the second
year after application, press mud became as effective as other chemical amendments. Similarly,
FYM and SPM each at 2t/ha showed effect as good as gypsum at 0.75 t/ha from second year and
onwards in a saline-alkali soil. As a result, the yield of sugarcane increased from 20.8, 22.8, 22.4
and 27.8 t/ha in the first year to 60.0, 58.7, 51.0 and 49.4 t/ha in the third year with SPM, FYM,
gypsum and in the control, respectively.
Economics of Press Mud Utilization The cost of pres mud can be taken at Rs. 18/tonne. Comparing the cost of pres mud and
fertilizer nitrogen with income from sugarcane sale, the economic gains increased with increased
addition of pres mud and nitrogen when applied alone or in combination. The maximum benefit:
cost raito was obtained when 10 or 20 t/ha press mud was applied followed by 75 kg N/ha with
10t/ha of press mud. Usage of press mud alone resulted in a benefit cost ratio of 12.75-18.65.
Farmers in Maharashtra state recycle press mud on a large scale and in some cases pay upto Rs.
50 per tonne for it. They utilize press mud in one of the following three ways.
149

Winter School on “Waste recycling and resource management”-Dec. 3-23, 2014
• Direct application of sulphitation press mud at 5t/ha once in 3 years
• By composting it with distillery spent wash
• By composting it with dung, cane trash and decomposing microbial culture.
Spent Wash - Properties, Potential and Utilization Distilleries are one of the most important agro-based industries producing ethyl alcohol
for industrial and potable uses. There has been two fold increase in number of alcohol industries
in India during the last decade. Presently there are 285 Industries in India. Most of these are
concentrated in the states of Maharashtra, U.P., Karnataka, A.P. and M.P. However, these
industries are assessed as polluting units generating large volume of foul smelling coloured
waste water known as "spent wash". Distillery effluent is characterized by its extremely large
volume, foul odour, dark coffee colour, highly biodegradable matter with high dissolved solid
that present significant disposal or treatment problems (Table 6). Generally, the wastewater is
discharged into water courses under untreated or partially treated condition which creates
extremely anoxic conditions due to high biological oxygen demand (BOD) and chemical oxygen
demand (COD) of the effluent in the water body resulting in mass scale mortality of fish and
other aquatic organisms. The effluent, therefore, is a major source of water pollution.
Table 6: Characteristics of distillery effluent Parameters Untreated Treated pH 3.5-4.5 7.5-8.0
EC, ds m-1 15-36 9-23
BOD, mg L-1 28000-50000 4000-5000
COD, mg L-1 90000-100000 20000-25000
Total N, mg L-1 1000-1200 260-300
Total P, mg L-1 30-50 18-20
Total K, mg L-1 9000-13000 6000-7000
Total sulphate, mg L-1 1200-3000 800-1000
TDS, mg L-1 71000 1800
Phenolic compounds, mg L-1 0.25 1.58
150

Winter School on “Waste recycling and resource management”-Dec. 3-23, 2014
Excessive disposal of the effluent in the surrounding environment affects the
underground drinking water resources also through seepage of effluent and also results in loss of
huge amount of useful nutrients and organic matter. According to the recent estimates, the
alcohol production in India has reached 2.7 billion litre mark. The proportion of spent wash is
nearly 12 to 15 times of the total alcohol production. This massive quantity, approximately 40
billion litre of effluent, if disposed untreated can cause considerable stress on water courses
leading to widespread damage of aquatic life. Distillery effluents discharge has also been found
to result in deterioration of water quality of the river Gelabil in Assam with respect to pH, total
suspended solids, dissolved oxygen content, biological oxygen demand, chemical oxygen
demand and NH4+, NO3
-, NO2-, S-2 and PO4
-3 contents.
Not only the suitable measures are imperative to restrain the entry of such highly organic
effluents into the water courses, the organic matter and the nutrients present in the effluents
should also be harnessed to the full extent. The application of distillery effluent on land as
irrigation water and as source of plant nutrients offers a promising alternative. It has been
estimated that a 10cm irrigation on one hectare of land with post methanated effluent may
provide as much as 300 kg N, 20 kg P, 6000 kg K and 1000 kg SO4 besides huge quantity of
organic matter. But continuous and indiscriminate use or abuse may also cause accumulation of
salts in the soil endangering its productivity and sustainability. Hence, proper management
practices have to be developed for harmless utilization of effluent in agriculture.
Some studies have been conducted here and there in a scattered way on the application of
distillery effluent on land as irrigation water and as source of plant nutrients. Crops like
sugarcane can withstand application of concentrated effluents without showing any reduction in
yield whereas cereals like rice and wheat grow well after dilution (BOD level 500 -1000 mg L-1)
of the effluent. It was reported that treating cane field with stillage at rates up to 185 m3 ha-1
increased cane yields and reduced K fertilizer needs at all levels of application. The spent wash
was as effective as MOP in supplying the plant requirements for sorghum. Some workers
classified spent wash as dilute liquid organic fertilizer with high K contents and its nitrogen was
mostly in colloidal form behaving as a slow release fertilizer better than most chemical nitrogen
sources. Two-third of P was also in organic form and metabolic availability of which was more
151

Winter School on “Waste recycling and resource management”-Dec. 3-23, 2014
than chemical sources. Moreover, it contained large amount of important secondary elements
like Ca, S, Mg as well as trace elements, viz., Cu, Mn and Zn. However, non-judicious use of
spent wash might adversely affect the growth of plant and soil properties. Some authors reported
that with 75 per cent of the recommended fertilizer application and irrigating with the distillery
wastewater, the yield was at par with 100 per cent recommended dose of fertilizer application
with normal water irrigation. Moreover, the percentage utilization of applied N, P and K through
fertilizer was more in distillery wastewater irrigation than with normal water irrigation.
The soils of tropical regions are low in organic C content and therefore, the addition of
organic matter has always been beneficial for increasing crop production. But it is feared that the
application of organic material with such high BOD and COD may have an adverse effect on
crop growth. This is attributed to increase in CO2, increase in temperature, formation of organic
acids during decomposition of organic matter and net immobilization of plant nutrients. The
effluents irrigations in sugarcane significantly increased the pH, EC, OC, SAR, exchangeable Na
and K and available nutrient contents, i.e, N and K of the soils than with normal water at the
same level of fertilizer application showing that K fertilizer can be withdrawn from the fertilizer
schedule. It was further concluded that the distillery waste could safely be used as liquid manure
at the rate of 125 to 250 t ha-1. The effluent irrigation also improved physical and chemical
properties of the soil, increased water retention characteristics of the soil, restored and
maintained soil fertility and increased soil microflora. However, some workers noted adverse
effect on water retention, hydraulic conductivity and stable aggregates of soil. It was also found
that addition of spent wash with dilution was very effective in increasing water intake rate of
sodic calcareous soil.
On application of distillery effluent top surface of soil become hard and may act as a
barrier for movement of water down into the profile and thereby reducing the water intake
capacity of the profile from irrigation/rainfall. This hard layer also restricts the water losses from
the surface due to evaporation and acts as a mulch for conserving moisture in the profile for
making it additionally available for uptake by the crop roots. Presence of organic matter modifies
the structure (clod size distribution) and thus affects the pore size distribution considerably.
Continuous addition of distillery effluent may lead to gradual but very slow changes in textural
152

Winter School on “Waste recycling and resource management”-Dec. 3-23, 2014
modifications due to particulates incorporation in the surface layer. Organic matter acting as an
important agent for improving aggregation in case of highly permeating soil will ultimately lead
to improved soil physical health. In case of slowly permeating soils, the action would be other
way, thereby increasing the infiltration rate and total porosity.
Some workers noticed the absence of nitrogen fixing bacteria from the soils where
untreated effluent was used. However, the population of fungi and actinomycetes showed an
increasing trend. The effect was not so severe with the post-methanated effluents. Some others,
on the other hand, reported that irrigation with high BOD wastewaters did not adversely affect
the nitrification activity in soil.
IISS Experience
The application of SW also showed a significant improvement in the physical properties
of the soil (Table 7). The mean weight diameter (MWD), per cent water stable aggregates,
saturated hydraulic conductivity and water retention at saturation and 0.033 MPa suction were
significantly (P<0.05) more, while bulk density (BD) and penetration resistance were
significantly less (P<0.05) in all the SW treated plots except in SW2.5 + residual than those of
control and NPK + FYM treatments. The MWD showed a positive linear relationship (r =
0.90**) with the organic carbon content of the soil.
Table 7: Changes in some soil physical properties due to SW at the end of the third
cropping cycle
Treatments MWD (mm)
%WSA BD
(MG
m-3)
Sat HC (x106 ms-1)
WR at 0.33 bar
(w/w)
Soybean Wheat
Control Control
0.53 44.9 1.28 7.3 25.0
153

Winter School on “Waste recycling and resource management”-Dec. 3-23, 2014
NPK+FYM NPK 0.65 48.2 1.24 8.3 26.9
SW2.5 Residual 0.68 50.5 1.22 13.8 27.3
SW2.5 SW1.25 0.89 53.3 1.15 23.9 31.0
SW5.0 Residual 0.90 54.0 1.17 28.3 30.1
SW5.0 SW2.5 1.02 63.9 1.12 31.1 32.5
There has not been any significant change in pH of the black soil with the application of
distillery wastes, but a slight build-up of salinity as indicated by EC of the soil has taken
place by 0.12 units as compared to control under maize-chickpea (Table 8). The OC content
of the soil has also improved with the application of these wastes, a high of 0.66% being in
PME treated plots and a low of 0.59% in SW and LS treated plots, which were at par with
NPK+FYM treatment (0.53%) and significantly higher than control (0.48%) under maize-
chickpea. Under groundnut-wheat system, all three wastes behaved almost similarly with
NPK+FYM in improving OC content of the soil (Table 4).
Table 8. Changes in some soil properties at the end of the third cropping cycle Treatments Maize-Chickpea Groundnut-Wheat
pH EC OC(%) pH EC OC (%)
Control 8.1 0.46 0.48 8.2 0.48 0.49
NPK+FYM 8.0 0.51 0.53 8.1 0.48 0.64
PME(0.5cm) 7.9 0.52 0.59 7.9 0.53 0.64
PME(1.0cm) 8.0 0.56 0.66 8.0 0.56 0.57
LS (5 t ha-1) 7.9 0.55 0.59 8.1 0.50 0.63
CD (P=0.05) NS 0.08 0.13 NS 0.07 0.11
There was no significant change in available N status of the soil in both the cropping systems
with the addition of distillery wastes. Available P and K status of the soil increased to a great
extent over control due to distillery wastes in both systems. While LS treated plots recorded
154

Winter School on “Waste recycling and resource management”-Dec. 3-23, 2014
the highest available P status of the soil, PME recorded the highest available K status of the
soil. There was quite a significant accumulation of available K in the soil in proportion to the
level of addition of these waste products at the end of third cropping cycle (Table 9).
Table 9. Changes in some soil fertility parameters (kg ha-1) at the end of third cropping cycle
Treatments Maize-Chickpea Groundnut-Wheat
Av.N Av.P Av.K Av.N Av.P Av.K
Control 208.3 5.6 388.8 188.1 6.6 431.7
NPK+FYM 250.8 19.9 687.2 229.9 14.0 584.6
PME(0.5cm) 253.7 13.1 810.4 188.1 17.6 818.9
PME(1.0cm) 205.0 13.6 1011.5 191.0 20.0 1015.5
LS (5 t ha-1) 221.8 27.6 641.9 213.3 21.2 656.3
CD (P=0.05) NS NS 213.4 NS NS 165.9
Irrespective of the cropping systems, there was no significant changes in available N status of
the soil at lower depths due to distillery wastes vis-à-vis NPK+FYM and control (Table 10).
There was some improvement in terms of available P status of the soil in the subsurface layer
(15-30cm), although the waste treatments had no significant effect over and above control
and NPK+FYM. Cropping systems also had no effect on the profile distribution of available
P (Table 11). Unlike N and P, available K status in the sub-surface soils improved
considerably with distillery wastes and NPK+FYM as compared to control. However,
amongst the wastes there was no significant differences in this regard and all three wastes
were at par with NPK+FYM (Table 12).
155

Winter School on “Waste recycling and resource management”-Dec. 3-23, 2014
Table 10: Changes in available N status (kg ha-1) in soil profile at the end of third cropping cycle
Treatments Maize-Chickpea Groundnut-Wheat
0-15 cm
15-30
cm
30-60
cm
0-15
cm
15-30
cm
30-60
cm
Control 208.3 143.4 122.9 188.1 125.3 102.4
NPK+FYM 250.8 163.9 163.9 229.9 177.7 143.4
PME(0.5cm) 253.7 143.4 163.9 188.1 117.7 125.3
PME(1.0cm) 205.0 143.4 143.4 191.0 122.9 164.0
LS (5 t ha-1) 221.8 125.3 143.4 213.3 140.6 130.5
CD (P=0.05) NS NS NS NS NS NS
Table 11: Changes in available P status (kg ha-1) in soil profile at the end of third cropping cycle.
Treatments Maize-Chickpea Groundnut-Wheat
0-15 cm
15-30
cm
30-60
cm
0-15
cm
15-30
cm
30-60
cm
Control 5.6 6.4 5.9 6.6 6.3 5.5
NPK+FYM 19.9 11.5 4.7 14.0 13.7 5.5
PME(0.5cm) 13.1 8.7 5.4 17.6 12.7 3.8
PME(1.0cm) 13.6 8.7 4.7 20.0 12.8 4.0
LS (5 t ha-1) 27.6 10.1 4.8 21.2 11.9 5.1
CD (P=0.05) 8.2 NS NS 7.8 NS NS
156

Winter School on “Waste recycling and resource management”-Dec. 3-23, 2014
Table 12: Changes in available K status (kg ha-1) in soil profile at the end of third cropping cycle.
Treatments Maize-Chickpea Groundnut-Wheat
0-15 cm
15-30
cm
30-60
cm
0-15
cm
15-30
cm
30-60
cm
Control 388.8 330.5 391.4 431.7 388.3 360.7
NPK+FYM 687.2 696.7 582.4 584.6 675.3 592.8
PME(0.5cm) 810.4 650.7 617.8 818.9 594.7 582.7
PME(1.0cm) 1011.5 678.7 622.3 1015.5 679.5 613.0
LS (5 t ha-1) 641.9 655.9 574.9 656.3 580.6 533.7
CD (P=0.05) 213.4 292.5 212.4 165.9 203.8 198.7
157

Winter School on “Waste recycling and resource management”-Dec. 3-23, 2014
In Conclusion
Press mud and spent wash contain considerably high amount of organic matter,
potassium, nitrogen, phosphorus, sulphur and calcium, and, therefore, these can be utilized as a
good source of nutrients and would reduce the investment on fertilizer. However, since the
wastes contain a fairly high salt load comprising sulphates and chlorides of potassium, sodium
and calcium, the environmental implications of their continuous use in the farmers’ fields cannot
be ruled out. Hence, proper prescriptions for efficient application of these wastes in various
crops/cropping systems for different agro-ecological regions need to be developed.
158

Winter School on “Waste recycling and resource management”-Dec. 3-23, 2014
Microbes and biogeochemical processes in organic recycling
S.R. Mohanty
Indian Institute of Soil Science, Bhopal, India
Soil microorganisms predominate in their abundance as long as there is a carbon source
for energy. A large number of bacteria in the soil exists, but because of their small size, they
have a smaller biomass (Table 1). Actinomycetes are a factor of 10 times smaller in number but
are larger in size so they are similar in biomass to bacteria. Fungus population numbers are
smaller but they dominate the soil biomass when the soil is not disturbed. Bacteria,
actinomycetes, and protozoa are hardy and can tolerate more soil disturbance than fungal
populations so they dominate in tilled soils while fungal and nematode populations tend to
dominate in untilled or no-till soils.
Table 1: Relative number and biomass of microbial species at 0–6 inches (0–15 cm) depth of soil
Microbial groups Number g-1 of soil Biomass (g m-2)
Bacteria 108-109 400-500
Actinomycetes 107-108 40-500
Fungi 105-106 100-1500
Algae 104-105 1-50
Protozoa 103-104 varies
Nematodes 102-103 varies
Microbial Soil organic matter decomposition
Decomposition of organic matter is a specialty of soil organisms as they need energy to
live, together with nutritive elements, from which they synthesize their constituents. Therefore
the organic fraction of residues applied to the soil such as compost has great importance as it
affords a food source for a wide range of micro-organisms which, via the carbon cycle, will help
to keep up a reserve of organic matter in the soil, along with its biological activity. Among the
159

Winter School on “Waste recycling and resource management”-Dec. 3-23, 2014
various organisms in the soil, microbes play a fundamental part in the decomposition of organic
matter.
Organic matter decomposition serves two functions for the microorganisms, providing
energy for growth and supplying carbon for the formation of new cells. Soil organic matter
(SOM) is composed of the “living” (microorganisms), the “dead” (fresh residues), and the
“very dead” (humus) fractions. The “very dead” or humus is the long-term SOM fraction that is
thousands of years old and is resistant to decomposition. Soil organic matter has two components
called the active (35%) and the passive (65%) SOM. Active SOM is composed of the “living”
and “dead” fresh plant or animal material which is food for microbes and is composed of easily
digested sugars and proteins. The passive SOM is resistant to decomposition by microbes and is
higher in lignin. Microbes need regular supplies of active SOM in the soil to survive in the soil.
Long-term no-tilled soils have significantly greater levels of microbes, more active carbon,
more SOM, and more stored carbon than conventional tilled soils. A majority of the microbes in
the soil exist under starvation conditions and thus they tend to be in a dormant state, especially in
tilled soils. Dead plant residues and plant nutrients become food for the microbes in the soil. Soil
organic matter (SOM) is basically all the organic substances (anything with carbon) in the soil,
both living and dead. SOM includes plants, blue green algae, microorganisms (bacteria, fungi,
protozoa, nematodes, beetles, springtails, etc.) and the fresh and decomposing organic matter
from plants, animals, and microorganisms.
Aerobic heterotrophic microorganisms are known to completely metabolize
macromolecular carbon from organic particles to CO2 and cell biomass, whereas anaerobic
decomposition is accomplished by mutualistic consortia of organisms. The initial steps of
anaerobic decay are the hydrolysis and fermentation of complex organic structures to smaller
moieties of low-molecular-weight organic acids (e.g. acetate) (see aerobic degradation reaction
below). Many of these compounds can be directly mineralized to CO2 by microorganisms
respiring with various oxidized inorganic compounds (e.g. N03- and SO4) as electron acceptors.
It is therefore important to realize that differences in reaction rates between aerobic and
anaerobic decomposition can occur at two levels: the initial cleavage of particulate and other
large macromolecules and the final oxidation to inorganic mineralization products. Although
160

Winter School on “Waste recycling and resource management”-Dec. 3-23, 2014
studies have considered these two levels, not all differentiate between them in their interpretation
of organic matter decomposition.
“average” organic matter composition: 54% protein, 25% carbohydrate, 16% lipid, 4% nucleic acid
(CH2O)106(NH3)16(H3PO4) + 138O2 1= 06CO2 + 122H2O +16HNO3 + H3PO4
Anaerobic Degradation : Anaerobic degradation processes have always been considered
inferior to aerobic degradation in their kinetics and capacities. They are thought to be slow and
inefficient, especially with certain comparably stable types of substrates. Nonetheless, in certain
anoxic environments, such as the cow’s rumen, the turnover of, e.g., cellulose is much faster than
in the presence of oxygen, with average half-life times in the range of one day. Fermentative
degradation of fibers in the rumen reaches its limit with plant tissues rich in lignin which largely
withstands degradation in the absence of oxygen. Also in waste treatment, especially with high
loads of easy-to-degrade organic material, anaerobic processes have proved to be efficient and
far less expensive than aerobic treatment: they require only small amounts of energy input, in
contrast to treatment in aeration basins, and can produce a mixture of methane and CO2
(‘biogas’), which can be used efficiently for energy generation. This holds true for most waste
materials that are easily accessible to degradation without the participation of oxygen, such as
polysaccharides, proteins, fats, nucleic acids, etc. These polymers are hydrolyzed through
specific extracellular enzymes, and the oligo- and monomers can be degraded inside the cell
through enzyme reactions similar to those known in aerobic metabolism. The specific activities
of such enzymes in anaerobic cultures are in the same range (0.1–1 μmol substrate per min and
mg cell protein) as those of aerobic bacteria, and thus the transformation rates per unit biomass
should be equivalent. Nonetheless, anaerobic bacteria obtain far less energy from substrate
turnover than their aerobic counterparts. Whereas aerobic oxidation of hexose to six CO2 yields
2870 kJ per mol, dismutation of hexose to three CH4 and three CO2 yields on ly 390 kJ per mol,
about 15% of the aerobic process, and this small amount of energy has to be shared by at least
three different metabolic groups of bacteria. As a consequence, they can produce far less biomass
per substrate molecule than aerobes can. Their growth yields are low, and most often growth is
slower than that of aerobes. Maintaining the biomass inside specifically designed reactors (fixed
bed, fluidized bed reactors, Upflow Anaerobic Sludge Blanket reactors)
161

Winter School on “Waste recycling and resource management”-Dec. 3-23, 2014
helps to overcome the problem of low and slow biomass production in anaerobic degradation and
largely uncouples substrate turnover from biomass growth. These systems allow anaerobic
wastewater treatment to be nearly as efficient as and less expensive than the aerobic process,
with methane as a useful product; but the microbial communities in these advanced anaerobic
reactors still are comparably sluggish in reacting to changes in substrate composition or in their
reestablishment after accidental population losses due to toxic ingredients in the feeding waste.-
Biogeochemical processes :
A high redox potential equals to well-aerated environmental conditions and a low redox
potential equals to saturated environmental conditions. Saturated soils become depleted of
oxygen, because this is rapidly consumed by aerobic organisms and cannot be replenished by
diffusion quickly. Then, anaerobic and facultative organisms continue the decomposition
process. In the absence of oxygen, other electron acceptors begin to function, depending on their
tendency to accept electrons. When flooding occurs the reduction of the remaining oxygen will
take place first, followed by the reduction of nitrate, then manganese, iron, sulphate, and carbon
dioxide (Figure 1). The reduction of oxygen occurs by the O2 consumption of aerobic organisms,
NO3 serves as a biochemical electron acceptor involving N-organisms that ultimately excrete
reduced N, the reduction of Mn can be initiated in presence of NO3-, whereas the reduction of Fe
cannot be initiated in presence of NO3-, and sulfate reducing bacteria are involved to reduce SO4
2-.
The sequential reduction of the different electron acceptors in soil is assumed to be due to
different types of microorganisms that compete for common electron donors with greater
efficiency according to the redox potential of the electron acceptors (D. R Lovley 1987). For
example, the two most important immediate precursors for CH4 formation are acetate and H2 for
which, however, SO4- -reducing and Fe3+-reducing bacteria compete successfully, if SO4- and
Fe3+ are available, respectively. CH4 production in anoxic rice paddies begins only if all the other
redox processes, i.e. reduction of NO3, Fe3+ and SO4- are finished. Methanogenesis is inhibited
by competition for H2, if SO4- reduction and Fe3+ reduction was made possible by addition of
SO4- and Fe3+, respectively. About 85% of the total CH4 input flux is consumed by tropospheric
OH, producing CO2, H2O, CO, H2 and various intermediate products. The remaining flux enters
the stratosphere. Reaction with stratospheric OH is the dominant sink, followed by reaction with
162

Winter School on “Waste recycling and resource management”-Dec. 3-23, 2014
O and Cl atoms. Under anoxic conditions CH4 is oxidized in the presence of electron acceptors
with sugar as the end product (Miura et al. 1992). Sugar thus formed is oxidized by other
microorganisms with ultimate CO2 formation. In the presence of oxygen, CH4 is oxidized to CO2
by methanotrophic bacteria. The oxidation of CH4 to CO2 completes the carbon cycle.
Figure 1. Microbial mediated redox reaction in soils and the location in the redox range
where the various electron acceptors are active.
From a global perspective redox is an important aspect of energy and carbon transfer. Carbon
reduction and its subsequent oxidation fuel the biological world. Carbon reduction or gain in
electrons is often called photosynthesis by the uninitiated and the reverse oxidation reaction is
called respiration when applied to humans and other large animals. Microbial respiration
accompanies or is synonymous with mineralization. Regardless of your perspective, redox
reactions are important aspects of soil chemistry. Redox reactions change the speciation and
solubility of many elements, create new compounds and alter the biochemistry of soils. In a
complex mixture such as soils the interpretation of redox relationships is difficult. Since the
dynamics of soil oxygen which drives the changes in redox potential are rapid, equilibrium may
not be attained. From a thermochemistry view point redox is not at equilibrium, because all of
163
Winter School on “Waste recycling and resource management”-Dec. 3-23, 2014
the energy yielding compounds by definition contain excess free energy and are unstable with
respect to carbon dioxide and water. Processes which reduce oxygen levels and decrease redox
potentials are driven by microbial consumption of oxygen. Conditions necessary for lowering
redox potentials include, a source of decomposable organic materials (energy source), a
population of microbes capable of utilizing this energy source for metabolism, and a restriction
on the resupply of oxygen. These requirements are not uniformly distributed in soils and
sediments. Thus, redox reactions and redox potentials are not uniform throughout the soil matrix.
In fact, redox potentials are highly variable and therefore are best used as an indication or
relative status of the soil.
164

Winter School on “Waste recycling and resource management”-Dec. 3-23, 2014
Nanotechnology in Soil Science and Plant Nutrition Studies
TAPAN ADHIKARI
Indian Institute of Soil Science, Nabibagh, Berasia Road Bhopal-462038, E-mail:
Nanotechnology refers to controlling, building, and restructuring materials and devices on the scale of atoms and molecules. A nanometer (nm) is one-billionth of a meter. Nanotechnology is also applied to prevent waste in agriculture Ex: - cotton industry Cotton fabric or garment waste (cellulose or the fibers) Low -valued products (cotton balls, yarns). Nanotechnology research and development is directed towards understanding and creating improved materials, devices and systems and exploit these properties as they are discovered and characterized. Nanotechnology has not left agriculture untouched and promises to revolutionize the agriculture sector with new tools for molecular treatment of plant diseases, rapid detection of diseases, enhancing the ability of plant to absorb nutrients thus increasing soil fertility and crop production. In this context, nanotechnology in soil science sector has to be introduced which is likely to bring a sea change in agricultural production and productivity. Nanotechnology development in India is at a nascent stage with policy initiatives directed towards promoting research and development. The most common natural nanoparticles are soil colloids, which are constituted of silicate clay minerals, iron-or aluminum oxides / - hydroxides or humic organic matter, including black carbon. Incidental nanoparticles are largely either of anthropogenic (from grinding of primary or secondary minerals, wear of metal or mineral surfaces, combustion) or pyrogenic (smoke from volcanoes or fires) origin. Engineered nanoparticles (ENPs) are particles that are produced by man because of specific nanotechnological properties. A large number of nanoparticles (NP) are present in the soil environment and understanding the behavior of nano-particles is very important to a wide variety of soil processes pertaining to plant nutrition and soil reclamation. The field of nano-science is gradually emerging out as a frontier area of research; because many of the natural components of soil are nano-particulates. Moreover, increasing number of engineered NPs produced by nanotechnology industries find their way into soils environment. Therefore soil colloids should be viewed as an essential building block of the abiotic medium supporting life in general. During the process of weathering of silicates, oxides and other minerals, a number of NPs such as amorphous silica, hydrous aluminosilicates such as allophane, clays such as halloysite, and oxides such as magnetite and hematite, are produced in soil but their precise function and effects are still poorly defined and understood. Soil health maintenance is a key issue in sustaining crop productivity due to the fact that major portion of nutrient ions gets fixed in the broken edges of the clay particles and thus availability of nutrients become deficient. Nanotechnology can change the scenario, nano particles can adsorb on to the clay lattice thereby preventing fixation while releasing nutrients into the solution that can be utilized by plants. This process improves soil health and nutrient use efficiency by crops. Nanotechnology can be used to develop simple gadgets to assess available nutrient status of soil that will pave way for précised delivery of nutrient input in agro-ecosystem. Nano-particles are mini laboratories having the potential to precisely monitor temporal and seasonal changes in the soil system.
165
Winter School on “Waste recycling and resource management”-Dec. 3-23, 2014
Nano-sensors detect the availability of nutrients and water precisely which is very much essential to achieve the mission of precision agriculture.
Nanotechnology in Soil Science
Since the inception soil scientists have spent a great deal of time and efforts to study and understand the properties and behavior of different size fractions in soils. Each size fraction of the soil matrix, such as the colloidal fraction, clay fraction, silt fraction, sand fraction, and gravel, has specific properties and roles within this matrix. A special attention was always given to the smallest fraction, or the so-called ‘‘fine-grained,’’ ‘‘submicro,’’ or ‘‘ultrafine’’ fraction in soils. This fraction controls or dramatically affect the soil physical and chemical properties, such as soil water holding capacity, tortuosity, particle aggregation, CEC, AEC, etc., because of its large surface area, large percentage of surface atoms with unbalanced charge, large number of surface functional groups per unit of mass. Research efforts have been intensified in this area because many aspects of NP behavior have been little studied and our understanding of the nanomaterials is far from being complete from a fundamental physical chemistry point-of-view. In addition, various nanotechnologies are producing significant amounts of different NPs. Research on environmental behavior of these NP has been also intensified because of the significant increase in the production of MNPs, which, in one way or another, will be deposited or discarded into soils. NPs may occur as nanominerals (which are defined as minerals that only exist in this size range, e.g., certain clays and Fe and Mn (oxyhydr) oxides) or as mineral NPs. A typical example of a nanomineral is ferrihydrite, which together with a variety of mineral NPs, nanoscale aggregates of natural organic matter (NOM), and bacterial appendages known as nanowires, are ubiquitous in soil environments. A variety of soil, geological, and biological processes contribute to the formation of NNP that are present in volcanic dust, most natural waters, soils, and sediments.Natural, accidental, incidental nanomaterials, such as fullerenes, have existed on Earth for nearly 2 billion years and are common constituents in combustion exhaust. Soils and sediments contain many kinds of inorganic and organic particles, such as (i) clay minerals, metal (hydr) oxides, and humic substances while allophane and imogolite are abundant in volcanic soils (ii) nanoparticulate goethite, akaganeite, hematite, ferrihydrite, and schwertmannite (iii) the soil humic substance which consists of a mixture of identifiable nanoscale biopolymers obtained, for example, directly from plant tissues that are added annually by maize plant residues .Three classes of NP may be present in terrestrial ecosystems: nanofilms (or nanosheets), nanorods, and NPs Nanosheets in the form of thin coatings are commonly present on surfaces of primary minerals of the soil matrix. In most of the cases, they are products of the weathering processes that occur in soils; an example are the coatings found on the surface of pyrite microcrystals that compose framboidal pyrites of an alluvial naturally bioreduced sediments. Typically the coatings consist of mainly pure or mixtures of oxides and oxyhydroxides of Fe or other elements. However, in some cases they may exhibit remarkably diverse compositions. Nanosheets may also occur in the form of thin platelets, such as the ones that compose the cancrinite microcrystal formed under extreme alkaline and saline conditions, which promoted accelerated and intensive dissolution of existing minerals and subsequent precipitation of neophases. Nanorods in the form of goethite needles and sodalite were formed in the sediments of the Hanford site, WA, as a result of accelerated weathering of primary soil minerals induced by sediment exposure to leaking waste fluids from the storage tanks, which happened to be highly alkaline (pH - 14)
166

Winter School on “Waste recycling and resource management”-Dec. 3-23, 2014
and saline. As a result, intense dissolution of primary soil minerals, such as feldspars and mica, initially occurred, followed by precipitation of goethite, sodalite, and other secondary phases, such as nanosize hematite and feldspathoids in the group of cancrinite and zeolite. These processes significantly affected the mobility of different contaminants present in the waste liquids in the sediments. Ferrihydrite exists only as NP and larger equivalents of this soil mineral do not even exist. Ferrihydrite is a widespread nanomineral in almost all terrestrial systems and in its ideal form, contains 20% tetrahedrally and 80% octahedrally coordinated Fe and has a basic structural motif closely related to the Baker–Figgis delta-Keggin cluster (Michel et al., 2007). However, despite the ubiquity of ferrihydrite in natural sediments and its importance as an industrial sorbent, the nanocrystallinity of this iron oxyhydroxide has hampered accurate structure determination by traditional methods thatrely on long-range order (Michel et al., 2007), and although ferrihydrite has been subject to intensive research, its exact structure and composition is still a matter of debate, unlike other Fe oxides (Carta et al., 2009). Apparently, the pre-, during, and postformation conditions have a pronounced effect on ferrihydrite’s structure and reactivity. Both the structure and the reactivity of ferrihydrite prepared by three procedures and characterized with XRD, infrared spectroscopy, differential thermal analysis, and kinetic dissolution in an acidic medium, were a function of the preparation procedures (Ma et al., 2008). In another study, synthetic coprecipitates of humic material (dissolved organic matter, DOM) obtained from a Podzol and synthetic ferrihydrite were examined using XRD and Fe-specific Mo¨ssbauer spectroscopy.. Results demonstrated that organic components of the DOM coprecipitated with the ferrihydrite. Solid-state 13C NMR spectra suggested that O-alkyl C of the DOM was mainly responsible for the interaction with the Fe in the oxide. This is again an example of the importance of the conditions of formation on the structure of ferrihydrite. Indeed, studies have confirmed that MNP are released in the environment. Direct evidence of the release of TiO2 NP with a size of about 20–300 nm (used in large quantities in exterior paints as whitening pigments), from exterior facade paints to the discharge into surface waters, was presented in this study. Results revealed that TiO2 particles were detached from new and aged facade paints under the effect of natural weather conditions, then they were transported by facade runoff and subsequently were discharged into natural, receiving waters. Assessing these effects and environmental risks requires an understanding of NP mobility, bioavailability, reactivity, ecotoxicity, and persistency). However, many challenges remain and the effect of NPs on the extent and rate of terrestrial chemical, biological, and hydrological processes and reactions is far from being understood. Some review papers onNPbehavior and ecotoxicity are now available, based on the rudimentary available knowledge that is currently available. NPs that are present in soils may undergo transformations, such as growth, dissolution, aggregation, and aging, changing the micro or nano environment surrounding the individual soil NPs. NPs may also interact in different ways with an array of minerals of the soil solid phase, and a variety of soil solution aqueous species. As a result of these transformations and interactions, the extent and timescale of processes and reactions that control the fate of nutrients and contaminants may also change. In order to better understand the behavior of NPs in terrestrial systems, it is essential to initially understand NP interactions with different components of natural waters including dissolved NOM, over a broad range of physicochemical conditions. For this reason, the discussion in this section is focused on the behavior and reactivity of NP exposed to different conditions that might be present in the soil aqueous phase. The binary interactions between
167

Winter School on “Waste recycling and resource management”-Dec. 3-23, 2014
NP and soil solution chemical species of nutrients or contaminants is presented and discussed in terms of NP growth, stability, phase transformation, aggregation, and aging. This discussion is then expanded to include arguments on how NPs may affect or control sorption, redox reactions, and advective/ diffusive mobility of contaminants and/or nutrient in soils. All these processes are expected to be a function of NP size, shape, concentration as well as aggregation and aging. A variety of variables, such as pH, organic matter (OM) content and DOM concentration in addition to a multitude of NP properties such as type, concentration, age, aggregation, size, formation pathway (biotic or abiotic), and the presence of surface impurities, may affect (i) the NP crystal structure formation and coarsening; and (ii) the kinetics of phase formation and phase transformation. Surface impurities, for example, were found to inhibit NP growth and phase transformation when they existed as surface clusters .Being a master geochemical variable, soil pH has a profound effect on NP formation and growth. Understanding pH effects on assembly and coarsening kinetics may improve our overall understanding of NP properties. Results from experiments conducted with anatase NPs, showed that oriented attachment was significant at values near to the PZNPC, where anatase is very insoluble and has low surface charge (Finnegan et al., 2008). Results from another study conducted with CoOOH NPs which were aged under varying pH conditions, demonstrated that the observed size and shape of the particles were strongly influenced by pH; aging under higher pH conditions resulted in larger particles with a smaller aspect ratio, which was reflected in the ratio of dissolution products (Myers and Penn, 2007). The results from yet another study, which was conducted to show the effect of pH during sol–gel synthesis on the brookite content and average anatase and brookite particle sizes, demonstrated that substantial control over the brookite content, particle size, and particle growth mechanism can be achieved by varying the pH of the sol–gel synthesis. Dissolved organic matter is another key common component of the aqueous phase in terrestrial systems which may affect NPs crystal structural formation. By simulating the process of ferrihydrite precipitation out of solution containing DOM researchers prepared a series of 2-line ferrihydrite–OM coprecipitates using water extractable OM from a forest topsoil . Results from XRD, Mo¨ssbauer spectroscopy, N2 gas adsorption and TEM analyses indicated that OM strongly influence the process of ferrihydrite crystal growth by controlling the particle size, lattice spacing, structural irregularities, and its crystallinity, and even small amounts of OM significantly changed particle size and structural order of ferrihydrite. The stability of NP is a function of their surface energy and NPs are more stable when they possess a low surface energy. For example, the surface energies of small rutile particles are higher than those for anatase particles of a similar size, consistent with anatase being the more stable phase of nanocrystalline TiO2. The surface free energy of NP in an aqueous solution consists of the electrostatic energy of charged surfaces and the interfacial energy. Both these terms can be modified by solution chemistry. They can also be manipulated to control NP phase stability and transformation kinetics. In addition, a better understanding of the stability of nanostructures in different chemical environments can be achieved by the incorporation of size-, shape-, and temperature-dependent thermodynamic model, into theoretical descriptions of nanomaterials. Recently measured thermodynamic data on formation and surface energies of Fe oxides which occur in almost all terrestrial ecosystems
168
Winter School on “Waste recycling and resource management”-Dec. 3-23, 2014
and exist in a rich variety of structures and hydration states has been presented in a recent publication. These authors studied the size driven crossovers in stability and they claimed that this would help toexplain patterns of occurrence of different Fe oxides in nature. A kinetic equation that incorporates the dependence of the rate constant on the particle size for phase transformation via interface nucleation in NP was proposed in the following study (Zhang and Banfield, 2005). These authors observed that the temperature dependence of the rate constant of a kinetically controlled phase transformation was usually described by the Arrhenius equation, which comprises a preexponential factor multiplied by an exponential term involving the activation energy and temperature. They showed that particle size was another factor that was needed in the description of kinetics of NP stability. Among the geochemical variables that control the NP stability, solution pH is probably the most important one. The phase stability of TiO2 NPs, for example, strongly depends on the solution pH. The results presented in this study showed that at small sizes, rutile was stable relative to anatase in very acidic solutions, whereas in very basic solutions anatase was stable relative to rutile and brookite. The authors claimed that the activity of potential determining ions (protons or hydroxyl groups) could control the phase stability of TiO2 NP in aqueous solutions at pH values far from TiO2 PZC. In another study, an investigation was conducted to quantify dissolution extent and describe the Ag released from nano-Ag-products (Geranio et al., 2009). This is definitely an important parameter needed to predict the effect of Ag NPs on the environment. The aim of this study was to determine the amount and the form of Ag released during washing from nine fabrics with different ways of silver incorporation into or onto the fibers. The effect of pH, surfactants, and oxidizing agents was evaluated in this study. The results showed that dissolved Ag concentrations were 10 times lower at pH 10 than at pH 7. Bleaching agents such as hydrogen peroxide or peracetic acid were found to greatly accelerate the dissolution of Ag. This study is one of the first to show results and important implications for the risk assessment of Ag-textiles and the environmental fate of Ag NPs. Surface spectroscopic methods combined with solution phase measurements were used to explore ligand-promoted dissolution and photochemical reductive dissolution of goethite (a-FeOOH) of different particle sizes in the presence of oxalate at pH 3 and 298 K.. The ATR-FTIR results showed a significant presence of surface hydroxyl groups as well as differences in surface complexes formed on goethite nanorod surfaces. The results also showed that nanorods have unique surface chemistry as compared to larger microrods. Furthermore, the result showed that the saturation coverage of oxalate adsorbed on nanorods relative to microrods was similar to 30% less as determined from solution phase batch adsorption isotherms. However, despite less oxalate uptake per unit surface area, the surface-area-normalized rate of oxalate-promoted dissolution was similar to four times greater in nanorod suspensions, suggesting this process was particle size dependent. Other factors, such as coatings may also control NP stability. For example, stability of the magnetite NP in acidic solutions increased when these particles were coated with alumina. NP aggregation may be a common phenomenon in soils since it is observed in many occasions under laboratory conditions. For example, CeO2 NPs, which are being used as a catalyst in the automotive industry and are expected to be present in terrestrial systems in significant amounts, formed aggregates with a mean size of approximately 400 nm when the NPs of three different sizes (14, 20, and 29 nm) were exposed to a solution with a pH of 7.4, which is within the range of pH values found in soils. In another study, the colloidal behavior of 6 nm NP of FeOOH was investigated. These NP formed stable suspended clusters under a
169

Winter School on “Waste recycling and resource management”-Dec. 3-23, 2014
range of aqueous conditions. Light and X-ray scattering methods showed that suspended fractal nanoclusters were formed between pH 5 and 6.6 with well-defined maximum diameters that varied from 25 to approximately 1000 nm. Importantly, the nanoclusters retained a very high surface area, and persisted in suspension for at least 10 weeks in solution. The process was partially reversible because optically transparent suspensions were regained when NPs that aggregated and settled at pH > 7 were adjusted to pH 4 without stirring. But these authors reported that completely redispersed NPs were not obtained even after 1 month. These results demonstrated that NPs could form stable nanoclusters in groundwater, with implications for the transport of surface sorbed nutrients and contaminants. Because nanocluster formation is controlled predominantly by surface charge, it is anticipated that many metal oxide and other inorganic NPs would exhibit equivalent cluster-forming behavior (Gilbert et al., 2007). However, NPs may show complex colloid and aggregation behavior in soils because aggregation is likely to be affected by many variables such as particle shape, size, surface area and surface charge, and surface coatings. Factors such as pH, ionic strength water hardness, and the presence of DOMor other organic compounds may also control NPs aggregation in terrestrial systems. Currently, the precise regimes of dispersion and aggregation have been determined for very few nanomaterials and definitely additional studies are required to provide evidence and measure in a more rigorous manner the effect of these variables on NP aggregation and provide definitive answers on the role of surface coatings on aggregation. The pH and ionic strength effects on aggregation were demonstrated in a few recent studies. Highlights from these studies are presented below: In the first study, it was found that aggregation of the bare 5 nm TiO2 NPs increased when contacting solution pH values were near the PZC, and, at any given pH, an increase in ionic strength generally resulted in increased aggregation. NPs of titanium dioxide of 4–5 nm diameter readily formed stable aggregates with an average diameter of 50–60 nm at pH similar to 4.5 in a NaCl suspension adjusted to an ionic strength of 0.0045 M . Holding the pH constant but increasing the ionic strength to 0.0165 M, led to the formation of micron-sized aggregates within 15 min. At all other pH values tested (5.8–8.2), micron-sized aggregates formed in less than 5 min (minimum detection time), even at low ionic strength (0.0084–0.0099 M NaCl). In contrast, micron-sized aggregates formed within 5 min in an aqueous suspension of CaCl2 at an ionic strength of 0.0128Mand pH of 4.8, which is significantly faster than that observed for NaCl suspensions with similar ionic strength and pH. In summary, these results emphasized the role of pH, ionic strength, and type of cation in NP aggregation under conditions that may be present in soils. Contrary effects of surface coatings on aggregation are reported in the literature. On one hand, surface coatings may promote NP dispersion.For example, the results of a recent study conducted with TiO2 NPs of 5 nm and Suwannee River fulvic acid (SRFA) indicated that conditions which favored adsorption of the fulvic acid resulted in less aggregation of the TiO2 NPs presumably due to increased steric repulsion among individual NP. NP dispersions were found to be stable for environmentally relevant conditions of SRFA, pH, and ionic strength. Although these investigations have improved our understanding of the physical and chemical properties of individual soil particles, the results cannot be readily extrapolated to the behaviors of these complex assemblages within natural soil and sediment systems. A full understanding of the nature and magnitude of these interactions, especially the interaction among soil particles and NPs of different types, and a comprehension of how these interactions may affect the extent and timescales of different soil/geo-processes, is currently lacking. Heterocoagulation
170

Winter School on “Waste recycling and resource management”-Dec. 3-23, 2014
reactions between oppositely charged oxide NPs and larger phyllosilicate colloids may have a considerable impact on colloidal stability, particle size distribution, and adsorption reactions. In addition, results from another study have demonstrated that dissolution of galena NP was greatly inhibited for NP surfaces that were closely adjacent (1–2 nm, or less) to other nano crystals. Recently, the stability and aggregation kinetics of two different suspensions of fullerene (C60) NPs and their relation to NP charge (electrokinetic) properties were investigated. The two synthesis methods employed produced negatively charged fullerene NPs. Consistent with the Derjaguin_Landau_Verwey_Overbeek (DLVO) theory, with an increase in electrolyte (KCl) concentration, the electrophoretic mobilities of both fullerene NPs became less negative, while the corresponding aggregation rates increased until maximum rates were reached at their respective critical coagulation concentrations. A comparison of the aggregation kinetics with predictions based on DLVO theory yielded the same Hamaker constant for both fullerene NPs, indicating that they had the same material composition. Further investigation by these researchers showed that both fullerene NPs were more negatively charged and stable at higher pH conditions, suggesting that dissociation of surface functional groups contributed to surface charge for both NPs. This hypothesis was further supported by oxidation which occurred on the surface of bulk fullerene that has been exposed to water over a prolonged period of time, as detected through XPS. However, since both NP remained negatively charged at pH 2, it is likely that there are other contributing factors to the surface charge of fullerene NPs. acidic conditions (pH 3), it has been determined that the dissolution rate of PbS galena varied by at least 1 order of magnitude simply as a function of particle size, and also due to the aggregation state of the particles. These authors claimed that the dissolution rate difference between galena microparticles and NPs was due to differences in nanotopography and the crystallographic faces present. Aggregate versus dispersed dissolution rates were related to transport inhibition in the observed highly confined spaces between densely packed, aggregated nanocrystals, where self-diffusion coefficients of water and ions decreased dramatically. This study also demonstrated that factors at the nanometer scale significantly influence the release rate of aqueous, highly toxic, and bioavailable. Within this subject area of research there are many important topics to be addressed such as (i) assessment of NP sorption capacity in soils; (ii) assessment of sorption capacity of NP polymorphs in soils; (iii) assessment of NPs interactions with other minerals of the soil matrix and the resulting inhibitory and catalytic effects on contaminant and nutrient adsorption/desorption in soils; (iv) usage of NP for groundwater cleanup and remediation purposes; (v) evaluation and quantification of the controls or effects of different physical, chemical, biological, and hydrological variables on these processes. One can clearly realize that a massive research effort is required to address all these scientific issues. The few examples provided below illustrate the fact that the scientific community has just started to work in these directions. Because the chemical and electrostatic interactions at mineral–water interfaces are of fundamental importance in many geochemical, materials science, and technological processes, the topic of contaminant or nutrient sorption on NP surfaces has attracted the attention of researchers especially in recent years. Studies in the areas of geochemistry/ soil chemistry have shown that NPs have high sorption capacities for metal and anionic contaminants such as arsenic, chromium, lead, mercury, and selenium , copper ,hexavalent uranium [U(VI)] , NOM , and organic acids. In one of these studies, it was found that the contaminant sequestration was accomplished mainly by surface complexation, but sorbed surface species may be encapsulated within
171
Winter School on “Waste recycling and resource management”-Dec. 3-23, 2014
interior interfaces of NP aggregates, a phenomenon with significant consequences for contaminant dispersal or remediation processes. Subject of another study were the Andosols on the island of Re´union which have high nickel (Ni) concentrations due to the natural pedo-geochemical background; they are characterized by high abundances of natural aluminosilicate NPs .In this study, Ni speciation was investigated in two complementary systems. Nanoparticle interactions with soil minerals and the subsequent effects on sorption and/or desorption of nutrients or contaminants is the subject of some recent studies. Quartz crystal microbalance experiments were performed to investigate the kinetics of surface adsorption from solutions containing oppositely charged NPs. A theoretical model was developed according to which formation of dense NP monolayers was driven by a cooperative process, in which the already-adsorbed NPs facilitate adsorption of other NPs from solution. The results from this study also indicated that the kinetic rate constants change with the NP solution concentration and can be used to backtrack adsorption free energies, which agree with the predictions of a simple DLVO model. In another study, researchers used force-volume microscopy and a siliconnitride probe to measure changes in adhesion when a patchy overgrowth of Mn oxide nanostructures forms on the surface of rhodochrosite Results showed that the nanostructures grown under natural conditions modified the layout of adhesion on mineral surfaces. According to these authors, the quantitative mapping of adhesive force can lead to an improved mechanistic understanding of how nanostructure growth influences contaminant immobilization and bacterial attachment. Research has also demonstrated that Fe-rich NP competed efficiently with NOM for Pb binding in both the soil and river systems studied. Another aspect of this phenomenon is related to NPs competition with the aqueous species of contaminants and/or nutrients for available sorption sites on different sorbents that are present in soils.
172

Winter School on “Waste recycling and resource management”-Dec. 3-23, 2014
Nanotechnology in Plant Nutrition
Higher plants strongly interact with their atmospheric and terrestrial environments and are expected to be affected as a results of their exposure to NSPs. Studies on the toxicity of nanomaterials are still emerging and basically evidence several negative effects on growth and development of plantlets. These results are based on tests suggested and encoded by USEPA (1996) that consider studies on seed germination, root elongation, often accom-panied by other evaluations on biomass changes and anatomical-histological studies, useful to evidence in situ symptoms of possible toxicity. Lin and Xing (2007) analysed phytotoxicity of five types of multiwalled nanoparticles at the level of seed germination and root growth in six higher plant species (Raphanus sativus, Brassica napus, Lolium multiflorum, Lactuca sativa, Zea mays and Cucumis sativus). Seed germination was not affected except for the inhibition of nanoscale zinc on Lolium multiflorum and nanoscale zinc oxide on Zea mays. Inhibition of root growth varied greatly among nanoparticles and plants and it is partially correlated to nanoparticles concentration. The authors concluded that the inhibition occurred during the seed incubation process rather than seed soaking stage. Later, the same researchers team (Lin and Xing 2008) analysed the cell internalization and the upward translocation of ZnO nanoparticles by Lolium perenne. In the presence of ZnO nanoparticles ryegrass biomass significantly reduced, root tip shrank and root epidermal and cortical highly vacuolated or collapsed cells. ZnO nanoparticles greatly adhered onto the root surface and individual nanoparticles were observed present in apoplast and protoplast of the root endodermis and stele. Translocation factor of Zn from root to shoot remained very low under ZnO nanoparticles treatments. The authors evidenced that the phytotoxicity of ZnO nanoparticles was not directly correlated with their limited dissolution in the bulk nutrient solution or rizosphere. Limited reports underline positive or no adverse effects of NSPs on higher plants. Hong et al. (2005) analyzed the effects of nano-Ti02 (rutile) on the photochemical reaction of chloroplasts of Spinacia oleracea as a theoretical basis and technical approach for the agricultural application of NSPs. The obtained results evidenced that the nano TiO2 treatments induced an increase of the Hill reaction and of the activity of chloroplasts, which accelerated FeCy reduction and oxygen evolution. Moreover non cyclic photophosphorylation activity was higher that cyclic photophosphorylation activity. The explanation of these effects, on the opinion of the authors, could be that the nano-TiO2 might enter the chloroplast and its oxidation-reduction reactions might accelerate electron transport and oxygen evolution. Zhang et al. (2005) analysed the effects of nano-TiO2 and non nano-TiO2 on the germination and growth of naturally aged seeds of Spinacia oleracea by meas-uring the germination rate and the germination and vigor indexes. An increase of these indexes was observed at 0.25-4‰ nano-TiO2 treatments. During the growth stage the plant dry weight was increased as was the chlorophyll formation, the ribulose bisphosphate carboxylase/oxygenase activity and the photosynthetic rate. These results evidenced that the physiological effects were related to the nanometer-size particles. The authors reported also that the effects of non nano-TiO2 particles were not significant. Racuciu and Creanga (2007) analysed the influence of magnetic nanoparticles coated with tetramethylammonium hydroxide on the growth of Zea mays plant in early ontogenetic stages. The authors affirmed that water based ferrofluid addition in culture medium represents a source of iron. The ironbased nanoparticles may have not only a chemical but also a magnetic influence on the
173

Winter School on “Waste recycling and resource management”-Dec. 3-23, 2014
enzymatic structures implied in the different stages of photosynthesis. Small concentrations of aqueous ferrofluid solution added in culture medium had a stimulating effect on the growth of the plantlets while the enhanced concentration of aqueous ferrofluid solution induced an inhibitory effect. Since the manufacture of nano sized materials may result in the discharge of amount of these materials into the environments, Doshi et al. (2008) analysed the transport of two types of nano sized alumina particles through sand column with asso-ciated environmental impacts on soil systems. The presence of nano alumin particles did not have a negative effect on the growth of Phaseolus vulgaris and Lolium perenne in the tested concentration range. In order to understand the possible benefits of applying nanotechnology to agriculture, the first step should be to analyze penetration and transport of nanoparticles in plants. It is ascertained that nanoparticles tagged to agrochemicals or to other substances could reduce the injury to plant tissues and the amount of chemicals released into the environment; a certain contact is however unavoidable, due to the strong interaction of plants with soil growth substrates. The application of microscopy tools and techniques at different level of resolution has been used to visualize and track the transport and deposition of nanoparticles inside the plants. The author used carbon-coated magnetic nanoparticles (carbon encapsulation provides biocompatibility and a large adsorption surface) in living plant as Cucurbita pepo and the results showed the presence of nanoparticles both in the extracellular space and within some cells. Battke et al. (2008) analysed the uptake of Palladium (Pd) by Hordeum vulgare and the behaviour of Pd nanoparticles in nutrient solutions used to grow plants. Smaller and larger Pd particles were comparatively assessed and the results showed that Pd uptake, via the roots, depends on its particle diameter. Smaller Pd particles cause stress effects in leaves at low concentration in nutrient solution. Zhu et al. (2008) showed that Cucurbita maxima growing in an aqueous medium containing magnetite nanoparticles can absorb, move and accumulate the particles in the plant tissues, on the contrary Phaseolus limensis is not able to absorb and move particles. Therefore different plants have different response to the same nanoparticles. Lee et al. (2008) analysed toxicity and bioavailability of copper nanoparticles to the plants Phaseolus radiatus and Triticum aestivum employing plant agar test as growth substrate for homogeneous exposure of nanoparticles. Plant agar, which is soft gel, allows dispersion of NSPs, hardly water soluble, avoiding their precipitation. The growth rates of both plants were inhibited and as result of exposure to nanoparticles and the seedling lengths of tested species were negatively related to the exposure concentration of nanoparticles. Bioaccumulation is concentration dependent and the contents of NSPs in plant tissues increased with increasing NSPs concentration in growth media. Triticum aestivum showed a greater accumulation of Cu NSPs in its roots due to root morphology. Bioavailability was estimated by calculating the bioaccumulation factor defined as Cu NSPs concentration in the plants divided by the Cu NSPs concentration in the growth media. The main damage to the ecosystem due to particulate deposition is related to the competition pattern alteration among the species that can result in a drastic effect in plant biodiversity: more sensitive species may be eliminated and growth, flowering and fructification of other species may be favoured. Atmospheric particulate matter deposition on the leaves leads to remarkable alteration in the transpiration rates, thermal balance and photosynthesis. Da silva et al. (2006) showed that nanoparticles may enter leaf surface. The structural features of leaf of Byrsonima sericea and Psidium guineense such peltate trichomes and hypodermis probably formed a barrier reducing the penetration of metal ions into the mesophyll as observed by the lower iron leaf content and iron accumulation in
174

Winter School on “Waste recycling and resource management”-Dec. 3-23, 2014
trichomes. Since penetration rates of foliar applied polar solutes are highly variable and the mechanism is not yet fully understood, Eichert et al (2008) investigated in Allium porrum and Vicia faba size exclusion limits and lateral heterogeneity of the stomatal foliar uptake pathway for aqueous solutes and water-suspended nanoparticles. The results suggested that the stomatal pathway differ fundamentally from the cuticolar foliar uptake pathway. Since nanoparticles are introduced into the soil as a result of human activities, among the many fields that nanotechnology takes into consideration, it is also important to recall the analyses of the connections among nanoparticles, plants and soil where plants live and grow up. According to this viewpoint, Shah and Belozerova (2009) analysed the influence of metal nanoparticles on the soil microbial community and germination of Lactuca seeds. The results showed a insignificant influence of the nanoparticles in the soil on the number of colony forming units confirming the results of Tong et al. (2007). On the contrary metal nanoparticles influence the growth of Lactuca seeds, this influence was tested by measuring the length of the root and shoot of the plant after 15 days of incubation. An increase if the shoot/root ratio compared to that of the control was evidenced. The limits of uptake and the distribution of silver nanoparticles in Brassica juncea and Medicago sativa. In contrast to Brassica juncea, Medicago sativa showed an increase in metal uptake with a corresponding increase in the substrate of metal concentration and exposure time. The silver nanoparticles were located in the nucleus and applying the definition of McGrath and Zhao (2003) the authors suggested that both Medicago sativa and Brassica juncea were hyperaccumulators of silver. Due to the ability of specific plant species to hyperaccumulate NPs without apparent physiological damages, at least in particular experimental conditions, plants may represent from one hand a potential transport pathway of NPs in the environment, from the other, in specific cases, a cost-effective alternative to clean up NPs contamination. Besides Medicago and Brassica, it is noteworthy to recall Cucurbita maxima and its capability to take up a significant amount of magnetite nanoparticles from liquid growth medium and to accumulate them within roots and leaves (Zhu et al. 2008). In recent years remarkable progress has been made in developing nanotechnology as showed by the mentioned reports. Moreover the growth of nanotechnology has led to the rapid development of commercial application which involves the use of a great variety of manufactured NSPs. The use of these organic and inorganic nanosized materials may result in the discharge of these materials into the environment: major environmental receptors of nanomaterials will be soil, sediment and biosolids from wastewater treatment. There are many gaps in our knowledge on the ecotoxicity of NPs and there are many unresolved problems and new challenges concerning the biological effects of these NSPs. It is worth noting that nanoparticles can be made from an huge variety of bulk materials and that they can explicate their actions depending on both the chemical composition and on the size and/or shape of the particles. Compared to other contaminant, nanoparticles size plays important roles in the behaviour, in the reactivity and in the toxicity of NPs. Considering these aspects it is not strange to find both positive and negative effects of nanoparticles on higher plants. Given that nanotechnology industry is growing in a very fast way, there is a crucial urgency to perform further studies on the subject, in order to establish right regulation of nanomaterials over their use, confinement, and disposal.
175

Winter School on “Waste recycling and resource management”-Dec. 3-23, 2014
REFERENCES
1. Battke F., Leopold K., MaierM., SchidhalterU., and Schuster M., (2008). Palladium exposure of barley uptake and effects. Plant biology, 10: 272-276. 2. Carta, D., Casula, M. F., Corrias, A., Falqui, A., Navarra, G., and Pinna, G. (2009). Structural and magnetic characterization of synthetic ferrihydrite nanoparticles. Mater.Chem. Phys. 113, 349–355. 3. Da silva L. C., Oliva M. A., Azevedo A. A., and De Araujo M. J., (2006). Response of restinga plant species to pollution from an iron pelletization factory. Water, Air, and Soil Pollution, 175: 241-256. 4. Doshi R., Braida W., Christodoulatos C., Wazne M., and O’Connor G., (2008). Nano-aluminum: transport through sand columns and enviromental effects on plant and soil communication. Environmental Research, 106: 296-303. 5. Eichert T., KurtzA., SteinerU., and Goldbach H.E., (2008). Size exclusion limits and lateral heterogeneity of the stomatal foliar uptake pathway for aqueous solutes and water suspended nanoparticles. Physiologia Plantarum, 134: 151-160. 6. Finnegan, M. P., Zhang, H. Z., and Banfield, J. F. (2008). Anatase coarsening kinetics under hydrothermal conditions as a function of pH and temperature. Chem. Mater. 20, 3443–3449.
7. Geranio, L., Heuberger, M., and Nowack, B. (2009). The behavior of silver nanotextiles during washing. Environ. Sci. Technol. 43, 8113–8118.
8. Gilbert, B., Lu, G. P., and Kim, C. S. (2007). Stable cluster formation in aqueous suspensions of iron oxyhydroxide nanoparticles. J. Colloid Interface Sci. 313, 152–159. 9. Hong F., Zhou J., Liu C., Yang F., Wu C., Zheng L., and Yang P., (2005). Effects of Nano-TiO2 on photochemical reaction of chloroplsts of Spinach. Biological Trace Element Research, 105: 269-279. 10. Lee W.-M., AnY.-J., YoonH., and KwbonH.-S., (2008). Toxicity and bioavailability of copper nanoparticles to the terrestrial plants mung bean (Phaseolus radiatus) and wheat (Triticum aestrivum): plant agar test for water-insoluble nanoparticles. Environmental Toxicology and Chemistry, 27: 1915-1921. 11. Lin D. and Xing B., (2007). Phytotoxicity of nanoparticles: inhibition of seed germination and root growth. Environmental Pollution, 150: 243-250. 12. Lin D. and Xing B., (2008). Root uptake and phytoxoxicity of ZnO nanoparticles. Environmental Science & Technology, 42: 5580-5585.
176

Winter School on “Waste recycling and resource management”-Dec. 3-23, 2014
13. Ma, M. R., Yang, L. J., Liu, Q., Liu, H., and Wei, Y. (2008). Effect of ferrihydrite submicrostructure on its reactivity. Acta Physico-Chimica Sin. 24, 2282–2286. 14. McGrath S.P., Zhao F.J., (2003). Phytoextraction of metals and metalloids from contaminated soils. Current Opinion in Biotechnology, 14: 277-282. 15. Michel, F. M., Ehm, L., Antao, S. M., Lee, P. L., Chupas, P. J., Liu, G., Strongin, D. R., Schoonen, M. A. A., Phillips, B. L., and Parise, J. B. (2007). The structure of ferrihydrite, a nanocrystalline material. Science 316, 1726–1729. 16. Myers, J. C., and Penn, R. L. (2007). Evolving surface reactivity of cobalt oxyhydroxide nanoparticles. J. Phys. Chem. C 111, 10597–10602. 17. Racuciu M. and Creanga D. E., (2007). TMA-OH coated magnetic nanoparticles internalized in vegetal tissues. Romanian Journal of Physics, 52: 395-395. 18. Shah V. and Belozerova I., (2009). Influence of metal nanoparticles on the soil microbial community and germination of lettuce seeds. Water, Air, and Soil Pollution, 97:143-148. 19. Tong Z., BischoffM,. Nies L., Applegate B., Turco R.F. (2007). Impact of fullerene (C60) on a soil microbial community.. Environmental Science & Technology, 51: 2985-2991. 20. USEPA (1996). Ecological effects test guidelines (OPPTS 850.4200) Seed Germination Root Elongation Toxicity Test. Available from: http://www.epa.gov/publications. 21. Zhang L., Hong F., Lu S., and Liu C., (2005). Effect of nano-TiO2 on strength of naturally aged seeds and growth of Spinach. Biological Trace Element Research, 105: 83-91.
22. Zhang, H. Z., Penn, R. L., Hamers, R. J., and Banfield, J. F. (1999). Enhanced adsorption of molecules on surfaces of nanocrystalline particles. J. Phys. Chem. B 103, 4656–4662.Zhu H., HanJ., Xiao J.Q., and JinY., (2008). Uptake, translocation and accumulation of manufactured iron oxide nanoparticles by pumpkin plants. Journal of Environmental Monitoring, 10: 713-717.
23. Zhu H., HanJ., Xiao J.Q., and Jin Y., (2008). Uptake, translocation and accumulation of manufactured iron oxide nano particles by pumpkin plants. Journal of Environmental Monitoring, 10: 713-717.
177

Winter School on “Waste recycling and resource management”-Dec. 3-23, 2014
Impact of MSW Compost Application on Soil Health
Asit Mandal Indian Institute of Soil Science, Bhopal
Introduction
As municipal areas grow its size along with the rapid industrialization, urbanization and
increased population density in India has led to the greater generation of Municipal Solid Waste
(MSW). The waste disposal methods has become inadequate and its needs ecofriendly approach
to save the environment. Composting of municipal solid waste has been considered an attractive
waste management tool for effective reduction of waste volume and beneficial utilization of
MSW compost can eventually turn waste into a resource. Application of MSW compost in
agricultural soils can directly alter soil physicochemical properties and act as nutrient source for
crops and as soil conditioner. The soil microbial biomass, considered as the living part of soil
organic matter, is very closely related to the soil organic matter content in many arable
agricultural soils. MSW Compost technology is the most cost effective option for disposal over
traditional means such as landfilling or incineration. The application of MSW in agricultural
lands can be justified by the need of finding an appropriate destination for waste recycling.
However, agricultural use of MSW may present a potential threat to the environment due to the
presence of pathogens and several toxic pollutants (i.e., heavy metals or organic pollutants, salts
etc). Municipal solid waste or urban solid waste, is a waste type that includes predominantly
household waste (domestic waste) with sometimes the addition of commercial wastes,
construction and demolition debris, sanitation residue, and waste from streets collected by a
municipality within a given area. They may be in either solid or semisolid form. A considerable
quantity of MSW can be recycled and reused but it contains high amount of undesirable heavy
metals which may cause contamination of environment.
Composting cannot be considered a latest technology, but among the MSW management
strategies it is gaining interest as suitable option for chemical fertilizers with environmental
profit, since this process eliminates or reduces the toxicity of pollutants which is present in MSW
(Araujo and Monteiro, 2005) and leads to a final product which can be applied in improving and
maintaining soil quality (Larney and Hao, 2007). Application of MSW compost in agricultural
178

Winter School on “Waste recycling and resource management”-Dec. 3-23, 2014
soils can directly improves soil physicochemical properties such as: soil structure, water
retention capacity, buffering capacity and soil nutrient status. Besides these, in relation to soil
biological properties, numerous researchers have reported different effects of MSW compost on
soil microbial biomass and biochemical activity. Thus agricultural use MSW compost not only
helps to improve the overall soil quality but also sustaining the soil productivity for a long-run.
Effect of MSW compost on soil physical properties
Production of municipal solid waste compost, including organic waste is increasing while
soils are progressively losing organic matter due to intensive cultivation and climatic conditions.
This makes the recycling of organic waste as soil amendments a useful alternative to
incineration. A primary benefit of MSW compost is the high organic matter content and low bulk
density (Soumare et al., 2003). A survey of MSW compost reported that on average, 20% of the
total C in MSW compost was organic C, 8% carbonate C, and 71% residual C which may have
included organic C components (He et al., 1995). Furthermore, the majority of the humic
substances found in MSW compost were identified as humic acid, with a humic acid to fulvic
acid ratio of 3.55 (He et al., 1995). Humic acid is generally considered to be more stable than
fulvic acid and has been associated with increasing the buffering capacity of soil (Garcia-Gil et
al., 2004). When MSW compost was applied to soil at application rates of 20 and 80 Mg ha-1, the
major structural units of humic acid in MSW compost were incorporated into the humic acids in
the soil. The change in soil structure persisted and was structurally changed with long-term
application. Repeated application of MSW compost consistently increased soil organic matter
content and soil C/N ratio to levels greater than those of unamended soil (Montemurro et al.,
2006; Walter et al., 2006). Municipal solid waste compost had a high water holding capacity
because of its organic matter content, which in turn improved the water holding capacity of the
soil. Furthermore, application rates of 30 and 60 Mg ha-1 of MSW compost increased the
aggregate stability of soil through the formation of cationic bridges thereby, improving the soil
structure (Hernando et al., 1989). One study also reported that the addition of mature MSW
compost increased aggregate stability in silt loam soil (Annabi et al., 2007).
Effect on Soil Moisture
The soil moisture retention benefits of compost applied to soils are well documented. The
organic matter in these compost additions has the ability to absorb relatively large amounts of
water (Edmeades 2003). The soil moisture levels increased in MSW compost treated areas in
179
Winter School on “Waste recycling and resource management”-Dec. 3-23, 2014
both broad-acre and horticultural soils indicating the material is performing as would be
expected of high quality compost.
Effect on pH & Electrical Conductivity
Municipal solid waste compost has also been reported to have high salt concentrations,
which can inhibit plant growth and negatively affect soil structure. Application of different
amendment of municipal solid waste (viz. kitchen waste) compost found significant effect the pH
may be due to the mineralization of carbon and subsequent production of OH- ions by ligand
exchange as well as the introduction of basic cations, such as K+, Ca+2, and Mg+2. Plants are
negatively affected by excess salts in soils and Na can be detrimental to soil structure. Electrical
conductivity (EC) of the soil solution is related to the dissolved solutes content of soil and is
often used as a measurement of soil salt content (Brady and Weil, 1996).
Effect of MSW compost on chemical soil properties
Effect on Organic Carbon
Application of different amendment of municipal solid waste (viz. kitchen waste)
compost found significant effect and increase the Organic carbon content in soil over the years.
Soil organic carbon plays a major role in maintaining soil quality. In addition to
supplying plant nutrients, the type and amount of soil organic matter influences several soil
properties Arau´jo et al., (2008). Utilization of MSW compost in agricultural land increase the
soil organic matter improves soil properties, enhances soil quality, and reduces soil erosion,
increases plant productivity and soil microbial biomass. Thus, in the regions where organic
matter content of the soil is low, agricultural use of organic compost is recommended for
increasing soil organic matter content and consequently to improve and maintain soil quality.
Effect on Nitrogen, phosphorus and Potassium
Application of different amendment of municipal solid waste (viz. kitchen waste)
compost found significant effect to nitrogen content. It may be due to the Mineralization of
organic N in compost is dependent on many factors including C/N ratio of raw material,
composting conditions, compost maturity, time of application, and compost quality (i.e., C/N
ratio and C- and N-fractions)(Amlinger et al., 2003).
180

Winter School on “Waste recycling and resource management”-Dec. 3-23, 2014
Amendment of municipal solid waste compost found significant effect to phosphorus. It
may be due to the competition between organic ligand and phosphate for sites on metallic oxides
as well as the formation of phosphohumic complexes which can increase P mobility.
Soil K concentrations are increased in all the season and significantly affect the soil
potassium when different rates of MSW compost are used the same pattern are agreement with
(Giusquiani et al., 1988). Increased K content of the following was reported for soils treated with
MSW compost.
Effect on other essential elements
With the application of municipal solid waste compost on soil significantly increase the
concentration of Magnesium, Manganese, Copper, Zinc and Iron with compare to control
environment.
In small amounts, many of these trace elements (e.g., boron, zinc, copper, and nickel) are
essential for plant growth. However, in higher amounts they may decrease plant growth. Other
trace elements (e.g., arsenic, cadmium, lead, and mercury) are of concern primarily because of
their potential to harm soil organisms and animals and humans who may eat contaminated plants
or soil. The impact of metals on plants grown in compost amended soils depends not only on the
concentration of metals, but also on soil properties such as pH, organic content and cation
exchange capacity. Different types of plants also react very differently to metals which may be
present.
Effect of Trace Elements
Metals appear in the municipal solid waste stream from a variety of sources. Batteries,
consumer electronics, ceramics, light bulbs, house dust and paint chips, lead foils such as wine
bottle closures, used motor oils, plastics, and some inks and glass can all introduce metal
contaminants into the solid waste stream. Composts made from the organic material in solid
waste will inevitably contain these elements that have detrimental effect on the environment.
Effect of MSW compost on soil biology
Effects of MSW compost on Soil Organisms
Composting is a microbiological process, little is known about microorganisms involved
and their activities during specific phases of the composting process. Defining the diversity and
181
Winter School on “Waste recycling and resource management”-Dec. 3-23, 2014
structure of microbial communities of compost through their constituent populations has been of
considerable interest to compost researchers in order to address basic ecological questions such
as how similar are microbial communities in mature compost that were made from different
feedstocks and using different composting methods (Tiquia and Michel, 2002). Composting is a
spontaneous biological decomposition process of organic materials in a predominantly aerobic
environment. During the process bacteria, fungi and other microorganisms, including micro
arthropods, break down organic materials to stable, usable organic substances called compost
Bernal et al. (2008). It is also known as a biological reduction of organic wastes to humus or
humus like substances (Gautam et al., 2010). Municipal solid waste (MSW) is largely made-up
of kitchen and yard waste, and its composting has been adopted by many municipalities (Otten,
2001). Composting MSW is seen as a method of diverting organic waste materials from landfills
while creating a product, at relatively low-cost, that is suitable for agricultural purposes.
Soil ecology is increasingly being used to evaluate soil quality. It is thought that soil
microbiological properties are most sensitive to changes in the soil environment (Pankhurst et
al., 1997; Crecchio et al., 2001). Biomass N, C, and S showed increases in the soil immediately
after compost addition and for up to one month, while biomass P showed an increasing trend for
5 months (Perucci, 1990). Application of MSW compost increased soil microbial biomass C and
soil respiration (an index of general metabolic activity of soil microorganisms) when compared
to a control (Bhattacharyya et al., 2003). Soil basal respiration rate, a parameter used to monitor
microbial activity, was also seen to increase where MSW compost was applied when compared
to a control.
Another measure of soil microbial health is the activity of soil enzymes involved in the
transformation of the principal nutrients (Crecchio et al., 2004). After application of MSW
compost, the enzyme activities of phosphodiesterase, alkaline phosphomonoesterase,
arylsulphatase, deaminase, urease, and protease were increased (Perucci, 1990). The activity of
phosphatase remained constant in the soil after reaching its maximum value, and so it may be
concluded that MSW compost may stimulate the transformation of organic P to its inorganic and
available form. Enzyme activities of arylsulphatase, dehydrogenase, and L-asparaginase have
also been seen to increase with the addition of MSW compost, with application rates up to 90 Mg
ha-1, while the activities of phosphodiesterase and phosphomonoesterase increased linearly with
182

Winter School on “Waste recycling and resource management”-Dec. 3-23, 2014
increasing application rates (Giusquiani et al., 1994). Dehydrogenase activity was affected in the
long-term when MSW compost was applied at low rates (Pascual et al., 1999). Increases of
urease and acid phosphatase activities were observed in soils treated with 2.5–40 Mg ha-1 and
were proportional to MSW compost application rate (Bhattacharyya et al., 2003). The enzyme
activities of β-glucosidase and nitrate reductase have also been reported to increase with the
addition of MSW compost when compared to a control (Crecchio et al., 2001). Some enzyme
activities were reported to decrease where MSW compost was applied. For example, protease
activities were found to decrease where only 24 Mg ha-1 MSW compost was applied, probably
reflecting the low protein content of the product (Crecchio et al., 2004). Furthermore, it was
found that the addition of MSW compost at 20 and 80 Mg ha-1 inhibited the activity of urease
and protease (Garcia-Gil et al., 2000). The decrease, in both cases, was attributed to the potential
toxic effects exerted by trace elements in this particular compost.
Variability of metal levels in MSW compost somewhat hinders the ability to directly
compare studies because of the sensitivity of soil microorganism to heavy metal. Composting of
municipal solid waste has potential as a beneficial recycling tool. It is safe use in agriculture,
however, depends on the production of good quality compost, specifically, compost that is
mature and sufficiently low in metals and salt content.
The effect of trace elements in MSW composts on soil organisms such as invertebrates
(e.g., earthworms) and microorganisms (e.g., nitrogen-fixing bacteria) is largely unexplored.
When sewage sludge is applied to land, the concentration of some trace metals (e.g., cadmium)
in earthworms is increased, but this increase does not pose a significant risk to the worms or to
wildlife that consumes them based on the risk assessment performed for sewage sludge. There is
contradictory evidence as to whether metals in MSW composts may harm soil microorganisms,
including nitrogen-fixing bacteria.
Metal loading and its bioavailability
Municipal solid waste compost is increasingly used in agriculture as a soil conditioner
but also as a fertilizer. Proponents of this practice consider it an important recycling tool since
MSW would otherwise be landfilled and critics are concerned with its often elevated metal
concentrations. Large amounts of MSW compost are frequently used in agriculture to meet crop
183
Winter School on “Waste recycling and resource management”-Dec. 3-23, 2014
N requirements and for the addition of organic matter. The main concern is loading the soil with
heavy metals that can result in increased metal content of crops. Furthermore, in some cases,
metals and excess nutrients can move through the soil profile into groundwater. Many
researchers agree that bioavailability should be addressed in the guideline limits, in addition to
metal loading. For agriculture, complete examination of metal bioavailability in soils exhibiting a
range of the factors affecting plant uptake is necessary. These factors include pH, cation
exchange capacity (CEC), organic matter content, soil structure, and soil texture (Pinamonti et
al., 1999). Research in this area would also have to consider, and account for, the effects MSW
compost may have on the soil such as, increased soil pH and organic matter content (Deportes et
al., 1995; Mkhabela and Warman, 2005). A fraction of the added organic matter is resistant to
decomposition but some of the humic substances eventually decompose releasing metals bound
in this fraction. Rather, it is thought that the inorganic residues such as the phosphates, silicates,
Fe, Al, and Mn oxide most likely provide long-term retention of metals demonstrating the need
for long-term experiments (McBride, 1995).
The effect of MSW compost application in long run there is continuous accumulation of
heavy metal into the soil (Richard, 1992). Large amounts of MSW composts are applied to
agricultural soils, half of the organic matter may decompose within one or two decades. Metal
concentrations in soil are unlikely to exceed the concentration present in the original compost,
unless very large amounts of compost high in organic matter are applied. Over time, metals
generally become less available to plants and other organisms unless soil pH decreases greatly or
the soil is flooded for a long period of time.
Potential Benefits of Trace Elements in MSW Compost
Potential adverse effects of heavy metals and metalloids in MSW compost is well
established, there are also potential beneficial effects for agriculture and horticulture. Soils that
have been cropped for many years may be deficient in nutrients such as boron, zinc and copper,
and MSW compost could mitigate such deficiencies. Other benefits include improved soil
physical characteristics such as increased water-holding capacity, improved chemical
characteristics such as nutrient retention capacity, and stimulation of microbial activity that can
improve plant growth and decrease the leaching of pollutants into water supplies. MSW compost
may also limit harm to plants by tying up trace pollutants and toxic organic compounds.
184

Winter School on “Waste recycling and resource management”-Dec. 3-23, 2014
Effect on soil health
The application of MSW compost increased soil organic matter, N, P and stable
aggregates from both amended soils. The results also showed a positive response of plant growth
to application of MSW compost in both soils. The sources of heavy metals found in all MSW
compost such as Cd, Cu, Pb and Zn and there are obvious concerns about such toxic elements
entering the food chain through food crops leads to biomagnifications of food chain (Gillet,
1992). Heavy metals are not biodegraded by process of composting, and can become
concentrated due to the loss of carbon and water from the compost due to microbial respiration.
However, Arau´jo and Monteiro (2006) reported a decreasing in heavy metals (HMs) content in
textile sludge as a result of composting. The application of MSW compost in soil can promote
changes in soil microbial biomass and activity, mainly due heavy metals content. There is an
important need to evaluate the effect of MSW compost on soil microbial biomass.
Organic materials amendment in soil, such as municipal solid waste compost (MSWC),
promotes soil microbiological activity, but the presence of potential toxic heavy metals is of
much concern. An appreciable amount of heavy metals in MSWC does not seem to have any
detrimental influence on microbial biomass and enzyme activities in soil. But there are some
reports which show that heavy metals present in MSWC decrease the proportion of microbial
biomass C in total soil organic matter. The increase in soil microbial biomass with the MSWC
amendments is mainly due to the microbial biomass present in the organic residues and the
addition of substrate C, which stimulates the indigenous soil microbes. Effect of HMs on soil
microbes depends on soil as well as MSW characteristics and its amendment rates.
Sewage sludge as well as MSW compost contain valuable plant nutrients and organic
matter that can improve soil fertility and overall soil health. The phytonutritive capacity of
compost has often been demonstrated to be analogous to that of manure; the same level of
productivity, both quantitatively and qualitatively, can be maintained by replacing manure with
compost (Beyca et al 1993 and Roe et al, 1993). However, sewage sludge and MSW compost
often contains potentially toxic elements that can cause soil pollution, phytotoxicity and
undesirable residues in plant and animal products (Alloway and Jackson, 1991). As a matter of
fact, pollution problems may arise if toxic metals are mobilized into the soil solution and are
either taken up by plants or transported in drainage waters. In the long term, the use of sewage
185

Winter School on “Waste recycling and resource management”-Dec. 3-23, 2014
sludge and MSW compost can also cause a significant accumulation of Zn, Cu, Pb, Ni and Cd in
the soil and plants (Mulchi et al, 1991).
Heavy metal pollution of agricultural soils and crops through the application of MSW
compost as organic fertilizers is of great concern. Since mobility, environmental diffusion and
bioavailability largely depend on soil physico-chemical characteristics and, likewise, on trace
metal chemical forms that dictates the toxicity of metals in the soil environment system. From an
environmental point of view, the evaluation and forecast of food contamination is related to the
bioavailable fraction of heavy metals in soil.
Conclusion
Composting municipal solid waste (MSW) is becoming increasingly recognized as a
viable and economical method for waste management. Composting has advantages over land-
filling and incineration because of lower operational costs, less environmental pollution, and
beneficial use of the end product. Municipal solid waste compost significantly influences the soil
physicochemical properties and promotes microbiological activity, but the presence of potential
toxic heavy metals is of much concern. There are, however, some uncertainties about potential
health hazards resulting from excessive MSW compost application to agricultural lands. It was
observed that the positive effects resulting from compost application far outweigh the negative
effects, but more research is needed on a wide range of MSW composts with more precise
determination of the fate of MSW compost-applied trace elements in the environment.
References
Alloway, B.J., Jackson, A.P. (1991). The behaviour of heavy metals in sewage sludge-amended soil. Sci. Total Environ., 100, 151-176.
Amlinger, F., Gotz, B., Dreher, P., Geszti, J., Weissteiner, C. (2003). Nitrogen in biowaste and yard waste compost: dynamics of mobilization and availability—a review. Eur. J. Soil Biol. 39:107–116.
Annabi, M., Houot, S., Francou, C., Poitrenaud, M., LeBissonnais, Y. (2007). Soil aggregate stability improvement with urban composts of different maturities. Soil Sci. Soc. Am. J. 71:413–423.
Araujo, A.S.F., Santos, V.B., Monteiro, R.T.R. (2008). Responses of soil microbial biomass and activity for practices of organic and conventional farming systems in Piaui state, Brazil. European Journal of Soil Biology 44:225-230.
Araujo, A.S.F. and Monteiro, R.T.R., (2005).Plant bioassays to assess toxicity of textile sludge compost. Scientia Agricola., 62: 286–290.
186

Winter School on “Waste recycling and resource management”-Dec. 3-23, 2014
Bernal, M.P., J.A. Albuquereque, R. Moral. (2008). Composting of animal manures and
chemical criteria for compost maturity assessment: a review”, Bioresour Technol, 99: 3372- 3380.
Beyca, J., De Chant, L., Conditt, M, Jones, B. (1993). Wet bag composting trial yields promising results. Biocycle, 34(4): 72-75.
Bhattacharyya, P., Chakrabarti, K., Chakraborty, A. (2003). Effect of MSW compost on microbiological and biochemical soil quality indicators. Compost Sci. Util. 11 (3): 220–227.
Brady, N., Weil, R. (1996). The Nature and Properties of Soils, 12th ed. Prentice, New Jersey, USA, pp. 385, 495.
Crecchio, C., Curci, M., Mininni, R., Ricciuti, P., Ruggiero, P. (2001). Shortterm effects of municipal solid waste compost amendments on soil carbon and nitrogen content, some enzyme activities and genetic diversity. Biol. Fert. Soils 34:311–318.
Crecchio, C., Curci, M., Pizzigallo, M., Ricciuti, P., Ruggiero, P. (2004). Effects of municipal solid waste compost amendments on soil enzyme activities and bacterial genetic diversity. Soil Biol. Biochem. 36:1595–1605.
Deportes, I., Benoit-Guyod, J., Zmirou, D. (1995). Hazard to man and the environment posed by the use of urban waste compost: a review. Sci. Total Environ. 172:197–222.
Edmeades D C (2003). The long term effects of manures and fertilizers on soil productivity and quality: a review. Nutr. Cycl. Agroecosys. 66:165-180.
Garcia-Gil, J.C., Ceppi, S., Velasca, M., Polo, A., Senesi, N. (2004). Long-term effects of amendment with municipal solid waste compost on the elemental and acid functional group composition and pH-buffer capacity of soil humic acid. Geoderma 121:135–142.
Garcia-Gil, J.C., Ceppi, S., Velasca, M., Polo, A., Senesi, N. (2004). Longterm effects of amendment with municipal solid waste compost on the elemental and acid functional group composition and pH-buffer capacity of soil humic acid. Geoderma, 121: 135-142
Gautam S.P., P.S. Bundela, A.K. Pandey, M.K. Awasthy, S. Sarsaiya, (2010). evolution of the Municipal Solid Waste Compost Phytotoxicity, and Maturation for ecofriendly organic forming system. Journal of applied science in environmental sanitation, 5 (4): 397-402.
Gillet, J.W. (1992). Issues in risks assessment of compost from municipal solid waste: occupational health and safety, public health and environmental concerns. Biomass Bioenerg 3:145–162.
Giusquiani, P., Marucchini, C., Businelli, M. (1988). Chemical properties of soils amended with compost of urban waste. Plant Soil 109:73–78.
Giusquiani, P.L., Gigliotti, G., Businelli, D. (1994). Long-term effects of heavy metals from composted municipal waste on some enzyme activities in a cultivated soil. Biol. Fertil. Soils 17: 257–262
He, X., Logan, T., Traina, S. (1995). Physical and chemical characteristics of selected U.S. municipal solid waste composts. J. Environ. Qual. 24: 543–552.
Hernando, S., Lobo, M., Polo, A. (1989). Effect of the application of municipal refuse compost on the physical and chemical properties of soil. Sci. Total Environ. 81/82: 589–596.
Larney, F.J., Hao, X., (2007).A review of composting as a management alternative for beef catle feedlot manure in southern Alberta, Canada”, Bioresour Technol, 98:3221–3227.
McBride, M. (1995). Toxic metal accumulation from agricultural use of sludge: are USEPA regulations protective? J. Environ. Qual. 24:5-18.
187
Winter School on “Waste recycling and resource management”-Dec. 3-23, 2014
Mkhabela, M.,Warman, P.R. (2005). The influence of municipal solid waste compost on yield,
soil phosphorus availability and uptake by two vegetable crops, grown in a Pugwash sandy loam soil in Nova Scotia. Agric. Ecosyst. Environ. 106:57–67.
Montemurro, F., Maiorana, G., Convertini, M., Ferri, D. (2006) Compost organic amendments in fodder crops: effects on yield, nitrogen utilization and soil characteristics, Compost Sci. Util. 14: 114–123
Mulchi, C.L., Adamu, C.A., Bell, P.F., Chaney, R.L. (1991). Residual heavy metal concentrations in sludge amended coastal plain soils. I. Comparison of extractans. Commun. Soil Sci. Plant Anal., 22(9/10):919-941
Pankhurst, C.E., Doube, B.M., Gupta, V.V.S.R. (1997). Biological Indicators of Soil Health. CABI, Wallingford, UK, 451 pp
Pascual, J.A., Garcia, C., Hernandez, T. (1999). Lasting microbiological and biochemical effects of the addition of municipal solid waste to an arid soil. Biol. Fertil. Soils 30:1–6.
Perucci, P. (1990). Effect of the addition of municipal soild-waste compost on microbial biomass and enzyme activities in soil. Biol. Fertil. Soils 10: 221–226.
Pinamonti, F., Nicolini, G., Dalpiaz, A., Stringari, G., Zorzi, G. (1999). Compost use in viticulture: effects on heavy metal levels in soil and plants. Commun. Soil Sci. Plan. 30: 1531–1549
Richard, T., Woodbury, P. (1992). The impact of separation on heavy metal contaminants in municipal solid waste composts. Biomass Bioenerg. 3: 195–211.
Roe, N.E., Stoffela, P.J., Bryan, H.H. (1993). Utilization of MSW compost and other organic
mulches on commercial vegetable crops. Compost Sci. Utilization, 1(3):73-84. Soumare, M., Tack, F., Verloo, M. (2003). Characterization of Malian and Belgian solid waste
composts with respect to fertility and suitability for land application. Waste Managment 23: 517–522.
Tiquia SM., Michel FC Jr. (2002). Bacterial Diversity in Livestock manure compost as characterized by terminal restriction fragment length polymorphisms (T-RFLP) of PCRamplified16S rRNA gene sequences. In: Insam H., Riddech R., Klammer S.,Eds, Microbiology of Composting. Springer Verlag, Heidelberg, pp. 65-82.
Walter, I., Martinez, F., Cuevas, G. (2006). Plant and soil responses to the application of composted MSW in a degraded, semiarid shrubland in central Spain, Compost Sci. Util. 14:147-154.
188

Winter School on “Waste recycling and resource management”-Dec. 3-23, 2014
Heavy metal status in different composts and their permissible limits
J.K. Saha
Head and Principal Scientist, Division of Environmental Soil Science, Indian Institute of Soil Science, Nabibagh, Berasia Road, Bhopal-462038
Composts prepared from municipal solid waste (MSW), biosolids (municipal sewage sludge), food processing wastes, manures, yard debris, and agricultural byproducts and residues are increasingly available for agricultural use. Utilization of MSW and biosolids as fertilizers and soil conditioners provides benefits from nutrients, from organic matter, from biodegradation of organic matter, and from organisms in the composts. Production of composts provides an important cost saving to cities, industries, and agricultural users, and allows recycling for beneficial use of more of society's discards. Although many benefits are possible from use of composts, these products must be safe for sustainable agriculture for their use to be permitted by governments. These products also must reliably supply nutrient and organic matter benefits to become competitive in the marketplace. The potential presence of pathogenic organisms, heavy metals/trace elements, potentially toxic synthetic organic compounds (compounds that are not normally biosynthesized are referred to as "xenobiotic" compounds), and possible element imbalance in composts have caused concern to some potential compost users.
Because biosolids and composts cannot be as low in metals as background soils, some method is needed to evaluate whether high-quality organic resources are low enough in metals and xenobiotics that they may be safely used in agriculture. Quantitative risk assessment methods have been developed in several countries using scientific data from field research studies with amendments, soils, crops, and animals to determine whether harm is possible or likely when different quality organic resources are used on cropland. Some heavy metals are essential plant nutrients although they are phytotoxic at high concentrations. Some heavy metals like cadmium, chromium, mercury and lead are entering "agricultural ecosystems" to an increasing extent through atmospheric fall-out, with waste water or in waste products as industrialization increases and have become a focus of general interest in connection with environmental protection. These heavy metals enter the biological cycle through the leaves and roots of crops and other plants and are enriched in various plant organs (roots, stems, leaves, fruit), depending on their availability, concentration and mobility. Apart from direct harmful effects on plant growth, the question of their transmission along the food chain is becoming increasingly important. If certain tolerance levels are exceeded, these elements can cause acute and chronic illness in both man and livestock that may even lead to death. Heavy metal inputs to the biosphere stem from geogenous sources (e.g. volcanic activity) and anthropogenous activity. Inputs from the latter source are currently increasing, so that larger amounts are entering the "biological chain".
189
Winter School on “Waste recycling and resource management”-Dec. 3-23, 2014
Phytotoxicity of Heavy metals
Plants are harmed by excessive soil heavy metals before other highly exposed individuals
(HEI) in the pathways are harmed. This is a valuable protection of humans, livestock, and wildlife. But farmers do not want yield reduction when they expect beneficial response of crops to applied biosolids and composts.
There are two approaches of assessing phytotoxicity of trace metals present in biosolids and composts. In the first approach, concentration of metals in immature plants (2 to 6 weeks period) that causes reduction in shoot weight in pot or nutrient solution tests are assessed through plant tissue concentration vs growth retardation tabulation. This information is utilized to develop a phytotoxicity value assuming that short-term reduction in shoot growth translates to yield reduction at maturity. As the scientific literature does not adequately address the validity of this assumption, a 50% growth retardation (phytotoxicity threshold; PT 50) is used as the threshold. Then, the field data from several studies are examined to search for the probability that the plant tissue metal concentration associated with the PT 50 is exceeded in the field, with a 1 % probability used to set soil metal limits. A 1% chance of exceeding the plant tissue concentration associated with the PT 50 concentration is considered quite protective by USEPA, especially considering the observed probability for all recorded studies, far less than 1 %.
A second approach (approach 2) to calculate allowable loading rates to estimate heavy limits uses plant tissue concentration associated with potential phytotoxicity in sensitive crops in the field (obtained from the literature) and the plant response curve to biosolids-applied metals in acidic fields, subtracting the background concentration of the element in leafy vegetables, to calculate an allowable loading rate. The lower value from these two approaches is used as the cumulative allowable limit.
Plateau Response to Heavy metals by Plants
There have been many studies examining the uptake of metals by plants which show that for a given soil, the rate of metal absorption increases as the concentration of metal in the soil increases. In soils with a low level of metal contamination, a linear correlation between the concentration of Cd and Zn in a given soil and the Cd and Zn concentration in plants is frequently observed. However, a more complicated relationship has been found 'when the uptake of Cd and Zn by plants growing in a soil treated with a wider range of metal concentrations is quantified. Several authors reported that the concentration of heavy metals in plant tissue increased with amount of metals supplied to soil through additions of sludge, until they reached a maximum concentration which did not respond to further applications of metals.
190

Winter School on “Waste recycling and resource management”-Dec. 3-23, 2014
There are several mechanisms, which may act concurrently, that could explain such observation.
Soil factor:
(i) Sludge chemistry: Sewage sludges typically contain a high proportion of organic and amorphous oxide components which have a high capacity for specific sorption of metals. Concentration of metal in plants approaches a plateau with increasing sludge application rate because addition of the sludge to the soil increases not only the total soil metal content, but also the metal adsorption capacity of the soil, thereby potentially reducing total metal availability.
(ii) Precipitation reactions could limit metal solubility. Increases in the total metal concentration in the soil above a critical limit for metal precipitation would not lead to further increases in metal concentrations in the soil solution, and there would therefore be no further increase in absorption of metals by the plant roots.
Plant physiological factors:
(i) Excluder mechanism: Plant blocks the translocation of metals from the root to the shoot in order to reduce the accumulation of toxic metals in the leaves. As trace metals such as Zn and Cu are essential micronutrients, any such exclusion mechanism would of necessity either not function or function less efficiently at low concentrations of metals in the soil solution, and hence uptake of metals by plants at lower soil concentrations could be concentration dependent. However, when metal concentration in solution reached a threshold level, this mechanism could activate, resulting in the concentration-independent uptake of metals that has been reported at higher metal concentrations in the soil.
(ii) Saturation of transport system into roots: The uptake of Zn and other transition metals is postulated to occur through a channel or carrier mediated process which becomes saturated at relatively low concentrations of substrate in solution. At metal concentrations at which the uptake mechanism is saturated, there would be no further increase in metal uptake with increasing concentrations in the soil solution. (iii) Root avoidance mechanism: Roots proliferate less in surface soil layer contaminated heavily with sludges or MSW, thereby reducing metal uptake by plants growing in sludge amended soils
Heavy metal impact on soil
Several workers in different parts of world have reported that continuous application of municipal organic waste has resulted in heavy metal enrichment in soil when analytically determined as total contents in digests with strong inorganic acids.
Total amounts of heavy metals are not decisive for mobility and bioavailability. Long-term application of metal contaminated sludge generally results in heavy metal bioavailability; although less soluble or unavailable (which are not susceptible to plant uptake or leaching) fraction also increases over time. Metal inputs by sewage sludge have been found to cause a
191

Winter School on “Waste recycling and resource management”-Dec. 3-23, 2014
marked increase in metal availability in slightly acidic sandy loams, a smaller increase in slightly acidic clays and had little effect in an alkaline loam. Such mobility of metals may have impact on groundwater quality particularly under heavy contaminated sludge application in soils with low fixation capacity. Thus total heavy metal concentrations in sewage sludge, soil pH, CEC, mineralization of OM are the main criteria to control metal accumulation by crops as well as their downward leaching.
Heavy metals are also known to be toxic to microorganisms which led to concerns that soils treated with metal contaminated sludge could adversely affect the mineralization of organic N in the soil sludge-plant system. Overall, the effect on microbial activity was greater in loams when compared to soil richer in SOM. Increasing heavy metal concentrations from different sources, including sewage sludge, generally resulted in a decreasing biomass C : soil C ratio and caused a shift in the microbial community structure towards fungi.
Limits on Contaminants in Biosolids and Composts
The different laws in developed countries include specific approaches to limit the load of pollutants via sewage sludge or compost application onto soil. European Union regulates limit values for heavy metal concentrations in soil to which sludge is applied, in sludge, and maximum annual quantities of heavy metals added to agricultural soils. The US EPA developed use and disposal regulations for sewage sludge also including pollutant limits, operational requirements, as well as management practices.
Heavy metal input to soils is regulated in the developed countries by at least defining limit concentrations in the sludge to be applied in agriculture. Regarding the standards for metals in sewage sludge ("ceiling concentrations") which at least must be met to allow any application onto agricultural land, the US EPA permits the highest limit values among developed nations (Tab. 1).
Two different approaches are behind these standards: (1) a risk assessment on the basis of "no observed adverse effect concentrations" (NOAECs); (2) a precautionary approach to avoid any accumulation of possibly hazardous elements in soil (EU). The EPA Part 503 rule was developed realizing that the use or disposal of biosolids will result in environmental changes, as does the use of all other fertilizers, the construction of buildings, and many other aspects of human activity. The biosolids risk assessment process provides a scientific basis for determining acceptable environmental change when biosolids are used or disposed. Acceptable change means that even though changes have occurred as a result of the use or disposal of biosolids, (e.g., increases in nutrients, organic matter, and pollutants), public health and the environment are still protected from the reasonably anticipated adverse effects of pollutants in biosolids. EU countries have generally adopted ‘No net degradation and precautionary principle policy-driven approaches as a basis for setting limits for biosolids. Countries using this approach generally allow only small, incremental increases of pollutants from the use or disposal of biosolids over
192

Winter School on “Waste recycling and resource management”-Dec. 3-23, 2014
background levels of pollutants in the environment. The US EPA also established maximum cumulative pollutant loading rates for eight metals at land application sites. A third set of metals criteria is also considered, known as pollutant concentrations (Tab. 1). If these concentrations are not exceeded in the biosolids applied to land, the cumulative pollutant loading rates do not need to be tracked. Absolute permissible loads via sewage sludge or compost to be land- applied are given in Tab. 1 and 2. If the ceiling concentration of Cd is put into consideration, the annual whole sludge application rate in the USA may amount to 22 Mg d.m. ha-l yr-l; whereas, for example, the sludge application rate in Germany is limited to 5 Mg d.m. ha-1 (3 yr)-1. Exceeding the concentration limits of one or more heavy metals in soil will prohibit any use of sewage sludge. Furthermore it has to be ensured that the limit values are not exceeded as a result of sludge use.
Phytoavailability of Applied Heavy metals over Time
Although concern about long-term phytoavailability of metals in soils amended with biosolids and compost has been part of the focus of research in this area of science for over 30 years, some continue to express concern about the long-term risk from metals in biosolids and composts.
Organic matter comprises the most important metal-adsorbing constituents in biosolids-amended soils, and because the added organic matter eventually oxidizes to the level appropriate for the climate, texture, and cropping pattern of the soil in question, the added metals would become more plant available over time and eventually poison plants and animals. Thus metals in land-applied biosolids/compost may threaten soil fertility and food chain safety and comprise a "time bomb" because applied organic matter is biodegradable. Many researchers had this concern in the 1970s, before extensive research conducted in several nations failed to support this model. High applications of biosolids would add higher amounts of specific metal binding strength to the amended soil, which would cause lower Cd uptake slopes compared to lower cumulative biosolids/compost application rates. Because soil pH strongly affects uptake of Cd, valid comparisons of soil differences should be made at equivalent soil pH levels.
193

Winter School on “Waste recycling and resource management”-Dec. 3-23, 2014
Table 1. Limit values for concentrations (mg/kg dry wt.) of HM in biosolids
Table 2. Limit values for concentrations (mg/kg dry wt.) of HM in MSW compost
800 100 50 2.5 600 100 2 Sweden
300 100 30 0.75 75 75 1.25 Netherlands
4200 1100 420 11 1700 2800 34 Canada
4000 1000 400 15 1500 1200 30 Russia
2800 300 420 17 1500 1200 39 USA-Pollut.
7500 840 420 57 4300 3000 85 USA-ceiling
3000 800 200 10 1000 1000 20 France
2500 900 200 8 800 900 10 Germany-BS
2500-4000
750-1200
300-400 16-25 1000-1750 - 20-40
EU
Zn Pb Ni Hg Cu Cr Cd
1000 100 50 0.15 300 50 5 India
400 150 50 1 100 100 1.5 Germany
200-4000
120-1200
20-400 0.3-25 60-1200 50-750 1.2– 4.0 European countries
Zn Pb Ni Hg Cu Cr Cd
194

Winter School on “Waste recycling and resource management”-Dec. 3-23, 2014
Impact of Wastewater Application on Soil Health
M. Vassanda Coumar
Scientist, Division of Environmental Soil Science, Bhopal
Water is one of the most precious natural resources, without which it is impossible to sustain life.
India has 4% of water resources of the world, while it has to support 16% of world population
and 15% of livestock. The demand for water shows that the agricultural sector uses around 79%
of the available freshwater supply. The domestic sector consumes around 6% while the industrial
sector consumes around 5%. With this exponential increase in demand for water, the projected
municipal and domestic water demand will be double by 2030, to 108 billion m3 (7% of total
demand), while projected demand from industry will quadruple to 196 billion m3 (13%), pushing
overall demand growth close to 3% per annum (CGWB, 2011). On the other hand, about 80% of
water supplied (especially in urban areas) becomes wastewater. It is estimated that 26,254 MLD
of domestic wastewater is generated from urban centres while 13,468 MLD of industrial
wastewater is generated. However, the treatment capacity available for domestic wastewater is
only for 6,955 MLD, against 8,000 MLD of industrial wastewater (CPCB 2007; Sengupta 2008).
Thus, there is a huge gap between sewage generated and treatment capacity: Only 30% of total
sewage generated by urban India treated and the rest is discharged directly to water bodies or to
the land surface. In arid and semi-arid regions, this wastewater is considered a valuable source of
irrigation water.
With the present population growth rate (1.9% per year), the population is expected to cross the
1.5 billion mark by 2050. Due to increasing population and all round development in the country,
the per capita average annual freshwater availability has been reducing since 1951 from 5177 m3
to 1869 m3, in 2001 and 1588 m3, in 2010. It is expected to further reduce to 1341 m3 in 2025
and 1140 m3 in 2050 (CWC, 2010). As fresh water becomes increasingly scarce due to
population growth, urbanization and climate change, the use of wastewater in agriculture will
increase even more. It can be seen that irrigation sector is consuming most of the water (about
85% of total water) and in future to meet the food demand, additional water will be required to
meet the demand of irrigation sector. Further, it has been estimated that the projected wastewater
generation from urban centres may cross 120,000 MLD by 2051 and that rural India will also
195

Winter School on “Waste recycling and resource management”-Dec. 3-23, 2014
generate not less than 50,000 MLD. Thus, a huge quantity of wastewater generation gives an
opportunity for its use in agricultural sector for meeting the irrigation water demand in water
scares areas. Wastewater has been widely used as a low-cost alternative to conventional
irrigation water; it supports livelihoods and generates considerable value in urban and periurban
agriculture.
Benefits and risk associated with the use of Wastewater
The main benefits of wastewater Irrigation with treated wastewater has been used for three
purposes: (a) complementary treatment method for wastewater (Bouwer and Chaney 1974), (b)
the use of marginal water as an available water source for agriculture (Bouwer and Idelovitch,
1987), and (c) the use of wastewater as nutrient source (Bouwer and Chaney 1974; Vazquez-
Montiel et al. 1996) associated with mineral fertilizer savings and high crop yields (Smith and
Peterson, 1982). However, besides these beneficial effects wastewater often contains appreciable
amounts of organic and inorganic toxic materials. The organic pollutants being biodegradable are
less persistent, and presumably have transient and less serious effects in soil environment as they
eventually metabolize to carbon dioxide and other simpler products. Among the inorganic
substances, heavy metals are often present in substantial quantities chelated by the organic matter
in wastewater. When wastewater is applied to agricultural fields, heavy metals enter the soil and
get fixed to the soil components. Thus continuous application of wastewater tends to accumulate
large quantities of heavy metals in soil, which persists there for an indefinite period to have long
lasting effects in the soil environment (Kabata-Pendias and Pendias 2002). Inhibition of root
growth, shoot development and various metabolic processes in plants have been reported
because of higher concentrations of heavy metals in soils which further resulted in chlorisis,
damage to root tips, reduced water and nutrient uptake and damage to enzyme system (Baisberg-
Pahlsson 1989; Sanita di Toppi and Gabbrielli 1999). Chronic lower level intakes of toxic
elements have damaging effects on human beings and other animals (Ikeda et al. 2000), since
there is no efficient mechanism for their elimination, and the detrimental impact becomes
apparent only after several years of exposure (Bahemuka and Mubofu 1999). Consuming food
contaminated by Pb, Hg, As, Cd and other metals can seriously deplete body stores of Fe,
vitamin C and other essential nutrients, leading to decreased immunological defences,
intrauterine growth retardation, impaired psycho-social faculties and disabilities associated with
196

Winter School on “Waste recycling and resource management”-Dec. 3-23, 2014
malnutrition (Iyengar and Nair 2000). There have been a number of risk factors identified for
using wastewater for purposes such as agricultural irrigation. Some risk factors are short term
and vary in severity depending on the potential for human, animal or environmental contact (eg,
microbial pathogens), while others have longer term impacts which increase with continued use
of wastewater (eg, saline effects on soil). Therefore, inappropriate handling and management of
wastewater for irrigation can create serious environmental and health hazards. This encourages
most countries to continuously modify and update the standards and guidelines for reuse of
wastewater for irrigation.
Wastewater classification
Definitions and concepts of wastewater are given in various reports and textbooks (Metcalf and
Eddy 1995; Westcot 1997; Asano and Levine 1998; Martijn and Huibers 2001). The urban
wastewater may be a combination of some or all of the following:
i) Domestic effluent consisting of blackwater (excreta, urine and associated sludge) and
greywater (kitchen and bathroom wastewater).
ii) Water from commercial establishments and institutions, including hospitals.
iii) Industrial effluent.
iv) Stormwater and other urban runoff.
The actual proportion of each constituent within any given urban sewage load will vary due to
spatial and temporal differences. In irrigation, sometimes the term marginal quality water is used.
This refers to water whose quality might pose a threat to sustainable agriculture and/or human
health, but which can be used safely for irrigation provided certain precautions are taken.
Wastewater Utilization
The following three types of wastewater use are the most relevant:
Direct use of untreated wastewater is the application to land of wastewater directly from a
sewerage system or other purpose-built wastewater conveyance system. Control exists over the
conveyance of the wastewater from the point of collection to a controlled area where it is used
for irrigation (Westcot 1997).
197

Winter School on “Waste recycling and resource management”-Dec. 3-23, 2014
Direct use of treated wastewater is the use of treated wastewater where control exists over the
conveyance of the wastewater from the point of discharge from a treatment works to a controlled
area where it is used for irrigation. Many countries in the Middle East make use of wastewater
stabilization ponds to remove pathogens from wastewater. The effluent from the ponds is used
for irrigation. To describe such a situation the term reclaimed water is often used, meaning water
that has received at least secondary treatment and is used after it flows out of a domestic
wastewater treatment facility.
Indirect use of wastewater is the planned application to land of wastewater from a receiving
water body. Municipal and industrial wastewater is discharged without treatment or monitoring
into the watercourses draining an urban area. Irrigation water is drawn from rivers or other
natural water bodies that receive wastewater flows. There is no control over the use of water for
irrigation or domestic consumption downstream of the urban centre. As a consequence, many
farmers indirectly use marginal quality water of unknown composition that they draw from many
points downstream of the urban centre.
Impact of Wastewater irrigation on soil Quality
Today, due to constraint in availability of fresh water for irrigation, waste water especially
sewage water is being used for irrigation of agricultural fields. Various studies confirm that
treated sewage wastewater can be useful as an additional water resource for irrigation (Palese et
al. 2009; Mehrdadi et al. 2007). Application of sewage water improved the physico-chemical
properties and nutrient status of the soil and increases crop production as it supplies N, P and K
and also valuable micronutrients than what crop requires (Panicker 1995). On the other hand, the
use of sewage water in agriculture is associated with health risks because of presence of
pathogenic micro-organisms (Toze 2006), metallic contaminants like Cu, Ni, Cd, Cr, Zn (Misra
& Mani 1991) and polychlorinated substances (Bansal 1998).The long-term use of wastewater
can become self-limiting due to soil damage. There is a well recognized need to detect the level
of pollution of soil given the increased use of sewage water in agricultural soils which provides
an indication of soil health. Repeated application of sewage effluent to agricultural lands can
have significant effects on soil properties.
198
Winter School on “Waste recycling and resource management”-Dec. 3-23, 2014
Physical properties
The bulk density of soils irrigated with sewage water was low (1.2 to 1.39 Mg m-3) as compared
to those for the well-irrigated soils. The soil moisture retention of sewage-irrigated soils was also
slightly higher as compared to that of sewage–free soils which can be ascribed to addition of
organic matter through sewage. Rattan et al. (2001) observed enhanced available water content
in the soils due to continuous application of sewage waters. The hydraulic conductivity was also
higher (1.10 to 1.33 cm h-1) for sewage irrigated soils. Mathan (1994) recorded significantly
lower bulk density and increased hydraulic conductivity in sewage farm soils with sewage
irrigation for 15 years. This can be attributed to improvement in total porosity and aggregate
stability in the sewage-irrigated soils due to addition of organic matter which plays an important
role in improving soil physical environment.
However, Otis (1984) reported that the application of sewage reduced the hydraulic conductivity
of soils due to pore clogging by suspended solids. This can be justified as the organic suspended
solids may impede water transmission initially by temporarily plugging soil surface and by
clogging of pores and thus, reduce the water availability to irrigated crops.; however, the effect
of organic matter addition through sewage on aggregation improves soil structure and enhances
water transmission. Moreover, salinisation of soil through the application of irrigation water with
high salinity and the subsequent effect on clay in the soil is one mechanism that reduces the
hydraulic conductivity. Other wastewater characteristics that have been identified to reduce
hydraulic conductivity include the present of suspended solids (Magesan et al. 2000), nutrients
which cause excess growth of microorganisms in the soil (Magesan et al. 1999) or interaction of
dissolved organic matter with the soil profile (Tarchitzky et al. 1999). The microorganisms in
this study reduced the hydraulic conductivity in the soil by excess cell growth and the production
of biofilm structures, both of which would have clogged up the pore spaces between the soil
particles.
Chemical properties
Wastewater effluent from domestic sources could supply all of the nitrogen and much of the
phosphorus and potassium that are normally required for agricultural crop production. In
addition, micronutrients and organic matter also provide additional benefits. The salinity of
199
Winter School on “Waste recycling and resource management”-Dec. 3-23, 2014
wastewater can impact both on the soil itself, as well as influencing the growth of the crops being
irrigated. Salinity in the form of sodium can directly affect soil properties through the
phenomena of swelling and dispersion (Halliwell et al. 2001). These effects occur as sodium,
which is a positively charged cation interacts with the negatively charged layers (known as
platelets) of clay particles. As sodium concentrations increase, the electrophoretic mobility of the
clay platelets increases resulting in swelling dispersion of the clay particles thus impacting on
soil permeability (Halliwell et al. 2001). This effect of increasing sodium concentrations on clay
is not uniform, however and can vary between soils with similar soil characteristics (Balks et al.
1998). The reasons for these variations are complex and involve competing properties including
soil texture and mineralogy, bulk density, pH, mechanical stresses and aggregate binding agents
such as iron, aluminium oxides and organic matter (Halliwell et al. 1998). Similarly, deleterious
effects, such as increase in pH, salinity and EC in soils due to use of textile effluent have been
reviewed by Chhonkar et al. (2000).
Sinha et al. (2006) suggested that soil becomes alkaline due to the alkalinity of the tannery
effluent discharged. Electrical conductivity of the target area red soil (0.43 mhos/cm) was greater
compared to the control red soil (0.32 mhos/cm). The conductivity of the target area black soil
was found to be 0.87 which was higher compared to that of control black soil (0.19). High
conductivity of the soil indicates the presence of higher levels of anions and cations in the soil.
Soil discharged with effluents from cotton ginning mills and paper mills showed higher electrical
conductivity (Medhi 2005). Soil analysis in the study done by Sheela and Peethambaram (2007)
revealed that NPK content of the soil was slightly increased by effluent treatment as the nutrients
nitrogen, phosphorus and potassium present in diluted effluent played a role in promoting plant
growth at lower concentration. Irrigation with sewage and pulp paper cult effluent was reported
to enrich the soil, mainly with respect to nitrogen, phosphorus and potassium, and enhanced the
crop yields considerably (Nan and Chung 2001).
Irrigation with wastewater is known to contribute significantly to the heavy metals content of
soil. Heavy metals are very harmful because of their non-biodegradable nature, long biological
half-lives and their potential to accumulate in different body parts. Most of the heavy metals are
extremely toxic because of their solubility in water. Even low concentrations of heavy metals
have damaging effects to man and animals because there is no good mechanism for their
200

Winter School on “Waste recycling and resource management”-Dec. 3-23, 2014
elimination from the body. Nowadays heavy metals are ubiquitous because of their excessive use
in industrial applications. Excessive accumulation of heavy metals in agricultural soils through
wastewater irrigation, may not only result in soil contamination, but also affect food quality and
safety (Muchuweti et al. 2006).
Rajkumar et al. (2005) observed that chromium is a transition metal that is discharged into the
environment through the disposal of wastes from industries like leather tanning and
metallurgical, leading to contamination of soil. Chromium is the main tanning agent and most
hazardous chemical used in chrome tanning process. The excessive use of this chemical leads to
higher concentration in the effluent (Bhalli and Khan 2006). Excessive accumulation of heavy
metals such as cadmium, lead, chromium and nickel in the soil due to effluent discharge and the
resultant phytotoxicity was reported by Peralta et al. (2001) and Tsakou et al. (2001). Cadmium
dispersed in the environment persists in soils and sediments for decades and taken up by plants
which accumulates in the biosphere (Bernard 2008). According to Sinha et al. (2006), chromium
and other metals were found to be high in effluent contaminated soils. Significant increases in
soil metal content were found in areas of high industrial activity where accumulation may be
several times higher than that of the average content in non contaminated areas (Krishna and
Govil 2008).
Khurana et al. (2003) found that mean concentrations of DTPA-extractable Pb, Ni, Cd, Zn, Mn
and Fe in surface soils (0-15 cm) surrounding the densely industrialized city of Ludhiana,
irrigated largely with sewage effluents, were 4.2, 3.6, 0.30, 11.9, 25.4 and 49.2 mg/kg as
compared, with 2.8, 0.40, 0.12, 2.1, 8.3, 10.9 mg/kg, respectively, in the soils around a less
industrialized city of Sangrur, indicating greater loading of soils of Ludhiana with potentially
toxic metals through sewage irrigation. In industrialized cities of Amritsar and Jalandhar, mean
concentrations of these metals, except Pb and Zn in Amritsar, were in-between the values for
Ludhiana and Sangrur.
A long-term study on the use of sewage wastewater in soils of Calcutta (India) reported 2.43,
46.5, 3.81, 0.86, 93.0, 15.9, 3.88, 2.44 and 6.61-fold increase in total-Fe, Zn, Cu, Mn, Cd, Pb,
Co, Ni and Cr concentration in comparison to soils receiving ground water for irrigating the
crops (Gupta and Mitra 2002). A considerable build-up of 1241 mg Fe kg-1, 208 mg Zn kg-1, 37
mg Cu kg-1, 53 mg Mn kg-1, 3.1 mg Cd kg-1, 54 mg Ni kg-1 and 56 mg Cr kg-1 in surface soil
201

Winter School on “Waste recycling and resource management”-Dec. 3-23, 2014
layer with wastewater irrigation over ground water irrigation has been reported. The
accumulation of heavy-metals in the surface soil layers may be the result of sorption reactions of
negatively charged soil colloids for these cationic heavy-metals.
Elevated levels of different heavy-metals in soils irrigated regularly with wastewater have also
been reported (Aghabarati et al. 2008). Significant increase in DTPA-extractable Pb and Cd upto
30 cm soil layer with the application of wastewater, consecutively for 80-years than the soils
irrigated with ground water has been reported. The plough (0-15 cm) layer of soils of highly
industrialized city of Ludhiana (Punjab, India) irrigated largely with sewage effluents are
reported to contain 4.21, 3.58, 0.30, 11.9, 25.4 and 49.2 mg L-1 DTPA-extractable Pb, Ni, Cd Zn,
Mn and Fe were as compared to 2.76, 0.40, 0.12, 2.10, 8.34, 10.88 mg L-1 in the less
industrialized city of Sangrur (Punjab, India) indicating maximum loading of soils of Ludhiana
with heavy-metals through sewage irrigation (Khurana et al. 2003). Likewise sandy soils
irrigated with wastewater are reported to contain 3.2, 122, 129, 186, 22.0, 14.5 and 10.5-fold
higher concentrations of DTPA-Fe, Mn, Zn, Cu, Co and Ni, respectively than soils receiving
ground water as irrigation.
Heavy metals are easily accumulated in the edible parts of leafy vegetables, as compared to grain
or fruit crops. Vegetables take up heavy metals and accumulate them in their edible (Bahemuka
& Mubofu, 1991) and inedible parts in quantities high enough to cause clinical problems both to
animals and human beings consuming these metal-rich plants.
Biological properties
The microbial count in sewage-irrigated soils was higher for bacteria, fungi and actinomycetes
which was about 1.34, 1.52 and 1.18 times (for 0-30 cm) higher as compared to that in normal
soils, respectively. This may be due to the suspended organic material added to soil through
sewage which serves as a source of energy for microbial population (Joshi and Yadav 2005;
Seeker and Sopper, 1988). Irrigation with effluent does not inhibit soil microbial diversity and
soil enzymatic activity, instead of experimental fields have shown that microbial growth, activity
and diversity of micro-organisms and enzymatic activity increased linearly due to accumulation
of organic compounds upto 75% effluent application along with irrigation water. Toxic effects of
heavy metals upon soil micro-organisms and microbial mediated processes have been reviewed
202

Winter School on “Waste recycling and resource management”-Dec. 3-23, 2014
by Duxbury (1985) and Doelman (1986). Studies have shown that on applying sewage water to
soil, Cu is among those metals that would quickly double its concentration in the top soils (Jorge
et al. 2005) and found to be toxic to certain micro organism and enzymatic activity.
Conclusion
Wastewater contains essential nutrients or possesses properties which can easily be utilized for
irrigating the field crops if proper treatment and management practices are adopted. Safe
utilization of wastewater for irrigation to crops requires several precautionary measures viz.
adequate dilution, selection of crop etc. However, repeated application of wastewater may
accumulate appreciable quantities of heavy-metals in the soil. Therefore, periodic monitoring of
soil, wastewater and crop quality are required to ensure successful, safe and long-term use of
WW for irrigation.
References
Aghabarati, A., Hosseini, S. M. and Maralian, H. (2008) Heavy metal concentration of soil and olive trees (Olea eu-ropaea L.) in Suburban areas of Tehran, Iran., Res. J. Environ. Sci., 2: 323-329.
Asano, T. and Levine, A.D. (1998) Wastewater reclamation, recycling, and reuse: an introduction. In: Asano, T.(ed.) Water Quality Management Library 10, Wastewater Reclamation and Reuse. Technomic Publishing Company, Inc., Lancaster, Pennsylvania, pp. 1–56.
Bahemuka, T.E. and Mubofu, E.B. (1999) Heavy metals in edible green vegetables grown along the sites of the Sinza and Msimbazi Rivers in Dares Salaam, Tanzania. Food Chem. 66: 63-6.
Baisberg-Pahlsson, A.M. (1989) Toxicity of heavy metals (Zn, Cu, Cd, Pb) to vascular plants. Water. Air. Soil. Pollut. 47(3-4): 287-319.
Bansal, O. P. (1988) Heavy metal pollution of soils and plants due to sewage irrigation. Indian J. Environ. Hlth. 40 (1): 51-57.
Bouwer, H. and Chaney, R.L. (1974) Land treatment of wastewater. Adv. Agro., 26: 133-176.
Bouwer, H. and Idelovitch, E. (1987) Quality requirements for irrigation with sewage water. J. Irrigat. Drainage Eng., 113: 516-535.
CGWB (2011) Ground Water Year Book - India 2010-11. Central Ground Water Board, Ministry of Water Resources. Government of India.
Chhonkar, P.K., Datta, S.P., Joshi, H.C. and Pathak, H. (2000) Impact of industrial effluents on soil health and agriculture - Indian experience. J. Sci. Ind. Res., 59: 446-454.
203

Winter School on “Waste recycling and resource management”-Dec. 3-23, 2014
CPCB. (2007) Evaluation of Operation and Maintenance of Sewage Treatment Plants in India-2007, Control of Urban Pollution Series: CUPS/68/2007. Central Pollution Control Board, India.
CWC (2010) Water and related statistics. Water Planning and Project Wing, Central Water Commission, India.
Gupta, S.K. and Mitra, A. (2002) In: Advances in Land Resource Management for 21st Century, Soil Conservation Society of India, New Delhi, India, 2002. p. 446-460.
Halliwell, D.J., Barlow, K.M. and Nash, D.M. (2001) A review of the effects of wastewater sodium on soil properties and their implications for irrigation systems. Australian Journal of Soil Research. 39: 1259-1267.
Ikeda, M., Zhang, Z.W., Shimbo, S., Watanabe, T., Nakatsuka, H. and . Moon, C.S. (2000) Urban population exposure to lead and cadmium in east and southeast Asia. Sci. Total Environ. 249: 373-384.
Iyengar, V. and Nair, P. (2000) Global outlook on nutrition and the environment: meeting the challenges of the next millennium. Sci. Total Environ. 249: 331- 346.
Kabata-Pendias, A. and Pendias, H. (2002) Trace elements in soils and plants. CRC, Boca Raton, FL. p.9.
Khurana, M.P.S., Nayyar, V.K., Bansal, R.L. and Singh, M.V. (2003) Heavy metal pollution in soils and plants through untreated sewage-water. In ‘Ground Water Pollution’ (Eds. VP Singh, RN Yadava), pp. 487–95.
Magesan, G.N., Williamson, J.C., Sparling, G.P., Scxhipper, L.A. and Llyod-Jones, A.R. (1999) Hydraulic conductivity in soils irrigated with wastewaters of differing strengths: field and laboratory studies. Australian Journal of Soil Research. 37: 391-402.
Magesan, G.N., Williamson, J.C., Yeates, G.W. and Llyod-Jones, A.R. (2000) Wastewater C:N ratio effects on soil hydraulic conductivity and potential mechanisms for recovery. Bioresource Technology. 71: 21-27.
Martijn, E.J. and Huibers, F.P. (2001) Use of Treated Wastewater in Irrigated Agriculture. Coretech Working Document WP4-1. Irrigation and Water Engineering Group, Wageningen University, Wageningen, The Netherlands, 34 pp.
Mathan, K.K. (1994) Studies on the influence of long-term municipal sewage effluent irrigation on soil properties. Bioresource Technology, 48: 275-276.
Mehrdadi, N., Joshi, S. G., Nasrabadi, T. and Hoveidi, H. (2007) Aplication of Solar Energy for Drying of Sludge from Pharmaceutical Industrial Waste Water and Probable Reuse. Int. J. Environ. Res., 1(1): 42-48.
Metcalf and Eddy Inc. (ed.) (1995) Wastewater Engineering: Treatment, Disposal and Reuse. McGraw-Hill, New York, 1819 pp.
204
Winter School on “Waste recycling and resource management”-Dec. 3-23, 2014
Misra, S.G. and Mani, D. (1991) Soil pollution. Ashish Publishing House, 8/81 Punjabi Bagh, New Delhi, India.
Otis, R.J. (1984) In onsite treatment. 4th National Symposium on Individual and small community sewage systems, New Orleans, Lousiana, December 10-11, 1984.
Palese, A. M., Pasquale, V., Celano, G., Figliuolo, G., Masi, S. and Xiloyannis, C. (2009) Irrigation of olive grooves in southern Italy with treated municipal waste water: Effects of microbiological quality of soil and fruits. Agriculture, Ecosystem and Environment, 129: 43-51.
Panicker, P. V. R. C. (1995) Recycling of human waste in agriculture. In: Tandon, HLS(Ed.), Recycling of waste in Agriculture. Fert. Dev. Consultation Org., New Delhi, India, p 68-90.
Rattan, R.K., Datta, S.P., Singh, A.K., Chonkar, P.K. and Suribau, K. (2001) Effect of long-term application of sewage effluents on available nutrient and available water status in soils under Keshopur effluent irrigation scheme in Delhi. Journal of water Management 9: 21-26.
Sanita di Toppi, L. and Gabbrielli, R. (1999) Response to cadmium in higher plants. Environ. Exp. Bot. 41(2): 105-130.
Sengupta, A.K. (2008) WHO Guidelines for the Safe Use of Wastewater, Excreta and Greywater In: National Workshop on Sustainable Sanitation, 19-20 May 2008, New Delhi. http://www.whoindia.org/LinkFiles/Waste Water_Management_WHO Guidelines for_the safe use of wastewater, excreta_use_of_wastewater, excreta and greywater. Pdf
Tarchitzky, J., Golobati, Y., Keren, R. and Chen, Y. (1999) Wastewater effects on montmorillonite suspensions and hydraulic properties of sandy soils. Soil Science Society of America Journal. 63: 554-560.
Toze, S. (2006) Reuse of effluent water-benefits and risks. Agric. Water Management, 80: 147-159.
Vazquez-montiel, O., Horan, N.J. and Mara, D.D. (1996) Management of domestic wastewater for reuse in irrigation. Water Sci. Tech., 33: 355-362.
Westcot, D. W. (1997) Quality control of wastewater for irrigated crop production. Water Report no. 10. Food and Agriculture Organization of the United Nations (FAO), Rome, Italy, 86 pp.
205

Winter School on “Waste recycling and resource management”-Dec. 3-23, 2014
0
50
100
150
200
250
300
350
400
05
101520253035404550
2003 2010 2025
Fo
od
gra
in p
rod
uc
tio
n
Nu
trie
nts
Year
Foodgrain production (Mt)NPK Demand (Mt)NPK Consumption (Mt)NPK Gap (Mt)
Organics as Sources of Plant Nutrient for Improving Nutrient Use Efficiency
Brij Lal Lakaria
Indian Institute of Soil Science, Nabibagh, Bhopal (M.P.) – 462 038
India hosts Indian agriculture has grown over past 50 years from subsistence of farming
to a market surplus one with the present food grain production above 250 million tones (Fig. 1)
which was only 50 million tones in 1950. At the same time the country has struggled over the
years to meet the fertilizer requirement. More than 50 per cent fertilizer consumption is
imported. The response ratio (kg
grain/ kg nutrient) in food grain
crops in irrigated areas in India
(Fig. 1) substantially declined
between 1960 and 2008 (Biswas
and Sharma, 2008). The need to
improve NUE is therefore of
paramount importance both for
economical as well as
environmental reasons. At the
same time, overexploitation and degradation of natural resources is one of the major constraints
that agriculture faces worldwide.
In India, currently the gap between annual output
of nutrients (NPK) from soil due to crop removals and the
nutrient inputs from external sources (fertilizers) is
negative by about 10 million tonnes (Sundaram 2001).
Also, 15% of the animal population., which, apart from
supplying milk and draught power in agricultural
operations, also contribute valuable plant nutrients acting
as supplement to the fertilizer nutrients. Increasing
consciousness about conservation of environment as well as health hazards associated with
206
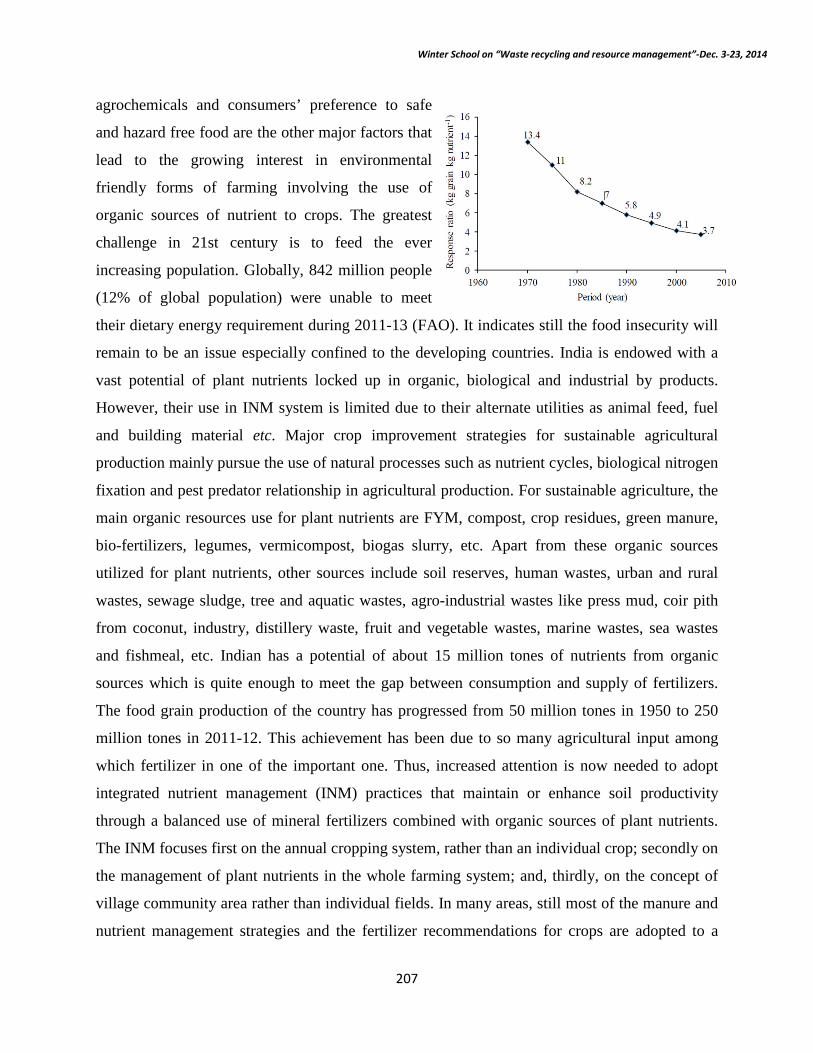
Winter School on “Waste recycling and resource management”-Dec. 3-23, 2014
agrochemicals and consumers’ preference to safe
and hazard free food are the other major factors that
lead to the growing interest in environmental
friendly forms of farming involving the use of
organic sources of nutrient to crops. The greatest
challenge in 21st century is to feed the ever
increasing population. Globally, 842 million people
(12% of global population) were unable to meet
their dietary energy requirement during 2011-13 (FAO). It indicates still the food insecurity will
remain to be an issue especially confined to the developing countries. India is endowed with a
vast potential of plant nutrients locked up in organic, biological and industrial by products.
However, their use in INM system is limited due to their alternate utilities as animal feed, fuel
and building material etc. Major crop improvement strategies for sustainable agricultural
production mainly pursue the use of natural processes such as nutrient cycles, biological nitrogen
fixation and pest predator relationship in agricultural production. For sustainable agriculture, the
main organic resources use for plant nutrients are FYM, compost, crop residues, green manure,
bio-fertilizers, legumes, vermicompost, biogas slurry, etc. Apart from these organic sources
utilized for plant nutrients, other sources include soil reserves, human wastes, urban and rural
wastes, sewage sludge, tree and aquatic wastes, agro-industrial wastes like press mud, coir pith
from coconut, industry, distillery waste, fruit and vegetable wastes, marine wastes, sea wastes
and fishmeal, etc. Indian has a potential of about 15 million tones of nutrients from organic
sources which is quite enough to meet the gap between consumption and supply of fertilizers.
The food grain production of the country has progressed from 50 million tones in 1950 to 250
million tones in 2011-12. This achievement has been due to so many agricultural input among
which fertilizer in one of the important one. Thus, increased attention is now needed to adopt
integrated nutrient management (INM) practices that maintain or enhance soil productivity
through a balanced use of mineral fertilizers combined with organic sources of plant nutrients.
The INM focuses first on the annual cropping system, rather than an individual crop; secondly on
the management of plant nutrients in the whole farming system; and, thirdly, on the concept of
village community area rather than individual fields. In many areas, still most of the manure and
nutrient management strategies and the fertilizer recommendations for crops are adopted to a
207

Winter School on “Waste recycling and resource management”-Dec. 3-23, 2014
very limited scale due to perceptions such as the fertilized foods are harmful to soil health. At
present even the farmers are experiencing fatigue in crop yields and realizing decline in soil
health due to imbalanced fertilizer application. Therefore efforts towards the use of organic
sources, such as crop residues, FYM, poultry manures, cow dung manure, oil seed cakes, green
manures and agro-industrial by products, as a source of plant nutrients (Table 1&2) would be
essential in improving soil fertility and productivity. In addition to these sources ample forest
litter is available for communities residing adjoining to forest area which can provide about 15
million tones of compost. In addition to it there are vast scope to promote organic inputs to field
such as green manuring, biofertilizer additions, Rhizobium, BGA, Azolla and PSB etc (Table 3).
along with inorganic fertilizer addition to sustain the productivity.
Table 1 Nutrient Potentials of Organic manures and residues and their availability
Manure Total quantity available (m t)
Total nutrients (000, t y-1)
N P2O5 K2O Total
Cattle dung manure 279 2813 2000 2069 6882
Crop residue 273 1283 1966 3904 7153
Rural compost 285 1431 861 1423 3715
City refuse 14 98 64 112 294
Sewage sludge 0.5 5 3 3 11
Press mud 3 33 79 56 168
Table 2 Availability of various residues (t ha-1) and nutrient content therein (%)
Crop Residues Quantity N P K
Mustard straw 1.8-2.2 0.45 0.53 1.48
Castor shell 0.5 1.01 0.35 1.86
Wheat straw 1.8-2.5 0.53 0.10 1.10
Cotton stalk 4.0-5.0 0.44 0.10 0.66
208

Winter School on “Waste recycling and resource management”-Dec. 3-23, 2014
Paddy straw 2.20 0.36 0.08 0.71
Rice husk 0.25 0.45 0.25 0.45
Sugarcane trash 9.0 0.35 0.12 0.6
Maize cobs 0.8-1.2 0.42 1.57 1.65
Groundnut shell 0.8 1.25 0.46 1.5
Banana pseudo stem 9.0 0.61 0.12 1.0
Pigeonpea stalk 1.5-2.0 1.10 0.58 1.28
Pearlmillet straw 0.4 0.65 0.75 2.50
Table 3 Biofertilizer production in India during 2011-12
Zone States Tonnes
West zone M.P., Chhatisgarh, Rajasthan, Goa, Maharashtra 11528
North Zone H.P., Uttrakhand, Punjab, Haryana, Delhi 12183
South zone AP, Karnataka, TN, Pondicherry, Kerala 11674
East zone Bihar, Orissa, W.B., Jharkhand 1277
North East zone Assam, Mizoram, Nagaland, Tripura 1624
Source: National centre of organic farming, Department of Agriculture and Co-operation
In another estimate by Tandon, 1997 the availability of organic manure has been proposed to be around 32 m tones by 2025 from different sources (Table 4)
Table 4 Aavailability of nutrients (N+P2O5+K2O) by 2025
Resources Potential Tapable*
Human excreta 2.60 2.60
Livestock dung 7.54 7.54
Crop residues 22.27 22.27
Total 32.41 32.41
* Tapable 30% dung, 80%human excreta, 30% residues
209

Winter School on “Waste recycling and resource management”-Dec. 3-23, 2014
Green Manures
Green manuring can be defined as a practice of ploughing or turning into the soil undecomposed green plant tissues for improving physical structure as well as soil fertility. Green manuring, wherever feasible, is the principal supplementary means of adding organic matter to the soil. The green-manure crop supplies organic matter as well as additional nitrogen, particularly if it is a legume crop, due to its ability to fix nitrogen from the air with the help of its root nodule bacteria. The green-manure crops also exercise a protective action against erosion and leaching. Green manure to be incorporated in soil before flowering stage because they are grown for their green leafy material, which is high in nutrients and protects the soil. Green manures will not break down in to the soil so quickly, but gradually, add some nutrients to the soil for the next crop. The nutritional potentials of some important green manures are given in the Table 5 and 6 respectively.
Table 5 Nutrient potential of green manures
Green manure Biomass (tones) N accumulobase (Kg/ha)
Sesbania aculeate 22.50 145.00
S. rostrata, 20.06 146.00
Crotalaria juncea 18.40 113.00
Tephrosia perpurea 6.80 6.00
Green gram 6.50 60.20
Black gram 5.12 51.20
Cow pea 7.12 63.30
Advantages of organic manure additions:
• Creates optimal conditions in soil for high yields and good quality crops,
• Supply of all the nutrients required by the plants,
• Improvement in the growth and physical activity of the crop plants,
• Improvement in granulation, tilth, aeration, root penetration, and water holding capacity of
the soil.
210

Winter School on “Waste recycling and resource management”-Dec. 3-23, 2014
• Also fibrous portion of the roots improve the soil aggregation and permeability of soil.
• The carbon added through manures is a source of energy for the microbes which help in
aggregation and thus increases water retention and decreases the soil erosion.
Manure Efficiency: Improving NUE is of paramount importance both from an economic as well
as an environmental point of view. Among several strategies to improve NUE, balanced
nutrition, particularly balancing N and potassium (K) nutrition and tapping into the synergistic
effect of N and K, is recently gaining importance. The efficiency of fertilizer N is only 30-40%
in rice and 50-60% in other cereals. The N use efficiency is low mainly because of
immobilization, volatilization, denitrification and leaching losses. There are several reports
indicating the positive effects of N and K interaction in terms of crop productivity and
economics, but the balance of N and K application is not appropriately practiced in many parts of
the world. Positive interaction of N and K has been reported in many rainfed cereals like
sorghum, pearl millet, finger millet, maize, and minor millets. In a study based on 241 site-years
of experiments in China, India, and North America, balanced fertilization with N, phosphorus
(P), and K increased first-year recoveries by an average of 54% compared to recoveries of only
21% where N was applied alone (Brar et al. 2011). It has also been demonstrated that with the
application of PK, the agronomic efficiency of N (AEN) improved substantially (6.7 kg grain/kg
N) in sorghum and (10.3 kg grain/kg N) in pearl millet. Balanced fertilization improved both
AEN as well as partial factor productivity of fertilizer N at on farm locations. Phosphorus use
efficiency ranges between 15-20% on account of fixation in soils as Al-P, Fe-P and Ca-P. The
use efficiency of potassium is maximum compared to other nutrients and it can be as high as
even 70-80% . Its fixation in clay-lattice also prevails but it is still not permanent one.
The use efficiency of manures such as FYM may be adjudged in three ways viz., Efficiency in
comparison to fertilizers, Advantages of its application in addition to NPK (add-on series) and
Possibilities of economy of N/NPK by FYM (replacement). Numerous studies conducted have
revealed improvement in soil properties with the application of manures along with significant
improvements in yields of various crops. Large amounts of data are published form experiments
conducted under AICRP on long term in this respect. Application of FYM along with NPK has
211

Winter School on “Waste recycling and resource management”-Dec. 3-23, 2014
been found to sustain the productivity in different cropping systems. In a study, application of
FYM with NPK increased the recovery efficiency of N by 45.2% in maize and 68.2% in wheat.
Similarly recovery efficiency of P increased by 28.4% and 34.2 % and that of K by 59 and 108%
by maize and wheat in a long term experiment. Significant improvement in crop yield under
different long term fertilizer experiments has been demonstrated while substituting about 50% of
N requirement by organic sources at various centres of AICRPs (Table 6) under rice-rice
cropping system. In Titabar (Assam) use of moderate level of N, P and K i.e. 40:20:20 kg ha-1 to
each crop is recommended. Use of organic sources, such as FYM, compost, green manure,
Azolla etc to meet 25-50% of N requirement in Kharif rice help curtailing NPK by 25-50%. In
another study application of 75% of recommended NPK along with rice straw or azolla is
recommended to supply 25% of fertilizer N in monsoon rice. This IPNS strategy improves the
fertilizer use-efficiency and helps in saving of 25% fertilizer dose in acid soils (Entisols and
Inceptisols) of Assam. When Azolla or rice is applied to monsoon rice, it is possible to curtail
25% fertilizer NPK even in subsequent summer rice without any yield reduction. In rice – wheat
cropping system at Malan (H.P.), a temperate region, application of 5 t FYM+50% RDF resulted
13.7% more rice and 32.2% more wheat yield as compared to 100% RDF. These results clearly
suggest that in a two crops a year cropping system at least 25% economy of the recommended
dose for the entire cropping can be affected by the FYM.
Table 6. Effect of N substitution through organic sources on rice yields (t ha-1)
Treatment Bhubneswar Maruteru Karjat Karamana
100% RDF in rabi and Kharif 9.0 10.7 8.2 7.6
50% N through FYM/compost+50% RDF in kharif 100% RDF Rabi
9.8 10.5 7.7 8.1
50% N through crop residues +50% RDF in kharif 100% RDF Rabi
9.4 10.4 7.9 7.9
50% N through green manure +50% RDF in kharif 100% RDF Rabi
9.7 10.7 8.5 8.5
212

Winter School on “Waste recycling and resource management”-Dec. 3-23, 2014
Epilogue
The dependency on commercial fertilizers is mainly because of their quick effects on the crop
growth and yields. From each corner the soils are experiencing a decline in crop yields due to
similar management strategies and there has been decline in crop response ratio. There seems no
way out rather ensuring that plants receive an adequate and balanced supply of nutrients. The
appropriate environment must exist for nutrients to be available to a particular crop in the right
form, in the correct absolute and relative amounts, and at the right time for high yields to be
realized in the short and long term. In this regard it is important to utilize the available and
tapable organic resources to recycle plant nutrients to soil system for better soil health and crop
production since there exists a huge gap between the demand and supply of plant nutrients for
sustainable crop production. Research need to be further carried out for promoting biological
nitrogen-fixation as a low-cost “organic” approach to increasing nitrogen availability and organic
matter content in soils. The application of targeted, sufficient, and balanced quantities of organic
sources along with inorganic fertilizers will be necessary to make nutrients available for high
yields without polluting the environment. Also our holistic efforts are required to improve the
availability and use of secondary nutrients and micronutrients, organic fertilizers, and soil-
conservation practices.
References:
Biswas, P.P., and P.D. Sharma. 2008. A new Approach for Estimating Fertilizer Response Ratio: The Indian Scenario, Indian J. Fert. 4(7):59-62.
Brar, M.S., Bijay Singh, S.K. Bansal and Ch. Srinivasarao. 2011. Role of Potassium Nutrition in Nitrogen Use Efficiency in Cereals. Research Findings, International Potash Institute, e-ifc No. 29, December 2011.
Tandon, H.L. S. 1997. Organic Sources: An Assessment of Potential Supplies, their Contribution to Agricultural Productivity and Policy Issues for Indian Agriculture from 2000-2025. In. Plant Nutrient Needs, Supply, Efficiency and Policy Issues 2000-2025. (Eds. Katyal and Kanwar), pp 15-28.
213

Winter School on “Waste recycling and resource management”-Dec. 3-23, 2014
Microbial diversity on composting processes
M.C. Manna
Indian Institute of Soil Science, Nabi Bagh, Berasia Road, Bhopal
The organic substrates and bulking agents used in composting are mainly derived from
plants. The process is carried out by various microorganisms who decompose these wastes.
Decomposition by microorganisms occurs predominantly in the thin liquid films (biofilms) on
the surface of the organic particles. A certain amount of knowledge regarding the composition
and the microbial populations involved in the nutrient cycles (i.e. C, N, S, P) in mature composts,
is important in order to predict its potential impact on soil fertility and other biological
parameters. Bacteria related to the genus Arthrobacter form a numerically important fraction of
the natural bacterial flora of soils and their presence and numbers in mature composts could be
used as an additional microbiological parameter for compost maturity evaluation. Species
diversity seems to be correlated with stability of the end product. Furthermore, the degree of
maturity of the compost affects its successful utilization in agriculture.
During composting, carbon compounds provide the energy for microbial maintenance
and growth. The yield coefficient, that is the amount of C incorporated into the cells per unit of
degraded C ranges from 10% to 35%. It depends on the content of substrate energy content,
degrading organism and environmental conditions. The other macronutrients required by
microorganisms for their growth besides a C source, are N, P, K and trace elements. Nitrogen is
a critical element for microbial growth, and its fall below the optimal level will slow down the
degradation process where as excess N may be lost from the system as ammonia or through
leaching as nitrate.
Assuming microbial yield coefficient of 30%, and an average microbial C:N of 10, the
theoretical optimum substrate C:N ratio comes to 30. In practice the optimum substrate C:N ratio
has been reported to range between 25 and 35. During the process, the C:N ratio decreases
markedly because, part of the C is lost as CO2 during microbial respiration while N is recycled .
Such curves, including extension of the time axis, may vary to a great degree depending on
factors such as substrate, outside temperature, moisture availabilty and type of aeration or
turning frequency.
214
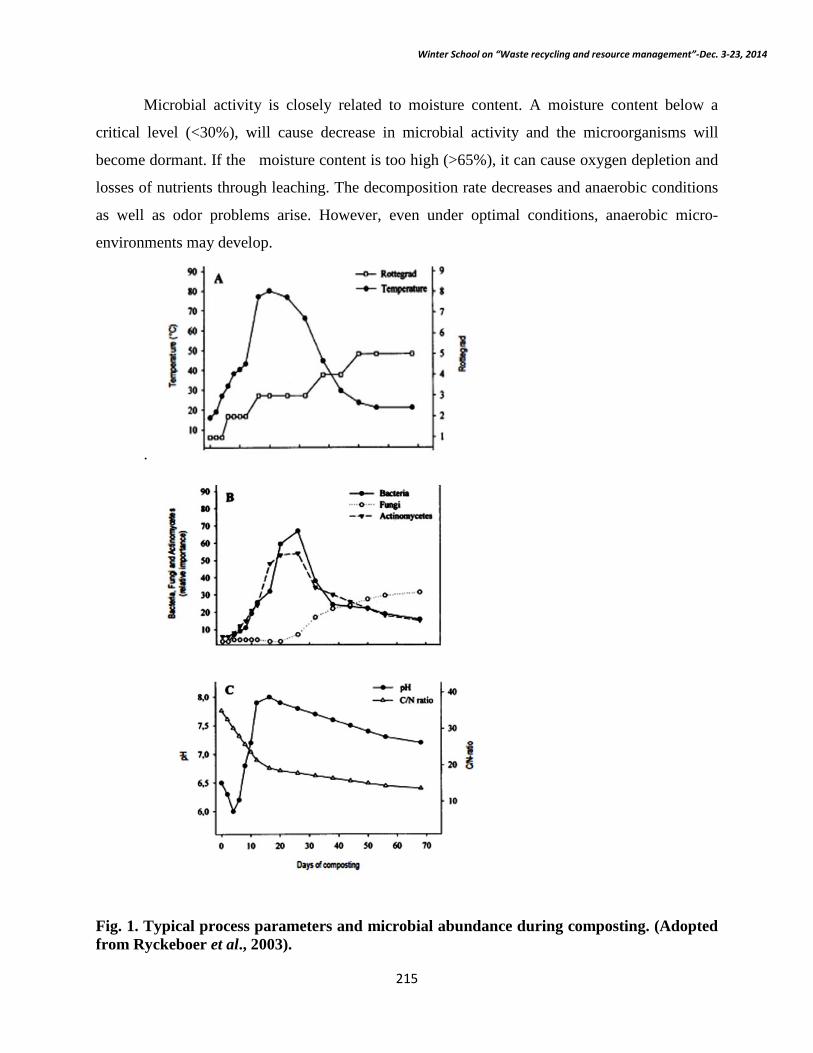
Winter School on “Waste recycling and resource management”-Dec. 3-23, 2014
Microbial activity is closely related to moisture content. A moisture content below a
critical level (<30%), will cause decrease in microbial activity and the microorganisms will
become dormant. If the moisture content is too high (>65%), it can cause oxygen depletion and
losses of nutrients through leaching. The decomposition rate decreases and anaerobic conditions
as well as odor problems arise. However, even under optimal conditions, anaerobic micro-
environments may develop.
.
Fig. 1. Typical process parameters and microbial abundance during composting. (Adopted from Ryckeboer et al., 2003).
215
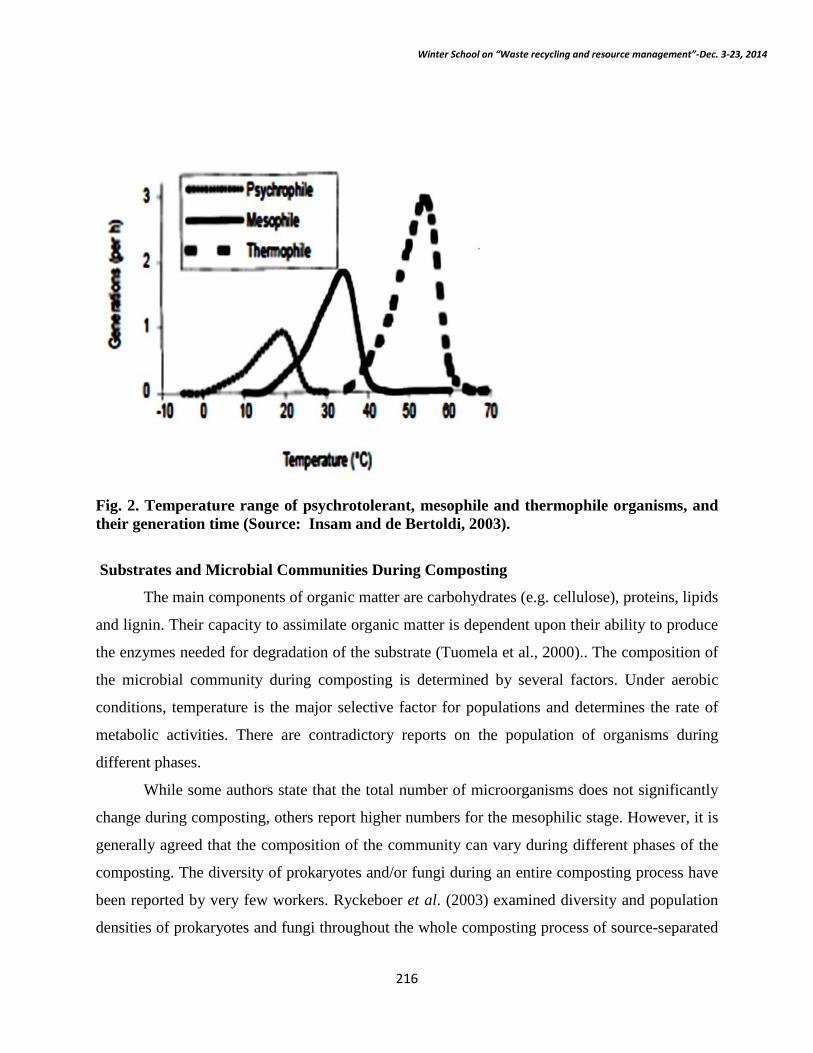
Winter School on “Waste recycling and resource management”-Dec. 3-23, 2014
Fig. 2. Temperature range of psychrotolerant, mesophile and thermophile organisms, and their generation time (Source: Insam and de Bertoldi, 2003).
Substrates and Microbial Communities During Composting
The main components of organic matter are carbohydrates (e.g. cellulose), proteins, lipids
and lignin. Their capacity to assimilate organic matter is dependent upon their ability to produce
the enzymes needed for degradation of the substrate (Tuomela et al., 2000).. The composition of
the microbial community during composting is determined by several factors. Under aerobic
conditions, temperature is the major selective factor for populations and determines the rate of
metabolic activities. There are contradictory reports on the population of organisms during
different phases.
While some authors state that the total number of microorganisms does not significantly
change during composting, others report higher numbers for the mesophilic stage. However, it is
generally agreed that the composition of the community can vary during different phases of the
composting. The diversity of prokaryotes and/or fungi during an entire composting process have
been reported by very few workers. Ryckeboer et al. (2003) examined diversity and population
densities of prokaryotes and fungi throughout the whole composting process of source-separated
216

Winter School on “Waste recycling and resource management”-Dec. 3-23, 2014
household wastes, i.e. from starting material to mature compost. Since starting material and
process conditions determine the community composition to a large degree, it is difficult to make
a generalized statement.
Table 1. Approximate numbers of microorganisms during different phases of composting
Organism Number/ g-1 substrate Bacteria in mesophilic stage 109-1013 Bacteria in thermophilic stage 108-1012 Actinomycetes, thermophilic stage 107-109 Actinomycetes, mesophilic stage 108-1012 Fungi*, average value 105-108
Stages of the Composting Process
The composting process under optimal conditions can be divided into four phases/stages:
(i) an initial (first) mesophilic phase (occurring at 10-42 °C), which may last for only a few hours
or a couple of days (one week); (ii) a thermophilic phase (at 45-70 °C), lasting a few days (6
weeks), several weeks (particularly in food wastes) or even months (particularly in wood
wastes); (iii) second mesophilic phase during which mesophile organisms, often dissimilar to
those of the first mesophilic phase, recolonize the substrates; and (iv) the maturation/curing (2-4
weeks) and stabilization phase which can last for several weeks to months (2-4 weeks).
Different microbial communities predominate during the various composting phases,
each of which being adapted to a particular environment. Physico-chemical environment is
created in composting by primary decomposers, which attack the initial substrates and produce
the metabolites that are suitable for secondary organisms. A rapid transition from mesophilic to
thermophilic microflora is caused by the initial rapid increase of temperature.However, a
disruption of the process is observed at 42 °C - 45 °C. The inhibition of initial mesophilic
microflora is caused by the high temperature, when the thermophilic organisms have not yet
developed due to the temperature being below their optimum (Fig..2).
Starting phase - first mesophilic phase
Due to the heterogeneity of substrates, little is known regarding the original composition
of the waste microbial community. There are very few reports on microbial diversity present in
organic waste material. von Klopotek (1962) isolated few mesophilic fungi from fresh MSW at
217

Winter School on “Waste recycling and resource management”-Dec. 3-23, 2014
36 °C. While studying source-separated household waste, Ryckeboer et al. (2003) found few
mesophilic fungi, but numerous thermophilic fungi and bacteria. During the initial phase, the
substrates are at ambient temperature and the pH is usually slightly acidic. The dominant active
degraders of fresh organic waste materials are mesophilic and/or thermotolerant fungi and
bacteria (20-40 °C). The proliferation of fungi and yeasts is stimulated by food wastes containing
vegetable residues often have a low initial pH (4.5 to 5.0). These microorganisms rapidly break
down soluble and easily degradable carbon sources, resulting in a pH drop due to the production
of organic acids.
An increase in pH is favourable for bacteria that subsequently out-compete fungi within a
few hours or days. The high surface/volume ratio of bacteria allows a rapid transfer of soluble
substrates into the cell. Nutritionally also, bacteria are the most diverse group of compost
organisms, which chemically degrade a variety of organic materials via a broad range of
enzymes. Also, the average generation time of bacteria is much shorter than that of fungi which
gives them a competititive advantage during such phases of the composting process which are
characterized by rapid changes in substrate availability and other parameters like temperature,
moisture, aeration etc.
Resultant to this factor, the number of bacteria (including actinomycetes) is usually much
higher than the number of other microorganisms, e.g. fungi (if total numbers are comparable at
all). It can be said that bacteria are responsible for most of the initial decomposition and heat
generation in compost provided that the major growth requirements are met, Bacteria prefer a
near-neutral pH and the optimal moisture content for their functioning is 50- 60% (Fogarty and
Tuovinen, 1991; Golueke, 1992.
Actinomycetes develop more slowly than most bacteria and fungi and are rather
ineffective competitors when nutrient levels are high (Hardy and Sivasithamparam, 1989;
Hoitink and Boehm, 1999). A wide range of prokaryotes produce amylase which is also
important during the initial phase for degradation of starch.
Thermophilic phase
Both thermophiles and mesophiles are reported to be good decomposers of cellulose,
although the cellulose degrading ability of thermophiles was found to be exceedingly higher.
Cellulose degradation occurs at optimal temperature of around 65°C, implying that degradation
218
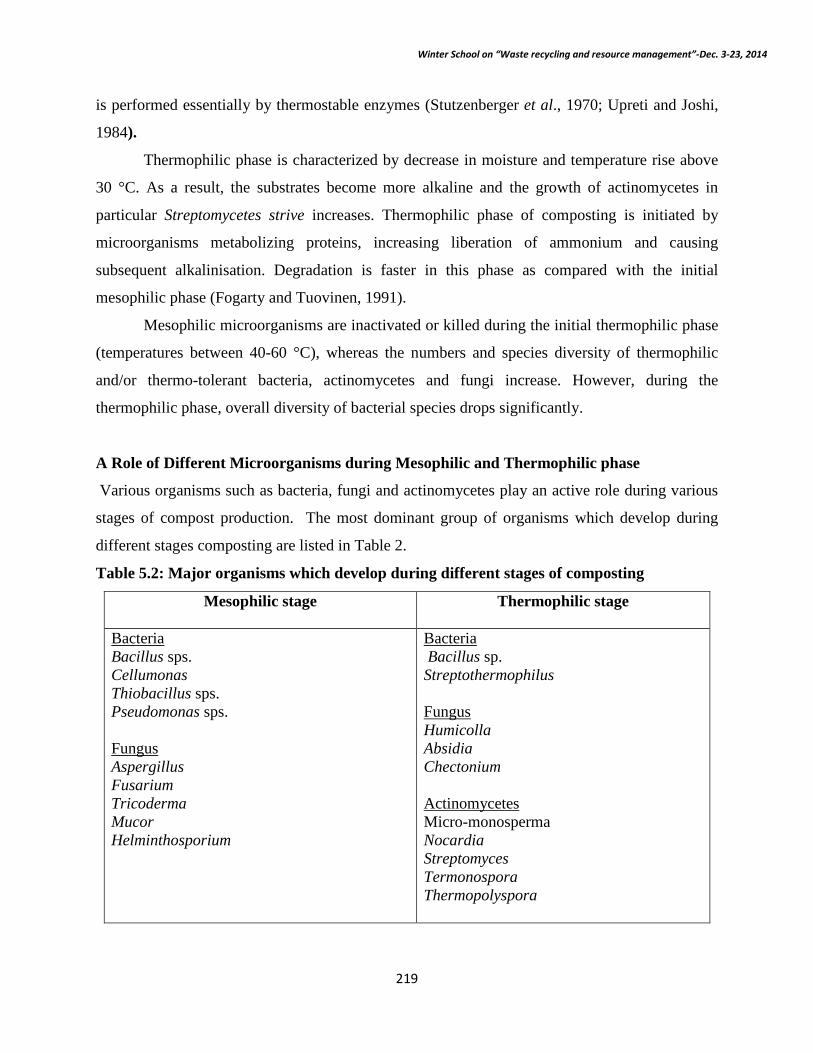
Winter School on “Waste recycling and resource management”-Dec. 3-23, 2014
is performed essentially by thermostable enzymes (Stutzenberger et al., 1970; Upreti and Joshi,
1984).
Thermophilic phase is characterized by decrease in moisture and temperature rise above
30 °C. As a result, the substrates become more alkaline and the growth of actinomycetes in
particular Streptomycetes strive increases. Thermophilic phase of composting is initiated by
microorganisms metabolizing proteins, increasing liberation of ammonium and causing
subsequent alkalinisation. Degradation is faster in this phase as compared with the initial
mesophilic phase (Fogarty and Tuovinen, 1991).
Mesophilic microorganisms are inactivated or killed during the initial thermophilic phase
(temperatures between 40-60 °C), whereas the numbers and species diversity of thermophilic
and/or thermo-tolerant bacteria, actinomycetes and fungi increase. However, during the
thermophilic phase, overall diversity of bacterial species drops significantly.
A Role of Different Microorganisms during Mesophilic and Thermophilic phase
Various organisms such as bacteria, fungi and actinomycetes play an active role during various
stages of compost production. The most dominant group of organisms which develop during
different stages composting are listed in Table 2.
Table 5.2: Major organisms which develop during different stages of composting
Mesophilic stage
Thermophilic stage
Bacteria Bacillus sps. Cellumonas Thiobacillus sps. Pseudomonas sps. Fungus Aspergillus Fusarium Tricoderma Mucor Helminthosporium
Bacteria Bacillus sp. Streptothermophilus Fungus Humicolla Absidia Chectonium Actinomycetes Micro-monosperma Nocardia Streptomyces Termonospora Thermopolyspora
219
Winter School on “Waste recycling and resource management”-Dec. 3-23, 2014
Role of Actinomycetes: They cause the characteristic earthy smell of soil and compost by
production of geosmine, which are sesquiterpenoid* compounds. Actinomycetes compete with
other organisms for nutrients and can inhibit microbial growth by production of antibiotics, lytic
enzymes or even by parasitism. In composting, they play an important role by degrading natural
polymers and colonize organic material after bacteria and fungi have consumed easily
degradable fractions,. The enzymes produced by actinomycetes enable them to degrade tough
debris such as woody stems, bark or newspaper. Cellulose and hemicellulose originating from
plant material. Chitin from fungi and soil fauna and possibly lignin and humus are their C and N
sources (Hardy and Sivasithamparam, 1989; Beffa et al., 1996). It I also reported that they are
able to degrade xenobiotic (harmful to living organisms) compounds (Goodfellow and Williams,
1983).
Actinomycetes develop poorly in materials that are too wet (Finstein and Morris, 1975)
or too dry (Festenstein et al., 1965). Most actinomycetes tolerate a higher pH than fungi, their
optimum pH being 7-8. Under adverse conditions actinomycetes can survive as
spores.Temperatures of 45 to 55 °C, optimal for thermophilic actinomycetes for their growth,
cause significant increase in their number and diversity.
In the preparation of mushroom (Agaricus) substrates, the so-called “firefang period” at
45-48 °C is known when the substrate is covered by a white actinomycetes mycelium. The main
function is a re-assimilation of ammonium during this phase, which does not occur in later
stages. If the firefang period is too short or incomplete, ammonia will later hamper the growth of
Agaricus. To what extent similar processes occur in ordinary waste composting is not known.
Above 60 °C, the number and diversity of actinomycetes decreases along with their importance
in the degradation process.
Role of bacteria: Endospore-forming bacteria, for e.g. Bacillus spp., are very active at
temperatures around 50-60 °C (Ryckeboer et al., 2003). At temperatures above 60 °C,
thermophilic bacteria dominate in the degradation process (Gray et al., 1971). Non-spore
forming bacteria such as Hydrogenobacter spp. and Thermus spp. are the dominant active
degraders in thermogenic composts at temperatures above 70 °C, even upto 82 °C.
Role of Fungi: The ability of fungi to degrade cellulose and lignin is higher than that of
actinomycetes, and bacteria in general (Godden et al., 1992). Temperature is one of the most
important factors affecting fungal growth. The majority of fungi are mesophilic (5 °C to 37 °C),
220

Winter School on “Waste recycling and resource management”-Dec. 3-23, 2014
with an optimum of 25-30°C. A low N content is a prerequisite for lignin degradation, although
most fungi prefer a moderate level of N. Due to their extensive hyphal network, they can attack
organic residues that are too dry, too acidic, or too low in nitrogen for bacterial decomposition.
In comparison to actinomycetes, thermophilic fungi are generally less tolerant to high
temperatures, their optimal temperature being 40 to 55 °C with a maximum at 60 to 62 °C. At
temperatures above 60 °C, fungi are killed or transiently present as spores. Yeasts disappear
during the thermophilic phase of composting, but when the temperature cools down to 54 °C,
they can be found again. Appendix III lists several fungal genera which are able to degrade
cellulose, carboxymethyl cellulose (CMC), hemicellulose, or more specific, and the difficult to
decompose compounds such as xylan (a pentosan found in woody tissue) and arabinoxylan.
Cooling or second mesophilic phase
Once the activity of the thermophilic organisms ceases due to depletion of substrates, it
causes the decrease in temperature. Mesophilic organisms start to re-colonise the substrate,
either originating from surviving spores, speading through protected microniches, or from
external inoculation. The bacterial numbers may decrease by 1 to 2 orders of magnitude during
the start of mesophilic phase in comparison to the numbers present during the thermophilic
phase (108-1011 g-1 dry wt), but their taxonomic and metabolic diversity increases. Several
bacterial functions that are important for compost maturation and which are absent or not
detected in the thermophilic phase appear during the cooling and maturation phase (Beffa et al.,
1996). Metabolic studies have revealed that several isolates were not only simply organic
oxidizers, but were involved in hydrogen-, ammonium-, nitrite- and sulphur-oxidation, nitrogen-
fixation, sulphate-reduction, exopolysaccharide production, and nitrite production from
ammonium under heterotrophic conditions. High numbers of diverse mesophilic and
thermotolerant actinomycetes and yeasts reappear. Fall in temperature, lower water content and
their ability to attack and/or degrade natural complex polymers (e.g. cellulose, hemicellulose,
lignocellulose, lignin) also favour mesophilic and thermotolerant fungi during the cooling phase
(Finstein and Morris, 1975; Ryckeboer et al., 2003).
Maturation phase
During the maturation phase the main activity which takes place is degradation of the
more resistant compounds and getting them partly transformed into humus (Gray et al., 1971).
These compounds are lignin, lignocellulose and other recalcitrant components of tree bark, yard
221

Winter School on “Waste recycling and resource management”-Dec. 3-23, 2014
wastes, agricultural wastes, etc. Paper may contain up to 20% of lignin Most of the fungi,
predominant cellulose and lignin degraders, are isolated during the maturation phase. During
composting of solid wastes, the problem of the presence of undegraded cellulosic material in the
compost at the end of the process is encountered. This is probably due to the inaccessibility of
residual cellulose to enzymatic attack because of low water content or association with protective
substances such as lignin (Poincelot and Day, 1973).
Synthesis of humus during composting process
Humus is the end product of composting in which organic compounds of natural origin
are partially transformed into relatively stable humic substances. Humus is a black to dark
brown component of organic matter which has high molecular weight, very high CEC and is a
store house of plant nutrients. The pathway from organic matter to humus formation involves a
number of degradative and condensation reactions. Initially, the mixture of wastes, whether
agricultural or MSW contain a number of mono, di- and polysaccharides. The monosaccharides
(glucose, fructose, mannose etc) are easily biodegradable and least resistant. The intermediate
biodegradeable compounds are disaccharides or oligosaccharides such as sucrose, melibiose,
maltose, lactose and cellubiose while the the organic polymers such as cellulose, hemicelluloses
and chitin (indigestible); starch, glycogen, gum (digestible) and lignin (α-guaicyl-glycerol, β-
coniferyl-ether) most resistant to decomposition.
During humification, aliphatic compounds of waste material changes into aromatic
compounds upon microbial action. Lignin is first degraded by extracellular enzymes to smaller
units, which are then absorbed into microbial cells where they are partly converted to phenols
and quinones. The substances are discharged together with oxidizing enzymes into the system
where they get polymerized.
In general, immature compost contains high levels of fulvic acids and low levels of
humic acids. As the decomposition proceeds, the fulvic acid fraction either decreases or remains
unchanged while humic acids are produced. Mature humified compost is characterized by (1) a
high content of stable organic matter rich in humic acid containing aromatic moieties (2)
refeeding of soils with humus into soil microbes, (3) high nutrient supply capacity (4) support of
better plant health, and (5) minimum content of pollutants.
222

Winter School on “Waste recycling and resource management”-Dec. 3-23, 2014
Conservation Agricultural Practices for Enhancing Soil Organic Carbon and Nutrient
Availability
J. Somasundaram Indian Institute of Soil Science, Nabibagh, Berasia Road, Bhopal-462038 (MP)
Our ‘mother’ soils are generally taken for granted for many uses. Most people do not
recognize the importance of soil resource. Soils are fundamental material for farming/agriculture.
Without high quality soils, agriculture production cannot be attained on sustainable basis. Thus,
conversion from conventional practices to conservation agriculture will help in sustaining soil
health. No-till/conservation agriculture production systems are capable of improving the soil
health by increasing organic carbon, aggregation, improving infiltration, minimising erosion
losses, etc.
Conservation agriculture (CA) practices involve minimum soil disturbance, providing a
soil cover through crop residues or other cover crops, and crop rotations for achieving higher
productivity. This has emerged as way for transition to the sustainability of intensive cropping
systems. The key features of CA include: (i) minimum soil disturbance by adopting no tillage
and minimum traffic for agricultural operations, (ii) leave and manage the crop residues on the
soil surface, (iii) adopt spatial and temporal crop sequences / crop rotations to derive maximum
benefits from inputs and minimize adverse environmental impacts (Abrol and Sanger, 2006;
FAO, 2008; Friedrich et al., 2012; Somasundaram et al., 2014a). In the conventional systems
involving intensive tillage, there is gradual decline in soil organic matter through accelerated
oxidation and burning of crop residues causing pollution, greenhouse gases emission and loss of
valuable plant nutrients. Intensive seed-bed preparation with heavy machinery leads to declining
soil fertility, biodiversity and erosion. When the crop residues are retained on soil surface in
combination with no tillage, it initiates processes that lead to improved soil quality and overall
resource enhancement. Therefore, conservation agriculture practices may lead to sustainable
improvements in the efficient use of water and nutrients by improving nutrient balances and
availability, infiltration and retention by soils reducing water losses due to evaporation, and
improving the quality and availability of ground and surface water. When the crop residues are
retained on soil surface in combination with no tillage, it initiates processes that lead to improved
soil quality and overall resource enhancement.
223
Winter School on “Waste recycling and resource management”-Dec. 3-23, 2014
Elements of Nutrient Management Strategy in CA
Nutrient management strategies in CA systems would need to attend to the following four
general aspects, namely that: (i) the biological processes of the soil are enhanced and protected
so that all the soil biota are microorganisms are privileged and that soil organic matter and soil
porosity are built up and maintained; (ii) there is adequate biomass production and biological
nitrogen fixation for keeping soil energy and nutrient stocks sufficient to support higher levels of
biological activity, and for covering the soil; (iii) there is an adequate access to all nutrients by
plant roots in the soil, from natural and synthetic sources, to meet crop needs; and (iv) the soil
acidity is kept within acceptable range for all key soil chemical and biological processes to
function effectively.
Towards CA-Based Nutrient Management Practices
Integrated Soil Fertility Management (ISFM) and Integrated Natural resources
Management (INRM) approaches of various types and nomenclature have been in vogue in
recent years in certain sections of the scientific community. Generally, such approaches are
focused more on meeting crop nutrient demand rather than managing soil health and land
productivity as is the case with CA systems. Also, most of the work that is understands under the
title of ISFM or INRM over the past 15 years or so has been geared towards tillage-based
systems which have many unsustainable elements, regardless of farm size or the level of
agricultural development. Unless the concepts of soil health and function are explicitly
incorporated into ISFM or INRM approaches, sustainability goals and means will remain only
accidentally connected, and sustainable crop intensification will be difficult to achieve
particularly by resource poor farmers. We believe that CA systems have within them their own
particular sets of ISFM or INRM processes and concepts that combine and optimize the use of
organic with inorganic inputs integrating temporal and spatial dimensions with soil, nutrient,
water, soil biota, biomass dimension, all geared to enhancing crop and system outputs and
productivities but in environmentally responsible manner. There is empirical evidence to show
that CA based ISFM or INRM processes can work because of the underpinnings of soil health
and function.
224

Winter School on “Waste recycling and resource management”-Dec. 3-23, 2014
Focusing on soil fertility but without defining the tillage and cropping system, as often
proposed by ISFM or INRM approaches, is only a partial answer to enhancing and maintaining
soil health and productivity in support of sustainable production intensification, livelihood and
the environment. Over the past two decades or so, empirical evidence from the field has clearly
shown that healthy agricultural soils constitute biologically active soil systems within landscapes
in which both the soil resources and the landscape must operate with plants in an integrated
manner to support the various desired goods and services (e.g., food, feed, feedstock, biological
raw material for industry, livelihood, environmental services, etc) provided by agricultural land
use. Consequently, successful nutrient management strategies as part of any ISFM or INRM
approach must pay close attention to issues of soil health management which means managing
the microscopic integrity of the soil plant system particularly as mediated by soil living biota,
soil organic matter, soil physico-chemical properties, available soil nutrients, adapted germplasm
as well as to managing the macroscopic dimensions of landscapes, socioeconomics and policy.
Given that CA principles and practices offer substantial benefits to all types of farmers in most
agro-ecological and socio-economic situations, CA-based IFSM and INRM approaches to
nutrient management and production intensification would be more effective for farmer-based
innovation systems and learning processes such as those promoted through Farmer Field School
networks.
Adopting CA-Based Nutrient Management Framework
CA has now emerged as a major “breakthrough” systems approach to crop and
agriculture production with its change in paradigm that challenges the status quo. However, as a
multi-principled concept, CA translates into knowledge-intensive practices whose exact form
and adoption requires that farmers become intellectually engaged in the testing, learning and fine
tuning possible practices to meet their specific ecological and socio-economic conditions
(Friedrich and Kassam 2009). In essence, CA approach represents a highly biologically and bio-
geophysically-integrated system of soil health and nutrient management for production that
generates a high level of “internal” ecosystem services which reduces the levels of “external”
subsidies and inputs needed. CA provides the means to work with natural ecological processes to
harness greater biological productivities by combining the potentials of the endogenous
biological processes with those of exogenous inputs. The evidence for the universal applicability
225

Winter School on “Waste recycling and resource management”-Dec. 3-23, 2014
of CA principles is now available across a range of ecologies and socio-economic situations
covering large and small farm sizes worldwide, including resource poor farmers (Goddard et al.
2007, FAO 2008).
There are many different ecological and socio-economic starting situations in which CA
has been and is being introduced. They all impose their particular constraints as to how fast the
transformation towards CA systems can occur. In the seasonally dry tropical and sub-tropical
ecologies, particularly with resource poor small farmers in drought prone zones, CA systems will
take longer time to establish, and step-wise approaches to the introduction of CA practices seem
to show promise (Mazvimavi and Twomlow 2006). These involve two components: the
application of planting ‘Zai-type’ basins which concentrate limited nutrients and water resources
to the plant, and the precision application of small or micro doses of nitrogen-based fertilizer. In
the case of degraded land in wet or dry ecologies, special soil amendments and nutrient
management practices are required to establish the initial conditions for soil health improvement
and efficient nutrient management for agricultural production (Landers 2007). What seems to be
important is that whichever pathway is followed to introduce CA practices, there is a need for a
clear understanding of how the production systems concerned should operate as CA systems to
sustain soil health and productivity, and how nutrient management interventions that may be
proposed can contribute to the system effectiveness as a whole both in the short- and long-term.
Conservation Agriculture and Soil Organic Carbon
Long-term implementation of conservation tillage practices also increases organic matter
levels in the soil. Lower soil temperatures and increased soil moisture contributes to slower rates
of organic matter oxidation. An increase in organic matter is normally observed within the
surface 10 cm of soil. Higher organic matter levels stabilize soil aggregates, which increases soil
tilth. Crop residues retained on the soil surface in conservation agriculture (Fig 1), in general,
serve a number of beneficial functions, including soil surface protection from erosion, enhancing
infiltration and cutting run-off rate, decreasing surface evaporation losses of water, moderating
soil temperature and providing substrate for the activity of soil micro-organisms, and a source of
soil organic carbon (SOC).
226

Winter School on “Waste recycling and resource management”-Dec. 3-23, 2014
Fig 1. Residue retention under soybean-wheat system (left) and maize-gram system (right)
While conventional cultivation generally results in loss of soil C and nitrogen,
conservation agriculture has proven potential of converting many soils from sources to sinks of
atmospheric C, sequestering carbon in soil as organic matter. In general, soil carbon
sequestration during the first decade of adoption of best conservation agricultural practices is 1.8
tons CO per hectare per year. On 5 billion hectares of agricultural land, this could represent one-
third of the current annual global emission of CO from the burning of fossil fuels (FAO, 2008).
Lal et al. (1998) estimated that widespread adoption of conservation tillage on some 400 million
ha of crop land by the year 2020 may lead to total C sequestration of 1500 to 4900 Mg.
India produces a large amount of crop residues (500-550 million tons) annually that are
used as animal feed, soil mulch, manure, thatching for rural homes and fuel for domestic and
industrial purposes. However, a large portion of these crop residues (90-140 Mt) is burnt on-farm
primarily to clear fields to facilitate timely planting/seeding of succeeding crops. In comparison
to burning, residue retention increases soil carbon and nitrogen stocks, provides organic matter
necessary for soil macro-aggregate formation and fosters cellulose–decomposing fungi and
thereby carbon cycling. Rice-wheat is an important cropping system followed on more than 10
million ha in the Indo-Gangetic Plains of the country. Crop residue burning in rice-wheat
production system is although a quick, labour-saving practice to get rid of residue that is viewed
as a nuisance by farmers. Residue-burning, however, has several adverse environmental and
ecological impacts. The burning of dead plant material adds a considerable amount of CO2 and
particulate matter to the atmosphere and can reduce the return of much needed C and other
227

Winter School on “Waste recycling and resource management”-Dec. 3-23, 2014
nutrients to soil. Lack of soil surface cover due to burning or removal of the crop residues
increases the loss of mineral and organic matter–rich surface layer in run-off. Crop residues
returned to the soil, on the other hand, help increase SOM levels, which facilitate greater
infiltration and store greater water in the soil profile. Crop residues provide substrate to soil
organisms which help in recycling of the plant nutrients. Leaving crop residue on the field is
another practice which could have an important impact on the global carbon cycle. The annual
production of crop residue is estimated to be about 3.4 billion Mg in the world. If 15% of C
contained in the residue can be converted to passive soil organic carbon (SOC) fraction, this may
lead to C sequestration at the rate of 0.2 x l015 g/yr (Lal, 1997). Similarly, restoring presently
degraded soils, estimated at about 2 billion ha, and increasing SOC content by 0.01% /yr may
lead C sequestration at the rate of 3.0 Pg C/yr. Systems, based on high crop residue addition and
no-tillage, tend to turn the soil into a net sink of carbon (Bot et al., 2001). In the USA, the total
loss of carbon, from a plot of ploughed under wheat residues, was up to five times higher than
from plots not ploughed, and the loss of carbon was equal to the quantity of carbon in the wheat
residues which had remained in the field from the previous crop (CTIC, 1996a). Conservation
tillage adoption on three-quarter of the land would half this respired CO as compared to 1993,
representing an accrual of almost 400 million tons (Bot and Benites, 2001). Net soil C stock
changes for US agricultural soils between 1982 and 1997 due to shifts towards conservation
agriculture are estimated to amount to 21.2 MMT C/year (Eve et al., 2002). At an average rate
of 0.51 t/ha/year, Brazilis sequestering about 12 million t of carbon on 23.6 million ha of no-
tillage adoption. In Canada, at a CO sequestration rate of 0.74 t/ha farmers practicing no-till
would be sequestering about 9 million tons of C02 from the atmosphere each year, while at the
same time enriching the soil in carbon (Bot et al., 2001). It is estimated that wide dissemination
of conservation agriculture (which leaves at least 30% of plant residue cover on the surface of
the soil after planting) could offset as much as 16% of worldwide fossil fuel emissions (CTIC,
1996b). A study conducted at IISS, Bhopal also reveals effect of tillage systems on SOC was
found to significant only at surface layer (0-15cm) and higher SOC value observed under
reduced tillage (RT) as compared to conventional tillage (CT) after three years of crop cycles
(Fig 2). Further, reduction in tillage operation coupled with residue retention helps in
maintaining the soil organic carbon (Somasundaram et al., 2014b; Subba Rao and
Somasundaram, 2013).
228

Winter School on “Waste recycling and resource management”-Dec. 3-23, 2014
Fig 2. Effect of different tillage on soil organic carbon
Conservation Agriculture on Nutrient Availability
Tillage, residue management and crop rotation have a significant impact on nutrient
distribution and transformation in soils, usually related to the effects of conservation agriculture
on SOC contents. Similar to the findings on SOC, distribution of nutrients in a soil under zero
tillage is different to that in tilled soil. Increased stratification of nutrients is generally observed,
with enhanced conservation and availability (Franzluebbers and Hons, 1996). The altered
nutrient availability under zero tillage compared to conventional tillage may be due to surface
placement of crop residues in comparison with incorporation of crop residues with tillage (Ismail
et al., 1994). Slower decomposition of surface placed residues (Kushwaha et al., 2000) may
prevent rapid leaching of nutrients through the soil profile, which is more likely when residues
are incorporated into the soil. However, the possible development of more continuous pores
between the surface and the subsurface under zero tillage may lead to more rapid passage of
soluble nutrients deeper into the soil profile than when soil is tilled (Franzluebbers and Hons,
1996). Furthermore, the response of soil chemical fertility to tillage is site-specific and depends
on soil type, cropping systems, climate, fertilizer application and management practices (Rahman
et al., 2008).
The density of crop roots is usually greater near the soil surface under zero tillage
compared to conventional tillage (Qin et al., 2004). This may be common under zero tillage as in
the study of Mackay et al. (1987) a much greater proportion of nutrients was taken up from near
the soil surface under zero tillage than under tilled culture, illustrated by a significantly higher P
uptake from the 0–7.5 cm soil layer under zero tillage than under conventional tillage. However,
229
Winter School on “Waste recycling and resource management”-Dec. 3-23, 2014
research on nutrient uptake by Hulugalle and Entwistle (1997) revealed that nutrient
concentrations in plant tissues were not significantly affected by tillage or crop combinations.
Although there are reports of straw burning increasing nutrient availability (Du Preez et al.,
2001), burning crop residues is not considered sustainable given the well documented negative
effects on physical soil quality, especially when it is combined with reduced tillage (Limon-
Ortega et al., 2002). Mohamed et al. (2007) observed only short-term effects of burning on N, P
and Mg availability. As a consequence of the short-term increased nutrient availability limited
nutrient uptake by plants after burning, leaching of N, Ca, K, and Mg increased significantly
after burning (Mohamed et al., 2007).
Nitrogen availability
The presence of mineral soil N available for plant uptake is dependent on the rate of C
mineralization. The literature concerning the impact of reduced tillage with residue retention on
N mineralization is inconclusive. Zero tillage is generally associated with a lower N availability
because of greater immobilization by the residues left on the soil surface (Bradford and Peterson,
2000). Some authors suggest that the net immobilization phase when zero tillage is adopted, is
transitory, and that in the long run, the higher, but temporary immobilization of N in zero tillage
systems reduces the opportunity for leaching and denitrification losses of mineral N (Follet and
Schimel, 1989). According to Schoenau and Campbell (1996), a greater immobilization in
conservation agriculture can enhance the conservation of soil and fertilizer N in the long run,
with higher initial N fertilizer requirements decreasing over time because of reduced losses by
erosion and the build-up of a larger pool of readily mineralizable organic N. Tillage increases
aggregate disruption, making organic matter more accessible to soil microorganisms and
increasing mineral N release from active and physically protected N pools (Six et al., 2002).
Lichter et al. (2008) reported that permanent raised beds with residue retention resulted in more
stable macro aggregates and increased protection of C and N in the micro aggregates within the
macro aggregates compared to conventionally tilled raised beds. This increases susceptibility to
leaching or denitrification if no growing crop is able to take advantage of these nutrients at the
time of their release. Randall and Iragavarapu (1995) reported about 5% higher NO -N losses
with conventional tillage compared to zero tillage. Jowkin and Schoenau (1998) report that N
availability was not greatly affected in the initial years after switching to zero tillage in the
230
Winter School on “Waste recycling and resource management”-Dec. 3-23, 2014
brown soil zone in Canada. Larney et al. (1997) reported that, after eight years of the tillage
treatments, the content of N available for mineralization was greater in zero-tilled soils than in
conventionally tilled soil under continuous spring wheat. Wienhold and Halvorson (1999) found
that nitrogen mineralization generally increased in the 0-5 cm soil layer, as the intensity of tillage
decreased. Govaerts et al. (2006) found after 26 cropping seasons in a high-yielding, high input
irrigated production system that the N mineralization rate was higher in permanent raised beds
with residue retention than in conventionally tilled raised beds with all residues incorporated, and
also that N mineralization rate increased with increasing rate of inorganic N fertilizer application.
The tillage system determines the placement of residues. Conventional tillage implies
incorporation of crop residues while residues are left on the soil surface in the case of zero
tillage. These differences in the placement of residues contribute to the effect of tillage on N
dynamics. Kushwaha et al. (2000) reported that incorporated crop residues decompose 1.5 times
faster than surface placed residues. However, also the type of residues and the interactions with
N management practices determine C and N mineralization.
Phosphorus availability
Numerous studies have reported higher extractable P levels in zero tillage than in tilled
soil, largely due to reduced mixing of the fertilizer P with the soil, leading to lower P-fixation.
This is a benefit when P is a limiting nutrient, but may be a threat when P is an environmental
problem because of the possibility of soluble P losses in runoff water (Duiker and Beegle, 2006).
After 20 years of zero tillage, extractable P was 42% greater at 0-5 cm, but 8-18% lower at 5-30
cm depth compared with conventional tillage in a silt loam (Ismail et al., 1994). Also Matowo et
al. (1999) found higher extractable P levels in zero tillage compared to tilled soil in the topsoil.
Accumulation of P at the surface of continuous zero tillage is commonly observed.
Concentrations of P were higher in the surface layers of all tillage systems as compared to deeper
layers, but most strikingly in zero tillage (Duiker and Beegle, 2006). When fertilizer P is applied
on the soil surface, a part of P will be directly fixed by soil particles. When P is banded as a
starter application below the soil surface, authors ascribed P stratification partly to recycled P by
plants (Duiker and Beegle, 2006). Duiker and Beegle (2006) suggest there may be less need for P
starter fertilizer in long-term zero tillage due to high available P levels in the topsoil where the
seed is placed. Deeper placement of P in zero tillage may be profitable if the surface soil dries
231

Winter School on “Waste recycling and resource management”-Dec. 3-23, 2014
out frequently during the growing season as suggested by Mackay et al. (1987). In that case,
injected P may be more available to the crop. However, if mulch is present on the soil surface in
zero tillage the surface soil is likely to be moister than conventionally tilled soils and there will
probably be no need for deep P placement, especially in humid areas.
Potassium availability
Zero tillage conserves and increases availability of nutrients, such as K, near the soil
surface where crop roots proliferate (Franzluebbers and Hons, 1996). According to Govaerts et
al. (2007b), permanent raised beds had a concentration of K 1.65 times and 1.43 times higher in
the 0-5 cm and 5-20 cm layer, respectively, than conventionally tilled raised beds, both with crop
residue retention. In both tillage systems, K accumulated in the 0-5 cm layer, but this was more
accentuated in permanent than in conventionally tilled raised beds. Other studies have found
higher extractable K levels at the soil surface as tillage intensity decreases (Lal et al., 1990). Du
Preez et al. (2001) observed increased levels of K in zero tillage compared to conventional
tillage, but this effect declined with depth. Some authors have observed surface accumulation of
available K irrespective of tillage practice (Duiker and Beegle, 2006). Follett and Peterson
(1988) observed either higher or similar extractable K levels in zero tillage compared to mould
board tillage, while Roldan et al. (2007) found no effect of tillage or depth on available K
concentrations.
Micronutrients
Increasing supply to food crops of essential micronutrients might result in significant
increases in their concentrations in edible plant products, contributing to consumers' health
(Welch, 2002). Micronutrient cations (Zn, Fe, Cu and Mn) tend to be present in higher levels
under zero tillage with residue retentions compared to conventional tillage, especially extractable
Zn and Mn near the soil surface due to surface placement of crop residues (Franzluebbers and
Hons, 1996). In contrast, Govaerts et al. (2007b) reported that tillage practice had no significant
effect on the concentration of extractable Fe, Mn and Cu, but that the concentration of
extractable Zn was significantly higher in the 0-5 cm layer of permanent raised beds compared to
conventionally tilled raised beds with full residue retention. Similar results were reported by Du
Preez et al. (2001) and Franzluebbers and Hons (1996). Residue retention significantly decreased
232

Winter School on “Waste recycling and resource management”-Dec. 3-23, 2014
concentrations of extractable Mn in the 0-5 cm layer in permanent raised beds (Govaerts et al.,
2007b). According to Peng et al. (2008), however, Mn concentrations are increased by higher
SOM contents.
Conclusions
Conservation agricultural practices improve soil aggregation compared to conventional tillage
systems and zero tillage without retention of sufficient crop residues in a wide variety of soils
and agro-ecological conditions. The combination of reduced tillage with crop residue retention
increases the SOC in the topsoil. Moreover, C-cycle is influenced by conservation agriculture,
similarly N cycle is altered. Adoption of conservation agriculture systems with crop residue
retention may result initially in N immobilization. However, rather than reducing N availability,
conservation agriculture may stimulate a gradual release of N in the long run and can reduce the
susceptibility to leaching or denitrification, when no growing crop is able to take advantage of
the nutrients at the time of their release. Also crop diversification, an important component of
conservation agriculture, has to be seen as an important strategy to govern N availability through
rational sequences of crops with different C/N ratios. Tillage, residue management and crop
rotation have a significant impact on micro- and macronutrient distribution and transformation in
soils. The altered nutrient availability may be due to surface placement of crop residues in
comparison with incorporation of crop residues with tillage. Conservation agriculture increases
availability of nutrients near the soil surface where crop roots proliferate. Slower decomposition
of surface placed residues prevents rapid leaching of nutrients through the soil profile. The
response of soil chemical fertility to tillage is site-specific and depends on soil type, cropping
systems, climate, fertilizer application and management practices. However, in general nutrient
availability is related to the effects of conservation agriculture on SOC contents. The CEC and
nutrient availability increase in the topsoil. Numerous studies have reported higher extractable P
levels in zero tillage than in tilled soil largely due to reduced mixing of the fertilizer P with the
soil, leading to lower P-fixation.
References Abrol, I.P. and Sanger, S. 2006. Sustaining Indian Agriculture-Conservation agriculture the way
forward. Current Science, 91 (8): 1020-1024.
233

Winter School on “Waste recycling and resource management”-Dec. 3-23, 2014
Balota, E.L., Colozzi, A., Andrade, D.S., and Dick, R.P. 2004. Long-term tillage and crop
rotation effects on microbial biomass and C and N mineralization in a Brazilian Oxisol. Soil Till. Res. 77:137-145.
Blanco-Canqui, H. and Lal, R. 2007. Impacts of long-term wheat straw management on soil hydraulic properties under no-tillage. Soil Sci. Soc. Am. J. 71:1166-1173.
Bot, A. and J. Benites. 2001. Conservation agriculture: Case studies in Latin America and Africa. Rome, Italy: FAO. CTIC Conservation Technology Information Centre. (1996a). Facilitating Conservation Farming Practices and Enhancing Environmental Sustainability with Agricultural Biot e chnology 1 - 2 ; (ht tp://www. c t i c .purdue . edu/medi a/pdf/Biot e ch Executive_Summary.pdf).
Bot, A. and J. Benites. 2001. Conservation agriculture: Case studies in Latin America and Africa. Rome, Italy: FAO.
Bradford, J.M. and Peterson, G.A. 2000. Conservation tillage. In Handbook of soil science, ed. M. E. Sumner, G247-G269. Boca Raton, FL, USA: CRC Press.
CTIC. (1996b). 17th Annual Crop Residue Management Survey Report. West Lafayette, In: Conservation Technology Information Center.
Baker, J.M., Ochsner, T.E., Venterea, R.T., and Griffis, T.J. 2007. Tillage and soil carbon sequestration - What do we really know? Agr. Ecosyst. Environ. 118:1-5.
Dolan, M.S., Clapp, C.E., Allmaras, R.R., Baker, J.M., and Molina, J.A.E. 2006. Soil organic carbon and nitrogen in a Minnesota soil as related to tillage, residue and nitrogen management. Soil Till. Res. 89:221-231.
Du Preez, C.C., Steyn, J.T., and Kotze, E. 2001. Long-term effects of wheat residue management on some fertility indicators of a semi-arid Plinthosol. Soil Till. Res. 63:25-33.
Duiker, S.W. and Beegle, D.B. 2006. Soil fertility distributions in long-term no-till, chisel/disk and moldboard plow/disk systems Soil and Tillage Research 88:30-41.
Ellert, B.H. and Bettany, J.R. 1995. Calculation of organic matter and nutrients stored in soils under contrasting management regimes. Can. J. Soil Sci. 75:529-538.
Etana, A., Hakansson, I., Zagal, E., and Bucas, S. 1999. Effects of tillage depth on organic carbon content and physical properties in five Swedish soils. Soil Till. Res. 52:129-139.
Eve, M.D., M. Sperow, K. Howerton, K. Paustian and R.F. Follett. 2002. Predicted impact of management on soil carbon storage for each cropland region of the conterminous US, J. Soil Water Cons. 57: 196–204.
FAO, 2008. Investing in Sustainable Agricultural Intensification: The Role of Conservation Agriculture – A Framework for Action’ FAO Rome, August 2008 (available at www.fao.org/ag/ca/).
Follett, R.F. and Peterson, G.A. (1988). Surface Soil Nutrient Distribution As Affected by Wheat-Fallow Tillage Systems. Soil Sci. Soc. Am. J. 52:141-147.
Follett, R.F. and Schimel, D.S. 1989. Effect of tillage on microbial biomass dynamics. Soil Sci. Soc. Am. J. 53:1091-1096.
234

Winter School on “Waste recycling and resource management”-Dec. 3-23, 2014
Franzluebbers, A.J. and Hons, F.M. 1996. Soil-profile distribution of primary and secondary
plant available nutrients under conventional and no tillage. Soil Till. Res. 39:229-239. Friedrich , T., Derpsch,R. and Kassam, A. 2012. Overview of the Global Spread of Conservation
Agriculture, http://factsreports.revues.org/1941 Published 12 september 2012. Friedrich, T. and Kassam, A.H. 2009. Adoption of Conservation Agriculture Technologies:
Constraints and Opportunities. Invited paper, IV World Congress on Conservation Agriculture, 4-7 February 2009, New Delhi, India.
Galantini, J.A., Landriscini, M.R., Iglesias, J.O., Miglierina, A.M., and Rosell, R.A. 2000. The effects of crop rotation and fertilization on wheat productivity in the Pampean semiarid region of Argentina 2. Nutrient balance, yield and grain quality. Soil Till. Res. 53:137-144.
Goddard, T., Zoebisch, M., Gan, Y., Ellis, W., Watson, A. And Sombatpanit, S. 2007 (Eds.). No-Till Farming Systems. WASWC Special Publication No. 3, Bangkok, 544 pp.
Govaerts, B., Sayre, K.D., Ceballos-Ramirez, J.M., Luna-Guido, M.L., Limon-Ortega, A., Deckers, J., and Dendooven, L. 2006. Conventionally tilled and permanent raised beds with different crop residue management: Effects on soil C and N dynamics. Plant Soil 280:143–155.
Govaerts, B., Sayre, K.D., Lichter, K., Dendooven, L., and Deckers, J. 2007b. Influence of permanent raised bed planting and residue management on physical and chemical soil quality in rain fed maize/wheat systems. Plant Soil 291:39-54.
Govaerts, B., Verhulst, N., Sayre, K.D., Dixon, J., and Dendooven, L. 2009b. Conservation Agriculture and Soil Carbon Sequestration; Between Myth and Farmer Reality. Crit. Rev. Plant Sci.
Hulugalle, N.R. and Entwistle, P. 1997. Soil properties, nutrient uptake and crop growth in an irrigated Vertisol after nine years of minimum tillage. Soil Till. Res. 42:15-32.
Ismail, I., Blevins, R.L., and Frye, W.W. 1994. Long-Term No-Tillage Effects on Soil Properties and Continuous Corn Yields. Soil Sci. Soc. Am. J. 58:193-198.
Jantalia, C.P., Resck, D.V.S., Alves, B.J.R., Zotarelli, L., Urquiaga, S., and Boddey, R.M. 2007. Tillage effect on C stocks of a clayey Oxisol under a soybean-based crop rotation in the Brazilian Cerrado region. Soil Till. Res. 95:97-109.
Jowkin, V. and Schoenau, J.J. 1998. Impact of tillage and landscape position on nitrogen availability and yield of spring wheat in the Brown soil zone in southwestern Saskatchewan. Can. J. Soil Sci. 78:563-572.
Kushwaha, C.P., Tripathi, S.K., and Singh, K.P. 2000. Variations in soil microbial biomass and N availability due to residue and tillage management in a dryland rice agroecosystem. Soil Till. Res.56:153-166.
Lal, R.1998. Soil quality and sustainability. In: Methods for Assessment of Soil Degradation. (Eds: Lal, R.; Blum, W. H.; Valentine, C.; Stewart, B. A.) CRC Press, New York, 17-30.
Lal, R., 1997. Residue management, conservation tillage and soil restoration for mitigating greenhouse effect by CO -enrichment. Soil and Tillage Research 43: 81-107.
235

Winter School on “Waste recycling and resource management”-Dec. 3-23, 2014
Lal, R., Logan, T.J., and Fausey, N.R. 1990. Long-Term Tillage Effects on a Mollic Ochraqualf
in North-West Ohio.3. Soil Nutrient Profile Soil and Tillage Research 15:371-382. Landers, J. 2007. Tropical Crop-Livestock Systems in Conservation Agriculture: The Brazilian
Experience. Integrated Crop Management Vol. 5. FAO, Rome. Larney, F.J., Bremer, E., Janzen, H.H., Johnston, A.M., and Lindwall, C.W. 1997. Changes in
total, mineralizable and light fraction soil organic matter with cropping and tillage intensities in semiarid southern Alberta, Canada. Soil and Tillage Research 42:229-240.
Lichter, K., Govaerts, B., Six, J., Sayre, K.D., Deckers, J., and Dendooven, L.2008. Aggregation and C and N contents of soil organic matter fractions in a permanent raised-bed planting system in the Highlands of Central Mexico. Plant Soil 305:237-252.
Limon-Ortega, A., Sayre, K.D., Drijber, R.A., and Francis, C.A. 2002. Soil attributes in a furrow-irrigated bed planting system in northwest Mexico. Soil Till. Res. 63:123-132.
Mackay, A.D., Kladivko, E.J., Barber, S.A., and Griffith, D.R. 1987. Phosphorus and Potassium Uptake by Corn in Conservation Tillage Systems. Soil Sci. Soc. Am. J. 51:970-974.
Mackay, A.D., Kladivko, E.J., Barber, S.A., and Griffith, D.R. 1987. Phosphorus and Potassium Uptake by Corn in Conservation Tillage Systems. Soil Sci. Soc. Am. J. 51:970-974.
Matowo, P.R., Pierzynski, G.M., Whitney, D., and Lamond, R.E. 1999. Soil chemical properties as influenced by tillage and nitrogen source, placement, and rates after 10 years of continuous sorghum. Soil and Tillage Research 50:11-19.
Mazvimavi, K. and Twomlow, S. 2006. Conservation Farming for Agricultural Relief and Development in Zimbabwe. In: No-Till Farming Systems (Goddard, T. et al., Eds.), pp. 169-175. WASWC Special Publication No. 3, Bangkok.
Mohamed, A., Hardtle, W., Jirjahn, B., Niemeyer, T., and von Oheimb, G. 2007. Effects of prescribed burning on plant available nutrients in dry heathland ecosystems. Plant Ecol. 189:279-289.
Peng, K.J., Luo, C.L., You, W.X., Lian, C.L., Li, X.D., and Shen, Z.G. 2008. Manganese uptake and interactions with cadmium in the hyper-accumulator - Phytolacca americana L. J. Hazard. Mater. 154:674-681.
Qin, R.J., Stamp, P., and Richner, W. 2004. Impact of tillage on root systems of winter wheat. Agr. J. 96:1523-1530.
Rahman, M.H., Okubo, A., Sugiyama, S., and Mayland, H.F. 2008. Physical, chemical and icrobiological properties of an Andisol as related to land use and tillage practice. Soil Till. Res. 101:10-19.
Randall, G.W. and Iragavarapu, T.K. (1995). Impact of Long-Term Tillage Systems for Continuous Corn on Nitrate Leaching to Tile Drainage. J. Environ. Qual. 24:360-366.
Roldan, A., Salinas-Garcia, J.R., Alguacil, M.M., and Caravaca, F. 2007. Soil sustainability indicators following conservation tillage practices under subtropical maize and bean crops. Soil and Tillage Research 93:273-282.
236

Winter School on “Waste recycling and resource management”-Dec. 3-23, 2014
Sakala, W.D., Cadisch, G., and Giller, K.E. 2000. Interactions between residues of maize and
pigeonpea and mineral N fertilizers during decomposition and N mineralization. Soil Biol. Biochem. 32:679-688.
Sanger, L.J., Whelan, M.J., Cox, P., and Anderson, J.M. 1996. Measurement and modelling of soil organic matter decomposition using biochemical indicators. In Progress in Nitrogen Cycling Studies, ed. O. Van Cleemput, G. Hofman, and A. Vermoesen, 445-450. Netherlands: Kluwer Academic Publ.
Schoenau, J.J. and Campbell, C.A. 1996. Impact of crop residues on nutrient availability in conservation tillage systems. Can. J. Plant Sci. 76:621-626.
Sisti, C.P.J., dos Santos, H.P., Kohhann, R., Alves, B.J.R., Urquiaga, S., and Boddey, R.M. 2004. Change in carbon and nitrogen stocks in soil under 13 years of conventional or zero tillage in southern Brazil. Soil Till. Res. 76:39-58.
Six, J., Conant, R.T., Paul, E.A., and Paustian, K. 2002. Stabilization mechanisms of soil organic matter: Implications for C-saturation of soils. Plant Soil 241:155-176.
Somasundaram, J., Chaudhary, R.S., Hati, K. M., Vassanda Coumar, M., Sinha, N.K., Jha, P., Ramesh, K., Neenu, S., Blaise, D., Saha, R., Ajay, Biswas, A.K., Maheswari, M., Rao, D.L.N., Subba Rao, A and Venkateswarlu, B. (2014b). Conservation Agriculture for Enhancing Soil Health and Crop Productivity. Published by Indian Institute of Soil Science, Bhopal in collaboration with National Initiative on Climate Resilient Agriculture (NICRA), CRIDA, Hyderabad, 64 p.
Somasundaram, J., Chaudhary, R.S. Subba Rao, A., Sinha, N.K. and Vasanda, Coumar. 2014a. Conservation Agriculture for carbon sequestration and sustaining soil health. New India Publications Agency, New Delhi. P. 1-528. (ISBN: 978-93-83305-32-2).
Subba Rao, A and Somasundaram, J. 2013. Conservation Agriculture for carbon sequestration and sustaining soil health, In: Agriculture Year Book 2013, Published by Agriculture Today (The National Agricultural Magazine) pp:184-188.
VandenBygaart, A.J. and Angers, D.A. 2006. Towards accurate measurements of soil organic carbon stock change in agroecosystems. Can. J. Soil Sci. 86:465-471.
Vanlauwe, B., Dendooven, L., and Merckx, R. 1994. Residue Fractionation and Decomposition – the Significance of the Active Fraction. Plant Soil 158:263-274.
Welch, R.M. 2002. The impact of mineral nutrients in food crops on global human health. Plant Soil 247:83-90.
West, T.O. and Post, W.M. 2002. Soil organic carbon sequestration rates by tillage and crop rotation: global data analysis. Soil Sci. Soc. Am. J. 66:1930-1946.
Wienhold, B.J. and Halvorson, A.D. 1999. Nitrogen mineralization responses to cropping, tillage, and nitrogen rate in the Northern Great Plains. Soil Sci. Soc. Am. J. 63:192-196.
237

Winter School on “Waste recycling and resource management”-Dec. 3-23, 2014
Long-term Application of Manures and Fertilizers on Heavy Metals Development in
Soils
TAPAN ADHIKARI
Indian Institute of Soil Science, Nabibagh, Berasia Road Bhopal-462038, E-mail: [email protected]
Soil is a long-term sink for the potentially toxic elements often referred to as heavy metals, including Cu, Zn, Cd, Pb, Cr, As, Hg, etc. The harm of heavy metal pollution on soil environment and human health and its control has become a hot topic in the current environmental research field. The heavy removal of nutrients from the soil by high-yielding varieties for higher use of fertilizer made it imperative to examine the sustainability of modern intensive cropping systems based on high external inputs of fertilizers and high-yielding varieties under irrigated conditions. Long term or continuing field experiment provided an opportunity to study such slow changes in soil over time. One of the most exciting unforeseen benefits of the long-term experiments has been the opportunity to study contaminant trends over time in response to increasing public and scientific interest of the impact of humankind on the environment. Amongst the fertilizers, generally applied by the farmer in fields, phosphate fertilizers contain varying amount of cadmium and other heavy metals as contaminants from phosphate rock. The average application of SSP is ranged from 325 kg/ha/annum to 440 kg/ha/annum in soils under LTFE. As the experiment is >35 years old, total SSP added during this period is ranged from 11375 kg/ha to 15093 kg/ha. As per report SSP contains cadmium (30 mg/kg fertilizer to 187 mg/kg fertilizers). This variation in Cd content in SSP is due to the type of rock phosphates used for manufacturing SSP. There may be contamination of other heavy metals like Pb and Cr in soil which are supposed to come from fertilizers SSP and Zinc Sulphate as impurities. During this long period (>35 years), there may be a chance of heavy metals build up in soils which subsequently enter into the food chain of human and animal and also potentially damage the soil microbes. Unlike other countries like USA, Australia, UK etc, we do not have any database regarding the heavy metal pollution in soil under long term fertilizer experiments. Also, concentrations of metals that do not affect crop growth may affect other parameters contributing to soil fertility. Microbial populations are potentially one of those parameters which govern the crop yield. The classical concept of microbial diversity involves species richness, evenness, and composition in a community. Soil microorganisms are an integral part of ecosystems, performing many essential roles including nutrient cycling and the decomposition and transformation of organic matter and xenobiotics. Beneficial organisms act as biological agents against plant pathogens, contribute to soil aggregation, and participate in soil formation (Dalai 1998). Soil respiration and enzyme activities, particularly hydrolase activities, involved in organic matter turnover, hence in nutrient cycles and plant nutrition, have been utilized by soil scientists in order to investigate the effects of different soil management strategies and agricultural practices, including organic amendments on soil fertility and health. Since the soil is a very complex ecosystem, the measurement of a single parameter is not suitable as a biological indicator of soil quality. By contrast, the simultaneous measurement of several parameters allows a better assessment of the effects of
238

Winter School on “Waste recycling and resource management”-Dec. 3-23, 2014
management on soil properties. The quantification of microbial biomass and microbial activity of soil has been an important research issue for soil scientists for many years because of the important role that micro flora plays on nutrient cycles in soil, organic residues degradation, humic substance synthesis and pollutant degradation. Soil microbial biomass and microbial activity have shown to be sensitive indicators of changes in the soil organic matter content because of variations in management and soil perturbations by pollutants. Research to understand the mechanisms by which the microorganisms benefit the crops is critically important. Microorganisms that are beneficial to plants are the phosphate solubilizers, plant growth promoting pseudomonads and mycorrhizal fungi. There are considerable reports, which mentioned that fertilizer containing heavy metals affect the growth of microorganism adversely and subsequently in crop yield.
DEFINITION OF HEAVY METALS
Heavy metals appear to include all metals of the periodic table with atomic numbers greater than 20, generally excluding the alkali metals and the alkali earths. Elements - are the metals or metalloids (elements that have both metal and nonmetal characteristics) having a density greater than 5 Mg m-3 viz. Cd, Pb, Cu, Zn, Ni, Sb and Bi etc.
SOURCES OF HEAVY METALS
The risks of contaminants accumulating in soils and crops due to inadvertent addition of impurities in agricultural fertilizers and soil amendments were assessed. Elements considered of concern were cadmium (Cd), lead (Pb), chromium (Cr), Nickel (Ni) etc ( McLaughlin, 1996). The concentrations of impurities in manufactured nitrogenous or potassic fertilizers are generally low (Zarcinas and Nable 1992). Where liming materials or gypsum are by-products of industrial processing (klin dust, gypsum etc.) the products may contain significant concentrations of Cd (Zarcinas and Nable 1992), depending on the industrial process involved. Trace element fertilizers, or trace element raw materials used to manufacture trace element enriched phosphatic fertilizers, may be an important source of Cd in some fertilizers. Sauerbeck (1992) recently assessed the potential for contamination in soils by phosphatic fertilizers and drew his data from a number of sources, but in terms of fertilizer use he assessed that elements posing a potential risk of accumulation in soils are Cd, Cr, Sr (strontium), U (uranium) and Zn (zinc). The increase in the total Pb concentration in soil is probably due to the contribution of lead from the zinc sulphate in addition to that from single super phosphate source.
239

Winter School on “Waste recycling and resource management”-Dec. 3-23, 2014
Heavy metal contents (average) in fertilizers
Fertilizer Heavy metal (mg kg-1 fertilizer)
Cu Zn Mn Mo Cd Pb
NON –POINT SOURCES POINT SOURCES Fertilizers Ag. Chemicals
Waste Products
Irrigation,
Dredged S di t
Soil/Plant
Human
Animal
Urban –
Fossil fuel of
power
Generation
Mining,
Smelting,
240

Winter School on “Waste recycling and resource management”-Dec. 3-23, 2014
Single super phosphate 26 115 150 3.3 187 609
Diammonium phosphate -- -- -- 109 188 --
Muriate of potash 3 3 8 0.2 14 88
Ca-ammonium nitrate 0.2 6 11 -- 6 200
Urea 0.4 0.5 0.5 0.2 1 4
Complex fertilizer 22 276 -- -- 6 128
Pathak et al., 2002
DEFINITION OF SOIL HEALTH
Soil health is an assessment of ability of a soil to meet its range of ecosystem functions as appropriate to its environment. The term soil health is used to assess the ability of a soil to Sustain plant and animal productivity and diversity; Maintain or enhance water and air quality; Support human health and habitation.The underlying principle in the use of the term “soil health” is that soil is not just a growing medium, rather it is a living, dynamic and ever-so-subtly changing environment. We can use the human health analogy and categorise a healthy soil as one: In a state of composite well-being in terms of biological, chemical and physical properties; Not diseased or infirmed (i.e. not degraded, nor degrading), nor causing negative off-site impacts; With each of its qualities cooperatively functioning such that the soil reaches its full potential and resists degradation; Providing a full range of functions (especially nutrient, carbon and water cycling) and in such a way that it maintains this capacity into the future.
241
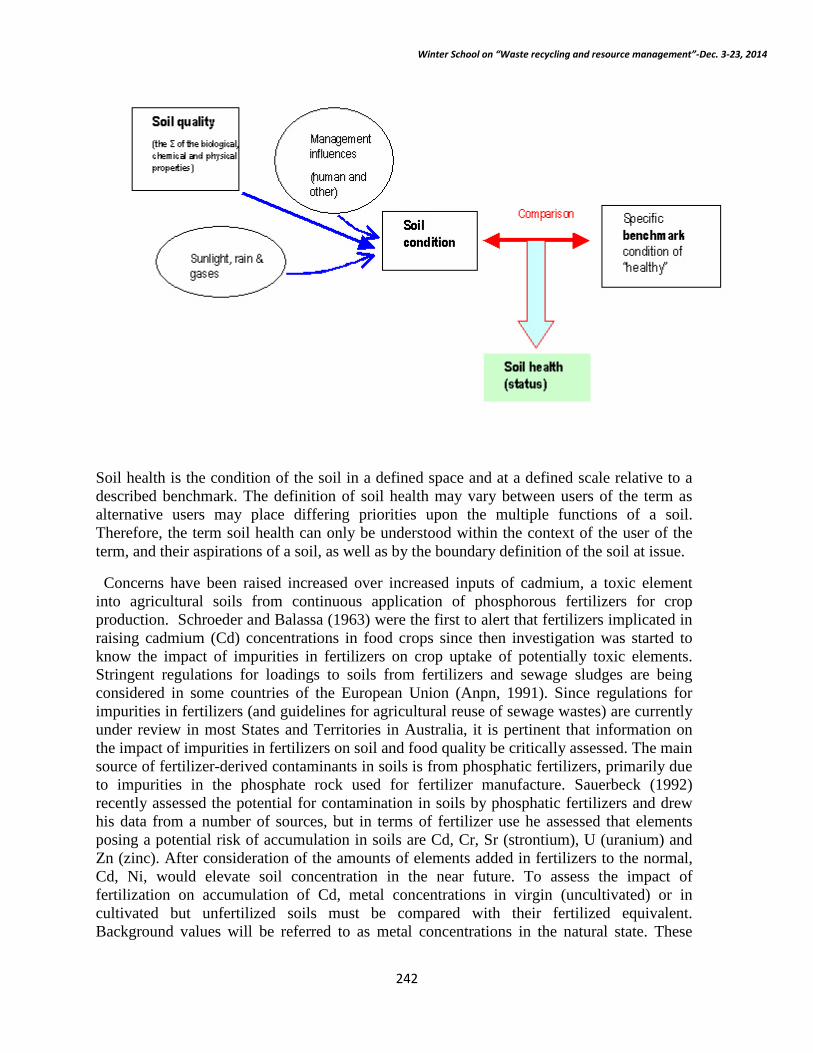
Winter School on “Waste recycling and resource management”-Dec. 3-23, 2014
Soil health is the condition of the soil in a defined space and at a defined scale relative to a described benchmark. The definition of soil health may vary between users of the term as alternative users may place differing priorities upon the multiple functions of a soil. Therefore, the term soil health can only be understood within the context of the user of the term, and their aspirations of a soil, as well as by the boundary definition of the soil at issue.
Concerns have been raised increased over increased inputs of cadmium, a toxic element into agricultural soils from continuous application of phosphorous fertilizers for crop production. Schroeder and Balassa (1963) were the first to alert that fertilizers implicated in raising cadmium (Cd) concentrations in food crops since then investigation was started to know the impact of impurities in fertilizers on crop uptake of potentially toxic elements. Stringent regulations for loadings to soils from fertilizers and sewage sludges are being considered in some countries of the European Union (Anpn, 1991). Since regulations for impurities in fertilizers (and guidelines for agricultural reuse of sewage wastes) are currently under review in most States and Territories in Australia, it is pertinent that information on the impact of impurities in fertilizers on soil and food quality be critically assessed. The main source of fertilizer-derived contaminants in soils is from phosphatic fertilizers, primarily due to impurities in the phosphate rock used for fertilizer manufacture. Sauerbeck (1992) recently assessed the potential for contamination in soils by phosphatic fertilizers and drew his data from a number of sources, but in terms of fertilizer use he assessed that elements posing a potential risk of accumulation in soils are Cd, Cr, Sr (strontium), U (uranium) and Zn (zinc). After consideration of the amounts of elements added in fertilizers to the normal, Cd, Ni, would elevate soil concentration in the near future. To assess the impact of fertilization on accumulation of Cd, metal concentrations in virgin (uncultivated) or in cultivated but unfertilized soils must be compared with their fertilized equivalent. Background values will be referred to as metal concentrations in the natural state. These
242

Winter School on “Waste recycling and resource management”-Dec. 3-23, 2014
values are probably represented by Cd concentrations in parent rock material. Cadmium concentrations in crystal rocks vary from 1 to 90,000µg/kg (Kabata-Pendias and Pendias, 1992), with igneous and metamorphic rocks generally having lower Cd concentrations than sedimentary deposits. Values for total Cd concentrations reported overseas in ‘Normal’ agricultural soils vary from less than 0.01 mg/kg to over 2.50 mg Cd/kg, but generally soils fall in the range 0.05 –1.00 mg Cd/kg. Jensen and Bro-Rasmussen (1992) recently complied data on Cd in European agricultural soils classed as normal. The mean Cd concentrations for various countries ranged from 0.06 mg Cd/kg in Finland to 0.50 mg Cd/kg in the UK, with minima and maximum from 0.03 to 10.00 mg Cd/kg. Holmgren et al (1993) recently analysed 3045 agricultural top soils in the USA for metal concentration and found Cd concentrations ranged from <0.01 to 2.00 mg Cd/kg with a mean value 0.26 mg Cd/kg. Recently, Silanpaa and Janson (1992) published data on the concentrations of Cd extracted from over 3500 soils in 30 countries and found the median Cd concentration was under 0.05 mg/kg. The main source of Cd added to agricultural soils in Australia is through the use of phosphatic fertilizers. The high concentrations of Cd in Australian superphosphates were identified by Walkely (1940) but their environmental consequence for soil and food quality in Australia were highlighted later by Williams and David (1973). The main rock phosphate sources for manufacture of phosphatic fertilizers in Australia were from oceanic sedimentary, guano-based deposits with Cd concentrations ranging from 42-99 mg/kg (McLaughlin 1991). In the manufacture of single superphosphate it appears that most of the Cd in the original phosphate rock is found in the final fertilizer (Williams 1977). In the manufacture of high analysis fertilizers, some of the Cd in the original rock appears in the by-product gypsum, but the main proportion of the Cd is transferred to the final product (David et al. 1978). Rayment et al. (1989) recently compared a small range of low and high analysis fertilizers manufactured in Queensland and found a similar ratio Cd : P ratio (413+ - 40 mg Cd/kg P) in both low and high analysis formulations. Increasing imports from other countries –rock phosphates from Senegal and Togo exhibit 10 to 100 fold higher Cd contents- suggest problems that could become reality which seem to be over estimated at present. Technological measures that might be taken to eliminate cadmium are very limited or at least expensive, although production of phosphoric acid is reducing Cd concentration (the Cd being removed with the gypsum produced). However, high elimination rates only occur with phosphates that have low Cd contents. The risks of contaminants accumulating in soils and crops due to inadvertent addition of impurities in agricultural fertilizers and soil amendments were assessed. Elements considered of concern were cadmium (Cd), lead (Pb), chromium (Cr), Nickel (Ni) etc. Cadmium is the element of most concern as its transfer from soils to the edible portions of agricultural food crops is significantly greater than for the others. Inputs of Cd to agricultural soils are predominantly through additions of Cd in phosphatic fertilizers, although atmospheric or other sources (sewage sludges) may be important in localized areas. Cadmium content in phosphatic fertilizers is generally high in Australia and Europe. It was also observed that there had been no additional accumulation of cadmium in soils low in organic matter and with pH above 6.5, to which 0.4 t ha-1 super phosphate had been added each year for 100 years; there was some retention of cadmium added in superphosphate, however, on acid soils with more organic matter. There was no change in cereal grain over time, but that in herbage had increased. The concentrations of impurities in manufactured nitrogenous or potassic fertilizers are generally low (Zarcinas and Nable 1992). Where liming materials or gypsum are by-products of industrial processing
243

Winter School on “Waste recycling and resource management”-Dec. 3-23, 2014
(klin dust, gypsum etc.) the products may contain significant concentrations of Cd (Zarcinas and Nable 1992), depending on the industrial process involved. Trace element fertilizers, or trace element raw materials used to manufacture trace element enriched phosphatic fertilizers, may be an important source of Cd in some fertilizers. The value compares with previous estimates for fertilizer Cd inputs to Australian soils by Tiller et al., (1994) of 1.5-3.0 g Cd /ha-year and data for the UK of 4.3 g Cd /ha-year (Hutton and Symon, 1986), 3.5 –4.3 g Cd /ha-year in Germany (Sauerbeck, 1982), 3.0 g Cd /ha-year in Denmark (Hovmand 1981), 8.9 g Cd /ha / year in New Zealand (Bramely 1990), 0.3 – 1.2 g Cd /ha/year in the USA (Mortvedt 1987) and an average for EEC countries of 2.5 g Cd /ha /year (Biberacher and Shah 1990). Where soils are heavily fertilized, Cd input may range up to 35 g Cd /ha/year. values are consistent with measured increases in Cd concentrations in surface soils due to fertilization e.g. up to 0.14 and 0.18 mg/kg soil for cereal and pastures soils respectively (Williams and Dravid 1973). The accumulation of Cd in soils from the long-term application of phosphatic fertilizer is now well documented in studies in many other countries (Mulla et al. 1980, Mortvedt et al., 1981, Isermann 1982; Smilde and van Luit 1983, Kofoed and Klausen 1983, Hansen and Tjell 1983, Rothbaum et al., 1986; Baerug and Singh 1990; Anderson and Siman 1991; Singh 1991). Cadmium appears to be slowly accumulating in our agricultural soils and concentrations of Cd in agricultural produce have exceeded permitted concentrations in some situations. It is important that accumulation of this element in soils is minimized through use of P fertilizers with low Cd concentrations, and growers be made aware of environmental conditions or crop varieties which result in produce having Cd concentrations in excess of the MPC. Measurement and prediction of the long term availability of Cd in a range of soils will be important in order to determine acceptable loading limits of this metal to agricultural land. Heavy metals are toxic to all organisms if present in high concentrations. Microorganisms are no different in this respect, and heavy metal exposure has, since the last century, been known to affect microbial growth and survival. Soil respiration rate is easy to measure and appears to be a sensitive measurement with which to detect heavy metal pollution, especially under standardized conditions. Thus Tyler (1974), by standardizing the soil water content, minimized the variability among the samples and was able to detect changes in respiration rate at lower contamination levels than Nordgren et al. (1983) who used soil sample with field moisture content. The addition of different substrates to soil and the subsequent degradation of these substances measured as increased respiration rate, has also been used to study the effect of heavy metals. Tyler (1975) found that the rate of cellulose and starch decomposition to be lower in metal contaminated soil. Regarding nitrogen transformation, in general, there appears to be an increased N-accumulation at lower metal levels, while larger additions of metal usually lead to lower accumulation than in control treatments. Similarly, N-mineralization can be stimulated or inhibited by the application of metals (Tyler, 1981).Several measurements of enzyme activities have been used in relation to heavy metal pollution in soil. The activity of acid phosphatase and dehydrogenase appear to be a good indicator of pollution. Tyler and Westman (1979) recorded lower enzymatic activity levels in soil where a mean of 78 mg Pb/kg soil, 1.6 mg Cd/kg soil and 53 mg As/kg soil were found. A reduction in abundance and biomass of fungi and bacteria due to heavy metals has been detected in numerous investigations. Fungi appear to be more tolerant than bacteria. Among bacteria, gram negative bacteria appear to be more tolerant than gram –positive ones, while selective groups, like Azotobacter or nitrifires, have been reported to be especially sensitive
244

Winter School on “Waste recycling and resource management”-Dec. 3-23, 2014
to heavy metal pollution (Maliszewska et al., 1985). Few attempts to study total microbial biomass in metal polluted soils have been made. Brookes and McGrath (1984) found a decrease in soil biomass measured by the fumigation technique in agricultural soils. Regarding species composition and diversity, a shift in the species composition due to heavy metal pollution, for example with Zn (Jordan and Lechevalier, 1975) Cd, Cu, Pb and Zn (Hartman,1976) and Cu (Kendrick, 1962) was, however evident. Usually a decrease in commonly isolated genera such as Penicillium, Oidiodendron, and Mortierella are found in metal polluted soils (Arnebrant et al., 1987). Carter (1978) found Penicillium waksmanii to be abundant only in polluted soils and Arnebrant et al., (1987) found some species of Mortierella and Penicillium only in polluted soil samples, although other members of these genera disappeared in sites with high metal concentrations. A majority of agricultural soils contain sufficient reserves of phosphorous, of which a considerable part is accumulated as consequence of regular applications of P-fertilizers (Lata et al., 2000). Diverse groups of organisms in soil employ variety of solubilization reactions to release soluble phosphorus from insoluble phosphates (Singh and Kapoor, 1998). There exists an immense diversity among microorganisms within a group of microorganisms. The maintenance of this potent battery of prototype and new microorganisms is the very basis of impressive investment in long tem basic and applied agricultural research.
HEALTH IMPLICATIONS OF HEAVY METAL ACCUMULATION
Many metals act as biological poisons even at parts of per billion (ppb) levels. The toxic elements accumulated in organic matter in soils are taken up by growing plants (Dara, 1993). The metals are not toxic as the condensed free elements but are dangerous in the form of cations and when bonded to short chains of carbon atoms (Bairds, 1995). Many metals with important commercial uses are toxic and hence undesirable for indiscriminate release into the environment (Bunce, 1990). Chaney (1980) and Smith et al. (1996) cautioned on the use of wastes in crop production since it may be possible for heavy metal from the waste to accumulate in soils and thereby enter the food chain, contaminate surface and underground water thus cause health hazard. Lead contamination of biota is well documented. Lead is usually ingested through food, water and cigarettes. Lead is very toxic and has very chronic health implications even at very low concentration. Ingestion of Pb could cause metal retardation in children (Huges et al., 1980), colic anemia and renal diseases (Fisherhbein, 1992). Lead replaces Ca in the bone (Mills, 1971}. Its effect is cumulative and long term exposure has been noted to cause serious health hazard (Essien, 1992) which include inhibition of the synthesis of haemoglobin and also adversely affect the central and peripheral nervous system as well as the kidney (Bhata, 2002). Human being may be exposed to nickel by eating contaminated food containing nickel. Foods naturally high in nickel include soya-beans, nuts and oat meals. Miller and Miller (2002) noted that Zn and Cu are toxic to plants before they accumulate in sufficient concentrations to affect animals or human. Consequently, high concentration of Zn and Cu kill or stunt plants growth. Cadmium adversely affects several important enzymes. It can also cause painful osteomalacia (bone disease), destruction of red blood cell and kidney damage. Cadmium is chemically very similar to zinc and are
245

Winter School on “Waste recycling and resource management”-Dec. 3-23, 2014
found in the +2 oxidation state. It is believed that much of the physiological action of cadmium arises from its chemical similarity to zinc. Specifically, Cd may replace Zn in some enzymes thereby altering the stereochemistry of the enzyme and impairing its catalytic activity. Disease symptoms ultimately results. Arsenic forms a number of toxic compounds. The toxic As2 O3 is absorbed through the lungs and intestine. Biochemically, arsenic acts to coagulate proteins, and inhibits the production of adenosin triphosphate (ATP) in essential metabolic processes. Generally, at the biochemical levels, the toxic effects caused by excess concentrations of heavy metals include competition for sites with essential metabolites, replacement of essential ions, reactions with –SH groups, damage to cell membranes and reactions with the phosphates groups (Alloway and Ayres, 1997).
Agricultural soils normally contain low background levels of heavy metals. Contamination from industrial activities or byproducts can increase the natural levels of heavy metals in soil, creating a health hazard to people, livestock and plants. Fertilizers and other soil amendments also add small amounts of heavy metals to the soil, which can build up over time with repeated applications. The actual toxicity of a heavy metal will be affected by soil texture, organic matter, and pH. The health effects of exposure to heavy metals depend on the amount and duration of exposure, i.e. the volume of contaminated soil or food consumed over time. It is not clear exactly what levels of heavy metals in soil are safe or unsafe, so the following information is provided only to help you understand your test results and the relative level of risk they represent. In soils with elevated heavy metal levels, which may pose higher levels of risk, you should consider whether remedial actions are appropriate, or whether crops should be grown at all. Mohamedova and Lecheva (2013) reported that microarthropod community structure reflects soil ecosystem health and is influenced by the soil environment directly and/or indirectly by affecting the soil micro-flora and fauna that they graze. In this study, ecological indices for soil microarthropod community structure in soil contaminated (CS) with heavy metals in Plovdiv region and of a nearby non-contaminated area (NC) were examined during the three seasons from April through November 2011 to reveal influence of heavy metals on the soil microarthropod community structure. The QBS index as a tool has been applied to assess soil biological quality. Comparison of QBS index between CS and NC indicates that it was decreased in CS, indicating that soil health and function were adversely affected. Seasonal changes in the QBS index during the study period showed that the effect of heavy metals on microarthropod community structure is influenced by seasonal changes in environmental conditions.
Heavy Metals Soil Test The test provided is only a screen for heavy metals and does not measure the actual total metal content of the soil. This low-cost test uses a weak acid to extract heavy metals. The amount of metal extracted is roughly proportional to the total amount present. Maximum levels for heavy metals in soils established by regulatory agencies are based on total heavy metal content (see below) and require a more involved and expensive test. Table 1 shows the aggregated results of thousands heavy metal soil tests from across many soil types and management practices on farms and gardens in Vermont. The table includes the median
246

Winter School on “Waste recycling and resource management”-Dec. 3-23, 2014
result for each element, which is the point where half the test results were above and half the test results were below. The 95% and 99% result levels are the points where only 5% and 1% of all test results, respectively, were higher. The maximum level is the highest test result recorded for that element from the number of tests shown in the bottom row. Test results above the 95% level may be cause for concern, and thus some remedial action (see below). An extremely high level may be cause for extreme action, such as abandonment of production, but such results are rare, as indicated by the fact that the maximum levels found for each element are many times higher than the 99% level for each element. (All results are mg/kg of soil, which is the same as ppm.) . Table 1. Combined results of field, horticulture and homeowner soil tests for heavy metals. University of Vermont Agricultural and Environmental Testing Lab, 2007-2011. Results are for extracted heavy metals using pH 4.8 ammonium acetate. (Arsenic is not listed because it is not effectively extracted.) mg/kg of soil
Copper Cadmium
Chromium
Nickel Lead Zinc
Median 0.20 0.05 0.05 0.15 0.35 1.05 95%* 0.75 0.10 0.15 0.50 2.20 6.90 99%** 1.75 0.20 0.20 1.20 18.30 24.3
0 Maximum
60.50 2.25 1.05 11.65 2129.00
370.50
Number of tests
17,209 11,958 11,638 12,252 17,183 17,302
* 5% of all test results were higher than this level. **1% of all test results were higher than this level.
The US Environmental Protection Agency (EPA) and NY Department of Environmental Conservation (NYS DEC) have guidelines for determining the safety of various land uses based on total soil metal concentrations. Table 2 shows these limits, which are used to guide clean-up efforts. EPA levels are used to guide clean-up efforts of contaminated sites; NYS DEC levels are based on removing human health risks; unrestricted use includes agriculture. Table 2. Levels of heavy metals in soil used to guide cleanup and land use decisions (mg/kg)
US EPA
Soil level requiring clean-up
NYS DEC
Unrestricted use* Residential use
Copper (Cu) -- 270 270
Cadmium (Cd)
70 0.43 0.86
247
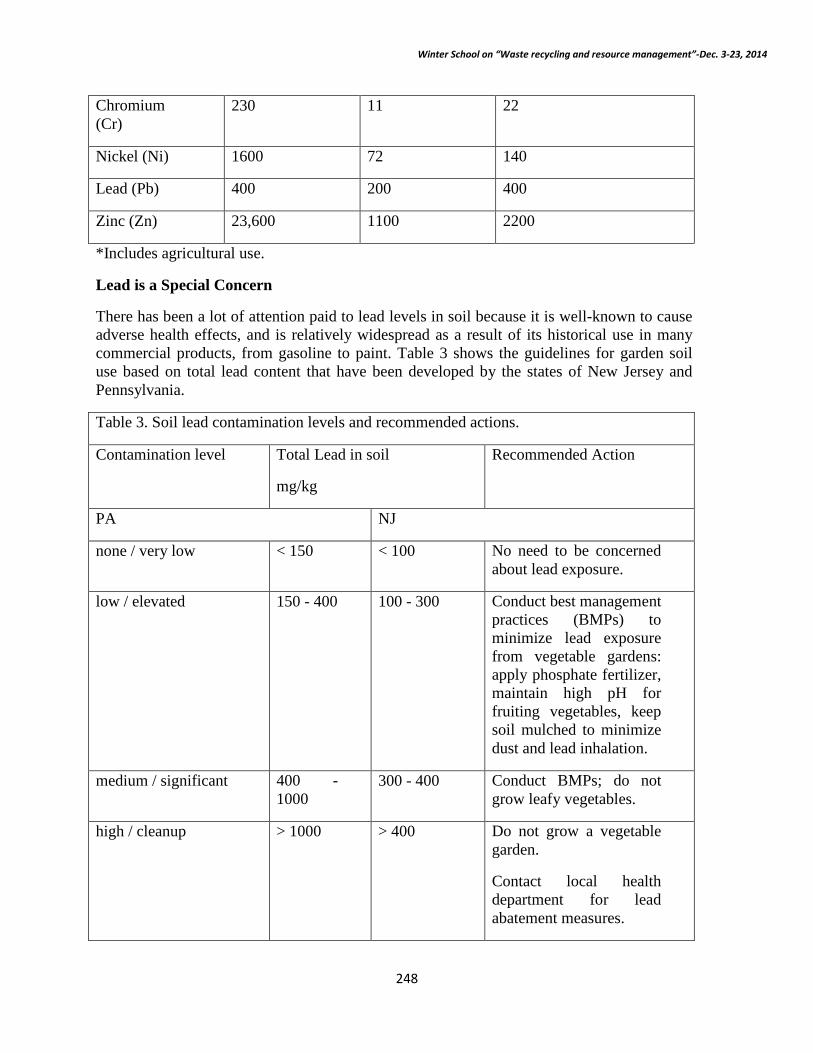
Winter School on “Waste recycling and resource management”-Dec. 3-23, 2014
Chromium (Cr)
230 11 22
Nickel (Ni) 1600 72 140
Lead (Pb) 400 200 400
Zinc (Zn) 23,600 1100 2200
*Includes agricultural use.
Lead is a Special Concern
There has been a lot of attention paid to lead levels in soil because it is well-known to cause adverse health effects, and is relatively widespread as a result of its historical use in many commercial products, from gasoline to paint. Table 3 shows the guidelines for garden soil use based on total lead content that have been developed by the states of New Jersey and Pennsylvania.
Table 3. Soil lead contamination levels and recommended actions.
Contamination level Total Lead in soil
mg/kg
Recommended Action
PA NJ
none / very low < 150 < 100 No need to be concerned about lead exposure.
low / elevated 150 - 400 100 - 300 Conduct best management practices (BMPs) to minimize lead exposure from vegetable gardens: apply phosphate fertilizer, maintain high pH for fruiting vegetables, keep soil mulched to minimize dust and lead inhalation.
medium / significant 400 - 1000
300 - 400 Conduct BMPs; do not grow leafy vegetables.
high / cleanup > 1000 > 400 Do not grow a vegetable garden.
Contact local health department for lead abatement measures.
248

Winter School on “Waste recycling and resource management”-Dec. 3-23, 2014
Best Management Practices for Soils with Elevated Levels of Heavy Metals
Although heavy metals remain in soil for a very long time, there are some steps that can be taken to reduce the level of risk they pose. In some cases, heavy metal concentrations can be ‘diluted’ with deep tillage; for example, to distribute contaminated surface sediment that was deposited by flooding. In garden plots, dilution can be achieved by the addition of uncontaminated soil. Adding organic matter to the soil can help ‘tie up’ heavy metals chemically, reducing their availability for potential plant uptake. Similarly, liming to a neutral pH and maintaining optimal soil phosphorus levels can reduce heavy metal availability to plants.
Build up of heavy metals in the soils under long term experiment in India is not alarming after 25 years of cultivation. Amongst the treatment addition of fertilizer at higher doses (150% NPK, 100% NPK+ Zn, 100% NPK+FYM), increased the DTPA extractable heavy metals contents but are under permissible limits. Amongst the fertilizer samples of different sites of long term experiment DAP, SSP, FYM, and ZnSO4 content varying amount (mg/kg) of cadmium (Cd), lead (Pb), chromium (Cr), and Nickel (Ni) which may increase the build up of metal in soil. To assess the quality of food grain, heavy metal content in grain was estimated and it has been found that all the heavy metals like Cd, Cr, Pb, Ni, Co were present in the food grain. Intake of metals by human through the consumption of these grains was calculated and hazard quotient i.e. the ratio of average daily dose to the reference dose was worked out. The values of hazard quotients (HQ) for different crops of different heavy metals were calculated and the values of HQ for all the crops were less than unity (1). Hence these grains are not likely to induce any health hazards to the consumers (human) as far as its metal contents are concerned.
REFERENCES
Alloway BJ (1990) Heavy Metal in soils Blackie Glasgow UK.
Alloway BJ and Ayres DC (1997). Chemical principals for environmental pollution Blackie Academic and Professional pp 190-220.
Bairds C (1995). Environmental Chemistry. Printed in United State ofm America pp 387 – 387.
Bearington F (1975). Heavy Metal contamination of vegetables and in domestic gardens around a smelting complex. Environmental Pollution 9: 211-217.
Bhata SC (2002). Environmental Chemistry. CBS Publishes and Distributors, New Delhi pp 442
Boon DY Soltanpour PN (1992). Lead, Cadmium and Zinc contamination of aspen garden soil and vegetation. Journal of environmental quality 21: 82-86.
249

Winter School on “Waste recycling and resource management”-Dec. 3-23, 2014
Bryan GW (1976). Heavy Metal contamination in sea, in: Matius Pollution Johnson, Academic Press. Pp 185 – 302.
Bryce-Smith D (1971). Lead pollution, a growing hazard to public health Chemistry in Britain, 7(2) 54 – 56.
Bunce NJ (1990). Environmental Chemistry Winners Publishing Ltd. Winnipeg Canada, pp 206 – 247.
Chaney Rl (1980). Health risk associated with toxic metals in municipal sludge in: Bilton G et al (ed) Sluge-Health-Risk of land application. Ann Arbor Scie. Publi MI pp 59 – 83
Dara SS (1993). A Text book of Environmental Chemistry and pollution control. Printed at Rjendra Rarindra Printers (PVT) Ltd Ram Niger, New Delhi 10055, 167 – 206.
Essian EU (1992). Differential accumulation of lead on selected edible vegetables associated with roadside gardening in Nig. Trop. J. Applied Sciences 1(2): 83-86.
Faust SD, Aly OM (1987). Adsorption processes for water treatment, Butterwort publishers, Boston. pp. 108-132.
Fischbein A (1992). Occupational and environmental lead exposure In: environment and occupational medicine. Ron WN (ed) Little brown publication Boston pp. 735 – 736.
Horsfall M Jr, Spiff AI (2004b.) Studies on the effect of pH on the sorption of Pb2+ and Cd2+ from aqueous solutions by caladium bicolor (wild cocoyam) biomass. Elect J. Biotechnol (online). 15 December, vol. 7, No. 3. Available from internet: http://www.ejbiotechnology.info/content/vol.7/issure3/full/8/index.html. ISSN 0717 3458.
Hsisheng T, Chien-Ts H (1998). Influence of surface characteristics on liquid – phase Adsorption of phenol by Activated carbon prepared from Bituminous coal. Ind. Engr. Chem. Res. 37 (9), 3618-3624.
Huges Mk, Lepp Nw, Phipps DA (1980). Arial heavy metal pollution and terrestrial ecosystem. Advance Ecol. Research 11: 217 – 227
Jeanne CC, Sidle RC (1991). Fate of heavy metals in an abandoned Zinc tailing pond. J. Environ. Qual. 20: 745 – 751.
Kabat Pendias A, Pendias H (1984). Changing metal cycles and human health Nnagu, JO (ed), Springer, Verling Berlin.
Krankel JSC (1989). Sources and classification of water pollutants In: Industrial pollution: Sax NJ (ed) Van Nostrand Reinhold Co. New York. pp. 177 – 219.
Miettinen JK (1975). The accumulation and excretion of heavy metals in aquatic environment. Peter A (ed) Krenkal Perganon Press. p. 155.
Miller DM, Miller WP (2000). Land application of wastes. Summer ME (ed) Handbook of soil science CRC Books New York.
250

Winter School on “Waste recycling and resource management”-Dec. 3-23, 2014
Ndiokwere CL (1984). A Study of Heavy metal pollution from motor vehicle emission and its effect on road side vegetation and crop in Nigeria. Environ. Pollut. Series 8(7): 35 – 42.
Nwoko CO, Egunobi Jk (2002). Lead contamination of soil and vegetation in an abandoned battery factory site in Ibadan, Nig. J.Sustain Agric. Environ. 4(1): 91 – 96
Rose CJ (2002). Lead in the home garden and urban soil environment. http://www.extension.umn.edu/distribution.horticulture/DG2543html. Sax NI, Sax PH (1975). Encyclopedia index in industrial pollution. Sax NJ (ed) Van Nostrand Reinhold, New York pp. 577 – 683.
Smith CJ, Hopmans P, Cook FJ (1996). Accumulation of Cr, Pb, Cu, Ni Zn and Cd in soil following irrigation with untreated urban effluents in Aust. Environ Pollut. 94(3): 317 – 323.
Sonuhmache M, Domingo JL, Liobet JM, Conbella IJ (1993). Chromium, Copper and Zinc concentration in edible vegetables grown in Terragon Province Spain, J. Bull. Environ. Contamination and Toxicol. 58: 515-521.
US EPA. 2002. Supplemental guidance for developing soil screening levels for superfund sites. Office of Solid Waste and Emergency Response, Washington, D.C.
Vousta D, Grimanins A, Sammara C (1996). Trace elements in vegetable grown in an industrial areas in relation to soil and air particulate matter. Environ. Pollut. 94(3): 325 – 335.
251
Winter School on “Waste recycling and resource management”-Dec. 3-23, 2014
Biochemical Quality Assessment of Compost Prepared from Organic Wastes
A.B. Singh Indian Institute of Soil Science Nabi Bagh Berasia Road Bhopal-462038 (M.P.)
The diversification of organic sources of plant nutrients is becoming popular these days
and the use of compost or vermicompost has become an important input in the integrated use
of plant nutrient supply. Recycling of crop residues makes an appreciable contribution to
improving the organic matter content of the soil. The residues influence physicochemical and
biological properties of the soil and play an important role in energy flow and nutrient
cycling. If the decomposition of residues is done by composting i.e. by the use of enrichment
materials or by vermiculture inoculations, the decomposition become further accelerated and
the decomposed products become enriched with mineralizable plant nutrients. The quality
and quantity of organic manures play a vital role in the maintenance of soil quality in
sustainable agriculture production.
The organic wastes available in India are estimated to supply about 7.1, 3.0 and 7.6
million tones of nitrogen, phosphorus and potassium, respectively. Enhancing the
degradation of organic wastes and enrichment by chemical amendment (rock phosphate,
pyrite and urea) are some of the recent developments in composting technology. These
accelerate the break down of organic into simpler form by converting them into the soluble
and mineralizable forms.
Production of enriched compost
The recycling of crop residues and organic wastes through composting methods is the
key technology for disposal and production of organic manures and minimization of
environmental pollution. Technologies for the production of enriched compost such as
phosphocompost and N-enriched phosphocompost from crop residue, forest litter and
biodegradable organic wastes developed using indigenously available mineral additives such
as rock phosphate, pyrites and beneficial microorganisms like cellulose decomposers
(Pacilomyces fusisporus), phosphate solubilizers (Aspergillus awamorie) and N-fixing
microorganisms (Azotobactor chroococcum). For phosphocompost, rock phosphate (.2.5%
252

Winter School on “Waste recycling and resource management”-Dec. 3-23, 2014
P2O5) and AG pyrites (5%) are mixed on DM basis. Again for N-enriched phosphocompost,
05% N was added through urea in addition to the above two ingredients. For P-enriched
vermicospost preparation, rock phosphate @ 2.5% P2O5 could be applied at the time of
earthworm inoculation after 45 days.
Biological and Biochemical assays
The biochemical and biological parameters of compost can be studied by analyzing the
different enzyme activities in compost samples:
Dehydrogenase Activity:
Biological activity of soil/compost is the function of number of organism present in the
soil/compost and their physiological efficiency. The rate of respiration can be used as an
index of the biological activity of soil/composts. Dehydrogenases, which are respiratory
enzymes and integral part of all organisms, will give a measure of biological activity of
compost at a given time and the activity of dehydrogenase can be estimated by following the
procedure as given by Casida et al. (1964).
Principle:
In respiration, biological oxidation of reduced compounds occurs which is catalysed by
dehydrogenase. This process can be represented as:
RH2 + A → R + AH2 (2H±2e -)
Where, RH2 represents a reduced compound (hydrogen donor) and ‘A’ is the
electron acceptor. In the anaerobic conditions compound like TTC cannot act as electron
acceptor. In the process, TTC is reduced to, TTF, which can be quantitatively extracted by
methanol and measured colorimetrically.
Reagents:
(i) 20% Calcium Carbonate
(ii) 3%, 2, 3, 5- Triphenyltetrazolium chloride (TTC): 3 g of TTC will dissolved in about
80 ml of water and made the volume upto 100 ml with water.
253

Winter School on “Waste recycling and resource management”-Dec. 3-23, 2014
(iii) Methanol: (AR grade)
(iv) Triphenyl farmazan (TPF) standard solution: 100mg of TPF will dissolved in about
80 ml of methanol and volume will be adjusted to 100 ml with methanol.
Procedure:
5 g compost sample will be taken in test tubes and add 0.2 g of calcium carbonate, 1 ml
of 3% TTC and 2.5 ml of distilled water. The content of the tube will be mix thoroughly. The
tube will incubate at 37oC for 24 hrs. To each test tube, add 5 ml of methanol and then
centrifuged for 10 minutes. The intensity of pink red colour will measure on
spectrophotometer at 485 nm. Methanol will take as a blank.
Acid and Alkaline Phosphatase Activity:
The acid and alkaline phosphatase activity in compost samples will be analysed by adopting the producer of Bremner and Tabatabai (1969).
Reagent:
i)Toluene
ii) Modified universal buffer (MUB) stock solution: It can be prepared by dissolving 12.1
g of tris hydroxy methyl amino methane (THAM), 11.6 g of maleic acid, 14.0 g of citric
acid, and 6.3 g of boric acid (H3BO3) in 488 ml of I N sodium hydroxide (NaOH) and
dilute the solution to 1 litre with water.
ii) Modified universal buffer (MUB) pH 6.5 and 11: Place 200 ml of MUB stock solution
in a 500 ml beaker on a magnetic stirrer. Titrate the solution to pH 6.5 with 0.1 N
hydrochloric acid (HCl) and adjust the volume to 1 litre with water. Titrate another 200
ml of MUB stock solution to pH 11 using 0.1 N NaOH, and adjust the volume to 1 litre
with water.
iv) p-Nitrophenol phosphate solution, (0.025 M): Dissolve 0.420 g of disodium p-
nitrophenol phosphate tetra hydrate MUB pH 6.5 (for assay of acid phosphatase) or pH
11 (for assay of alkaline phosphatase) and dilute the solution to 50 with MUB of the
same pH. Store the solution in a refrigerator.
254
Winter School on “Waste recycling and resource management”-Dec. 3-23, 2014
v) Calcium Chloride 0.5 M: Dissolve 73.5 g of CaCl2 in about 700 ml of water, and made
up the volume to 1 litre with water.
vi) Sodium hydroxide 0.5M: Dissolve 20 g of NaOH in about 700 ml of water and made
up the volume to 1 litre with water.
vii) Standard p nitrophenol solution: Dissolve 1.0 g of p-nitrophenol in about 70 ml of
water and dilute the solution to 1 litre with water. Store the solution in a refrigerator.
Procedure:
Take 1 g of sample in a 50 ml flask, add 0.2 ml of toluene, 4 ml of MUB (pH 6.5 for
assay of acid phosphatase or pH 11 for assay of alkaline phosphatase), 1 ml of p-nitrophenol
phosphate solution made in the same buffer, and swirl the flask for a few seconds to mix the
contents. Stopper the flask, and place it in an incubator at 37oC for 1 hour. After one hour,
remove the stopper, than add 1 ml of 0.5 M CaCl2 and 4 ml of 0.5 M NaOH, swirl the flask for a
few seconds, and filter the soil suspension through a whatman no. 2 filter paper. Measure the
yellow colour intensity at 420 nm on spectrophotometer.
Cellulase activity Cellulase activity in compost samples can be analysed by adopting the procedure as
described by Schinner and Merri (1990). For assay of cellulase activity. The air-dried sample
(20º C) can be stored at room temperature (20ºC) for 1 month without loss of activity.
Reagent:
i) Carboxy methylcellulose sodium salt. Dissolve 7g-carboxy methylcellulose sodium
salts.
ii) 0.2 M acetate buffer (pH 5.5)
iii) Anhydrous sodium carbonate, 16.0 g and sodium cyanide 0.9 g dissolve in 1 liter
distilled water.
iv) Potassium ferric hexa cyanide, 0.5g dissolve in 1 litter distilled water.
255

Winter School on “Waste recycling and resource management”-Dec. 3-23, 2014
vi) Ferric ammonium sulfate 1.5g sodium dodecyle sulfate 1.0g H2S04 4.2 ml dissolve in
one litter distilled water.
Procedure:
Weigh 5g compost samples and transferred it in a 100 ml Erlenmeyer flask and mixed
with 15 ml 0.2 M acetate buffer and 15 ml cellulose sodium salt solution. The flask will shake
briefly, sealed with a rubber stopper and keep at 50ºC for 24 h. After that the content of the
flasks will filter. A control for each sample prepared separately and treated like the Sample.
After incubation add 15 ml CM cellulose substrate solution to the control, and then the mixture
will shake and filtered immediately for the production of extracts. The reducing sugar content in
the extract will be measured by following the method of Nelson (1944). To one ml of the
sample add 1 ml of copper reagent. It will then boiled in a water bath for 20 minutes. One ml
of arsenomolubdate reagent will be added to the tubes and made up the volume upto 25 ml.
Absorbance will read at 495 mm. Glucose standards shall run simultaneously to quantify the
unknowns.
Arylsulfatase activity
Arylsulfatase activity will be assayed by the procedure described by Tabatabai and
Bremner (1970 ). The method is based on colorimetric determination of the P-nitrophenol
released by arylsulfatase activity when compost is incubated with buffer (pH 5.8) potassium P-
nitrophenol sulfate solution and toluene.
Reagents:
(i) 0.25 ml Toluene
(ii) Acetate buffer 0.5 M, pH 5.8: Dissolve 68 g of sodium acetate trihydrate in about 700 ml
of water, add 1.70 ml of glacial acid (99%) and dilute the volume to 1 liter with distilled
water.
(iii) P-nitrophenyl sulfate solution: 0.025 M: Dissolve 0.312g of potassium p-nitrophenyl
sulfate in about 40 ml of acetate buffer, and dilute the solution to 50 ml with buffers.
(iv) Calcium chloride (0.5 M), Sodium hydroxide (0.5 M) and standard p-nitrophenol
solution: (as described in phosphatase enzyme activity)
256

Winter School on “Waste recycling and resource management”-Dec. 3-23, 2014
Procedure:
Place 1 g of compost sample in a 50 ml flask, add 0.25 ml of toluene, 4 ml of acetate
buffer and 1 ml of p-nitrophenol sulfate solution and shake the flask for few seconds to mix the
contents Stopper the flask and place it in a incubator at 37º C. After 1 hr, remove the stopper,
add 1 ml of 0.5 M CaCl2 and 4 ml of 0.5 M, NaOH, and shake the flask for a few seconds and
fitter the suspension through a whatman No. 2 filter paper. Measure the yellow color intensity
on a spectophometer.
Urease activity:
Urease activity will be assayed by the procedure described by Mulvancy and Bremner
(1979). Take 5g of compost samples +10ml of phosphate buffer (pH 6.7), 10 ml of a urea
solution and 0.5 ml of toluene will be added to a 50 ml beaker. The soil could be incubated at
30oC for 24 hours. After incubation, the contents of the beaker will be filtered and add 15 ml of
1N KCl in the beaker. After 10 minutes, the solution will be filtered and make the volume upto
100ml with distilled water. The amount of ammonium in a 10 ml sample will determine by
steam distillation.
Soil respiration
In a conical flask 50 g sample is taken. 10 ml of N Na OH is pipette out in a small bottle
tied to a cork and placed inside the flask. Flasks are left undisturbed for 10 days. Titration is
done using 0.5 N HCL, a drop of Phenolphthalein indicator, 2 ml of BaCl2 and 3 ml of distilled
water are added. Titration is done till the color changes from pink to white. Blank is run
simultaneously.
Microbial biomass carbon
Moist samples approximately50 g, are fumigated with chloroform (ethanol free) for about 18-
24 hours. Then samples are exposed for 2 hours to escape the chloroform from the system.
Samples are extracted with 200 ml of 0.5 M K2 SO4 and shake for 30 min and filtered with what
man no 42 filter paper. In 150 ml conical flask 10 ml of extract is taken with 2 ml of 0.2 N
K2Cr2O7 and 15 ml of acid mixture. This mixture is digested at 150 °C or 30 min and allowed to
cool and then diluted with 20-25 ml distilled water. Titration is using 0.01N Ferrous
257

Winter School on “Waste recycling and resource management”-Dec. 3-23, 2014
Ammonium Soleplate and Ferro in as an indicator. Similar procedure is followed for non-
fumigated samples.
Microbial biomass nitrogen
Most samples, approximately 5g, are fumigated with chloroform (ethanol free) for about 18-24
hours. Soil samples are exposed for 2 hours to escape the chloroform from system. Samples are
extracted with 50 ml of 2 N KC1 and shake for half an hour. Filter the soil suspension with
Whitman no. 42 filter paper. The filtered organic N in the extract can be determined by Boric
acid distillation method. In distillation tube 10 ml aliquot is taken with a pinch of MgO and 20
ml of distilled water. Then it is distilled with 25 ml of 2% boric acid. The Boric acid changes
from purple to green. Then it is titrated against 0.02 N H2SO4. Same tube is cooled down. To it
a pinch of Devarda’s alloy is added which is again distillated with 25 ml of boric acid. Color of
boric acid changes from purple to green. Then titrate it against 0.02 N H2SO4. The same
procedure is followed for non-fumigated samples.
Biochemical quality indicators of compost:
The increase in phenol is one of the indicators for completion of humification and the composts
having reached the maturity level. Dehydrogenase activity was chosen as an index of
microbiological activity because it refers to a group endo-cellular enzymes which catalyze the
oxidation of soil organic matter (Forster et al, 1993). The higher value of dehydrogenase
activity in conventional compost indicates that the compost is still being decomposed and
hence, it exhibited higher microbial activity in fully matured compost decomposition is slowed
down and the dehydrogenase activity is thus lower. The initial high dehydrogenase activity
might have been the result of high microbial activity due to the high WSC and consequently
the decrease coincided with the decrease WSC. Alkaline phosphatase is the indicator of
phosphorus minieralization power by the microorganisms involved in P-cycling. Similar was
the case with acid phosphatase also. The higher values of alkaline phosphatase enzyme activity
in the enriched compost may be due to the use of rock phosphate amendment in the
composting process which accelerated the microorganisms related to phosphorus
mineralization.
258

Winter School on “Waste recycling and resource management”-Dec. 3-23, 2014
Study of chemical, biochemical and biological parameters of compost helps to
understand the potential of nutrient availability and biological properties. Singh and Ganguly
(2005) have reported that the total phenol content was recorded highest in vermicast followed
by vermicompost and vermiwash. The activity of dehydrogenase was highest in vermicompost
compared to vermicast and vermiwash. Vermiwash contained the lower activity of
dehydrogenase, acid phosphatase and alkaline phosphatase. Similarly, total phenol content in
vermicompost and P-enriched vermicompost showed higher values than the conventional
compost. With regard to dehydrogenises activity it was observed that the vermicompost either
produced in heap or pit method showed less DHA as compared to FYM. The Conventional
compost possessed higher value of DHA, which indicates that the compost is partially cause
oxygen deficiency in soil and rhizosphere and biological blockage of available soil nitrogen
(Karthikeyan, 2000).
Table 1: Biochemical characteristics of vermicompost prepared from soybean and wheat straw.
Waste Material
/ Plant Lifer
Lignin (%) Cellulose (%)
L/C Total Phenol
(µg g-1)
Dehydrogenase
(µg TPF g-1 24 hr-1)
Phosphatase
activity (use P nitrophenol
g-1 hr-1)
Soybean Straw
39 30 2.6 100 38.7 562
Wheat Straw 37 12 3.1 28.5 40.0 590
Control 24 16 1.5 84 48.9 428
Singh and Ganguly, (2004).
259

Winter School on “Waste recycling and resource management”-Dec. 3-23, 2014
Table 2: Biochemical composition and enzyme active of vermicast and vermiwash
Singh and Ganguly, (2004).
In other study, the decomposition of leaf litter (fallen leaves of Eucalyptus, Acacia and
Jamun), wheat straw and legume residues was carried out separately with and without
earthworm (Zachariah and Chhonkar, 2004). They have found that cellulase activity of
vermicompost materials (1226.9 µg glucose g-1 dry compost hr-1). The decreases in cellulase
activity of leaf litter and legume residue composts have been observed. Similarly, urease
activity of legume residue compost was less compared to leaf litter and wheat straw compost. It
may be due to production of NH4+ in legume compost due to its narrow C: N ratio. Since, NH4
+
inhibits urease activity and synthesis, a release of NH4+ by urinalysis may have been responsible
for lower urease activity. The increase in urease activity due to earthworm inoculation may be
due to increased biomass of earthworm and microbes, which increase the enzyme activity. The
average value of alkaline (2540.2 µg PNP g-1 dry compost ha-1) and acid phosphatase (1946.6
Parameter Vermicast Vermiwash
Total Phenol (µg g-1) 49.4 9.30
Total Sugar (ppm) 71.0 84.0
Reducing Sugar (ppm) 36.1 31.3
Non-Reducing Sugar (ppm) 35.1 52.7
Total Protein (ppm) 54.0 18.0
Total Amino acid (ppm) 47.0 12.1
Dehydrogenase activity (µg TPF/g/24hr.) 52 22
Alkaline Phosphatase (µg nitro phenol/g/hr.) 216 40
Avid Phosphatase (µg nitro phenol/g/hr.) 109 28
260

Winter School on “Waste recycling and resource management”-Dec. 3-23, 2014
µg PNP g-1 dry compost ha-1) activity of the vermicompost were significantly higher as
compared to compost prepared by conventional compost method (160.9 and 1064.1 g PNP g-1
dry compost ha-1) for the same materials.
Table 3: Enzyme activities of compost prepared from different materials
Treatment Cellulose
(µg glucose g-1 dry compost hr-1)
Urease (µg glucose g-1 dry compost hr-1)
Alkaline phosphatase (µg PNP g-1 dry compost hr-1)
Acid phosphatase (µg PNP g-1 dry compost hr-1)
Without earthworm
Legume residue
1064.4 437.7 2043.0 1006.3
Leaf litter 598.1 553.2 1327.2 1288.5
Wheat straw 1134.1 619.2 1456.8 897.5
With earthworm
Legume residue
1249.7 528.9 3231.8 1705.0
Leaf litter 1156.5 592.8 2084.5 2740.3
Wheat straw 1274.6 843.3 2304.3 1394.3
CD ( P=0.0)
Substrate (S) NS 73.9 449.1 323.1
Earthworm (E) NS 104.5 NS 456.9
Zahariah and Chhonkar (2004)
261

Winter School on “Waste recycling and resource management”-Dec. 3-23, 2014
Table 4: Nutrient status of vermicompost and its substrates (Lantana, congress grass and
cow dung)
Nutrient Substrates Vermicompost
Lantana
Congress grass
Cow dung VCI VC2 FYM
C (%) 47.56 44.08 42 42.48 41.32 36
N (%) 2.52 2.04 0.70 2.94 2.38 1.40
P0O5 0.37 0.33 0.45 0.51 0.42 1.41
K2O (%) 1.92 1.60 0.65 0.80 0.72 0.40
Mn (mg kg-1) 18 8 20 33 28 22
Fe (mg kg-1) 830 630 2080 8010 7040 7370
Cu (mg kg-1) 67 47 54 80 72 44
Zn (mg kg-1) 6.2 3.3 14.2 15.0 11.3 10.5
C:N 18.9:1 21.6:1 60:1 14.5:1 17.4:1 25.7:1
C:P 128.5:1 133.6:1 93.3:1 84.3:1 98.4:1
Sharma et al (2004).VC1 – Lantana vermicompost VC 2 – Congress grass vermicompost
Cunha Queda (1999) has characterized the enzymatic profiles during several composting
trials. Biochemical parameters like enzyme activity and microbial biomass C are optimum
indicators of biological activity in various natural ecosystems. The enzymatic activity can be a
pat of a reliable measure of compost maturity and stability. When materials of varying C: N
ratios were composted with and without earthworms both urease and phsphatase activity of the
compost increased significantly due to earthworm activity while, there was no significant
increase in microbial biomass and cellulose activity. The higher humic acid content in the
compost also implies the good quality and maturity of the compost. Earthworms are important
262

Winter School on “Waste recycling and resource management”-Dec. 3-23, 2014
natural bioreactor, they can accumulate and transfer into beneficial organic manures, rich in
minerals, enzymes activities.
Table 5: Enzyme activities of five different composts
Enzyme activities Compost
C1 C2 C3 C4 C5
Protease (mmole tyrosine g-1 dw 2h-1) 10.80a 5.56b 20.26c 15.15d 113.12e
Lipase (C10)(mmole p-nitrophenol g-1 dw 2h-1)
21.47a 60.63b 28.09c 41.81d 163.68e
Total cellulose (mmole glucose g-1 dw 2h-1)
19.02a 40.72b 45.66b 19.80a 94.44c
Cunha Queda et al (1999)
References:
Bremner J M and Tabatabai MA (1969). Use of nitrophenyl for assay of soil phosphatase activity, Soil Biology and Biochemistry, 1: 301-307.
Casida LE, Klein DA and Santoro T (1964). Soil dehydrogenase activity. Soil Science 98: 371-376.
Cunha Queda, AC., Almetda Duarte E., Compos, L, Bruno De Sousa, R. (2000). Composting of horse manure enriched with paperboard residues: study of physico-chemical and biochemical parameters during the composting process. In: Warman PR, Taylor BR (eds). Proceedings of the International Composting Symposium (ICS, 99), Halifax (Canada), 1, pp. 110-123.
Forster JC, Zech W and Wiirdinger E (1993). Comparison of chemical and microbiological methods for the characterization of the maturity of composts from contrasting sources. Biology & Fertility of Soils 16: 433-466.
Karthikeyn, S. (2000) Compost maturity indices. In: Short Course on Vermiculture and Vermicomposting Technology, Tamil Nadu Agricultural University, Coimbatore, 98
Schinner, F. and Merri, Von. W. (1990). Xylanase, CM-cellulase and invertase activity in soil:
an Improved method. Soil Biology and Biochemistry. 22: 511-515.
Singh AB and Ganguly TK (2004). Quality comparison of various composts. Indian Society of Soil Science, Vol 53(3): 352-355
263

Winter School on “Waste recycling and resource management”-Dec. 3-23, 2014
Singh AB, Manna, MC, Tripathi AK and Ganguly TK (2005). Vermicomposting: A technology for organic waste recycling. IISS Bulletin No 1/2005 pp 1-11.
Sharma, Vivek, Kanwar Kamla and Dev, S.P (2004). Efficient recycling of obnoxious weed plants (Partheniumcamara L.) and Congress grass (Parthenium hysterophorus L.) as organic manure through vermicomposting. Journal of the Indian Society of Soil Science 52, 112-114.
Zachariah, A.S and Chhonkar, P.K (2004). Biochemical properties of compost as influenced by earthworms and feeding materials. Indian Society of Soil Science. Vol. 52 (2): 155-159.
264

Winter School on “Waste recycling and resource management”-Dec. 3-23, 2014
Commercial Production of Vermicompost
M.C. Manna, A.B. Singh and A.K. Tripathi
Indian Institute of Soil Science, Nabi Bagh, Berasia Road, Bhopal
Vermicompost is primarily the excreta of earthworms. The collection of vermicasts along
with microbially degraded organic matter is called vermicompost. The term "vermicomposting"
refer to the use of earthworms as the living medium for digesting and decomposing organic
residues to produce a compost. Earthworms can consume practically all kinds of organic matter
and can eat as much as their own body weight per day. Every kg of earthworms feed on 5 kg of
waste with 50 to 60% moisture per day. In this way, with the help of earthworms, composting
can be carried out with minimum cattle-dung. The excreta “casting" of earthworms are rich in
nutrients (N, P, K and Mg) and also in bacterial and actinomycetes population.
The methodology for the preparation of vermicompost is described below from selection
of the earthworms to production of vermicompost and saving the worms from predators.
Selection of Suitable Earthworm Species
Out of 3,000 species of earthworms, only a few are known to be used for earthworms for
vermicomposting. These are (i) Eisenia foetida (ii) Eudrilus eugeniae and (iii) Perionyx
excavatus. The first two are exotic and the third one is indigenous to India. These species are
most suited because these are prolific breeders with high multiplication rate, have short life
cycles with less mortality and are voracious feeders which excrete high quality vermicasts. They
are easy to handle, have lifespan of 1 to 1.5 years, are sturdy and survive very well throughout
the year under varying weather conditions. Such species are easily available and economically
feasible for vermicomposting. Earthworms are also raised and sold to vermicompost producers,
reportedly at around Rs 500/kg.
The biomass production by exotic earthworms like Eudrilus eugeniae and Eisenia foetida
may increase 40 to 90 folds in a period of 3-6 months with adequate space and food. For
example, a tank of 60 x 45 x 60 cm can hold of 1,000 to 1,500 adult Eudrilus eugeniae, and
3,000-5,000 Eisenia foetida or Perionyx Excavatus. Their growth rate and reproduction is
controlled by their population density. In case of Eudrilus eugeniae, earthworms remain small in
size and produce less number of cocoons when they are crowded. In comparison, Perionyx
265

Winter School on “Waste recycling and resource management”-Dec. 3-23, 2014
excavatus and Eisenia foetida can withstand the population pressure (density pressure) but
Eudrilus eugeniae cannot. Thus, frequent harvesting of earthworms is essential to bring down
population pressure. Addition of wheat bran, gram husk or gram powder and even neem cake
stimulates the reproductive potential of Eudrilus eugeniae.
Suitable Conditions for Vermicomposting
Any well decomposed food of any organic waste in adequate quantity having C:N ratio of
20- 40 can form feed for earthworms. If the C:N ratio of the waste is less than 20, it can be used
directly as manure.
Suitable location and protection from light: Earthworms are nocturnal and are hence more
active during night. They are injured and may be killed by exposure to light and are specially
affected by ultra-violet wavelength. It is therefore advisable to provide shade to the
vermicomposting structures as earthworms are photo-negative. Earthworm multiplication
should be carried out under shade. Earthworms can be multiplied very well in pits or raised beds
or on 2' high heaps filled with ready food (decomposed or partially decomposed organic waste).
Adequate moisture: Water is one of the most important requirements. Earthworms contain 85%
water in their body and hence water constitutes the basic need. Respiration occurs through the
body wall, so it is kept moist. Thus, more than 35% water must be present in the earthworm feed
for proper growth. They constantly release mucus through the dorsal pores to keep the body wet.
Therefore it is essential to maintain 60% moisture in the medium (one must feel the wetness in
the material). Excess moisture or water stagnation creates anaerobic conditions in the medium
and thus deters the growth of earthworms and also the quality of compost.
Suitable temperature: The temperature of earthworm feed should be between 20°C to 35°C.
Temperature > 45° C results into dessication of their body and moisture stress while their activity
stops below freezing point (0°C).
Suitable pH: For effective multiplication of earthworms, pH of the feeding material should be at
neutral level i.e. 7.0. The earthworm population is adversely affected if the pH is below 4 or
above 9. Normally a pH of 6.0 to 8.5 in the feed mix is most suitable. Outside these extremes,
there may be slight reduction in food consumption and compost production. To get an ideal pH,
it is essential to use green matter along with dry biomass and also regulate the moisture in the
medium.
266
Winter School on “Waste recycling and resource management”-Dec. 3-23, 2014
Preparation of Vermicompost:Compost pit of any convenient dimension can be dug in the backyard or garden or in a field. The most convenient and easily manageable pit size is 6′ x 3′ x 1.5′ (LxWxH). A tank may be constructed with brick and mortar with proper water outlets. Alternatively, or a plastic crate 60 cm x 30 cm x 30 cm with holes drilled at the bottom or empty wooden crates (drilled wood boxes) or well rings of 75 cm diameter and 30 -45 cm height can also be used with slight modification in the thickness of layers used. Preparation of organic biomass for earthworms feeding: Earthworms cannot function well at resist temperature beyond 35°C. Any biomass, dry or green, generates heat during and as result the temperature of the heap increases beyond 40°-50°C. Therefore, it is very essential to predigest the organic biomass before it is used as a vermin feed. It can be digested in heaps, pits or tanks. It is preferable to decompose organic biomass by using bio dung technique. After 30 days when organic biomass is partially digested after two turnings and its temperature comes down to 25 - 30°C, it can be used as feed for vermicomposting. Similarly, fresh cattle-dung cannot be used for vermicomposting as the generation of ammonia and high temperature of the cattle-dung heap can kill the earthworms. Thus, cattle-dung heap of 10′ x 5′ x 5′ may be prepared in shade and about 50 - 60% moisture maintained in it for about 30 days. This heap also should be turned at least twice 15-day intervals. After 30-40 days when the temperature of the heap is reduced to 25-30°C, this predigested or partially digested cattle dung should be transferred to vermibed as feed for the worms. Preparation of vermibed and introduction of earthworms:Shade (either tree shade or artificial tin shade) is a must for vermicomposting. Vermibed of the size 10′ x 3′ x 1.5′ can be prepared under shade. The breadth of a bed should not exceed 4′ and depth or height should not exceed 1.5′ and to avoid compaction and heat generation from the organic matter. The bottom layer of vermibed should be loosely lined with brick pieces, pebbles or twigs to facilitate aeration and avoid compaction. At the bottom layer, dry and hard agricultural biomass can be placed. To save the earthworms from red ants, lining of wood or charcoal ash also can be given over vermibeds. Similarly covering the bed with neem leaves or other dry biomass like wheat straw, paddy straw or dry grass also can help in protecting worms from red ants. This basal layer provides the housing for earthworms. After this, approximately 9"-12" thick layer of partially decomposed biomass is made over the basal vermibed layer. No chemicals should be sprayed over the compost pit.
Water is sprinkled over this layer to maintain moisture. 2000 earthworms are inoculated in one bed. In a vermibed single/mixture of varieties can be used for vermicomposting. Earthworms, when released into the vermibed or tanks containing half decomposed organic biomass enter into it and feed on the material, layer after layer and release their excreta on the surface. As most of the material at the top is converted into their cast, earthworms keep moving downwards. Harvesting of vermicompost: As soon as vermicasts are collected on the top layer of vermibed, regular watering should be stopped. Due to loss of moisture from the surface and lack of feeding material earthworms will move downward. After 2-3 days, small heaps of compost are prepared on the vermibed and kept open. This facilitates earthworms to move downwards. The process of vermicomposting takes 40-45 days. Use of different materials like green biomass, fibrous material, dry leaf litter and animal dung in combination results in the recovery of good quality of compost. In the end, compost recovery will be around 50 to 60% of the original material both by weight and volume.
267
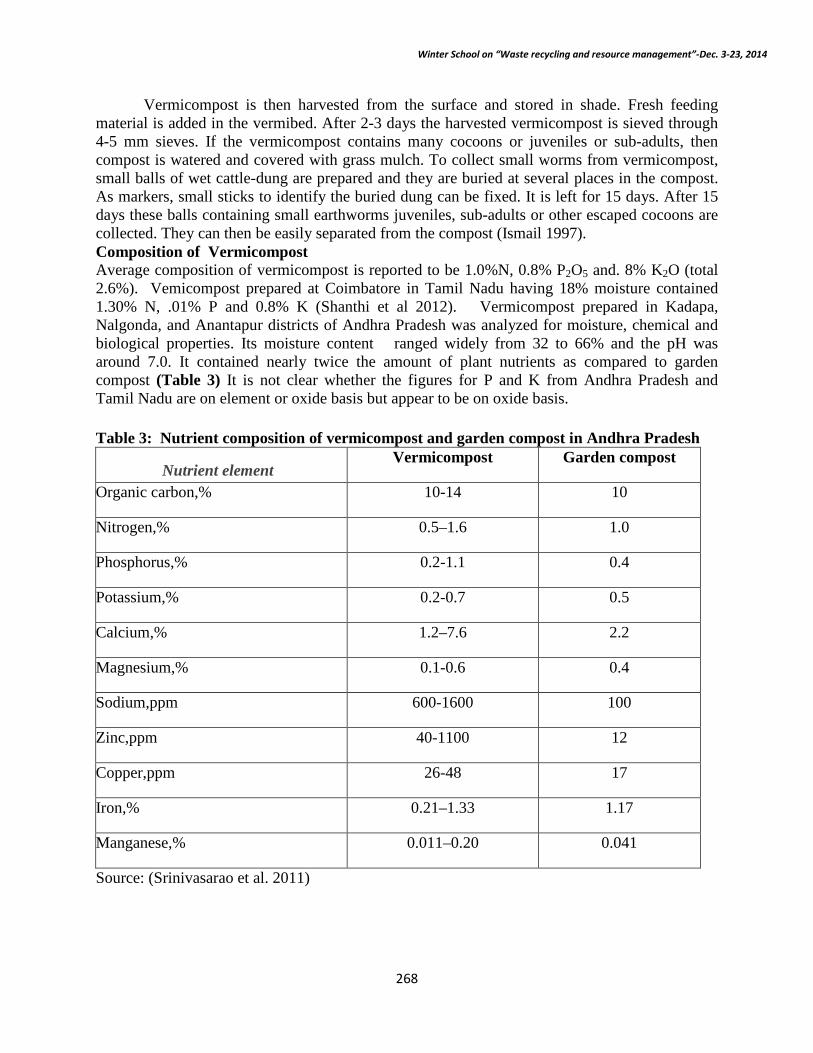
Winter School on “Waste recycling and resource management”-Dec. 3-23, 2014
Vermicompost is then harvested from the surface and stored in shade. Fresh feeding
material is added in the vermibed. After 2-3 days the harvested vermicompost is sieved through 4-5 mm sieves. If the vermicompost contains many cocoons or juveniles or sub-adults, then compost is watered and covered with grass mulch. To collect small worms from vermicompost, small balls of wet cattle-dung are prepared and they are buried at several places in the compost. As markers, small sticks to identify the buried dung can be fixed. It is left for 15 days. After 15 days these balls containing small earthworms juveniles, sub-adults or other escaped cocoons are collected. They can then be easily separated from the compost (Ismail 1997). Composition of Vermicompost Average composition of vermicompost is reported to be 1.0%N, 0.8% P2O5 and. 8% K2O (total 2.6%). Vemicompost prepared at Coimbatore in Tamil Nadu having 18% moisture contained 1.30% N, .01% P and 0.8% K (Shanthi et al 2012). Vermicompost prepared in Kadapa, Nalgonda, and Anantapur districts of Andhra Pradesh was analyzed for moisture, chemical and biological properties. Its moisture content ranged widely from 32 to 66% and the pH was around 7.0. It contained nearly twice the amount of plant nutrients as compared to garden compost (Table 3) It is not clear whether the figures for P and K from Andhra Pradesh and Tamil Nadu are on element or oxide basis but appear to be on oxide basis. Table 3: Nutrient composition of vermicompost and garden compost in Andhra Pradesh
Nutrient element Vermicompost Garden compost
Organic carbon,% 10-14 10
Nitrogen,% 0.5–1.6 1.0
Phosphorus,% 0.2-1.1 0.4
Potassium,% 0.2-0.7 0.5
Calcium,% 1.2–7.6 2.2
Magnesium,% 0.1-0.6 0.4
Sodium,ppm 600-1600 100
Zinc,ppm 40-1100 12
Copper,ppm 26-48 17
Iron,% 0.21–1.33 1.17
Manganese,% 0.011–0.20 0.041
Source: (Srinivasarao et al. 2011)
268
Winter School on “Waste recycling and resource management”-Dec. 3-23, 2014
Microbial Biodiversity: Present and Future of Soil Health
Asit Mandal
Indian Institute of Soil Science, Bhopal
Microbial diversity is dynamically changing over the years and still recent years it is very difficult to determine the composition of microbial communities in soil. The agricultural management practices and carbon inputs are the key factors for the alteration of microbial diversity. To sustain the agricultural productivity through maintaining living component of soil needs a greater attention. To manage and maintain soil in a sustainable fashion, the definition of soil health must be broad enough to encompass the many functions of soil, e.g. environmental filter, plant growth and water regulation (Doran and Safley, 1997). Microbial diversity and soil ecosystem are least explored among the natural ecosystem that requires a better understanding of relation between the microbial diversity and soil functions. Poor soil health is dictates by the loss of soil organic carbon, extractive farming practices, less use of organics and imbalanced fertilization which stands a little crop yield and more poverty. Global warming will further exacerbate the problem of food insecurity. At present agriculture soil health seeks greater attention for better crop and soil nutrient management systems in a long-run as per as soil sustainability is concern. Based on different studies, it is suggested that measurement of four parameters, viz. particulate organic matter, soil respiration, microbial biomass carbon and N-mineralization would be adequate to give a complete picture of soil biological health (Rao and Manna, 2005; Rao 2007). However, there is a need to undertake systematic studies on soil microbial diversity for assessing soil health. Sustaining soil health is the most effective method for ensuring sufficient food to support life. The nation’s soil health directly affects its national security and freedom of its people. With the development in agricultural sciences, plant nutrients were identified as an essential component of soil health, with respect to sustaining biological productivity. This resulted in a new paradigm of plant nutrition and soil health management that relied heavily on the use of chemical fertilizers and intensive tillage. Increasing concern over agriculture’s impact on the environment has created renewed interest in soil health. The biological indicators for soil health are very sensitive and it gives warning signals for any kind of disputs in soil health. As there are several soil processes taking place simultaneously, a single compound microbial parameter for assessing soil health would always be a potentially exciting goal and challenge so that scientists can use it in a practical way for advisory purpose on soil health similar to soil testing for soil fertility. Soil Health Soil health can be defined as the continued capacity of soil to function as a vital living system, within ecosystem and land–use boundaries, to sustain biological productivity, promote the quality of air and water environments and maintain plant, animal and human health (Doran et al., 1996). Goswami and Rattan (1992) defined soil health, “as being a state of dynamic equilibrium between flora and fauna and their surrounding soil environment in which all the metabolic activities of the former proceed optimally without any hindrance, stress or impedance from the
269

Winter School on “Waste recycling and resource management”-Dec. 3-23, 2014
latter. They further stated that in absolute terms a healthy soil is indefinable, rather impaired functioning of the soil is easily observable and detectable as constraints. Characterization of soil health by farmers focuses on descriptive/ qualitative properties of soil with a direct value judgment (unhealthy to healthy) integrated into the options for a given property. Concept of soil health is not at all different and separate from the aims and goals of society. Modern agriculture cannot be sustainable unless agriculturists identify and adhere to asset of thresholds beyond which the capacity of soils to function as a biomass producer is impaired. The majority of the contributors found it difficult to identify the critical threshold values that would allow maximum production while minimizing any deterioration in soil health. Therefore the challenge ahead is to understand how microbial activity is influencing soil health and in turn how biodiversity management needs to be modified due to changes in soil health. The sustenance of soil health depends on an understanding of how soils respond to agricultural use and practices over time. In order to develop best management practices, it is necessary to develop method to assess the soil health over a period of time. There is a great need both to determine the status of soil health and to enhance our soil resources. Assessment and monitoring of soil health must also provide opportunity to evaluate and redesign soil and land management systems for sustainability. Standards of soil health are needed to determine what is sustainable and what is not and to determine if soil management systems are functioning at acceptable levels of performance. The aims of sustainable agriculture is to develop farming system that are productive and profitable, conserve the natural base, protect environment and enhance health and safety of natural resource and environment in long-term perspective. Soil organisms The perception that soil is living results from the observation, that number of living organisms in a fertile soil (10 g) can exceed nine billion, about one and one-half times of the human population of the earth. Soils is formed slowly (averaging 100–400 years per centimeter of topsoil) through the interaction of climate, topography and a myriad of living organisms (earthworms, insect, bacteria, fungi, algae, nematodes, animals, plants, human etc.). Thus, the physico-chemical attributes of soil regulates biological activity and interchanges of molecules/ions between the solid, liquid and gaseous phases, which influence nutrient cycling, plant growth; and recycle of organic waste. A little is known about soil biodiversity compared to other environments, even though terrestrial ecosystems cannot function without it. More than 90% of the planet’s genetic biodiversity is resident in soils but less than 1% of the microorganisms have been cultured and studied. To maintain the soil ecosystem of the future microbial communities play a key role (Rao, 2006). A greater understanding of the functional bridges between the physics and biology of soils will be required. Environmental genomics will be crucial in exploring microbial diversity and its functional significance. Complex interactions between plants and consortia of microbes would extend beyond those resisting pathogens and scavenging nutrients and would help improve drought resistance and salt tolerance of plants and have other growth-promoting activities. Soil biodiversity also embraces an immense ecological diversity of the soil biota manifested through behavioral patterns and feeding or habitat preferences. The combination of all these aspects is expressed in the functional diversity of soil organisms. The number of species
270

Winter School on “Waste recycling and resource management”-Dec. 3-23, 2014
(taxonomic diversity) clearly encompasses an important part of an ecosystem’s diversity and this is controlled by the genetic diversity, which can be greater than the number of recognized species. Several species have the same functions, resulting in what might is known as functional redundancy. Equally, some species may interact to perform functions not possible by any single species. Biodiversity is therefore the interaction of all these elements. A better comprehension is required to correlate the soil health with soil microbial biodiversity, its ecological significance and innovative techniques to measure soil health. Causes of Poor Soil Health The major reasons for poor soil health are: • Wide gap between nutrient demand and supply • Imbalanced use of chemical fertilizer • Deficiency of secondary and micronutrients: • Use of organic inputs • Acidification and Al3+ toxicity • Insufficient Development of salinity and alkalinity: • Development of heavy metal toxicity • Disproportionate growth of microbial population • Natural and man-made disturbances How Soil Physical Condition affects Biological Properties of Soil Changed soil conditions can have positive or negative influences on growth of organisms, depending on the organism being investigated, as well as on the frequency, type and severity of disturbance. Based on Huston’s Dynamic Equilibrium Model, it is expected that: (i) In soil with a highly active community, maximum diversity of organisms is occurred when there are relatively frequent or major disturbances. (ii) In soil with a moderately active community, maximum diversity of organisms is expected to occur when disturbances are of intermediate frequency or moderate intensity. (iii) In soil with a low level of activity of organisms, maximum diversity is expected to occur when there is a low frequency or low intensity of disturbance. The following is a series of examples of how different types of soil disturbance could change the activities of soil organisms. The examples are grouped according to: Natural Disturbances to the Soil Organisms Natural events that disturb the habitat of soil organisms includes Wind and water erosion, Slow drainage, Flood, Tree-fall, Digging by small animals, Natural fire,. Drought and seasonally dry periods, Freezing and thawing, and Succession in plant communities
271

Winter School on “Waste recycling and resource management”-Dec. 3-23, 2014
Disturbances of Soil Organisms Caused by Land Management The following disturbances are examples of changes imposed by land management. These changes alter the soil in ways that alter the habitat of soil organisms.
• Cultivation • Soil disturbance • Disturbances to Soil Caused by Disposal of Wastes and Industrial Activities
Soil Organic Matter and Its Significance in Influencing Soil Health Soil organic matter is an important attribute of soil health. It influences soil physical, chemical and biological properties and processes. It regulates energy and nutrients for soil biota, aggregate stability, water retention, hydraulic properties, resistance or resilience to compaction, buffering capacity, cation exchange capacity, and formation of soluble and insoluble complexes with metals. The most important biological properties of organic matter are: (i) its role as a reservoir of metabolic energy for soil microbial and faunal activities, (ii) its effects in stabilizing enzyme activities and (iii) its values as a source of plant nutrition through mineralization. Soil organic matter attributes (microbial biomass C and N) are very sensitive to changes in total soil organic matter and could be utilized, based on their relative simple and straightforward methodology, as indicators of change. More recently, a greater range of labile soil organic matter attributes such as light fraction of organic matter, particulate organic matter (POM, <53 µm), water soluble carbon, acid hydrolysable carbohydrates and potentially mineralizable fraction of carbon are more sensitive to changes in management. Little attention has been paid towards labile pools of carbon as compared to total organic carbon in most agricultural soils. Typically, organic matter levels decline rapidly when soil under native vegetation is converted to arable agriculture in the first 10-20 years and then stabilize at a new equilibrium level. Many factors contribute to loss of SOM levels such as lower allocation of carbon to the soil, removal or burning of crop residue, tillage induced aggregates disruption, more favorable condition for decomposition and greater losses of surface soil by water erosion. Factors that increase organic matter under arable agriculture include a decreasing proportion of fallow in rotation, an increase in the proportion of cereal as compared to root crops, an increasing proportion of perennial crops in rotation, return of crop residue rather than burying or removal, improve root biomass and crop growth with better fertilizer and irrigation conditions, and addition of organic manure or other organic wastes. Similarly, perturbations to the soil system such as conversion of native vegetation to arable agriculture cause large changes in SOM content in soil. These are reflected in labile and stabilize SOM fractions in soil. In addition labile fraction has a disproportionately large effect on nutrient supplying capacity and structural stability of soil. In agricultural soil, the light fraction typically contain 20–30% C and 5–20% N and 22–18% of total C (TOC) and 1–16% of total N (TN) in the whole soil. Particulate organic matter contains 20–45% of TOC and 13–40% of TN in the whole soil. Particulate organic carbon is the precursor for formation of soil microbial biomass carbon, soluble fraction of carbon, humic and non-humic fraction of carbon in soil and thus it is a key attribute of soil quality. It is the major source of cellular C and energy for the heterotrophic microorganisms. The POM accumulation is also the major pathway by which
272
Winter School on “Waste recycling and resource management”-Dec. 3-23, 2014
nutrients are recycled from crop residues back to the soil and release nutrients by mineralization during decomposition of POM. The large POM maintains soil structure and macro- aggregation. The large amount of microbial community associated with the decomposing POM produces binding agent such as exo-cellular mucilaginous polysaccharides. It acts as a major food and energy for endogenic soil fauna. Thus, POM is associated with a multitude of soil process and functions and is therefore, a key attribute of soil quality. Acid hydrolysable carbohydrates (AHC) (32–37% of TOC) is a labile C fraction and has been found more rapidly in response to changes in management than TOC contents. The KMnO4–oxidizable C fraction accounts for 5–30% of organic C. This oxidizable fraction usually is more sensitive to soil management than TOC. Simple measurement of soil aggregate stability, POM, light fraction of carbon, acid hydrolysable carbohydrates have been evaluated on their sensitivity to change in different soils and crop management systems. The presence of soil organic matter significantly influences heterotrophic soil organisms. Based on Huston’s model, an interaction between disturbance frequency or intensity and the rate of growth of organisms in soil would be closely linked with the amount and kind of organic matter. The diversity of organisms is expected to be high in a soil containing large amounts of different kinds of organic matter, but only if there is also a high level of disturbance. Low levels of disturbance of the same soil would have a lower diversity of organisms. In contrast, a soil with low levels of organic matter would be expected to have greater diversity if it was disturbed frequently. It is more difficult to measure soil organism diversity than plant diversity. Also, in soil, organisms can be present at low numbers and may not be active because of unfavourable conditions. Thus organisms in low abundance are only likely to appear in an assessment of soil biodiversity when soil conditions are changed. While the application of the Dynamic Equilibrium Model is complex for soil organisms and needs more experimental testing, the following general hypotheses are proposed: • For soils with high levels of organic matter at low levels of disturbance: some organisms become dominant. At high levels of disturbance: more even growth of a range of organisms is possible because the disturbance prevents the fast-growing organisms from out-competing the slow-growing organisms. • For soils with low levels of organic matter at low levels of disturbance: growth of organisms on organic matter is restricted by low quantities of organic matter and maximum diversity occurs because there is insufficient resource to allow fast-growing organisms to grow rapidly. • Soils with high levels of disturbance: the organic resource becomes further depleted by conditions that favour mineralization and most organisms become inactive. Organic Farming vis-à-vis Soil Biodiversity Improvement Scientific research has demonstrated that organic agriculture significantly increases the density and species of soil’s life. Suitable conditions for soil fauna and flora as well as soil forming and conditioning and nutrient cycling are encouraged by organic practices such as: manipulation of crop rotations and strip-cropping; green manuring and organic fertilization (animal manure, compost, crop residues); minimum tillage; and of course, avoidance of pesticides and herbicides
273

Winter School on “Waste recycling and resource management”-Dec. 3-23, 2014
use. Benefits of organic management on soil biological activity are summarized below: (a) Abundant arthropods and earthworms: Organic management increases the abundance and species richness of beneficial arthropods living above ground and earthworms, and thus improves the growth conditions of crops. More abundant predators help to control harmful organisms (pests). In organic systems the density and abundance of arthropods, as compared to conventional systems, has up to 100% more carabids, 60–70% more staphylinids and 70–120% more spiders. This difference is explained by prey deficiency due to pesticide influence as well as by a richer weed flora in the standing crop that is less dense than in conventional plots. In the presence of field margins and hedges, beneficial arthropods are further enhanced, as these habitats are essential for over-wintering and hibernation. The biomass of earthworms in organic systems is 30–40% higher than in conventional systems, their density even 50–80% higher. Compared to the mineral fertilizer system, this difference is even more pronounced. (b) High occurrence of symbionts: Organic crops profit from root symbioses and are better able to exploit the soil. On average, mycorrhizal colonization of roots is highest in crops of unfertilized systems, followed by organic systems. Conventional crops have colonization levels that are 30% lower. The most intense mycorrhizal root colonization is found in grass-clover, followed by the vetch rye intercrop. Roots of winter wheat are scarcely colonized. Even when all soils are inoculated with active micorrhizae, colonization is enhanced in organic soil. This indicates that, even at an inoculum in surplus, soil nutrients at elevated levels and plant protection suppress symbiosis. This underlines the importance of appropriate living conditions for specific organisms. (c) High occurrence of micro- organisms: Earthworms work hand in hand with fungi, bacteria, and numerous other microorganisms in soil. In organically managed soils, the activity of these organisms is higher. Micro-organisms in organic soils not only mineralize more actively, but also contribute to the buildup of stable soil organic matter (there is less untouched straw material in organic than in conventional soils). Thus, nutrients are recycled faster and soil structure is improved. The amount of microbial biomass and decomposition is connected: at high microbial biomass levels, little light fraction material remains undecomposed and vice versa. (d) Microbial carbon: The total mass of micro-organisms in organic systems is 20–40% higher than in the conventional system with manure and 60–85% than in the conventional system without manure. The ratio of microbial carbon to total soil organic carbon is higher in organic system as compared to conventional systems. The difference is significant at 60 cm depth (at 80 cm depth, no difference is observed). Organic management promotes microbial carbon (and thus, soil carbon sequestration potential). (e) Enzymes: Microbes have activities with important functions in the soil system: soil enzymes indicate these functions. The total activity of micro-organisms can be estimated by measuring the activity of a living cell-associated enzyme such as dehydrogenase. This enzyme plays a major role in the respiratory pathway. Proteases in soil, where most organic N is protein, cleave protein compounds. Phosphatases cleave organic phosphorus compounds and thus provide a link
274

Winter School on “Waste recycling and resource management”-Dec. 3-23, 2014
between the plant and the stock of organic phosphorus in the soil. Enzyme activity in organic soils is markedly higher than in conventional soils. Microbial biomass and enzyme activities are closely related to soil acidity and soil organic matter content. (f) Wild flora: Large organic fields (over 15 ha) featured flora six times more abundant than conventional fields, including endangered varieties. In organic grassland, the average number of herb species was found to be 25 percent more than in conventional grassland, including some species in decline. Vegetation structure and plant communities in organic grassland are more even and more typical for a specific site than in conventionally managed systems. In particular, field margin strips of organic farms and semi-natural habitats conserve weed species listed as endangered or at risk of extinction. Animal grazing behaviour or routing activity (e.g. pigs) was found important in enhancing plant species composition. Weeds (often sown in strips in organic orchards to reduce the incidence of aphids) influence the diversity and abundance of arthropods and flowering weeds are particularly beneficial to pollinators and parasitoids. (g) High-energy efficiency: Organic agriculture follows the ecosystem theory of closed (or semi-closed) nutrient cycle on the farm. Organic land management allows the development of a relatively rich weed-flora as compared to conventional systems. Some “accompanying plants” of a crop are desired and considered useful in organic management. The presence of versatile flora attracts beneficial herbivores and other air-borne or above-ground organisms. Their presence improves the nourishment of predatory arthropods. When comparing diversity and the demand of energy for microbial maintenance (as indicated by the metabolic quotient), it becomes evident that diverse populations need less energy per unit biomass. A diverse microbial population, as present in the organic field plots, may divert a greater part of the available carbon to microbial growth rather than maintenance. In agricultural practice this may be interpreted as an increased turnover of organic matter with a faster mineralization and delivery of plant nutrients. Finally, more organic matter is diverted to build-up stable soil humus. (h) Erosion control: Organic soil management improves soil structure by increasing soil activity and thus, reduces erosion risk. Organic matter has a positive effect on the development and stability of soil structure. Silty and loamy soils profit from organic matter by an enhanced aggregate structure. Organic matter is adsorbed to the charged surfaces of clay minerals. The negative charge decreases with increasing particle size. Silt is very susceptible to erosion since it is not charged, but organic matter layers on the silt surface favor aggregates with silt too. Soil Microbial Diversity in relation to soil and crop management in India Measurement of the level of soil biodiversity is having great significance; greater species diversity indicates a healthy environment. A large, diverse, and active population of soil organisms is thus the most key indicator of a healthy soil. The effects of chemical and physical degradation of soils are quite obvious. But the effects of biological degradation which is caused due to loss of specific soil organic carbon fractions and consequently the loss of microbial communities dependent on them for nutrition as well as and specific toxicity influences on soil flora and fauna are insidious. The loss of the diversity is difficult to measure and even more difficult to link with loss of specific soil functions. This is because there is a lot of functional
275

Winter School on “Waste recycling and resource management”-Dec. 3-23, 2014
redundancy for most of the soil biological processes. The soil management practices of different soils of India have great influences on soil organic carbon which is a key factor for quantifying soil biological processes. In case of fertilizer and organics, in long-term fertilizer experiment it was found that NPK + FYM was better over the only NPK in all soils in improving the organic carbon, physical properties (bulk density, size of soil aggregate), microbial biomass and dehydrogenase activity (Singh 2010). The contribution of organic C, microbial biomass, dehydrogenase activity and physical properties to soil quality index (SQI) was roughly 70% in the Inceptisol at Coimbatore and 95% in the Alfisol of Palampur in the fertiliser+FYM treatment. In the long term experiment with rice-wheat-jute system in an Inceptisol at Barrackpore in West Bengal, NPK + FYM or NPK alone improved soil quality in comparison to fallow (Chaudhury et al. 2005). Long-term application of NPK and NPK+FYM maintained or improved SOC content over initial (Manna et al., 2006, 2007). Further they reported that active fractions of SOC viz., particulate organic carbon, water-soluble carbon and hydrolysable carbohydrates, soil microbial biomass C and N, dehydrogenase and alkaline phosphatase activity, improved significantly with the application of NPK and NPK+FYM (Table 1). The biological activity of soil is the reservoir of plant nutrients, especially N and P, because of the large amount of soil microbial biomass in soil and also because of more labile component of soil organic matter fractions (soluble phase of carbon and carbohydrates) than most other fractions (passive pool of carbon). Thus, best way to characterize biological health of the soil and inherent fluxes at which the soil microbial biomass would transmit the organic and inorganic growth stimulants, including the nutrients to the growing crops. Table 1. Long-term effect of manure and fertilizer application on active and slow fractions of soil organic carbon under Inceptisol (Rice-Wheat-Jute, R-W-J), and Vertisol (Sorghum-Wheat, S-W) at 0-15 cm soil depth
In integrated nutrient management (INM) is the balanced way of fertilizer management by fertilizers, organics and biofertilisers in a balanced way, Though balanced nutrition through fertilizers alone may enhance crop productivity by improving chemical stability but agricultural systems may be unustainable because of less than optimum SOM content, soil physical environment and soil biological condition. Lack of sustainability must show up in the form of aggravation of early warning indicators such as soil enzymes. Results from an on-farm
Location Treatments SMBC (mg kg-1)
SMBN (mg kg-1)
AHC (mg kg-1)
SOC (mg kg-1)
%POM in SOC
Inceptisol (R-W- J)
Control 169 11.4 526 5.4 10.6 N 162 10.7 580 5.7 16.5 NP 209 11.0 609 6.3 22.4 NPK 327 15.2 689 7.4 20.0 NPK + FYM 486 20.2 845 7.9 27.0
Vertisol (S- W)
Control 201 8.6 462 3.5 10.3 N 220 10.2 590 3.4 23.3 NP 244 12.3 620 3.9 26.7 NPK 382 13.3 725 4.2 30.1 NPK + FYM 465 16.4 840 4.5 39.7
276

Winter School on “Waste recycling and resource management”-Dec. 3-23, 2014
experiment with soybean-wheat rotation in a farmer field in a Vertisol near Bhopal, Madhya Pradesh showed that organic carbon, bacterial and fungal counts and activity of soil enzymes during wheat growth increased just after two years and were higher in organic and INM than with fertilizers only but were not yet statistically significant, as it was still an early stage (Rao DLN 2007, unpublished, Table 2). However, the improvement trends were unmistakable and become significantly positive. Table 2: Microbial populations and soil enzymes in a Vertisol in various nutrient management options in soybean-wheat rotation
1Cellulase = µM glucose/g soil/24h; 2Urease = µM NH4-N g-1 soil h-1; 3acid, 4alkaline phosphatase and 5aryl sulphatase = µg p-nitrophenol g-1 soil h-1 In organic farming practice, the heterotrophic organisms are utilizing the organic materials as both carbon and energy sources, and higher microbial populations have been measured by a number of workers in organically managed soils. As a generalization, organically managed soils maintain higher biodiversity and have been shown to have lesser incidence of soil borne diseases compared to conventional farming. Higher incidence of mycorrhiza in organically managed soils has also been known since long. Average density of carabids, staphylinids and spiders in the organic plots was almost twice that in conventional plots and their beneficial role in biological control is known (Mader et al 2002). Greater amount of readily-extractable ATP, increased numbers of viable but nonculturable bacteria, total and vital fungal bio-volumes in soil in organically managed soils pointed to greater physiological diversity of microorganisms in such soils. Microbial Biodiversity and Soil Resilience A perhaps more profound outcome of a soil that functions as a living community would be the degree of resilience and stability that develops over time. In India, the paucity of information is available on soil tillage and soil biological activity interaction. A decrease of tillage intensity, resulted in a greater production of soil microbial biomass this may indicated that the organic matter is increasing soil organic carbon may not be significantly different between tillage systems. This microbial biomass has been used as an early indicator of soil health. As in other well-studied ecosystems, the resilience of the soil is associated with biodiversity such that increasing the microbial diversity of the soil increases its resilience capacity. Thus, the aim of isolating viable microorganisms in soil is to estimate not only their numbers but also the diversity of the isolates. To do this, a medium satisfying the nutritional requirements of as many
Treatment Org. C (%)
Bacteria (106/ g)
Fungi (104/g)
Cellu-lase1
Urease2
Acid Phosphatase3
Alkaline phosphatase4
Aryl Sulphatase5
Field Practice 0.44 8.6 2.9 1.0 10.0 33.8 108.2 34.9 Chemical 0.47 9.3 1.6 1.15 7.0 23.0 105.9 29.2 Organic 0.50 8.4 1.5 1.37 8.6 35.1 116.6 35.0 Integrated 0.54 13.0 2.1 1.27 9.0 27.1 115.8 31.4 LSD(p=0.05) - 2.3 0.9 0.15 2.5 10.9 41.4 11.1
277

Winter School on “Waste recycling and resource management”-Dec. 3-23, 2014
microorganisms in the soil as possible is required. The functional diversity of microbial populations in soils may be determined by measuring the expression of different enzymes, e.g. with respect to carbon utilization patterns. Another aspect of soil biodiversity, soil suppressiveness, is an indicator of the capacity of soils to suppress specific plant pathogens through inherent biotic and abiotic factors. Several methods are available for determining soil suppressiveness, including the inoculation of target plants seeds directly into the test soil or into a pathogen infested test soil. Microbial Indicators of Soil Health Biodiversity Indicators Microbial community structure and diversity has been noted as important for understanding the relationship between environmental factors and ecosystem functions. The diversity measurement at community level is expressed as the species richness. Diversity of a microbial community is often described by the Shannon-Weaver index (H) (Shannon et al., 1949). The correlation between soil health and biodiversity is not completely understood, although a medium to high diversity is generally considered to indicate a good soil health. Microbial genetic diversity The genetic diversity of soil microorganisms is an indicator of the genetic resource. Methods for determination of the genetic microbial diversity include several molecular methods. Bacterial genetic diversity Is most commonly studied by diversity of the 16S rDNA genes, which occur in all bacteria and which show variation in base composition among species. Two methods have been developed to examine the diversity of 16S rDNA sequences in total DNA extracted from soil microbial communities, namely PCR-DGGE and T-RFLP. (i) Denaturing Gradient Gel Electrophoresis (PCR-DGGE) (Muyzer et al., 1993) and Temperature Gradient Gel Electrophoresis (PCR-TGGE) (Heuer et al., 1997) are based on variation in base composition and secondary structure of fragments of the 16S rDNA molecule. • By PCR-DGGE the gel itself contains a chemical-denaturing gradient, making the fragments denature along the gradient according to their base composition. • By PCR-TGGE a temperature gradient is created across the gel, resulting in the same type of denaturation. The number and position of fragments reflect the dominating bacteria in the community. (ii) Terminal Restriction Fragment Length Polymorphism (T-RFLP) (Liu et al., 1997) is an alternative method for examining diversity of 16S rDNA sequences of microbial communities. It is also based on PCR amplification of 16S rDNA with specific primers. The primers are labelled with a fluorescent tag at the terminus resulting in labelled PCR-products. The products are cut with several restriction enzymes, one at a time, which result in labelled fragments that can be separated according to their size on agarose gels. As the PCR products are labelled at the
278

Winter School on “Waste recycling and resource management”-Dec. 3-23, 2014
terminus, only restriction enzyme fragments containing either of the terminal ends of the PCR product will be detected. The digested PCR products are subsequently loaded on a sequencer. The output includes fragment size and quantity. Fungal genetic diversity The classical method for estimating the fungal diversity of soil has been number and morphology of fruiting bodies. However, the majority of fungi in soil are present either as resting stages (spores) or mycelium. Both spores and mycelium can be isolated from soil, but if a fruiting body is not formed, identification of the organisms is difficult at best, and generally impossible. Further, the isolation step may be selective to specific fungal groups, e.g. the fast growing ones. Molecular methods based on 18S rDNA provide tools that can overcome these problems. Diversity measurements within the fungal community in soil can also be measured by PCR-DGGE (Pennanen et al., 2001) and PCRTGGE (Smit et al., 1999). The methodologies are described above in relation to bacterial genetic diversity. Protozoal diversity Determination of the diversity of protozoa is normally carried out by taxonomic affiliation to species, groups or families based on morphological features. This method is very time consuming, requires specialists and is further complicated by the incomplete taxonomic description of protozoa. Alternatively, protozoan diversity can be determined by molecular methods. The diversity of protozoa has been characterised by PCR-DGGE targeting an 18S rDNA fragment (van Hannen et al., 1999). Structural diversity Phospholipid fatty acids (PLFAs) are stable components of the cell wall of most microorganisms. They are polar lipids specific for subgroups of microorganisms, e.g. gram -negative or gram-positive bacteria, methanotrophic bacteria, fungi, mycorrhiza, and actinomycetes. PLFAs are extracted from soil samples and subsequently analysed by gas chromato-graphy. The technique gives estimates of both microbial community composition and biomass size, and the results represent the in situ conditions in soil. The ratio of oligotrophs (bacteria that require a low nutrient input) to copiotrophs (bacteria that require a high nutrient input) has been proposed to reflect the nutrient stress tolerance of the species present in soil (van Bruggen et al., 2000). Early appearing colony forming units (CFUs) represent copiotrophic bacteria, while late appearing CFUs represent oligotrophic bacteria. • A high ratio, e.g. dominance of oligotrophs, may indicate stable environmental conditions with low substrate availability. • A low ratio, e.g. dominance of copiotrophs, may, in contrast, indicate an environment regularly receiving input of organic rich substrate, e.g. addition of sewage sludge or pesticides. Microbial Activity Indicators Indicators of microbial activity in soil represent measurements at the ecosystem level (e.g.
279
Winter School on “Waste recycling and resource management”-Dec. 3-23, 2014
processes regulating decomposition of organic residues and nutrient cycling, especially nitrogen, sulphur, and phosphorus). Measurements at the community level include bacterial DNA and protein synthesis. Frequency of bacteriophage is a measurement at the population level. Bacterial DNA synthesis Synthesis of DNA is a prerequisite for bacterial cell division and, as such, an indicator of bacterial growth. DNA is unique in the way that it only participates in cell division. DNA synthesis can be determined by incorporation of 3H- or 14C-thymidine into bacterial DNA as thymidine is a unique nucleoside, which only participates in DNA synthesis. The method has several requirements: (i) DNA synthesis has to be linearly correlated with the cell growth (balanced growth) (ii) All bacteria must take up thymidine through the cell membrane, which has been shown not to be the case. (iii) Thymidine should not be metabolised and (iv) The radioactive label (3H) should not exchange with other molecules, e.g. proteins. Bacterial protein synthesis Bacterial protein synthesis is directly correlated to bacterial activity and can be determined by incorporation of 3H or 14C leucine, as this amino acid is incorporated into proteins only. The method for leucine incorporation is the same as for thymidine incorporation and the incorporation of both precursors can be carried out in a single assay if different radiolabels are used. Measurements of protein synthesis are supposed to be more accurate than that of DNA synthesis, because of relatively higher protein content in cells. RNA measurements The RNA molecules, ribosomal RNA (rRNA) and messenger RNA (mRNA), play key roles in the protein synthesis. The amount of RNA in individual cells or in a community may, therefore, be taken as an indicator of protein synthesis and, thus, microbial activity. The number of active cells can be detected by fluorescent in situ hybridisation (FISH) (Amann et al., 1995). By this method, individual cells carrying high concentrations of rRNA, situated on ribosomes, are quantified by fluorescence microscopy. The amount of rRNA in a community can also be detected by Reverse Transcriptase Polymerase Chain Reaction (RT-PCR), where rRNA extracted from soil is detected by creating a DNA copy and separating by gel electrophoresis (Duineveld et al., 2001). Bacteriophages A bacteriophage is a virus, which infects and multiplies in a specific host bacterium. Bacteriophages are abundant in the soil environment and have been isolated for nearly every known species of soil bacteria. Monitoring of the frequency and host specificity of free bacteriophages in soil is an indicator of the activity of specific soil bacteria. This is in contrast to the other microbial activity indicators, which measure the activity of whole microbial
280

Winter School on “Waste recycling and resource management”-Dec. 3-23, 2014
communities. Determination of free bacteriophages in soil can be carried out by a standard method of extraction followed by a plaque-assay ( e.g. (Hu, 1998)) with specific host bacteria, e.g. Pseudomonas (Cambell et al., 1995), Bacillus (Pantasticocaldas et al., 1992), Rhizobium (Radeva et al., 2001). Soil Biomass Indicators Biomass is fundamental for soil processes to occur and quantification of microbial biomass is as such a measurement at the ecosystem level. Microbial biomass Soil microbial biomass represents the fraction of the soil responsible for the energy and nutrient cycling and the regulation of organic matter transformation (Gregorich et al., 1994). Soil microbial biomass contributes to soil structure and soil stabilisation and has also been recommended as indicators of soil organic carbon (Carter et al., 1999). Methods have been used for the estimation of microbial biomass in soil: • Direct [e.g. microscopy or determinations of specific membrane phospholipid fatty acids (PLFAs)] PLFAs are found only in membranes of bacteria and fungi. Individual PLFAs are specific for specific subgroups of microorganisms. Using extraction of soil samples and analysis by gas chromatography, the total amount of PLFAs can be quantified. • Indirect (e.g. chloroform fumigation (CFE/CFI) or substrate induced respiration (SIR)). Determination of microbial biomass by chloroform fumigation covers two indirect methods: the chloroform fumigation incubation method (CFI) and the chloroform fumigation extraction method (CFE) (Carter et al., 1999). In both cases, the chloroform vapour kills the microorganisms in the soil, and subsequently the size of the killed biomass is estimated either by quantification of respired CO2 over a specified period of incubation (CFI) or by a direct extraction of the soil immediately after the fumigation followed by a quantification of extractable carbon. Another common indirect method is substrate induced respiration (SIR). This method measures only the metabolically active portion of the microbial biomass. SIR measures the initial change in the soil respiration rate as a result of adding an easily decomposable substrate (e.g. glucose). Protozoan biomass Protozoan biomass is determined by extracting a soil sample and counting directly by use of an inverted microscope. A newly developed molecular method, MPN-PCR, has been used to quantify a specific group of soil flagellates directly in a gnotobiotic soil system and higher but corresponding numbers was found compared to traditional MPN counting based on culturing (Fredslund et al., 2001). Bioavailability Indicators Microorganisms can measure the bioavailability of a chemical compound in soil. From an environmental viewpoint, the bioavailable fraction of a chemical compound may be a more relevant parameter than the chemically extractable fraction. Indicators of bioavailability represent measurements at the community and population levels.
281

Winter School on “Waste recycling and resource management”-Dec. 3-23, 2014
Biosensor bacteria Biosensor bacteria are designed to respond to certain stress situations (e.g. toxicity) through the use of reporter genes. Environmental relevant bacteria can be selected and genetically modified by fusing reporter genes (e.g. bioluminescence) to the genes of interest and thereby give a certain signal to a specific response. Ultimately, fibre optic linked membrane bound biosensor probes may facilitate in situ ecotoxicity monitoring of soil (Paton et al. 1997). Plasmid-containing bacteria The frequency of plasmid-containing soil bacteria has been shown to be higher in polluted soils compared to agricultural soils, and to increase by addition of heavy metals to soil (Cambell et al., 1995). Thus, measurement of numbers of plasmid- containing bacteria or numbers of plasmids in soil can be used as a general indicator of environmental contaminants. Two different approaches can be used to assess the occurrence of plasmids in soil, the endogenous and the exogenous approach. • By the endogenous approach, plasmids are extracted from soil bacteria isolated on agar plates followed by a visualisation of the plasmids on agarose gels. Plasmids are extracted and visualised as in the endogenous approach. • By the exogenous approach, suitable plasmid free recipient bacteria are used as “fishing rods”. The plasmid free bacteria are mixed with a soil sample and allowed time to pick up (by conjugation) naturally occurring plasmids from the indigenous bacteria. Antibiotic resistant bacteria Antibiotic substances have been detected in outlets of sewage treatment plants, manure and agricultural fields. Although the measured concentrations of antibiotic substances are generally below the minimum inhibitory concentration (MIC) to microorganisms, they may nevertheless select for the outgrowth of resistant bacteria in the soil ecosystem. Very little, however, is known about the occurrence of resistant microorganisms in agricultural soil. Thus, monitoring antibiotic resistant bacteria in soil will not only allow an assessment of the potential risk of antibiotic resistant bacteria to humans (human health), but can also be used as an indicator of industrial and urban pollution (potential leaching or surface run-off). Enumeration of antibiotic resistant bacteria can be carried out either by cultivation and/or molecular techniques. By the use of cultivation method on selective media, not only numbers of resistant bacteria can be estimated, but also the MIC and the breakpoint value may also be determined. A well-known drawback of the cultivation methods is non-culturability of some bacteria. This can be overcome by molecular techniques, which estimate the population sizes of the resistance genes. PCR and molecular gene probe analysis can possibly be used to detect a specific resistance gene in a soil sample and to develop quantitative PCR methods. Incidence and expression of catabolic genes The incidence of specific catabolic genes gives information on the ability of a soil to modify or degrade xenobiotic compounds. An elevated expression of the catabolic genes will, indicate a
282

Winter School on “Waste recycling and resource management”-Dec. 3-23, 2014
partial or complete degradation of the corresponding organic compound. Several methods have been proposed for determination of the incidence and expression of specific catabolic genes. These include conventional culturing of degradative microorganisms, activity measurements of specific degradative key enzymes, and molecular methods for detection of catabolic genes ( e.g. PCR, qPCR) and measurements of their expression (e.g. mRNA, rRNA, biosensor bacteria). The potential for degradation of a xenobiotic compound in soil can be estimated by incubation of a soil slurry spiked with the compound (radiolabelled or unlabelled) of interest and subsequent determinations of either radiolabelled CO2-production, the respiration rate or cell growth. The incubation approach is also used for isolation of consortia or pure cultures able to grow on and degrade specific xenobiotic compounds (Shuttleworth et al. 1997). C-Cycling Indicators A major activity of soil microorganisms is decomposition of organic matter. Soil microorganisms are in general heterotrophic and rely on input of carbon energy from outside the microbial community. Organic matter in soil is largely derived from higher plants consisting of cellulose (15–60%), hemicellulose (10–30%) and lignin (5–30%). Soil respiration Soil respiration measurements have been used as an indicator of pesticide and heavy metal toxicity (Brookes, 1995). Soil respiration, which is the biological oxidation of organic matter to CO 2 by aerobic organisms (microorganisms) occupies a key position in the C cycle of all terrestrial ecosystems. It provides the principal means by which photosynthetically fixed carbon is returned to the atmosphere. The metabolic activities of soil microorganisms can be quantified by measuring CO2 production and/or O2 consumption. Measurement of soil respiration is one of the oldest, but still most frequently used techniques for quantification of microbial activities in soil. Soil respiration is positively correlated with soil organic matter content, and often with microbial biomass and microbial activity (Alef, 1995). Determination of CO2 production from soil samples can be made in the laboratory by simple and inexpensive techniques based on alkaline CO2 traps followed by chemical titration or by more sophisticated automated instruments based on electrical conductivity, gas chromatography or infrared spectroscopy. Field measurements of soil respiration are less often used due to the high sensitivity to environmental conditions, although such measurements have been shown to discriminate between different soil management practices. Organic matter decomposition Rates of OM decomposition is a prerequisite for understanding the availability and recycling of important organic bound nutrients within the ecosystem, such as carbon, nitrogen, sulphur and phosphorus. Field incubation of different types of plant litter or more standardised pieces such as cotton strips and wood sticks, are the most commonly used methods for studying OM decomposition rates. • Decomposition of plant litter can be measured by placing the litter in so-called litterbags in the field. Litterbags are made of inert nylon with a defined mesh size allowing a free exchange of air, water and nutrients and access for organisms. The mesh size defines the groups of organisms
283

Winter School on “Waste recycling and resource management”-Dec. 3-23, 2014
that can contribute to the decomposition within the litterbag. The decomposition rate of the litter is determined as weight loss per time interval (Verhoef, 1995). • Decomposition of cotton strips and wood sticks can be measured by direct placement into the soil. Decomposition rate of the cotton strips is determined as reduction in tensile strength per time interval, while the rate for the sticks is determined as simple weight loss (Harrison et al., 1988). Soil enzymes Soil enzyme activities can be used as measures of microbial activity, soil productivity, and inhibiting effects of pollutants (Tate, 1995). Disturbance of the soil microbial activity, as shown by changes in levels of metabolic enzymes, can serve as an estimate of ecosystem disturbance. This relationship has been clearly shown when soil is polluted with heavy metals. These include dehydrogenase, â-glucosidases, urease, amidases, phosphatases, arylsulphatase, cellulases and phenol oxidases. Hydrolysis of the fluorescent fluorescein diacetate is thought to broadly represent soil enzyme activity, because it is hydrolysed by a number of different enzymes, such as proteases, lipases and esterases. Measurements of soil enzyme reaction are usually based on the addition of an artificial, soluble substrate at a concentration sufficient to maintain zero-order kinetics, thus achieving a reaction rate proportional to enzyme concentration. Long incubation periods have to be omitted to avoid substrate depletion and microbial growth. Enzyme activities are usually determined by a dye reaction followed by a spectrophotometric measurement. Methane oxidation Net production of methane can be considered as an indicator of greenhouse gas emission and may further be linked to monitoring of the atmospheric balance. Methane oxidation is measured by spiking a soil sample with methane and incubating the sample in a closed jar in the laboratory. Loss of methane is subsequently determined by gas chromatography. The number of methanotrophs is an indicator of potential greenhouse gas consumption. Methanotrophs can be quantified directly in soil by fluorescent in situ hybridisation (FISH) (Bourne et al., 2000) or standard growth- dependent MPN counts. Analyses of methanotrophic communities can be done with PCR-DGGE using methanotrophs-specific 16S rDNA primers (Ritchie et al., 1997). N-Cycling Indicators The mineralization of soil organic nitrogen (N) through nitrate to gaseous N2 by soil microorganisms is a very important process in global N- cycling. This cycle includes N-mineralization, nitrification, denitrification and N2-fixation. Indicators of nitrogen cycling represent measurements at the ecosystem level. Organic N is mineralized to ammonium (NH4
+) by a wide variety of soil microorganisms and it reflects the turnover of organic material in soil and the available indigenous N-pools to plants. Ammonium is subsequently either immobilised by soil microorganisms (that is, assimilated into new biomass) or oxidised to nitrite (NO2
–) and subsequently to nitrate (NO3
–) by aerobic nitrification. At this step, leaching of N to the groundwater may occur due to the negative charge of the nitrate ion. Under normal
284

Winter School on “Waste recycling and resource management”-Dec. 3-23, 2014
circumstances, however, nitrate is subsequently reduced to gaseous nitrogen (N2) via nitrous oxide (N2O) by anaerobic denitrification. Nitrification and denitrification together lead to losses of bioavailable N since nitrous oxide and gaseous N2 may be lost to the atmosphere. N2 can be re-fixed into the soil by N2- fixing microorganisms. Nitrous oxide is a greenhouse gas when lost to the atmospher N-mineralization Ammonification is actually a measure of the net N-mineralization, since immobilisation of NH4
+ by soil microorganisms into new biomass occurs simultaneously with the mineralization process. The measurement thus reflects the potential N -mineralization in soil and is measured by the accumulation of NH4
+ in soil slurry under aerobic conditions over a period of several weeks. Anaerobic incubation is sometimes preferred because there is less microbial immobilisation under anaerobic conditions and nitrification is inhibited (Stenberg 1999). Compared to other measurements of N-cycling, the N-mineralization is relatively insensitive to disturbances because a wide variety of microorganisms are involved in the process. Nitrification Nitrification is believed to be a more sensitive parameter than N mineralization, because only a small number of bacteria, the nitrifiers, are involved in the process. Nitrification measurements reflect the population size of the nitrifiers since ammonium is an essential substrate for these organisms. Furthermore, these measurements together with denitrification measurements may indicate deposition of ammonia on N -limited habitats. Nitrification is measured by the ammonium oxidising assay. With this method, a soil slurry is incubated with excess ammonium and chlorate, the latter inhibiting the oxidation of nitrite to nitrate (Belser et al., 1980). The oxidation of ammonium to nitrite is measured by gas chromatography. Denitrification The denitrifying capacity is a widespread feature among soil bacteria and therefore denitrification can be used as a representative for microbial biomass (Stenberg, 1999). Since denitrification is an anaerobic process the amount of denitrification found in soil is very dependent on abiotic factors such as precipitation and soil compaction. Thus, soil management practices readily influence the amount of denitrification found in agricultural fields. Denitrification measurements may, together with nitrification measurements, indicate deposition of ammonia in N-limited habitats. Measurement of denitrification is carried out by the acetylene inhibition technique (Smith et al., 1979), in which the reduction of N2O to N 2 is inhibited by acetylene and accumulated nitrous oxide is measured by gas chromatography. The method is often used to measure the potential denitrification where nitrate and carbon are added and anaerobic conditions are established. However, interpretation of denitrification data is complicated, because the denitrification enzymes are synthesised only under anaerobic conditions and the enzymes are not functional under aerobic conditions, even though they persist in the microbial community. The denitrification assay may thus reflect historical anaerobic situations and not necessarily the size of the actively denitrifying biomass.
285
Winter School on “Waste recycling and resource management”-Dec. 3-23, 2014
Minimum dataset for soil health quantification Due to the explosion of interest in alternate farming systems, like organic farming, conservation farming etc., minimum data sets of physical, chemical, and biological properties that can be used as quantitative indicators of soil health have assumed crucial significance. Because soils perform many simultaneous functions, the goal of relating indicator properties to specific functions or processes is very difficult. Soil organisms contribute to the maintenance of soil health, as they control the decomposition of plant and animal materials, biogeochemical cycling including nitrogen fixation, the formation of soil structure and the fate of organics applied to soils. A large, diverse, and active population of soil organisms may be the most important indicator of a healthy, high-quality soil. Yet, soil biological activity may be the most difficult indicator to satisfactorily measure and interpret. Microbial diversity is so little understood, less than 1% of the microorganisms have been isolated and identified. A good ecological indicator, which could be reliably used, has not been identified because of stringent requirements for its functionality. This situation is unlikely to change in the near future. So, for a working definition of soil biological quality and ease of analysis, biochemical attributes of soil are the only option at present. Soil organic matter influences many soil properties including infiltration rate, bulk density, aggregate stability, cation exchange capacity, and biological activity, all of which are related to a number of key soil functions. Particulate organic matter (POM >53 mm) represents a significant proportion of the slow pool and is important in maintaining the stability of macroaggregates (>250 mm). POM and microbial biomass are important pools of soil organic matter (SOM) turnover and are sensitive indicators of management-induced changes in the fate of crop residues and the turnover of SOM constituents. Soil respiration and nitrogen mineralization are widely used as indices. Decrease of microbial biomass carbon as fraction of total organic carbon implies reduction in microbial transformation and intensity. The metabolic quotient or qCO2 is a more sensitive indicator of soil microbial reaction to cropping systems, lower values implying more stable and mature systems where carbon utilization efficiency of the microbial population is higher due to shift from zymogenous to autochthonous microflora. CONCLUSIONS Microbial diversity over the years is changing due to alteration in carbon inputs from the agricultural management practices. To sustain the agricultural productivity through maintaining living component of soil needs a greater attention. Further more attention is needed under different soil, crop and nuteinrt management system in a long-run. Based on different studies and published literature, it is suggested that measurement of four parameters, viz., Particulate organic matter, Soil respiration, Microbial biomass carbon and N mineralization would be adequate to give a complete picture of soil biological health. However there is a need to undertake systematic studies on soil microbial diversity changes in conservation farming and possible implications for soil functions. Over long-term imbalances in ecological function may be changes drastically present output of agriculture vis- a-vis loss of microbial diversity i.e. soil biological function. More research is needed for crop adaptation strategies under different farming system to improve productivity and soil health sustenance.
286
Winter School on “Waste recycling and resource management”-Dec. 3-23, 2014
REFERENCES Alef, K. (1995). Soil respiration. In: Methods in Applied Soil Microbiology and Biochemistry.
Alef, K. and Nannipieri, P. (Eds.). Academic Press, pp. 214–218. Amann, R., Ludwig, W. and Schleifer, K.H. (1995). Phylogenetic identification and in situ
detection of individual microbial cells without cultivation. Microbiological Reviews, 59: 143–169.
Belser, L.W. and Mays, E.L. (1980). Specific inhibition of nitrite oxidation by chlorate and its use in assessing nitrification in soils and sediments. Applied and Environmental Microbiology, 39: 505–510.
Bourne, D.G., Holmes, A.J., Iversen, N. and Murrell, J.C. (2000). Fluorescent oligonucleotide rDNA probes for specific detection of methane oxidizing bacteria. FEMS Microbiology Ecology, 31: 29–38.
Brookes, P.C. (1995). The use of microbial parameters in monitoring soil pollution by heavy metals. Biology and Fertility of Soils, 19: 269–279.
Cambell, J.I.A., Albrechtsen, M. and Sørensen, J. (1995). Large pseudomonas phages isolated from barley rhizosphere. FEMS Microbiology Ecology, 18: 63–74.
Carter, M.R., Gregorich, E.G., Angers, D.A., Beare, M.H., Sparling, G.P., Wardle, D.A. and Voroney, R.P. (1999). Interpretation of microbial biomass measurements for soil quality assessment in humid temperate regions. Canadian Journal of Soil Science, 79: 507–520.
Doran, J.W., Sarrantonio, M. and Liebig, M.A. (1996). Soil health and sustainability. Advances in Agronomy, 56: 1–54.
Doran JW, Safley M (1997) Defining and assessing soil health and sustainable productivity. In: Pankhurst CE, Doube BM, Gupta VVSR (eds) Biological indicators of soil health. CABI, Wellingford, pp 1–28
Duineveld, B.M., Kowalchuk, G.A., Keijzer, A., van Elsas, J.D. and van Veen, J.A. (2001). Analysis of bacterial communities in the rhizosphere of chrysanthemum via denaturing gradient gel electrophoresis of PCRamplified 16S rRNA as well as DNA fragments coding for 16S rRNA. Applied and Environmental Microbiology, 67: 172– 178.
Fredslund, L., Ekelund, F., Jacobsen, C.S. and Johnsen, K. (2001). Development and application of a Most-Probable-Number-PCR assay to quantify flagellate populations in soil samples. Applied and Environmental Microbiology, 67: 1613–1618.
Goswami, N.N. and Rattan, R.K. (1992). Soil Health-Key to sustained agricultural productivity. Fertilizer News, 37(12): 53–60.
Gregorich, E.G., Carter, M.R., Angers, D.A., Monreal, L.C.M. and Ellert, B.H. (1994). Towards a minimum data set to assess soil organic-matter quality in agricultural soils. Canadian Journal of Soil Science, 74: 367–385.
Harrison, A.F., Latter, P.M. and Walton, D.W.H. (1988). The cotton strip assay: An index of decomposition in soils. Institute of Terrestrial Ecology Symposium No. 24, Institute of Terrestrial Ecology, Grange-Over-Sands, UK.
Heuer, H. and Smalla, K. (1997). Application of denaturing gradient gel electrophoresis and temperature gradient gel electrophoresis for studying soil microbial communities. In: Modern Soil Microbiology. van Elsas, J.D., Trevors, J.T., and Wellington, E.M.H. (Eds.). Marcel Dekker, Inc., New York, pp. 353–373.
Liu, W.T., Marsh, T.L., Cheng, H. and Forney, L.J. (1997). Characterization of microbial diversity by determining terminal restriction fragment length polymorphisms of genes
287
Winter School on “Waste recycling and resource management”-Dec. 3-23, 2014
encoding 16S rRNA. Applied and Environmental Microbiology, 63: 4516– 4522.
Mader P. et al. 2002. Soil fertility and biodiversity in organic farming. Science, 296, 1694-1697. Manna, M.C., Swarup, A., Wanjari, R.H. and Ravankar, H.N. (2007). Long-term effects of NPK
fertilizer and manure on soil fertility and a sorghum-wheat farming system. Aust. J. Exptl. Agril., 47: 700–711.
Manna, M.C., Swarup, A., Wanjari, R.H., Singh, Y.V., Ghosh, P.K., Singh, K.N., Tripathi, A.K. and Saha, M.N. (2006). Soil organic matter in a West Bengal Inceptisol after 30 years of multiple cropping and fertilizer. Soil Sci. Soc. Am. J., 70: 121–129.
Muyzer, G., Dewaal, E.C. and Uitterlinden, A.G. (1993). Profiling of complex microbial populations by denaturing gradient gel-electrophoresis analysis of polymerase chain reaction-amplified genes coding for 16S ribosomal- RNA. Applied and Environmental Microbiology, 59: 695–700.
Pantasticocaldas, M., Duncan, K.E., Istock, C.A. and Bell, J.A. (1992). Population-dynamics of bacteriophage and Bacillus subtilis in soil. Ecology, 73: 1888–1902.
Paton, G.I., Rattray, E.A.S., Campbell, C.D., Cresser, M.S., Glover, L.A., Meeussen, J.C.L. and Killham, K. (1997). Use of genetically modified microbial biosensors for soil ecotoxicity testing. In: Biological indicators of soil health. Pankhurst, C.E., Doube, B.M., and Gupta, V.V.S.R. (Eds.). CAB International, pp. 397–418.
Pennanen, T., Paavolainen, L. and Hantula, J. (2001). Rapid PCR-based method for the direct analysis of fungal communities in complex environmental samples. Soil Biology and Biochemistry, 33: 697–699.
Prasad, R.N., Patiram, R.C., Baroah and Munna Ram (1981). Soil fertility management in North Eastern Hill Regions ICAR Res. Bull NER 9.
Radeva, G., Jürgens, G., Niemi, M., Nick, G., Suominen, L. and Lindstrom, K. (2001). Description of two biovars in the Rhizobium galegae species: Biovar orientalis and biovar officinalis. Systematic and Applied Microbiology, 24: 192–205.
Rao DLN. 2006. Soil Biology and Biochemistry Research in India at the turn of the millennium- A Critique and a Perspective. ISSS Bulletin “Trends in Soil Research”, Indian Society of Soil Science, New Delhi, 23, 41-78.
Rao DLN, Manna MC. 2005. An Appraisal of Soil Quality Assessment Indicators In: Abrol IP et al (Eds). Conservation Agriculture- Status and Prospects. Proc. National Conference on Conservation Agriculture: Conserving Resources-Enhancing Productivity. CASA, New Delhi , pp 210-217.
Rao DLN. 2007. Microbial Diversity, Soil Health and Sustainability. J. Indian Society of Soil Science, 55, 392-403.
Ritchie, D.A., Edwards, C., McDonald, I.R. and Murrell, J.C. (1997). Detection of methanogens and methanotrophs in natural environments. Global Change Biology, 3: 339–350.
Shannon, C. and Weaver, W. (1949). The mathematical theory of communication. University of Illinois Press, Urbana, Illinois, USA.
Shuttleworth, K.L. and Cerniglia, C.E. (1997). Practical methods for the isolation of polycyclic aromatic hydrocarbon (PAH)-degrading microorganisms and the determination of PAH mineralization and biodegradation intermediates. In: Manual of Environmental Microbiology. Hurst, C.J., McInerney, M.J., Stetzenbach, L.D., Knudsen, G.R. and Walter, M.V. (Eds.). ASM Press, Washington DC, pp. 766–775.
Smit, E., Leeflang, P., Glandorf, B., van Elsas, J.D. and Wernars, K. (1999). Analysis of fungal diversity in the wheat rhizosphere by sequencing of cloned PCR-amplified genes encoding
288
Winter School on “Waste recycling and resource management”-Dec. 3-23, 2014
18S rRNA and temperature gradient gel electrophoresis. Applied and Environmental Microbiology, 65: 2614–2621.
Smith, M. and Tiedje, J.M. (1979). Phases of denitrification following oxygen depletion in soil. Soil Biology and Biochemistry, 11: 261–267.
Stenberg, B. (1999). Monitoring soil quality of arable land: Microbiological indicators. Acta Agriculturae Scandinavia, 49: 1–24.
Tate, R.L. (1995). Soil microbiology. John Wiley, New York. van Brüggen, A.H.C. and Semenov, A.M. (2000). In search of biological indicators for soil health
and disease suppression. Applied Soil Ecology, 15: 13–24. van Hannen, E.J., Mooij, W., van Agterveld, M., Gons, H.J. and Laanbroek, H.J. (1999). Detritus-
dependent development of the microbial community in an experimental system: Qualitative analysis by denaturing gradient gel electrophoresis. Applied and Environmental Microbiology, 65: 2478–2484.
Verhoef, H.A. (1995). Litter bag method In: Methods in Applied Soil Microbiology and Biochemistry. Alef, K. and Nannipieri, P. (Eds.). Academic Press, pp. 485–487.
289

Winter School on “Waste recycling and resource management”-Dec. 3-23, 2014
Mitigation options for greenhouse gas emissions from agricultural fields
S.R. Mohanty
Indian Institute of Soil Science, Nabibagh, Bhopal-462038.
Growing awareness of global warming and ozone (O3) depletion has led to an increased
emphasis on the study of greenhouse gases viz., carbon dioxide (CO2), methane (CH4), nitrous
oxide (N2O) and chlorofluorocarbons (CFC). The emission of these anthropogenically mediated
greenhouse gases due to an increased human activity, intensive agriculture, rapid
industrialization and other associated interventions have contributed to a steady increase in
global warming. It has been projected that if the present state of industrialization, dairy farming,
rice cultivation, and other agriculture activities continue and/or further intensified, the
atmospheric concentration of greenhouse gases will double by 2035 AD. Agriculture is
considered to be one of the major anthropogenic sources of atmospheric greenhouse gases. Its
important task of providing food for a steadily increasing world population is reflected in the
growing damage it is causing to the environment as exemplified by the global rise in
concentrations of CH4, CO2, and nitrogen oxides (NOx and N2O). CH4 and N2O are the
important greenhouse gases than other trace gases in their contribution to global warming. The
ability of CH4 and N2O molecules to absorb infrared radiation makes these gases 20–30 and
200–300, respectively, more times efficient than CO2 as a greenhouse gas, resulting in a
significant contribution to the radiative forcing of the atmosphere and global climate changes.
CH4 the major component of natural gas, is the second in importance as a greenhouse gas
with a current ambient concentration of 1.7ppm. To many activities build up in the global
atmospheric CH4 concentration is attributed. CH4 affects the earth’s atmospheric chemistry due
to its multifarious role in the earth’s troposphere and stratosphere including the stratospheric
ozone budget. CH4 undergoes photochemical oxidation in stratosphere and produces water
vapour and results in the formation of the polar stratospheric clouds. In addition to general
climatological effects, global warming may affect the global carbon cycle by greatly reducing the
soil organic carbon content, which may be released as CO2 and is likely to add to the current
burden of CO2 in the atmosphere. According to an estimate (World Resource Institute,
Washington DC, 1990), Indian contribution to CH4 from all sources (flooded rice paddies,
290

Winter School on “Waste recycling and resource management”-Dec. 3-23, 2014
animal husbandary, landfills, etc) is 12% of global CH4 production. Although there are many
sources of CH4 which contributes to global CH4 budget (Fig. 1) but the contribution from
wetlands is substantial. Rice production is one of the most profitable ways for management of
lowlands and rice serves as the most important cereal for the majority of global population, the
question of reducing global rice area does not arise. On the contrary, projected increase in rice
production is expected to be achieved from an intensification of rice cultivation that, in turn, may
contribute to further increases in other greenhouse gases including CH4. Rice is preferentially
grown under submerged conditions due to better yields than in uplands soils and positive
response to modern agricultural practices. But the predominately anaerobic flooded soils
promote the production of CH4, a major end product of anaerobic decomposition of organic
matter (native or added).
Rice cultivation, on the other hand also appears to be the most suitable candidate for
reducing CH4 in the atmosphere because of the possibility of controlling emissions by selected
agronomic practices. Therefore this chapter will focus on the process of CH4 emission from rice
fields and the options to reduce its emission.
Fig.1. Methane emission from different sources. In agriculture sector, wetlands including the rice
fields are the major sources of atmospheric CH4.
Methane emission from agricultural fields
Upto 70-80% of atmospheric CH4 is biogenic and rice fields contribute about 20% of global atmospheric budget. India and China represent the two major rice growing countries of Asia which together covers a total of 60% of world’s rice area, the contribution of these two countries
291

Winter School on “Waste recycling and resource management”-Dec. 3-23, 2014
to global CH4 budget is substantial. Rice is grown in India over a widely divergent geographical area and the largest area under rice cultivation accounting for about 28% of total crop area.
Based on the data, generated from CH4 flux measurement in rice fields it is reported that CH4 emission from Indian rice fields was about 4.3 Tg yr-1 with a range between 2.7 and 6.4 Tg yr-1 in which the major share of about 94% was from rainfed rice and only 6% from irrigated rice.
CH4 emission from rice fields :
CH4 emission from rice paddy is governed by a complex set of parameters, viz., soil type, pH, redox potential, temperature, water regime, fertilizer, sulphate content, rice cultivars and cultural practices used in rice cultivation. Both organic and inorganic fertilizers can influence CH4 production and emission. CH4 emission from rice field is the net effect of CH4 production and CH4 oxidation. Both CH4 production and oxidation can be regulated by several approaches and can be manipulated to reduce global CH4 budget.
Flooded rice fields emit methane (or CH4), which is second in importance to CO2 as a greenhouse gas. Under anaerobic condition of submerged soils of flooded rice fields, methane is produced and much of it escapes from the soil into the atmosphere by three major modes (Fig. 2).
(i) diffusion of dissolved methane across the water-interface,
(ii) bubble ebullition, and
(iii) air circulation between the atmosphere and buried tissues of aquatic plants, with the stems and leaves serving as conduits.
Biogeochemical Cycling of CH4
The carbon atom found in the CH4 molecule is fully reduced and is potential electron donor . At the other extreme of the redox scale lies CO2, the most oxidized form of carbon found in the cycle. CO2 generally enters the carbon cycle by photosynthetic fixation of glucose. Carbon atoms thus fixed are then converted into a myriad of other organic molecules, varying in size and complexity, but all being intermediate in redox potential between CO2 and CH4. Carbon atoms are shuffled around these organic molecules by biosynthetic and biodegradative reactions which organisms use to acquire the energy. Under anaerobic conditions, organic materials are converted into organic acids, alcohols, methylated amines, and H2 by microbial communities. Under highly reducing conditions and in absence of other electorn acceptors, these substrates are converted to CH4. CH4, thus formed enters the atmosphere. About 85% atmospheric CH4 is consumed by OH followed by reactions with O and Cl atoms and sequesters ozone depletion. Under oxidized condition CH4 is oxidized to CO2 by methanotrophic bacteria in terrestrial environment.
292

Winter School on “Waste recycling and resource management”-Dec. 3-23, 2014
Microbiology and biochemistry of methanogenesis
CH4 producing bacteria are phylogenetically diverse, but coherent group within the domain Archaea. Methanogens can be found in number of other environments including some marine sediments, the digestive tract of many animals and insects and anaerobic sewage digesters. Methanogenic bacteria can metabolize only in strict absence of oxygen and at very low redox potential with a temperature optima between 37 and 40C. Twenty genera of CH4 producing bacteria have been described which could be grouped into three major groups depending upon 16S rRNA sequences. Only a few methanogens including Metahnobacterium and Methanosarcina have been isolated from rice soils. Methanogens derive energy by reducing CO2 to CH4.
Factors affecting CH4 production and emission from rice soils
The production and emission of CH4 in flooded rice soils are controlled by many edaphic factors and agroclimatic factors such as redox potential, pH, temperature, organic matter content, sulphate content, moisture regime, soil type, and rice cultivars. Besides, many cultural practices including application of fertilizer influence the rate of production and emission of CH4 from flooded rice paddies. However, the major factors that can be considered to reduce atmospheric CH4 emission from rice fields are soil type, organic matter management, fertilizer type and sulphate content, water management and various agrochemicals including the pesticides. This chapter is limited to test some of these factors on methane emission from rice fields.
Methane production in different tropical rice soil types of India
CH4 production potential (methanogenesis) from different major rice growing soils of India analyzed to explore the soil physicochemical or biological factors with methanogenesis. Soils collected from different agroclimatic zones of India (Balasore, Bhubaneswar, Cochin, Cuttack, Hyderabad, Kalahandi, Khuntuni, Pokkali, Sukinda) were used in this study (Table 1).
Table – 1. Physicochemical characteristics of the soils used in the study
293

Winter School on “Waste recycling and resource management”-Dec. 3-23, 2014
CH4 production rates of the nine soils studied showed appreciable differences among themselves
and were of lower magnitude in almost all the soils except that of Balasore soil (Figure 3).
Temporal pattern of production rates during incubation indicated three different classes of
production patterns, namely (I) suppressed (Kalahandi, Pokkali, Sukinda, and Bhubaneswar), (II)
delayed (Cuttack, Khuntuni, Cochin, and Balasore) and (III) immediate (Hyderabad). Kalahandi
soil was not microbially active as indicated by a slow reduction of the soil following flooding.
However, in spite of fast reduction and near neutral pH, CH4 production was low in acid sulfate
soil (Pokkali) and could be due to the presence of sulfate and volatile sulfides in the soil.
Methane production rates were low throughout the incubation period for the soils classified in
category I. On the contrary, CH4 production in category II soils was low during the first 10 d
followed by an increase around 30 d of incubation. Interestingly, in Hyderabad soil, CH4
production reached its peak within first 10 d of incubation after which it declined.
Fig. 3. CH4 production from different rice growing soil types of India.
A correlation analysis of different soil characters and CH4 production rates analysed (data not shown) and no such significant correlation observed. Although methane production was significantly correlated only with soil CEC over initial incubation while no significant correlation existed between any of the soil characters and CH4 production for incubation period. While soil physicochemical properties are known to affect CH4 production through various pathways, soils used in the present study did not reveal any such effect. The scope of the present study involving incubation of select native rice soils is of limited nature and probably can not be
294

Winter School on “Waste recycling and resource management”-Dec. 3-23, 2014
extended to field situations where growing rice plants will affect CH4 production by providing exogenous substrates through root exudates and dead and decaying roots. However, the results indicate the inherent spatial variability among different rice soils and further studies with a wider range of soils and different amendments would probably help in explaining the basic mechanisms of variability of CH4 production and emission from these soils.
Agricultural practices that reduce CH4 emission
Organic Matter Amendment
Organic matter amendment to flooded soil generally increases CH4 production and emission. Organic matter decomposes and produces different simple carbon sources known as readily mineralizable carbon and this type of soil organic matter in soil acts as the main fermentation products in flooded soils and sediments that are driven to CH4 by strict anaerobic bacteria (methanogens).
Methane flux from flooded plots planted to rice under different organic amendments, was monitored. Fields were incorporated with urea N, Sesbania + urea N, Compost + urea N, and Azolla +urea N. All organic amendments made on equal N basis (20 kg N ha–1) with urea to provide a total of 60 kg N ha-1. Seasonal flux of CH4 was high following the application of fertilizer-N and organic amendments further enhanced it. All the organic treatments in combination with urea effected higher CH4 flux over that of chemical-N (urea) alone. Organic amendment affected an immediate increase in emission values. After 10 days emission rates decreased but remained consistently on a higher level than the other treatments (Figure 4. Over the season, the ranking in emission from these four treatments was Sesbania (212% increase as compared to urea alone) > Azolla (61% increase) > compost (54% increase) > urea. Among the three organic amendments tested, Azolla had the lowest ratio between CH4 flux and yield (Table 3). Azolla is often used as a biofertilizer in south and southeast Asia to improve the N balance of paddy fields and is either incorporated as green manure at the beginning of the cropping season.
295
Winter School on “Waste recycling and resource management”-Dec. 3-23, 2014
Fig 4. Effect of urea N in combination with different organic amendments on CH4 emission from rainfed rice fields planted to rice.
Mode of application of Azolla to reduce CH4 emission from a flooded alluvial soil planted to rice.
CH4 production and emission from flooded rice soils are strongly influenced by several soil processes including changes in soil redox status and pH, dynamics of substrate and nutrient availability and textural stratification. In addition, common cultivation practices such as application of agrochemicals also affect CH4 efflux from flooded rice soils. However, the relationship between fertilizer application and CH4 efflux from flooded rice system is far from clear and available literature on the effect of fertilizers on CH4 emission is often contradictory. While organic matter amendment generally increases CH4 emission, CH4 efflux is also strongly influenced by the type, method and rate of application of chemical fertilizer. Although urea remains the preferred chemical N-fertilizer for rice cultivation, several organic sources including partially decomposed and fresh organic matter and biofertilizers are widely used for maintaining the soil fertility and sustained high yield in tropical rice fields. Azolla, a free-floating aquatic fern having symbiotic association with the N2-fixing cyanobacterial symbiont Anabaena Azollae, can fix 30–60 kg Nha−1 in 30 days. It is either incorporated as green manure at the beginning of the cropping season or grown as a dual crop along with rice, in the standing water of flooded fields. The fern is used to a great extent in China, India, Bangladesh and Vietnam as an important biological source to improve the N balance of rice fields. The nitrogen fixed by the cyanobacterial symbiont is either released upon decay of the incorporated Azolla or leached into the standing water from the growing Azolla and is available for uptake by the rice crop. We evaluated the effects of applying Azolla as green manure or dual cropping it on CH4 efflux from flooded alluvial soil planted to rice with urea (Table. 2). In addition, the alterations in select soil and plant parameters in Azolla applied soil and their relationship with CH4 emission were investigated.
296
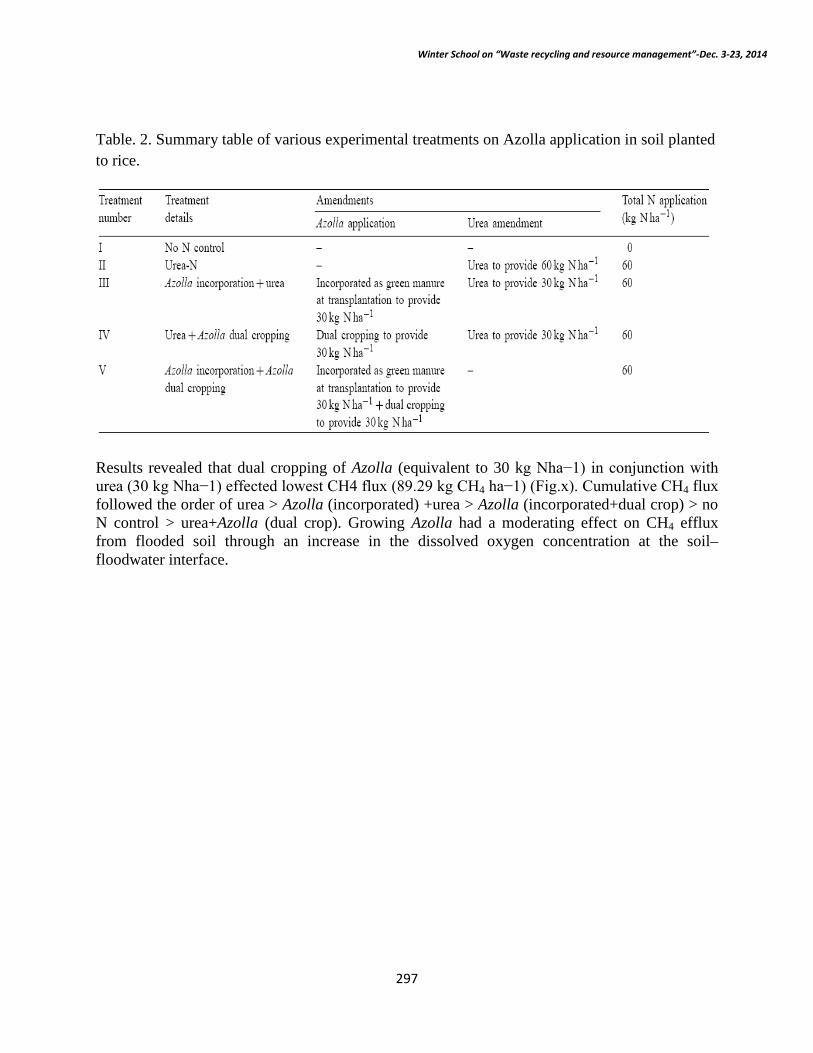
Winter School on “Waste recycling and resource management”-Dec. 3-23, 2014
Table. 2. Summary table of various experimental treatments on Azolla application in soil planted to rice.
Results revealed that dual cropping of Azolla (equivalent to 30 kg Nha−1) in conjunction with urea (30 kg Nha−1) effected lowest CH4 flux (89.29 kg CH4 ha−1) (Fig.x). Cumulative CH4 flux followed the order of urea > Azolla (incorporated) +urea > Azolla (incorporated+dual crop) > no N control > urea+Azolla (dual crop). Growing Azolla had a moderating effect on CH4 efflux from flooded soil through an increase in the dissolved oxygen concentration at the soil–floodwater interface.
297

Winter School on “Waste recycling and resource management”-Dec. 3-23, 2014
Fig. 5. Effect of Azolla and urea application on methane efflux from flooded alluvial field planted to rice [A.no N (Control), B. urea (60 kg Nha−1), C. Azolla incorporated (30 kg Nha−1) +urea (30 kg Nha−1), D. Azolla dual cropping (30 kg Nha−1) +urea (30 kg Nha−1), E. Azolla incorporated (30 kg Nha−1)+dual cropping (30 kg Nha−1)]. Means of three replicate values plotted, bars/half-bars indicate the SD.
Water Management and incorporation of rice straw influence CH4 emission from rice fields.
Flooding the soil creates anaerobiosis and conditions favorable for CH4 production and
emission. Thus, floodwater regime can have a strong influence on CH4 emission rates from rice
fields and a single midseason drainage is considered to reduce seasonal CH4 rates by about 50%.
In a controlled experiment during the dry season, seasonal CH4 flux as influenced by continuous
flooding vis-à-vis alternate flooding (intermittent irrigation) was investigated. Mean CH4
emission was lowest (13.80 mg m–2 d–1) in field plots that were alternately flooded as compared
to continuously flooded (16.32 mg m–2 d–1) field plots leading to a 15% reduction in seasonal
298

Winter School on “Waste recycling and resource management”-Dec. 3-23, 2014
CH4 flux (Table 3). Amendment with rice straw at 2 t ha-1 significantly increased CH4
production under both continuously flooded and intermittently flooded field plots with the
maximum increase under the continuously flooded conditions. However, grain yield was higher
under rice straw-amended, intermittently flooded field plots, resulting in the least amount of CH4
t-1 grain yield. In rainfed rice ecosystem, drying and wetting of soil occurs naturally and
frequently with alternate drought and rainy periods. While such situations would automatically
reduce CH4 flux from a rainfed ecosystem, efficient water management in areas with effective
drainage facility would further limit CH4 flux.
Table. 3. Methane emission from an irrigated alluvial field planted to rice as affected by water regime and straw amendment.
Cultivar variation on CH4 emission from flooded rice paddies.
Rice plants serve as the major conduit for the transfer of CH4 from the reduced soil layer to the atmosphere and more than 90% of CH4 fluxes from paddy soils are mediated by the rice plants. In view of the inherent variability in plant architecture, metabolic activity and gas transport potential among different rice cultivars, cultivar variation in CH4 efflux from rice has attracted attention. The role of rice cultivar on CH4 emission from flooded fields was investigated in a field experiment in wet season. Among the four modern improved rice cultivars tested, cv. Lalat gave the highest seasonal CH4 flux (44.41 kg ha-1) and the degree of CH4 efflux followed the order of Lalat > IR 72 > Gayatri > Tulasi. Cultivars Gayatri and Tulasi had lower CH4 flux (Table 4), thereby producing –13% and –22% CH4 over that of IR72. Wide variations among rice cultivars tested with regard to CH4 flux opens up possibilities for breeding rice cultivars with low CH4 emission potential.
299

Winter School on “Waste recycling and resource management”-Dec. 3-23, 2014
Table 4. Methane emission from a rainfed alluvial field planted to different rice cultivars under uniform conditions.
Influence of Pesticides (Butachlor) on CH4 emission from rice fields.
The use of pesticides has now become an integral part of intensive rice growing systems,
protecting modern high-yielding rice varieties from pests in order to achieve high yields. Many
of the agrochemicals effect qualitative and quantitative alterations in the activities and
populations of different groups of soil microorganisms. While some insecticides, such as DDT
and HCH (isomeric mixture) are known to inhibit CH4 production and emission, the effects of
herbicides on CH4 production and emission are not clearly known. Currently, herbicides are
being increasingly used in Indian agriculture, in general, and rice culture in particular. Butachlor
(N-butoxymethyl-2-chloro-2b,6b-diethyl acetanilide) belongs to the chloroacetanilide group of
herbicides which inhibit protein synthesis in developing plant tissue, and is largely used for pre-
emergence and/or early post-emergence control of a variety of undesirable grasses and selected
broad-leaved weeds in transplanted and direct-seeded rice. Biodegradability and the short half-
life period (t1/2) of butachlor argue for its increased use in intensive rice cultivation. Butachlor is
a widely used herbicide in rice culture in India and ranks first among the different herbicides
used with a total consumption of approximately 2,600 m t year–1 . We studied the effect of
butachlor on CH4 emission and ebullition fluxes from a tropical flooded field (alluvial soil)
planted to rice and grown under irrigated condition.
300

Winter School on “Waste recycling and resource management”-Dec. 3-23, 2014
Fig. 6 Methane efflux from a direct-seeded flooded rice field untreated or treated with the herbicide butachlor (means of four replicates plotted; bars/half-bars indicate the standard deviation)
Application of a commercial formulation of the herbicide butachlor (N-butoxymethyl-2-chloro-
2b,6b-diethyl acetanilide) at 1 kg a.i. ha–1 to an alluvial soil planted with direct-seeded flooded
rice (cv. Annada), significantly inhibited both crop-mediated emission and ebullition fluxes of
methane (CH4) (Fig. 6 and 7). Over a cropping period of 110 days, the crop-mediated cumulative
emission flux of CH4 was lowered by 20% in butachlor-treated field plots compared with that of
an untreated control.
Fig. 7. Seasonal pattern of ebullition flux of CH4 from a directseeded flooded rice field untreated or treated with the herbicide butachlor (means of two replicates plotted; bars/half-bars indicate the standard deviation)
301
Winter School on “Waste recycling and resource management”-Dec. 3-23, 2014
Concurrently, ebullition flux of CH4 was also retarded in butachlor-treated field plots by about
81% compared with that of control plots. Significant relationships existed between CH4 emission
and redox potential (Eh) and Fe2+ content of the flooded soil. Application of butachlor retarded
a drop in soil redox potential as well as accumulation of Fe2+ in treated field plots.
Methanogenic bacterial population, counted at the maturity stage of the crop, was also low in
butachlor-treated plots, indicating both direct and indirect inhibitory effects of butachlor on
methanogenic bacterial populations and their activity. Results indicate that butachlor, even at
field-application level, can effectively abate CH4 emission and ebullition from flooded soils
planted to rice whilst maintaining grain yield.
Conclusion
Flooded paddy is one of the most important anthropogenic source of atmospheric CH4.
Research worldwide indicates that organic amendments, water management, fertilizer
management and candidate rice cultivars affect the flux of CH4 from this economically important
ecosystem. Studies conducted under the IRRI-UNDP Interregional Research Program at India
using automatic measurement system have clearly indicated that (I) although organic amendment
increased CH4 flux under rainfed conditions, application of Azolla resulted in a lower CH4 flux
per ton of grain yield; (II) CH4 emission was reduced by 15% when intermittent irrigation was
practiced during the dry season; and (III) agrochemicals like herbicide butachlor distinctly
inhibited CH4 flux.
References :
1. Adhya,T.K.,Bharati.K., Mohanty, S.R., Mishra,S.R.,Rao,V.R. and sethunathan.N.2000. Methane emission from rice fields at Cuttack ,India. Nutr.Cycling.Agroecosyst.58:95-105.
2. Bharati.K., Mohanty, S.R.Singh, D.P.Rao, V.R.and Adhya, T.K. 2000. Influence of incorporation or dual croppping of Azolla on Methane emission from a flooded alluvial soil planted to rice in Eastern India. Agric.Ecosyst.Environ.79:73-83.
3. Mohanty, S.R., Bharati, K., Moorty, B.T.S. Rao,V.R., Sethunathan,N.,and Adhya, T.K., 2001. Effect of herbicide butachlor on methane emission and ebulltion flux from a direct seeded flooded rice field. Biol. Fertil. Soils 33:175-180.
4. Mohanty S R, Nayak D R, Babu Y J, 2004. Inhibition of methane production and oxidation by butachlor in different soils. Microbiological Research. 159(3):193-201.
5.
302

Winter School on “Waste recycling and resource management”-Dec. 3-23, 2014
Understanding the concept of Soil Quality Assessment
S.Kundu
Indian Institute of Soil Science (ICAR), Bhopal(MP)
Soil degradation (~ 57% of the cultivated area) both in irrigated and rain-fed agro-ecosystems is a major threat to agricultural sustainability and environmental quality in India. A perceived decline or stagnation in crop yield, partial factor productivity of inputs and also quality of the produce is the fall out of such degradation. To arrest such degradation and decline in productivity, soil testing service has been put in place that stipulates an analysis of a few straitjacket soil parameters for recommendation of fertilizer requirements and occasionally soil amendments for ameliorating any adverse soil conditions. But such testing for a few parameters has proved to be inadequate to meet the needs for a sustainable use of soil and its protection against degradation. A holistic approach that encompasses all the soil degrading forces arising out of natural and anthropogenic activities for intensive cultivation with an ecosystem perspective is needed. Assessment of soil quality - fitness for use, and its resilience – ability to recover, and identification of diagnostic recovery modules are the only options. Such an assessment will involve integration of physical, chemical and biological functions with parameters that emerge at the systems/process level. As such it will be unique for each soil type, cropping system and catchment area.
Development of such a diagnostic tool with simple, robust and process based indicators, both quantitative and qualitative, will help to discern mechanistically why a particular (management/cropping) system is favourable or unfavourable to soil health, its casualty and the rate and degree of recovery (i.e. its resilience) of a degraded system on rehabilitation measures, if undertaken. On operation, the tool will help to evolve management practices that optimize the combined goals of high crop production, low environmental degradation, and a sustained soil resource. Importance of Soil Quality Assessment
The industrialization of agriculture and the concomitant increase in societal concerns on environmental protection and food quality in industrialized countries (Schjonning et al., 2004) on the one hand, and continued land resources degradation and ‘basic human needs insecurity’ in developing countries on the other, have put the focus on agricultural management and its impact on soil quality. The need for assessing SQ as an element of agro-ecosystem sustainability is a rational response to these societal concerns. Most SQ research efforts intend to use science for better decision making regarding soil management practices and to make the best use of the finite soil, water and energy resources (Doran, et al., 1996; Herrick, 2000; Karlen et al., 2001). SQ monitoring supports land managers to scrutinize the sustainability of land use systems. In other words, understanding SQ leads to management systems that optimise soil functions for the current and future generations. Improving SQ can provide economic benefits in the form of increased productivity; nutrient and pesticides use efficiency, water and air quality enhancement and amelioration of greenhouse gases. However, the primary objectives of SQ management may vary depending on ecological or socioeconomic circumstances.
303

Winter School on “Waste recycling and resource management”-Dec. 3-23, 2014
Concept of Soil Quality
The term and concept of soil quality evokes various responses depending on our scientific and social backgrounds. Presently, soil quality has been defined by some scientists as the “fitness for use and by others as the “capacity of the soil to function”, whereas the definition of soil quality as proposed by Karlen et al. (1997b):
“The capacity of a specific kind of soil to function, within natural or managed ecosystem boundaries, to sustain plant and animal productivity, maintain or enhance water and air quality, and support human health and habitation.”
Traditionally, the quality of soil has been mainly associated with its productivity, whereas more recently, the definition has been expended to include the capacity of a soil to function within ecosystem environmental quality, and promote plant and animal health. Soil quality depends on a large number of chemical, physical, biological and biochemical properties, and its characterization requires the selection of the properties most sensitive to change in management practices.
Soil function describes what the soil does. Larson and Pierce (1991) defined three major functions of soil; (1) a medium for plant growth, (2) regulating and partitioning of water flow through the environment, and (3) serving as an effective environmental filter. The key soil functions as described by Karlen et al. (1997b) are given below:
1. Sustaining biological activity, diversity, and productivity: 2. Regulating and partitioning water and solute flow; 3. Filtering, buffering, degrading, immobilizing, and detoxifying organic and inorganic
materials, including industrial and municipal by-products and atmospheric deposition; 4. Storing and cycling materials and other elements within the earth’s biosphere; and 5. Providing support of socioeconomic structures and protection for archeological treasures
associated with human habitation. Soils vary naturally in their capacity to function; therefore, quality is specific to each kind of
soil. Soil quality includes an inherent and a dynamic component (Carter, 2002). With respect to inherent properties, a soil is a result of the factor of soil formation- climate, topography, vegetation, parent material, and time. Each soil, therefore, has an innate capacity to function, e.g., some soil will be inherently more productive or will be able to partition water much more effectively than others. This view of the definition is useful for comparing the abilities of one soil against another, and is often used to evaluate the worth or suitability of soil for specific uses. For example, a loamy soil will have a higher water holding capacity than a sandy soil; thus, the loamy soil has a higher inherent soil quality. This concept is generally referred to as soil capability. Map unit descriptions in soil survey reports are based on differences in the inherent properties of soils. Dynamic SQ, however, refers to the condition of soil that is changeable in a short period of time largely due to human impact and management (Carter, 2002). For example, a farming system that does not protect the surface layer from erosion results in the loss of clay and other finer sized soil particles, organic matter, nutrients, and other beneficial properties. In most cases, this eroded soil would be considered impaired or of a lesser quality. Some management practices, such as the use of cover crops, increase organic matter and can have a positive effect on soil quality. Other management practices, such as tilling the soil when wet,
304

Winter School on “Waste recycling and resource management”-Dec. 3-23, 2014
adversely affect soil quality by increasing compaction. This view of soil quality requires a reference condition for each kind of soil with which changes in soil condition are compared, and its currently the focal point for the term “soil quality”.
Potential Soil Quality Indicators and Criteria for Selection
Soil quality cannot be measured directly, but must be inferred from measuring changes in its attributes of the ecosystem, referred to as indicators. Indicators can be physical, chemical, and biological properties, processes, or characteristics of soils. They can also be morphological or visual features of plants. Indicators are measured to monitor management induced changes in the soil. Indicators of soil quality should give some measure of the capacity of the soil to function with respect to plant and biological productivity, environmental quality, and human and animal health. For example, soil organic matter is a widely used indicator, because it can provide information about a wide range of properties such as soil fertility, soil structure, soil stability, and nutrient retention. Similarly, plant indicators, such as rooting depth, can provide information about the bulk density or compaction of the soil. They should also be used to assess the change in soil function within land use or ecosystem boundaries. Doren and Parkin (1994) have defined a set of specific criteria that indicators of soil quality must process; they should (1) encompass, ecosystem processes and relate to process oriented modeling, (2) integrate soil physical, chemical, and biological properties and processes, (3) be accessible to many users and applicable to field conditions, (4) be sensitive to variations in management and climate, and (5) where possible, be components of exisisting soil data bases. Also indicators should be easily measured and measurements should be reproducible. Figure 1 represents critical soil functions such as nutrient cycling, physical stability and support, resistance and resilience, and water relations for indicator selection. Corresponding to the critical soil functions, indicators were selected based on several additional criteria (Table 1) including climate, crop type or rotation, tillage practice(s), assessment purpose, and inherent soil properties (such as OM class,texture, slope, degree of weathering and pH) (Andrews et al., 2004).
305

Winter School on “Waste recycling and resource management”-Dec. 3-23, 2014
Fig.1 Potential management goals and associated soil functions used to select appropriate SQ indicators (Adapted from Andrews et al., 2004) Table 1 Selection rules for some potential indicators of the supporting soil functions (Adapted from Andrews et al., 2004)
PMN = potentially mineralisable nitrogen, MBC= microbial biomass carbon, AGG = Aggregate stability, BD= Bulk density, AWC= Available water capacity, EC = Electrical conductivity, SAR = Sodium absorption ratio
306

Winter School on “Waste recycling and resource management”-Dec. 3-23, 2014
Role of Minimum Data Set for Soil Quality Assessment
Indicators can be assessed by qualitative and/or quantitative techniques. A qualitative assessment is the determination of the nature of an indicator. A quantitative assessment is the accurate measurement of an indicator. For example, if erosion is the indicator being evaluated, a qualitative assessment would be the observation of rills and gullies in the field, indicating that erosion is occurring. A quantitative assessment would measure the amount of erosion occurring in the field. In another example, a qualitative assessment of infiltration would be the observation of excessive runoff water from a field. A quantitative assessment would measure the infiltration rate. Qualitative assessments have an element of subjectivity and, thus, are best done by the same person over time to minimize variability in the results. Indicators measured with a quantitative method have a precise, numeric value. Therefore, different people conducting the same measurement should be able to produce very similar results.
Since it is impractical to measure every ecosystem or soil property, many researchers have proposed a minimum data set, which is the smallest set of soil properties or indicators needed to measure or characterize soil quality. Identifying key soil properties or attributes that are sensitive to change in soil functions establish a minimum data set. Among the soil parameters, (1) SOM, (2) soil structure, (3) soil and rooting depth, (4) infiltration and bulk density, (5) water holding capacity, (6) pH, (7) electrical conductivity, (8) available nitrogen, (9) phosphorus, (10) potassium, (11) microbial biomass carbon and nitrogen, (12) potentially mineralisable nitrogen, and (13) soil respiration are generally proposed as potential members of MDS (Doran et al, 1996; Seybold et al, 1998; Doran and Parkin, 1994). Additional parameters may be included depending on the local circumstances of the soil and the objectives of the study. Each minimum data set is tailored to a particular region or soil map unit (soil type) and includes only those properties relevant to the soil types, farming system, and land uses of the areas being evaluated. The suite of indicators used for assessing soil quality can vary from location to location depending on the kind of land (e.g., rangeland, wetland, agricultural land) or land use, soil function, and the soil forming factors. Different kinds of land uses may require increased capacities of certain soil functions and, thus, require certain indicators over others for assessment. For example, a wetland soil has a different role than a agricultural soil for the soil function, partitioning of water. Therefore, infiltration would not be a useful indicator of wetland soil quality, but would be very useful for assessing the quality of most agricultural soils. Soil organic matter (SOM) includes a number of fractions such as the light fraction, microbial biomass, water-soluble organics, and human (stabilized organic matter) of soils. It is one of the more useful indicators of soil quality, because it interacts with other soil components; affecting water retention, aggregate formation, bulk density, pH, buffer capacity, cation exchange properties, mineralization, sorption of pesticides and other agrichemicals, colors (facilitate warming), infiltration, aeration and activity of soil organism. It is the interaction of the various components of a soil that produce the net effects and not organic matter acting alone. In addition to the amount of SOM, its quality is also an important indicator of soil quality. For example, organic matter derived from manure differed in quality from organic matter derived from fertilized plots after 90 years of cropping. The fertilized plots contained organic matter with a greater chemical reactivity, which was attributed to a larger amount in the silt-sized fraction. The biologically active components of SOM (e.g., constituents of soil microbial biomass, and energy sources like organic C and N) have been shown to be some of the more sensitive indicators of initial changes in soil due to management. Organic matter can have a tremendous effect on the
307
Winter School on “Waste recycling and resource management”-Dec. 3-23, 2014
capacity of a soil to function; it has been recommended to be a basic component in every minimum data set for assessing soil quality. Soil quality index (SQI) Computation
To determine a soil quality index, four main steps are followed: (i) define the goal, (ii) select a minimum data set (MDS) of indicators that best represent soil function, (iii) score the MDS indicators based on their performance of soil function and (iv) integrate the indicators score into a comparative index of soil quality.
To select a representative minimum data set (MDS) only those soil properties that showed significant treatment differences has to be selected. Significant variables are chosen for the next step in MDS formation through principle component analysis (PCA). Principal components (PC) for a data set are defined as linear combinations of variables that account for maximum variance within the set by describing vectors of closet fit to the “n” observation in “p”-dimensional space, subject to being orthogonal to one another. The principal components receiving high eigen values and variables with high factor loading are assumed to be variables that best represent systems attributes. Therefore, only the PCs with eigen values >1 and those that explain at least 5% of the variation in the data has to be used. Within each PC, only highly weighted factor are retained for MDS. Highly weighted factor loadings are defined as having absolute value within 10% of the highest factor loading. When more than one factor is retained under a single PC, multivariate correlation coefficients are employed to determine if the variables could be considered redundant and therefore eliminated from the MDS.
After determining the MDS indicators, every observation of each MDS indicator is transformed using a linear scoring method. Indicators are arranged in order depending on whether a higher value was considered “good” or “bad” in terms of soil function. For ‘more is better’ indicators, each observation is divided by the highest observed value such that the highest observed value receives a score of 1. For ‘less is better’ indicator, the lowest observed value (in the numerator) is divided by each observation (in the denominator) such that the lowest observed value receives a score of 1. Once transformed, the MDS variables for each observation are weighted using the PCA results. Each PC explains a certain amount (%) of the variation in the total data set. This percentage, divided by the total percentage of variation explained by all PCs with eigenvectors >1, provides the weighted factor for variables chosen under a given PC. Then the weighted MDS variables scores for each observation were summed up using the following equation:
n SQI = Σ….WiSi
i=1 Where Si is the score for the subscripted variable and Wi is the weighing factor derived
from the PCA. Therefore, the assumption is that higher index score meant better soil quality or greater performance of soil quality or greater performance of soil function. Shortcomings of soil quality concept and analysis
Although the SQ concept and assessment approaches have been used worldwide under different socio-economic circumstances and ecological settings, the concept, scope and the tools
308

Winter School on “Waste recycling and resource management”-Dec. 3-23, 2014
of analysis have been strongly criticized. As a summary, the drawbacks regarding soil quality concept and its assessment are discussed as follows:
Lack of standard: In the SQ analysis, there is no standard to which SQ indicators can be compared, but higher soil quality index (SQI) numbers are interpreted as higher soil quality.
Lack of functional relationship: Establishing a functional relationship between SQ and SQ indicators is decisive in SQ assessment. However, such functional relationships cannot always be established empirically. This is particularly true for indicators with only indirect effects on plant growth, such as SOM and water stable aggregates. Consequently, there is a potential subjectivity and opportunity for value laden biases that may skew the analyses.
Weighting factor: There is a lack of clarity as to what weighting factors should be given to individual indicator values.
Adding indicators values: The appropriateness of summing the indicator values to get an index is doubtful.
Index values to compare: Assuming a reliable SQI can be determined, there is confusion and contradiction as to which SQI values can be compared. Possible scenarios include: 1. Comparing all soils 2. Comparing temporal or spatial variation and 3. Comparing treatment or management-induced changes on a single soil.
Water quality not addressed: although some soil properties promoted as positive for SQ can greatly increase the probability of surface and groundwater degradation, the SQ paradigm does not address water quality issues.
Crop specificities: Although crops differ in their response to many soil attributes, and a soil of high quality for one crop may be low quality for another, no consideration is given to crop specificity. Conclusion
As a result of increasing demographic pressure, intensive land use and improper soil management, soils encounter diversity of constraints broadly on account of physical, chemical and biological soil health leading to deterioration in soil quality (SQ) and ultimately end up with poor functional capacity. SQ decline severely impacts the environment and agricultural viability, and thus ecosystems and the population’s health, food security, and livelihoods. Despite of growing concern of threat from land degradation on land productivity and ecosystem sustainability, few studies have been made to evaluate and monitor soil quality. Understanding the response of soils to agricultural management practices over time helps to evaluate whether the investigated practices maintain or improve soil quality. Therefore, SQ assessment plays an important role to monitor the effect of management systems on SQ attributes and to avoid practices that damage SQ and negatively affect its capacity to function.
309

Winter School on “Waste recycling and resource management”-Dec. 3-23, 2014
Reference:
Andrews, S.S. Karlen, D.L. and Cambardella, C.A. (2004). The Soil Management Assessment Framework: A quantitative soil quality evaluation method with case studies. Soil Science Society of America Journal.
Carter, M.R. (2002). Soil quality for sustainable land management: Organic matter and aggregation interactions that maintain soil functions. Agronomy Journal, 94: 38-47.
Daily, G.C., Matson, P.A. and Vitousek, P.M. (1997). Ecosystem services supplied by soil. P. 113-132. In: Daily, G. C. (ed.): Nature’s Services: Societal dependence on natural ecosystems. Island Press, Washington, DC.
Doran, J.W. and Parkin, T.B. (1994). Defining and assessing soil quality. In Defining Soil Quality for a Sustainable Environment (J.W. Doran, D.C. Coleman, D.F. Bezdicek, and B.A. Stewart, Eds.), Soil Science Society of America, Inc, Madison, WI, USA, pp. 3–21.
Doran, J.W., Sarrantonio, M. and Liebig, M.A. (1996). Soil health and sustainability. Advances in Agronomy, 56: 1–54.
Harris, R.F., Karlen, D.L. and Mulla, D.J. (1996). A conceptual framework for assessment and management of soil quality and health. P. 61-82. In: Doran, J.W. and Jones, A.J. (ed.): Methods for Assessing Soil Quality. SSSA Special Publication 49. SSSA, Inc., Madison, WI.
Herrick, J.E. (2000). Soil quality: an indicator of sustainable land management. Applied Soil Ecology, 15: 75–83.
Karlen, D.L., Andrews, S.S. and Doran, J.W. (2001). Soil quality: current concepts and applications. Advances in Agronomy, 74: 1-40.
Karlen, D.L., Mausbach, M.J., Doran, J.W., Cline, R.G., Harris, R.F. and Schuman, G.E. (1997). Soil quality: a concept, definition, and framework for evaluation. Soil Science Society of America Journal, 61: 4-10.
Larson, W.E. and Pierce, F.J. (1991). Conservation and enhancement of soil quality. In Evaluation for sustainable land management in the developing world, vol. 2: Technical papers. International Board for Research and Management (Ed.).
Schjonning, P., Elmholt, S. and Christensen, B.T. (2004). Soil quality management concepts and terms. P. 1-15. In Managing soil quality challenges in modern agriculture. (Schjonning P. S. Elmholt and B.T. Christensen, Eds.), CABI publishing.
Seybold, C.A., Mausbach, M.J., Karlen, D.L. and Rogers, H.H. (1998). Quantification of soil quality. P. 387-404. In: Lal, R., Kimble,J.M., Follett, R.F., Stewart, B.A. (Eds.), Soil Processes and the Carbon Cycle. CRC Press, Washington, DC, USA.
Sparling, G.P. (1997). Soil microbial biomass, activity and nutrient cycling as indicators of soil health. P. 97-119. In: Pankhurst et al. (ed.): Biological Indicators of Soil Health. CAB International, New York, NY.
310

Winter School on “Waste recycling and resource management”-Dec. 3-23, 2014
Long-term use of organics on soil physical health
K. M. Hati Indian Institute of Soil Science, Bhopal
Organic matter is a temporary product - a stage in a natural cycle of decay or decomposition of plant and animal residue. Soil organic matter (SOM) is dynamic. It changes continually through further decomposition. Dead plant matter provides food for micro-organisms that in turn die and make a contribution to the total organic content of the soil. Soil organic matter is composed of plant and animal matter in different stages of decay, making it a complex and varied mix of materials. The SOM contributes to a variety of biological, chemical and physical properties of soil and is essential for good soil health. Soil health is important to optimize productivity in agricultural systems. The physical properties of soil are affected by the amount and type of organic matter present in the soil. The organic matter basically acts as biological "glue" that cements individual soil particles together into aggregates. Thus, it affects soil structure and therefore the retention and movement of water and air into, in and out of the soil. Some organisms such as earthworms while feeding on organic matter modify the structure of the soil and improve its porosity.
Functions of soil organic matter
Soil organic matter (SOM) is a key indicator of soil health because it plays an important role in a number of key functions. These functions can be divided into three types: 1. Biological functions of SOM
• Provides nutrients and habitat for organisms living in the soil • Provides energy for biological processes • Contributes to soil resilience (the ability of soil to return to its initial state after a
disturbance, for example after tillage).
2. Chemical functions of SOM • Measure of nutrient retention capacity • Provides resilience against pH change • Main store of many key nutrients especially nitrogen and potassium.
3. Physical functions of SOM
• Binds soil particles into aggregates improving soil structural stability • Enhances water holding capacity of soil • Moderates changes in soil temperature.
311
Winter School on “Waste recycling and resource management”-Dec. 3-23, 2014
There are often strong interactions between these different functions. For example, the biological function of providing energy that drives microbial activity also results in improved structural stability and creates organic materials that can contribute to nutritional capacity and resilience to change.
Optimizing the benefits of soil organic matter
Managing soil organic matter for a maximum contribution to soil health and resilience can present a challenge. Decomposition and mineralization of organic matter are required for functions such as provision of energy and nutrients. However, the maintenance or increases in organic matter help to maintain its positive effects on soil chemical and physical properties and to sequester carbon in soil which will help in addressing the problem of future climate change through mitigation. Freshly added or partially decomposed plant residues and their non-humic decomposition products constitute the labile organic matter pool. The more stable humic substances tend to be more resistant to further decomposition. The labile soil organic matter pool regulates the nutrient supplying power of the soil, particularly of nitrogen (N), whereas both the labile and stable pools affect soil physical properties, such as aggregate formation and structural stability. When crops are harvested or residues burned, organic matter is removed from the system. However, the loss can be minimized by retaining plant roots in the soil and leaving crop residues on the surface as practiced under conservation agriculture. Organic matter can also be restored to the soil through growing green manures, cuttings from agroforestry species and the addition of manures and compost. Soil organic matter is the key to soil life and the diverse functions provided by the range of soil organisms.
When selecting management scenarios to optimize the benefits of soil organic matter the following needs to be considered for each particular site: • what are the most important functions that organic matter provides? • how big is the contribution of organic matter to soil health and resilience?
Management actions that optimize the provision of these functions and maintain the contribution to soil health and resilience will ensure maximum benefit from soil organic matter.
Physical Properties
Organic matter influences the physical conditions of a soil in several ways. Plant residues that cover the soil surface protect the soil from sealing and crusting by raindrop impact, thereby enhancing rainwater infiltration and reducing runoff. Increased organic matter also contributes indirectly to soil porosity (via increased soil faunal activity). Fresh organic matter stimulates the activity of macro-fauna such as earthworms, which create burrows lined with the glue-like secretion from their bodies and intermittently filled with worm cast material. Surface infiltration depends on a number of factors including aggregation and aggregate stability, pore continuity and stability, the existence of cracks, and the soil surface condition. Organic matter also contributes to the stability of soil aggregates and pores through the bonding or adhesion properties of organic materials, such as bacterial waste products, organic gels, fungal hyphae and worm secretions and casts. Besides this, the quality of the crop residues, in particular its chemical composition, determines their effect on soil structure and aggregation. Moreover,
312

Winter School on “Waste recycling and resource management”-Dec. 3-23, 2014
organic matter intimately mixed with mineral soil materials has a considerable influence in increasing moisture holding capacity.
Soil structure and Aggregate stability
The formation and stability of soil aggregates depends on the nature of the organic inputs. Such as, easily decomposable products have an intense and transient effect on aggregate stability, while more recalcitrant ones, such as lignin and cellulose, have a lower but longer-lasting effect. The organic matter stabilizes soil structure by at least two different mechanisms: by increasing the inter-particle cohesion within aggregates and by enhancing their hydrophobicity, thus decreasing their breakdown, e.g. by slaking.
The concept of aggregation as a process involving different organic binding agents at different scales was pioneered by Tisdall and Oades (1982) and based on their work, Oades and Waters (1991) introduced the concept of aggregate hierarchy. Large aggregates (>2000μm) were hypothesized to be held together by a fine network of roots and hyphae in soils with high SOC content (>2%), while 20-250μm aggregates consist of 2-20μm particles, bonded together by various organic and inorganic cements. Water stable aggregates of 2-20μm size, in turn, consist of <2μm particles, which are an association of living and dead bacterial cells and clay particles. The concept of aggregate hierarchy suggests that organic matter controls aggregate stability, and degradation of large (relatively unstable) aggregates creates smaller, more stable aggregates. Stabilization of macro-aggregates occurs mainly via binding by fungal hyphae and roots. Particulate organic matter, on the other hand, serves as a substrate for microbial activity, resulting in the production of microbial bonding materials for micro-aggregates and for the encrustation of plant fragments by mineral particles. In this model, three principal organic binding agents are involved in the aggregate formation and stabilisation: transient, temporary and persistent organic matter. Transient organic binding agents are rapidly decomposed by micro-organisms and are thought to be mostly composed of glucose-like components (mono and polysaccharides), effectively lasting only for a period of a few weeks, after which their effect diminishes. Temporary organic binding agents are thought to consist of roots and hyphae and may persist for months and years. Persistent organic binding agents are composed of degraded humic materials mixed with amorphous forms of Fe and Al and Al-silicates. Tisdall and Oades (1982) proposed that the ‘fresh’ or ‘active’ part of SOM (consisting of mono- and polysaccharides, exudates from roots and fungal hyphae) was largely responsible for stabilisation of aggregates. They attributed the key aspect of aggregate formation by polysaccharides to the presence of functional groups, which upon deprotonation, become negatively charged and interact with positively charged oxides, producing stable organic-inorganic microstructures (Oades et al., 1989). However, they found that due to the variability of organic matter, the strength and time for formation of aggregates varied. For example, glucose-like components acted strongly in aggregate formation for the first 2-3 weeks of the experiment after which the effect declined. Based on these data, it is apparent that a specific group or groups of organic matter are key agents for aggregate formation and maintenance of structural stability in soils. Puget et al. (1995) stated that the type of organic matter was more critical to structural stability than the net amount of organic matter. However, there is no general agreement as to the type of organic matter essential for aggregation. This is most likely due to the fact that different types of organic matter perform different functions at different times during the aggregate formation and
313

Winter School on “Waste recycling and resource management”-Dec. 3-23, 2014
conservation process. In fact, Kay and Angers (1999) suggested that most or all SOC fractions were involved to different degrees in aggregate formation and stabilization. The following studies illustrate different phases of aggregate formation and types of organic components involved.
Figure 1. Graphical presentation of model by Ketterings et al. (1997), representing the relationship between percentage total carbon in dry sieved aggregates, percentage total clay of bulk soil, and water stability of 4-10 mm aggregates. The model explained 67% of the total variability in water- stability of aggregates of this size class (Ketterings et al., 1997).
Many researchers has shown that hydrophobic components of SOM give more effective stability of soil aggregates on different soils like, chermozem, grey soils, podzolic, ferralitic and other soils. Hydrophobic components generated and remaining stationary in soil profile form the hydrophobic surfaces of soil mineral particles. The amphiphilic molecules of SOM as usual have hydrophilic and hydrophobic components. In the presence of water hydrophilic compounds are connected with soil mineral surfaces, which are also hydrophilic. So, these polarized mineral and organic compounds form the stable linkage. But another part of the same SOM molecule, the hydrophobic one, forms the stable hydrophobic linkage to the same part of another molecule. Aggregate with two mineral particles is unstable. On the contrary, if the amphiphilic molecules of SOM present in inter-particle space so polarized parts (hydrophilic) are combined readily with the hydrophilic surface of soil mineral particles. But the hydrophobic parts of SOM molecules enter into chemical hydrophobic combinations with each other. New energy connections, holding particles together, are formed. Mechanism of water stability of soil aggregates is thus governed by amphiphilic fragments of SOM molecules, which form inter-particle connections in the system “mineral particle hydrophyllic-hydrophobic components of SOM + hydrophobic-hydrophilic components of SOM-mineral particle.”
314

Winter School on “Waste recycling and resource management”-Dec. 3-23, 2014
Water-Holding Capacity An important indicator of soil physical fertility is the capacity of soil to store and supply water and air for plant growth. The ability of soil to retain water is termed water holding capacity (WHC). In particular, the amount of plant-available water in relation to air-filled porosity at field capacity is often used to assess soil physical fertility. Total plant available water (PAW) is the amount of water held between the wettest drained condition (field capacity FC, at matric suction of -10 kPa) and the water content at which plants are unable to extract water (permanent wilting point PWP, at matric suction of -1500 kPa). However, some studies use -10 kPa for coarse textured soils only and use -33 kPa for fine-textured soils (Bauer and Black, 1992). The WHC of soils is controlled primarily by the number of pores and pore-size distribution of soils, and by the specific surface area of soils. In turn, this means that with an increase in SOC content, there is increased aggregation and decreased bulk density which tends to increase the total pore space as well as the number of small pore sizes (Khaleel et al., 1981; Haynes and Naidu, 1998). These relationships highlight the interconnectivity between soil structure, bulk density and WHC. The effect of organic carbon on the WHC of soil is generally assumed to be positive but the types of carbon responsible for this effect and synergistic behaviour with other soil properties is not well understood.
Analysis done by Kay et al. (1997) predicted that an increase in SOC content of 0.01 kg kg
-1 would increase PAW from 0.02 to 0.04 m
3 m
-3, with the largest increase occurring in coarse-
textured soils. Their predictions further showed that an increase in SOC increased WHC at FC and PWP across a range of clay contents. However, the increase at FC tended to be greater than at PWP and the effect of increasing SOC on PAW diminished as clay content increased. Most studies show a positive relationship between increase in WHC and increase in SOC; however, the fact that some studies show little or no effect suggests that SOC threshold values and/or specific SOC components are required for WHC to be increased.
315
Winter School on “Waste recycling and resource management”-Dec. 3-23, 2014
Fig 2. Technological options for enhancing C pool in soil and ecosystems (Lal, 2002).
Fertilizer effect on soil physical properties
Fertilizers are applied to soils in order to maintain or improve crop or pasture yield. The increased plant biomass produced by fertilizer results in increased return of organic material to the soil in the form of decaying roots, litter and crop residues. Mineral fertilizers indirectly influence soil organic matter content by increasing crop productivity and thereby the amount of organic matter returned to the soil in various crop residues. The effect of mineral fertilizers may therefore be compared to that of straw incorporation. But when animal manure with a plant nutrient content equivalent to that of the mineral fertilizer dressing is applied, the soil receives an additional input of organic material which contributes to the soil organic matter pool. The increase in organic matter formed due to mineral fertilizer-induced crop yield increases is generally of a more aromatic nature and thus has a higher CEC than that formed due to organic fertilizer (farmyard manure) addition (Schjønning et al., 1994). Increased organic matter inputs stimulate the microbial and faunal activity of the soil and consequently favor improved soil physical conditions. Increasing soil organic matter content characteristically leads to a decrease in bulk density, and surface crusting and an increase in water holding capacity, macroporosity, infiltration capacity, hydraulic conductivity and aggregation. These aspects are discussed below in detail:
a. Structure and aggregation: Soil aggregates are the basic unit of soil structure and are composed of primary particles and binding agents (Tisdall and Oades, 1982, Haynes et al., 1981). Soil aggregation is the process by which aggregates of different sizes are joined and held together by different organic and inorganic binding agents. In surface soils, organic matter is the main binding agent responsible for the water stability of soil aggregates by the formation of clay humus complex. The aggregate stability is positively correlated with the soil organic carbon content (Hati et al., 2008). So it is expected that addition of organic-fertilizers or materials rich in organic carbon such as manure or sludge will lead to an improvement of the aggregation status of soil. Long-term fertilizer studies have shown that application of fertilizers to soil induces an increase in number and size of water stable aggregates. Inorganic fertilizer additions can also have physico-chemical effects on soil which influence soil aggregation. Phosphatic fertilizers and phosphoric acid can favour aggregation by the formation of Al or Ca phosphate binding agents whilst where fertilizer NH4
+ accumulates in the soil at high concentrations, it behaves like Na+ and causes dispersion of clay colloids.
b. Bulk density and porosity: Application of organic-fertilizer in long-term normally reduces the bulk density of the soil due to higher organic matter content of the soil, better aggregation and consequent increase in volume of pores and increased root growth. Furthermore, addition of large quantity of organic manure or wastes reduces the bulk density of the soil due to a dilution effect caused by mixing of the added organic material with the denser mineral fraction of the soil (Khaleel et al., 1981). Organic fertilizer addition leads to an increase in total pore volume of the soil. Besides total pore volume, pore size distribution also changes with fertilization. Organic matter addition through sludge and compost increases the
316
Winter School on “Waste recycling and resource management”-Dec. 3-23, 2014
percentage of transmission (50-500 µm) and storage (0.5-50 µm) pores while reduces the percentages of fissure (>500 µm) (Metzer and Yaron, 1987).
c. Water retention properties: Water retention by soils is controlled primarily by: (i) the number of pores and pore-size distribution of soils; and (ii) the specific surface area of soils. Because of increased aggregation with application of organic-fertilizers, total pore space in soil is increased. Furthermore, as a result of decreased bulk density, the pore-size distribution is altered and the relative number of small pores increases, especially for coarse textured soils. Organic-fertilizer application improves water retention properties of soil through its effect on pore size distribution and soil structure. Organic-fertilization increases soil-water retention more at lower suctions due to increase in micro-pores and inter-aggregate pores caused by enhanced soil organic matter content and higher activity of soil fauna e.g. earthworms and termites. At higher tensions close to the wilting point (1.5 MPa) nearly all pores are filled with air and the surface area and the thickness of water films on soil particle surfaces determine moisture retention. Following an addition of organic matter, specific surface area increases resulting in increased water holding capacity at higher tensions.
d. Water transmission properties: Fertilization indirectly influences the water transmission properties of the soil through their influence on aggregation status and on porosity. As good structural conditions are usually associated with adequate water transmission properties, it can be inferred that fertilization will generally improve the water transmission properties.
i. Hydraulic conductivity: Addition of organic manure and mineral fertilizer results better aggregation, increase in effective pore volume and an increase in continuity of pores due to enhanced root growth and formation of bio-pores, increased faunal activity and earthworm population and burrows. As soil permeability is a function of effective pore volume, increased pore volume has a positive influence on the saturated hydraulic conductivity of the soil (Hati et al., 2006).
ii. Infiltration: Infiltration through the soil surface depends on the soil surface features and the hydraulic conductivity in the underlying soil. The application of organic fertilizer generally improves both the initial and steady state infiltration rate due to the beneficial effect of fertilization on the water stability of soil aggregates, consequent reduction in crust formation and increase in hydraulic conductivity.
Detrimental effects
Excess or imbalanced application of fertilizers to soil can have some negative effect on soil physical properties. An application of ammonium containing or forming fertilizers sometimes shows adverse effect on soil aggregation. When the monovalent NH4
+ ion accumulates in soils in large amount it becomes a dominant exchangeable cation and like Na+ it favours dispersion of soil colloids (Haynes and Naidu, 1998). In many cases application of fertilizer K alone particularly in humid temperate region decrease the aggregate stability of the soil owing to an increase in the proportion of exchangeable cations present in monovalent form and leaching of Ca and Mg. Long-term application of N-containing mineral fertilizer alone in
317

Winter School on “Waste recycling and resource management”-Dec. 3-23, 2014
Alfisols of humid tropics can deteriorate the physical properties of the soil due to reduction in pH and yield of crops (Hati et al., 2008).
Application of organic fertilizers to soil at rates far in excess of traditional rates for the purpose of disposal of wastes (eg. animal manure from feed lots, composted municipal wastes and sewage sludge) also have detrimental effects on soil physical properties like surface crusting, increased detachment of soil particles by raindrops and decreased hydraulic conductivity. The primary reason for this soil structural breakdown is the high content of monovalent cations (Na+
and K+) in animal waste materials and accumulation of high concentration of NH4+ through
mineralization of N in organic wastes. Sometimes excessive NO3- formed in the animal manure
feed lot can leach down the profile and pollute the ground water. Besides this at high rate of organic matter application to soil, the soil tends to become water repellent due to production of water repellent substances by fungi involved in the decomposition of the manure (Weil and Kroontje, 1979).
References:
Bauer, A. and Black, A. L. (1992). Organic carbon effects on available water capacity of three soil textural groups. Soil Science Society of America Journal 56, 248-254.
Haynes, R. J. and Naidu, R. (1998). Influence of lime, fertilizer and manure applications on soil organic matter content and soil physical conditions: a review. Nutrient Cycling in Agroecosystems 51, 123-137.
Kay, B. D. and Angers, D. A. (1999). Soil Structure. In 'Handbook of Soil Science. (Ed M. E. Sumner.) p. A-229 - A-276. (CRC Press: Boca Raton, USA.)
Ketterings, Q. M., Blair, J. M., and Marinissen, J. C. Y. (1997). Effects of earthworms on soil aggregate stability and carbon and nitrogen storage in a legume cover crop agroecosystem. Soil Biology & Biochemistry 29, 401-408.
Khaleel, R., Reddy, K. R., and Overcash, M. R. (1981). Changes in soil physical properties due to organic waste applications: a review. Journal of Environmental Quality 10, 133-141.
Hati, K.M., Swarup, A., Singh, D., Misra A.K. and Ghosh, P.K. 2006. Long-term continuous cropping, fertilization and manuring effects on soil physical properties and organic carbon content of a sandy loam soil. Australian Journal of Soil Research 44(5): 487-495.
Hati, K.M., Swarup, A., Mishra, B., M.C. Manna, Wanjari, R.H., Mandal, K.G. and Misra A.K. (2008). Impact of long-term application of fertilizer, manure and lime under intensive cropping on physical properties and organic carbon content of an Alfisol. Geoderma 148 (2): 173-179.
Haynes, R.J. and Naidu, R., 1998. Influence of lime, fertilizer and manure applications on soil organic matter content and soil physical conditions: a review. Nutr. Cycl. Agroecosyst. 51, 123-137.
Lal, R. (2002). Soil carbon dynamics in cropland and rangeland. Environmental Pollution 116, 353-362.
318

Winter School on “Waste recycling and resource management”-Dec. 3-23, 2014
Oades, J. M. and Waters, A. G. (1991). Aggregate hierarchy in soils. Australian Journal of Soil Research 29, 815-828.
Oades, J. M., Gillman, G. P., and Uehara, G. (1989). Interactions of soil organic matter and variable-charge clays. In 'Dynamics of soil organic matter in tropical ecosystems. (Eds D. C. Coleman, J. M. Oades, and G. Uehara.) pp. 69-95. (University of Hawaii Press: Honolulu.)
Puget, P., Chenu, C., and Balesdent, J. (1995). Total and young organic matter distributions in aggregates of silty cultivated soils. European Journal of Soil Science 46 , 449-459.
Schjonning, P., Christensen, B.T. and Carstensen, B., 1994. Physical and chemical properties of a sandy loam receiving animal manure, mineral fertilizer or no fertilizer for 90 years. Eur. J. Soil Sci., 257-268.
Tisdall, J. M. and Oades, J. M. (1982). Organic matter and waterstable aggregates in soils. Journal of Soil Science 33, 141-163.
Weil, R.R., Kroontje, W. and 1979. Physical condition of a Davidson clay loam after five years of heavy poultry manure applications. J. Environ. Qual. 8, 387-392.
319

Winter School on “Waste recycling and resource management”-Dec. 3-23, 2014
EFFICIENT USE OF MANURES/COMPOSTS FOR CROP PRODUCTION IN
ORGANIC FARMING
K. Ramesh and A.B. Singh
Indian Institute of Soil Science, Nabi Bagh, Bhopal-462038
Introduction
Intensive agriculture involving greater use of synthetic agro-chemicals such as fertilizers and pesticides with adoption of nutrient responsive high yielding varieties of crops has boosted the production per hectare in most cases. However, this increase in production has slowed down and in some cases there are indications of decline in crop productivity. Further, the success of the green revolution in recent decades has often marked significant externality affecting natural resource and human health as well as agriculture itself (Subba Rao, 1999). Environmental and health problems associated with intensive agriculture have been increasingly well documented, but it is only recently that the scale of the costs has attracted the attention of planners administrators and scientists.
Increasing consciousness about conservation of environment as well as of health hazard caused by agrochemicals has brought a major shift in consumer preference towards food quality particularly in the developed countries. Global consumers are increasingly looking forward for organic food that is considered safe and chemical free. The global market for organic food is expected to touch $ 96.5 billion by 2014 (www.prlog.org). The demand for organic food is steadily rising both in developed and developing countries with annual average growth rate of 20 to 25 per cent. Worldwide, over 130 countries produce certified organic products in commercial quantities (Usha, 2006).
The concept of organic farming/manuring
Organic farming is one among the broad spectrum of production methods that are supportive of the environment. Organic production systems are based on specific standards precisely formulated for food production and aim at achieving agro ecosystems, which are socially and ecologically sustainable. It is based on minimizing the use of external inputs through use of on-farm resources efficiently compared to intensive agriculture involving the use of synthetic fertilizers, pesticides and hybrid seeds.
The use of organic manures (farmyard manure, compost, green manure, etc.) is the oldest and most widely practised means of nutrient replenishment in India, even today. Before the advent of fertilizer responsive varieties, organic manures were the sole source of soil and plant nutrition, since animal production was part of farming activity. Cattle accounted for more than
320

Winter School on “Waste recycling and resource management”-Dec. 3-23, 2014
90 percent of total manure production. The proportion of cattle manure available for fertilizing purposes decreased from 70 percent in the early 1970s to 30 percent in the early 1990s. The use of farmyard manure has almost came down to 2 tonnes/ha, farmers in Madhya Pradesh apply FYM once in 4 years only, which is much below the desired rate of 10-12.5 tonnes/ha. As two-thirds of all crop residues are used as animal feed, only one-third is available for compost making, which can add 2.5 million tonnes/year. The production of urban compost has been fluctuating around 6–7 million tonnes and the area under green manuring is about 7 million/ha.Unlike fertilizers, the use of organic material has not increased much in the last two to three decades. The estimated annual available nutrient (NPK) contribution through organic sources is about 5 million tonnes, which could increase to 7.75 million tonnes by 2025. Thus, organic manures have a significant role to play in nutrient supply. In addition to improving soil physico-chemical properties, the supplementary and complementary use of organic manure also improves the efficiency of mineral fertilizer use.
Compost
Compost can be an important part of small fruit nutrient management. In addition to adding nutrients to the soil, compost can improve long-term soil health. Composts are best when used in combination with other nutrient management strategies including raw manures, green manures, fertilizers and crop rotations. According to the National Organic Standard, compost can be applied as necessary provided the compost meets carbon to nitrogen (C:N) and temperature requirements and has not been treated with prohibited substances. When using compost it must have a C:N ratio between 25:1 and 40:1. Compost the end-product of the decomposition of organic matter, is often called black gold and is universally recognized for improving soil structure and water-holding capacity. Compost helps the soil become loose and easy to cultivate. Making and using compost is also a way to recycle organic matter, especially materials that might otherwise have been treated as home or industrial wastes.It improves the capacity of soil to hold nutrients through a complex process called cation exchange capacity. In addition, compost indirectly provides nutrients for plant use when earthworms and other organisms digest the organic matter, producing nutrient-rich castings, or excrement.These products are significantly richer in nutrients than the surrounding soil, and in a form, which is readily available to plant roots. While compost provides small amounts of nutrients and makes other nutrients more available, it is not considered fertilizer. However, in many organic gardening or farming systems, compost is the major amendment to enrich soil. Not all composts are alike. Composts and its quality vary greatly, depending upon what goes into them and how they are processed since maturity makes a difference. Maturity means that the compost has decomposed extensively and has become fairly stable. Maturity is not the same as quality. Maturity means the energy and nutrient containing materials have merged into a stable organic mass. Mature compost (also called "finished" compost) is dark-colored and has an earthy odour. Quality is the chemical composition of that mass. Source materials affect quality. Soluble salts, nutrients and contaminants vary, depending on what the source material of the compost is.Soluble salts are actually chemically charged particles
321

Winter School on “Waste recycling and resource management”-Dec. 3-23, 2014
(ions), usually from dissolved fertilizer and irrigation water, but may come from the composted material itself. While not a human health concern, concentrated soluble salts can cause problems in plant growth. Compost made from food (fruits and vegetable scraps, fish residues, coffee grounds, brewery and bakery wastes) is typically richer in nutrients, but may have high salt content.
Hot is different from cold. Composts may or may not heat up during decomposition. Particularly in small-scale home composting systems, compost may not get hot. Some tests have shown that finished cold compost may actually have a higher nutrient content than products from a hotter compost. However, weed seeds and disease organisms are more likely to be destroyed in hot compost.
Manures
Animal manures have long been a popular form of organic matter as well as fertilizer for farms and gardens. Farm manure is still the most readily available manure, purchased directly or sometimes free from the farm. It is sometimes bagged and sold in garden centers - with a wide range in its quality, nutritional content, age, and weed seeds present. It is not recommended that homeowners use any manure from dogs, cats, or other meat-eating animals, since there is risk of parasites or disease organisms that can be transmitted to humans.
Using manure: Manures differ from each other because of their source, their age, how they were stored (piled, spread, turned over or not), and the animal bedding material, which may be mixed in. For that reason it is difficult to provide precise guidance about how long manure should be aged before use, or how much to use.
Composting is the safest way to make the most of manure's nutritional potential - if the logistics of making and hauling compost are viable. For direct use in the garden, first aging manure for 6 months is a good rule of thumb. Many farmers and gardeners spread fresh manure in the fall or winter, and till or turn it in at spring planting time.
When manure is spread in the spring, even if aged, it is safest to wait for at least one month before planting crops, since the microbial activity it stimulates may interfere with seed germination or plant growth before that time.
Problems with manure: While it is one of the most readily available forms of organic matter and fertilization for many gardeners, manure can present some problems.
• The relatively high nitrogen content makes manure extremely valuable in composting, where it activates soil bacteria and contributes to rapid decomposition of organic matter. But, as a direct soil amendment, that same high nitrogen content can be a deficit. Fresh, raw, or hot manure activates and builds up soil microbial activity to the extent that the nutrients volatilize, or burn up, before plants can use them.
322

Winter School on “Waste recycling and resource management”-Dec. 3-23, 2014
• Fresh manure also can damage plant tissue and kill seedlings. An excessive amount of
soil nitrogen can pro-duce plants with a high nitrate con-tent. These high nitrate levels are not only potentially harmful to humans; they also are more attractive to pests than crops grown with less nitrogen, and do not store as well either.
• Manure also is notorious for adding undigested weed seeds to the garden, particularly from horses and other animals that eat hay. Composting in a hot system (when the pile reaches over 155 degrees F.) destroys most weed seeds, but many composting systems are inexact and seeds can come through. For that reason, those who use manure usually plan on weed-control techniques such as mulching, interplanting (growing cover crops between rows), mechanical or hand-weeding, or herbicides in some situations.
• Particularly in agriculture, manure use can pose pollution problems when rain or irrigation systems carry nitrogen from the fields before it is used by plants. Nitrogen from manure or synthetic fertilizers has been identified in New York State as a pollutant found in groundwater.
• Fresh manure must be used with caution in the garden because it may contain pathogenic bacteria such as E. coli, Listeria, and Salmonella. Although the chance of contamination is slim, severe sickness and even death may occur if contaminated produce is eaten. To be safe, either compost your manure or apply it in the fall after harvest. Wash your hands after handling manure and try to leave at least 120 days between application of fresh manure and harvest of a crop.
Soil fertility management
Organic farming is often understood as a form of agriculture with use of only organic inputs for the supply for the nutrients and managements of pest and diseases. In fact it is a specialized form of diversified agriculture wherein problems of farming are managed using local resources alone. The term organic does not explicitly mean the type of inputs used rather it refers to the concept of farm as an organism. Often organic agriculture has been criticized on the grounds that with organic inputs alone farm productivity and profitability might not be improved because the availability of organic sources is highly restricted (Chhonkar, 2003). True, organic resources availability is limited but under conditions of soil constraints and chemicals beggaries, organic inputs use have proved more profitable compared to agrochemicals (Huang et al., 1993).
Organic farming systems relay on the management of soil organic matter to enhance the chemical, biological and physical properties of the soil. One of the basic principles of soil fertility management in organic systems is that plan nutrient depends on “biologically derived nutrients” instead of using readily soluble forms of nutrients; less available forms of nutrients such as those in bulky organic materials are used. This requires release of nutrients to the plant via the activity of soil microbes and soil animals. Improved soil biological activity is also known to play a key role in suppressing weeds, pests and diseases (IFOAM, 1998).
There are several doubts in the minds of not only farmers but also scientists whether it is possible to supply the minimum required nutrients to crops through organic sources alone and even if it is possible how are we going to mobilize that much of organic matter. At this juncture,
323

Winter School on “Waste recycling and resource management”-Dec. 3-23, 2014
it is neither advisable nor feasible to recommend the switch over from fertilizer use to organic manure under all agro-ecosystems. Presently only 30 per cent of our total cultivable areas have irrigation facilities where agro-chemicals use is higher compared to rainfed zones. It is here that ingenuity and efforts are required to increase crop productivity and farm production despite of recurrence of environmental constraints of drought and water scarcity (Ramesh et al., 2005b).
The basic requirement in organic farming is to increase input use efficiency at each step of farm operation. This is achieved partly through reducing losses and partly through adoption of new technologies for enrichment of nutrient content in manures. Technologies to enrich the nutrient supply potential from manures including farm yard manure three to four times are being widely used at organic farms. According to a conservative estimate around 600 to 700 million tonnes agricultural waste is available in the country every year, but most of it is not used properly. We must convert our filth/waste into wealth by mobilizing all the biomass in rural urban areas into bioenergy to supply required nutrients to our starved soil and fuel to farmers (Veeresh, 1997). India produces about 1800 mt of animal dung per annum. Even if two-third of the dung is used for biogas generation, it is expected to yield biogas not less than 120m m3 per day. In addition the manure produced would be about 440 mt per year, which is equivalent to 2.90 mt N, 2.75 mt P2O5 and 1.89 mt K2O (Ramaswami, 1999).
Organic farm and food production systems are quite distant from conventional farm in terms of nutrient management strategies. Organic systems adopt management options with primary aim to develop whole farm like a living organism with balanced growth in both crops and livestock holding. Thus nutrient cycle is closed as far as possible. Only the nutrients in the form of food are exported out of the farm. Crop residues burning are prohibited so is the unscientific storage of animal wastes and its application in fields. It is therefore, considered as more environmental friendly and sustainable than the conventional system. Farm conversion from high chemical based system is designed after undertaking as constraint analysis for the farm with primary aim to take advantages of local conditions and their interactions with farm activities, climate, soil and environment so as to achieve as far as possible, the closed nutrient cycles with less dependence on off-farm inputs. As far as possible implies that only nutrients leaving the farm unit are those for human consumption.
Crop rotations and varieties are selected to suit local conditions having potential to sufficiently balance the crops nitrogen demand. Requirements for other nutrients like phosphorus, sulphur and micronutrients are met with local, preferably renewable resources. Organic agriculture is therefore often termed as knowledge based rather than input based agriculture. Furthermore, organic farms aim to optimize the crop productivity under given set of farm conditions. This is in contrast with the concept of yield maximization through the intensive use of agrochemicals, irrigation water and other off farm inputs.
324

Winter School on “Waste recycling and resource management”-Dec. 3-23, 2014
Principle components of managing soil fertility
Green manures
Traditionally India has been using green manures like sesbania, dhaincha, sunnhemp, wild indigo, cowpea, cluster bean, greengram, blackgram, berseem, etc either as a catch crop, shade crop, cover crop or forage crop. The green manure contributes about 60-200 kg N in about 45 to 60 days (Palaniappan, 1992). Some promising green manures are Crotolaria juncea (Sunnhemp), which is quick growing, more succulent and easy to produce seed, could accumulate 16.8 t/ha biomass with 159 kg N/ha. Sesbania aculeate (dhaincha), which could accumulate high biomass of 26.3 t/ha and is widely adapted could contributes about 185 kg N/ha. Similarly, the stem nodulating, water logging tolerant Sesbania rostrata could add biomass of 24.9 t/ha with N accumulation of 219 kg/ha. The drought tolerant self • seeding Tephrosia purpurea could produce biomass of 16.8 t/ha which contribute 115 kg N/ha. The multipurpose green manure cum fodder cum cover crop Phaseolus triobus could generate biomass of 19.6 t/ha contributing 126 kg N/ha/season.
Inclusion of green manure in the yearly cropping sequence (Rice –rice) improved good buildup of SOC fairly (Ramesh, 2002). This might be due to the following: 1. GM was totally returned to soil as C inputs (GM Organic carbon was 16.75 per cent at 40
DAS, Kaliduarai, 1989). 2. GM plants at 87 DAS had a lignin: N of 17 (McDonagh et al., 1995) 3. GM contains polyphenols, which might have combined with GM protein to render residue
recalcitrant to microbial attack and might have provided fast route to increased SOM. This corroborates the findings of Cadisch and Giller (2001).
4. Root released C of GM (It accounted for 20-40 per cent of photo synthetically fixed C from different plants, Van Veen et al., 1991).
5. Leguminous plant roots had higher C: N and lignin than leaves (Chesson, 1997; Schweizer et al., 1999) in which the latter is recalcitrant and protects cellulose from microbial attack due to its entrapment with the cell walls.
6. Cadisch et al. (1998) suggested that between 43 and 47 per cent of legume root C was undecomposable contributing to SOC buildup.
7. McDonagh et al. (1995b) found that GM leaves contained 4.47 per cent N, with nil lignin content, whereas stem contained 0.62 per cent N with 42 per cent lignin. Although the incorporated GM mineralizes immediately possibly from the lignin free leaves. But the stems might have restricted quick decomposition by the high content of lignin, in turn favouring enrichment of SOC
325

Winter School on “Waste recycling and resource management”-Dec. 3-23, 2014
Application of composted animal manures
Animal manures are the most common amendments applied to the soil. Cattle account for about 90 % of the total animal dung and nutrients. Organic manures produced from non-organic farms may be brought onto the holding but there are restrictions. The quantity of nutrients in manures varies with type of animal, feed composition, quality and quantity of bedding material, length of storage and storage conditions. In organic systems, it is particularly important to conserve manure nutrients for both economic and environmental reasons. Composting is recommended in organic farming as a management tool for control of weeds, pests and diseases.
Development of several compost production technologies like vermicomposting, phosphocomposting, N-enriched phosphocomposting, etc improves the quality of composts through enrichment with nutrient bearing minerals and other additives. These manures have capacity to fulfill nutrient demand of crops adequately and promote the activity of beneficial macro- and micro- flora in soil. (Mohan Singh, 2003). A gist of the chemical was composting of manures/composting in presented table 1.
Use of Agro-industry wastes
Press mud, coirpith, sea weed residues, cotton wastes, bagasse, biogas slurry, mushroom spent waste etc contribute substantial quantities of NPK besides secondary and micro nutrients.
Table 1. Chemical composition of different manures/composts
Manure Total N (%)
Total P (%) C:N Ratio Citrate Soluble P (%)
FYM 0.5-0.8 0.32-0.55 22.0-25.0 0.05-0.06
Ordinary compost 0.6-0.8 0.55-0.60 22.0-25.0 0.06-0.07
Biogas slurry 0.8-1.0 0.70-0.80 20.0-23.0 0.05-0.06
Vermicompost 1.0-1.2 0.50-0.60 19.0-20.0 0.07-0.08
Phosphocompost 1.2-1.4 2.00-3.50 17.0-18.0 0.90-1.20
Oil cakes and other organic manures
Oil cakes of non-edible types like castor, neem and karanji (Pongamia pinnata) as well as edible cakes like groundnut, mustard are widely used in India as organic manures due to their high NPK content. Nimbin and Nimbicidin is said to inhibit nitrification processes. Animal wastes like bone meal, fish meal etc are also rich in nutrients and are often used in organic farming. Tapping and proper utilization of such locally available organic resources could provide substantial quantity of crop nutrients in organic farming.
326
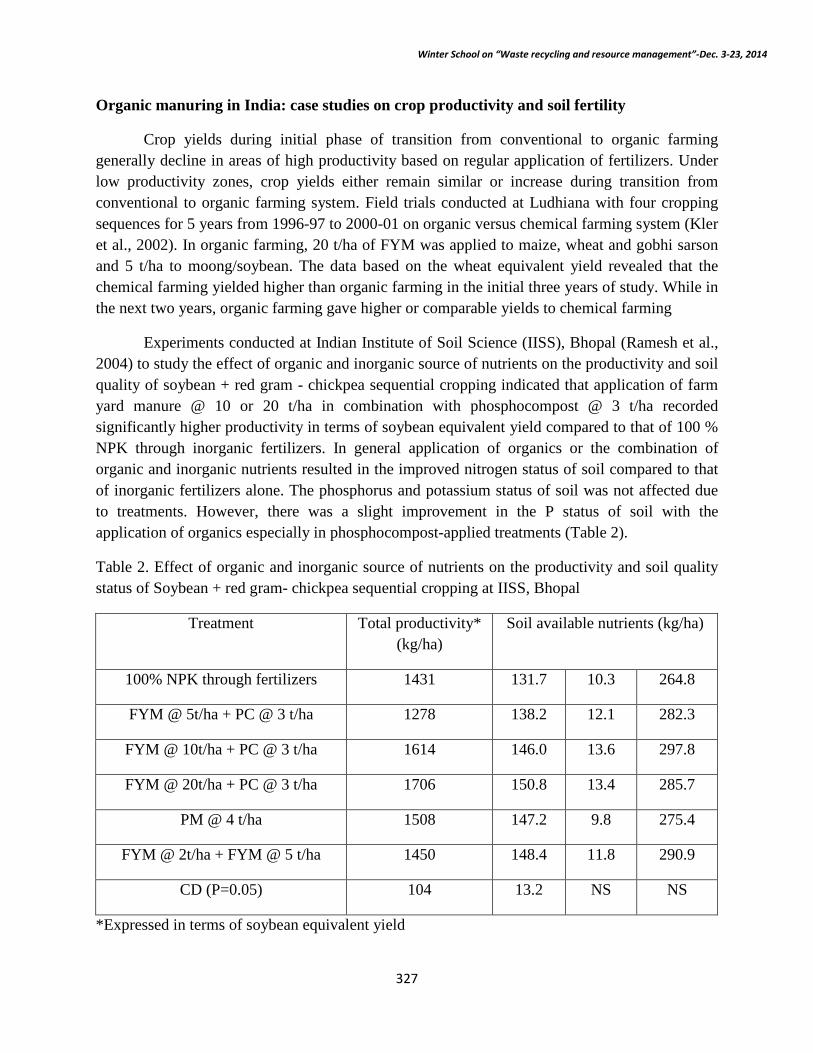
Winter School on “Waste recycling and resource management”-Dec. 3-23, 2014
Organic manuring in India: case studies on crop productivity and soil fertility
Crop yields during initial phase of transition from conventional to organic farming generally decline in areas of high productivity based on regular application of fertilizers. Under low productivity zones, crop yields either remain similar or increase during transition from conventional to organic farming system. Field trials conducted at Ludhiana with four cropping sequences for 5 years from 1996-97 to 2000-01 on organic versus chemical farming system (Kler et al., 2002). In organic farming, 20 t/ha of FYM was applied to maize, wheat and gobhi sarson and 5 t/ha to moong/soybean. The data based on the wheat equivalent yield revealed that the chemical farming yielded higher than organic farming in the initial three years of study. While in the next two years, organic farming gave higher or comparable yields to chemical farming
Experiments conducted at Indian Institute of Soil Science (IISS), Bhopal (Ramesh et al., 2004) to study the effect of organic and inorganic source of nutrients on the productivity and soil quality of soybean + red gram - chickpea sequential cropping indicated that application of farm yard manure @ 10 or 20 t/ha in combination with phosphocompost @ 3 t/ha recorded significantly higher productivity in terms of soybean equivalent yield compared to that of 100 % NPK through inorganic fertilizers. In general application of organics or the combination of organic and inorganic nutrients resulted in the improved nitrogen status of soil compared to that of inorganic fertilizers alone. The phosphorus and potassium status of soil was not affected due to treatments. However, there was a slight improvement in the P status of soil with the application of organics especially in phosphocompost-applied treatments (Table 2).
Table 2. Effect of organic and inorganic source of nutrients on the productivity and soil quality status of Soybean + red gram- chickpea sequential cropping at IISS, Bhopal
Treatment Total productivity* (kg/ha)
Soil available nutrients (kg/ha)
100% NPK through fertilizers 1431 131.7 10.3 264.8
FYM @ 5t/ha + PC @ 3 t/ha 1278 138.2 12.1 282.3
FYM @ 10t/ha + PC @ 3 t/ha 1614 146.0 13.6 297.8
FYM @ 20t/ha + PC @ 3 t/ha 1706 150.8 13.4 285.7
PM @ 4 t/ha 1508 147.2 9.8 275.4
FYM @ 2t/ha + FYM @ 5 t/ha 1450 148.4 11.8 290.9
CD (P=0.05) 104 13.2 NS NS
*Expressed in terms of soybean equivalent yield
327

Winter School on “Waste recycling and resource management”-Dec. 3-23, 2014
In another experiment at IISS, Bhopal (Ramesh et al., 2005 a), the effect of different organic sources of nutrients was tested for the productivity and soil quality of different cropping sequences. The data on the yield of different crops indicated that soybean and durum wheat recorded higher seed yield in chemical fertilized plots compared to other organic source of nutrients. However, in chickpea, mustard and isabgol, application of cattle dung manure recorded seed yields, which were on par with that of chemical fertilizers (Table 3).
Table 3. Yield of crops (kg/ha) as influenced by different source of nutrients at IISS, Bhopal
Treatment Soybean Durum wheat Chic pea Mustard Isabgol
Control 825 3566 11311 1033 990
Chemical fertilizers
1027 5165 1733 1855 1180
Cattle dung manure
952 4273 1784 1798 1253
Vermicompost 890 4468 1676 1668 1286
Biogas slurry 915 4333 1635 1466 1107
Poultry manure 940 4566 1744 1731 1186
CD=(P=0.05) 64 580 281 166 121
Application of 18 t/ha of cattle dung manure to the wheat crop is found superior compared to the application of the same quantity of cattle dung to the soybean crop alone in soybean - wheat cropping system in deep vertisols of Madhya Pradesh. This treatment improved the total productivity of the system besides improving the soil organic carbon, available N, P and K status of the soil (Ramesh et al., 2004 a).
Under rainfed conditions of IISS, Bhopal, pigeon pea was taken up as a test crop to find out the most effective source of organic nutrients in comparison to chemical fertilizers during the rainy season of 2003. The data (Table 4) indicated that among the manurial treatments, application of cattle dung manure recorded the highest seed yield, which was on par with that of chemical fertilizers. The post harvest soil data showed that the available nitrogen was the highest in poultry manure plot compared to other treatments. Organic carbon content was slightly higher in cattle dung manure than other source of nutrients (Ramesh et al., 2004 b).
328

Winter School on “Waste recycling and resource management”-Dec. 3-23, 2014
Table 4. Effect of organics on seed yield of pigeon pea and soil quality parameters at IISS
Treatment Seed yield (kg/ha)
Soil-N (kg/ha)
Soil-P (kg/ha)
Soil-K (kg/ha)
Organic carbon (%)
Chemical fertilizers
2889 134.3 13.29 588 0.58
Vermicompost 2649 137.9 14.47 574 0.56
Phosphocompost 2789 141.0 13.58 587 0.59
Poultry manure 2683 145.7 13.96 591 0.60
Cattle dung manure
2973 139.5 14.67 591 0.60
Control 1862 132.0 13.17 560 0.56
CD=(P=0.05) 240 8.2 NS NS NS
Experiment conducted at Indian Institute of Soil Science under organic farming for comparison of organic, inorganic and integrated nutrient management systems on soil quality since 2004 in pomegranate orchard. Data relation to soil organic carbon, available N and P content at the end 5th year experiment showed that highest soil organic carbon content was recorded in cattle dung manure treatment (CDM) followed by phosphocompost, Vermicompost, INM treatment and the lowest in absolute control (no fertilizers). The increase n organic carbon content in soil may be attributed to addition of organic materials through various organic sources. Available N content were recorded maximum in INM treatment followed by various organic manures application which were at par. Similarly, available P content was recorded highest in INM followed by organic and inorganic treatment and was the lowest in absolute control (Table 5).
329

Winter School on “Waste recycling and resource management”-Dec. 3-23, 2014
Table 5. Effect of organic nutrient sources on soil organic carbon and available N and P content
Treatment OC (%) N (kg/ha) P (kg/ha)
Chemical fertilizers 0.57 166 15.7
Vermicompost 0.86 208 24.3
Phosphocompost 0.87 217 28.7
Cattle dung manure 0.98 250 27.9
RDF 0.65 205 28.6
INM 0.91 260 29.7
CD=(P=0.05) 0.17 37.4 4.16
Conclusions
Application of organic manuring was earlier considered as organic farming, which has been proposed as a solution to problem associated with intensive use of agro-chemicals. It takes an ecological approach to nutrient supply and crop protection rather than a chemical one. Organic manuring proved beneficial under cropping systems approach rather than sole cropping. Crop rotation is the central tool that integrates the maintenance and development of soil fertility with different aspects of crop and livestock production in organic systems. Manures and crop residues are carefully managed to recycle nutrients in the system. Management of soil organic matter helps to ensure good soil structure and biological activity, important for nutrient supply, health and productivity of crops. The supply and management of N is more complex in organic than in conventional agriculture. The major challenge for N management in organic system is to synchronize the availability of N mineralized from manures and crop residues with crop demand. Most of the organic nutrient management practices are site specific and crop specific' Hence more research efforts are required to develop and fine-tune the nutrient management technologies to suite different ago-ecological and site-specific requirements.
330

Winter School on “Waste recycling and resource management”-Dec. 3-23, 2014
Suggested reading
Bellamy, P.H., Loveland, P.J., Bradley, R.I., Lark, R.M. and Kirk, G.J.D., 2005. Carbon losses from all soils across England and Wales 1978-2003. Nature, 437: 245-248.
Betts, R.A., 2000. Offset of the potential carbon sink from boreal forestation by decreases in surface albedo. Nature, 408: 187-190.
Bhogal A, Nicholson FA, Chambers B. (2008) Organic carbon additions: effects on soil bio-physical and physico-chemical properties. European Journal of Soil Science 60, 276-286
Bisoyi, R.N., 2000. Current advances in production and quality control of rice based biofertilizers. Proc. National workshop on Recent developments of Biofertilizers Technology for Rice Based cropping systems. T.N.A.U. Coinbatore PP.117-124
Burkitt, L. L., Small, D. R., McDonald, J.W., Wales, W.J., and Jenkin, M.L., 2007, Comparing irrigated biodynamic and conventionally managed dairy farms. 1. Soil and pasture properties. Austr. J. Exp. Agric. 47: 479-488.
Cadisch, G., and K. Giller, 2001: Soil organic matter management. The role of residue quality in C sequestration and N supply. In: R. M. Rees, B. C. Ball, C. D. Campbell, and C. A. Watson (eds), Sustainable Management of Soil Organic Matter, pp. 97—111. CABI Wallingford, UK.
Cadisch, G., O. C. de Oliveira, R. Cantarutti, E. Carralho, and S. Urquiago, 1998: The role of legume quality in soil carbon dynamics in Savannah ecosystems. In: L. Bergstorm, and H. Kirkmann (eds), Carbon and Nutrient Dynamics in Natural and Agricultural Tropical Ecosystems, pp. 53-54. CAB International, Wallingford, UK.
Cao, M.K. and Woodward, F.I., 1998. Dynamic responses of terrestrial ecosystem carbon cycling to global climate change. Nature, 393: 249-252.
Chesson, A., 1997: Plant degradation in ruminants: parallels with litter decomposition in soils. In: G. Cadisch, and K. E. Giller (eds), Driven by Nature. Plant Litter Quality and Decomposition, pp. 47—66. CAB International, Wallingford, UK
Chhonkar, P.K. 2003. Organic Farming: Science and Belief' Dr.R.V. Tamhane memorial lecture at the 68 th Annual Convention of the Indian Soc. Soil Sci., 5 November, 2003, CSAU&T KanPur.
Cox, P.M., Betts, R.A., Jones, C.D., Spall, S.A. and Totterdell, I.J., 2000. Acceleration of global warming due to carbon-cycle feedbacks in a coupled climate model. Nature, 408: 184-187.
331

Winter School on “Waste recycling and resource management”-Dec. 3-23, 2014
Derrick, J.W., and Dumaresq, D.C., 1999, Soil chemical properties under organic and
conventional management in southern New South Wales, Austr. J. Soil Res. 37: 1047- 1055.
Droogers, P., and Bouma, J., 1996, Biodynamic vs. conventional farming effects on soil structure expressed by simulated potential productivity, Soil Sci. Soc. Am. J. 60: 1552-1558.
FAO, 1999. Guidelines for the production, processing, labelling and marketing of organically produced foods. Joint FAO/WHO Food Standards Program codex Rome, CAC/GL 32, 49 P.
Gliessman, S.R. (2006). Agroecology: The Ecology of Sustainable Food System; CRC press: Boca Raton, FL, USA,
Hao Y, R. Lal, L.B. Owens, R.C. Izaurralde, and W.M. Post (2010)Soil Organic Carbon Dynamics for Different Land Uses and Soil Management Practices at the North Appalachian Experimental Watersheds in Ohio. www.netl.doe.gov /publications/ proceedings /01/carbon.../3c4.pdf
http://www.gardening.cornell.edu/factsheets/orgmatter/
Huang, S. S., Tai, S.F., Chen, T. C., and Huang, S.N., 1993. Comparison of crop production as influenced by organic and conventional farming systems. Taichung District Agricultural improvement station, Special Publication, 32: 109 -125
IFOAM, 1ggg. ln "IFOAM basic standards for organic Production and Processing" IFOAM Publications, Tholey-Tholey, Germany.
Jenkins L. J. Hathaway, R. J. Godwin, B. Pearce, R Sakrabani and A. Whitmore (2010) A comparison between conventional and organic farming practices 1: Soil physical properties. 19th World Congress of Soil Science, Soil Solutions for a Changing World 1 – 6 August 2010, Brisbane, Australia. Published on DVD.
Jenkinson, D.S., Adams, D.E. and Wild, A., 1991. Model estimates of CO2 emissions from soil in response to global warming. Nature, 351: 304-306.
Jones, C., McConnell, C., Coleman, K., Cox, P., Falloon, P., Jenkinson, D. and Powlson, D.,2005. Global climate change and soil carbon stocks; predictions from two contrasting models for the turnover of organic carbon in soil. Global Change Biology, 11: 154-166.
Kalidurai, M., 1989: Studies on nitrogen fixation and nitrogen contribution of stem nodulating Sesbania rostrata in rice soil ecosystem. MSc (Ag.) Thesis, TNAU, Coimbatore.
332

Winter School on “Waste recycling and resource management”-Dec. 3-23, 2014
Kler, D. S., Sarbjeet Singh and Walia, S.S., 2002. Studies on organic versus chemical farming.
Extended summaries Vol.1, 2nd International Agronomy Congress, November 26-30, 2002, New Delhi, India, 39-40
Knorr, W., Prentice, I.C., House, J.I. and Holland, E.A., 2005. Long-term sensitivity of soil carbon turnover to global warming. Nature, 433: 298-301.
Komatsuzaki M and M. Faiz Syuaib (2010) Comparison of the Farming System and Carbon Sequestration between Conventional and Organic Rice Production in West Java, Indonesia. Sustainability 2010, 2, 833-843
Liebig, M.A., and Doran, J.W., 1999, Impact of organic production practices on soil quality indicators, J. Environ. Qual. 28: 1601-1609.
Lützow, M., and Ottow, J.C.G., 1994, Effect of conventional and biological farming on microbial biomass and its nitrogen turnover in agriculturally used Luvisols of the Friedberg plains, Zeitschrift Pflanzenernähr. Bodenk. 157: 359-367.
Marriott, E.E., and Wander, M.M., 2006, Total and labile soil organic matter in organic and conventional farming systems, Soil Sci. Soc. Am. J. 70: 950-959.
McDonagh, J. F., B. Toomson, V. Limpinuntana, and K. E. Giller, 1995: Grain legumes and green manures as pre-rice crops in North east Thailand. II. Residue decomposition. Plant Soil 177, 127—136.
Mohan Singh, 2003.Organicfarming prospects in Indian agriculture. Souvenir of 68th Annual Convention of Indian Soc. Soil Sci. CSAU&T., Kanpur, November 4-8' 2003. 52-60.
Nix J (2007) ‘Farm Management Pocketbook’ (Imperial College London, Wye Campus)
Palaniappan, S.P., 1992. Green manuring nutrient potentials and management. In Fertilizers, organic manures, recyclable wastes and biofertilizers (Ed H.L.S. Tandon), FDCO. New Delhi.
Paustian, K., Six, J., Elliott, E. T. and Hunt, H. W. 2000.Management options for reducing CO2 emissions from agricultural soils. Biogeochem. 48, 147–163.
Petersen, S.O., Debosz, K., Schjønning, P., Christensen, B.T., and Elmholt, S., 1997, Phospholipid fatty acid profiles and C availability in wet-stable macro-aggregates from conventionally and organically farmed soils, Geoderma 78: 181-196.
Pimentel, D.; Harvey, C.; Resosudarmo, P.; Sinclair, K.; Kurz, D.; McNair, M.; Crist, S.; Shpritz, L.; Fitton, L.; Saffouri, R.; Blair. R. (1995) Environmental and economic costs of soil erosion and conservation benefits. Science, 267; 1117–1122.
333

Winter School on “Waste recycling and resource management”-Dec. 3-23, 2014
Rajendran, T.P., Venugopa|an, M.V. and TarhaIkar, P.P., 2000. Organic cotton farming in India.
Central Institute of cotton Research, Technical Bulletin No.1/2000, Nagpur, India, P.39.
Ramaswami, P.P., 1999. Recycling of agricultural and agro industry wastes for sustainable agricultural production, J. Indian Soc. Soil Sci., 47, 661-665.
Ramesh K., S.Anbumani, N.Ravisankar and B.Chandrasekharan (2001) Developmental Phases of Agriculture and Eco System -An Analysis. Abstract of the “National Symposium on bio diversity vis-a vis resource exploitation: An introspection", Central Agricultural Research Institute, Andaman, Portplair. Apr, 23-24.p.25
Ramesh, P., A.B.Singh, S.Ramana and N.R.Panwar. 2005 a. Production potential of soybean-based cropping systems with different nutrient options under organic farming in vertisols of Madhya Pradesh. In the Souvenir of the National Seminar on National Policy on Promoting organic Farming, held at NCOF. Ghaziabad during 10-11, March 2005, p 44-45.
Ramesh, P., Mohan Singh and A. Subba Rao. 2005 b. Organic Farming: Its relevance to the Indian context. Current Science, 88 (4) 561-568.
Ramesh, P., Mohan Singh and N.R. Panwar. 2OO4 a. Effect of graded levels of cattle dung manure on the productivity and soil fertility of soybean - durum wheat cropping system under organic farming in deep vertisols of central India. Proc. National Seminar on; operational Methodologies and Package of Practices in organic Farming by the Association for Promotion of Organic Farming (APOF), Bangalore during 7-9, October 2004, P 82-83.
Ramesh, P., Mohan Singh, A.B.Singh and N.R.Panwar.2004 b. Nutrient management of pigeon pea under organic farming system in deep vertisols of Madhya Pradesh. Proceedings of the National Symposium on “Resource Conservation and Agricultural Productivity” held at Punjab Agricultural University, Ludhiana during 22-25, November 2005, p 15-16.
Ramesh, P., Mohan Singh, A.B.Singh and T.R.Rupa. 2004 c. Response of soybean + redgram – chickpea sequential cropping to organic and inorganic source of nutrients in vertisols. Proc. National Seminar on “Resource Management for Sustainable Agriculture" held at Agricultural College, Bapatla, Achrya N.G.Ranga Agricultural University during 28-30 January 2004, p 412-413.
Reganold, J.P., 1988, Comparison of soil properties as influenced by organic and conventional farming systems, Am. J. Alter. Agric. 3: 144-154.
Wander, M.M., Traina, S.J., Stinner, B.R., and Peters, S.E., 1994, Organic and conventional management effects on biologically active soil organic matter pools, Soil Sci. Soc. Am.J. 58: 1130-1139.
334
Winter School on “Waste recycling and resource management”-Dec. 3-23, 2014
Schweizer, M., J. Fear, and G. Cadisch, 1999: Isotopic fraction during plant residue
decomposition and its implications for SOM studies. Rapid Commun. Mass Spectrom. 13, 1284—1290.
Stockdale, E, N. H. Lampkin, M. Hovi, R. Keatinge, E. K. M. Lennartsson, D. W. Macdonald, S. Padel, F. H. Tattersall, M. S. Wolfe and C. A. Watson 2000. Agronomic and environmental implications of organic farming systems. Adv. Agron., 70, 261-327.
Subba Rao, I.V.,1999. Soil and environmental pollution- A threat to sustainable agriculture, J. I. Indian Soc. Soil Sci., 47, 611-633.
Sukkel, W, Geel, W. van & Haan, J.J. de (2008) Carbon sequestration in organic and conventional managed soils in the Netherlands. 16th IFOAM Organic World Congress, Modena, Italy, June 16-20, 2008 Archived at http://orgprints.org/view /projects /conference.html
Sun, C., Gao, F., and Qu, J.: Latest knowledge on Global Climate Change – IPCC third assessment report, ZiRan ZaZhi, (in Chinese), 24(2), 114–122, 2001.
Usha K , 2006. Organic farming system set up. NABARD technical digest. 9: 28-30
Usha, K 2006. Organic farming systems fertility. NABARD technical digest. 9:28-30.
Van Veen, J. A., E. Liljeroth, and J. K. Lekkerkerk, 1991: Carbon fluxes in plant soil system at elevated atmospheric CO2 levels. Ecol. Appl. 12, 175—187.
Vanlauwe, B., 2004. Integrated soil fertility management research at TSBF: the framework, the principles, and their application. In: Bationo, A. (Ed.), Managing Nutrient Cycles to Sustain Soil Fertility in Sub-Saharan Africa. Academy Science Publishers, Nairobi, Kenya.
Veeresh, G.K., 1997. Organic Farming: Ecologically sound and economically sustainable. Paper presented at the International Conference on Ecological Agriculture: Towards Sustainable Agriculture, Punjab Agricultural University, 15-17 November 1997.
Vleeshouwers, L.M. and Verhagen, A., 2002. Carbon emission and sequestration by agricultural land use: a model study for Europe. Global Change Biology, 8: 519-530
Watson, C.A., D. Atkinson, P. Gosling, L.R. Jackson and F.W. Rayns, 2002. Managing soil fertility in organic farming systems. So/ Use and Management, 18,239-247.
White, R.E., 1987. Introduction to the principles and practices of soil science. 2nd Edition, Blackwell Scientific, Oxford, UK.
www.prlog.org
335

Winter School on “Waste recycling and resource management”-Dec. 3-23, 2014
Synchronization of nutrient release from manures and crop demand: N,P and S
mineralization Characteristics of different organic manures in relation to their quality
Ashok K.Patra
Indian Institute of Soil Science, Nabibagh, Berasia Road, Bhopal-462038
India hosts 15% of the animal population, which, apart from supplying milk and draught power in agricultural operations, also contribute valuable plant nutrients acting as supplement to the fertilizer nutrients. Indian cattle, however, has different genetic make up compared to the ones reared in developed countries. They are smaller in size with lower body weight, are low in milk production and adapted to the different climatic conditions and different feeding situations besides their different heritage. Consequently, the different types of manures, derived under such varying environments do differ in their physical and chemical composition. Manure composition differs due to the difference in the type of animal used to produce dung, animal density, nutrient density of the feed material, type of work an animal is put to use and management factors. This calls for a need to develop a database of actual dung and manure availability depending upon the livestock and other animal density in different regions, also the actual manure availability and its composition. India is endowed with variable climates, different strata of farmers ranging from marginal to large practicing variable crop and nutrient management options. These factors change the nutrient recovery from the applied manure. The first year nutrient recovery coefficients have been reported to be 0.5 and 0.75 for N and P, respectively. It is also reported that the recovery coefficients vary with the method of manure management being higher with soil incorporation and lower with surface application (Barker and Zublena, 1993). Hence there is a need to compile the manure preparation and handling practices in different parts of the country specific to different situations. The amount and type of the animal feed is important w.r.t. the milk yield and manure nutrient composition. A compilation of the crop residues and its composition used as cattle feed, the availability of concentrated feed material (manufactured and imported) and composition of different cattle feeds, the region-specific availability of grazing land and amount and type of pasture, the amount of feed depending upon the type and age of animal is important for determining not only the quantity and quality of manure but also will be helpful in computing enteric methane emission coefficients from animals and methane emission potential of manures.
Availability of organic wastes
Crop residue can be an important source of nutrients to subsequent crops. It is well documented that different quantities of N, P, K and other nutrients are removed from and returned to the soil depending on crop species concerned. The quantity and quality of crop residues will greatly influence the build up of soil organic matter. Cereals straw contains only around 35 kg N/ha compared to more than 150 kg N/ha for some vegetable crop residue.
336

Winter School on “Waste recycling and resource management”-Dec. 3-23, 2014
Residues also contain variable amounts of lignin and polyphenols, which influence decomposition and mineralization rates. Incorporation of N rich, low C: N ratio residues leads to rapid mineralization and a large rise in soil mineral N, while residues low in N such as cereal straw can lead to net immobilization of N in the short to medium term. The latter can be advantageous in preventing N leaching from soil between crops. The inclusion of crops with a diverse range of C: N ratios can help to conserve N within the system .
Crop residues, which are not fed to animals or in excess on the farm such as straw of cereals, oilseeds etc. can supply about 1.13, 1.41 and 3.54 million tonnes of nitrogen, phosphorus and potassium, respectively. On the basis of crop production levels it is estimated that ten major crops (rice, wheat, sorghum, pearl millet, barley, finger millet, sugarcane, potato tubers and pulses) of India generate about 312.5 Mt of crop residues that have nutrient potential of about 6.46 million tonnes of NPK (Table 1). It has been estimated that all animal excreta can potentially supply 17.77 million tonnes of plant nutrients. But only 1/3rd of it is used as manure (Table 3). Annually, most of the metropolitan cities of India are generating about 150 million tonnes of city refuse (Table 2) that have nutrient potential of about 1.72 million tonnes of N, P and K. It was estimated that about 57 million tonnes of city wastes is being generated every year from different cities of India that is expected to will be increased to 104 million tonnes per year during 2025. About 41% of these wastes contain biodegradable matter, but only 8.6 % of the municipal solid wastes are composted which is about 8.9 million tonnes per year. This could be increased to 20.8 million tonnes per year during 2025 by improved technologies. By adopting the efficient composting techniques, the produced compost will have high nutrient value compared to conventional compost. The chemical analysis of municipal solid waste (Table 4) showed that the contents of N, P2O5 and KgO is about 2.85 lakhs tonnes that would be about 5.4 lakh tonnes during 2025.
Table 1: Nutrient potential of crop residue
Crop Residues
N
(%)
P2O5
(%)
K2O
(%)
Total
Tonne/ Tonne residue
Rice
0.61
0.18
1.38
2.17
0.0217
Wheat
0.48
0.16
1.18
1.82
0.0182
Sorghum
0.52
0.23
1.34
2.09
0.0209
Maize
0.52
0.18
1.35
2.05
0.0205
Pearl millet
0.45
0.16
1.14
1.75
0.0175
Barley
0.52
0.18
1.30
2.00
0.0200
Finger millet
1.00
0.20
1.00
2.20
0.0220
Pulses
1.29
0.36
1.64
3.29
0.0329
Oilseeds
0.80
0.21
0.93
1.94
0.0194
Groundnut
1.60
0.23
1.37
3.20
0.0320
337

Winter School on “Waste recycling and resource management”-Dec. 3-23, 2014
Sugarcane
0.40
0.18
1.28
1.86
0.0186
Potato tuber
0.52
0.21
1.06
1.79
0.0179
Total
8.71
2.48
14.67
26.16
0.2616
Source: Tandon, 1997.
Table 2: Organic resources and their nutrient supply potential
Agricultural/
animal /city
Quantity
(Mt)
N (Mt)
P2O5 (Mt) K2O (Mt)
Rice 110.5 0.61 0.18 1.38 Wheat
82.6
0.48
0.16
1.18
Sorghum
21.0
0.52
0.23
1.34
Sugarcane
40.9
0.40
0.18
1.28
Pulses
13.7
1.60
0.51
1.75
Cattle dung
1227.8
1.84
1.23
0.61
Animal urine
800
1.60
0.08
1.60
Sheep and goat
45
0.27
0.06
0.45
Poultry wastes
1.00
2.17
2.00
2.20
Horses
0.48
1.51
0.35
1.80
City refuse
150
0.75
0.34
0.63
Sewage sludge
t
1460 Mt
m2 year-1
0.04
0.01
0.18
Total
3952.98
11.79
5.33
14.4
Table 3: Nutrient content (%) in dung of different animals
S.N Animal dung N (%) P (%) K (%) Total
1. Cattle dung 0.50 0.20 0.50 1.20 2.
Buffalo dung
0.50
0.20
0.50
1.20
3.
Sheep dung
0.65
0.50
0.03
1.18
4.
Goat dung
0.65
0.50
0.03
1.18
5.
Pig dung
0.60
0.50
0.40
1.50
6. Poultry dung
1.80 2.30 1.40 5.50
Source: Tripathi et al, 2003
338

Winter School on “Waste recycling and resource management”-Dec. 3-23, 2014
Table 4 : Availability of rural compost and urban compost in India
Rural Compost (Lakh tonnes)
Urban Compost (Lakh tonnes)
Sr.No.
State/UTs
1994-95
2002-03 Avg.
Nutrient value
1994-95
2002-03 Avg.
Nutrient value
1.
Andhra Pradesh
76.790
135.00
105.89
1.482
3.150
3.150
3.150
2 Arunchal Pradesh 0.091 0.15 0.120 0.0016 Nil Nil Nil Nil 3 Assam 0.100 0.01 0.055 0.0007 - - 4 Bihar
14.786
6.12
10.453
0.1463
0.240
0.05
0.125 0.0043 5.
Goa
2.522
2.42
2.471
0.0345
-
6.
Haryana
90.521
103.53
97.02
1.358
0.258
0.00
0.129
0.0045
7.
Himachal Pradesh
34.195
30.25
32.22
0.4510
0.086
0.91
0.498
0.0174
8.
Karnataka
212.876
587.17
400.02
5.600
21.477
132.70
77.08
2.6970
9.
Kerala
5.028
0.00
2.519
0.035
0.062
0.02
0.041
0.0014
10.
Madhya Pradesh
30.860
32.00
31.430
0.440
5.756
1.70
3.728
0.1304
11. Maharastra 9.304 17.83 13.582 0.1901 5.879
24.66
15.26
0.5341
12. Mizoram
0.137
0.12
0.128
0.0017
- - 13. Nagaland 0.001 0.01 0.005 0.00007 0.002 - 0.001 0.00003 14.
Orissa 121.774
127.05
124.412
1.741
0.155
0.03
0.092
0.0032
15.
Punjab
326.100
322.00
325.05
4.550
2.100
1.97
2.035
0.0712
16.
Rajasthan
59.450
62.13
60.79
0.851
8.040
8.88
8.46
0.2961
17.
Tamilnadu
3.685
4.23
3.95
0.055
2.260
0.77
1.515
0.0530
18.
Uttar Pradesh
950.00
12.92
481.46
6.740
16.500
Nil
8.25
0.2887
19. West Bengal 275.00
20.10 147.55
2.065
0.017
0.16 0.016 0.0005 20. Daman & Deep 0.1
Nil - - - Nil Nil Nil 21. Delhi - 0.15 0.15 0.0021 0.039
0.04 0.039 0.0013 22. LakshDweep 0.006
Nil 0.006
0.00008
- Nil Nil Nil 23. Pondichery - Nil - - 0.654
Nil
0.327
0.0114 24. Uttranchal
- Nil - - - - - - Total
2224.319
1463.24
1843.77
25.81 2.56(mt
69.002
175.01
122.00
4.27 (0.427mt
Source: Agricultural Statistics at a Glance, 2004
Nutrient content of rural compost; 0.4% N, 0.3% P2O5, 0.7% K2O, 1.4% (NPK)
Nutrient content of rural compost, 1.0% N, 1.0% P2O5, 1.5% K, 3.5% (NPK)
339

Winter School on “Waste recycling and resource management”-Dec. 3-23, 2014
Manure application to agricultural land involves the addition of all the components of the manure to the soil. After application of manure, decomposition of the organic material by microorganisms starts and results in production of carbon dioxide, water and release of mineral plant nutrients such as N, P, S and metal ions. Manuring almost always has a positive influence on the build up of soil organic matter and thus improves the "intrinsic" fertility of the soil as well as the soil structure. Organic matter that remains one year after application is assumed to be part of the soil organic matter and will decompose gradually over the years, releasing plant nutrients in a way that resembles a slow release fertilizer. A small fraction of the added organic material is transformed into organic matter that is resistant to microbiological breakdown, the so called humus or stable organic matter. Humus contributes to soil fertility by retaining plant nutrients through adsorption. It also acts as binding material in the soil, improving soil structure and responsible for making clay soil less susceptible to compaction caused by heavy traffic, or a silty soil less susceptible to erosion. In addition, humus increases the water holding capacity and the cation exchange capacity of any type of soil. The passage of weed seeds through the digestive tract of animal reduces their germination capability. Some weeds species, however, survive. In a stack of farmyard manure, the temperature rises above 55°C because of the microbiological decomposition of the organic matter and kills weed seeds within three weeks.
Transport of manure to field
Based on a total of 23 on-farm and 6 industrial composts in Quebec, Canada characterized (Gagnon et al, 1999) and statistically analysed, 5 farm management factors-
1. Type and amount of bedding
2. System of manure handling and storage
3. Compost windrow turning
4. Composting length
5. Milk production intensity were identified that affect one or several major parameters such as pH, dry matter, electrical conductivity, total and water-soluble C, N, P and K, and humic component characteristics of manure.
Quality of manure is important as the manure is bulky and transport costs are high. Because of the high cost of transporting manure, and the resulting tendency to apply high rates close to its source, makes areas with intensive livestock production particularly vulnerable to environmental damage. When buying or getting ready to spread manure, one must remember that the moisture content greatly affects the total quantity of nutrients in a tonne of material. For example, broiler manure at 25-30% moisture when removed from the house will contain about
340

Winter School on “Waste recycling and resource management”-Dec. 3-23, 2014
38 kg of nitrogen, 42 kg of phosphate and 35 kg of potash per tonne. But a tonne of fresh manure at 75% moisture will contain only 30, 31 and 16 kg of these nutrients, respectively. At 75% moisture, the farmer will be hauling around 1682 kg of water and only 560 kg of solid material. Eghball and Power (1994) reported that manure is an economic substitute for chemical fertilizer for haulage distances up to 15 km, if labour and non cash costs are ignored. So the manure transport from the areas of intense livestock production to far away places for use in crop production is a difficulty proposition.
Manure application to field
In India manure with approximately 40 to 60% moisture is cart to fields in summer months after the harvest of rabi (Winter) season crops. The manure is placed in small heaps through out the field. Depending upon field size and capacity (volume) of the cart, it takes 3 to 5 days to transport the manure. The manure is either immediate spread manually with small devices like spade, winnower, basket etc. and incorporated by ploughing in or the heaps are left untouched in the field until monsoon rains; then the manure is spread and incorporated during preparatory cultivation at least 15-20 days before sowing of the Kharif crops. During storage of manure in the open, NH3 volatilization and NO3, P and K leaching occurs particularly when rainfall is high. This again means nutrient losses. Surface spreading of manure without working during periods of precipitation surplus on fallow land, may lead to NH3 volatilization, NO3 and P leaching, and surface runoff of manure. The rate of NH3 volatilization is strongly influenced by NH3 concentration in the manure, temperature and wind speed. These factors, however, do not necessarily influence the total amount of NH3 volatilized in seven days in warm, dry and windy conditions may not be very different from that in cool and quiet conditions. The difference is that in the first situation 95% may volatilize during the first day after application and the remaining 5% during day 2 to 7, while in the second situation volatilization is spread more evenly over the week.
The influence of different application techniques (broadcast application, application in narrow band and injection) of liquid cattle manure on NH3-N emission indicated that on grassland, emission declined from 38-74% after broadcast application to 7-23% of applied NH4-N after injection, which on arable land gave respective values ranging from 6.1 to 10% (Mannheim et al., 1995).
The studies at Animal Manure and By-Product Laboratory at Beltsville Maryland showed that ammonia losses from unincorporated slurry were 45% of the applied ammonium-N, while losses following immediate incorporation with a chisel plow, tandem-disc, or moldboard plow were 9%, 5% and 1%, respectively. They evaluated the effectiveness of alum or zeolite added to dairy slurry as a means to reduce ammonia volatilization and to sequester phosphorus (P). Ammonia volatilization from dairy slurry was slurry was reduced by about 55% from the addition of either 2.5% alum or 6.25% zeolite (by weight), soluble P was also reduced by both
341

Winter School on “Waste recycling and resource management”-Dec. 3-23, 2014
amendments with alum virtually eliminating soluble P and zeolite reducing soluble P by about one half.
Uniformity of manure application
Farmers have now several techniques to manage ammonia emission from land application of slurries that are now available (injection, immediate tillage, surface banding), but several of these techniques will significantly reduce residue cover and promote sediment loss. In addition, poultry litter is a major manure source in Maryland which has no application equipment suited for direct soil incorporation, other than immediate tillage (which will also reduce residue cover). Consequently, there is need to develop high residue manure application equipment that provides soil incorporation, especially for poultry litter. There is also the need to provide economic incentives (tax credits, cost sharing) to purchase application equipment with soil incorporation, in order to promote ammonia conservation from land application of manures.
It is difficult to apply uniformly on fields. Spread pattern and application rates of manure spreaders should be checked at least once a year. This can be done by placing sheets of plastic film of uniform size at equal intervals across the path of application and then measuring how much manure is on each. Uniformity of spread can be improved by using lower application rates and going over the field twice with the spreader. The second pass can "split the middle" of the first pass, or run perpendicular to it. A summary statement of extent of manure nutrient availability under various methods of application are furnished in Table 5 (Anonymous, 1998). Only about half (three-fourths for poultry) of the N in the manure is available to the crop in the year it is spread. The remaining N will slowly become available over a period of years. The availability of this residual N can be estimated from the manure history of a field. Availability factors for residual N are given in (Table 6). These availability factors can be used for working out the additional needs of fertilizer N to the current crop or to work out manure rates to be applied to meet the crop N requirements.
Table 5 : Nitrogen losses as influenced by the method of manure application
Fraction N losses
Application technique
Average Range
Surface spreading
0.59
0.29-0.91
Diluted manure 1 :3
0.24
0.12-0.35
Rain 20 mm
0.15
0.11-0.18
Immediate tillage
0.17
0.14-0.20
Sod manuring
0.06
0.04-0.08
Injection
0.04
0.00-0.13
Drag-hoses
0.35
0.25-0.44
342
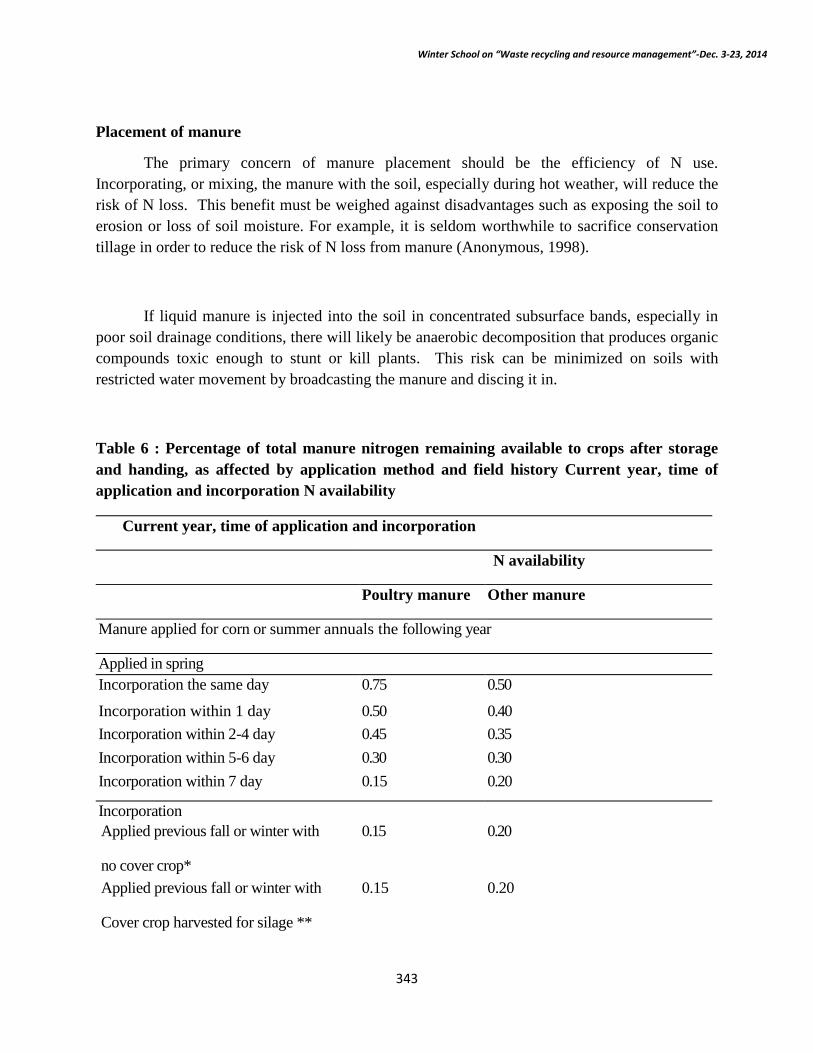
Winter School on “Waste recycling and resource management”-Dec. 3-23, 2014
Placement of manure
The primary concern of manure placement should be the efficiency of N use. Incorporating, or mixing, the manure with the soil, especially during hot weather, will reduce the risk of N loss. This benefit must be weighed against disadvantages such as exposing the soil to erosion or loss of soil moisture. For example, it is seldom worthwhile to sacrifice conservation tillage in order to reduce the risk of N loss from manure (Anonymous, 1998).
If liquid manure is injected into the soil in concentrated subsurface bands, especially in poor soil drainage conditions, there will likely be anaerobic decomposition that produces organic compounds toxic enough to stunt or kill plants. This risk can be minimized on soils with restricted water movement by broadcasting the manure and discing it in.
Table 6 : Percentage of total manure nitrogen remaining available to crops after storage and handing, as affected by application method and field history Current year, time of application and incorporation N availability
Current year, time of application and incorporation
N availability
Poultry manure Other manure
Manure applied for corn or summer annuals the following year
Applied in spring
Incorporation the same day
0.75
0.50
Incorporation within 1 day
0.50
0.40
Incorporation within 2-4 day
0.45
0.35
Incorporation within 5-6 day
0.30
0.30
Incorporation within 7 day
0.15
0.20
Incorporation
Applied previous fall or winter with
no cover crop*
0.15
0.20
Applied previous fall or winter with
Cover crop harvested for silage **
0.15 0.20
343

Winter School on “Waste recycling and resource management”-Dec. 3-23, 2014
Applied previous fall or winter with a
cover crop as a green manure
0.05 0.40
Manure applied for small grains:
Applied previous fall or winter 0.50 0.40
* There is the potential of significant nitrogen loss to the environment when manure is applied in this manner.
** These low availability factors do not indicate a net loss of N.A large amount of N is removed in the cover crop silage but is recycled in the manure when the silage is fed.
Manure application in vegetable crops
If fresh manures are used on soil, it should be worked in as soon as possible or covered with other organic materials such as straw, hay, or grass clippings to prevent the loss of nitrogen through leaching. No fresh manure may be used during the year of harvest for certified organic production. So one may plant a green manure or cover crop on this ground initially. If we are not concerned with organic certification, we must still allow at least one or two months to pass before planting after fresh manure application.
Nutrient availability from applied manures
According to Nishiwaki and Noue (1996) chicken manure compost applications gave nearly the same yields for sweetcorn and cabbage compared with nitrogen fertilizer. The total carbon content of the soil has increased with the application of composts prepared with high C/N ratio material such as rice straw or cattle manure. Nitrate content in the soil water increased with the amount of chemical fertilizer applied but remained low when only composts were applied. The application of animal manure composts to mineral soil was effective in reducing the leaching out of mineral nutrients.
Results of long-term fertilizer experiment in Tamil Nadu, India on nutrient availability in the soil under different fertilizer and manure treatments revealed that inclusion of farmyard manure with inorganic fertilizers had a positive effect on all the organic N fractions (Santhye et al. 1998).
A long term field experiment in Akola, India, under sorghum-wheat cropping sequence on a Vertisol during the seventh cycle showed that the combination of fertilizers with farmyard manure increased the organic carbon and available NPK status of soil (Vaidya and Gabhane, 1998).
Field studies on the effect of farm wastes and organic manures on soil properties and nutrient availability on sodic Vertisols at Parbhani, Maharashtra indicated that among the treatments pressmud [filter cake], dried biogas slurry, FYM, and wheat straw the treatment of 25t FYM+ 20 t pressmud/ha was the best for increasing yields of rice and wheat. In general, all the treatments decreased the pH and exchangeable sodium percentage (ESP) of the soil. The
344

Winter School on “Waste recycling and resource management”-Dec. 3-23, 2014
infiltration rates increased due to application of organic wastes and manures. All the treatments increased the contents of organic carbon, available N, P and K in soil, particularly FYM + pressmud (More, 1994).
Madhumita et al. (1991) studied the influence of organic manures on native plant nutrient availability in an acid Alfisol from Meghalaya and reported that the relative efficiency of the organic manures in improving soil fertility followed the order: poultry manure> pig manure> farmyard m
Kwakye (1988) studied the influence of organic matter in combination with mineral fertilizers on crop yields and soil properties on a savanna soil in Ghana under continuous cropping.
The application of manure in combination with N, P and K had no significant effects on crop yields. Application of N, P and K significantly increased the respective nutrient elements in the soil. The fertility status of the soil was maintained chiefly by manuring which significantly increased the levels of organic C, total N, and available P and K. Soil pH was significantly reduced by the. N, P and manure treatment.
Sharma and Gupta (1998) reported that among the different organic sources, farmyard manure proved superior to blackgram (Vigna munga) straw followed by white popinac leaves, while wheat straw gave poor results. The water-holding capacity, organic carbon, available nitrogen and phosphorus in soil increased with increase in the organic residues while available K and bulk density decreased.
In a greenhouse sorghum was grown in an Oxic Paleustult to which poultry manure, cattle manure, rice husk, burnt rice husk, rice straw or cowpea stems had been added at 2 t/rai. Poultry manure increased the highest soil pH and available P [6.25 Rai = 1 ha] (Seripong and Suksri, 1989).
Studies of Warman (1990) on fertilization with manures and legume intercrops and their influence on brassica and tomato crops and soil copper, manganese and zinc indicated that the animal manures contributed to micronutrient levels in soils and crops. Pig manure significantly increased Zn uptake, and chicken and dairy manures increased soil pH, thus reducing the availability of Mn, while pig manure had the opposite effect.
An experiment on the organic farming of sweetcorn and vegetable soybeans by Hsieh and Hsu (1993) using composted pig manure, composted cattle manure, composted chicken manure, or mixtures of composted cattle and chicken or pig and chicken manure indicated that use of manures increased soil pH, organic matter (OM), available P, exchangeable K and Mg and extractable Mn, Zn and Cu, and decreased soil salinity and extractable Fe.
345

Winter School on “Waste recycling and resource management”-Dec. 3-23, 2014
Nutrient recovery and availability coefficient
Turner (1976) developed an approach to manure N availability under various storage treatment and handling systems (Table 7). Nitrogen losses in storage and handling ranged from 10 to 84%. The availability coefficient indicates that a portion of the total soil-incorporated manure N becomes available. The value of availability coefficient is influenced by the portion of the total N that is already in the inorganic form when the manure is incorporated, the amount of organic N in the current year application that is mineralized during the year and the amount of residual organic N from previous applications that is mineralized during the current year. Estimated values for availability coefficient (table 8) are based on the assumption that manure will be applied each year on the same land for an indefinite number of years. The availability coefficient, therefore, approaches 1.0 with time.
Table 7 : Nitrogen remaining after accounting for storage, treatment and handling losses
Manure storage, treatment, and N remaining % handling system
Oxidation ditch, anaerobic lagoon irrigation 16 or liquid spreading
Anaerobic lagoon, irrigation or liquid spreading 22
Deep pit storage, liquid spreading 34
Aerobic lagoon, irrigation or liquid spreading 40
Open lot surface storage, solid spreading 40
Fresh manure, directly field spread: (Time between application and incorporation) 1-4 days; warm, dry soil 65
7 days or more, warm, dry soil 50
1-4 days, war, wet soil 85
7 days or more, war, wet soil 60
7 days or more; cool, wet soil 90
346

Winter School on “Waste recycling and resource management”-Dec. 3-23, 2014
Table 8 : Availability coefficient for the first 5 application years
Type of manure Availability coefficient for the year of application
1 2 3 4 5 Poultry, fresh
Poultry, aged, covered
Dairy, fresh
Dairy, liquid manure tank
(1-3 weeks storage)
0.75
0.60
0.50
0.42
0.80
0.75
0.65
0.54
0.85
0.80
0.70
0.60
0.90
0.84
0.74
0.64
0.93
0.87
0.78
0.68
Common nutrient recovery efficiencies (outputs/inputs) of nutrients in manures have been: 20-35% for N, 30-40% for P and 25-40% for K.
Fertilizer value of manures
It is important to remember that nutrient contents in manures vary widely according to age of the animals, feed used, moisture content, degree of decomposition, and the amount of litter or bedding material mixed in with the manure. One may need to adjust the application rates up or down according to what he knows about the age, quality, and moisture content of the manure.
During digestion, some of the energy, nutrients, vitamins, and minerals in feed are retained by the animal. However, most of the nutrients pass through the animal in urine or faeces. For example, about 75% of N, 80% of P, and 85% of the K consumed by cattle is excreted. Undigestible and partially digested organic residues are also excreted.
Nitrogen availability: Soluble N (primarily in the form of ammonium) in animal manures ranges from about one-third of the total N in poultry manure to about two-thirds or more in lagoon liquids. This portion has the same availability to plants as N contained in commercial fertilizer.
Phosphorus availability: Animals and poultry under intense production are likely to have higher amounts of dicalcium phosphate added to the ration which passes through as inorganic P (50% to 60% of the total P). This form of P, which acts similar to fertilizer forms of P in the soil, may be readily available during the first year when soil pH is at recommended levels.
347

Winter School on “Waste recycling and resource management”-Dec. 3-23, 2014
Fertilizing value of nitrogen in manure
Zhang et al. (1998) compared variable rates of N from cattle manure with N from land reported that two kg of manure-N were equivalent to 1 kg of urea-N in terms of P uptake and yield response in the first year of manure application. No significant movement nitrate occurred in the top 75 cm of the soil profile with the manure-N rate up to 225 kg ha-1.
In studies on response of wetland rice to nitrogen from cattle manure and urea in a rice-wheat rotation by, Yadvinder Singh et al. (1996) showed that the combined application of cattle manure and urea showed no positive interaction effects. The mean fertilizer N equivalent manure ranged from 42 to 52% during the 3 years.
The fertilizing value of animal manure not only depends on its composition, but also on the crop to which it is applied, the climatic conditions, the type of mineral fertilizer substituted, the method of application and the time of application in relation to crop growth.
The efficiency of a nutrient in animal manure can be expressed in the working coefficient. The working coefficient indicates how much nutrient from a reference mineral fertilizer is used to produce the same yield as an application of animal manure which contains 100 kg of the nutrient.
Nitrogen in manure and in soil occurs in various forms. Furthermore, plants and microorganisms can use N in different ways. It would be best to establish, through experiments, crop response curves under all circumstances relevant to the identified livestock systems and determine the working coefficients.
First, the form in which N is present in the manure has a decisive influence on the availability for plants. Higher plant availability of N in the manure implies that it can substitute for more mineral fertilizer, i.e. the working coefficient will be higher. Sluijsmans and Kolenbrander (1977) suggested differentiation between:
- Nm : N Present in mineral form;
- Ne : N mineralized within one year after application in temperate zones or within three
months in lowland tropics;
- Nr: N mineralized later.
The fractionation depends, among other-things, on the type of animal, its diet and the method and duration of storage of the manure. The working coefficients can now be estimated with some assumptions.
348

Winter School on “Waste recycling and resource management”-Dec. 3-23, 2014
In the example given below assumptions have been made for the situation of a wheat crop in a temperate climate. These include:
Working coefficients
Nm Ne Nr
Cattle farmyard manure
0.10
0.45
0.45
Cattle liquid manure
0.50
0.15
0.35
Pigs liquid manure
0.50
0.22
0.28
Poultry liquid manure
0.70
0.20
0.10
Veal liquid manure
0.80
0.09
0.11
Urine
0.94
0.03
0.03
Fertilizing value of phosphorus in manure
For practical recommendations to Dutch farmers, Noij and Westhoek (1992) differentiate between a single dose and repeated annual doses of P. They assume a working coefficient of P from any type of slurry on grassland of 0.8 after a single dose and of 1.0 after repeated annual doses. For maize, they assume a working coefficient for cattle, pig or poultry slurry of 0.6, 1.0 and 0.7, respectively for a single dose, and again 1.0 if repeated annual doses are applied. For maize, a fraction of the P is released only in later years. Working coefficient for P from farmyard manure higher than 1.0 have been reported from experiments on potatoes over a period of six years in India (Sharma et al., 1988). Working coefficients for P from farmyard manure of 0.6, 0.4 and 0.5 were from experiments on hyacinth bean (Dolichos lablab L.) for three consecutive seasons (Noor et. al. 1992).
An indicative value for the working coefficient of P for any type of animal manure is 1.0 with repeated annual applications. For single applications of farmyard manure, the P working coefficient can be assumed to be 0.5.
Temperature influences mineralization of the organic P in manure. It can therefore be assumed that like N, P is mineralized more rapidly in tropical than in temperate conditions. Because the ratio organic P/ inorganic P in manure is much lower than organic N/ inorganic N, temperature influences the working coefficient of P for single applications much less than that of N.
349

Winter School on “Waste recycling and resource management”-Dec. 3-23, 2014
Table 9 shows for the period 1990-2000 the maximum amount of P2O5 in animal manure
that have been and probably will be allowed to be added to the soil for different crops in Netherland. As it was common practice for many intensive livestock holders to use maize plots as "dumping sites" for their manure surpluses, the law allowed for relatively high amounts of P2O5 on maize during the first years, to give those farmers the opportunity to adjust their manure management to the new legal situation. The objective is that by the year 2000 the estimated P2O5 addition to the amount removed in crops will be restricted to 90 kg/ha for grassland and 65 kg/ ha for maize and other field crops averaged over the country. This statement is obvious for N leaching because the N:P ratio in manure is in all but very exceptional cases lower than the N:P ratio in crops. Thus, N removal in crops will be generally higher than N-application via animal manure.
Table 9 : Maximum rates of P2O5 in animal manure allowed to be applied
Crop
1990
1991-92
1993
1994
1995
1996
2000
Crass-land
250
200
200
200
150
135
90
Maize
350
250
200
150
110
90
65
Field crops
125
125
125
125
110
90
65
Fertilizing value of potassium in manure
The K content of manure is mostly soluble and consequently is readily available to crops. It is given an availability factor of 100%, which means that it acts the same as K in commercial fertilizer when applied to the soil. Like P, it can accumulate in the soil and increase soil test K or move down into the soil profile if more is applied than the crops remove. This is not currently a water quality concern but may be an economic loss to the farmer.
Effect of Organic manures on crop yields in organic farming and IPNS system:
Under organic farming manures were applied to kharif and rabi crops based on N equivalent basis. Phosphorus was supplemented through rock phosphate along with PSB. The treatment which received a combination of cow dung manure (CDM), poultry manure (PM) and vermicompost (VC) during the previous crop followed by the application of CDM for the current soybean crop recorded the highest soybean yield (1160 kg ha-1) compared to the other treatments (Table 10). During rabi, highest yield of durum wheat (4810 kg ha-1) were recorded with the treatment CDM + PM + VC (1:1:1 ratio). Whereas combination of CDM + PM and CDM + VC recorded higher yield of mustard (2110 kg ha-1) and chickpea (1846 kg ha-1), respectively.
350

Winter School on “Waste recycling and resource management”-Dec. 3-23, 2014
Table 10: Crop yield (kg ha-1) as influenced by various organic manure combinations Manurial treatment
Soybean
Durum wheat
Mustard
Chickpea
Isabgol
Kharif
Rabi
CDM
CDM + PM
1092
4487
2110
1692
1056
CDM
CDM + VC
1068
4593
1960
1876
1165
CDM
PM + VC
1080
4390
1894
1710
1096
CDM
CDM + PM + VC
1160 4810
1922
1820
1292
Control
Control
996
2765
1032
1080
849
CD(P=0.05)
90
508
214
206
195
In general, the productivity of crops was higher in the integrated nutrient management compared to either inorganic or organic treatments. However, the organic recorded 11.1, 1.1, 3.0, 4.2 and 11.2% higher seed yields of soybean, durum wheat, mustard, chickpea and isabgol, respectively, compared to the inorganic treatment (Table 11).
Table 11: Productivity of crops (kg ha-1) as influenced by management practices
Management
practices
Soybean Durum
Wheat
Mustard Chickpea Isabgol
Organic
1144
4915
1948
1890
1249
Inorganic
1030
4862
1890
1813
1123
Integrated nutrient
management
1090
5160
2156
2056
1228
CD(P=0.05) 78.3
NS
NS
NS
54.9
Response of manures
The long term effect of chemical fertilizers and manures applied individually and in combination on yield of crops and soil health is being studied at 11 major agro-climatic regions of India under the All India Coordinated Research Project on Long-term Fertilizer Experiments (ICAR) since 1970-71. The response ratios to applied nutrients were computed for rice (Barrackpore), wheat (Barrackpore, Ludhiana, Pantnagar and Palampur), maize (Ludhiana and Bangalore) and finger millet (Bangalore) and are presented in Figure 1. The application of N alone caused reduction in response ratio from initial 12.5 to 5 over 30 years primarily due to deficiency of P and K. The response ratio increased with the application of P along with N, but its reduction with time was again conspicuous in the absence of K application. The ratio got stabilized at a higher
351

Winter School on “Waste recycling and resource management”-Dec. 3-23, 2014
level only with the balanced application of NPK. With the addition of higher amounts of chemical fertilizers @ 150% recommended NPK response ratio rather declined. The response ratios appreciated with a rising trend only when chemical fertilizers were supplemented with multi-nutrient source of organic manure. The average response ratios of N, NP, NPK and NPK+FYM were 8.1, 10.1, 12.8 and 15.2, respectively.
Promoting use of organic manures (farmyard manure/compost/vermicompost)
In rice-wheat system, the yield potential of crops can be realized by organic manuring with locally available organic materials by supplementing fertilizer N up to 50% of the total requirement without affecting the system productivity (Sharma and Mitra, 1990). The grain yield of rice with FYM or water hyacinth compost at 10 t/ ha (50% moisture basis) was equivalent to that with 30 kg N/ha of urea fertilizer. The yield of wheat grown solely on residual soil fertility was low and direct N fertilizer was essential for achieving high productivity. In a long-term study at Ludhiana, the highest yields of rice were obtained with 75% NPK + 25% N replaced by FYM, which were comparable with 100% NPK or where 50% N was replaced by green manure (GM). Replacement of 50% N with FYM for rice consistently produced the highest wheat yields, which were significantly higher than with 100% inorganic N, indicating a positive residual effect of FYM. Thus, integrated use of manures and fertilizers proved to be as efficient as 100% NPK in the productivity of rice-wheat cropping system, suggesting that 50% N can easily be replaced by FYM or GM without yield reduction. The effect of poultry manure (PM) and urea was investigated in rice-wheat cropping system when applied at equal N rates or in 1:1 ratio (Bijay Singh et. al. 1997). Poultry manure was inferior to urea fertilizer in the first year, but by third year, it produced significantly more yield than the same rate of N as urea. Further, the poultry manure sustained the grain yield of rice, while the yield decreased with urea. A residual effect of poultry manure applied to rice to supply 120-180 kg N/ha was observed in the following wheat, which was equivalent to 40 kg N/ha plus some P.
Green manuring
Green manuring with leguminous crops is desired not only for enhancing the yield of rice-wheat cropping system but also for improving the fertility status of the soil. A 6-8 week old crop of sunhemp or dhaincha during summer accumulates about 3-4 t/ha dry matter and 100-120 N/ha, which when incorporated in situ, supplements up to 50% of the total N requirement of rice, besides leaving some residual effect on succeeding crop of wheat. A number of experiments have shown the beneficial effect of green manure crops through increased yields of succeeding crops and saving of N fertilizer in rice ranging from 60-120 kg N/ha (Yadvinder Singh et al, 1991). It is beneficial to apply P fertilizer to the green manure crop for enhancing dry matter production and N accumulation, consequently leading to greater saving of N fertilizer in rice (Sharma and Mitra 1988). Application of P to rice can be skipped altogether if it is preceded by a phosphate treated green manure. In the calcareous soils of Bihar, green manuring with dhaincha and sunnhemp was equally effective in improving the productivity of rice-wheat system (Prasad et al 1995). Further,
352

Winter School on “Waste recycling and resource management”-Dec. 3-23, 2014
the requirement of Zn of both the crops could completely be met through the green manuring. Long-term experiments at 6 locations in the Indo-Gangetic plains revealed that grain yield of rice and wheat decreased under control and sub-optimal fertilizer inputs. Whereas recommended NPK fertilizer increased yield of rice but did not prevent decline in yield of wheat. Partial substitution of inorganic fertilizer with green leaf manure of Sesbania sesban brought further improvement in the yield of rice and the residual effect of green manure reversed the declining trend in wheat yield. The sustainability yield index was also greater in plots receiving 100% NPK or green manure +NPK, indicating that rice-wheat system is more stable under these treatments. The yield performance of rice and wheat was evaluated under integrated nutrient management practices on farmers' fields in a high-productivity zone (Jalandhar) and low-productivity zone (Ghazipur) (Yadav, 2001). At Jalandhar, green manuring was the superior practice for enhancing grain yields of the system compared with other nutrient management practices in 3 out of 5 years. On the other hand, in the low-productivity zone of Ghazipur, fertilizer NPK alone increased the yields of rice-wheat system compared with other nutrient management practices.
In rice-wheat system, a lean period of 70-90 days (April to June) is generally available which can profitably be utilized for growing a catch crop of summer pulse. Inclusion of a legume crop either for grain or fodder during summer can help in restoring the soil fertility, resulting in higher yield of the rice-wheat system. Growing of green gram, black gram or cowpea and incorporating the residues into the soil after harvesting the grains/pods is suggested for not only increasing the system productivity but also for saving of a portion of inorganic fertilizer (John et al 1989, Kundu and Pillai, 1992). Incorporation of green gram residues after picking of pods before transplanting rice economized 40-60 kg N/ha in rice. Green gram straw incorporation can substitute up to 50% NPK needs of rice, amounting to 60 kg N, 30 kg P2O5 and 15 kg K2O in rice-wheat system, without any adverse effect on total productivity (Saraf and Patil, 1995). In a study at New Delhi, incorporation of green gram residue increased the yield of rice by similar magnitude as Sesbania green manure, although the amount of biomass and N added were higher under the latter than for former (Table 12) (Sharma et al. 1995). The residual effect of all summer legumes on succeeding wheat followed the order: green gram residue incorporated>sesbania green manure>green gram residue removed>fallow. An additional advantage of 0.9 t/ha of seed yield of green gram, besides beneficial effect of productivity of rice-wheat cropping system was obtained. Thus, the practice of incorporation of green gram and cowpea stover after picking the pods was as good as or even better than green manuring. Further, it also helps in mobilizing the available N, P, K and micronutrients like Zn, Fe and Mn from soil.
353

Winter School on “Waste recycling and resource management”-Dec. 3-23, 2014
Table 12 : Effect of summer legumes on performance of rice-wheat cropping system at New Delhi (mean of 2 years)
Treatment Summer
Legumes
Direct effect on rice yield
(t/ha)
Residual
effect on
wheat yield
Biomassadded
N
Added
Fallow
-
- 4.50 3.25 Sasbania green manure
4.0
73.3 5.05 3.70 *Greengram (residue removed)
-
- 4.65 3.50
*Greengram (residue incorporated)
2.7
63.5 5.00 3.80
*A grain yield of 0.9 t/ha was harvested from greengram
Source: Sharma et al. (1995)
Biofertilizers
Crops in dryland areas suffer due to moisture stress and low native soil nutrient status. Use of integrated nutrient management practices involving application of chemical fertilizers along with organics and biofertilizers is important to impart sustainability to production. Experiments in the All India Network Project on Biofertilizers in loamy sand soils with very poor organic matter content, at Bawal in Haryana showed that inoculation of bacterial biofertilizers like Azospirillum and Pseudomonas on pearlmillet, wheat and mustard gave 10-22% increase in grain yield when applied alongwith 75% recommended doses of nitrogen and saved 25% N dose. Fifty field demonstrations in farmers' fields in six districts of Haryana showed that pearlmillet yields were improved and there was an increase of 15% in net income (Rs. 800/ha) earned by farmers through simple inoculation (Table 13). A number of field experiments with different rice varieties grown in Alfisols and Vertisols in Tamilnadu have consistently proved over the last five years that by applying AZOPHOS, a mixed Biofertilizer comprising of Azospirillum and Phosphate solubilising bacteria (PSB) through dipping of the rice seedlings in a slurry of the inoculum at transplanatation, about 25% recommended dose of N and P can be saved, i.e., yields at 75% NP with inoculum are at par with 100% recommended dose of NP (Table 14). This was additionally proved by also using leaf colour charts in which not only a saving of 15 kg N/ha but significantly higher yield was obtained with Azophos inoculation. (Table 15). In a long term experiment started seven years ago on inoculation of Bradyrhizobium japonicum in soybean and Azotobacter inoculation in wheat in Vertsisols of M.P., additional grain yields of about 200 kg in soybean and 300 kg in wheat have been recorded due to inoculation (Table 16) over and above the recommended dose of NPK. In
354
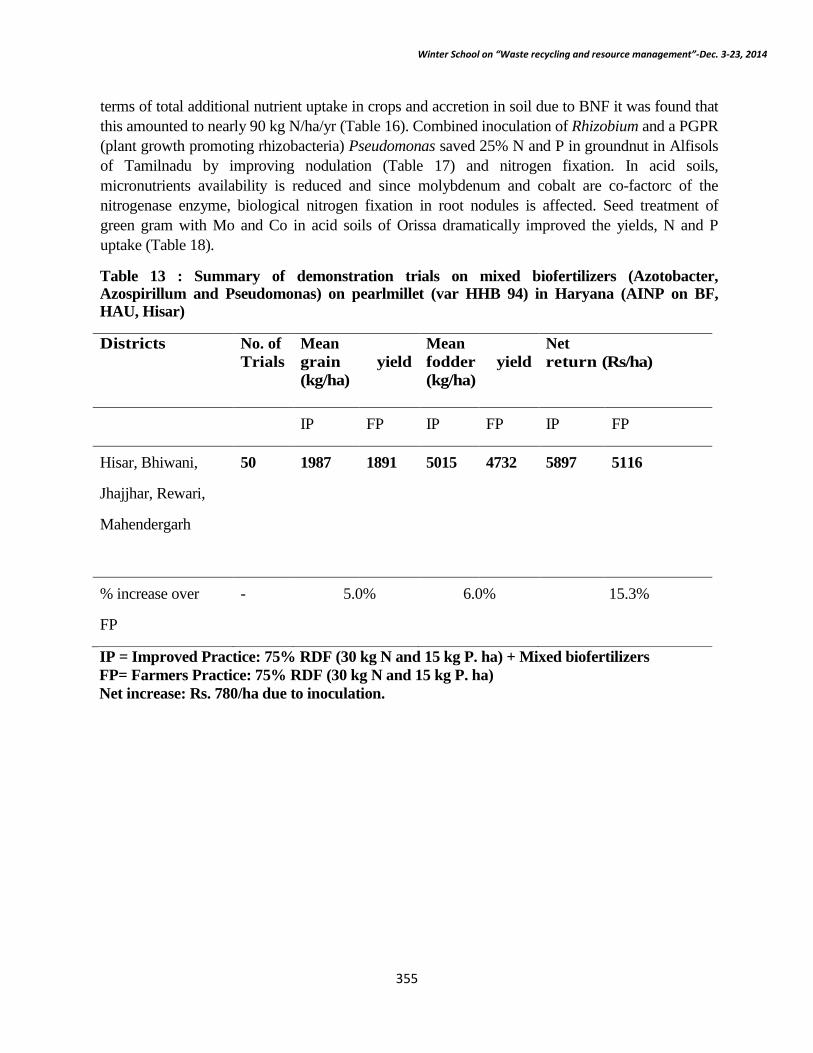
Winter School on “Waste recycling and resource management”-Dec. 3-23, 2014
terms of total additional nutrient uptake in crops and accretion in soil due to BNF it was found that this amounted to nearly 90 kg N/ha/yr (Table 16). Combined inoculation of Rhizobium and a PGPR (plant growth promoting rhizobacteria) Pseudomonas saved 25% N and P in groundnut in Alfisols of Tamilnadu by improving nodulation (Table 17) and nitrogen fixation. In acid soils, micronutrients availability is reduced and since molybdenum and cobalt are co-factorc of the nitrogenase enzyme, biological nitrogen fixation in root nodules is affected. Seed treatment of green gram with Mo and Co in acid soils of Orissa dramatically improved the yields, N and P uptake (Table 18).
Table 13 : Summary of demonstration trials on mixed biofertilizers (Azotobacter, Azospirillum and Pseudomonas) on pearlmillet (var HHB 94) in Haryana (AINP on BF, HAU, Hisar)
Districts
No. of Trials
Mean grain yield (kg/ha)
Mean fodder yield (kg/ha)
Net return (Rs/ha)
IP FP IP FP IP FP
Hisar, Bhiwani,
Jhajjhar, Rewari,
Mahendergarh
50 1987 1891 5015 4732 5897 5116
% increase over
FP
- 5.0% 6.0% 15.3%
IP = Improved Practice: 75% RDF (30 kg N and 15 kg P. ha) + Mixed biofertilizers FP= Farmers Practice: 75% RDF (30 kg N and 15 kg P. ha) Net increase: Rs. 780/ha due to inoculation.
355

Winter School on “Waste recycling and resource management”-Dec. 3-23, 2014
Table 14 : Effect of Azophos* on rice (var. ASD 18) (AICRP-BNF, TNAU, Coimbatore)
Treatment Grain yield (kg ha'1)
(var. ASD 18)
Grain yield (kg ha'1)
(var. white ponni)
100%N + P
Uninoculated
Azophos
4343
4520
5905
75%N + P
Uninoculated
Azophos
CD
3766
4416
492
5760
6000
240
*Azospirillum + PSB mixed in same packet.
100% NPK was 120: 38: 36.
Table 15. Effect of Azophos* inoculation on yield and N P uptake of rice (var. ASD 18) (AICRP-BNF, TNAU, Coimbatore)
SI. No. Treatment
Grain yield
(kg ha-1)
Nutrient uptake (kg ha-1)
N
P
1
+ NPK, - Inoculum
2658
49.0
8.7
2
+ NPK, + Azophos
2881
57.1
10.6
3.
N LCC Grade 3
3053
58.0
10.7
(105 kg /ha) + Azophos
CD= 0.05
190
8.8
1.5
*Azospirillum + PSB mixed in same packet. 100% NPK was 120: 38: 36.
356

Winter School on “Waste recycling and resource management”-Dec. 3-23, 2014
Table 16 : Yield and N benefits due to Rhizobium inoculation of soybean and Azotobacter inoculation of wheat (av. of 6 years 1999-2005) in Vertisols (AICRP-BNF, JNKW, Jabalpur)
Treatment
Soybean yield (kg/ha)
Wheat yield (kg/ha)
Soybean N uptake (kg/ha)
Wheat N uptake (kg/ha)
SoilN increment (kg/ha/yr) in Soybean- wheat
Total N benefit due to use of inoculants (kg/ha)
A
B
C
D
E
C+D+E
Uninoculated
1651
4980
132
109
1425
Inoculated
1855
5296
149
124
1486
Gain
204
316
17
15
61
93
* N, P and K were applied at 20 : 80 : 20 to all plots in soybean
Table 17: Effect of combined inoculation of Rhizobium (TNAU 14) and plant growth promoting harmones (PGPR) (Pseudomonas- PS2) on groundnut (AICRP-BNF, Coimbatore).
Treatment
Nodule (no./ pi)
Nodule Dry weight (rag/pi)
Pod yield (kg/ ha)
% increase over control
100% NP
Uninoculated
20
120
1333
-
Rhizobium + Pseudomonas
47
220
1492
11.9
75% NP
Uninoculated
21
100
1001
--
Rhizobium + Pseudomonas
39
270
1278
27.6
L.S.D.
(P=0.05)
3
35
6»
-
: Inoculation saved 25% of the recommended doses of N and P in groundnut.
357

Winter School on “Waste recycling and resource management”-Dec. 3-23, 2014
Table 18 : Impact of combined application of Rhizobium and micronutrients on yield and nutrient uptake of green gram in an acid loam (AICRP-BNF, OUAT, Bhubaneswar)
Treatment
Grain
(k /h )
Stover
(k /h )
N uptake
(k /h )
P uptake
(k /h )
Uninoculated
340
300
21.4
1.9
Rhizobium
430
340
28.5
2.5
Rhizobium + Mo + Co
610
680
45.4
4.4
LSD (p=0.05)
50
60
2.4
048
*Figures in parenthesis denote per cent increase over uninoculated control; recommended doses of NPK were applied.
Effect of organic manure application on soil properties
Organic manures application plays a vital role in maintenance of chemical, biochemical and biological properties of soils, besides supplementing macro and micro nutrients to crop. The deficiency of micro nutrients particularly of Zn, Fe, B, Mn, Cu and Mo is becoming a yield limiting factor in most of the soils. The better quality of the produce obtained with the application of manures, is not due to differences in the nature and properties of the nutrients supplied through manures and fertilizers. To avoid the wastage of resources and to minimize the environmental damage there is a need to adopt better nutrient management practices like balanced fertilization or application of organics in combination with chemical fertilizers to increase nutrient availability (N, P, K, Ca, Mg and S) and improve soil physical, chemical and biological conditions, thereby, enhancing quality of produce and helping in sustainability of Agriculture.
Results of long-term fertilizer experiment in Tamil Nadu, India on nutrient availability in the soil under different fertilizer and manure treatments revealed that inclusion of farmyard manure with inorganic fertilizers had a positive effect on all the organic N fractions (Santhy et al. 1998). A long term field experiment in Akola, India, under sorghum-wheat cropping sequence on a Vertisol during the seventh cycle showed that the combination of fertilizers with farmyard manure increased the organic carbon and available NPK status of soil (Vaidya and Gabhane, 1998).
Field studies on the effect of farm wastes and organic manures on soil properties and nutrient availability on sodic Vertisols at Parbhani, Maharashtra indicated that among the treatments pressmud (filter cake), dried biogas slurry, FYM, and wheat straw the treatment of 25 t FYM + 20t pressmud/ha was the best for increasing yields of rice and wheat. In general, all the treatments decreased the pH and exchangeable sodium percentage (ESP) of the soil. The infiltration rates increased due to application of organic wastes and manures. All the treatments increased the contents of organic carbon, available N, P and K in soil, particularly FYM+ pressmud (More, 1994).
358

Winter School on “Waste recycling and resource management”-Dec. 3-23, 2014
Madhumita et al. (1991) studied the influence of organic manures on native plant nutrient availability in an acid Alfisol from Meghalaya and reported that the relative efficiency of the organic manures in improving soil fertility followed the order: poultry manure>pig manure> farmyard manure. Kwakye (1988) studied the influence of organic manure in combination with mineral fertilizers on crop yields and soil properties on a savanna soil in Ghana under continuous cropping. The application of manure in combination with N, P and K had no significant effects en crop yields. Application of N, P and K significantly increased the respective nutrient elements in the soil. The fertility status of the soil was maintained chiefly by manuring which significantly increased the levels of organic C, total N and available P and K. Soil pH was significantly reduced by the N, P and manure treatment.
Sharma and Gupta (1998) reported that among the different organic sources, farmyard manure proved superior to blackgram (Vigna mungo) straw followed by white popinac leaves, while wheat straw gave poor results. The water-holding capacity, organic carbon, available nitrogen and phosphours in soil increased with increased in the organic residues while available K and bulk density decreased. An experiment on the organic farming of sweetcorn and vegetable soybeans by Hsieh and Hsu (1993) using composted pig manure, cattle manure, chicken manure, or mixtures of composted cattle and chicken or pig arid chicken manure indicted that use of manures increased soil pH, organic matter (OM), available P, exchangeable K and Mg and extractable Mn, Zn and Cu, and decreased soil salinity and extractable Fe. Results of organic farming experiment at IISS, Bhopal revealed that organic carbon content and soil biological activities were improved with the application of various organic manures compared to control under soybean and wheat cropping system in vertisol.
References:
Agrawal Pragya, Bhattacharya Leena, Kulshrestha Kalpana and Mahapatra BS (2007). Effect of organic, inorganic and integrated methods of cultivation on quality of fresh green peas. Journal of Eco-friendly Agriculture, 2 (1): 20-22.
Anonymous (1998). Manure nutrient availability. Section 2, soil Fertility Manual. Penn State Agronomy Guide 1997-98.
Agricultural Statistics at a Glance (2004). Agricultural Statistics Division, Directorate of Economics R Statistics , Dept. of Agriculture, Govt. of India p 1-221.
Bahadur Anant, Singh Jagdish, Upadhyay AK and Singh KP (2003). Effect of organic manure and biofertilizers on growth, yield and quality attributes of broccoli (Brassica oleracea L. var. italicaplenk). Vegetable Science. Vol. 30:192-194
Barkdoll AW, Nordsedt RA and Mithchell DJ (2002). Large Scale utilization and composting of yard waste, CIR 1027: 1-15. Agricultural and Biological Engineering Department, Florida Cooperative Extension Service, Institute of Food and Agricultural Sciences, University of Florida.
359

Winter School on “Waste recycling and resource management”-Dec. 3-23, 2014
Edward D R and Daniel TC. (1992). A review on poultry manure. Bioresource Technology 41: 91-
02.
Eghbal, and Power, J.F. (1994). Beef cattle feedlot manure management. Journal of Soil and Water Conservation. 49: 2,113-122.
Gagnon, B., Robitaille, R., Simard, R.R. (1999). Characterization of several on-farm industrial composted materials. Canadian J. Soil Sci. 79 (1): 201-210
Ghai Deepti, Kalpana Kulshrestha, Leena Bhattacharya and Mahapatra BS (2006). Quality evaluation of lentil and rice grown by inorganic and organic mode of cultivation. Journal of Eco-friendly Agriculture, 1 (2): 117-119.
Harada Y (1995). Practical aspects of animal waste composting. PP 64-86. In: Lecture of International training course on microbial fertilizers and composting. Rural development Administration (Republic of Korea) and Food and Fertilizer Technology Centre for Asian and Pacific Region.
Hsieh, C.F. and Hsu, KN. (1993). An experiment on the organic farming of sweet corn and vegetable soybeans. Bulletin of Taichftag District Agricultural Improvement Station. No. 39,29-39.
Kumari KU, Kumari PP and Padmaja P (1997). Efficiency of vermicompost on yield and quality of banana (AB) CV. Nyalipoovan. South Indian Horticulture, 45: 158-160.
Kundu, O.K. and Pillai, K.G. (1992) Integrated nutrient supply systems in rice and rice based cropping systems. Ferti. News. 37 (4), 35-41.
Kwakye, P.K. (1988). The influence of organic matter in combination with mineral fertilizers on crop yields and scil properties on a savanna soil in Ghana under continuous cropping. International Journal of Tropical Agriculture. 6: 57-67.
Lin CW (1999). Composting of Livestock feces. Composting Technology, pp 107-141. In: Special Bulletin No 88 of Taiwan Agricultural Research Institute, CO A, Republic of China.
Madhumita, D, Singh, BP, Munna Ram, Dwivedi BS and Prasad RN (1991). Influence of organic manures on native plant nutrient availability in an acid Alfisol. J. Indian Soc. Soil Sci. 39:286-291.
Mannheim T, Braschkat J and Marschner H (1995). Reduction of ammonia emission after application of liquid cattle manure on arable land and grassland: Comparision of wide spread application, application in narrow bands and injection. Zeitschrift-fur-Pflanzenernahrung-und-Bodenkunde, 158: 535-542.
Manna MC, Ganguly, T.K, Ghosh PK, Singh AB and Tripathi AK (2006). Phospho- Sulpho - Nitro Compost: Production and Evaluation. Bulletin No. 2/2006, pp 1-11.
Mohan Singh (2009). Enrichment Technology for Improving the Compost quality. Published In: Efficient Use of On-farm and off farm Resources in organic farming Edited by (P Ramesh and A Subba Rao), pp, 126-138.
360

Winter School on “Waste recycling and resource management”-Dec. 3-23, 2014
More, S.D (1994). Effect of farm wastes and organic manures on soil properties, nutrient
availability and yield of rice-wheat grown on sodic Vertisol. J. Indian Soc. Soil Sci. 42:253-256.
Prasad, B., Prasad, J. and Prasad, R. (1995). Nutrient management for sustainable rice and wheat production in calcareous soil amended with green manure, organic manures and zinc. Ferti. News. 40 (3), 39-41,43,45.
Reganold John P, Glover Jerry D,. Andrews Preston K and Hinman Herbert R (2001). Sustainability of three apple production systems. Nature 40: 926-929.
Santhy, P, Sankar, SJ, Muthuvel, P and Selvi, D. (1998). Long term fertilizer experiments status of N, P and K fractions in soil, J. Indian Soc. Soil Sci. 46: 395-398.
Sharma, M.P. and Gupta, J.P. (1998). Effect of organic materials on grain yield and soil properties in maize (Zea mays)- wheat (Triticum aestivum) copping system. Indian J. Agric. Sci. 68:715-717.
Singh, AB, Manna, MC, Ganguly, TK and Tripathi AK (2005). Vermicomposting: A technology for recycling of organic wastes. Bulletin No l/2005.pp 1-13.
Singh AB, Saha JK and Ghosh PK (2008). Effect of nutrient management practices on soybean (Glycine mo*) - chickpea (Cicer arietinum) cropping system for improving yield, quality and soil biological health under rain fed condition Indian Journal of Agricultural Sciences 78(6): 485-489.
Singh AB, Ramesh P, Panwar NR and Ramana S (2008). Nutritional quality of soybean (Glycine max), wheat (Triticum durum) and chickpea (Cicer arietinum) and soil biological properties as influenced by different organic manures Indian Journal of Agricultural Sciences 78(9): 781-784.
Semwal Pooja, Leena Bhattacharya, Kalpana Kulshrestha and Mahapatra BS (2006).Quality evaluation of Pusa Basmati-1 rice grown by organic, inorganic and integrated methods of cultivation. Journal of Eco-friendly Agriculture, 2 (2): 113-115.
Tendon HL S (1997). Fertilizers, organic manures, recycling wastes and bio-fertilizers. Fertilizer Development and consultation Organization, New Delhi
Tripathi SB, Yadav RB and Pathak PS (2003). Nutrient Mining in Bundelkhand Agro-climate zone of Uttar Pradesh. Fertilizer News Vol. 48(11), pp 33-50.
Vaidya, P.H. and Gabhane, V.V. (1998). Availability of nutrients in Vertisol as influenced by sorghum-wheat cropping sequence. Journal of Soils and Crops. 8: 70-72.
Warman, Z.Y. and Qing, C.L. (1994). Studies on nitrogen miner crops and their influence on brassica and tomato growth, and on tissue and soil copper, manganese and zinc. Biological Agriculture and Horticulture. 6: 325-335.
Watson C.A. D. Atkinson, P Gosling, LR Jackson and F. W. Rayns (2002). Managing soil fertility in organic farming systems. Soil use and Management, 18:239-247.
361
Winter School on “Waste recycling and resource management”-Dec. 3-23, 2014
Walia Sohan Singh and Her, DS (2007). Ecological studies on organic VS inorganic nutrient
sources under diversified cropping systems. Indian journal of fertilizers Vol 3 (7): 55-62 & 74.
Yadvinder Singh, Khind, C.S. and Bijay Singh (1991). Efficient management of leguminous green manure in wetland rice. Adv. Agron. 45,135-189.
Yadvinder Singh, Dobermann, A, Bijay Singh, Bronson, KF and Khind, CS. (2002). Optimal phosphorus management strategies for wheat-rice cropping on a loamy sand. Soil Sci. SocAm. J. 64,1413-1422.
362

Winter School on “Waste recycling and resource management”-Dec. 3-23, 2014
Effect of use of sewage water, MSW and city wastes on crop quality parameters
Ajay
IISS, Bhopal – 462038 [email protected]
In many arid and semi-arid countries water is becoming an increasingly scarce resource
and planners are forced to consider any sources of water which might be used economically and effectively to promote further development. At the same time, with population expanding at a high rate, the need for increased food production is apparent. The potential for irrigation to raise both agricultural productivity and the living standards of the rural poor has long been recognized. Irrigated agriculture occupies approximately 17 percent of the world's total arable land but the production from this land comprises about 34 percent of the world total. This potential is even more pronounced in arid areas, such as the Near East Region, where only 30 percent of the cultivated area is irrigated but it produces about 75 percent of the total agricultural production. In this same region, more than 50 percent of the food requirements are imported and the rate of increase in demand for food exceeds the rate of increase in agricultural production.
Whenever good quality water is scarce, water of marginal quality will have to be considered for use in agriculture. Although there is no universal definition of 'marginal quality' water, for all practical purposes it can be defined as water that possesses certain characteristics which have the potential to cause problems when it is used for an intended purpose. For example, brackish water is marginal quality water for agricultural use because of its high dissolved salt content, and municipal wastewater is marginal quality water because of the associated health hazards. From the viewpoint of irrigation, use of’marginal’ quality water requires more complex management practices and more stringent monitoring procedures than when good quality water is used. This lecture deals with agricultural use of municipal wastewater, which is primarily domestic sewage but possibly contains a proportion of industrial effluents discharged to public sewers.
Expansion of urban populations and increased coverage of domestic water supply and sewerage give rise to greater quantities of municipal wastewater. With the current emphasis on environmental health and water pollution issues, there is an increasing awareness of the need to dispose of these wastewaters safely and beneficially. Nevertheless, wastewater use will result in the conservation of higher quality water and its use for purposes other than irrigation. As the marginal cost of alternative supplies of good quality water will usually be higher in water-short areas, it makes good sense to incorporate agricultural reuse into water resources and land use planning. Properly planned use of municipal wastewater alleviates surface water pollution problems and not only conserves valuable water resources but also takes advantage of the nutrients contained in sewage to grow crops.
Many countries have included wastewater reuse as an important dimension of water resources planning. In the more arid areas of Australia and the USA wastewater is used in agriculture, releasing high quality water supplies for potable use. Some countries, for example the Hashemite Kingdom of Jordan and the Kingdom of Saudi Arabia, have a national policy to reuse all treated wastewater effluents and have already made considerable progress towards this end.
363

Winter School on “Waste recycling and resource management”-Dec. 3-23, 2014
Example 1 - agronomic and economic benefits of wastewater use in irrigation
A city with a population of 500,000 and water consumption of 200 l/d per person would produce approximately 85,000 m3/d (30 Mm³/year) of wastewater, assuming 85% inflow to the public sewerage system. If treated wastewater effluent is used in carefully controlled irrigation at an application rate of 5000 m3/ha.year, an area of some 6000 ha could be irrigated. In addition to the economic benefit of the water, the fertilizer value of the effluent is of importance. With typical concentrations of nutrients in treated wastewater effluent from conventional sewage treatment processes as follows:
Nitrogen (N) - 50 mg/l Phosphorus(P) - 10 mg/l Potassium (K) - 30 mg/l
and assuming an application rate of 5000 m3/ha.year, the fertilizer contribution of the effluent would be:
N - 250 kg/ha. year P - 50 kg/ha. year
K - 150 kg/ha. year Thus, all of the nitrogen and much of the phosphorus and potassium normally required
for agricultural crop production would be supplied by the effluent. In addition, other valuable micronutrients and the organic matter contained in the effluent will provide additional benefits.
1. Properties Determining Plant Quality Overall quality may be defined as the sum (or product) of individual properties that
enable a plant or plant product to meet the requirements of a user or consumer. Table 1 show that overall quality depends on both physical and chemical plant properties. Physical properties determine nearly exclusively the outward appearance and thus the marketable yield of vegetables and fruits for direct consumption. To achieve required quality standards, vegetable growers often apply very high doses of nitrogen, irrespective of adverse environmental impacts and the nutritional quality of the product.
Nutritional and sensory quality is, however, mainly determined by the chemical composition of a plant including both quality-improving and quality-reducing compounds. Quality may be improved by high concentrations of essential minerals, carbohydrates, nitrogenous compounds, such as essential amino acids, lipids, organic acids, flavors, vitamins and bioactive compounds (secondary compounds or accessory health factors). Most of these groups of substances also include, however, quality- reducing compounds, for example heavy metals, nitrate, oxalate and so-called antinutrients. It is worth mentioning that a number of compounds (e.g., phytic acid, dietary fiber) simultaneously show typical features of an antinutrient (e.g., due to adverse effects on mineral element bioavailability), as well as typical features of an accessory health factor (e.g., due to anticarcinogenic activity). In contrast to marketable yield and nutritional quality, processing quality (including cooking quality) depends on both physical and chemical properties of the harvested plant part. In addition to these parameters directly determining crop quality, one may also include production quality, i.e., environmental impacts of crop production, into an overall quality concept.
364
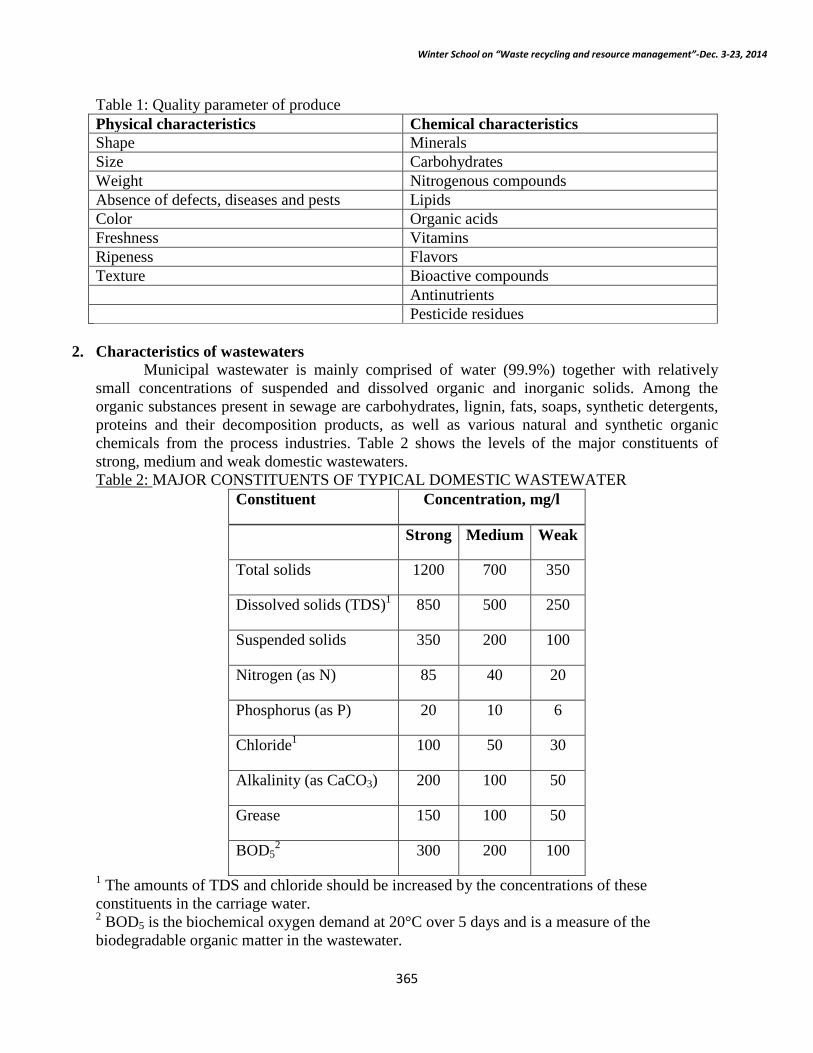
Winter School on “Waste recycling and resource management”-Dec. 3-23, 2014
Table 1: Quality parameter of produce Physical characteristics Chemical characteristics Shape Minerals Size Carbohydrates Weight Nitrogenous compounds Absence of defects, diseases and pests Lipids Color Organic acids Freshness Vitamins Ripeness Flavors Texture Bioactive compounds Antinutrients Pesticide residues
2. Characteristics of wastewaters
Municipal wastewater is mainly comprised of water (99.9%) together with relatively small concentrations of suspended and dissolved organic and inorganic solids. Among the organic substances present in sewage are carbohydrates, lignin, fats, soaps, synthetic detergents, proteins and their decomposition products, as well as various natural and synthetic organic chemicals from the process industries. Table 2 shows the levels of the major constituents of strong, medium and weak domestic wastewaters. Table 2: MAJOR CONSTITUENTS OF TYPICAL DOMESTIC WASTEWATER
Constituent Concentration, mg/l
Strong Medium Weak
Total solids 1200 700 350
Dissolved solids (TDS)1 850 500 250
Suspended solids 350 200 100
Nitrogen (as N) 85 40 20
Phosphorus (as P) 20 10 6
Chloride1 100 50 30
Alkalinity (as CaCO3) 200 100 50
Grease 150 100 50
BOD52 300 200 100
1 The amounts of TDS and chloride should be increased by the concentrations of these constituents in the carriage water. 2 BOD5 is the biochemical oxygen demand at 20°C over 5 days and is a measure of the biodegradable organic matter in the wastewater.
365

Winter School on “Waste recycling and resource management”-Dec. 3-23, 2014
Source: UN Department of Technical Cooperation for Development (1985)
Table 3: US-EPA water quality guidelines for irrigation with reclaimed water (from Crook and Surampalli 1996) Use Reclaimed water quality Treatment
Urban, irrigation of crops eaten raw,
pH 6>9 secondary filtration and
recreational impoundment’s ≤10 mg/L BOD disinfection
≤2 NTU
no detectable FC/100mL
≤1 mg/L Cl2 residual
Irrigation of restricted access areas
pH 6>9 secondary and disinfection
and processed food crops, aesthetic
≤30 mg/L BOD
impoundments, construction uses,
≤30mg/L SS
industrial cooling, environmental
≤200 FC/100mL
reuse ≤1 mg/L Cl2 residual
Groundwater recharge of non potable
site specific and use dependent
site specific and use dependent,
aquifers by spreading primary (minimum)
Groundwater recharge of non potable
site specific and use dependent
site specific and use dependent,
aquifers by injection secondary (minimum)
Groundwater recharge of potable
site specific site specific, secondary and
aquifers by spreading meet drinking water standards disinfection (minimum)
366

Winter School on “Waste recycling and resource management”-Dec. 3-23, 2014
after
percolation through vadose zone
Groundwater recharge of potable
Includes the following: includes the following;
aquifers by injection, augmentation
pH 6>8.5 secondary, filtration,
of surface supplies ≤2 NTU disinfection, advanced
no detectable FC/100mL wastewater treatment
≤1 mg/L Cl2 residual
meet drinking water standards
BOD=biological oxygen demand, NTU= nephelometric turbidity units, SS= suspended solids.
Municipal wastewater also contains a variety of inorganic substances from domestic and industrial sources, including a number of potentially toxic elements such as arsenic, cadmium, chromium, copper, lead, mercury, zinc, etc. Even if toxic materials are not present in concentrations likely to affect humans, they might well be at phytotoxic levels, which would limit their agricultural use. However, from the point of view of health, a very important consideration in agricultural use of wastewater, the contaminants of greatest concern are the pathogenic micro- and macro-organisms.
Pathogenic viruses, bacteria, protozoa and helminths may be present in raw municipal wastewater at the levels and will survive in the environment for long periods. Pathogenic bacteria will be present in wastewater at much lower levels than the coliform group of bacteria, which are much easier to identify and enumerate (as total coliforms/100ml). Escherichia coli are the most widely adopted indicator of faecal pollution and they can also be isolated and identified fairly simply, with their numbers usually being given in the form of faecal coliforms (FC)/100 ml of wastewater.
3. Quality parameters of importance in agricultural use of wastewaters Parameters of health significance Organic chemicals usually exist in municipal wastewaters at very low concentrations and
ingestion over prolonged periods would be necessary to produce detrimental effects on human health. This is not likely to occur with agricultural/aquacultural use of wastewater, unless cross-connections with potable supplies occur or agricultural workers are not properly instructed, and can normally be ignored. The principal health hazards associated with the chemical constituents of wastewaters, therefore, arise from the contamination of crops or ground waters. Hillman (1988) has drawn attention to the particular concern attached to the cumulative poisons, principally heavy metals, and carcinogens, mainly organic chemicals. World Health Organization guidelines for drinking water quality (WHO 1984) include limit values for the organic and toxic substances given in Table 3, based on acceptable daily intakes (ADI). These
367

Winter School on “Waste recycling and resource management”-Dec. 3-23, 2014
can be adopted directly for groundwater protection purposes but, in view of the possible accumulation of certain toxic elements in plants (for example, cadmium and selenium) the intake of toxic materials through eating the crops irrigated with contaminated wastewater must be carefully assessed. Table 3: ORGANIC AND INORGANIC CONSTITUENTS OF DRINKING WATER OF HEALTH SIGNIFICANCE
Organic Inorganic Aldrin and dieldrin Arsenic Benzene Cadmium Benzo-a-pyrene Chromium Carbon tetrachloride Cyanide Chlordane Fluoride Chloroform Lead 2,4 D Mercury DDT Nitrate 1,2 Dichloroethane Selenium 1,1 Dichlorethylene Heptachlor and heptachlor epoxide Hexachlorobenzene Lindane Methoxychlor Pentachlorophenol Tetrachlorethylene 2, 4, 6 Trichloroethylene Trichlorophenol
Source: WHO (1984)
There is only limited evidence indicating that beef tapeworm (Taenia saginata) can be transmitted to the population consuming the meat of cattle grazing on wastewater irrigated fields or fed crops from such fields. However, there is strong evidence from Melbourne, Australia and from Denmark (reported by Shuval et al.1985) that cattle grazing on fields freshly irrigated with raw wastewater, or drinking from raw wastewater canals or ponds, can become heavily infected with the disease (cysticerosis).
Indian studies, reported by Shuval et al. (1986), have shown that sewage farm workers exposed to raw wastewater in areas where Ancylostoma (hookworm) and Ascaris (nematode) infections are endemic have significantly excess levels of infection with these two parasites compared with other agricultural workers in similar occupations. Furthermore, the studies indicated that the intensity of the Ascaris infections (the number of worms infesting the intestinal tract of an individual) in the sample of sewage farm workers was very much greater than in the control sample. In the case of the hookworm infections, the severity of the health effects was a function of the worm load of individuals, which was found to be related to the degree of exposure and the length of time of exposure to the hookworm larvae. Sewage farm workers are also liable to become infected with cholera if practicing irrigation with raw wastewater derived from an urban area in which a cholera epidemic is in progress (Shuval et al. 1985). Morbidity and serological studies on wastewater irrigation workers or wastewater treatment plant workers
368

Winter School on “Waste recycling and resource management”-Dec. 3-23, 2014
occupationally exposed to wastewater directly and to wastewater aerosols have not been able to demonstrate excess prevalence of viral diseases.
No strong evidence has been adduced to suggest that population groups residing near wastewater treatment plants or wastewater irrigation sites are at greater risk from pathogens in aerosolized wastewater resulting from aeration processes or sprinkler irrigation. Shuval et al. (1986) suggest that the high levels of immunity against most viruses endemic in the community essentially block environmental transmission by wastewater irrigation.
Finally, in respect of the health impact of use of wastewater in agriculture, Shuval et al. (1986) rank pathogenic agents in the order of priority shown in Example 2. They pointed out that negative health effects were only detected in association with the use of raw or poorly-settled wastewater, while inconclusive evidence suggested that appropriate wastewater treatment could provide a high level of health protection. EXAMPLE 2 - RELATIVE HEALTH IMPACT OF PATHOGENIC AGENTS High Risk (high incidence of excess infection)
Helminths (Ancylostoma, Ascaris, Trichuris and Taenia)
Medium Risk (low incidence of excess infection)
Enteric Bacteria (Cholera vibrio, Salmonella typhosa, Shigella and possibly others)
Low Risk (low incidence of excess infection)
Enteric viruses
The following microbiological parameters are particularly important from the health point of view: i. Indicator Organisms
a. Coliforms and Faecal Coliforms. The Coliform group of bacteria comprises mainly species of the genera Citrobacter, Enterobacter, Escherichia and Klebsiella and includes Faecal Coliforms, of which Escherichia coli is the predominant species. Several of the Coliforms are able to grow outside of the intestine, especially in hot climates; hence their enumeration is unsuitable as a parameter for monitoring wastewater reuse systems. The Faecal Coliform test may also include some non-faecal organisms which can grow at 44°C, so the E. coli count is the most satisfactory indicator parameter for wastewater use in agriculture.
b. Faecal Streptococci. This group of organisms includes species mainly associated with animals (Streptococcus bovis and S. equinus), other species with a wider distribution (e.g. S. faecalis and S. faecium, which occur both in man and in other animals) as well as two biotypes (S. faecalis var liquefaciens and an a typical S. faecalis that hydrolyzes starch) which appear to be ubiquitous, occurring in both polluted and non-polluted environments. The enumeration of Faecal Streptococci in effluents is a simple routine procedure but has the following limitations: the possible presence of the non-faecal biotypes as part of the natural microflora on crops may detract from their utility in assessing the bacterial quality of wastewater irrigated crops; and the poorer survival of Faecal Streptococci at high than at low temperatures. Further studies are still warranted on the use of Faecal Streptococci as an indicator in tropical conditions and especially to compare survival with that of Salmonellae.
369

Winter School on “Waste recycling and resource management”-Dec. 3-23, 2014
c. Clostridium perfringens. This bacterium is an exclusively faecal spore-forming anaerobe
normally used to detect intermittent or previous pollution of water, due to the prolonged survival of its spores. Although this extended survival is usually considered to be a disadvantage for normal purposes, it may prove to be very useful in wastewater reuse studies, as Clostridium perfringens may be found to have survival characteristics similar to those of viruses or even helminth eggs.
ii. Pathogens The following pathogenic parameters can only be considered if suitable laboratory facilities and suitably trained staff are available:
a. Salmonella spp. Several species of Salmonellae may be present in raw sewage from an urban community in a tropical developing country, including S.typhi (causative agent for typhoid) and many others. It is estimated (Doran et al. 1977) that a count of 7000 Salmonellae/litre is typical in a tropical urban sewage with similar numbers of Shigellae, and perhaps 1000 Vibrio cholera/litre. Both Shigella spp and V. cholera are more rapidly killed in the environment, so if removal of Salmonellae can be achieved, then the majority of other bacterial pathogens will also have been removed.
b. Enteroviruses. May give rise to severe diseases, such as Poliomyelitis and Meningitis, or to a range of minor illnesses such as respiratory infections. Although there is no strong epidemiological evidence for the spread of these diseases via sewage irrigation systems, there is some risk and it is desirable to know to what extent viruses are removed by existing and new treatment processes, especially under tropical conditions. Virus counts can only be undertaken in a dedicated laboratory, as the cell culture techniques required are very susceptible to bacterial and fungal contamination.
c. Rotaviruses. These viruses are known to cause gastro-intestinal problems and, though usually present in lower numbers than enteroviruses in sewage, they are known to be more persistent, so it is necessary to establish their survival characteristics relative to enteroviruses and relative to the indicator organisms in wastewaters. It has been claimed that the removal of viruses in wastewater treatment occurs in parallel with the removal of suspended solids, as most virus particles are solids-associated. Hence, the measurement of suspended solids in treated effluents should be carried out as a matter of routine.
d. Intestinal Nematodes. It is known that nematode infections, in particular from the roundworm Ascaris lumbricoides, can be spread by effluent reuse practices. The eggs of A. lumbricoides are fairly large (45-70 mm x 35-50 mm) and several techniques for enumeration of nematodes have been developed (WHO 1989).
4. Treatment of Human pathogens on irrigated produce
Microbial pathogen numbers are greatly reduced during secondary and tertiary treatment, but disinfection is required prior to exposure to the general public. The effectiveness of this process depends on the quality of the water and disinfection system used. Intestinal protozoan parasites (Giardia and Cryptosporidium) represent the highest risk due to long survival periods in the soil, low infective doses (single organisms can cause infection), practically no host immunity, and the limited possibility of concurrent infection in the home (Hespanhol and Prost 1994). To become infected by a pathogen from reclaimed water requires ingestion of the water, either directly from an irrigation source, or on fruit or vegetables irrigated with reclaimed water. Yates and Gerba (1998) reviewed the literature with respect to microbes in reclaimed water and found there was little evidence to
370

Winter School on “Waste recycling and resource management”-Dec. 3-23, 2014
indicate that microorganisms, including animal viruses, can be translocated into plant tissues (Oron; Sheikh et al. 1999b; Shuval et al. 1997) since both plant roots (Sheikh et al. 1999b), and soils (Pettygrove et al. 1985) effectively filter these out. Even when cucumbers and lettuces were emerged in heavily contaminated water (Shuval et al. 1997) no internal contamination of produce tissue was observed. Although Codd et al. (1999) indicated that some algae and/or their toxins may not be removed from lettuce with cursory washing; there is little evidence to indicate that toxic algae are found in high numbers in reclaimed water. Contamination of food crops with pathogens therefore requires contaminated water to remain on the surface of the crop or within a wound.
Viruses and pathogens die relatively quickly outside of their hosts in the environment (Melloul et al. 2001; Ward et al. 1981) and superficial washing in the home can remove 99.9% of remaining viral contamination (Shuval et al. 1997). Although viruses dosed on refrigerated food have survived for long periods in laboratory studies (Smith 1982), at more usual contamination levels, the risks are minimal. The greatest risks of food contamination comes from leaf crops that are sprinkler irrigated, and perhaps root crops with a high percentage of wounds since these can provide safe environments for microorganisms. In these instances vegetable contamination levels are directly related to the number of organisms in the irrigation water used (Armon et al. 1994).
There have been several studies examining the abundance of human pathogens on fruit and vegetables irrigated with reclaimed or fresh water. In Australia, Kelly and Stevens (2002) reported on bacterial contamination of lettuce, silverbeet, broccoli and cauliflower irrigated with reclaimed water, groundwater, or these vegetables taken from a fruit and vegetable market. Table 11 shows that bacterial populations were on average lower on vegetables taken from fields irrigated with reclaimed water than vegetables irrigated with groundwater or sampled from the marketplace. No data was available on the FC levels from the groundwater sources but the median numbers of E. coli in the reclaimed water were 0/100mL (Table 4). Smith (1982) found that coliform numbers on produce irrigated with reclaimed water were the same as those irrigated with groundwater, and both were lower than levels found on supermarket produce. Viruses were not detected on produce, even one day after irrigation with reclaimed water. Interestingly >97% of viruses seeded on to crops died within 48 hours. However, die-off was slower in the soil Poliovirus survived for 76 days when seeded on to vegetables and stored in a refrigerator. It was concluded that the very low level of viruses detected in the reclaimed water meant that they did not present a health threat on irrigated vegetables, provided that water was stored for two weeks prior to use as was done in this study. Premier et al. (2000) found no significant differences in the microbial contamination of potatoes irrigated with fresh or reclaimed water, although both were higher than unirrigated crops where conditions for growth were less favourable. Table 4: Numbers of bacteria on lettuce, silverbeet, broccoli and cauliflower irrigated with reclaimed water, groundwater, or taken from the supermarket in Adelaide, South Australia (from Kelly and Stevens 2002).
Salmonella Coliforms Faecal Coliforms
E. coli
Source of Produce
(orgs/25g) (orgs/g) (orgs/g) (orgs/g)
371

Winter School on “Waste recycling and resource management”-Dec. 3-23, 2014
Reclaimed Water
0 106 3 1
Groundwater 0 217 101 101
Market Place 0 612 39 38
A field study in France examined coliform levels on crops irrigated with reclaimed water
or non-irrigated (Bunel et al. 1995). Although thermotolerant coliform levels in the reclaimed water were above the prescribed limits at times, the levels of coliforms on reclaimed water irrigated plants were no higher than on unirrigated plants, and thus the conclusion was drawn that these coliforms were unlikely to have originated from reclaimed water. France has adopted the WHO standards for reclaimed water (≤1 intestinal helminth ova and ≤ 1,000 FC/L for direct irrigation), yet less stringent standards are used for subsurface or drip irrigation where wastewater is not put directly on to crops (Marecos do Momonte et al. 1996).
Other glasshouse and field experiments in Europe on lettuce and radish, irrigated with reclaimed water (Bastos and Mara 1995), using drip and furrow methods, showed that bacterial contamination of crops in dry weather was no more than that observed on supermarket produce, even when the quality of the reclaimed water was outside the WHO guidelines. However, when rainfall occurred, Salmonella and higher numbers of coliforms (E. coli) were recovered from lettuce leaf surfaces due to soil splash. Rainfall may thus be an important factor in determining bacterial contamination of vegetables. In France, Stien and Schwartzbrod (1990) examined the changes in the number of helminth ova (Ascaris spp) after high numbers were artificially applied (application method not defined) to crops and soils. The eggs remained viable in the soil for 20 days after which numbers declined very rapidly. After 10 days, when the first measurements were taken, they found no eggs on the leaves of lettuce, radish or chives, while on the below ground fractions of the plants 17-75% of eggs were still present on roots, reducing to 3% on radish roots after 60 days but <1% for the other two crops. Oron et al. (2001) have shown that microbes die off quickly as the soil dries out (<5% moisture content) or as the salinity of the soil increases.
In Morocco, Kouraa et al. (2002) examined faecal coliform and parasite egg (Helminth) contamination of potatoes and lettuce irrigated with raw wastewater, reclaimed water and potable water. There was no indication of the method of irrigation used, however they found levels of pathogens on vegetables irrigated with reclaimed water to be no different from those irrigated with potable water, and well below the WHO standard of 3 FC’s/kg and 0 helminth eggs/100g of crop. In contrast, Al-Lahham et al. (2003) working with furrow irrigated tomatoes in Jordan report FC contamination of tomato fruit skin (300 FC/100g) two orders of magnitude above the WHO limit, even though the water used (2 FC/100mL) was under the WHO limit. For tomatoes irrigated with potable water no faecal coliforms were detected on tomato skins. It is not clear why tomatoes irrigated with the WHO standard water in this study had such a high level of bacterial contamination.
These studies highlight the interactions between irrigation methods, climate, and crop types, which should all be considered as part of a risk minimisation strategy, and indeed are often reflected in guidelines for identifying which irrigation methods are appropriate for a particular reclaimed water grade and crop type (e.g. DHS and EPA SA 1999). This is discussed in more detail later. Although these studies provide evidence that food crops can be contaminated with pathogens they provide no evidence as to whether people will actually become infected, or more specifically, whether the rate of infection will be higher than that recorded if crops were irrigated with other
372

Winter School on “Waste recycling and resource management”-Dec. 3-23, 2014
waters. In many countries there are no limits set for microbial content of foods such as fresh vegetables (Behrsing and Premier 2002). Information on the actual dangers of reclaimed water irrigated foods can only be provided from detailed epidemiological studies of populations (Devaux et al. 2001).
5. Parameters of agricultural significance
The quality of irrigation water is of particular importance in arid zones where extremes of temperature and low relative humidity result in high rates of evaporation, with consequent deposition of salt which tends to accumulate in the soil profile. The physical and mechanical properties of the soil, such as dispersion of particles, stability of aggregates, soil structure and permeability, are very sensitive to the type of exchangeable ions present in irrigation water. Thus, when effluent use is being planned, several factors related to soil properties must be taken into consideration. A thorough treatise on the subject prepared by Ayers and Westcot is contained in the FAO Irrigation and Drainage Paper No 29 Rev. 1 (FAO 1985).
Another aspect of agricultural concern is the effect of dissolved solids (TDS) in the irrigation water on the growth of plants. Dissolved salts increase the osmotic potential of soil water and an increase in osmotic pressure of the soil solution increases the amount of energy which plants must expend to take up water from the soil. As a result, respiration is increased and the growth and yield of most plants decline progressively as osmotic pressure increases. Although most plants respond to salinity as a function of the total osmotic potential of soil water, some plants are susceptible to specific ion toxicity.
Many of the ions which are harmless or even beneficial at relatively low concentrations may become toxic to plants at high concentration, either through direct interference with metabolic processes or through indirect effects on other nutrients, which might be rendered inaccessible. Morishita (1985) has reported that irrigation with nitrogen-enriched polluted water can supply a considerable excess of nutrient nitrogen to growing rice plants and can result in a significant yield loss of rice through lodging, failure to ripen and increased susceptibility to pests and diseases as a result of over-luxuriant growth. He further reported that non-polluted soil, having around 0.4 and 0.5 ppm cadmium, may produce about 0.08 ppm Cd in brown rice, while only a little increase up to 0.82, 1.25 or 2.1 ppm of soil Cd has the potential to produce heavily polluted brown rice with 1.0 ppm Cd.
Important agricultural water quality parameters include a number of specific properties of water that are relevant in relation to the yield and quality crops, maintenance of soil productivity and protection of the environment. These parameters mainly consist of certain physical and chemical characteristics of the water. Table 4 presents a list of some of the important physical and chemical characteristics that are used in the evaluation of agricultural water quality. The primary wastewater quality parameters of importance from an agricultural viewpoint are:
Table 4: PARAMETERS USED IN THE EVALUATION OF AGRICULTURAL WATER QUALITY
Parameters Symbol Unit Physical Total dissolved solids TDS mg/l Electrical conductivity Ecw dS/m1 Temperature T °C Colour/Turbidity NTU/JTU2
373

Winter School on “Waste recycling and resource management”-Dec. 3-23, 2014
Hardness mg equiv. CaCO3/l Sediments g/l Chemical Acidity/Basicity pH Type and concentration of anions and cations: Calcium Ca++ me/l3 Magnesium Mg++ me/l Sodium Na+ me/l Carbonate CO3
-- me/l Bicarbonate HCO3
- me/l Chloride Cl- me/l Sulphate SO4
-- me/l Sodium adsorption ratio SAR Boron B mg/l4 Trace metals mg/l Heavy metals mg/l Nitrate-Nitrogen NO3-N mg/l Phosphate Phosphorus PO4-P mg/l Potassium K mg/l
1 dS/m = deciSiemen/metre in SI Units (equivalent to 1 mmho/cm) 2 NTU/JTU = Nephelometric Turbidity Units/Jackson Turbidity Units 3 me/l = milliequivalent per litre 4 mg/l == milligrams per litre = parts per million (ppm); also, mg/l ~ 640 x EC in dS/m Source: Kandiah (1990a)
I. Total Salt Concentration
Total salt concentration (for all practical purposes, the total dissolved solids) is one of the most important agricultural water quality parameters. This is because the salinity of the soil water is related to, and often determined by, the salinity of the irrigation water. Accordingly, plant growth, crop yield and quality of produce are affected by the total dissolved salts in the irrigation water. Equally, the rate of accumulation of salts in the soil, or soil salinization, is also directly affected by the salinity of the irrigation water. Total salt concentration is expressed in milligrams per litre (mg/l) or parts per million (ppm).
II. Electrical Conductivity Electrical conductivity is widely used to indicate the total ionized constituents of water. It is directly related to the sum of the cations (or anions), as determined chemically and is closely correlated, in general, with the total salt concentration. Electrical conductivity is a rapid and reasonably precise determination and values are always expressed at a standard temperature of 25°C to enable comparison of readings taken under varying climatic conditions. It should be noted that the electrical conductivity of solutions increases approximately 2 percent per °C increase in temperature. In this publication, the symbol ECw, is used to represent the electrical conductivity of irrigation water and the symbol ECe is used to designate the electrical conductivity of the soil saturation extract. The unit of electrical conductivity is deciSiemen per metre (dS/m).
374

Winter School on “Waste recycling and resource management”-Dec. 3-23, 2014
III. Sodium Adsorption Ratio
Sodium is an unique cation because of its effect on soil. When present in the soil in exchangeable form, it causes adverse physico-chemical changes in the soil, particularly to soil structure. It has the ability to disperse soil, when present above a certain threshold value, relative to the concentration of total dissolved salts. Dispersion of soils results in reduced infiltration rates of water and air into the soil. When dried, dispersed soil forms crusts which are hard to till and interfere with germination and seedling emergence. Irrigation water could be a source of excess sodium in the soil solution and hence it should be evaluated for this hazard. The most reliable index of the sodium hazard of irrigation water is the sodium adsorption ration, SAR. The sodium adsorption ratio is defined by the formula:
where the ionic concentrations are expressed in me/l. A nomogram for determining the SAR value of irrigation water is presented in Figure 3 (US Salinity Laboratory 1954). An exchangeable sodium percentage (ESP) scale is included in the nomogram to estimate the ESP value of the soil
that is at equilibrium with the irrigation water. Using the nomogram, it is possible to estimate the ESP value of a soil that is at equilibrium with irrigation water of a known SAR value. Under field conditions, the actual ESP may be slightly higher than the estimated equilibrium value because the total salt concentration of the soil solution is increased by evaporation and plant trans-piration, which results in a higher SAR and a corres-pondingly higher ESP value. It should also be noted that the SAR from Eq 1 does not take into account changes in calcium ion concentration in the soil water due to changes in solubility of calcium resulting from precipitation or dissolution during or following irrigation. However, the SAR calculated according to Eq 1 is considered an acceptable evaluation procedure for most of the irrigation waters encountered in agriculture. If significant precipitation or dissolution of calcium due to the effect of carbon dioxide (CO2), bicarbonate (HCO3
-) and total salinity (ECw) is suspected, an alternative procedure for calculating an Adjusted Sodium Adsorption Ratio, SARadj. can be used. The details of this procedure are reported by Ayers and Westcot (FAO (1985).
IV. Toxic Ions Irrigation water that contains certain ions at concentrations above threshold values
can cause plant toxicity problems. Toxicity normally results in impaired growth, reduced yield, changes in the morphology of the plant and even its death. The degree of damage depends on the crop, its stage of growth, the concentration of the toxic ion, climate and soil conditions.
The most common phytotoxic ions that may be present in municipal sewage and treated effluents in concentrations such as to cause toxicity are: boron (B), chloride (Cl) and sodium (Na). Hence, the concentration of these ions will have to be determined to assess the suitability of waste-water quality for use in agriculture.
V. Trace Elements and Heavy Metals A number of elements are normally present in relatively low concentrations, usually less than a few mg/l, in conventional irrigation waters and are called trace elements. They are not normally included in routine analysis of regular irrigation water, but attention should be paid to them when using sewage effluents, particularly if contamination with industrial
375
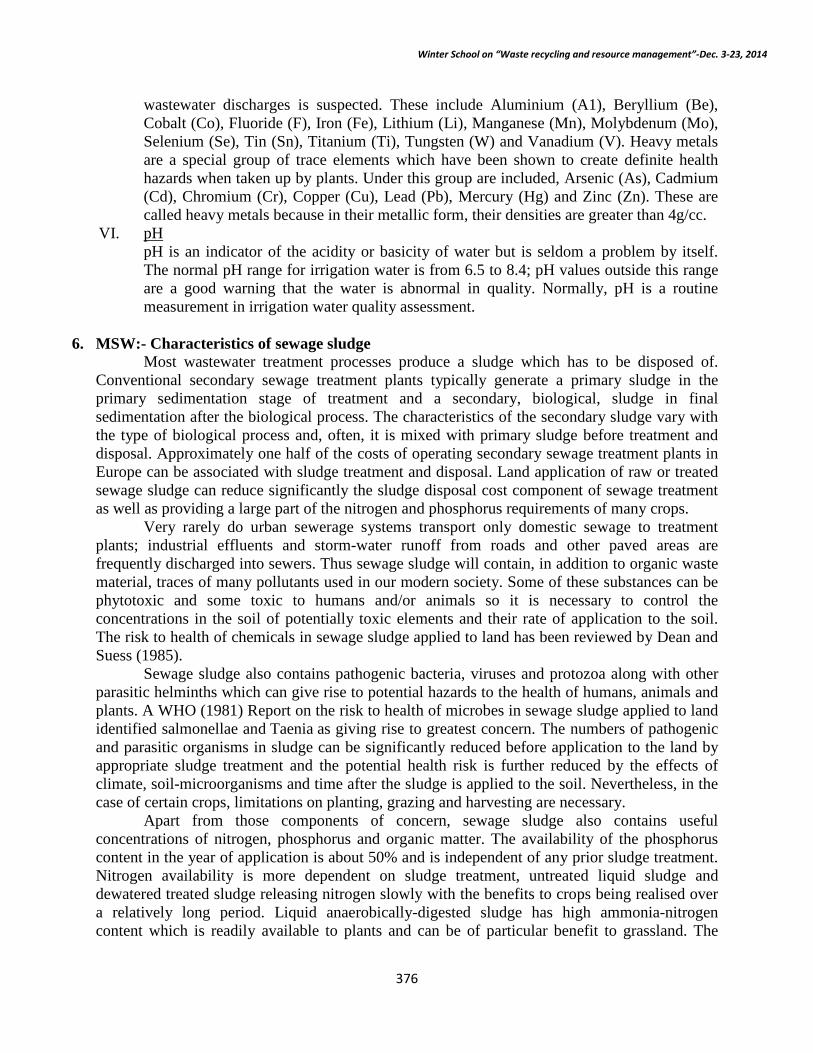
Winter School on “Waste recycling and resource management”-Dec. 3-23, 2014
wastewater discharges is suspected. These include Aluminium (A1), Beryllium (Be), Cobalt (Co), Fluoride (F), Iron (Fe), Lithium (Li), Manganese (Mn), Molybdenum (Mo), Selenium (Se), Tin (Sn), Titanium (Ti), Tungsten (W) and Vanadium (V). Heavy metals are a special group of trace elements which have been shown to create definite health hazards when taken up by plants. Under this group are included, Arsenic (As), Cadmium (Cd), Chromium (Cr), Copper (Cu), Lead (Pb), Mercury (Hg) and Zinc (Zn). These are called heavy metals because in their metallic form, their densities are greater than 4g/cc.
VI. pH pH is an indicator of the acidity or basicity of water but is seldom a problem by itself. The normal pH range for irrigation water is from 6.5 to 8.4; pH values outside this range are a good warning that the water is abnormal in quality. Normally, pH is a routine measurement in irrigation water quality assessment.
6. MSW:- Characteristics of sewage sludge
Most wastewater treatment processes produce a sludge which has to be disposed of. Conventional secondary sewage treatment plants typically generate a primary sludge in the primary sedimentation stage of treatment and a secondary, biological, sludge in final sedimentation after the biological process. The characteristics of the secondary sludge vary with the type of biological process and, often, it is mixed with primary sludge before treatment and disposal. Approximately one half of the costs of operating secondary sewage treatment plants in Europe can be associated with sludge treatment and disposal. Land application of raw or treated sewage sludge can reduce significantly the sludge disposal cost component of sewage treatment as well as providing a large part of the nitrogen and phosphorus requirements of many crops.
Very rarely do urban sewerage systems transport only domestic sewage to treatment plants; industrial effluents and storm-water runoff from roads and other paved areas are frequently discharged into sewers. Thus sewage sludge will contain, in addition to organic waste material, traces of many pollutants used in our modern society. Some of these substances can be phytotoxic and some toxic to humans and/or animals so it is necessary to control the concentrations in the soil of potentially toxic elements and their rate of application to the soil. The risk to health of chemicals in sewage sludge applied to land has been reviewed by Dean and Suess (1985).
Sewage sludge also contains pathogenic bacteria, viruses and protozoa along with other parasitic helminths which can give rise to potential hazards to the health of humans, animals and plants. A WHO (1981) Report on the risk to health of microbes in sewage sludge applied to land identified salmonellae and Taenia as giving rise to greatest concern. The numbers of pathogenic and parasitic organisms in sludge can be significantly reduced before application to the land by appropriate sludge treatment and the potential health risk is further reduced by the effects of climate, soil-microorganisms and time after the sludge is applied to the soil. Nevertheless, in the case of certain crops, limitations on planting, grazing and harvesting are necessary.
Apart from those components of concern, sewage sludge also contains useful concentrations of nitrogen, phosphorus and organic matter. The availability of the phosphorus content in the year of application is about 50% and is independent of any prior sludge treatment. Nitrogen availability is more dependent on sludge treatment, untreated liquid sludge and dewatered treated sludge releasing nitrogen slowly with the benefits to crops being realised over a relatively long period. Liquid anaerobically-digested sludge has high ammonia-nitrogen content which is readily available to plants and can be of particular benefit to grassland. The
376

Winter School on “Waste recycling and resource management”-Dec. 3-23, 2014
organic matter in sludge can improve the water retaining capacity and structure of some soils, especially when applied in the form of dewatered sludge cake. Table 4: The MSW composition of Indian condition contains as follows:
Physical Characteristics of Municipal Solid Wastes in Indian Cities Population Range (in million)
Number Of Cities Surveyed
Paper Rubber, Leather Glass Metals Total Inert
And compostable Synthetics matter
0.1 to 0.5 12 2.91 0.78 0.56 0.33 44.57 43.59
0.5 to 1.0 15 2.95 0.73 0.35 0.32 40.04 48.38
1.0 to 2.0 9 4.71 0.71 0.46 0.49 38.95 44.73
2.0 to 5.0 3 3.18 0.48 0.48 0.59 56.67 49.07
> 5 4 6.43 0.28 0.94 0.80 30.84 53.90
All values in table 3.4 are in percent, and are calculated on net weight basis Source : Background material for Manual on SWM, NEERI, 1996
Chemical Characteristics of Municipal Solid Wastes in Indian Cities
Population range (in million)
No. of Cities
surveyed
Moisture%
Organicmatter
%
Nitrogen as
Total Nitroge
n %
Phosphorous as P2O5 %
Potassium as K2O %
C/N Ratio
Calorific value* in kcal/kg
0.1-0.5 12 25.81 37.09 0.71 0.63 0.83 30.94 1009.89 0.5-1.0 15 19.52 25.14 0.66 0.56 0.69 21.13 900.61
1.0-2.0 9 26.98 26.89 0.64 0.82 0.72 23.68 980.05
2.0-5.0 3 21.03 25.60 0.56 0.69 0.78 22.45 907.18
> 5.0 4 38.72 39.07 0.56 0.52 0.52 30.11 800.70
7. Sludge treatment
Except when it is to be injected or otherwise worked into the soil, sewage sludge should be subjected to biological, chemical or thermal treatment, long-term storage or other appropriate process designed to reduce its fermentability and health hazards resulting from its use before being applied in agriculture. Table 5 lists sludge treatment and handling processes which have been used in the UK to achieve these objectives. The second edition of a 'Manual of Good Practice on Soil Injection of Sewage Sludge' has been produced by the Water Research Centre
377

Winter School on “Waste recycling and resource management”-Dec. 3-23, 2014
(1989) in the UK and describes suitable equipment and techniques for what is now the only method permissible within the EEC for applying untreated sludges to grassland. Table 5: EXAMPLES OF EFFECTIVE SLUDGE TREATMENT PROCESSES
Process Descriptions
Sludge Pasteurization
Minimum of 30 minutes at 70°C or minimum of 4 hours at 55° C (or appropriate intermediate conditions), followed in all cases by primary mesophilic anaerobic digestion
Mesophilic Anaerobic Digestion
Mean retention period of at least 12 days primary digestion in temperature range 35°C +/- 3°C or of at least 20 days primary digestion in temperature range 25°C + /- 3°C followed in each case by a secondary stage which provides a mean retention period of at least 14 days
Thermophilic Aerobic Digestion
Mean retention period of at least 7 days digestion. All sludge to be subject to a minimum of 55°C for a period of at least 4 hours
Composting (Windrows or Aerated Piles)
The compost must be maintained at 40°C for at least 5 days and for 4 hours during this period at a minimum of 55°C within the body of the pile followed by a period of maturation adequate to ensure that the compost reaction is substantially complete
Lime Stabilization of Liquid Sludge
Addition of lime to raise pH to greater than 12.0 and sufficient to ensure that the pH is not less than 12 for a minimum period of 2 hours. The sludge can then be used directly
Liquid Storage Storage of untreated liquid sludge for a minimum period of 3 months
Dewatering and Storage
Conditioning of untreated sludge with lime or other coagulants followed by dewatering and storage of the cake for a minimum period of 3 months if sludge has been subject to primary mesophilic anaerobic digestion, storage to be for a minimum period of 14 days
Source: Department of the Environment (1989)
8. Sludge application The concentrations of potentially toxic elements in arable soils must not exceed certain prudent limits within the normal depth of cultivation as a result of sludge application. No sludge should be applied at any site where the soil concentration of any of the parameters mentioned in Section 5.1, with the exception of molybdenum, exceed these limits. Maximum permissible concentrations of the potentially toxic elements in soil after application of sewage sludge (according to the UK Code of Practice) are given in Table 6. For zinc, copper and nickel, the maximum permissible concentrations vary with the pH of the soil because it is known that crop damage from phytotoxic elements is more likely to occur on acid soils. This Table also gives the
378

Winter School on “Waste recycling and resource management”-Dec. 3-23, 2014
maximum permissible average annual rates of addition of potentially toxic elements over a 10-year period. Table 6: MAXIMUM PERMISSIBLE CONCENTRATIONS OF POTENTIALLY TOXIC ELEMENTS IN SOIL AFTER APPLICATION OF SEWAGE SLUDGE AND MAXIMUM ANNUAL RATES OF ADDITION
Potentially toxic element (PTE)
Maximum permissible concentration of PTE in soil (mg/kg dry solids)
Maximum permissible average annual rate of PTE
addition over a 10 year period (kg/ha)3 PH1
5.0 <5.5 pH1
5.5<6.0 pH 6.0-7.0
PH2 > 7.0
Zinc 200 250 300 450 15
Copper 80 100 135 200 7.5
Nickel 50 60 75 110 3
Cadmium 35
0.15
Lead 300 15
Mercury 1 0.1
Chromium 400 (prov.)
15 (provisional)
*Molybdenum4 4 0.2
*Selenium 3 0.15
*Arsenic 50 0.7
*Fluoride 500 20
* These parameters are not subject to the provisions of Directive 86/278/EEC. 1 For soils of pH in the ranges of 5.0 < 5.5 and 5.5 < 6.0 the permitted concentrations of zinc, copper, nickel and cadmium are provisional and will be reviewed when current research into their effects on certain crops and livestock is completed. 2 The increased permissible PTE concentrations in soils of pH greater than 7.0 apply only to soils containing more than 5 % calcium carbonate. 3 The annual rate of application of PTE shall be determined by averaging over the 10-year period ending with the year of calculation. 4 The accepted safe level of molybdenum in agricultural soils is 4 mg/kg. However, there are some areas in the UK where, for geological reasons, the natural concentration of this element in the soil exceeds this level. In such cases there may be no additional problems as a result of
379

Winter School on “Waste recycling and resource management”-Dec. 3-23, 2014
applying sludge, but this should not be done except in accordance with expert advice. This advice will take account of existing soil molybdenum levels and current arrangements to provide copper supplements to livestock. 5 For pH 5.0 and above Source: Department of the Environment (1989)
When sludge is applied to the surface of grassland, the concentrations of potentially toxic elements should be determined in soil samples taken to a depth of 7.5 cm. The maximum concentrations of these parameters should not exceed the limits set out in Table 7. In order to minimize injestion of lead, cadmium and fluoride by livestock, the addition of these elements through sludge application to the surface should not exceed 3 times the 10 year average annual rates specified in Table 6. Sludge to be surface applied to grassland should not contain lead or fluoride individually in excess of 1200 and 1000 mg/kg dry solids, respectively. Table 7: MAXIMUM PERMISSIBLE CONCENTRATIONS OF POTENTIALLY TOXIC ELEMENTS IN SOIL UNDER GRASS AFTER APPLICATION OF SEWAGE SLUDGE WHEN SAMPLES TAKEN TO A DEPTH OF 7.5 cm
Potentially toxic element (PTE)
Maximum permissible concentration of PTE in soil (mg/kg dry solids)
pH 5.0 <5.5
pH 5.5<6.0
pH 6.0<7.0
PH3 > 7.0
Zinc1 330 420 500 750
Copper1 130 170 225 330
Nickel1 80 100 125 180
Cadmium2 3/54
Lead 300
Mercury 1.5
Chromium 600 (prov.)
*Molybdenum 4
*Selenium 5
*Arsenic 50
*Fluoride 500
* These parameters are not subject to the provisions of Directive 86/278/EEC.
380

Winter School on “Waste recycling and resource management”-Dec. 3-23, 2014
1 The permitted concentrations of these elements will be subject to review when current research into their effects on the quality of grassland is completed. Until then, in cases where there is doubt about the practicality of ploughing or otherwise cultivating grassland, no sludge applications which would cause these concentrations to exceed the permitted levels specified in Table 29 should be made in accordance with specialist agricultural advice. 2 The permitted concentration of cadmium will be subject to review when current research into its effect on grazing animals is completed. Until then, the concentration of this element may be raised to the permitted upper limit of 5 mg/kg as a result of sludge applications only under grass which is managed in rotation with arable crops and grown only for conservation. In all cases where grazing is permitted no sludge applications which would cause the concentration of cadmium to exceed the lower limit of 3 mg/kg shall be made. 3 The same values are valid for maximum permissible annual rate of PTE. 4 For pH 5.0 and above. Source: Department of the Environment (1989).
9. Effects of sludge on soils and crops The natural background concentration of metals in the soil is normally less available for
crop uptake and hence less hazardous than metals introduced through sewage sludge applications (Scheltinga, 1987). Research carried out in the U.K. (Carlton-Smith, 1987) has shown that the amounts of Cd, Ni, Cu, Zn and Pb applied in liquid sludge at three experimental sites could be accounted for by soil profile analyses five years after sludge applications, with the exception of Cu and Zn applied to a calcareous loam soil. These field experiments also determined the extent of transfer of metals from sludge-treated soil into the leaves and edible parts of six crops of major importance to UK agriculture and the effect of metals on yields of these crops.
Although all the plots received sufficient inorganic fertilizer to meet crop requirements for nutrients, the applications of sludge had some effects on crop yields. In 60% of the cases studied crop yields were not significantly affected but in 26% of the cases liquid sludge application resulted in significantly increased crop yields, attributed to the beneficial effects on soil structure. Reductions in wheat grain yield, from 6 - 10%, were noted on the clay and calcareous loam soils treated with liquid sludge and the sandy loam and clay soils treated with bed-dried sludge. However, this yield reduction was not thought to be due to metals but the most likely explanation was lodging of the crop as a result of excessive nitrogen in the soil.
Increases in metal concentrations in the soil due to sludge applications produced significant increases in Cd, Ni, Cu and Zn concentrations in the edible portion of most of the crops grown: wheat, potato, lettuce, red beet, cabbage and ryegrass. In most cases there was no significant increase of Pb in crop tissue in relation to Pb in the soil from sludge application, suggesting that lead is relatively unavailable to crops from the soil. The availability of metals to crops was found to be lower in soil treated with bed-dried sludge cake compared with liquid sludge, the extent being dependent on the crop. Even though the Ni, Cu and Zn concentrations in the soils treated with high rates of application of liquid and bed-dried sludges were close to the maximum levels set out in the EC Directive and the zinc equivalent of sludge addition exceeded the maximum permitted in U.K. guidelines, no phytotoxic effects of metals were evident, with one exception. This was in lettuce grown on clay soil, when Cu and Zn levels exceeded upper critical concentrations at high rates of sludge application.
381

Winter School on “Waste recycling and resource management”-Dec. 3-23, 2014
10. Planting, grazing and harvesting constraints
To minimize the potential risk to the health of humans, animals and plants it is necessary to coordinate sludge applications in time with planting, grazing or harvesting operations. Sludge must not be applied to growing soft fruit or vegetable crops nor used where crops are grown under permanent glass or plastic structures (Department of the Environment, 1989). The EC Directive (Council of the European Communities, 1986) requires a mandatory 3-week no grazing period for treated sludge applied to grassland but prohibits the spreading of untreated sludge on grassland unless injected. Treated sludge can be applied to growing cereal crops without constraint but should not be applied to growing turf within 3 months of harvesting or to fruit trees within 10 months of harvesting. When treated sludge is applied before planting such crops as cereals, grass, fodder, sugar beet, fruit trees, etc., no constraints apply but in the case of soft fruit and vegetables, the treated sludge should not be applied within 10 months of crop harvesting. In general, untreated sludge should only be cultivated or injected into the soil before planting crops but can be injected into growing grass or turf, with the constraints on minimum time to harvesting as already mentioned.
11. Environmental protection Care should always be taken when applying sewage sludge to land to prevent any form of
adverse environmental impact. The sludge must not contain non-degradable materials, such as plastics, which would make land disposal unsightly. Movement of sludge by tanker from sewage treatment plant to agricultural land can create traffic problems and give rise to noise and odour nuisance. Vehicles should be carefully selected for their local suitability and routes chosen so as to minimize inconvenience to the public. Access to fields should be selected after consultation with the highway authority and special care must be taken to prevent vehicles carrying mud onto the highway.
Odour control is the most important environmental dimension of sludge application to land. Enclosed tankers should be used for transporting treated sludge, which tends to be less odorous than raw sludge. Discharge points for sludge from tankers or irrigators should be as near to the ground as is practicable and the liquid sludge trajectory should be kept low so as to minimize spray drift and visual impact. Untreated sludge should be injected under the soil surface using special vehicles or tankers fitted with injection equipment.
Great care is needed to prevent sludge running off onto roads or adjacent land, depending on topography, soil and weather conditions. On sloping land there is the risk of such runoff reaching watercourses and causing serious water pollution. Sludge application rates must be adjusted accordingly and, under certain circumstances, spreading might have to be discontinued. In addition to the problem of surface runoff, pollution may arise from the percolation of liquid sludge into land drains, particularly when injection techniques are used or liquid sludge is applied to dry fissured soils. In highly sensitive water pollution areas, sludge should be used only in accordance with the requirements of the pollution control authority as well as of good farming practice. Sludge storage on farms can optimize the transport and application operations but every effort must be made to ensure that storage facilities are secure.
One method for minimising risks is the Hazard Analysis and Critical Control Point system as principally used in the food processing industry (Mortimore and Wallace 1998). HACCP uses a logical, common sense approach to the prevention of problems and has been endorsed by the UN (FAO 1995). While it has mostly been used in the food processing sector it could reasonably be expanded to vertically integrate whole production systems, and thus include
382

Winter School on “Waste recycling and resource management”-Dec. 3-23, 2014
reclaimed water irrigated cropping (Jackson 2003). The seven principles of HACCP are given in Table 8 below. Such systems could be deployed in reclaimed water irrigation systems to provide a measure of Quality Assurance for both the production system and protection of human health.
Table 8: Principles of Hazard Analysis and Critical Control Point system.
Principle Practise
1 Conduct hazard analysis Identify steps in process (construct flow chart), possible hazards
and control measures
2 Determine critical control points Identify where control is critical to ensure safety
3 Establish critical limits Describe measureable quantities for quality/safety parameters
4 Establish system to monitor critical
Document monitoring frequency, responsibilities, and actions to
control points be taken when results obtained
5 Establish corrective actions Procedures to ensure quality is restored and hazards removed
6 Establish procedures to verify system is
Quality Assurance in place for HACCP process
working
7 Documentation Documentation of process, monitoring results, actions taken,
deviations form critical limits
Adapted from Mortimore and Wallace (1998)
12. Effect of Waste Water Irrigation on Yield and Quality Crop Yield (Khurana and Singh, 2012) Table 9: Metal and metalloid bioavailability grouping Group
Metal Soil adsorption
Phytotoxicity Food chain risk
383

Winter School on “Waste recycling and resource management”-Dec. 3-23, 2014
1 Ag, Cr,
Sn, Ti, Low solubility and
Low Little risk because they are not
Y and Zr strong retention in soil
taken up to any extent by plants
2 As, Hg and Pb
Strongly sorbed by soil
Plant roots may adsorb them but not translate to
Pose minimal risks to the
colloids shoots or generally not phytotoxic except at very
human food chain
high concentrations
3 B, Cu, Mn, Mo,
Less strongly sorbed
Readily taken up by plants, and are phytotoxic at
Conceptually, the “soil-plant
Ni and Zn,
by soil than group 1&
Concentrations that pose little risk to human health.
barrier” protects the food chain
2. for these elements
4 Cd, Co, Mo and
Least of all metals
Pose human or animal health risks at plant tissue
Bioaccumulation through the
Se, Concentrations which are not generally phytotoxic.
soil-plant-animal food chain.
Source
(Chaney 1980)
Waste waters contain valuable plant nutrients and thus its reuse in agriculture serves as an
important source of nutrients and irrigation water for crops. Better crop growth particularly of leafy vegetable like cauliflower, cabbage, spinach etc. grown on fields receiving sewage WW have been achieved, in contrast to radish, which is more sensitive to WW. The results of many studies on the use of WW for long period of time have recapitulated significant increased in crop yields than GW irrigated fields. Significantly higher onion yield and maximum fertilizer use efficiency from plots fertilized with 40kg N, 20kg P2O5 and 20kg K2O ha-1 dose conjointly with distillery effluents (25-times diluted) over GW irrigated plots has been reported. A significant augmentation (3.38 g pot-1 to 8.85 g pot-1) in dry matter yield of barseem (Trifoliam sp.) in pots irrigated with sewage WW than GW irrigated pots signifies the essential nutrient supplementation from WW. The field experiments conducted on the use of WW for irrigation to maize, sunflower, groundnut and soybean registered 19.3, 29.9, 5.9 and 4.8% higher grain yield, respectively over fields irrigated with GW.
A favorable effect of treated paper and pulp industry effluents on maize, barley and
384

Winter School on “Waste recycling and resource management”-Dec. 3-23, 2014
wheat grown in coarse textured soil has also been reported in India. The yield increase from 6.9 to 13.9% in different sugarcane varieties grown with WW over GW irrigation has been recorded. Likewise, a significant increase in barley biomass with municipal WW irrigation application consecutively for 5-years over control, in contrast to lower barley biomass from fields irrigated with WW for consecutively for 10-years has been reported. The study has shown that barley biomass was still higher over control, albeit of decline in biomass after 5-years of field application. An another long-term experiment have shown that sewage WW irrigation had lead to highest grain yield of wheat, rice and cotton by 23, 46 and 50% than GW irrigation. A gradual increase in peanut pod yield has also been reported with the application of WW upto 50% concentration in effluent from textile industry.
On the contrary, however, yield suppressing trends (~40% yield decline) with distillery effluent irrigation fields has also been reported. Average productivity of rice and wheat from fields irrigated with fresh GW to around 48.1 q ha-1 and 8.37 q ha-1 in comparison to fields irrigated with distillery effluents to 27.8 and 6.89 q ha-1, respectively has been reported. Maximum levels of metals/metalloid contaminants in food
Plant species differed widely (Table 9 and 10) with respect to their bio-accumulation of heavy-metals and micro -nutrients. Heavy-metal and micro-nutrients content in the economic plant parts have been found to be higher. Spinach has been found to accumulation higher amount of Pb, Cr and Cd compared to Trifolium alexandrinum L. Root crops such as potato, carrot, turnip, and radish generally accumulates lower concentrations of pollutant elements than leafy vegetables such as spinach, methi (Trigonella cornuculata), menthe (Triginella foenumgraecum) and mint (Mentha piprita). Higher concentrations of Zn and Cu, slight increase in Ni content and lower concentration of Mn in rice grains harvested from sewage WW irrigated fields have been registered than GW irrigated fields. However, the tissue metal concentrations in some cereals, millet and vegetable crops grown in peri-urban areas of Delhi (India) were well below the generalized critical levels of phytotoxicity.
Heavy-metal accumulation in leaves of different plant species grown on soils irrigated with industrial WW for consecutive 5-years followed the order: jojoba> khaya> axodium>Italian cypress. In Zimbabwe, maize and Tsunga grown with sewage WW irrigation were observed to be heavily contaminated with Cd, Cu, Pb and Zn. Tsunga leaves contained 3.68 mg Cd kg−1, over 18-times the MPL of EU standards (0.2 mg kg−1); Cu concentrations were111 mg kg−1, 5-times the EU Standard (20 mg kg−1); concentrations of Pb were 6.77 mg kg−1, over 22-times the MPL of EU standards and UK guidelines (0.3 mg kg−1); Zn concentrations were 221 mg kg−1, over 4-times the guideline value (50 mg kg−1). They reported that the other plants viz. beans, maize, peppers and sugarcane also contained concentrations of heavy -metals above the MPL of EU standards. The edible portion of Beta vulgaris (Palak)-a highly nutritious leafy vegetable in the sub-urban areas of Varanasi (India) has been reported to contain Cd in higher concentration during the summer season than the MPL of the Indian standard, whereas Pb and Ni concentrations were higher in summer and winter seasons. The fruit and vegetable samples were found to contain 3.5- to 340-fold higher amounts of the heavy-metals (Co, Cd, Pb, Mn, Ni and Cu) from soils irrigated with WW than irrigated with GW. In an another study in peri-urban areas of Delhi (India), higher Zn, Pb and Cd levels except Cu than the WHO limits in spinach and okra irrigated with industrial effluents has been reported[87]. Vegetables grown on un-contaminated soils contains 8.1-17 mg Cu kg-1, 4.3-7.3 mg Pb kg-1, 44.7-85.5 mg Zn kg-1, and 109.2 mg Mn kg-1, than grown in contaminated soils that contains 9.0-36.5 mg Cu kg-1, 8.5-30.2
385
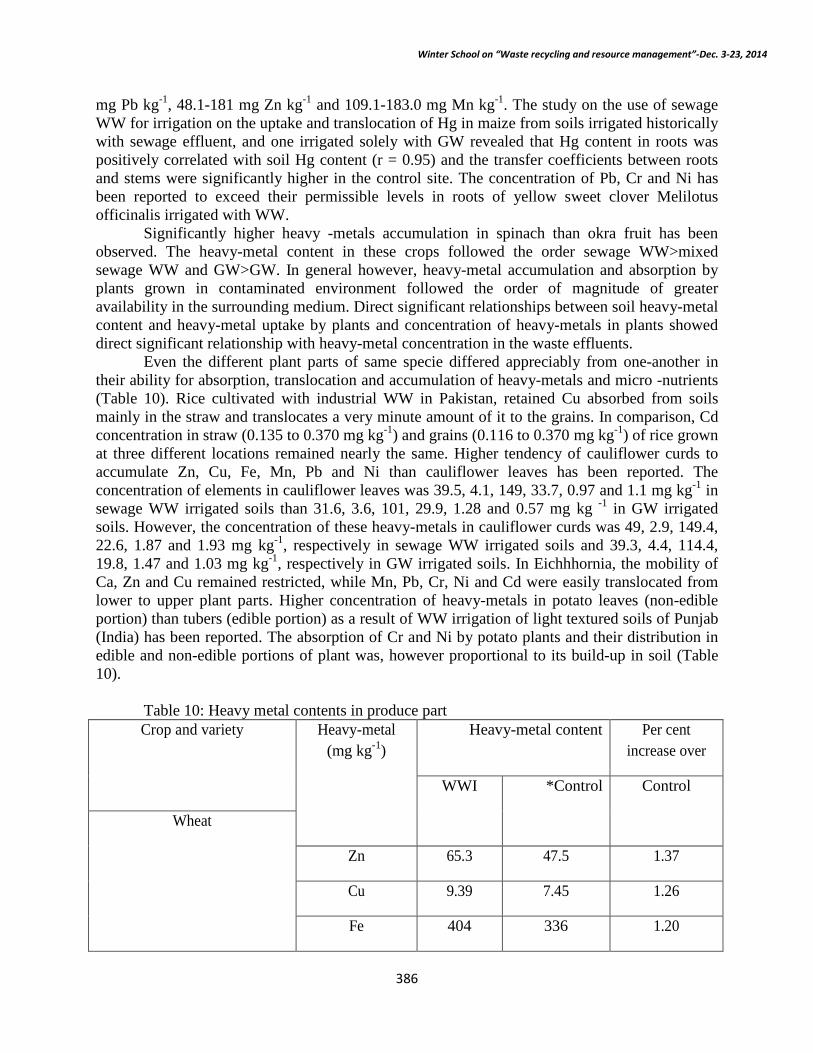
Winter School on “Waste recycling and resource management”-Dec. 3-23, 2014
mg Pb kg-1, 48.1-181 mg Zn kg-1 and 109.1-183.0 mg Mn kg-1. The study on the use of sewage WW for irrigation on the uptake and translocation of Hg in maize from soils irrigated historically with sewage effluent, and one irrigated solely with GW revealed that Hg content in roots was positively correlated with soil Hg content (r = 0.95) and the transfer coefficients between roots and stems were significantly higher in the control site. The concentration of Pb, Cr and Ni has been reported to exceed their permissible levels in roots of yellow sweet clover Melilotus officinalis irrigated with WW.
Significantly higher heavy -metals accumulation in spinach than okra fruit has been observed. The heavy-metal content in these crops followed the order sewage WW>mixed sewage WW and GW>GW. In general however, heavy-metal accumulation and absorption by plants grown in contaminated environment followed the order of magnitude of greater availability in the surrounding medium. Direct significant relationships between soil heavy-metal content and heavy-metal uptake by plants and concentration of heavy-metals in plants showed direct significant relationship with heavy-metal concentration in the waste effluents.
Even the different plant parts of same specie differed appreciably from one-another in their ability for absorption, translocation and accumulation of heavy-metals and micro -nutrients (Table 10). Rice cultivated with industrial WW in Pakistan, retained Cu absorbed from soils mainly in the straw and translocates a very minute amount of it to the grains. In comparison, Cd concentration in straw (0.135 to 0.370 mg kg-1) and grains (0.116 to 0.370 mg kg-1) of rice grown at three different locations remained nearly the same. Higher tendency of cauliflower curds to accumulate Zn, Cu, Fe, Mn, Pb and Ni than cauliflower leaves has been reported. The concentration of elements in cauliflower leaves was 39.5, 4.1, 149, 33.7, 0.97 and 1.1 mg kg-1 in sewage WW irrigated soils than 31.6, 3.6, 101, 29.9, 1.28 and 0.57 mg kg -1 in GW irrigated soils. However, the concentration of these heavy-metals in cauliflower curds was 49, 2.9, 149.4, 22.6, 1.87 and 1.93 mg kg-1, respectively in sewage WW irrigated soils and 39.3, 4.4, 114.4, 19.8, 1.47 and 1.03 mg kg-1, respectively in GW irrigated soils. In Eichhhornia, the mobility of Ca, Zn and Cu remained restricted, while Mn, Pb, Cr, Ni and Cd were easily translocated from lower to upper plant parts. Higher concentration of heavy-metals in potato leaves (non-edible portion) than tubers (edible portion) as a result of WW irrigation of light textured soils of Punjab (India) has been reported. The absorption of Cr and Ni by potato plants and their distribution in edible and non-edible portions of plant was, however proportional to its build-up in soil (Table 10).
Table 10: Heavy metal contents in produce part Crop and variety Heavy-metal
(mg kg-1) Heavy-metal content Per cent
increase over
WWI *Control Control
Wheat
Zn 65.3 47.5 1.37
Cu 9.39 7.45 1.26
Fe 404 336 1.20
386
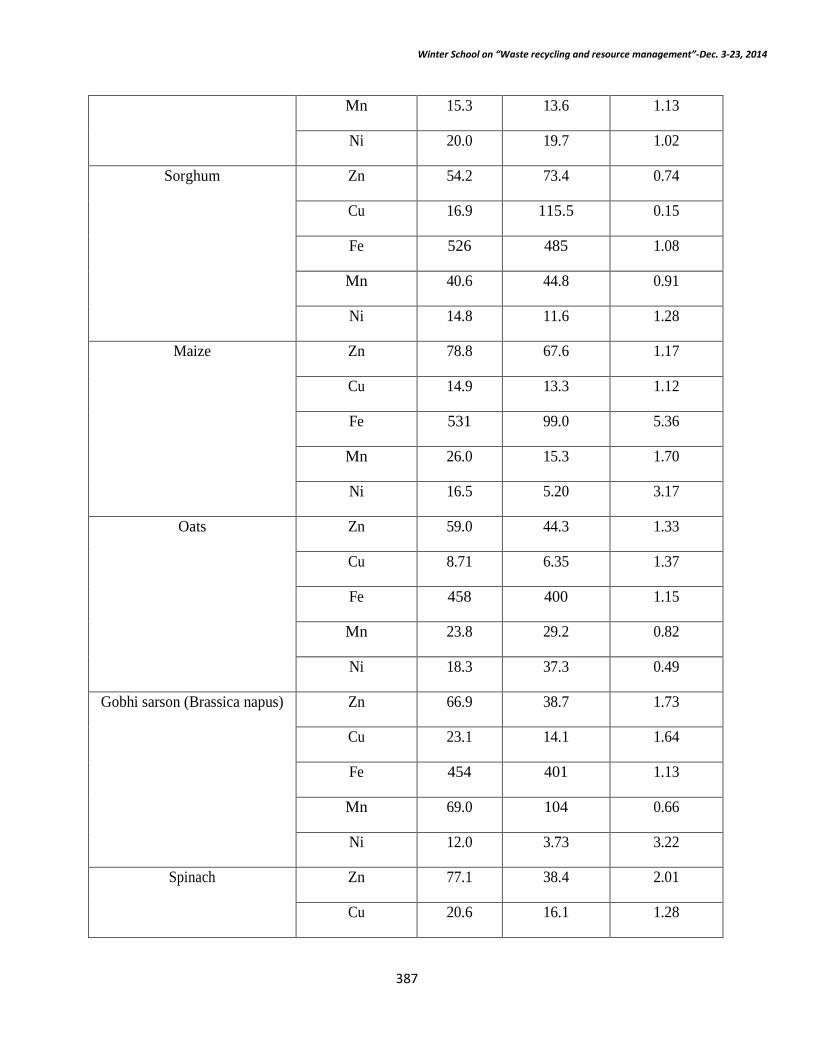
Winter School on “Waste recycling and resource management”-Dec. 3-23, 2014
Mn 15.3 13.6 1.13
Ni 20.0 19.7 1.02
Sorghum Zn 54.2 73.4 0.74
Cu 16.9 115.5 0.15
Fe 526 485 1.08
Mn 40.6 44.8 0.91
Ni 14.8 11.6 1.28
Maize Zn 78.8 67.6 1.17
Cu 14.9 13.3 1.12
Fe 531 99.0 5.36
Mn 26.0 15.3 1.70
Ni 16.5 5.20 3.17
Oats Zn 59.0 44.3 1.33
Cu 8.71 6.35 1.37
Fe 458 400 1.15
Mn 23.8 29.2 0.82
Ni 18.3 37.3 0.49
Gobhi sarson (Brassica napus) Zn 66.9 38.7 1.73
Cu 23.1 14.1 1.64
Fe 454 401 1.13
Mn 69.0 104 0.66
Ni 12.0 3.73 3.22
Spinach Zn 77.1 38.4 2.01
Cu 20.6 16.1 1.28
387

Winter School on “Waste recycling and resource management”-Dec. 3-23, 2014
Fe 711 734 0.97
Mn 39.3 87.8 0.45
Ni 18.4 13.2 1.39
Heavy metal uptake by plants varies greatly between plant species and part. For example, the fruiting organ generally contains the least Cd and the leaves higher concentrations. These concentrations can vary from <0.5 to 15 mg Cd/kg dry matter, depending on the species (Davis 1984). Therefore, any crop that has a leaf as the edible part has a much greater risk of containing high levels of Cd in a given situation. The potential risk of cadmium uptake is higher for root and tuber vegetables, leafy vegetables and peanuts (AFFA 2001). However, many factors influence the phytoavailability of metals in soil. Some of the major factors are soil pH, clay content, and organic matter, salinity of irrigation water, and plant species and cultivars.
Arsenic, cadmium, mercury and lead are the main inorganic contaminants likely to be scrutinised in relation to food quality (Table 17). Lead is rarely an issue in terms of crop uptake, as the metal is strongly sorbed by soil and if taken up by roots, is rarely translocated to edible plant parts. Where lead contamination has been identified, this is usually due to aerial contamination of the produce, either through dust contamination, or uptake of atmospheric lead derived from automobile or industrial sources. Similarly, arsenic is strongly retained by soil and is generally not regarded as a high risk for food chain contamination.
It is unlikely that either chromium or nickel pose great risks as these elements are often strongly adsorbed or precipitated in soils. For chromium, elemental speciation is critical in assessing risks, as the Cr(III) form is non toxic and precipitated in soil, while Cr(IV) is highly toxic and mobile.
It has been known for some time that after addition of soluble metals to soil, availability of the metal decreases with time. This decrease is initially associated with adsorption of metals to soil surfaces, but in the longer-term, slower “fixation” reactions appear to proceed which continue to reduce metal bio- and phyto- availability. Metal adsorption needs to be distinguished from metal fixation – the former leads to a reversible binding of metal to the soil solid phase, while the latter leads to an irreversible (or less reversible) binding of metal to soil. The heavy metals added with reclaimed water are usually added slowly over a long period of time, assisting slower fixation and lower phytoavailability in the long-term. Table 11: Maximum level of metal contaminant in food
Contaminant and food Contaminant mg/kg as consumed
Arsenic (total)
Cereals 1
Arsenic (inorganic)
388

Winter School on “Waste recycling and resource management”-Dec. 3-23, 2014
Crustacea 2
Fish 2
Molluscs 1
Seaweed (edible kelp) 1
Cadmium
Chocolate and cocoa products 0.5
Kidney of cattle, sheep and pig 2.5
Leafy vegetables (as specified in Schedule 4 to Standard 1.4.2)
0.1
Liver of cattle, sheep and pig 1.25
Meat of cattle, sheep and pig (excluding offal)
0.05
Molluscs (excluding dredge/bluff oysters and queen scallops)
2
Peanuts 0.1
Rice 0.1
Root and tuber vegetables (as specified in Schedule 4 to Standard 1.4.2)
0.1
Wheat 0.1
Lead
Brassicas 0.3
Cereals, Pulses and Legumes 0.2
Edible offal of cattle, sheep, pig and poultry 0.5
Fish 0.5
Fruit 0.1
Infant formulae 0.02
389

Winter School on “Waste recycling and resource management”-Dec. 3-23, 2014
Meat of cattle, sheep, pig and poultry (excluding offal)
0.1
Molluscs 2
Vegetables (except brassicas) 0. 1
Mercury
Crustacea mean level of 0.5*
Fish (as specified in Schedule 4 to Standard 1.4.2) and fish products, excluding gemfish, billfish
(including marlin), southern bluefin tuna, barramundi, ling, orange roughy, rays and all species of
0.5*
shark
Gemfish, billfish (including marlin), southern bluefin tuna, barramundi, ling, orange roughy, rays and
1*
all species of shark
Fish for which insufficient samples 1
Molluscs 0.5*
Tin
All canned foods 250
Source (ANZFA 2001. * mean level of. In the case of cadmium, while insignificant amounts of Cd are added to the soil in reclaimed water, changes in soil salinity and chloride concentrations due to reclaimed water use has the potential to increase phytotoxicity of Cd already present in the soil (McLaughlin et al. 1994).
In summary, heavy metals in reclaimed water are generally insignificant, however potentially an issue if guideline values are exceeded and thus should be monitored. Loading rates of heavy metals in irrigation water can be easily calculated and potential issues identified with readily available guidelines. Organic contaminants
In addition to pathogens, viruses, heavy metals and nutrients, reclaimed water may also
390

Winter School on “Waste recycling and resource management”-Dec. 3-23, 2014
contain organic compounds (Abdulraheem 1989; Chang et al. 1996; Gallegos et al. 1999). The levels and compositions of these compounds in reclaimed water depend on the waste input and treatment technology. Organics in raw wastewater include humic substances, faecal matter, kitchen wastes, detergents, oils, drugs and industrial wastes. Although wastewater treatment, in general significantly reduces organic matter in reclaimed water, there may still be some toxic organic compounds that remain.
The toxic organics in reclaimed water are highly heterogeneous, containing molecules of various weights, ranging from simple compounds to very complex polymers (e.g. Paxeus 1996; Ternes et al. 1999). Those that may pose risks to food quality and human health include disinfection byproducts (DBPs), pesticides, organohalogens (PCBs and dioxins), hydrocarbons, phthalates and flame-retardants, surfactants, hormones (naturally excreted by animals and humans, or synthesized as drugs), pharmaceuticals and personal care products, as well as algal toxins. Unfortunately little information is available on the potential impact of these organic compounds in reclaimed water on food quality.
Food quality could be affected through various mechanisms: uptake by plants, toxicity to soil microorganisms and plants. Chemical residues in harvested crops are the main concern in terms of food quality and human health. The organic compounds in reclaimed wastewater used in agriculture may be taken up by plants via four main pathways (Polder et al. 1995; Topp et al. 1986) viz.
a) root uptake followed by translocation in the plant’s transpiration stream (i.e. liquid phase transfer);
b) absorption by roots or shoots of volatilized organics from the surrounding air (i.e. vapour phase transfer);
c) uptake by external contamination of the above-ground parts of plants by wastewater, soil and dust, followed by retention in the cuticle or penetration through it; and
d) Uptake and transport in oil channels which are found in some oil-containing plants such as carrots.
One of the best examples on uptake by plants is that of phthalates. Di-n-butyl phthalate
(DBP) is a compound used widely in plastics manufacture and is found throughout man-made environments. Although it can be broken down in the soil by bacteria, concentrations of DBP in fruit, shoot and root of capsicum fruit were observed to increase with the increase of soil-applied DBP (Yin et al. 2003). Vitamin C and capsaicin contents in fruit were found negatively correlated to DBP concentration in the fruit, which suggest that DBP uptake by plants might impact on fruit quality. Although DBP has a relatively low toxicity, this work also highlights the pathways for the potential transfer of organic contaminants to humans through the food chain. Their presence in food has been implicated in a number of human effects (e.g. declining sperm count, Shaw and McCully 2002).
Some organic compounds in reclaimed wastewater such as natural hormones and contraceptive drugs, and surfactant degradation products (nonylphenols and octylphenols) are endocrine disrupting chemicals (EDCs). These may interfere with the normal functioning of endocrine systems, thus affecting reproduction and development in wildlife and human beings (Jobling et al. 1998; Ying and Kookana 2002), usually through more direct contact/ingestion than via a plant mediated pathway. Hormone steroids in the environment may affect not only wildlife and humans but also plants (Lim et al. 2000; Shore et al. 1995). Alfalfa irrigated with
391
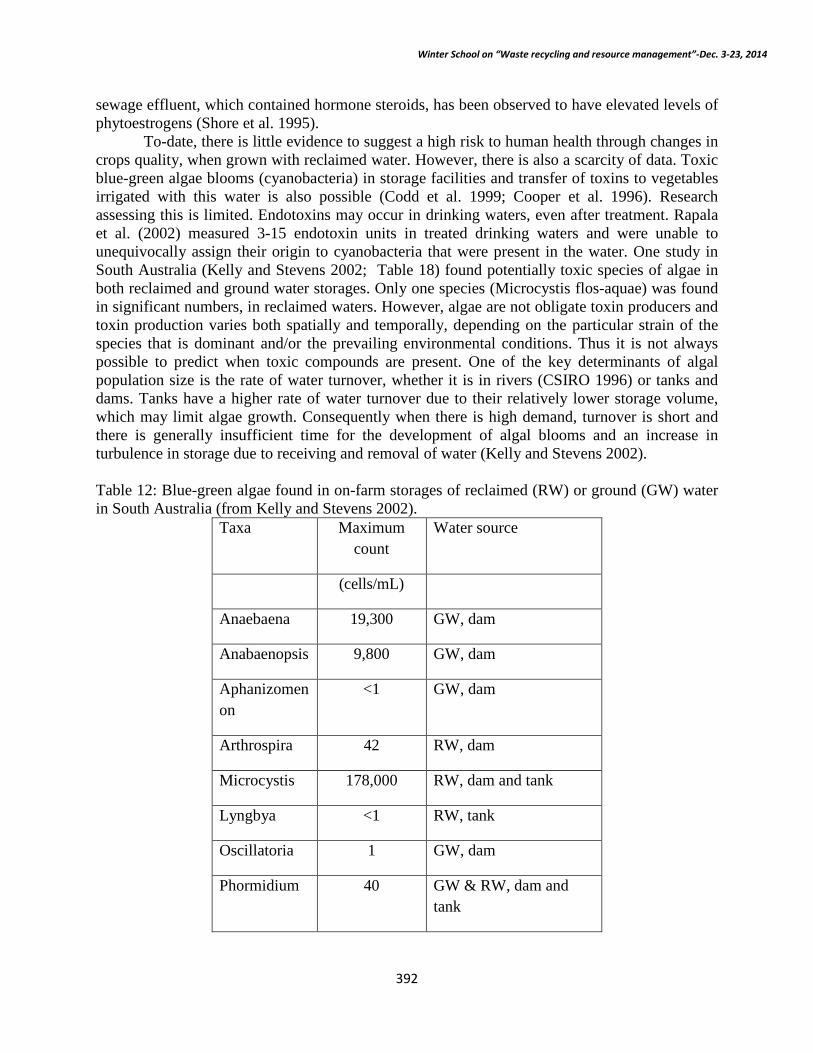
Winter School on “Waste recycling and resource management”-Dec. 3-23, 2014
sewage effluent, which contained hormone steroids, has been observed to have elevated levels of phytoestrogens (Shore et al. 1995).
To-date, there is little evidence to suggest a high risk to human health through changes in crops quality, when grown with reclaimed water. However, there is also a scarcity of data. Toxic blue-green algae blooms (cyanobacteria) in storage facilities and transfer of toxins to vegetables irrigated with this water is also possible (Codd et al. 1999; Cooper et al. 1996). Research assessing this is limited. Endotoxins may occur in drinking waters, even after treatment. Rapala et al. (2002) measured 3-15 endotoxin units in treated drinking waters and were unable to unequivocally assign their origin to cyanobacteria that were present in the water. One study in South Australia (Kelly and Stevens 2002; Table 18) found potentially toxic species of algae in both reclaimed and ground water storages. Only one species (Microcystis flos-aquae) was found in significant numbers, in reclaimed waters. However, algae are not obligate toxin producers and toxin production varies both spatially and temporally, depending on the particular strain of the species that is dominant and/or the prevailing environmental conditions. Thus it is not always possible to predict when toxic compounds are present. One of the key determinants of algal population size is the rate of water turnover, whether it is in rivers (CSIRO 1996) or tanks and dams. Tanks have a higher rate of water turnover due to their relatively lower storage volume, which may limit algae growth. Consequently when there is high demand, turnover is short and there is generally insufficient time for the development of algal blooms and an increase in turbulence in storage due to receiving and removal of water (Kelly and Stevens 2002). Table 12: Blue-green algae found in on-farm storages of reclaimed (RW) or ground (GW) water in South Australia (from Kelly and Stevens 2002).
Taxa Maximum count
Water source
(cells/mL)
Anaebaena 19,300 GW, dam
Anabaenopsis 9,800 GW, dam
Aphanizomenon
<1 GW, dam
Arthrospira 42 RW, dam
Microcystis 178,000 RW, dam and tank
Lyngbya <1 RW, tank
Oscillatoria 1 GW, dam
Phormidium 40 GW & RW, dam and tank
392

Winter School on “Waste recycling and resource management”-Dec. 3-23, 2014
Planktothrix 872 GW & RW, dam and
tank
Pseudanabaena
400 GW & RW, dam and tank
Due to the potential adverse effects of organics in reclaimed water on the environment
and food quality, some countries have set out irrigation water quality criteria for selected organics (Chang et al. 1996). Food Standards Australia New Zealand has regulations on the maximum levels of specified non-metal contaminants and natural toxins in nominated foods (FSANZ 2003) although these regulations are not set for organic contaminants in irrigation water. Because of the large number of compounds and their potential impact on food quality, and the limited amount of scientific information available, it is impractical to establish maximum permissible levels for the hundreds of organic compounds that may be present in reclaimed water and thus the Australian guidelines (ANZECC and ARMCANZ 2000) do not include safe levels of organic compounds for protection of human health. In the U.S. Chang et al. (1996) have listed what they consider acceptable levels in the soil of a range of organic chemicals and residues based on a risk assessment approach, which included epidemiological and toxicological data, acceptable daily intakes, environmental exposures and plant pollutant uptake (Table 19) . Such an approach might usefully be developed in Australia if data was collected on the concentrations of these compounds in soils irrigated with reclaimed and other irrigation waters. Table 13: Estimated maximum allowable pollutant concentration in reclaimed water irrigated soils to prevent accumulation of toxic levels of organic contaminants in food crops. Based on a risk assessment approach, which includes epidemiological and toxicological data, acceptable daily intakes, environmental exposures and plant pollutant uptake (from Chang et al. 1996)?
Maximum Maximum
Constituent concentration
Constituent concentration
in soil in soil
(mg/kg DW)
(mg/kg DW)
Aldrin 0.2 Hexachloroethane
2
Benzene 0.03 Pyrene 480
Benzo(a)pyrene 3 Lindane 0.6
Chlorodane 0.3 Methoxychlor 20
393

Winter School on “Waste recycling and resource management”-Dec. 3-23, 2014
Chlorobenzene ID Pentachloropheno
l 320
Chloroform 2 PCB’s 30
Dichlorophenols ID Tetrachloroethane
4
2,4-D 10 Tetrachloroethylene
250
DDT ID Toluene 50
Dieldrin 0.03 Toxaphene 9
Heptachlor 1 2,4,5-T ID
Henachlorobenzene
40 2,3,7,8, TCDD 30
ID = insufficient data for computation
In discussing the issue of blue-green algae toxins in irrigation water the Australian and New Zealand Guidelines for Fresh and Marine Water Quality guidelines (ANZECC and ARMCANZ 2000) conclude that “No trigger values for cyanobacteria in irrigation waters are recommended at this time”.
In summary, reclaimed water contains a cocktail of organic chemicals, belonging to different structural classes and having different adverse effects on organisms. Although the concentrations of these organics in reclaimed wastewater may be relatively low, the use of reclaimed water to irrigate crops may still pose risks to the environment, food quality and human health. Continued monitoring of organics in reclaimed water used for irrigation, and in soils, is needed to build sufficient data to further assess the potential risks to environmental and human health. While it is accepted that there will be some difficulties in identification and measurement of organic compounds in reclaimed water, some new and novel technologies could develop in the future. For example, Ono et al. (1996) used an assay of error-prone repair dependent DNA in Salmonella typhimurium as indicator of toxicity of organic compounds from reclaimed water. Such approaches are worthy of investigation since they may give an initial indication of potential problems, without knowing what toxic compounds might be present. If necessary, this could then be followed by identification of the active compounds. Plant nutrition and crop production
In terms of crop nutrition, the unique characteristics of reclaimed water compared to other water sources are principally a high nutrient content (N, P, K, Ca) and, to a lesser extent, high salt and boron (B) content. The N, P, K and Ca can be beneficial if carefully managed, whereas other salts and B tend to be detrimental, although in some cases the extra B may alleviate B deficiency (Smith 1982). For growers that are able to successfully balance these attributes reclaimed water may provide an attractive alternative to other, less fertile, water
394
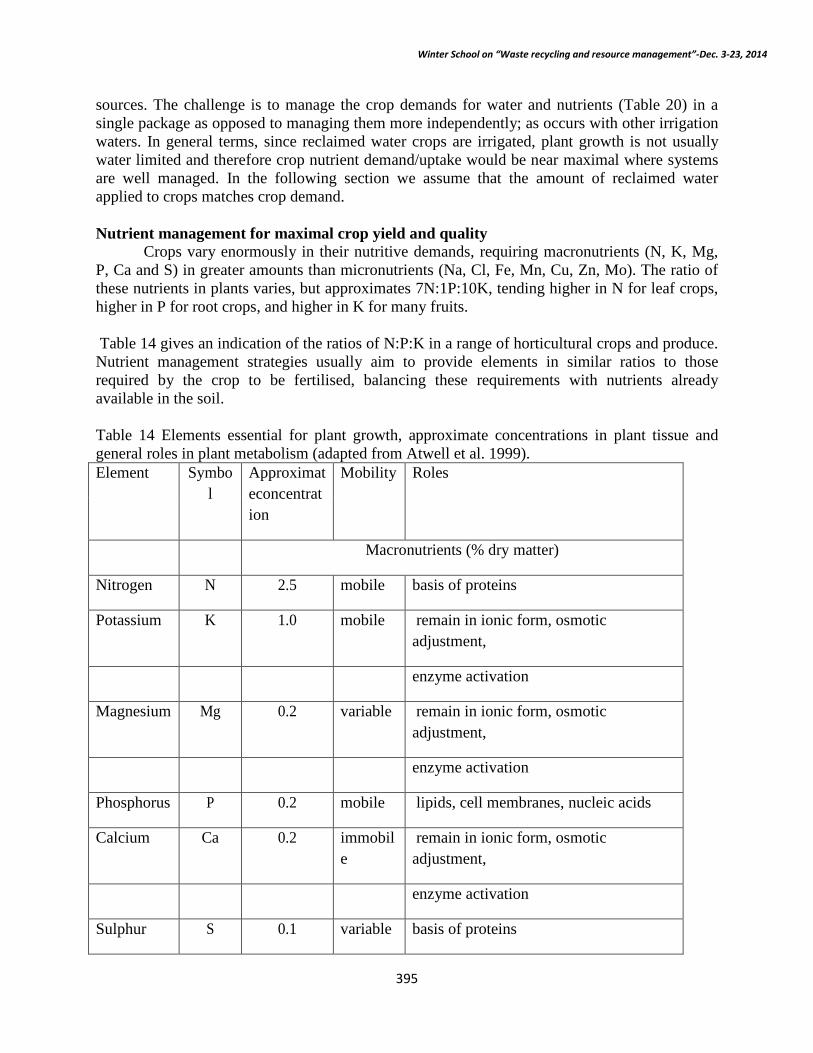
Winter School on “Waste recycling and resource management”-Dec. 3-23, 2014
sources. The challenge is to manage the crop demands for water and nutrients (Table 20) in a single package as opposed to managing them more independently; as occurs with other irrigation waters. In general terms, since reclaimed water crops are irrigated, plant growth is not usually water limited and therefore crop nutrient demand/uptake would be near maximal where systems are well managed. In the following section we assume that the amount of reclaimed water applied to crops matches crop demand. Nutrient management for maximal crop yield and quality
Crops vary enormously in their nutritive demands, requiring macronutrients (N, K, Mg, P, Ca and S) in greater amounts than micronutrients (Na, Cl, Fe, Mn, Cu, Zn, Mo). The ratio of these nutrients in plants varies, but approximates 7N:1P:10K, tending higher in N for leaf crops, higher in P for root crops, and higher in K for many fruits. Table 14 gives an indication of the ratios of N:P:K in a range of horticultural crops and produce. Nutrient management strategies usually aim to provide elements in similar ratios to those required by the crop to be fertilised, balancing these requirements with nutrients already available in the soil. Table 14 Elements essential for plant growth, approximate concentrations in plant tissue and general roles in plant metabolism (adapted from Atwell et al. 1999). Element Symbo
l Approximateconcentration
Mobility Roles
Macronutrients (% dry matter)
Nitrogen N 2.5 mobile basis of proteins
Potassium K 1.0 mobile remain in ionic form, osmotic adjustment,
enzyme activation
Magnesium Mg 0.2 variable remain in ionic form, osmotic adjustment,
enzyme activation
Phosphorus P 0.2 mobile lipids, cell membranes, nucleic acids
Calcium Ca 0.2 immobile
remain in ionic form, osmotic adjustment,
enzyme activation
Sulphur S 0.1 variable basis of proteins
395

Winter School on “Waste recycling and resource management”-Dec. 3-23, 2014
Micronutrients (mg/kg dry matter)
Sodium Na 500 mobile remain in ionic form, osmotic adjustment,
enzyme activation
Chlorine Cl 100 mobile remain in ionic form, osmotic adjustment,
Iron Fe 100 immobile
enzyme activation
Boron B 12 immobile
cell wall maintenance, unknown
Manganese Mn 20 immobile
Zinc Zn 20 variable components of some proteins, coenzymes
Copper Cu 3 variable
Nickel Ni 0.1 mobile
Molybdenum
Mo 0.1 variable
Table 15 Macronutrient (N, P and K) ratios in crops and produce of selected fruit and vegetables (calculated from Sceswell and Huett 1998).
Crop Part N P K
Cabbage Whole 6 1 6
Lettuce Whole 6 1 10
Curd 22 1 36
Cauliflower
Leaf 11 1 14
396

Winter School on “Waste recycling and resource management”-Dec. 3-23, 2014
Whole 5 1 6
Celery Whole 12 1 18
Capsicum Whole 10 1 17
Fruit 6 1 8
Cucumber
Leaf and stem
6 1 9
Whole 5 1 11
Leaf and stem
2 1 3
Tomato Fruit 2 1 4
Whole 2 1 4
Root 3 1 7
Carrots Leaf 6 1 10
Whole 7 1 6
Tuber 9 1 12
Potato Leaf and stem
17 1 16
Whole 11 1 13
How do nutrient ratios in reclaimed water compare with crop nutrient demands? The N to
P ratio (ca 9:1) provides an adequate base for a fertilizer application regime, while the cations (K, Ca and Mg) are in relative abundance (Table 16). In studies comparing growth and yield of crops irrigated with reclaimed or “fresh” water, reclaimed water irrigated crops have often yielded higher in both the absence (Kouraa et al. 2002) and presence (Maurer et al. ) of additional fertilizers. In terms of nutrient ratios, reclaimed waters also tend to have a higher proportion of sodium relative to other cations (K, Ca, Mg). This is discussed further in the effects of salinity section. Table 16: Nutrients and nutrient ratios in reclaimed water from Adelaide South Australia (calculated from Kelly et al. 2001).
N P K Ca Mg Na Cl B
397
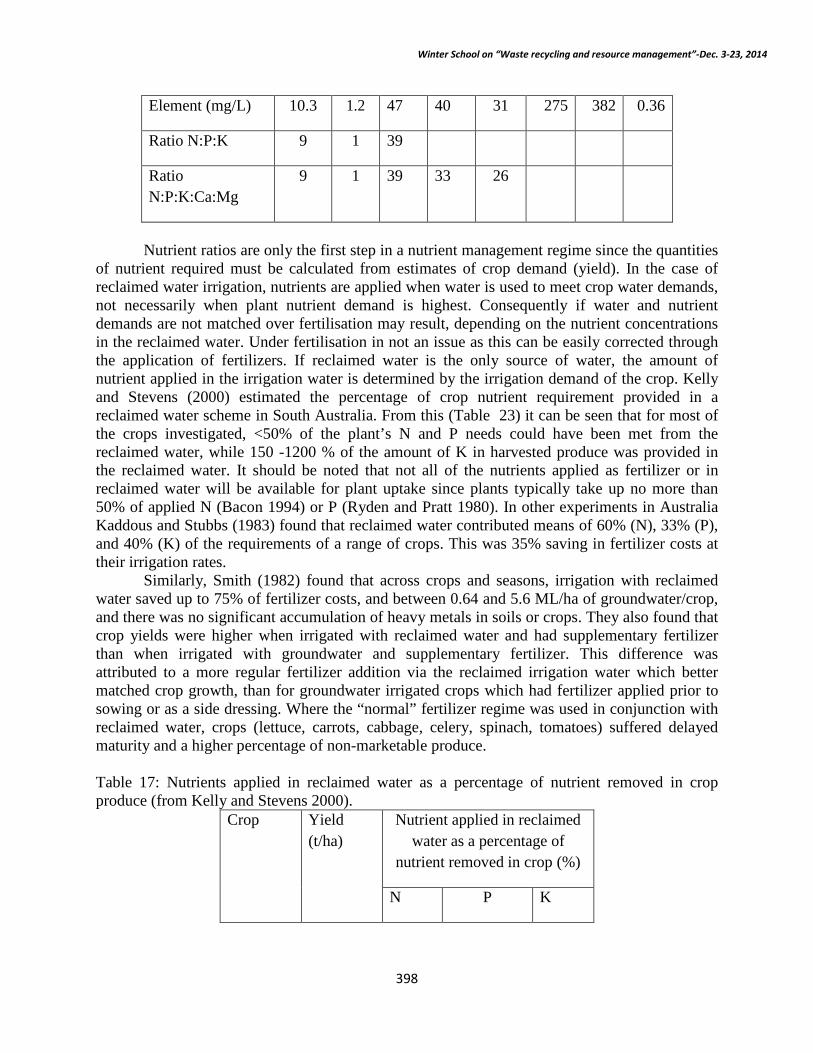
Winter School on “Waste recycling and resource management”-Dec. 3-23, 2014
Element (mg/L) 10.3 1.2 47 40 31 275 382 0.36
Ratio N:P:K 9 1 39
Ratio N:P:K:Ca:Mg
9 1 39 33 26
Nutrient ratios are only the first step in a nutrient management regime since the quantities
of nutrient required must be calculated from estimates of crop demand (yield). In the case of reclaimed water irrigation, nutrients are applied when water is used to meet crop water demands, not necessarily when plant nutrient demand is highest. Consequently if water and nutrient demands are not matched over fertilisation may result, depending on the nutrient concentrations in the reclaimed water. Under fertilisation in not an issue as this can be easily corrected through the application of fertilizers. If reclaimed water is the only source of water, the amount of nutrient applied in the irrigation water is determined by the irrigation demand of the crop. Kelly and Stevens (2000) estimated the percentage of crop nutrient requirement provided in a reclaimed water scheme in South Australia. From this (Table 23) it can be seen that for most of the crops investigated, <50% of the plant’s N and P needs could have been met from the reclaimed water, while 150 -1200 % of the amount of K in harvested produce was provided in the reclaimed water. It should be noted that not all of the nutrients applied as fertilizer or in reclaimed water will be available for plant uptake since plants typically take up no more than 50% of applied N (Bacon 1994) or P (Ryden and Pratt 1980). In other experiments in Australia Kaddous and Stubbs (1983) found that reclaimed water contributed means of 60% (N), 33% (P), and 40% (K) of the requirements of a range of crops. This was 35% saving in fertilizer costs at their irrigation rates.
Similarly, Smith (1982) found that across crops and seasons, irrigation with reclaimed water saved up to 75% of fertilizer costs, and between 0.64 and 5.6 ML/ha of groundwater/crop, and there was no significant accumulation of heavy metals in soils or crops. They also found that crop yields were higher when irrigated with reclaimed water and had supplementary fertilizer than when irrigated with groundwater and supplementary fertilizer. This difference was attributed to a more regular fertilizer addition via the reclaimed irrigation water which better matched crop growth, than for groundwater irrigated crops which had fertilizer applied prior to sowing or as a side dressing. Where the “normal” fertilizer regime was used in conjunction with reclaimed water, crops (lettuce, carrots, cabbage, celery, spinach, tomatoes) suffered delayed maturity and a higher percentage of non-marketable produce. Table 17: Nutrients applied in reclaimed water as a percentage of nutrient removed in crop produce (from Kelly and Stevens 2000).
Crop Yield (t/ha)
Nutrient applied in reclaimed water as a percentage of
nutrient removed in crop (%)
N P K
398

Winter School on “Waste recycling and resource management”-Dec. 3-23, 2014
Cabbage 50 35 25 160
Capsicum 20 126 150 341
Carrots 44 25 32 87
Cauliflower
50 43 26 175
Celery 190 17 8 34
Cucumber 18 416 271 1180
Lettuce 50 62 40 157
Potato 40 55 56 183
Tomato 194 53 27 143
The importance of interactions between water and N in crop production has been well
studied (Pier and Doerge 1995) and it is not necessary to discuss them here as they are not unique to reclaimed water irrigation. For reclaimed water irrigated crops, matching water and N supply can be difficult since growers lose some control over the timing of fertilizer application (Baier and Fryer 1973). If periods of peak crop water demand do not match peak N demand then N supply may be in excess of crop requirements. This may cause produce quality or yield decline, depending on the crop being grown or environmental problems off site. These problems are complicated and need to be addressed on a site by site basis, as nitrogen is probably the most variable component of reclaimed water (Westcot and Ayers 1984).
Sams (1999) summarised the effects of fertility on produce texture, indicating that N, P and K can reduce fruit firmness. Excessive K, relative to Ca, can increase fruit textural disorders. Calcium was highlighted as being the element most critical to fruit quality as it contributes more to the maintenance of firmness than any other element, and may be more significant than storage conditions for some fruits such as apples. Thus the relatively high cation content (particularly Ca2+) of reclaimed water might contribute to improved firmness and textural quality of fruits.
Baier and Fryer (1973) reviewed the principal concerns that relate to over-fertilisation of horticultural crops with N. A precis of the major issues is as follows. If too much N is applied yield can be reduced, particularly for perennial crops. The date of maturation of crops may also change (but not yield), or fruit size can decrease (e.g. peaches). Grape varieties respond differently to excess N, Malbec is very sensitive and Pinot Noir one of the least sensitive. The principal problem for grapevines is caused by pre-flower bud shatter when tissue nitrate-N reaches 1%. Problems may persist for more than one year if cane wood quality declines and impacts on next year’s growth and yield. Grapes can also accumulate phytotoxic levels of NO3
-. In potatoes and sugar beets too much N results in excessive vegetative growth and thus fewer and smaller tubers. Navel and Valencia oranges - when fertilised during the summer with excessive N (>17g/m2) produce grainy, pulpy oranges with less juice, and over-fertilised Valencia’s can also re-green when ripe. Lemons are rarely affected by over-fertilisation. Most
399
Winter School on “Waste recycling and resource management”-Dec. 3-23, 2014
stone fruit suffer a delay in maturation from over-fertilisation rather than a direct decrease in quality, this is because high N levels keep the plants vegetative for longer and this uses up carbohydrates which are normally stored in the fruit. With melons and squash the excessive vegetative growth may keep moisture content high around fruit and provide conditions conducive to development of rots. It is unlikely that over-fertilisation with P will occur from reclaimed water irrigation, since most of the P will be immobilised in the soil and not be readily available to plants (Ryden and Pratt 1980). Where N applied in the irrigation water exceeds the demand of annual crops, perennial crops can be grown as a management tool as these may have higher capacity for N uptake (Pettygrove et al. 1985).
The above provides an example of what can happen with over-fertilisation with N, whether reclaimed water or any water source that contain elevated concentrations of nitrogen. Zekri and Koo (1994) examined citrus fruit quality and production at some 32 sites irrigated with reclaimed or groundwater and concluded that over the 6 year period that any differences in fruit yield and quality were due to differences in total water applied (reclaimed water sites had more water applied) and not due to constituents of the water. Although there were higher levels of some ions in the leaves of reclaimed water irrigated plants the fruit quality remained well within acceptable standards. In studies with vines trickle irrigated with reclaimed water or well water (Neilsen et al. 1989a), yields of reclaimed water irrigated vines were higher than well water irrigated vines, despite application of >34g N/vine/yr for vines irrigated with well water. They concluded that the additional P and K applied in the reclaimed water contributed to the increased yield. Although this obviously reflects poor crop nutrition rather than beneficial effects of the reclaimed water per se, it does serve to illustrate the economic value of the contributions to crop production afforded by reclaimed water. These authors found similar results from parallel studies on apples (Neilsen et al. 1989b) and cherries (Neilsen et al. 1989c).
For potatoes in Australia, Premier et al. (2000) found that the use of reclaimed water (effectively only secondarily treated) for irrigation achieved very similar yields, potato size, disease levels, post harvest storage life, colour, and cooking characteristics, to freshwater irrigated crops. Heavy metal concentrations were also similar in both sets of potatoes, being well below risk levels. They concluded that potatoes grown with reclaimed water were of an equivalent quality to freshwater irrigated crops.
In general reclaimed water provides an excellent nutrient source for food crop production that can reduce grower fertilizer costs, provided that careful attention is paid to nutrient budgeting. There is little evidence to suggest that reclaimed water irrigated crops, managed appropriately, produce food of lower quality or shelf life than crops irrigated with other waters, and in some cases, such as tomato, crops may have enhanced flavour when irrigated with reclaimed water. Extended Resource/Reference: Khurana M. P. S. and Singh Pritpal. 2012. Waste Water Use in Crop Production: A Review,
Resources and Environment, 2: 116-131. www.fao.org/docrep/t0551e/t0551e04.htm Stephen R. Smith, A. 2009. Critical review of the bioavailability and impacts of heavy metals in
municipal solid waste composts compared to sewage sludge. Environment International 35: 142–156.
M. P. S. Khurana, Pritpal Singh. 2012. Waste Water Use in Crop Production: A Review.
400

Winter School on “Waste recycling and resource management”-Dec. 3-23, 2014
Resources and Environment 2: 116-131
Sajida Perveen, Abdus Samad, Wajahat Nazif And Sadaqat Shah. 2012. Impact Of Sewage Water On Vegetables Quality With Respect to Heavy Metals In Peshawar Pakistan. Pak. J. Bot. 44: 1923-1931.
H. Kasthuri, K. Shanthi, S. Sivakumar, S. Rajakumar, H. K. Son, Y. C. Song 2011. Influence of Municipal Solid Waste Compost (Mswc) on The Growth And Yield of Green Gram (Vigna Radiate (L) Wilczek), Fenugreek (Trigonella Foenum-Graecum L.) and on Soil Quality Iran. J. Environ. Health. Sci. Eng., Vol. 8, No. 3, pp. 285-294.
Rajinder Singh Antil. 2012. Impact of Sewage and Industrial Effluents on Soil-Plant Health, Industrial Waste, Prof. Kuan-Yeow Show (Ed.), ISBN: 978-953-51-0253-3, InTech, Available from: http://www.intechopen.com/books/industrial-waste/impact-of-sewer-water-and-industrial-wastewaters-on-soilplant-health
Hamid Iqbal Tak, Yahya Bakhtiyar, Faheem Ahmad and Arif Inam. 2012. Effluent Quality Parameters for Safe use in Agriculture, Water Quality, Soil and Managing Irrigation of Crops, Dr. Teang Shui Lee (Ed.), ISBN: 978953-51-0426-1,InTech, Available from:
http://www.intechopen.com/books/water-quality-soil-and-managingirrigation-of-crops/effluent-quality-parameters-for-safe-use-in-agriculture
Murray Unkovich, Daryl Stevens, Guang-Guo Ying and Jim Kelly. 2004. Impacts on crop quality from irrigation with water reclaimed from sewage. Australian Water Conservation and Reuse Research Program, CSIRO, Australia.
Shakunthala Bai, Shivanna Srikantaswamy, Doddaiah Shivakumar. 2010. Urban Wastewater Characteristic and its Management in Urban Areas—A Case Study of Mysore City, Karnataka, India. J. Water Resource and Protection, 2: 717-726.
R.K. Rattan, S.P. Datta, P.K. Chhonkar, K. Suribabu, A.K. Singh. 2005. Long-term impact of irrigation with sewage effluents on heavy metal content in soils, crops and groundwater—a case study. Agriculture, Ecosystems and Environment 109: 310–322
ec.europa.eu/environment/waste/sludge/pdf/part_i_report.pdf P.K.Singh,P.B.Deshbhratar,D.S.Ramteke. Effects of sewage wastewater irrigation on soil
properties, crop yield and environmentAgricultural Water Management 103: 100– 104.
401

Winter School on “Waste recycling and resource management”-Dec. 3-23, 2014
Role of microbes on greenhouse gas emission from compost
K. Bharati Indian Institute of Soil Science, Bhopal 462038. [email protected]
As the debate over Global Climate Change shifts from “is it happening” to “what do we do about it”, composting, like all other waste management activities, is being reviewed through the greenhouse gas lens. However, in order to make fair comparisons, we have to compare different activities as both possible sources of greenhouse gases and also as possible sinks. Composting would be beneficial if, when compared to alternatives, it either puts less greenhouse gases into the atmosphere (avoidance) or takes more CO2 out of the atmosphere (sequestration). Globally, agricultural green house gas (GHG) CH4 and N2O emissions have increased by nearly 17% from 1990 to 2005, an average annual emission increase of about 60 MtCO2-eq/yr. Waste management accounts for about 10 - 19% annual global methane emissions into the atmosphere (Bogner et al. 1999; IPCC 2001). In a country like India, agricultural waste i.e agro residues generated is 620 Mt, while at global scale it is 998Mt per yr. Animal manures agro waste particularly release significant amounts of N2O and CH4 during storage, but the magnitude of these emissions varies. GHG emissions in composting are mainly influenced by management, temperature, turning, aeration, height, composition, density, moisture content and pH of the raw materials
Composting may result in
1. CH4 emissions from anaerobic decomposition 2. Long-term carbon storage in the form of un-decomposed carbon compounds 3. Nonbiogenic CO2 emissions from collection and transportation of the organic materials
to the central composting site, and from mechanical turning of the compost pile. Composting also results in biogenic CO2 emissions associated with decomposition, both during the composting process and after the compost is added to the soil. Because this CO2 is biogenic in origin, however, it is not counted as a GHG in the Inventory of U.S. Greenhouse Gas Emissions and Sink and is not included in this accounting of emissions and sinks.
Importance of composting With emergence of municipal solid waste as a big problem for municipal authorities here
in India and abroad, companies introduced indigenously developed equipment to process mixed municipal solid waste. Aerobic composting is one such technology and it is considered to be one of the cheapest solutions to mixed municipal solid waste. All biodegradable material available in waste is converted into valuable organic manure. Aerobic composting is a process involving bio-chemical conversion of organic matter into humus lignopoteins by mesophilic and thermophilic organisms. A composting process seeks to harness the natural forces of decomposition to secure the conversion of organic waste into organic manure. This process is done under controlled conditions in order to make it aesthetically acceptable, minimize the production of offensive
402

Winter School on “Waste recycling and resource management”-Dec. 3-23, 2014
odours, avoid the propagation of insects, destroy pathogenic organisms present in the original waste, destroy weed seeds, retain the maximum nutrient content NPK, minimize the time required to complete the process, and minimize the land area required for the process. Compost serves as an ultimate solution for organic waste disposal, value addition to the project by means of fertilizer generation, easy handling and simple procedure, totally eco-friendly process, support to the green cover in the city, up-gradation of the natural resources by completing the cycle of nature. The rate of solid waste generation and the corresponding CH4 emission have increased to an exponential rate since 2001. By the year 2041, the waste will generate about 32 million tonnes of CH4 and this waste will require about 1100 km2 of land for disposal. As composition of MSW in India differs from city to city on wet weight basis the average India MSW consists of organic content, ash and fine earth, paper, glass, metal in different ratios. The calorific value of the Indian MSW is low due to the high inert matter and moisture content and is in the range 800-1000 K Cal Kg-1 (Sharholy et al., 2008). The total waste generated in urban India is estimated to be188, 500 tonnes per day (TPD) or 68.8million tonnes per year (TPY). A total of 366 cities in India which represent 70% of India's urban population generate 47.2 million TPY per capita waste generation rate of 500 g/day. At this rate the urban MSW generated in 2041 would be 230 million TPY and would occupy an area equivalent to that Mumbai, Chennai and Hyderabad.
Bacterial population during composting We know that composting is a microbial decomposition process where it is controlled by
physicochemical, physiological and microbiological factors (Fig 1). The importance of microbial communities (bacteria, actinomycetes and fungi) is well established. The number of mesophilic bacteria increases rapidly in first ten days, the count of mesophilic bacterial count remains in range of 1.7- 2.84 × 10⁹ cfu g-1. However, the thermophilic bacteria are dominant from 11–32 days of composting, with count in between 108 to107cfu g-1. Finally, mesophilic population stabilizes between 106 to 105 cfu g-1 during the cooling and maturation phase (30–40 days). Little is known about the thermophilic microorganisms involved in methane production and oxidation in these environments. But the Greenhouse gas regulating microbes the methanogens and methanotrophs also play a very significant role in regulating GHG emission from compost. In one study, it was shown that mushroom compost piles contain methanogens in dry matter, which were mainly identified as Methanobacterium thermoautotrophicum. However, both methane production and oxidation determine the net methane emission to the atmosphere. The oxidation is performed by methane-oxidising bacteria (MB). Phylogenetically MB belong to the Gammaproteobacteria (Methylococcaceae) and Alphaproteobacteria (Methylocystaceae and genera Methylocapsa and Methylocella).
403
Winter School on “Waste recycling and resource management”-Dec. 3-23, 2014
Fig 1. Microbial metabolism in a compost pile
Microbial Methane Oxidation
Microbial methane consumption is the only biogeochemical sink for removing methane from the atmosphere (Topp and Hanson, 1991) to reduce methane emissions. It occurs at the interface of aerobic and anaerobic zones, where methane is generated in anaerobic regions below, and methane uptake occures in aerobic zones above. Methane oxidation is typically accomplished by methanotrophs, a subset of a highly diverse group of bacteria called methylotrophs that can metabolize C-1 compounds such as methane, methanol, and methylamines (Hanson and Hanson, 1996). There are also a number of other bacteria, most notably ammonia oxidizers (Jones and Morita,1983; Bedard and Knowles, 1989), and some yeast that can oxidize methane (Wolf and Hanson, 1978). Microbial methane uptake is ubiquitous and occurs readily in a variety of ecosystems (Hanson and Hanson, 1996).
Increased knowledge of methanogens in manure will help us to mitigate GHG from compost sites. Studies are mostly carried for only short period of time and are used to extrapolate to obtain annual estimate therefore we should have year round measurement which would be more accurate and provide further information on the effect of climate
Green house gas (GHG) emission form compost
Some GHG emission during composting is unavoidable; however, management practices can reduce those emissions. Manure properties can be modified, e.g., by using bulking material to adjust the C/N ratio and moisture content (Shi et al., 1999), using proper windrow pile dimensions to manage aeration (Fukumoto et al., 2003) and using amendments to change manure pH, available C and N. Adding straw or woodchips (C-rich amendments) will increase the C/N ratio and reduce CH4 (Yamulki, 2006) and N2O emission (Mahimairaja et al., 1995;Yamulki, 2006). Adding phosphogypsum (PG), a P fertilizer industry by-product, reduced CH4 emission (Hao et al., 2005) mainly due to sulfur-reducing bacteria out-competing the methanogens as CH4 emission decreased exponentially with the total S content in manure. Although the N2O emission increased with the manure pH decreased from 8.0 to 7.4 by PG addition as N2O emission is generally greatest around neutral pH, the increases were not significant compared to no amended manure composting (Hao et al., 2005). Adding mature compost as a source of nitrite-oxidizing bacteria reduces N2O emission when solid swine manure was composted in a pilot scale forced-aeration (Fukumoto et al., 2006). However, when this was done with solid cattle feedlot manure in open windrow composting, no effect on N2O emission was observed (Hao et al., 2005).
Emissions may come from the composting process itself and from the equipment used to manage the process. Carbon dioxide released during composting is considered biogenic, so does not count in GHG calculations. While it is theoretically possible for CH4 to be generated in a poorly managed compost pile, the EPA has concluded that there is little evidence that this actually happens, so considers any releases negligible (EPA 2002). On the other hand, the fuel
404

Winter School on “Waste recycling and resource management”-Dec. 3-23, 2014
and electricity used to operate the equipment and buildings result in anthropogenic releases. Methane is formed as a by-product of microbial respiration in severely anaerobic environments when C is the only electron acceptor available. Carbon is used as an electron acceptor when other, more energetically favorable electron acceptors, including oxygen, nitrogen, iron, manganese, and sulfur, have been exhausted. Because the environments in a waste storage lagoon, landfill, or compost pile are not uniform, it is also possible that different electron acceptors can be used simultaneously. For example, when sulfur is used as an electron acceptor,highly odorous compounds, including dimethyl disulfide and methyl mercaptan, are formed. The presence of these compounds can be indicative of the presence of CH4. A compost or waste pile that exhibits minimal odors is more likely to have aerobic conditions throughout than a malodorous pile of processed feedstocks.
Nitrous oxide is a potent GHG, with the global worming potential of 298 over 100 years (IPCC, 2007). Even though many authors agree that compost management is decisive to determinate the amount of emission (Hao, 2007;Szanto et al., 2007, Hellebrand and Kalk, 2000) there is a difficulty to establish the variables that will be influencing the emissions the most. For instance during the initial phase of composting oxygen limitation plays a big role (Jarvis et al., 2009). In compost nitrous oxide peaks after 9 and 21 days of composting and are attributed to nitrification and denirtification processes respectively (Jarvis et al., 2009). During the mesophilic temperature the initial phase of composting is beneficial for nitrous oxide formation and when thermophilic conditions are reached, the production decreases (Beck-Friis et al., 2003). In denitrification process, nitrous oxide is an intermediate product, which can be transformed to N2 if the N2O reductase is present in the microbial community and the pH levels are beneficial (pH 6.5 - 7) for its assembly and functioning (Bergaust et al., 2010). A substantial release of N2O happens after the turning operations due to the transfer of NO2 –/NO3
–from aerobic portion into the anoxic portion (Jiang et al., 2011). Higher aeration rates increases the nitrification rate, producing both N2O and higher concentrations of NO2
–NO3–in the material. Nitrous oxide in
maturation phase of composting can be expected due to both nitrification and denitrification processes, which is especially relevant for larger composts as oxygen gradient is formed within the material (Beck-Friis et al., 2001) temperatures in mesophilic range and natural aeration is reducing. These conditions allow both nitrification and denitrification activities to continue.
Composting parameters influence microbial population
Nutrient balance –
It is determined primarily by the ratio of carbon to nitrogen in the compost mix (C/N ratio). It is like balancing carbohydrates and protein in a diet. Bacteria, actinomycetes, and fungi also require carbon and nitrogen for growth. These microbes use 30 parts of carbon to 1 part of nitrogen. Composting is usually successful when the mixture of organic materials consists of 20 to 40 parts of carbon to 1 part of nitrogen. However, as the ratio exceeds 30, the rate of
405
Winter School on “Waste recycling and resource management”-Dec. 3-23, 2014
composting decreases. As the ratio decreases below 25, excess nitrogen is converted to ammonia. This is wasted into the atmosphere and results in undesirable odors.
Phosphorus is another principal element required by compost microbes. Trace elements are needed in very small quantities. Normally, these elements are available in satisfactory amounts in compost when the C/N ratio is properly established.
Moisture content –
Compost should ideally be 60 percent after organic wastes have been mixed. Depending on the components of the mixture, initial moisture content can range from 55 to 70 percent. However, as the moisture content exceeds 60 percent, the structural strength of the compost deteriorates, oxygen movement is inhibited, and the process tends to become anaerobic. Low C/N ratio materials (e.g. meat wastes) putrefy when anaerobic. High ratio materials ferment. Both processes produce odors and must be avoided. As the moisture content decreases below 50 percent, the rate of decomposition decreases rapidly. As a rule of thumb, a mixture of organic wastes that contains 50 percent moisture feels damp to the touch but is not soggy.
Temperature
Rise in temperature occurs during composting results from the breakdown of organic material by bacteria, actinomycetes, fungi and protozoa. The temperature can range from near freezing to 71C. Starting at ambient temperature when the components are mixed, the compost can reach 65C in less than two days. Applying heat to compost from an external source serves no purpose unless ambient temperatures are far below freezing. Heat is generated from within the compost medium.
The hundreds of types of microorganisms involved with composting are generally classified into three categories according to temperatures most favorable to their metabolism and growth: As the microorganisms decompose (oxidize) organic matter, heat is generated and the temperature of the compost is raised a few degrees as a result. In composting, as in the decomposition of any complex substance, the breakdown is a dynamic process accomplished by a succession of microorganisms with each group reaching its peak population when conditions have become optimum for its activity. One group of microorganisms dies and another group thrives until the next incremental change in nutrition and temperature occurs, etc. Composting rate is generally measured by rate of carbon dioxide production. The maximum rate occurs when compost temperatures range from 43-65C. As the temperature exceeds 65C, the composting rate drops rapidly and becomes negligible at temperatures higher than 71C.
Most composting should include temperatures in the thermophilic range (43-65C). At these temperatures the rate of organic matter decomposition is maximum, and weed seeds and most microbes of pathogenic significance cannot survive. It takes three days at 55 C to kill parasites,
406

Winter School on “Waste recycling and resource management”-Dec. 3-23, 2014
fecal and plant pathogens. It is important that piles are turned frequently to ensure that all parts are exposed to high temperatures.
Aeration
It is a key element in composting. Proper aeration is needed to control the environment required for biological processes to thrive with optimum efficiency. A number of controllable factors are involved. Oxygen must be available to microbes in sufficient quantities to ensure vitality of the aerobic types and to minimize odors. The amount and type of bulking agent added during preparation of the compost determines the free air space in the pile. Pore space should range from 35-50% to maintain adequate aeration. Air may be forced through the pile to speed up the process. However, forced aeration adds complexity to the process.
Reduction of GHG emission from compost:
Greenhouse gas emissions from the agricultural sector can be reduced through implementation of improved management practices. For example, the choice of manure storage method should be based on environmental decision criteria, as well as production capacity. By composting all the cattle manure stored as slurry and stockpile, a reduction of 0.70 Tg CO2-eq year-1 would be achieved. Similarly, by collecting and burning CH4 emissions from existing slurry facilities, a reduction of 0.76 Tg CO2-eq year-1 would be achieved. New CH4 emission factors were estimated based on these results and incorporated into the IPCC methodology. For North-America under cool conditions, the CH4 emission factors would be 45 kg CH4 ha-1 year-1 for dairy cattle manure rather than 36 kg CH4 ha-1 year-1, and 3 kg CH4 ha-1 year-1for beef cattle manure rather than 1 kg CH4 ha-1 year (Pattey et al., 2005) contribution that manure management makes to total national agricultural emissions of N2O and CH4 vary, but can exceed 50% in countries reporting to the UNFCCC in 2009. On farm management decisions interact with environmental controls such as temperature and water availability of key microbial processes (i.e., nitrification, denitrification, methanogenesis, CH4 oxidation), affecting the magnitude of emissions from each stage of the manure management continuum. We review the current understanding of how manure management influences direct and indirect N2O emissions and CH4 emissions, introduce new data comparing direct N2O emissions following spreading of a range of manure types by different methods, and highlight some of the mitigations being considered by researchers and policy makers in developed and developing countries (Chadwick et al., 2011).
GHG emission could be reduced by managing compost pile size as larger piles increase CH4 and N2O emissions due to poor aeration (Fukumoto et al., 2003). Forced aeration and turning generally reduces CH4 emission (Lopez-Real and Baptista, 1996) while increasing compost pile porosity could reduce N2O emission (Møller et al., 2000). Bedding material used in cattle feedlots not only affects NH3 emission in the feedlot pen, but also GHG emission during composting. However, in open windrow composting, straw or woodchip bedding made no
407

Winter School on “Waste recycling and resource management”-Dec. 3-23, 2014
difference to GHG emissions from cattle feedlot manure (Hao et al., 2004). The effects of diet manipulation on manure properties can also carryover to affect GHG emission from manure composting. When an 85% barley grain finishing diet was replaced with 60% dried distilled grains (DDGS) and only 25% barley grain, N2O emissions from composting cattle manure were higher but CH4 emissions were not affected (Hao et al., 2011). The greater N2O emission can be attributed to the higher N content in DDGS. Separation of municipal solid waste followed by recycling (for paper, metals, textiles and plastics) and composting/anaerobic digestion (for putrescible wastes) gives the lowest net flux of greenhouse gases, compared to other options for the treatment of municiipal solid waste. In comparison with landfilling untreated waste, composting/anaerobic digestion of putrescible wastes and recycling of paper produce the overall greatest reduction in net flux of greenhouse of gases
Conclusion
The biggest benefit of composting with respect to Global Climate Change comes from avoiding the production of methane. Good composting practices minimize greenhouse gas emissions. The use of compost provides numerous greenhouse gas benefits, both directly through carbon sequestration and indirectly through improved soil health, reduced soil loss, increased water infiltration and storage, and reduction in other inputs.
408
Winter School on “Waste recycling and resource management”-Dec. 3-23, 2014
Organic Manures in Integrated Nutrient Management for Enhancing Productivity and
Nutrient Use Efficiency in Different Cropping System
R.H. Wanjari Indian Institute of Soil Science, Nabibagh, Berasia Road, Bhopal 462038 (Madhya Pradesh)
Keywords: Cropping system, integrated nutrient management, nutrient use efficiency, organic manures
Out of the total cultivated area of 142 million hectares (M ha) in India during 2011–12, 100.2 M ha was under cereals and 24.8 M ha under pulses, the staple food grains in the country (Economic Survey 2013). There is very little scope of bringing additional area under food grains; on the contrary this may decline in future due to the land needed for civil amenities and industrial purposes. Further, a lot of good agricultural land around villages and towns is being lost to urban development. As regards fertilizers, 27.57 M t of fertilizer (N + P2O5 + K2O) was used in 2011–12 as compared to a mere 0.069 M tonnes in 1950–51. Role of fertilizer in food grain production became more evident after the green revolution and NPK consumption increased from 1.1 Mt in 1966–67 to 28 Mt in 2011–12, and the food grain production increased from 74 Mt in 1966–67 to 257 Mt in 2011–12; about 70% of the total NPK was consumed in food grains production. Pulses have major role to maintain soil fertility and nutrient use efficiency. The beneficial effect of pulse crops in improving soil health and sustaining productivity has long been realized. On account of biological nitrogen fixation, addition of considerable amount of organic matter through root biomass and leaf fall, deep root systems, mobilization of nutrients, protection of soil against erosion and improving microbial biomass, they keep soil productive and alive by bringing qualitative changes in physical, chemical and biological properties. As a result of this, the productivity of cereals following a preceding grain legume often increases and corresponds to 40-60 kg N equivalent. Moreover, India has key place in global pulses production and contributes about 25% to the total pulse basket (Singh et al 2009).
Cropping system is a kind of sequence and arrangement of crops grown on a given area of land over a period of time. Cropping systems are the outcome of the technological innovations, household needs, reflection of government policies, availability of production inputs, market forces and socio-economic compulsion. An ideal cropping system should use natural resources efficiently, provide stable and high returns and do not damage the ecological balance. Cropping system is broadly grouped into sequential cropping and intercropping. It may be a regular rotation of different crops in which the crops follow a definite order of appearance on the land or it may consist of only one crop grown year after year on the same area. Other cropping systems may include different crops but lack definite or planned order in which crops follow one another or growing of two or several crops mixed together (Singh, 1972). More than 250 double
409

Winter School on “Waste recycling and resource management”-Dec. 3-23, 2014
cropping systems of primary, secondary and tertiary importance in terms of their spread in the country have been recorded. Out of which 30 are of primary importance (Yadav and Prasad, 1997). The top ten cropping systems contributing most to the food basket of our country are, viz., Rice-wheat, rice-rice, cotton-wheat, pearl millet- sorghum, maize-wheat, pearl millet- wheat, sorghum-sorghum, rice-chickpea, sugarcane-wheat, maize-chickpea. Under such cirmstances short-duration varieties of different crops could be fitted in crop rotations e.g. Maize-wheat-greengram / blackgram Greengram-wheat, potato-wheat-greengram, Rice-wheat-greengram/ blackgram, pigeonpea- wheat- greengram, pigeonpea-wheat, pigeonpea-lentil, Maize-groundnut-pea, Groundnut-wheat-mungbean/urdbean Groundnut-wheat etc. Thus various cropping systems will help in building the soil fertility and crop productivity.
Plant nutrient (N + P2O5 + K2O) availability from organic sources such as farmyard manure, compost, vermicompost and green manure is estimated at 13 Mt (9 Mt net). These estimates exclude secondary and micronutrients added, which are sizeable. Organic ma-nures and crop residues can play a major role in recycling K. Concomitant use of organic manure and fertilizer can reduce losses of nutrients. Fertilizer is one of the key inputs in crop production and India has made rapid growth in fertilizer consumption, particularly after the introduction of high yielding varieties (HYVs) in mid sixties (Chander, 2013). Soil fertility depletion due to imbalanced and inefficient use of nutrients has become serious constraint in improving yields. Continuous nutrient mining and non-recycling of crop residues have aggravated the problem of multi-nutrient deficiencies in Indian soils. The nutrient use efficiency is low and declining. The low nutrient use efficiency not only affects crop yields and farmer’s profit but also poses a great threat to the environment. Thus, integrated nutrient application plays key role in maintaining productivity and sustainability of the crops/ cropping system. According to Majumdar et al (2013) for best fertilizer use one should adopt and follow the principle of “4 R” – as the right nutrient source, at the right rate, right time and right place to achieve economics, social and environmental goals. This holds true not only for fertilizer but also for nutrient in totality. Thus, nutrient use efficiency represents a key indicator to assess progress towards better nutrient management. Keeping in view above background in mind Integrated Nutrient Management is vital for increasing food production.
Nutrient Scenario
To meet food grains requirement of 300 Mt by 2025, 45 Mt of N + P2O5 + K2O is estimated to be required per annum (Prasad 2012). Out of this, 35 Mt is proposed to be met from the chemical fertilizers and the rest from organic manures (Table 1). A similar estimate of one-and-half times to that in year 2007– 08 consumption of 23 Mt of NPK was made by Tiwari (2007). The present installed capacity of fertilizers is only 12.3 Mt of N and 5.7 Mt of P2O5. All potash is imported. During 2007–08, 6.9 Mt of urea, 3.0 Mt of DAP/MAP and 4.4 Mt of muriate of potash (KCl) were imported. Obviously, imports will increase in the coming years to sustain increased food production unless adequate incentives are provided to the fertilizer industry to increase the installed fertilizer production capacity.
410
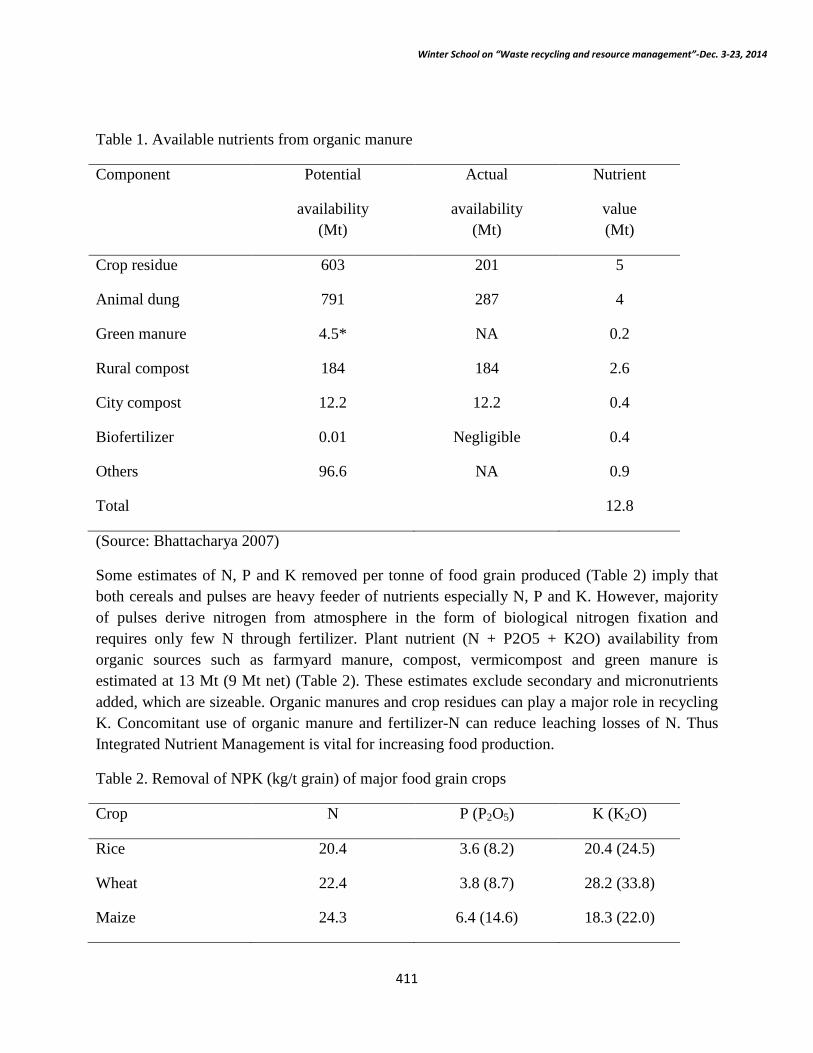
Winter School on “Waste recycling and resource management”-Dec. 3-23, 2014
Table 1. Available nutrients from organic manure
Component Potential
availability (Mt)
Actual
availability (Mt)
Nutrient
value (Mt)
Crop residue 603 201 5
Animal dung 791 287 4
Green manure 4.5* NA 0.2
Rural compost 184 184 2.6
City compost 12.2 12.2 0.4
Biofertilizer 0.01 Negligible 0.4
Others 96.6 NA 0.9
Total 12.8
(Source: Bhattacharya 2007)
Some estimates of N, P and K removed per tonne of food grain produced (Table 2) imply that both cereals and pulses are heavy feeder of nutrients especially N, P and K. However, majority of pulses derive nitrogen from atmosphere in the form of biological nitrogen fixation and requires only few N through fertilizer. Plant nutrient (N + P2O5 + K2O) availability from organic sources such as farmyard manure, compost, vermicompost and green manure is estimated at 13 Mt (9 Mt net) (Table 2). These estimates exclude secondary and micronutrients added, which are sizeable. Organic manures and crop residues can play a major role in recycling K. Concomitant use of organic manure and fertilizer-N can reduce leaching losses of N. Thus Integrated Nutrient Management is vital for increasing food production.
Table 2. Removal of NPK (kg/t grain) of major food grain crops
Crop N P (P2O5) K (K2O)
Rice 20.4 3.6 (8.2) 20.4 (24.5)
Wheat 22.4 3.8 (8.7) 28.2 (33.8)
Maize 24.3 6.4 (14.6) 18.3 (22.0)
411

Winter School on “Waste recycling and resource management”-Dec. 3-23, 2014
Sorghum 26.1 4.5 (10.3) 21.5 (25.8)
Pearl millet 27.1 8.2 (18.8) 39.7 (47.6)
Chickpea 50.6 8.6 (19.7) 29.7 (35.8)
Pigeonpea 92.1 8.2 (18.8) 30.7 (36.8)
At present, India is the second largest producer of fertilizer-nitrogen and the third largest producer of phosphate fertilizers in the world (Table 3). Potash is totally imported. As regards consumption, India is second only to China in nitrogen and phosphorus. However, the fertilizer consumption in India is quite skewed. The average fertilizer consumption of 120 kg/ha (in 2007–08) masks more than it reveals. During 2007–08, fertilizer NPK consumption (kg/ha) was maximum in Andhra Pradesh (205) followed by Punjab (196), Tamil Nadu (184), Haryana (182) and Uttar Pradesh (154), but was less than 2 kg/ha in Arunachal Pradesh and Nagaland (Prasad 2012).
At present, India is the second largest producer of fertilizer-nitrogen and the third largest producer of phosphate fertilizers in the world (Table 2). Potash is totally imported. As regards consumption, India is second only to China in nitrogen and phosphorus. However, the fertilizer consumption in India is quite skewed. The average fertilizer consumption of 120 kg/ha (in 2007–08) masks more than it reveals. During 2007–08, fertilizer NPK
Table 3. Production and consumption of nitrogen and phosphate fertilizers (2007–08)
Country Production (Mt) Consumption (Mt)
N P2O5 N P2O5
China 35.3 12.6 31.3 11.5
India 10.9 3.7 14.4 5.5
USA 8.5 8.9 11.6 4.1
Although it is reasonable to assume that, on a global scale, at least 50% of the fertilizer N applied is lost from agricultural systems and most of these losses occur during the year of fertilizer application. However, these losses could be minimized by adoption of good agronomic practice and best fertilizer management options. In case of P fertilizer applications typically result in cereal yield increases by 20 to more than 50 kg grain/kg P applied. Under favorable growth conditions, most agricultural crops recover 20-30% depending upon the growth stage of P
412

Winter School on “Waste recycling and resource management”-Dec. 3-23, 2014
applications. A large portion of the unused P accumulates in the soil and is eventually recovered by subsequent crops over, a much smaller fraction of P losses as runoff or through leaching that can be secondary off-site impacts (Dobermann, 2007). On the contrary, it has been reported that in developing countries, K input output budgets in agriculture are highly negative (Sheldrick 2002). In countries like India, annual K losses hover around 20-40 kg ha-1 and those have been increased steadily during the past 40 years (Majumdar et al 2013). Therefore, it is expected that there will be high nutrient use efficiency for the K in such areas. Today economic and environmental challenges are demanding more attention to nutrient use efficiency. Moreover, higher prices for both crops and fertilizers have highlighted interest in efficiency improving technologies and practices that also improve productivity. In addition, nutrient losses that harm air and water quality can be reduced by improving use efficiencies of nutrients particularity for nitrogen (N) and phosphorus (P).
Agricultural cropping systems contain complex combinations of components like soils, plants, water, soil microbes, crop rotations etc. Improvements in the efficiency of one component may or may not be effective in improving the efficiency of the cropping system. Nutrient inputs may include fertilizer alone or other sources including manures, nutrients in the soil, biological activities (e.g. N-Fixation). Outputs may consider the specific nutrient in question. Because a cropping system includes multiple inputs and outputs, its overall efficiency depends on the science of economics. To maximize profit is to obtain the maximum values of outputs per unit values of all inputs. At the rate where the net return to the use of one input peaks, the input is making its maximum contribution to increase the efficiency of all other inputs involved. Rates of nutrient application optimal for economic yields often minimize nutrient losses (Hong et al. 2007).
Concept and Principles of Nutrient Management
All plants require at least 17 essential elements to complete their life cycle. Nutrient availability in many native soils is too low in at least one or more of the essential nutrients to allow crops to express their genetic potential for growth. Each plant nutrient has specific function within the plant. Some are relatively simple while others take part in extremely complicated biochemical reactions. Once within the plant, the original source of the mineral nutrient is no longer important. One should remember and follow the concept that nutrients must be applied as right source at the right rate, time and place for the best nutrient management with the aim to enhance nutrient use efficiency. Applying the right source of plant nutrients at the right rate at the right time, and in the right place is the case concept of ‘4 R’ nutrient stewardship. The principles are the same globally, but how they are put into practice varies locally depending on specific soil, crop, climate, weather, economics and social condition. Farmers and crop advisers make sure the practices they select and apply locally are in accord with these principles.
413

Winter School on “Waste recycling and resource management”-Dec. 3-23, 2014
Right Source: The idea of selecting the most appropriate nutrient source seems simple in concept, but many factors need to be considered when adopting this choice. Factors influencing selecting the right source are namely, fertilizer delivery, issues, environmental concerns, product price and economic constraints. Important considerations for nutrient management for high nutrient use efficiency are (i) Consider rate, time and place of application (ii) Supply nutrients in plant-available forms (iii) Suit soil physical and chemical properties (iv) Recognize synergisms among nutrient elements and sources (v) Recognize blend compatibility (vi) Recognize benefits and sensitivities to associated elements and (vii) Control effects of non-nutritive elements
Right Rate : The core scientific principles that define right rate for a specific set of conditions are (i) Consider source, time and place of application (ii) Assess plant nutrient demand (iii) Use adequate methods to assess soil nutrient supply (iv) Assess all available nutrient sources (v) Predict fertilizer use efficiency (vi) Consider soil resource impacts and (vii) Consider rate-specific economics
Right Time : The core scientific principles that define right time for a specific set of conditions are (i) Consider source, rate and place of application (ii) Assess timing of plant uptake (iii) Assess dynamics of soil nutrient supply (iv) Recognize dynamics of soil nutrient loss (v) Evaluate logistics of field operations. Many examples (Majumdar et al., 2013) of timing fertilizers applications based on stage of crop growth can be given but few are referred here: (i) N application to small grains such as wheat : Most wheat recommendations calls for some N applied at planting, with the majority top-dress applied by (before) jointing. By the time wheat begins heading later in the season the majority of N has been taken up, and if good N a management practices were not previously used, then yield will suffer. (ii) Ca for groundnut: Groundnuts are especially sensitive to Ca deficiency. High levels of available Ca are needed in the soil zone where groundnuts pods are developing and thus pre-bloom applications of soluble Ca materials (i.e. calcium sulfate or calcium nitrate) are sometimes made to groundnuts. (iii) Mn for soybean: Early season foliar applications of Mn are often made to soybean in areas when deficiency symptoms appear on the plant tissue.
Right Place : The core scientific principles that define right time for a specific set of conditions are (i) Consider source, rate and place of application (ii) Consider where plants roots are growing (iii) Consider soil reactions (iv) Suit the goal of the tillage system and (v) Manage spatial variability
Measures of Nutrient Use Efficiency
In general, four terms are used in relation to NUE. These are: Agronomic Efficiency (AE), Recovery Efficiency (RE), Physiological Efficiency (PE), and Partial Factor Productivity of Fertilizers (PFPf). The expressions used for determining these NUE measures (Prasad 2009) are (i) AE (kg grain /kg nutrient applied) = (Yf – Yc)/ Na (ii) RE (% of nutrient taken up by a crop) = (NUf – NUc)/Na x 100 (iii) PE (kg grain/kg nutrient taken up by a crop) = (Yf – Yc)/(NUf–NUc)
414
Winter School on “Waste recycling and resource management”-Dec. 3-23, 2014
and (iv) PFPf (kg grain/kg nutrient applied) = Yf/ Na. In these above formulae the notations indicated as Yf, Yc = Yields (kg ha–1) in fertilized (f) and control (c) plots ; NUf, NUc = Nutrient uptake by a crop (kg ha–1) in fertilized (f) and control (c) plots; and Na = nutrient applied (kg ha–1)
AE is the same as “crop response ratio” or productivity index used by FAO (1989) and can be determined for a single nutrient (N, P, or K) or for a combination of nutrients (NP, NK, PK, or NPK), or for a fertilizer material per se. PFPf can also be determined for a single or a combination of nutrients or for a fertilizer per se. PFPf which was recently introduced does not ask for a ‘no-fertilizer control’ plot yield. This term permits comparison of fertilizer use efficiency in different countries or in different regions of a country. The term is useful in comparing the advantages of fertilizer use in experiments on tillage, irrigation, weed control etc., where a ‘no fertilizer control’ is typically not provided. Further, RE may be apparent recovery efficiency (RE) or true recovery efficiency (REt). REt is determined with the help of 15N for N and 32P for P. RE is used by soil and environment scientists in finding out the part of nutrient taken up by crop and the part causing environmental pollution. PE is used by plant physiologists and plant breeders in studying the efficiency of different crops or cultivars of a crop in utilizing the absorbed nutrients. PE is actually AE/ RE.
Impact of Nutrient Management on NUE
AE or Crop Response Ratio
Cereals
In the pre-Green Revolution era tall rice and wheat varieties showed highest response ratio for N (11.6 to 16.7 kg grain/kg N), followed by P (5.5 to 12.5 kg grain/kg P2O5), and the least for K (3.6-6.2 kg grain/kg K2O) (Prasad 2009). Furthermore, response to NP, NK, or NPK was not additive of their individual responses, which made the farmers to apply mostly N alone. Similarly, after Green Revolution era the increase in yield due to fertilizer was much higher (1.1 to 2.6 Mg ha-1 compared to 0.47 to 1.25 Mg ha-1 for tall wheat), the response ratio to NPK application was not much due to higher NPK doses and ranged from 4.7 to 10.9 kg grain/kg nutrient.
Balanced NPK fertilization has received considerable attention in India (Prasad 2009). Farmers, specially the marginal and dryland farmers, generally, tend to apply only N. However, the AEn of applied N can be largely increased by adequate P and K fertilization (Table 4). About 45% of Indian soils are also deficient in S and 48% in Zn. The soils in eastern India are particularly deficient in B.
415

Winter School on “Waste recycling and resource management”-Dec. 3-23, 2014
Table 4. Effect of balanced NPK fertilization on agronomic efficiency of nitrogen
Crop Control yield
(kg· ha–1)
N applied (kg ·ha–1)
AEn (kg grain or cane /kg N)
Increase in AEn due to PK application (%)
–PK + PK
Rice (kharif) 2740 40 13.5 27.0 100 Rice (boro) 3030 40 10.5 81.0 671 Wheat 1450 40 10.8 20.0 85 Pearl millet 1050 40 4.7 15.0 219 Maize 1670 40 19.5 39.0 100 Sorghum 1270 40 5.3 12.0 126 Sugarcane 4220
150 78.7 227.7 189
(Source: Prasad 2009)
Pulses
The AE for soybean found around 10 kg grain/kg N, 5 for P, 16 for K and 9 for combined use of NPK in long term fertilizer experiments at Jabalpur (Vertisols) (Singh and Wanjari, 2009). However, in Alfisols of Ranchi the AEn was negative due to adverse effect of N alone treatment than control. But application of P and K has enhanced the crop response ratio in Alfisols to 29, 34 and 21 kg grain /kg P, K and NPK, respectively.
Oilseeds
According to Aulakh and Garg (2007), nitrogen use-efficiency (NiUE) in sunflower with 60 kg N ha-1 ranged from 8.1 to 12.4 kg seed yield kg-1 N in different years with 4-year average of 10.2 seed kg-1 N. Further increase in seed yield with the application of fertilizer N along with 4 t CR ha-1 (crop residues) indicates either improvement in NiUE and/or availability of N added through CR. In case of groundnut, NiUE with 15 kg N ha-1 was 5 kg pod kg-1 N, which was enhanced by about 4 times owing to the residual effect of CR. Fertilizer P use-efficiency (PUE) with different rates and frequencies of applied P ranged from 5 to 30 kg seed kg-1 P in sunflower and 6 to 25 kg pod kg-1 P in groundnut. Phosphorus use-efficiency was greater at each P rate when P was provided only to sunflower than only to groundnut, and was lowest where both sunflower and groundnut were provided with fertilizer. At 30 kg P2O5 ha-1 (13 kg P ha-1), sunflower-applied P produced 24 kg sunflower seeds and 14 kg groundnut pods with a total yearly PUE of 38 kg yield kg-1 P. Where 30 kg P2O5 ha-1 was applied only to groundnut, total yearly PUE was 27 kg yield kg-1 P (17 kg groundnut pod plus 10 kg sunflower seed). The highest PUE obtained with sunflower-applied 30 kg P2O5 ha-1 in conjunction with 4 t CR ha-1. Thus, in order to harness highest benefit of N and P fertilizers, especially when resources are limited, (a) N and P
416

Winter School on “Waste recycling and resource management”-Dec. 3-23, 2014
application to winter-grown sunflower is the best option, and (b) recycling of crop residues greatly improve the efficiency of N and P fertilizers.
Recovery Efficiency
Cereal
It is documented that rice-wheat cropping system is the backbone of food security in India (Prasad, 2005) and values of true recovery efficiency from some experiments in India showed that in rice the values ranged from 26 to 35.8%, while in wheat these ranged from 25.6 to 44%. The global average values for rice, wheat, and maize clearly show that the values of all the terms associated with nitrogen use efficiency (NiUE) declined as the rate of N applied increased. At similar N levels, values of all NiUE terms in rice were lower in India compared to the global values. On the other hand, values of all terms of NiUE in wheat were higher in India than the global values, showing that in India N is more efficiently utilized for wheat than rice. Thus in rice there is considerable scope to increase NiUE. RE of P varied from 20–37%, while that of K varied from 40–56% in the rice-wheat cropping system.
Pulses
It has been estimated that 668,000 tonnes of nitrogen can be incorporated in the soil through the inclusion of legumes in cropping systems. The intrinsic nitrogen fixing capacity of pulse crops enables them to meet large proportion of their nitrogen requirement and also helps in economizing nitrogen in succeeding non-legume crops due to the residual effect. Different legumes have different capacity to leave behind varying amounts of N for use by the succeeding crops. In sequential cropping involving pulses, the preceding pulse may contribute 18-70 kg N/ha to the soil and thereby considerable amount of nitrogen to succeeding crop (Ali and Mishra 2000). The beneficial effect of pulses was more pronounced in maize as compared to sorghum after chickpea and pigeonpea whereas after lentil and peas the higher N equivalent benefit was observed after pearlmillet. Growing of short duration legumes such as green gram and cowpea in widely spaced crops and ploughing back the same in the soil after picking the grains resulted in an advantage of 30 kg N/ha on fertilizer basis in Alfisol of Hyderabad. Rekhi and Meelu (1983) found that incorporation of crop residue of mungbean in rice-wheat system not only added 100 kg N/ha to the soil but also maintained high availability of N during various growth stages of rice.
417

Winter School on “Waste recycling and resource management”-Dec. 3-23, 2014
Oilseeds
The apparent recovery of fertilizer N was 39% in sunflower and 55% in groundnut suggesting the latter a better user of fertilizer N (Aulakh and Garg, 2007). They further reported that the apparent recovery of fertilizer P by sunflower ranged from 39 to 44, 14 to 23 and 23 to 26% with the direct, residual and cumulative P treatments, respectively. The corresponding values for the P recovery by recovery of fertilizer P by both crops of groundnut-sunflower system was highest from 30 kg P2O5 ha-1 (13 kg P ha-1), applied to sunflower (75%), followed by P applied to groundnut (50%) and lowest from the P applied both to groundnut and sunflower further revealing that P was best used when applied to sunflower only. Soils receiving successive applications of fertilizer P either to each crop or to one crop in a long term crop rotation often accumulate large amounts of residual P due to low crop utilization of fertilizer P (often < 40%). Halvorson and Black (1985) reported fertilizer P recovery up to 45% in a long-term dryland cropping experiment. According to Aulakh and Grag (2007) P recovery was almost doubled when groundnut was fed on leftover fertilizer P in soil from preceding sunflower under irrigated groundnut-sunflower rotation.
Approaches to Improve NUE
Crop yield directly or indirectly is the numerator in all the terms of FUE/NUE and the crop, soil and agronomic factors that increase crop yield may therefore increase FUE/NUE (Prasad, 2009, 2012). Data on potential yield, on-station, and on-farm yields shows a gap of 37–52% between potential and on-station yields and a 35–70% gap between potential and on-farm yields. The gap between on-station and on-farm yields varied from 6–44%. In general the gaps are wider in rice than in wheat. The available farm technology can at least reduce on-station–on-farm gap and this can increase rice and wheat production by 15–20%. However, in rice the on-station–on-farm gap is zero in Ludhiana region of Punjab and in wheat it is even slightly negative in Pantnagar, Uttaranchal (Prasad 2009). This shows that the farmers have already applied the available technology in these regions. Thus with good extension efforts it can be replicated in other parts of the country. Information on benefits of improved technology as compared to farmers’ practices in increasing crop yield is also available for pulses (Ali et al 2002).
Soil Management
Both chemical amendments such as lime and gypsum and physical management involving tillage are important for increasing crop yields and in doing so, they improve NUE.
Liming acid soils: Nearly 51 million ha of soils in India have pH 5.5 or less (Mahapatra and Pattanayak, 2008). Long-term fertilizer experiments from Ranchi (Nambiar, 1994) further show that over a period of 13 years, maize yield was higher under NPK + lime compared to no-lime treatments. Continuous application of FYM also maintained reasonably good yields (71.7% of that obtained with NPK + lime).
418

Winter School on “Waste recycling and resource management”-Dec. 3-23, 2014
Gypsum application in sodic soils: Crop yields are low on sodic soils and can be largely increased by gypsum application. Data from Karnal (Singh and Abrol, 1988) illustrated that PFPnpk in wheat almost doubled following gypsum application.
Tillage: Puddling rice paddies reduces percolation of water and leaching of fertilizers, especially N, besides helping in weed control. The net result is increased rice yield and PFPn (Dwivedi et al., 2003). Several new tillage implements such as laser aided land leveller, mechanical rice transplanter, and drum seeders have recently become available (Tomar et al., 2006) and their use in rice cultivation will increase NUE. It is now possible to sow wheat soon after rice harvest without primary cultivation with zero-till machines, which permits timely sowing, besides ensuring increased grain yields and PFPnpk (Yadav et al, 2005; Singh et al, 2008). Advantage of zero tillage has also been reported for maize after rice in Telangana region of Andhra Pradesh (Reddy and Veeranna 2008). In arid regions, off-season tillage can help in storing soil moisture, which increases crop yield and PFPnpk (Samra 2003).
Crop Management
Crop varieties and cropping systems: The Green Revolution in India was initiated with the introduction of high yielding fertilizer responsive dwarf varieties of wheat (Swaminathan, 2006), which not only gave higher yields but also higher NUE. The introduction of rice hybrids (Chang et al 1988; Siddiq 2006) promises one tonne additional yield over that obtained with current high yielding varieties and an increase in AEn and REn (Kumar and Prasad 2004; Kumar et al 2007).
Timely sowing/transplanting: Delayed transplanting of rice reduces grain yield and PFPnpk as is obvious from the data from Bhubaneswar (Nayak et al 2003). Late sown wheat in rice-wheat cropping system results in16–24% less grain yields and 21.9 to 16–19.4% lower PFPnpk (Tripathi et al 2002).
Plant population: Sub-optimal plant population is one factor that reduces crop yields in India more than any other factor. Lower seed rates associated with wider spacing and fewer seedlings per hill in the case of rice and seedling mortality due to diseases and pests are the major factors that affect plant population in other crops. In rice transplanting two seedlings is advantageous from the viewpoint of grain yield as well as PFPnpk (Nayak et al 2003). Increasing seed rate from 100 to 125 kg ha–1 increased rice yield by 240 kg ha–1 and PFPnpk by 2% (Tripathy and Mohapatra 2007). Further increase in seed rate, however, reduced grain yield and PFPnpk. A large volume of data exists on seed rate, spacing, thinning etc. on most crops in India but it has not been linked with NUE.
419

Winter School on “Waste recycling and resource management”-Dec. 3-23, 2014
Weed Control: Weeds compete with crop plants for nutrients, water, and sunlight and as a consequence reduce crop yield and NUE. Examples are the menace of Phalaris minor in wheat in India (Sharma, 2007) and weedy rice (a natural hybrid of Oryza sativa and wild rices O. rufipogon and O. nivara) in South and Southeast Asia (Anonymous, 2007). Considerable information exists in India on effective weed control through mechanical methods and herbicides (Gupta, 1984), albeit it is not linked with NUE. Saha et al (2007), however, showed that effective weed control in rainfed rice in Cuttack raised grain yield by 1.34 Mg ha–1 and PFPnpk by 11.2%.
Water Management: Water management involving proper irrigation scheduling (irrigated areas) and moisture conservation (rainfed agriculture) is highly correlated with NUE. For example, in wheat, irrigation at 1.0 IW/CPE increased grain yield by 0.41 Mg ha–1, water use efficiency by 7.5 kg ha–1cm–1 and PFPnpk by 1.7 kg grain kg NPK–1 over irrigation at 0.8 IW/CPE (Verma and Singh 2008). Similarly, construction of water harvesting structures for irrigation is potential mechanisms in rainfed agriculture to increase grain yield as well as PFPnpk (Pali et al 2007).
Fertilizer Management
Materials: These are of two kinds slow-release nitrogen fertilizers: the coated conventional fertilizers such as sulphur coated urea, polymer coated urea, neem coated urea, and the inherently less soluble materials, which are mostly urea-aldehyde products, such as ureaform (urea-formaldehyde), isobutylidene diurea (IBDU), and crotonaldehyde diurea (CDU). However, the cost of N in these materials is twice or thrice or even more than the conventional fertilizers, making them beyond the reach of common farmers. Another approach has been to use nitrification inhibitors to retard nitrification of applied NH3 or urea-N and to reduce leaching and de-nitrification losses (Prasad 2005). The most widely tested and used nitrification inhibitors are Nitrapyrin or N-Serve, AM (2-amino-4-chloro, 6-methyl pyridine), and dicyandiamide. On-farm trials in Delhi, Punjab, Haryana, and Uttar Pradesh have shown that neem cake coated urea (NCCU) results in 6 to 11% increase in rice yield. PFPn for NCU ranged from 41 to 43% compared to 36 to 41% for prilled urea (Prasad 2007). Yield benefits with urea super granules (USG) over prilled urea varied from 0.2 to 1.2 Mg ha–1 at the same level of N (Kumar et al 1989). Production of USG in India, however, did not take off. Nonetheless, it was more popular and well received by the rice farmers of Bangladesh (Balasubramanian et al 2004). There has been not much research on slow-release P and K fertilizers. As regards to phosphate fertilizers, the phosphate rock is insoluble but on acid soils it can be directly used. However, good response have tested in lab to nano phosphorus which now being taken to field for their recommendation as it is low volume and highly efficient material from NUE.
Time of application: Split application of N is highly desirable since crop plants take up very small amounts of N ha–1day–1. For example, Prasad (2006) reported that rice removed just 1–1.2 kg N ha day–1. Excess N not used by crops is subject to various mechanisms of losses (Adhya et al 2007; Pathak et al 2008). Recent research has shown that for determining the proper time of post transplant/sowing application of N, use of new tools such as chlorophyll meters and leaf
420
Winter School on “Waste recycling and resource management”-Dec. 3-23, 2014
colour charts holds promise (Pathak and Ladha 2007, Bijai-Singh 2008). Most P and K are applied at sowing/transplanting, although it is reported that in wheat P may be applied after the first irrigation, in case it is not available or applied at sowing (Singh 1985). Likewise, some reports on the advantage of split application of K in rice are available (Meena et al 2002).
Method of application: It is known that there is advantage of deep placement of P for increasing its efficiency for crops other than rice (Rao et al 2003). However, only in areas where agriculture is mechanized, deep placement of P is practised; elsewhere, it is still broadcast depriving the farmers the full benefits of P fertilization. Regarding N also, deep placement increases nitrogen use efficiency (NiUE). Panda et al (2007) reported that band furrow placement of N doubled NiUE compared to its broadcast application in rainfed lowland rice. Foliar application of N is desirable in dryland agriculture, because the farmers in these areas apply fertilizers only when rains come, and these are often delayed. Thanunathan et al. (2004) recommended foliar application of N and K in flooded rice.
Balanced NPK Fertilization and Site Specific Nutrient Management: Balanced NPK fertilization has received considerable attention in India (Ghosh et al 2004). Farmers, specially the marginal and dryland farmers, generally, tend to apply only N. However, the AEn of applied N can be largely increased by adequate P and K fertilization. Adequate application of S and Zn in the soils deficient in these nutrients automatically increases the AEnpk (John et al. 2006). Widespread deficiencies of S, Zn, and B have led to the evolution of site specific nutrient management (Singh et al 2008). The SSNM increases the AE of all nutrients applied as it involves analyzing the soils for all essential plant nutrients and developing fertilizer recommendations based on soil analysis.
Integrated Plant Nutrient Supply System (IPNS): The IPNS demands a holistic approach to nutrient management for crop production and it involves judicious combined use of fertilizers, biofertilizers, organic manures (FYM, compost, vermicompost, biogas slurry, green manures, crop residues etc.), and growing of legumes in the cropping systems (Prasad, 2008). IPNS also encompasses balanced fertilization and SSNM. Considerable research on IPNS has been done in India (Rao et al 2002). Moreover, long-term fertilizer experiments have shown that addition of organic manures in addition to NPK (add-on series) results in high yields over a long period of time as compared to a decline in yield over time when only inorganic fertilizers were applied (Swarup 2002). Sarkar and Singh (2002) reported that for soybean-wheat cropping system in the acidic soils of Ranchi (pH < 5.4), soybean yield (averaged over 28 years) was 0.33 Mg ha–1 and wheat yield, 0.43 Mg ha–1 for plots receiving N alone as compared to 1.59 Mg ha–1 in soybean and 2.65 Mg ha–1 in wheat when NPK was applied. Application of FYM with NPK increased the soybean yield to 1.86 Mg ha–1 and that of wheat to 3.19 Mg ha–1. Further, the effects of NPK + FYM were at par with NPK + lime, implying that in acid soils continuous application of FYM can also partially offset soil acidity.
421

Winter School on “Waste recycling and resource management”-Dec. 3-23, 2014
Green manure crops have the intrinsic potential to recycle considerable quantities of organic materials and nutrients. Productivity of rice-wheat cropping could be raised by 1.2 Mg ha–1 with 80 kg N ha–1 (with Sesbania and cowpea GM) applied to rice over 120 kg N ha–1 applied in control plots (Misra and Prasad 2000). Green manures contribute 60–120 kg N ha–1 to the succeeding crop (Sharma et al 1996, Palaniappan et al 1997). Legumes fix 50–500 kg N ha–1 depending upon the crop and its growth period, and leave a residual N varying from 30–70 kg N ha–1 to the succeeding crop (Venkatesh and Ali 2007). Organic manures supply small amounts of micronutrients (Mishra et al 2006) and also improves the soil physical, chemical and biological properties (Misra and Saha 2008, Vineela et al 2008). Biofertilizers [Rhizobium, Azotobacter, Azosprillum, blue green algae (BGA), azolla, phosphate soluibilizing organisms (PSO, PSB, PSF), vescicular arbuscular mycorrhyza (VAM)] can become an important component of IPNS (Swarnalakshmi et al 2006, Tewatia et al 2007) specially under low-land rice cultivation and dryland agriculture, where only low levels of fertilizers are applied. Organisms accelerating the decomposition of crop residues also have a role (Sharma and Prasad 2002).
Conclusion
Now suitable agricultural technologies are available for enhancing the productivity to meet the yield gap between potential yield, on station and on farm yield. In this context, an effective nutrient management has to play key role in the development of site specific nutrient recommendations including balanced NPK doses, timely application of fertilizers using appropriate source, methods at right time and place. In addition to this, development and production of slow-release N fertilizers and indigenous nitrification inhibitors, and developing and practicing an integrated plant nutrient supply system (IPNS) using chemical fertilizers, organic manures, crop residues, and biofertilizers. Nutrient management with preferential application to crop as direct, residual or cumulative effect under different cropping system could be used as one of the strategies to improve nutrient use efficiency. Moreover, integrated nutrient management plays key role in strengthening soil health and sustaining crop productivity which lead to maximal NUE. Along with above strategies on nutrient management, other aspects of soil and crop management including the use of high yielding, nutrient-efficient cultivars, correcting soil physical and chemical problems and water management, disease and pest management (IPM), and post-harvest care and safe storage are important to achieve high nutrient use efficiency.
References
Adhya TK, Pathak H and Chhabra A (2007) N-fertilizers and gaseous- N emission from rice-based cropping systems. In: Agricultural Nitrogen Use and Its Environmental Implications. Abrol, Y.P., Raghuram N., and Sachdev, M.S. (eds). I.K. Pub. House Pvt. Ltd., New Delhi, pp.459–476.
Ali M and Mishra JP (2000) Nutrient management in pulses and pulse based cropping systems.
422

Winter School on “Waste recycling and resource management”-Dec. 3-23, 2014
Fertilizer News 45(4): 57-69.
Anonymous (2007) Weedy rice attacks Asia’s direct-seeded rice. Ripple 2(2): 5.
Balasubramanian V, Alves B, Aulakh MS, Bekunda M, Cai ZC, Drinkwater L, Mugendi D, Van Kessel C and Oenema O (2004) Crop environmental factors affecting N use efficiency. Agriculture and the Nitrogen Cycle: Assessing the Impacts of Fertilizer Use in Food Production and the Environment. Mosier AR, Syers JK and Freney JR (eds). Island Press. Scientific Committee on Problems of the Environment (SCOPE) Series Vol. 65, Paris, France, pp.19–33.
Bhattacharya P (2007) Prospects of organic nutrient resource utilization in India. Indian Journal of Fertilizer 3: 93–107.
Bijai-Singh (2008) Crop demand driven site specific nitrogen applications in rice and wheat: some recent advances. Indian J Agronomy 53: 1–30.
Chang Q, Hu N, Jing N and Huang F (1988) Physiological and biochemical characters of hybrid rice in Dongting Lake region, China. In: Hybrid Rice, International Rice Research Institute, Los Banos, Manila, pp. 279–286.
Dobermann A (2007). IFA International Workshop on Fertilizer Best Management Practices. 7-9 March, Brussels, Belgium
Dwivedi BS, Shanker AK and Singh VK (2003) Annual Report 2002-2003. Project Directorate for Cropping Systems Research (PDCSR), Modipuram.
Economic Survey (2013) Economic Survey 2012-2013, Government of India.
Gupta OP (1984) Scientific Weed Management. Toady and Tomorrow’s Pub., New Delhi.
Halvorson, A.D. and A.L. Black. 1985. Long-term dryland crop responses to residual phosphorus fertilizers. Soil Sci. Soc. Am. J. 49: 928-933.
Hong N, Scharf PC, Davis JG, Kitchen NR and Sudduth KA (2007). Journal of Environmental Quality 36: 354- 362.
Kumar N and Prasad R (2004) Nitrogen uptake and apparent N recovery by a high yielding variety and a hybrid of rice as influenced by levels and sources of nitrogen. Fertiliser News 49(5): 65–67.
Kumar N, Prasad R and Zaman FU (2007) Relative response of high yielding variety and a hybrid of rice to levels and sources of nitrogen. Proc. Indian Natl. Sci. Acad., 73: 1–6.
Mahapatra IC and Pattanayak SK (2008) Acid soils and their management – A case study with paper mill sludge. NAAS News 8(4): 6–7.
423

Winter School on “Waste recycling and resource management”-Dec. 3-23, 2014
Majumdar Kaushik, Johnston AM, Dutt Sudarshan, Satyanarayana T and Roberts TL (2013)
Fertilizer best management practices concept, global perspectives and application. Indian Journal of Fertilizer 9 (4) : 14-31.
Meena SL, Singh S and Shivay YS (2002) Response of hybrid rice (Oryza sativa) to nitrogen and potassium application. Indian J Agronomy 47: 207–211.
Mehla RS, Verma JK, Gupta RK and Hobbs PR (2000) Stagnation in the productivity of wheat in the IndoGangetic plains: zero-till-seed-cum-fertilizer drill as an integrated solution. Rice-wheat Consortium Paper Series 8, Rice-Wheat Consortium for the Indo-Gangetic Plains, New Delhi, 12p.
Milkha S. Aulakh & Ashok K. Garg (2007) Yields and nutrient use-efficiency in groundnut-sunflower -cropping system in Punjab, India, Journal of Sustainable Agriculture, 31:1, 89-110, DOI: 10.1300/J064v31n01_09.
Mishra BN, Prasad R, Gangaiah B and Shivakumar BG (2006) Organic manures for increased productivity and sustained supply of micro nutrients Zn and Cu in a rice-wheat cropping system. J Sustainable Agriculture 28: 55–66.
Misra BN and Prasad R (2000) Integrated nutrient management for sustained production in a rice-wheat cropping system. Acta Agronomica Hungarica 48:257–262.
Nambiar KKM (1994) Soil Fertility and Crop Productivity under Long Term Fertilizer Use, Indian Council of Agricultural Research, New Delhi, 144p.
Nayak BC, Dalei BB and Choudhury BK (2003) Response of hybrid rice (Oryza sativa) to date of planting, spacing and seedling rate during wet season. Indian J Agronomy 48: 172–174.
Pathak H and Ladha JK (2007) Improving nitrogen Use efficiency: strategies, tools,management and policy options. In: Agricultural Nitrogen Use and Its Environmental Implications. Abrol, Y.P., Raghuraman, N., and Sachdev, M.S. (eds). I.K. Int. Pub. House, New Delhi, pp. 279–302.
Pathak H, Bhatia A, Jain N, Mohanty S and Chandrasekharan S (2008) Nitrogen, phosphorus and potassium budgets in Indian Agriculture. In Indian Science Congress, Andhra University, Visakhapatnam, 3-7 January, 2008, 45p.
Prasad R (2005) Rice-wheat cropping systems. Advances in Agronomy 86: 255–339.
Prasad R (2006) Nitrogen uptake pattern as a guide for nitrogen application practices in rice. Indian J Fertiliser 2(6): 39–41.
424

Winter School on “Waste recycling and resource management”-Dec. 3-23, 2014
Prasad R (2012) Fertilizers and manures. Special Section. Current Science 102(6):894-898
(March 2012)
Prasad Rajendra (2009) Efficient fertilizer use: The key to food security and better environment. Journal of Tropical Agriculture 47 (1-2): 1-17.
Rao AS, Chand S and Srivastava S (2002) Opportunities for integrated plant nutrient supply for crops/cropping systems in different agro-ecosystems. Fertiliser News 47(12): 75–90.
Reddy RR and Veeranna G (2008) Rice-zero tillage in maize proved economical in Andhra Pradesh. Indian Farming 58(5): 8–9.
Rekhi, R.S and Meelu, O.P. 1983. Effect of complementary use of mung straw and inorganic fertilizer-N on N availability and yield of rice. Oryza 20: 125-129.
Sharma R (2007) Integrated weed management in wheat and rice crop. Indian Farming 57(8): 29–34.
Sharma SN, Prasad R, Singh P (2000) On-farm trials of the effect of introducing a summer green-manure of mungbean on the productivity of rice wheat cropping system. J Agricultural Science Camb., 134: 169–172.
Sheldrick WF, Syers JK and Lingard J (2002) Nutrient cycling in Agroecosystem 62: 61-72
Siddiq EA (2006) Genetic improvement of rice in perspective. Indian Farming 56(7): 10–16.
Singh G, Singh OP, Kumar V and Kumar T (2008) Effect of methods of establishment and tillage practices on productivity of rice – wheat cropping system in lowlands. Indian J Agriultue Sciences 78: 163–166.
Singh KK, Ali M and Venkatesh MS (2009) Pulses in Cropping Systems. Technical Bulletin, IIPR, Kanpur.
Singh RP (1985) Report of the All India Wheat Improvement Project, Wheat Agronomy 1984-85. Project Directorate for Wheat, New Delhi.
Singh SB and Abrol IP (1988) Long-term effects of gypsum application and rice-wheat cropping on changes in soil properties and crop yield. J Indian Society of Soil Science 36: 316–319.
Singh, A (1972) Conceptual and experimental basis of cropping patterns. In: Proceedings of “Symposium on cropping patterns in India” held at New Delhi, 27-31 January, 1968 , ICAR, New Delhi, pp. 271-274.
Swaminathan MS (2006) Sustainable Agriculture – Towards an Evergreen Revolution. Konark Pub. Pvt. Ltd., New Delhi, 217p.
425

Winter School on “Waste recycling and resource management”-Dec. 3-23, 2014
Swarnalakshmi K, Dhar DW and Singh PK (2006) Blue-green algae: A potential biofertilizer for
sustainable rice cultivation. Proc Indian National Science Academy 72: 167–178.
Swarup A (2002) Lessons from Long term fertilizer experiments in improving fertilizer use efficiency and crop yields. Fertiliser News 47(12): 59–73.
Tewatia RK, Kalve SP and Chaudhary RS (2007) Role of biofertilzers in Indian agriculture. Indian J Fertiliser 3(1): 111–118.
Thanunathan K, Kandasamy S, Vaiyapuri V, Imayavaramban V and Singarvel R (2004) Conjunctive use of N and K through foliage for augmenting the yield of flood affected rice. J Potassium Research 20: 116–117.
Tiwari KN (2007) Reassessing the role of fertilizers in maintaining food, nutrition and environmental security. Indian Journal of Fertilizer 3: 33–50.
Tomar RK, Sahoo RN, Garg RN and Gupta VK (2006) Resource conservation technologies – potential tools for attaining food, nutritional and livelihood security. Indian Farming 56(9): 24–30.
Tripathi SC, Chauhan DS, Sharma RK, Kharub AS, Chhonkar RS and Singh S (2002) Effect of sowing time and temperature on wheat productivity in NWPZ and NEPZ of India. Indian Wheat Newsletter 8(2): 6–7.
Tripathy SK and Mohapatra S (2007) Maximizing direct-sown rice production. Indian Farming 57(2):3–6.
Vineela C, Wani SP, Srinivasarao Ch, Padmaja B and Vittal KPR (2008) Microbial properties of soils as affected by cropping and nutrient management practices in several long-term manual experiments in the semi-acid tropics of India. Applied Soil Ecol. 40: 165-173.
Yadav DS, Shukla RP, Sushant and Kumar B (2005) Effect of zero tillage and nitrogen level on wheat (Triticum aestivum) after rice (Oryza sativa). Indian J Agronomy 50: 52–53.
Yadav RL (1996) Cropping Systems. In: 50 Years of crop science research in India. (Eds. R.S.Paroda and K.L.Chadha ), ICAR, New Delhi. Pp. 117-128.
Yadav RL and Prasad K (1997) Identifications of predominant cropping systems in different districts of India. Annual Report, Project Directorate of Cropping Systems Research, Modipuram. Pp 30-49.
426

Winter School on “Waste recycling and resource management”-Dec. 3-23, 2014
Phytoremediation of heavy metals from polluted soil
S. Ramana
Indian Institute of Soil Science, Nabibagh, Berasia Road, Bhopal-462038 ( M.P.)
Large areas of agricultural soils are contaminated by heavy metals that mainly originate from mining activities, industrial emissions or the application of sewage sludge. Excessive metals in human nutrition can be toxic and cause acute and chronic diseases such as gastrointestinal and respiratory damage and heart, brain, and kidney damage. The traditional methods used currently for cleaning the contaminated soils are: excavation and moving vast areas of contaminated soil, dilution by deep ploughing and mixing the contaminated soil with non contaminated soil, soil mixing, soil washing, electrolytic extraction, chemical leaching, immobilization, precipitation and burying contaminants. Recently, phytoremediation has emerged as an alternative to the engineering methods. The generic term phytoremediation consists of the Greek prefix phyto (plant) attached to the Latin root remediation (to correct or remove an evil).The term phytoremediation was coined by Ilya Raskin. Phytoremediation is actually a genneric term for several ways in which plants can be used to clean up contaminated soils and water. Clean up is defined as the destruction, inactivation or immobilization of the pollutants in a harmless form. Plants may break down or degrade organic pollutants, or remove and stabilize metal contaminants. It is also called as “Green remediation” and “Botanical bioremediation”. It involves the use of living green plants for in situ risk reduction and/or removal of contaminants from contaminated soil, water, sediments, and air. Phytoremediation involves two major processes i.e., phytodecontamination and phytostabilization. The choice of which of these alternatives techniques should be implemented at a site is not solely a matter of economics, for they have different constraints and applications and are sensitive to different site parameters such as concentration of the contaminant, soil chemistry, contamination depth or the time frame required for remediation. If an immediate reduction in risk are required phytostabilisation would be chosen because of the length required for plants to remove the contaminant for extraction . However, as sites where decontamination is desired and feasible, phytoextraction is more appropriate technique despite the higher cost.
Phytodecontamination
It is a subset of phytoremediation in which the concentration of the contaminants of concern in the soil is reduced to an acceptable level through the action of plants, their associated microflora and agronomic practices. The process of phytodecontamination is achieved by phytoextraction, phytodegradation, rhizofilteration, phytovolatilization, and rhizo (sphere) degradation.
427

Winter School on “Waste recycling and resource management”-Dec. 3-23, 2014
Phytoextraction (Phytoaccumulation) It is the name given to the process where plant roots take up the metal contaminant from the soil and translocate them to their above ground plant tissues. Once the plants have grown and absorbed the metal pollutants, they are harvested and disposed off safely. This process is repeated several times to reduce contamination to acceptable levels. In some cases it is possible to recycle the metals through a process known as phytomining, though this is usually reserved for use with precious metals. Metal compounds that have been successfully phytoextracted include zinc, copper, and nickel, but there is promising research being completed on lead and chromium absorbing plants. Hyperaccumulator plant species (species which absorb higher amounts of pollutants than most other species) are used on many sites due to their tolerance of relatively extreme levels of pollution.
Nickel is removed from soil by moving up into plant roots, stems, and leaves. The plant is then harvested and disposed of and the site replanted until the nickel in the soil is lowered to acceptable levels
There are several methods of contaminated crop disposal after phytoextraction process. They are: composting, compaction, incineration, ashing,pyrolysis, direct disposal, liquid extraction. Among them, incineration (smelting) is proposed as the most feasible, economically acceptable
428

Winter School on “Waste recycling and resource management”-Dec. 3-23, 2014
and environmentally sound.Phytoextraction offers an efficient, cost-effective, and environmentally friendly way to clean up heavy metal contamination. Plants are grown in situ on contaminated soil and harvested after toxic metals accumulate in the plant tissues. The degree of accumulation varies with several factors, but can be as high as 2 percent of the plants' aboveground dry weight, leaving clean soil in place that meets or exceeds regulatory cleanup levels.
Response of plants to heavy metals
Baker (1981) proposed three basic types of plants depending upon the response of plants to heavy metals. They are (1)Excluders (2)Indicators and (3)Accumulators.
Excluders: These plants have low uptake of the metal at quite high external metal concentrations. They have some kind of barrier to avoid uptake, but when metal concentration becomes too high these barrier losses it’s function probably due to toxic action by the metal and the uptake massively increases.
Accumulators: These plants have high concentrations of metals at very low external metal concentrations. These plants have certain detoxification mechanisms within the tissue which allow the plant to accumulate such high amounts of metals. At high external concentrations however, these plants don’t increase their uptake probably due to competition between metal ions at the site of uptake.
Indicators: These plants have a tissue concentration reflecting the external metal concentration, increasing the uptake linearly with increasing metal concentrations in the external medium.
429
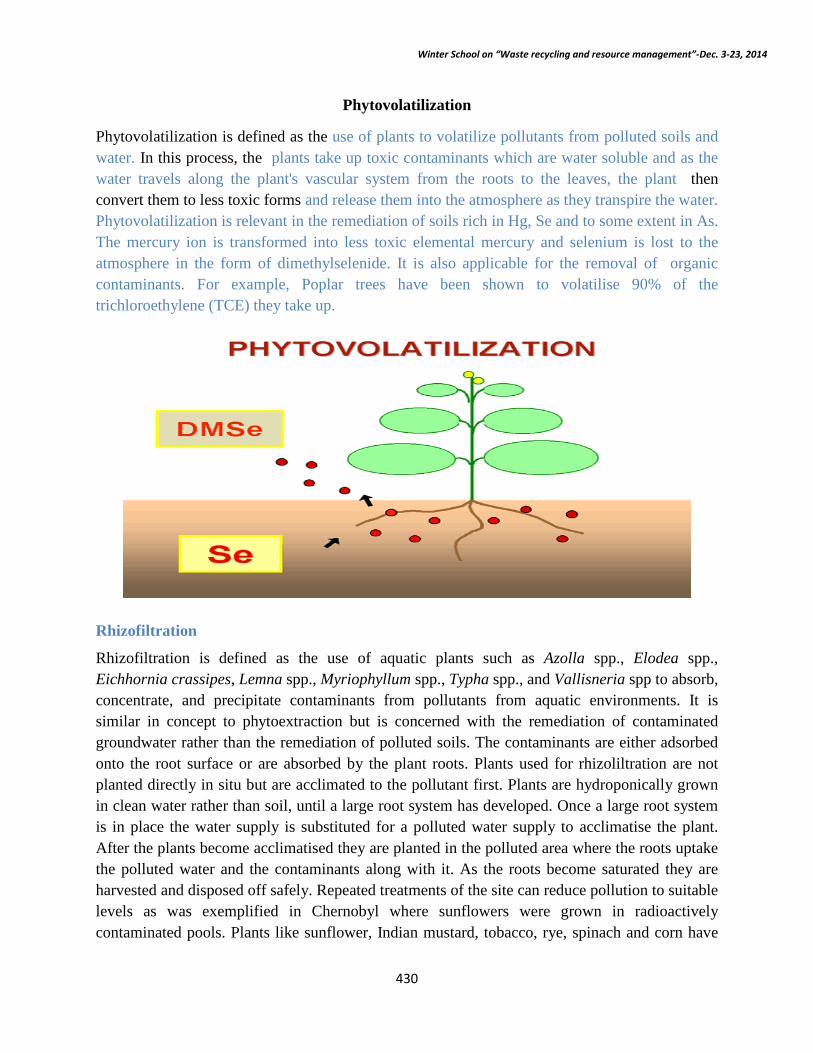
Winter School on “Waste recycling and resource management”-Dec. 3-23, 2014
Phytovolatilization
Phytovolatilization is defined as the use of plants to volatilize pollutants from polluted soils and water. In this process, the plants take up toxic contaminants which are water soluble and as the water travels along the plant's vascular system from the roots to the leaves, the plant then convert them to less toxic forms and release them into the atmosphere as they transpire the water. Phytovolatilization is relevant in the remediation of soils rich in Hg, Se and to some extent in As. The mercury ion is transformed into less toxic elemental mercury and selenium is lost to the atmosphere in the form of dimethylselenide. It is also applicable for the removal of organic contaminants. For example, Poplar trees have been shown to volatilise 90% of the trichloroethylene (TCE) they take up.
Rhizofiltration
Rhizofiltration is defined as the use of aquatic plants such as Azolla spp., Elodea spp., Eichhornia crassipes, Lemna spp., Myriophyllum spp., Typha spp., and Vallisneria spp to absorb, concentrate, and precipitate contaminants from pollutants from aquatic environments. It is similar in concept to phytoextraction but is concerned with the remediation of contaminated groundwater rather than the remediation of polluted soils. The contaminants are either adsorbed onto the root surface or are absorbed by the plant roots. Plants used for rhizoliltration are not planted directly in situ but are acclimated to the pollutant first. Plants are hydroponically grown in clean water rather than soil, until a large root system has developed. Once a large root system is in place the water supply is substituted for a polluted water supply to acclimatise the plant. After the plants become acclimatised they are planted in the polluted area where the roots uptake the polluted water and the contaminants along with it. As the roots become saturated they are harvested and disposed off safely. Repeated treatments of the site can reduce pollution to suitable levels as was exemplified in Chernobyl where sunflowers were grown in radioactively contaminated pools. Plants like sunflower, Indian mustard, tobacco, rye, spinach and corn have
430

Winter School on “Waste recycling and resource management”-Dec. 3-23, 2014
been studied for their ability to remove lead from effluent, with sunflower having the greatest ability. Indian mustard has proven to be effective in removing a wide concentration range of lead (4 – 500 mg/l). The technology has been tested in the field with uranium (U) contaminated water at concentrations of 21-874 μg/l; the treated U concentration reported by Dushenkov was < 20 μg/l before discharge into the environment .
Flow-through rhizofiltration system. The system contains 8-12 week-old sunflower plants with roots immersed in flowing contaminated water
Phytostabilisation
Phytostabilisation is the process in which plants are used to immobilise soil and water contaminants. Unlike phytoextraction, phytostabilization mainly focuses on sequestering pollutants in soil near the roots but not in plant tissues. Pollutants become less bioavailable and livestock, wildlife, and human exposure is reduced. The contaminants are absorbed and accumulated by roots, adsorbed onto the roots, or precipitated in the rhizosphere. This reduces or even prevents the mobility of the contaminants preventing migration into the groundwater or air, and also reduces the bioavailibility of the contaminant thus preventing spread through the food chain. This technique can also be used to re-establish a plant community on sites that have been denuded due to the high levels of metal contamination. Once a community of tolerant species has been established the potential for wind erosion (and thus spread of the pollutant) is reduced and leaching of the soil contaminants is also reduced. Phytostabilization involves three processes which include: humification, lignification and irreversible binding.
431

Winter School on “Waste recycling and resource management”-Dec. 3-23, 2014
Humification: In humification, the contaminants are incorporated into soil humus resulting in lower bioavailability.
Lignification: The toxic components become irreversibly trapped in plant cell wall constituents.
Irreversible binding: The compounds become increasingly unavailable due to binding into soil.
Advantages of phytoremediation compared to classical remediation • It is more economically viable using the same tools and supplies as agriculture • It is less disruptive to the environment and does not involve waiting for new plant communities
to recolonise the site • Disposal sites are not needed • It is more likely to be accepted by the public as it is more aesthetically pleasing than traditional
methods • It avoids excavation and transport of polluted media thus reducing the risk of spreading the
contamination • It has the potential to treat sites polluted with more than one type of pollutant Disadvantages of phytoremediation compared to classical remediation • It is dependant on the growing conditions required by the plant (i.e., climate, geology, altitude,
temperature) • Large scale operations require access to agricultural equipment and knowledge • Success is dependant on the tolerance of the plant to the pollutant • Contaminants collected in senescing tissues may be released back into the environment in
autumn • Contaminants may be collected in woody tissues used as fuel • Time taken to remediate sites far exceeds that of other technologies Contaminant solubility may be increased leading to greater environmental damage and the possibility of leaching.
432

Winter School on “Waste recycling and resource management”-Dec. 3-23, 2014
Impact of Industrial Waste and City Waste on Soil Quality
M. Vassanda Coumar
Indian Institute of Soil Science, Nabibagh, Berasia Road, Bhopal-462038 ( M.P.)
With increase in human population especially urban population and industrial growth, waste
generation in the developing countries like India is increased considerably. Waste is defined as
any material that is not useful and does not represent any economic value in the present form.
The per capita waste generation rate in India has increased from 0.44 kg/day in 2001 to 0.5
kg/day in 2011. India is the second largest nation in the world, with a population of 1.21 billion,
accounting for nearly 18% of world’s human population (Census, 2011), but it does not have
enough resources or adequate systems in place to treat its waste generated from industries,
municipal (urban) and agriculture system . In India, typical waste management includes waste
generation and storage; characterization; waste segregation, reuse, and recycling at the household
level; waste minimization; and treatment and monitoring of waste. However, the current waste
management services are inefficient, and may cause potential threat to the public health and
environmental quality (Biswas et al., 2010). Improper waste management deteriorates public
health, causes environmental pollution, accelerates natural resources degradation including soil,
water and vegetation, causes climate change and greatly impacts the quality of life of human.
Therefore, this chapter address the issue of waste generation in India from city (urban) and
industries and its impact on environment particularly soil health.
Classification of Waste
1. Industrial Waste
a. Solid waste- Bagasse, pressmud, brine mud, metallurgical slags, gypsum, fly ash,
paper and pulp wastes, synthetic fibres.
b. Liquid waste- Waste oil and oil emulsions, effluent dyes, slurries and spent washes,
whey from dairy plants, alcohol distillery wastes, molasses, miscellaneous dissolved
organics.
433

Winter School on “Waste recycling and resource management”-Dec. 3-23, 2014
2. Urban Waste
a. Municipal Solid Waste- Paper, glass, metals, synthetic polymers (cables, wires, toys
and plastic goods etc), inerts (stones, sand and pebbles etc), hides and leather discards,
pharmaceuticals wastes (tablets, ointments, lotion etc), rags and sanitary wares, kitchen
wastes-(fruit and vegetable peels, raw and processed food ingredients etc).
b. Sewage waste- Bulk excretory matters (feces and urine), body wastes (sweat, oil,
nails, dead tissue, saliva, tears and hairs etc), bath wastes, laundry wastes (detergent and
soap precipitates).
c. Fecal Sludge- sludge removed from all kind of on-site sanitation systems such as
septic tanks (settled solids, scum and liquid), bucket latrines, pit latrines etc.
3. Other Waste
a. Biomass waste- Crop debris (stalks, straws, cobs, husks, cakes, shells, pods etc.),
livestock wastes (cattle, pig, poultry and sheep waste etc.), bulk forest wastes (wood,
stubbles and humus), alternative forest wastes (leaf litters, dead seeds and spores etc.).
b. Biomedical waste- Human anatomical wastes, animal waste from veteneraries,
laboratory reagents, discarded medicines and toxic drugs.
1. Industrial Waste classification
In general industrial waste is classified as hazardous and non-hazardous waste. These waste
materials may be in solid, liquid and gaseous form which may cause treat to surrounding
environment and ultimately human health. In general 10 to 15% of the waste generated by the
industries is hazardous in nature which is increasing rapidly over the years. Hazardous waste in
particular includes products that are explosive, flammable, irritant, harmful, toxic, carcinogenic,
corrosive, infectious, or toxic to reproduction. Depending upon the type of industries, the nature
of hazardous materials varies and it is shown in the table 1. Similarly, non-hazardous waste
materials are also generated by industries which are similar in nature and composition of
household waste (paper, cardboard, wood, packaging material and textiles). These waste
materials (both hazardous nad non hazardous material) has to be treated properly and disposed
off safely without affecting the environment. The potential options available for treatment of
such waste are shown in the table 2.
434

Winter School on “Waste recycling and resource management”-Dec. 3-23, 2014
Table1: Nature of hazardous material and their source of generation.
Sources Hazardous material Mining, Smelters and Metal refining Industries Arsenic, Cadmium, Chromium, Manganese,
Copper, Nickel, Lead Alkali Industries Mercury Tannery Industries Chromium Fertilizer Industries Cadmium Petrochemical Industries Benzene Plastic Industries Vinyl Chloride Pesticide Industries Organic pollutants
Table 2: Treatment options for waste generated from different industries.
Industries Waste generated Options for treatment
Uses
Tanneries Hides and skins Acid treatments and biomethanation
Biogas production
Paper mills Paper shavings/Wood waste/ Paper boards
Combustion Heat and power
Paper pulp Acid treatments and biomethanation
Biogas production
Sugar Mills Pressmud Composting Fertilizer Sugar molasses Fermentation Ethanol synthesis Sugar bagasses Combustion and
Gasification Heat and Power
Sago factories Starch materials and peels
Biomethanation Biogas production
Dairy Plants Whey and Milk cream Fruits and vegetable processing units
Pulp wastes
Animal Husbandries Slaughter Houses
Animal excreta and body fluids Organs, Tissues, Blood, Hides, Animal excreta and Carcass etc
2. Urban Waste
The proliferation of urban waste has direct impacts on sanitation in India. With crowded cities
and significant poverty, millions of people in Indian cities are directly exposed to the harmful
effects of all urban waste, especially from fecal and sewage sludge from rivers and lakes.
435

Winter School on “Waste recycling and resource management”-Dec. 3-23, 2014
Municipal Solid Waste
Municipal Solid Waste (MSW) is more commonly known as trash or garbage. MSW includes
commercial and residential wastes generated in municipal or notified areas in either solid or
semi-solid form excluding industrial hazardous wastes but including treated bio-medical
wastes. There are many categories of MSW such as food waste, rubbish, commercial waste,
institutional waste, street sweeping waste, industrial waste, construction and demolition waste,
and sanitation waste. MSW contains recyclables (paper, plastic, glass, metals, etc.), toxic
substances (paints, pesticides, used batteries, medicines), compostable organic matter (fruit and
vegetable peels, food waste) and soiled waste (blood stained cotton, sanitary napkins, disposable
syringes) (Jha et al., 2003; Reddy and Galab,1998). With increasing urbanization and changing
life styles, Indian cities now generate eight times more MSW than they did in 1947. As per
estimates more than 55 million tons of MSW is generated in India per year; the yearly increase is
estimated to be about 5%. It is estimated that solid waste generated in small, medium and large
cities and towns in India is about 0.1 kg, 0.3 – 0.4 kg and 0.5 kg per capita per day respectively.
The estimated annual increase in per capita waste generation is about 1-1.33 % per year (Pappu
et al., 2007; Bhide and Shekdar, 1998; CPCB, 2004)
Sewage and Sewage Sludge
Sewage is defined as untreated municipal liquid waste requiring treatment in a sewage treatment
plant. Sewage contains about 99.9% of water, while the remaining content may be organic or
inorganic. Sewage denotes both black water and grey water at the household level, where black
water refers to waste water generated in toilets and grey water to the waste water generated in
kitchen, bathroom and laundry. The estimated sewage generation from Class-I cities and Class-II
towns together is 38,254 MLD, out of which only 11,787 MLD (31%) is being treated with a
capacity gap of 26,467 MLD (69% of total generation). The quantity of SW varies between 100 -
300 l/capita/day which depend on standard of living, climate and season. (CPCB, 2004)
Sewage sludge is the semi-solid precipitate produced in wastewater treatment plants. Such
sludge can also occur in untreated sewage disposed off into lakes and other water bodies.
Sewage sludge generation in India is increasing at a faster rate as more and more sewage
436

Winter School on “Waste recycling and resource management”-Dec. 3-23, 2014
treatment plants (STP) are being developed. Sewage sludge and effluents from these STPs are
frequently disposed off on agricultural lands for irrigation/manure purposes.
Fecal Sludge
Sludge of variable consistency collected from so-called on-site sanitation systems, such as
latrines, non-sewered public toilets, septic tanks and aqua privies is denoted as fecal sludge. The
fecal sludge comprises varying concentrations of settleable or settled solids as well as of other,
non-fecal matter. According to EAI estimates, about 0.12 million tons of fecal sludge is
generated in India per day.
Impact of Solid Waste on Soil Health
Worldwide large amount of waste materials are produced annually and its safe disposal is great
concern among the scientific community, environmentalists and policy makers. With increase in
population growth, urbanization and industrialization, the food demand has increased
exponentially which results in added pressure on production system and the waste gets
accumulated. Generally wastes such as farm waste, city waste (sewage and sludge), animal waste
and industrial wastes (food, sugar, cotton and rice industry) are recycled back to agricultural
land. However, still a considerable amount of wastes is still disposed through other means such
as burning/dumping/landfills which is associated with environmental problems such as emission
of particulates, heavy metals (e.g. Hg, Cd, and Pb), acidic gases (e.g. hydrogen chloride and
sulfur dioxide) and dioxin to the atmosphere.
Regular additions of organic materials such as sugar industry wastes including pressmud,
municipal biosolids, slag, animal manures and crop residues are of utmost importance in
maintaining the tillth, fertility and productivity of agricultural soils (Solaimalai et al., 2001).
Therefore recycling organic wastes by applying onto agricultural land seems to be the only best
option in such scenario, but at the same time necessary precautions has to be considered so that
the soil health is not affected (Ghulam et al., 2012; Cameron et al., 1997).
Impact of municipal solid waste on soil health
Agricultural application of Municipal Solid Waste (MSW), as nutrient source for plants and as
soil conditioner, is the most cost effective option of MSW management because of its advantages
437

Winter School on “Waste recycling and resource management”-Dec. 3-23, 2014
over traditional means such as landfilling or incineration. MSW compost could also mitigate the
deficiencies of boron, zinc and copper in the soils cropped for many years. Further, other benefits
include improved soil physical characteristics such as increased water-holding capacity,
improved chemical characteristics such as nutrient retention capacity, and stimulation of
microbial activity that can improve plant growth and decrease the leaching of pollutants into
ground water. However, agricultural application of MSW can also lead to a potential
environmental threat due to the presence of pathogens and toxic pollutants. Although it is
generally argued that the levels of heavy metals and other particulate matter in municipal wastes
are low, long term dumping of untreated municipal wastes and increasing toxicity of urban
refuse due to rapid industrialization make the use of municipal wastes potentially hazardous.
Chang et al. (1983) and Giusquiani et al. (1995) found that bulk density was reduced by
municipal sludge compost and urban waste compost respectively. Zebarth et al. (1999) applied
six different organic amendments including biosolids and food waste compost and found that all
the materials reduced bulk density. A decrease in bulk density might be expected when soil is
mixed with less dense organic material, but there may also be associated changes in soil
structure. The magnitude of change for bulk density and other soil properties is likely to differ
with soil texture as noted by Aggelides and Londra (2000). Baziramakenga et al. (2001), Chang
et al. (1983), Giusquiani et al. (1995) and Hernando et al. (1989) have all found increased soil
water holding capacity after application of urban wastes. Chang et al. (1983) also noted
increased hydraulic conductivity after application of MSW. Urban waste compost has also been
shown to increase total porosity (Aggelides and Londra 2000, Giusquiani et al., 1995, Pagliai et
al., 1981).
Studies conducted by Clemente and Bernal (2006) and Salt et al. (1995) also revealed that when
the compost from MSW is used as manure some heavy metals are being subject to
bioaccumulation in soil and plant and may cause risk to human health when transferred to the
food chain. Information on the effect of trace elements in MSW composts on soil organisms such
as invertebrates (e.g., earthworms) and microorganisms (e.g., nitrogen-fixing bacteria) is very
limited. It has been reported that when sewage sludge is applied to land, the concentration of
some trace metals (e.g., cadmium) in earthworms is increased, but this increase does not pose a
significant risk to the worms (Woodbury, 1992). Smith et al. (1996) reported that continuous
438

Winter School on “Waste recycling and resource management”-Dec. 3-23, 2014
disposal of municipal wastes in soil may increase heavy metal concentration in soil which will
ultimately affect crop and human health.
Anikwe and Nwobodo (2002) observed that heavy metals (Pb, Cu, Fe and Zn) were increased by
214% and 2040% in dump site soils relative to non-dump site soil. This may lead to increased
uptake of metals by some test crops depending upon the transfer ratios from crop to crop.
Shiralipour et al. (1992) reviewed the effects of municipal solid waste compost on soil properties
and concluded that municipal solid waste compost could induce salinity damage. Bevacqua and
Mellano (1994) also reported municipal compost causing salinity problems that could threaten
the production of sensitive horticultural crops.
Impact of pressmud on soil health
Pressmud is a soft, spongy, amorphous and dark brown material containing sugar, fiber and
coagulated colloids including cane wax, albuminoids, inorganic salts and soil particles. It
consists of 80 % water and 0.9 -1.5 % sugar, organic matter, nitrogen, phosphorus, potassium,
calcium, sulphur, coagulated colloids and other materials in varying amounts. Pressmud from
sugar mill is an enriched source of organic matter and contains substantial quantities of nutrients
for improving physical conditions and improvement of soil fertility (Ibrahim et al., 1993; Gupta
etal., 1987; Nisar, 2000).
Pressmud like other organic materials affects the physical, chemical and biological properties of
soil (Lamberton et al., 1960). Haider et al. (1976) reported significant decrease in SAR and
increase in the infiltration rate and yield of wheat, cotton, sorghum, maize, alfalfa and clover
with the application of pressmud. Milapchand et al. (1980) reported that pressmud increased the
extractable zinc in soils and helped to retain the applied zinc in the available form. Application
of pressmud along with gypsum in a sodic soil decreased the soil pH from 9.5 to 8.3 (Haq et al.,
2001).
Ghulam et al., 2010 found that the addition of pressmud increased the available P, S, K, Fe, Mn,
Zn and Cu content in soil in addition to increase in total porosity of soil. On the other hand, there
was small increase in ECe , and small decrease in bulk density and pH of the soil as a result of
increasing levels of pressmud application. It was concluded from the study that the application of
pressmud @ 15 to 20 t ha-1 would be the most suitable dose for improving the physico-chemical
properties of calcareous soil.
439

Winter School on “Waste recycling and resource management”-Dec. 3-23, 2014
Reddy (2002) reported that the pressmud is a potential source of major minerals (Ca-2.40 %, P-
1.27 %, K-1.81 %, Mg-1.28 %, S-2.62 %) as well as trace elements (Cu-22.6 ppm, Fe-2042.0
ppm, Zn-36.5 ppm, Mn-228.0 ppm). Razzaq (2001) also reported that substituting chemical
fertilizers with sugarcane filter cake in crop production will add sulfur and boost up O. M. status
of soil to satisfactory level within 5-6 years and improve and maintain soil health.
Therefore, the advantages of using sugarcane pressmud for soil application is its low cost, slower
release of nutrients, presence of trace element, high water holding capacity and mulching
properties (Shankaranand., et al., 1993 ). On the other hand, the disadvantages of using pressmud
are bulky in nature and its wax content might deteriorate the physical properties of soil such as
aeration, structure and permeability.
Impact of Fly ash on soil health
Flyash is the major solid waste produced in thermal power stations. Fly-ash is the end residue
from combustion of pulverized bituminous or sub-bituminus coal (lignite) in the furnace of
thermal power plants and consists of mineral constituents of coal which is not fully burnt. The
quantity of flyash produced annually by the 70 thermal power plants in the country is estimated
to be 50-60 million tons. In the absence of a well-planned strategy in India for the disposal of
this flyash, it is posing serious health and ecological hazards (Kanojia et al. 2001).
Flyash contains plant nutrients and can be used for crop production (Arvind Kumar et al. 1999).
Fly-ash has great potentiality in agriculture due to its efficacy in modification of soil health and
crop performance. The high concentration of elements (K, Na, Zn, Ca, Mg and Fe) in fly-ash
increases the yield of many agricultural crops.Application of high rates of fly-ash can change the
surface texture of soils, usually by increasing the silt content (Jones and Amos, 1976). Fly-ash
additionat 70 t ha_1 has been reported to alter the texture of sandy and clayey soil to
loamy(Capp, 1978). According to Prabakar et al. (2004), addition of fly-ash up to 46% reduced
the dry density of the soil in the order of 15–20% due to the low specific gravity and unit weight
of soil. Fly-ash application to sandy soil could permanently alter soil texture, increase
microporosity and improve the water-holding capacity (Ghodrati et al., 1995) as it is mainly
comprised of silt-sized particles. Fly-ash generally decreased the bulk density of soils leading to
improved soil porosity, workability and enhanced water-retention capacity (Page et al., 1975)
440

Winter School on “Waste recycling and resource management”-Dec. 3-23, 2014
Depending on the source, fly-ash can be acidic or alkaline, which could be useful to buffer the
soil pH (Elseewi et al., 1978; 1978b). The hydroxide and carbonate salts give fly-ash one of its
principal beneficial chemical characteristics, the ability to neutralize acidity in soils (Pathan et
al., 2003). Fly-ash has been shown to act as a liming material to neutralize soil acidity and
provide plant-available nutrients (Taylor and Schumann, 1988). Most of the fly-ash produced in
India is alkaline in nature; hence, its application to agricultural soils could increase the soil pH
and thereby neutralize acidic soils. On the other hand, the use of excessive quantity of fly-ash to
alter pH can increase the soil salinity especially with unweathered fly-ash (Sharma et al., 1989).
Application of unweathered fly-ash particularly to sandy soil greatly inhibited the microbial
respiration, enzymatic activity and soil N cycling processes like nitrification and N
mineralization (Wong and Wong, 1986; Pitchel, 1990). These adverse effects were partly due to
the presence of excessive levels of soluble salts and trace elements in unweathered fly-ash.
However, the concentration of soluble salts and other trace elements was found to decrease due
to weathering of fly-ash during natural leaching, thereby reducing the detrimental effects over
time. Further, application of unweathered fly-ash may have a tendency of accumulating elements
such as B, Mo, Se and Al, which at toxic levels are responsible for reductions in the crop yields
and consequently influence animal and human health (Sharma and Kalra, 2006). Fly-ash
application might also decrease the uptake of heavy metals including Cd, Cu, Cr, Fe, Mn and Zn
in plant tissues, which could be probably due to the increased pH of fly-ash amended soil.
Impact of sewage sludge on soil health
Most wastewater treatment processes produce a sludge which has to be disposed of.
Conventional secondary sewage treatment plants typically generate a primary sludge in the
primary sedimentation stage of treatment and a secondary, biological, sludge in final
sedimentation after the biological process. The characteristics of the secondary sludge vary with
the type of biological process and, often, it is mixed with primary sludge before treatment and
disposal. Sewage sludge contains significant amount of nitrogen, phosphorus and organic matter
and therefore used in agronomic crop production primarily as a nitrogen (N) fertilizer source,
and managed to meet crop N needs.
Abd-Alla et al., 1999 investigated the effect of sewage sludge application to a desert soil on
nodulation, nitrogen fixation and plant growth. Plant analysis indicated that the inhibitory effect
441

Winter School on “Waste recycling and resource management”-Dec. 3-23, 2014
of sewage sludge at high application rates was most probably due to a toxic effect of heavy
metals on the micro symbiont rather than on host plants. It is concluded that sewage sludge at
low application rates may significantly improve legume growth in desert soils (Abd-Alla et
al.1999).
In addition to organic waste material, sewage sludge also contain traces of many pollutants that
can be phytotoxic and toxic to humans and/or animals so it is necessary to control the
concentrations in the soil of potentially toxic elements and their rate of application to the soil.
However, it has also been shown that sewage sludge application at re- commended rates
increased microbial activity in soil and tied up the heavy metals making them unavailable to
plant and soil (Sastre et al., 1996).
Sewage sludge also contains pathogenic bacteria, viruses and protozoa along with other parasitic
helminths which can give rise to potential hazards to the health of humans, animals and plants.
Research carried out by Carlton-Smith (1987) has shown that the amounts of Cd, Ni, Cu, Zn and
Pb applied in liquid sludge at three experimental sites could be accounted for by soil profile
analyses five years after sludge applications, with the exception of Cu and Zn applied to a
calcareous loam soil. Increases in metal concentrations (Cd, Ni, Cu and Zn) in the soil due to
sludge applications and increases in concentrations in the edible portion of most of the crops
grown: wheat, potato, lettuce, red beet, cabbage and ryegrass were observed.
Waste Management
In India, typical waste management includes waste generation and storage; characterization;
waste segregation, reuse, and recycling at the household level; waste minimization; and
treatment and monitoring of waste. However the basic principle in waste management is reduce,
recycle and reuse.
Landfills
The most relatively inexpensive method of waste disposal is dumping of solid waste on land
which is called as landfills. In many metropolitan cities, open, uncontrolled and poorly managed
dumping is commonly practiced, giving rise to serious environmental degradation. More
than90% of MSW in cities and towns are directly disposed of on land in an unsatisfactory
manner. In general the landfills are the area which is relatively unused/abandoned lands like
442

Winter School on “Waste recycling and resource management”-Dec. 3-23, 2014
borrow pits, mining voids and quarries and it has been practiced globally. The main problem in
waste disposal through landfills is the degradation of the surrounding environment. The potential
environmental threat from landfills is the release of pollutant gas mostly methane and CO2 from
the dumped organic waste material through unaerobic decomposition. Further, the leachate
containing nitrate, some organic pollutants and also heavy metals from the solid waste percolates
through soil profile during rainy season. Under long term scenario, the leachates containing
pollutants will ultimately results in contamination of soil, nearby surface water bodies and
ground water. Therefore proper design of landfills is utmost importance to avoid environmental
degradation. Several measures like lining of landfills which will restrict the pollutant reaching
the ground water, compaction of waste to reduce mice/rat menace and collection and storage of
gas for electricity/heat/steam generation (Waste to energy).
Incineration
Incineration is a method of solid disposal where the waste material is combusted and converted
to gaseous products, steam and residue (ash). This process reduces the volumes of solid waste to
20 to 30 percent of the original volume. Incineration and other high temperature waste treatment
systems are sometimes described as thermal treatment. Similar to landfills, this process of
combustion also results in emissions of gaseous pollutants which could be utilized for energy
generation. Compared to landfills, incineration is carried out where sufficient amount of land is
not available because the former requires huge land area for disposal. Combustion in an
incinerator is not always perfect and there have been concerns about pollutants in gaseous
emissions from incinerator stacks. Particular concern has focused on some very persistent
organic compounds such as dioxins, furans, and PAHs, which may be created and which may
have serious environmental consequences.
Recycling
Recycling is a process of recovery mechanism where the waste material has been transformed to
useful new products. But for recycling of solid waste material it requires proper source
separation, handling and storage. Organic materials such as plant material, food material, and
paper products can be recycled through composting processes. During composting process the
organic materials is decomposed and the volume reduced to 50 – 80%. The resultant organic
443

Winter School on “Waste recycling and resource management”-Dec. 3-23, 2014
material is then used as compost for agricultural, plantation or landscaping purposes (Bhide and
Shekdar, 1998; Chakrabarty et al., 1995). In addition, waste to energy process is the conversion
of non-recyclable waste materials into usable heat, electricity, or fuel through a variety of
processes like combustion, gasification and pyrolysis. The environmental benefits of waste to
energy, as an alternative to disposing of waste in landfills, are clear and compelling. Waste to
energy generates clean, reliable energy from a renewable fuel source, thus reducing dependence
on fossil fuels, the combustion of which is a major contributor to GHG emissions. Globally,
waste-to-energy accounts for 16% of waste management. Among these process of converting
waste to energy, pyrolysis and gasification process are relatively carried out at high temperature
under limited oxygen condition and high pressure in sealed vessels/container/chamber. Pyrolysis
of solid waste converts the material into solid, liquid and gas products. The liquid and gas can be
burnt to produce energy or refined into other chemical products (chemical refinery). The solid
residue (char) can be further refined into products such as activated carbon. Gasification is used
to convert organic materials directly into a synthetic gas (syngas) composed of carbon monoxide
and hydrogen. The gas is then burnt to produce electricity and steam.
Conclusion
In India huge amount waste is generated yearly from several sectors like urban, industrial,
agricultural and allied sectors. Disposal of waste in a landfill involves burying the waste and this
remains a common practice in India. Incineration is a disposal method in which solid organic
wastes are subjected to combustion so as to convert them into residue and gaseous products.
However both these method leads to environmental pollution which ultimately affecting our soil
and human health. Alternatively, recycling of waste to compost and energy provides a better
option for disposal of such waste. Compost or vermicompost prepared from such waste material
find its use in agricultural and horticulture sector either as mulch or organic manure for crop
production. Moreover, certain industrial waste has been widely used as soil amendments or
organic source in crop production. Therefore recycling organic wastes by applying onto
agricultural land seems to be the best option in such scenario, but at the same time necessary
precautions has to be considered so that the soil health is not affected.
444

Winter School on “Waste recycling and resource management”-Dec. 3-23, 2014
References
1. Abd - Alla, M.H., Yan – Feng and Schubert, S. (1999) Effect of sewage sludge application on nodulation , nitrogen fixation, and plant growth of Faba bean, Soybean and lupin. Angewandte- Botanik, Germany 73(3/4): 69-75.
2. Aggelides, S.M. and Londra, P.A. 2000. Effects of compost produced from town wastes and sewage sludge on the physical properties of a loamy and a clay soil. Bioresource Technology 71: 253-259.
3. Anikwe, M.A.N. and Nwobodo, K.C.A. 2002. Long term effect of municipal waste disposal on soil properties and productivity of sites used for urban agriculture in Abakaliki, Nigeria. Bioresource Technology 83: 241–250.
4. Baziramakenga, R., Simard, R.R. and Lalande, R. 2001. Effect of de-inking paper sludge compost application on soil chemical and biological properties. Canadian Journal of Soil Science 81: 561-575.
5. Bhide, A.D. and Shekdar, A.V. 1998. Solid waste management in Indian urban centers. International Solid Waste Association Times (ISWA) (1): 26–28.
6. Biswas, A.K., Sunil Kumar, Sateesh Babu, S., Bhattacharyya, J.K. and, Tapan Chakrabarti. 2010. Studies on Environmental Quality in and around Municipal Solid Waste Dumpsite. : Resources, Conservation and Recycling, vol. 55.
7. Cameron, K.C., Di, H.J. and McLaren, R.G. 1997. Is soil an appropriate dumping ground for our wastes?. Aust. J. Soil Res. 35: 995-1035.
8. Capp, J.P. 1978. Power plant flyash utilization for land reclamation in the eastern United States. In: Schaller FW, Sutton P, editors. Reclamation of drastically disturbed lands. Madison, WI: ASA. pp.339–53.
9. Census of India, 2011. Census of India. 10. Central Pollution Control Board (CPCB), 2004. Management of Municipal Solid Waste.
Ministry of Environment and Forests, New Delhi, India. 11. Chakrabarty, P., Srivastava, V.K. and Chakrabarti, S.N., 1995. Solid waste disposal and
the environment – a review. Indian Journal Of Environmental Protection 15 (1): 39–43. 12. Chang, A.C., Page, A.L. and Warneke, J.E. 1983. Soil conditioning effect of municipal
sludge compost. Journal of Environmental Engineering 109: 574-583. 13. Clemente, R. and Bernal, M.P. 200). Fractionation of heavy metals and distribution of
organic carbon in two contaminated soils amended with humic acids. Chemosphere 64: 1264–73.
14. Elseewi, A.A., Bingham, F.T. and Page, A.L. 1978. Availability of sulfur in flyash to plants. J Environ Qual 7:69–73.
15. Elseewi, A.A., Bingham, F.T. and Page, A.L. 1978b. Growth and mineral composition of lettuce and Swiss chard grown on flyash amended soils. In: Adriano DC, Brisbin IL, editors. Environmental chemistry and cycling processes, Conf-760429. Springfield, VA: US Department of Commerce pp. 568–81.
16. Ghodrati, M., Sims, J.T. and Vasilas, B.S. 1995. Evaluation of flyash as a soil amendment for the Atlantic coastal plain. I. Soil hydraulic properties and elemental leaching. J Water Soil Air Pollut 81: 349–61.
17. Ghulam, S., Khan, M.J., Usman, K. and Rehman, H.U. 2010. Effect of different rates of pressmud on plant growth and yield of lentil in calcareous soil. Sarhad J. Agric 26(4): 565-570.
445
Winter School on “Waste recycling and resource management”-Dec. 3-23, 2014
18. Ghulam, S., Khan, M.J., Usman, K. and Shakeebullah 2012. Effect of different rates of
pressmud on plant growth and yield of lentil in calcareous soil. Sarhad J. Agric 28(2): 249-252.
19. Giusquiani, P.L., Pagliai, M., Giglotti, G., Buisinelli, D. and Beneti, A. 1995. Urban waste compost: Effects on physical, chemical and biochemical soil properties. Journal of Environmental Quality 24: 175-182.
20. Gupta, A.P., Antial, R.S. and Nath, J. 1987. Chemical composition of press mud from different sugar factories in Harayana. Indian J. Agric. Res.,21: 43–8.
21. Haider G., Hussain, G. and Tabassam, M.S. 1976. Use of press mud on soils irrigated with high SAR waters. Mona Rec. Expt. Project. Pub. No. 59.
22. Haq, I., Khattak, S.G., Rahman, H., Ali, A. and Salim, M. 2001. Effect of various amendments on the yield of rice crop under saline-sodic conditions in mardan/swabi districts. International Journal of Agriculture and Biology (3): 289–291.
23. Hernando, S., Lobo, M.C., and Polo, A. 1989. Effect of the application of municipal refuse compost on the physical and chemical properties of a soil. The Science of the Total Environment 81/82: 589-596.
24. Ibrahim, M., N. Ahmad, N. and Khan, A. 1993. Use of press mud as a source of phosphorus for crop production. Pakistan J. Sci. Res., 36: 110–13.
25. Jha, M.K., Sondhi, O.A.K. and Pansare, M. 2003. Solid waste management – a case study. Indian Journal of Environmental Protection 23 (10): 1153–1160.
26. Jones, C.C. and Amos, D.F. 1976. Physical changes in Virginia soils resulting from additions of high rates of flyash. In: Faber JH, Babcock AW, Spencer JD, editors. Proceedings of the 4th international ash utilization symposium US Energy Research Development Administration MERC/SP-76-4, Morgantown, WV.
27. Lamberton, J.A. and Redcliff, A.H. 1960. The chemistry of sugarcane wax and the nature of sugar cane wax. Australian Journal of chemistry 13: 261-268.
28. Nisar, A. 2000. Integrated Plant Nutrition Management in Pakistan: Status and Opportunities. Proc. Symp. IPNS. NFDC, Islamabad, pp. 18–37.
29. Page, A.L., Elseewi, A.A. and Straughan, I.R. 1979. Physical and chemical properties of flyash from coal-fired power plants with special reference to environmental impacts. Residue Rev 71: 83–120.
30. Pagliai, M., Guidi, G., La Marca, M., Giachetti, M. and Lucamante, G. 1981. Effects of sewage sludge and composts on soil porosity and aggregation. Journal of Environmental Quality 4: 556-561.
31. Pappu, A., Saxena, M. and Asokar, S.R. 2007. Solid Waste Generation in India and Their Recycling Potential in Building Materials. Journal of Building and Environment 42 (6): 2311–2324.
32. Pathan, S.M., Aylmore, L.A.G. and Colmer, T.D. 2003. Properties of several flyash materials in relation to use as soil amendments. J Environ Qual 32: 687–93.
33. Pitchel, J.R. 1990 Microbial respiration in flyash/sewage sludge amended soils. Environ Pollut 63:225–37.
34. Prabakar, J., Dendorkar, N. and Morchhale, R.K. 2004. Influence of flyash on strength behavior of typical soils. Constr Building Mater 18:263–7.
35. Razzaq, A. 2001. Assessing sugarcane filter cake as crop nutrients and soil health ameliorant. Pak. Sugar J 16(3):15-17.
446
Winter School on “Waste recycling and resource management”-Dec. 3-23, 2014
36. Reddy, S. and Galab, S. 1998. An Integrated Economic and Environmental Assessment
of Solid Waste Management in India – the Case of Hyderabad, India. 37. Salt, D.E., Blaylock, M., Kumar, N.P.B.A., Dushenkov, V., Ensley, B.D., Chet, I. and
Raskin, I. 199). Phytoremediation: a novel strategy for the removal of toxic metals from the environment using plants. Biotechnol 13: 468–474.
38. Sastre, I., Vicente, M.A. and Lobo, M.C. 1996. “Influence of the Application of Sewage Sludges on Soil Microbial Ac tivity,” Bioresource Technology 57(1): 19-23.
39. Shankaranand, V.S. and Lonsane, B.K. 1993. Sugarcane pressmud as novel substrate for production of citric acid by solid state fermentation, World Journal of Microbiology and Biotechnology 9: 13-15.
40. Sharholy, M., Ahmad, K., Mahmood, G. and Trivedi, R.C. 2008. Municipal solid waste management in Indian cities – A review. Waste Management 28: 459-467.
41. Sharma, S., Fulekar, M.H. and Jayalakshmi, C.P. 1989. Flyash dynamics in soil– water systems. Crit Rev Environ Control 19(3):251–75.
42. Sharma, S.K. and Kalra, N. 2006. Effect of flyash incorporation on soil properties and productivity of crops: a review. J Sci Ind Res 65(5): 383–390.
43. Shiralipour, A., McConnell, D.B. and Smith, W.H. 1992. Physical and chemical properties of soils as affected by municipal solid waste compost application. Biomass and Bioenergy 3: 261-266.
44. Smith, C.J., Hopmans, P. and Cook, F.J., 1996. Accumulation of Cr, Pb, Cu, Ni, Zn and Cd in soil following irrigation with untreated urban effluents in Australia. Environmental Pollution 94: 317–323.
45. Taylor, E.M. and Schumann, G.E. 1988. Flyash and lime amendment of acidic coal soil to aid revegetation. J Environ Qual 17:120–4.
46. Wong, M.H. and Wong, J.W.C. 1986. Effects of flyash on soil microbial activity. Environ Pollut Ser A 40:127–44.
47. Woodbury, P.B. 1992. Municipal Solid Waste Composting: Potential Effects of Heavy Metals in Municipal Solid Waste Composts on Plants and the Environment. In: Biomass & Bioenergy 3(3-4): 239-259.
48. Zebarth, B.J., Neilsen, G.H., Hogue, E, and Neilsen, D. 1999. Influence of organic waste amendments on selected soil physical and chemical properties. Canadian Journal of Soil Science 79: 501-504.
447
Winter School on “Waste recycling and resource management”-Dec. 3-23, 2014
Efficient use of sugar industrial waste for sustainable crop production and soil fertility
M.C. Manna and D.H. Phalke Indian Institute of soil science, Nabibagh, Berasia Road, Bhopal-462038 ( MP)
Sugarcane is an important cash crop in Indian agriculture, occupies 2.5 per cent of India’s
gross cropped area and shares 7 per cent of total value of agricultural output (Anonymous, 2014).
In India, more than 450 sugar factories are in operation and located in rural areas. It is the second
largest agro based industrial sector next to cotton textile. The sugarcane industries are
instrumental in generating sizeable employment in rural sector directly. India is the original
home of sugarcane species viz., Saccharum barberi. Sugarcane is the main source of white
crystal sugar in the world which contributes 70 per cent of the total sugar production. Worldwide
more than 90 countries sugarcane occupies an area of 90.4 million ha with total production and
productivity of 1274.7 million tons and 65.7 t ha-1, respectively (Anonymous, 2011 and 2012).
India is contributing about 21.4 per cent area and 23 per cent production globally and
ranks second among sugarcane growing countries of the world next to Brazil. Maharashtra is a
leading state, stood first in cane production and sugar recovery with the highest number of co-
operative and private sugar factories network. Sugarcane industry in Maharashtra is the second
largest agro based industry next to cotton in which the higher improvement is made and brought
about desirable changes in social, economical, educational and political sectors in the rural areas.
In India, the area under sugarcane increased since 1950-51 to 2009-10 from 1.7 million
ha to 42 million ha with cane production and productivity from 54.8 to 278 million tons and from
32 to 66 t ha-1, respectively, while in Maharashtra, area under sugarcane increased from 0.07 to
0.96 million ha with production and productivity from 54.8 to 79.3 million tons and from 67 to
85 t ha-1, respectively (Anonymous, 2011). This development in sugarcane might be due to
developments in production technology and introduction of high yielding varieties. This leads to
increase in substantial quantities of sugarcane trash and stubbles including root mass production.
With increase in sugarcane production resulted into increased sugar factories and distilleries in
the country. During 2009-10 about 490 and 303 sugar factories and distilleries are in operation in
India, while in the Maharashtra, about 143 sugar factories and 69 distilleries are in operation
(Anonymous, 2011). It is estimated that the by-product such as 7.4 million tons of press mud,
448

Winter School on “Waste recycling and resource management”-Dec. 3-23, 2014
271 million liters of spent wash and 0.5 million tons of baggasse is generated every year in India,
while in Maharashtra, annually about 2.4 million tons of press mud, 90 million liters of spent
wash and 0.18 million tons of baggase is generated.
Currently sugarcane growers are facing problems such as decline in productivity, soil
health deterioration, improper management of farm crop residues and indiscriminate waste
disposal in sugar factory. Sugarcane after harvest leaves behind 8 to 10 tons of sugarcane trash
(Bhoi et al., 2004), 4 to 5 tons of stubbles (Subba Rao and Shrivastva, 2007) and adequate
amount of root mass, besides 4 to 5 tons of press mud cake and about 12,000 to 18,000 liters of
biomethanated spent wash (Bhoi and More, 2007; More and Pharande, 2007) obtained from one
hectare area of sugarcane post harvest. About 3 tones of press-mud, 12410 liters of post
biomethanated spent wash and 85 kg baggase are being discharged from 85 tons of sugarcane
after crushing in sugar factory of Maharashtra state, which causes environmental pollution.
As sugarcane trash is a real potential source of organic matter in sugarcane cultivation
and still it is not used properly. Trash is usually burnt results in potential loss of useful organic
matter and plant nutrients. In Maharashtra alone, about more than 30 lakh tonnes of sugarcane
trash is burnt every year. The compost making from sugarcane trash has not become yet popular,
because it decomposes at a very slow rate due to in wider C:N ratio and it is not economically
viable as it requires land, labors and time for handling. However, ex-situ recycling and
incorporation of cane trash and stubbles in the field is an age old practice but adopted on smaller
scale. To overcome the problems of trash management, improving productivity, profitability and
yield sustainability of sugarcane, ratoon management practices were developed. However, there
is no any concrete recommendation for trash management after harvest of sugarcane ratoon.
After harvest of ratoon, farmers used to burn trash to clear the field for next crop. Sometimes, it
is utilized by people for covering huts and house roofs for shelter in rural areas and recently it is
utilized as a fuel for jaggary and other allied industries situated in adjoining sugarcane areas and
for cogeneration in power plants (Natrajan, 2009).
Burning of sugarcane trash results in potential loss of 40 to 50 kg N, 20 to 30 kg P2O5
and 3 to 4 tones of carbon per ha, while only 75 to 100 kg K2O and mineral elements are left
behind in the form of ash (Phalke et al., 2014). Burning of sugarcane before and after harvesting
is a common practice by almost all the cane growers. Burning cane/trash emits green house gases
449

Winter School on “Waste recycling and resource management”-Dec. 3-23, 2014
and pollutes the atmosphere. On an average burning of sugarcane trash from one tonne of
sugarcane emits 35.3, 2.7 and 2.3 kg of carbon monoxide, particulate matter and volatile organic
compounds (VOC’s); respectively, which is responsible for global warming (Perumal, 2002).
Sugarcane by virtue of it’s inherent biomass capacity as a C4 plant consumes more CO2 there by
reduces CO2 load from atmosphere. It fixes 159.9 ton of CO2/ha/year and one ton of cane fixes
1.4 billion ton of CO2 and releases 1.09 ton of O2 annually (Anders, 1988). However, manmade
practices like burning cane trash after harvest emits nitrate oxide, CO2 and other causative
chemical substances favoring global warming, ozone layer depletion and acidification of the
environment. Hence, the practice of trash burning is an international issue for global warming.
Organic solid wastes generated from sugarcane fields and commercial sugarcane
industrial activities are often indiscriminately disposed on the soils. The disposal pattern of
wastes also varies from place to place due to lacking awareness. However, under ordinary
conditions of storage, handling and applications, there are tremendous losses of plant nutrients
either by leaching or volatilization when manures and liquid spent wash remains exposed to sun
and rains. These industrial wastes produce foul smell and develops unpleasant environment due
to anaerobic decomposition. In case of press mud disposal, the sugar factories preparing press
mud compost on their own factory site and distributing among farmers at reasonable rates but
there is very serious problem of disposal of excess spent wash. Very few quantity of spent is
utilized during composting of press mud. There are some recommendations for one time
controlled application of spent wash to agricultural land @ 80,000 lit. ha-1. However, now a
days, Central Pollution Control Board (CPCB) banned the soil application of spent wash as it
pollutes ground water table, creating water and soil pollution by imposing Gazette. Thus, the safe
disposal of spent wash is a great challenge in front of sugar factories. Therefore, a cost effective
fully mechanized technology is needed to recycle excess spent wash along with trash and press
mud to sustain the productivity, improve soil health and minimize global warming.
The indiscriminate and imbalance use of chemical inputs in intensive farming has
increased the cost of production over the years and deteriorated soil health. Sustaining soil health
is the most effective method for ensuring sufficient food to support life. The health of nation’s
soil directly affects its national security. The aim of sustainable agriculture is to develop farming
system that are productive and profitable, conserve the natural base, protect environment and
450

Winter School on “Waste recycling and resource management”-Dec. 3-23, 2014
enhance health and safety in natural resource environment in long-term perspective. In the
context of agriculture, soil health has been used to measure soils’ fitness to support crop growth
without becoming degraded.
The major reasons for poor soil health are : wide nutrient gap between nutrient demand
and supply; high nutrient turnover in soil plant system coupled with low and imbalanced
fertilizer use; emerging deficiency of secondary and micronutrients due to improper use of inputs
such as water, fertilizers, pesticides etc.; insufficient use of organic inputs; acidification and
Al3+ toxicity; development of salinity and alkalinity in soils; development of adverse soil
condition such as heavy metal toxicity; disproportionate growth of microbial population
responsible for soil sickness and natural and manmade calamities such as erosion, deforestation
occurring due to rapid industrialization and urbanization etc. (Manna et al., 2013).
Soil organic carbon play multifunctional role to improve soil degradation. The majority
of carbon is held in the form of soil organic carbon, having a major influence on soil structure,
water holding capacity, cation exchange capacity, the soils ability to form complexes with metal
ions to store nutrients, improve productivity, minimize soil erosion etc. This organic carbon is
highly sensitive to changes in land use and management practices such as increased tillage,
cropping systems, fertilization etc., leading to soil organic carbon decline. Conversely, land use
change and the appropriate management of soils also provide us with the potential to sequester
carbon in soils. Sink of carbon from atmosphere to either plant into soil or directly from
atmosphere into soil is called as soil carbon sequestration. Excluding carbonate rocks (inorganic
carbon path), the soil represents the largest terrestrial stock of carbon, holding 1500 Pg (1Pg =
1015 g), which is approximately twice the amount held in the atmosphere and three times the
amount held in terrestrial vegetation. Soil inorganic carbon (SIC) pool contains 750 -950 Pg C.
Terrestrial vegetation is reported to contain 600 Pg C. Atmospheric concentration of carbon
dioxide and other green house gases is changing rapidly because of anthropogenic activities
including fossil fuel combustion, deforestation, biomass burning, cement manufacturing,
drainage of wetlands and soil cultivation. The current level of carbon dioxide concentration in
the atmosphere at 370 ppm in 2004, and is increasing at the rate of 1.5 ppm per year or 3.3 Pg C
per year. Researchers predicted that unless drastic measures are not taken to reduce net emission
451

Winter School on “Waste recycling and resource management”-Dec. 3-23, 2014
of carbon dioxide, atmosphere carbon dioxide might increase to 800 to 1000 ppm by the end of
21st century.
About 20 per cent of the earth’s land area is used for growing crops and thus farming
practices have a major influence on C storage in soil and its release into the atmosphere as CO2.
Within cropping /farming system, the equilibrium levels of soil organic carbon (SOC) can be
related linearly to amount of crop residue returned/applied to soil. The rate of accumulation of
SOC depends on the extent to which the soil is already filled by SOC i.e., the size and capacity
of the reservoir. Mechanical disturbance of soil by tillage increases the decomposition rate of
SOC. Practices, which increase residue, and /or plant growth result in enhanced SOC
sequestration. The beneficial effect of SOC is more than improving soil quality and fertility.
Therefore, it is of paramount importance for farmers, small-scale and large, in both
developing and developed countries, to employ appropriate crop management technologies that
will not only generate cost-effective, stable crop production opportunities and allow varieties to
yield well but which will also conserve the integrity and sustainability of the soil resources.
Soil organic matter with associated microbial activity also plays a major role in the
nutrient cycling process in soil leading to enhanced nutrient availability. Increasing plant bio
mass production per unit cropped area ,increasing biomass return per unit to cropped area and
decreasing soil organic matter loss have been identified as major consideration to maintain the
soil organic matter balance. Thus, low input sustainable agriculture and the reduced chemical
input concept focus on the reconsideration of agricultural practices such as burning crop residues
and organic matter recycling into soil, in order to maintain and preserve soil organic matter at an
adequate level and to sustain arable land.
Decomposed manures which have a high degree of humification and so contain less
phytotoxic material and pathogens are safe and efficient in crop production.
A.Case study:
An field experiment was carried out to evaluate the effect of in- situ recycling of
sugarcane crop residues and its industrial wastes on soil carbon fractions and SOC stock at farms
of M.P.K.V., Rahuri (latitude 190 47’ to 190 57’ N and longitude 740 18’ to 740 19’E) during
452

Winter School on “Waste recycling and resource management”-Dec. 3-23, 2014
summer, 2011 to 2012. A newly harvested field of sugarcane ratoon (var. COM-0265) was
selected for in situ recycling of sugarcane crop residues and its industrial wastes. The quantity of
sugarcane crop residues viz., sugarcane trash, sugarcane stubbles produced after harvest of
sugarcane ratoon from experimental field and quantity of sugarcane industrial wastes viz.,
pressmud, pressmud compost and biomethenated spent wash produced as a byproducts after
crushing of sugarcane in sugar factory produced from experimental site was quantified and
utilized for in situ recycling in various techniques. The shredding of sugarcane trash by tractor
drawn shredding machine and chapping of stubbles by rotavator into small pieces was carried out
for increasing surface area of crop residues substrate. For enhancing decomposition process and
adjustment of C:N ratio of sugarcane crop residues, 8 kg urea + 10 kg single super phosphate
(SSP) + 1 kg decomposing culture consisting Trichoderma herginum, Trichoderma viride,
Penecillium digitatum, Chetonium spp was used as per recommendation and phosphate
solubilizing micro-organisms (PSM) @ 2.5 kg ha-1 was used for enhancing decomposition
process. The availability of sugarcane crop residue and stubbles were about 13600 and 3289 kg
ha-1 and sugarcane based industrial waste like pressmud, pressmud compost and post methanated
spentwash were about 3.98, 1.99 and 14.89 tonne from 85 tonnes of sugarcane. The required
amount of these wastes have been calculated and applied per plot as per availability basis for all
these treatments. After two months period of decomposition the test crops viz., soybean in kharif
and maize in rabi were taken as a succeeding crops in sequence along with three graded levels of
NPK on the same set of experiment without disturbing the original layout of each treatment
which were super imposed by split plot design. Each single plot (treatment) was sub-divided into
three smaller plots for soybean and maize was grown in sequence having plot size of 10x 20 m2.
It was observed that, the active carbon pools like SMBC, WHC and AHC was
significantly increased in the treatment receiving 100% recommended dose of fertilizer along
with in-situ compost of crop residues, press mud cake and methanated spent wash compost
compared to burning of residues. Further it was observed that application of in-situ sugarcane
residues incorporation with pressmud retained higher amount of TOC, SMBC, WHC and AHC
after harvest of maize. The physically protected carbon i.e. POMC was greater in the treatment
receiving fertilizer in combination with decomposed pressmud compost. After harvest of maize
the maximum recalcitrant fraction (humic acid) of carbon was observed in the treatment T7 {(In
situ decomposition of sugarcane crop residues + cellulose decomposers+ PSM+ 8 kg urea +10 kg
453

Winter School on “Waste recycling and resource management”-Dec. 3-23, 2014
SSP) = T3 + 50% Press-mud cake + 50% biomethenated spent wash}. This study clearly
indicated that resistant fraction of carbon might be accumulated more where decomposed organic
matter was applied regularly. It clearly indicated that application of in situ decomposed residues
and by-products of industrial waste in combination with NPK enhanced the below and above
ground biomass production, SOC stock and carbon pools.
454

Winter School on “Waste recycling and resource management”-Dec. 3-23, 2014
Engineering intervention in composting
Vinod K Bhargav* and H L Kushwaha** *CIAE Bhopal, **IARI New Delhi
Composting is controlled decomposition and natural breakdown process of organic residues by microorganisms. Raw organic materials such as crop residues, animal wastes, food garbage, some municipal wastes and suitable industrial wastes, enhance their suitability for application to the soil as a fertilizing resource, after having undergone composting. Composting has been practiced in rural areas for centuries. Farmers traditionally put agricultural and some animal waste on their field. This is mainly seen as a means of enhancing the soil. Composting of urban waste has a different motivation. However, the main motivation is to reduce and recycle the waste, the empathies on comparatively low-value of components of waste.
There are two definitions of composting, where first is a definition in the strict sense of the term, which differentiates composting from all other forms of decomposition and second one is an ecological definition.
A definition that distinguishes composting from other biological processes is:
“Composting is the biological decomposition of biodegradable solid waste under controlled predominantly aerobic conditions to a state that is sufficiently stable for nuisance-free storage and handling and is satisfactorily matured for safe use in agriculture”.
An “ecological definition” is as follows:
“Composting is a decomposition process in which the substrate is progressively broken down by a succession of populations of living organisms. The breakdown products of one population serve as the substrate for the succeeding population. The succession is initiated by way of the breakdown of the complex molecules in the raw substrate to simpler forms by microbes indigenous to the substrate”.
There are broad distinction as “Traditional” and ‘Rapid’ composting practices has been made, based mainly on the considerations of the practices being adopted as a convention; and the recent introductions for expediting the process, involving individual or combined application of treatments like shredding and frequent turning, mineral nitrogen compounds, effective microorganisms, use of worms, cellulolytic organisms, forced aeration, forced aeration and mechanical turnings and so on.
Composts can be made from most organic by-products. Common feed-stocks are poultry, hog and cattle manures, food processing wastes, sewage sludge, municipal leaves, brush and grass clippings, sawdust, and other by-products of wood processing. Ideally, several raw materials should be mixed together to create the “ideal” range of conditions listed. However, in the real world this can’t always happen. Fortunately composting is a forgiving process that can occur over a wide range of conditions, and an acceptable moisture content and carbon-to-nitrogen ratio are required to produce acceptable compost with good management practices. In general, the
455

Winter School on “Waste recycling and resource management”-Dec. 3-23, 2014
combination of feedstock quality and compost management will determine the quality of the finished product.
Ideal Raw Materials
Vegetable and fruit scraps
Fallen leaves
Tea leaves and tea bags
Coffee grounds
Vacuum cleaner dust
Soft stems
Dead flowers
Used vegetable cooking oil
Egg shells
Old newspapers
Lawn clippings
Sawdust (not from treated timber)
Wood ash
Torn-up cardboard
456

Winter School on “Waste recycling and resource management”-Dec. 3-23, 2014
I) Factors Affecting the Composting Process
All organic material will eventually decompose. The speed at which it decomposes depends on these factors:
1. Carbon to nitrogen ratio of the material
2. Amount of surface area exposed
3. Aeration, or oxygen in the pile
4. Moisture
5. Temperatures reached in compost pile and outside temperatures
6. pH
1. Carbon-to-Nitrogen Ratios
Carbon and nitrogen are the two fundamental elements in composting, and their ratio (C:N) is significant. The bacteria and fungi in compost digest or "oxidize" carbon as an energy source and ingest nitrogen for protein synthesis. Carbon can be considered the "food" and nitrogen the digestive enzymes.
The bulk of the organic matter should be carbon with just enough nitrogen to aid the decomposition process. The ratio should be approximately 30 parts carbon to 1 part nitrogen (30:1) by weight. Adding 3-4 kg of nitrogen material for every 100 kg of carbon should be suitable for efficient and rapid composting. The composting process slows if there is not enough nitrogen, and too much nitrogen may cause the generation of ammonia gas, which can create unpleasant odors. Leaves are a good source of carbon; fresh grass, manures and blood meal are sources of nitrogen.
Table 1. Nitrogen content and C:N of various wastes and residues
Waste Nitrogen C:N
Activated sludge 5 6
Blood 10 to 14 3.0
Cow manure 1.7 18
Digested sewage sludge 2 to 6 4 to 28
Fish scraps 6.5 to 10 5.1
457

Winter School on “Waste recycling and resource management”-Dec. 3-23, 2014
Fruit wastes 1.5 34.8
Grass clippings 3 to 6 12 to 15
Horse manure 2.3 25
Mixed grasses 214 19
Nightsoil 5.5 to 6.5 6 to 10
Non-legume vegetable wastes 2.5 to 4 11 to 12
Pig manure 3.8 4 to 19
Potato tops 1.5 25
Poultry manure 6.3 15
Raw sewage sludge 4 to 7 11
Sawdust 0.1 200 to 500
Straw, oats 1.1 48
Straw, wheat 0.3 to 0.5 128 to 150
Urine 15 to 18 0.8
2. Surface Area
Decomposition by microorganisms in the compost pile takes place when the particle surfaces are in contact with air. Increasing the surface area of the material to be composted can be done by shredding, chopping, mowing, or breaking up the material. The increased surface area means that the microorganisms are able to digest more material, grow more quickly, and generate more heat. It is not necessary to increase the surface area when composting, but doing so speeds up the process. Insects and earthworms also break down materials into smaller particles that bacteria and fungi can digest.
3. Aeration
The decomposition occurring in the compost pile takes up all the available oxygen. Aeration is the replacement of oxygen to the center of the compost pile where it is lacking. Efficient decomposition can only occur if sufficient oxygen is present. This is called aerobic decomposition. It can happen naturally by wind, or when air warmed by the compost process rises through the pile and causes fresh air to be drawn in from the surroundings. Composting systems or structures should incorporate adequate ventilation.
458

Winter School on “Waste recycling and resource management”-Dec. 3-23, 2014
Turning the compost pile is an effective means of adding oxygen and brings newly added material into contact with microbes. It can be done with a pitchfork or a shovel, or a special tool called an "aerator," designed specifically for that purpose. If the compost pile is not aerated, it may produce an odor symptomatic of anaerobic decomposition.
4. Moisture
Microorganisms can only use organic molecules if they are dissolved in water, so the compost pile should have a moisture content of 40-60 percent. If the moisture content falls below 40 percent the microbial activity will slow down or become dormant. If the moisture content exceeds 60 percent, aeration is hindered, nutrients are leached out, decomposition slows, and the odor from anaerobic decomposition is emitted. The "squeeze test" is a good way to determine the moisture content of the composting materials. Squeezing a handful of material should have the moisture content of a well-wrung sponge. A pile that is too wet can be turned or can be corrected by adding dry materials.
5. Temperature
Microbes generate heat as they decompose organic material. A compost pile with temperatures between 32 and 60oC is composting efficiently. Temperatures higher than 60oC inhibit the activity of many of the most important and active organisms in the pile. Given the high temperatures required for quick composting, the process will inevitably slow during the winter months in cold climates. Compost piles often steam in cold weather. Some microorganisms like cool temperatures and will continue the decomposition process, though at a slower pace.
6. pH
The most advantageous pH range for most of the biological reaction is between 5.5 to 8.0. During the process of decomposition the pH increases and at the lower pH, fungi are most conquered organisms facilitating the decomposition. The domination of bacteria at 6.5 to 7.5 pH and at high pH, ammonia gas may be generated, which may cause adverse odour, microbial population decline and resulted poor quality of compost.
II) Category of Composting
Rational composting process control involves the interrelated factors heat output, temperature, ventilation and water removal. Composting may be divided into two categories by its nature of the decomposition, breakdown process and oxygen use. Compost “happens” either aerobically (with oxygen) or an-aerobically (without oxygen) when organic materials are mixed and piled together.
i. Aerobic (with oxygen) composting is the most efficient form of decomposition, and produces finished compost in the shortest time. If the proper amounts of food (carbon), nutrients, water and air are provided, aerobic organisms will dominate the compost pile and decompose the raw organic materials most efficiently. Pile “heat” is a by-product of biological “burning”—the aerobic oxidation of organic matter to carbon dioxide so that microbes can generate energy.
459

Winter School on “Waste recycling and resource management”-Dec. 3-23, 2014
ii. Anaerobic composting, decomposition occurs where oxygen (O) is absent or in limited supply. Under this method, anaerobic micro-organisms dominate and develop intermediate compounds including methane, organic acids, hydrogen sulphide and other substances. In the absence of O, these compounds accumulate and are not metabolized further. Many of these compounds have strong odours and some present phytotoxicity. As anaerobic composting is a low-temperature process, it leaves weed seeds and pathogens intact. Moreover, the process usually takes longer than aerobic composting. These drawbacks often offset the merits of this process, viz. little work involved and fewer nutrients lost during the process.
III) Methods of composting
In India, four methods and twomainly internationallyrecommended Methods-the Indore method (aerobic) and the Bangalore method (initially aerobic but later anaerobic) have been widely practiced. Yet tremendous renewed interest has been shown in the aerobic process of late. In developed countries, practicable technologies have now been worked out for the composting of troublesome wastes such as sewage sludge. Rapid composting processes based upon specific engineering design have been in use. Widespread interest is also being witnessed in the role of earthworms in composting of bio-degradable segments of Urban Solid Waste (USW).
Composting of the city garbage has a long history in India since 1934, when the first such activity was reportedly started at Indore by Mr. Howard. This process of aerobic composting in windrows has come to be known as the 'Indore Process'. This was followed by the work at IARI during the last 40's and early 50's by Prof. C.N. Acharya and his team, who developed the 'Bangalore Process', which was a method of co-composting of municipal and agricultural waste with night soil in covered shallow trenches in a semi-aerobic mode.
i. Anaerobic Decomposition 1. The Indian Bangalore Method
This method of composting was developed at Bangalore in India by Acharya (1939).The method is basically recommended when night soil and refuse are used for preparing thecompost. The method overcomes many of the disadvantages of the Indore method such asproblem of heap protection from adverse weather, nutrient losses due to high winds / strong
sun rays, frequent turning requirements, fly nuisance etc. It is recommended as a satisfactory method of disposal of town wastes and night soil. Trenches are dug 90 cm (3 ft.) deep, 1.5 to 2.5 m broad and 4.5-5.1m long, depending upon the amount of refuse and night soil to be disposed of. Depths greater than 9 cm are not recommended because of slow decomposition. The pits should be located away from city limits.
The composting procedure is as follows:
First a layer of refuse about 15 cm thick is spread at the bottom of the trench. Over this, night-soil is added corresponding to a thickness of 5 cm. Then alternate layers of refuse and night soil are added in the proportion of 15 cm and 5 cm respectively, till the heap rises to 30 cm above the ground level. The top layer of refuse should be at least 25 cm thickness. Then the heap is covered
460

Winter School on “Waste recycling and resource management”-Dec. 3-23, 2014
with excavated earth. If properly laid, a man's legs will not sink when walking over the compost mass.
Within 7 days as a result of bacterial action considerable heat (over 60°C) is generated in the compost mass. This intense heat which persists over 2 or 3 weeks, serves to decompose the refuse and night-soil and to destroy all pathogenic and parasitic organisms. At the end of 4-6 months, decomposition is complete and the resulting manure is a well-decomposed, odourless, innocuous material of high manurial value ready for application to the land.
2. The Indian Indore Method
An important advance in the practice of composting was made at Indore in India byHoward during the period 1924 to 1926. The traditional procedure was systematized into a The Indore method involves building a heap to the height of 1.5 metres with a base of 2m by 2m tapering up to about 1.2m by 1.2m – made up of layers. The first layer is brush or similar to improve drainage. Then there are alternate layers of low nitrogen and high nitrogen material and the heap is often then covered in 5cm of compacted soil to reduce fly issues and contain odours and loss of nitrogen. If left unturned the heap would usually be ready after one year. Otherwise turning after 8-10 days then after a month would give useable compost after a total of 2-3 months. Anaerobic conditions are common in the Indore method (especially without turning) meaning potential smell issues (if the soil casing is missed out). The heap can be made over time (many home garden composts are in that way similar to the Indore method) but this is not ideal and will usually mean a lack of temperature build up and therefore a slower process with lack of weed and disease control.
3. Nadep method of composting
The Nadep method of making compost was invented by a farmer named N.D. Pandharipande (also popularly known as “Nadepkaka”) living in Maharashtra (India). The method, which has become quite popular among the farmers in Western India, now bears his name.
The Nadep method of making compost is making good compost, which other methods can lay claim to its real secret lies in the large quantities of compost the process can deliver with a minimum of human effort within a specific period of time. The process basically involves placing select layers of different types of compostible materials in a simple, mud-sealed structure designed with brick and mud water. The system permits conversion of approximately 1 kg of animal dung into 40 kg of rich compost which can then be applied directly to the field.
DESCRIPTION OF THE MAIN FEATURES
The Nadep method of making compost involves the construction of asimple, inexpensive rectangular brick tank with enough spaces maintainedbetween the bricks (partial honeycomb pattern) to provide for necessary aeration.The recommended size of the tank is of the order of 3.0 m (length) x 1.8 m(breadth) x 0.9 (height). If more material is available for composting, then thelength should be increased. However, the breadth should never exceed 1.8 m.The tank can be erected with bricks and with the use of mud mortar. Cementmay also be used throughout but this is not necessary.However, the last two (topmost) layers of brick ought to be done in cementso
461

Winter School on “Waste recycling and resource management”-Dec. 3-23, 2014
that the structure has stability and is not damaged during actual operationsof filling and emptying the tank.
Since the compost is destined for agricultural fields, it would also be appropriateto keep in mind that the closer the tank is to the fields, the less timewould be required to transport it once it is ready. The bottom of the tank or thetank bed should also be covered as far as possible with an impervious layer orsealed to prevent the possibility of seepage of any liquid waste into the soilbelow. The tank bed can in fact also be laid with bricks provided the ground islevel.The honeycomb wall should be approximately 25 cm thick. The bestway to create the honeycomb effect is to leave out the alternate brick whenone reaches the third row from below. Once the tank is completed, there comes the important task of placing thelayers of organic material within the structure. The quantities required are asfollows:
(a) 1,500 kg of plant and farm waste, including dried husk, twigs, stalks,roots, leaves, etc. from which all plastic, glass and stones have beenremoved.
(b) 90-100 kg of cowdung. In place of this, the slurry from biogas plantscan also be used.
(c) Dried, filtered soil (from the fields and channels) from which againall materials like glass, stones and plastic have been removed. Soilmixed with urine from cattlesheds is especially productive.
(d) Water requirements will vary from season to seasonThe important technique in the manufacture of Nadep compost is that theentire tank should be filled in one go. Filling should be completed within 24hours and should never go beyond 48 hours, as this would affect the quality ofthe compost.Before charging the tank with the materials, it is advisable to wet theinner walls and the tank bed with cowdung dissolved in water.Thereafter, one commences charging the tank with the first layer as follows:
First layer: Plant waste is filled up to a height of 15 cm. This willtake up at least 100 to 120 kg of the material.
Second layer: 4 kg of cowdung should now be mixed well in 125 to 150litres of water and sprinkled on the plant waste in such a way that the materialis completely wet with it. More water will be required in summer for thewetting.
Third layer: The wet cowdung-sprinkled waste is covered with another60 kg of clean, filtered soil and water is sprinkled on it again.Thereafter, the tank continues to be filled with this series of three layersin the same sequence up to one and a 15 cm above the rim of the tank in theshape of a cone.Usually, the standard tank can take 11 or 12 series of layers.
Then, oncethe filling is completed, comes the job of having the tank sealed. This is easilydone by covering the top with a 7.5 cm layer of soil all around. The soillayer is then plastered with liquid cowdung slurry carefully so that no cracksemerge. After a period of 15 to 20 days, due to microbial activity that hasalready commenced, the material above the rim of the tank will shrink tobelow the tank rim.The tank should be opened and filled again with the same sequence oflayers up to a height of one and a 15 cm above the tank rim. Once again, thematerial should be covered
462

Winter School on “Waste recycling and resource management”-Dec. 3-23, 2014
in 8 cm of soil and sealed with liquidcowdung slurry.Thereafter, in order to maintain the moisture level (which should be about15% to 20%) and also to prevent cracking, cowdung mixed with water issprinkled on the compost heap. Water may also be sprayed through the holeson the tank sides. The entire tank is covered with a thatched roof to preventexcessive evaporation of moisture. At no point of time should the compost beallowed to become dry. Depending on the way in which the preparations have been done, thecompost will take between 90 and 120 days to be completely ready for removaland use. When the tank is opened, the compost will be a deep browncolour with a pleasant smell. It should be removed and sieved through a grill.The filtered fertiliser should be used and the remains placed back into the tankfor the next cornposting process.Each large tank can be harvested three times in one year.
4. Coimbatore method, composting is done in pits of different sizes depending on the waste material available. A layer of waste materials is first laid in the pit. It is moistened with a suspension of 5-10 kg cow dung in 2.5 to 5.0 I of water and 0.5 to 1.0 kg fine bone meal sprinkled over it uniformly. Similar layers are laid one over the other till the material rises 0.75 m above the ground level. It is finally plastered with wet mud and left undisturbed for 8 to 10 weeks. Plaster is then removed, material moistened with water, given a turning and made into a rectangular heap under a shade. It is left undisturbed till its use.
5. Chinese rural composting a. The pit method
In this method composting is carried out in a corner of a field and in a circular or rectangular pit. Rice straw, animal dung (usually pig), aquatic weeds or green manure crops are used and often silt pumped from river beds is mixed with the crop residues. The pits are filled layer by layer, each layer being 15 cm thick. Usually, the first layer is of a green manure crop or water hyacinth, the second layer is a straw mixture and the third layer is of animal dung. These layers are alternated until the pit is full, when a top layer of mud is added; a water layer of about 4 cm depth is maintained on the surface to create anaerobic conditions which help to reduce losses of nitrogen. Approximate quantities of the different residues in tons per pit are: river silt 7.5, rice straw 0.15, animal dung 1.0, aquatic plants or green manure 0.75 and superphosphate 0.02. Three turnings are given in all, the first one month after filling the pit and, at this time, the superphosphate is added and thoroughly mixed in. Water is added as necessary. The second turning is done after another month and the third two weeks later. The material is allowed to decompose for three months and produces about eight tons of compost per pit
b. High temperature compost
This form of compost is prepared mainly from night soil, urine, sewage, animal dung,and chopped plant residues at a ratio of 1:4. The materials are heaped in alternate layersstarting with chopped plant stalks and followed by human and animal wastes; water is addedto optimum amount.
At the time of making the heap, a number of bamboo poles are inserted for aerationpurposes. After the heap formation is complete, it is sealed with 3 cm of mud plaster. Thebamboo poles are withdrawn on the second day of composting leaving the holes for aeration of the heap. Within four to five days, the temperature rises to 60-70oC and the holes are thensealed. The first turning is usually done after two weeks and the moisture is made up withwater or animal or human
463
Winter School on “Waste recycling and resource management”-Dec. 3-23, 2014
excreta; the turned heap is again sealed with mud. The compost isready for use within two months.
In some locations, a modified method of high temperature composting is used. Theraw materials, crop stalks (30%), night soil (30%) and silt (30%) are mixed withsuperphosphate at the rate of 20 kg superphosphate per ton of organic material. The compostheaps have aerating holes made by inserting bundles of maize stalks instead of bamboo poles.
ii. Aerobic Composting
1. Windrow composting
Windrow composting is the production of compost by piling organic matter or biodegradable waste, such as animal manure and crop residues, in long rows (windrows). This method is suited to producing large volumes of compost. These rows are generally turned to improve porosity and oxygen content, mix in or remove moisture, and redistribute cooler and hotter portions of the pile. Windrow composting is a commonly used farm scale composting method. Composting process control parameters include the initial ratios of carbon and nitrogen rich materials, the amount of bulking agent added to assure air porosity, the pile size, moisture content, and turning frequency.
The temperatures of the windrows must be measured and logged constantly to determine the optimum time to turn the windrows for quicker compost production. Manually collecting data cannot be done continually and may expose the person collecting the data to harmful pathogens. Automatically collecting the data and transmitting the data wirelessly back to a centralized location allows composting temperatures to be continually recorded
The organic material is formed into long piles that are typically 1.5 m – 3 m high, 3 m – 6 m wide, and up to 100 m or more in length. This process requires that you leave an open space between the windrow, which provides room for the composting turning equipment to operate. Elevating-face or drum-style compost turners are typically used in windrow composting.
2. PASSIVE WINDROW
Passive windrow composting is a very low-costapproach requiring more land, but less labour andcapital than other composting methods. Generally,material to be composted is collected and promptlypiled into windrows which remain untouched. Thematerials may be wetted before they are initiallyformed into windrows, but this is not essential.A windrow is simply an elongated pile of materialwith a more or less triangular cross-section. A windrow should measureabout 3 metres wide and 1.5 metreshigh; its length will vary depending upon the amountof materials used. Aeration occurs naturally. As hotair rises, fresh air is drawn into the pile. Materials canbe added as they become available, or stockpileduntil sufficient amounts are available to make a goodsized pile or windrow. Two windrows should beused. When the first one is large enough, it should beallowed to decompose undisturbed. Additional wasteshould then be added to the second windrow.Covering the windrow with a layer of finishedcompost will help prevent moisture loss, reduceodour problems, and produce a more uniformcompost. Composting in these windrows can takefrom six months to two years.
464

Winter School on “Waste recycling and resource management”-Dec. 3-23, 2014
Large passive windrows can be as wide as 7 metres, and as high as 4 metres and of anylength. The centres of a windrow this size willquickly become anaerobic and only by turning can itreceive a new oxygen supply. An unpleasant odourwill develop in the anaerobic region and may beginto emanate from the composting material; hence, alarge land area is necessary to buffer residents andbusinesses from the odour. Since rapid compostingcan take place only in the presence of oxygen, thecompost normally will require three years tostabilize.With both the small and large windrows used inpassive windrow composting, there is no ability forprocess control. Therefore only medium productquality is produced.
3. TURNED WINDROW
Aeration of the windrow can be achieved throughmechanical turning. Turning can also be donemanually, but is considered impractical with volumeslarger than one or two cubic metres. Uniform decomposition, as well as pathogen destruction, is best achieved by turning the outer edges into the centre of the pile at each turn. However, if this cannot be accomplished, the frequency of turning can be increased. Turning should also be more frequent than under a regular schedule when the moisture content of the pile is too high so as to minimize the development of anaerobic conditions. In areas that receive heavy rainfall, it may be necessary to cover the windrows so they do not become too wet; however, the cost of this may be prohibitive for certain operations. Alternatively, maintaining a triangular or dome shaped windrow is effective for shedding excess rain or preventing excess accumulation of snow in the winter. In windrow composting, the raw material is mixed and placed in rows, either directly on the ground or on paved or concrete surfaces. During the active compost period, the size of the windrow decreases. Following the active period, windrows at the same level of maturity can be combined into larger rows, making additional space for more raw materials or compost. The equipment used for turning the windrow, varies from front-end loaders or bulldozers to specially designed turning machines. Loaders, although inexpensive compared to turners, have a tendency to compact the composting material, are comparatively inefficient, and can result in longer composting periods and less consistent quality. There are two basic types of windrow turners. The most commonly used have a series of heavy tines that are placed along a rotating horizontal drum which, turns, mixes, aerates and reforms the windrow as the machine moves forward. A second type uses a moving, elevator table chain equipped with sharp teeth. These windrow turners are either self contained units that straddle the row, or are powered by a tractor driven power takeoff. Windrows should be turned frequently at first and then at longer intervals by the end of the first month.
A recommended turning frequency is:
1st Week 3 Turnings
2nd Week 2-3 Turnings
3rd Week 2 Turnings
4th and 5th Week 1 Turning each week
6th and above 1 Turning every 2 weeks
465

Winter School on “Waste recycling and resource management”-Dec. 3-23, 2014
if heating still occurs Temperature measurements inside the windrow should be used to gauge the need for turning to stimulate or control heat production. With efficient turning by using a windrow turner, a minimum composting time is one month, followedby at least two months in a curing pile. The compostmay be ready to apply to land or be marketed.Windrow composting can produce excellentcompost, using a variety of diverse materials. Wastessuch as manure solids, fish waste and poultrymortalities can be composted with bulking agentssuch as sawdust, straw and recycled paper products.Windrow composting efficiency and product qualityare dependent primarily upon two major factors: 1.the initial compost mix, and 2. Managementpractices.
4. AERATED STATIC PILE
The aerated static pile composting method wasdeveloped by the United States Department ofAgriculture and can be a very efficient system.During recent years, this method has become popularat the municipal level in composting sewage sludge,but has not yet become popular on the farm.The aerated static pile method does not mechanicallyagitate compost material to achieve the desired levelof aeration. The pile is constructed above an airsource such as, perforated plastic pipes, aerationcones or a perforated floor; and aeration isaccomplished either by forcing or drawing airthrough the compost pile. This system of aerationrequires electricity at the site and appropriateventilation fans, ducts and monitoring equipment.The monitoring equipment determines the timing,duration and direction of air flow. The pile should beplaced after the floors are first covered with a layer ofbulking agent, such as wood chips or finishedcompost. The material to be composted is thenadded, and a topping layer of finished compostapplied to provide insulation. The optimum size ofpile is related to the materials composted, air flowcapabilities and the type of handling equipment. Insome facilities, the initial mix is piled betweentemporary fencing or movable highway dividers.This allows considerable flexibility with respect tothe size and location of the pile within the workingarea or building. In aerated static pile operations, thetiming, duration and uniform movement of air areimportant. Air flow requirements change dependingupon the materials composted, the size of the pile,and age of the compost.A major difficulty with the static pile system is theefficient diffusion of air throughout the entire pile,especially with wastes characterized by a largeparticle size distribution, high moisture content, or atendency to clump. Other problems include theformation of channels in the pile which allow forcedair to short-circuit. This causes excessive drying dueto evaporation of moisture near the channels. Thesesituations may require more frequent turns of piles.Aerated static piles can produce excellent compost,provided that two basic operating conditions are met:
• The initial material has adequate porosity; and
• The air flow system works properly and providesadequate air flows uniformly during the activecompost period to all areas of the pile.
In comparison to windrow composting, aerated staticpiles require a different level of management andmonitoring. Windrow composting is often regardedas a "normal" extension of an existing manure handling system, since some or all of the existing farm machinery can be used for windrow composting. Aerated static piles require additional equipment and infrastructure investment, and these assets are dedicated solely to the compost operation.
466

Winter School on “Waste recycling and resource management”-Dec. 3-23, 2014
In addition, pre-compost product mixingis a very important step in aerated static pile systems. In contrast, the mixing and blending is done throughout the active composting stage in windrow composting. Odour is an operation problem that can affect any type of compost system; however, odour problems are often inherent within a windrowing system. In contrast, if odour problems develop in an aerated static pile system, they can be easily identified and corrective measures taken such as for example, changing air flows; improving air flow capacities; dispersion and filters; and increasing the insulative cover. With negative air pressure delivery, air is drawn through the pile and can be cleaned using a bio-filter before releasing it to the atmosphere; with positive air pressure, air is pushed through the pile and the exterior insulative cover of mature compost cleans the exhaust air.
5. IN-VESSEL
In-Vessel compost systems are high rate controlledaeration systems which are designed to provideoptimal composting conditions involving mechanicalmixing of compost under controlled environmentalconditions. Although various designs are available,the different systems are similar in that they are bothcapital and management intensive. In-vessel, orenclosed-vessel systems fall under three maincategories:
• rotating drum
• horizontal (rectangular/cylindrical) or verticalsilos
• channels
The main advantages of the in-vessel system overothers (windrows, aerated static piles etc.) are theshortening of the mesophyllic and thermophilicstages, a higher process efficiency, and a decreasednumber of pathogens, resulting in a safer and morevaluable end product. As well, space requirementsare generally less than that of other methods.However, it is important to note that all systemsrequire final stabilization of the compost.Disadvantages of the enclosed vessel method includehigh capital and operational costs due to the use ofcomputerized equipment and skilled labour. Invesselcomposters are generally more automated thanwindrow or static pile systems, and can produce a topquality finished product on a consistent basis.Common reasons for choosing in-vessel compostingover other methods include:
• odour control
• space constraints at the site
• process and materials handling control
• better public acceptance due to the
aesthetics/appearance of the composting site
• less manpower requirements
• more consistent product quality
467

Winter School on “Waste recycling and resource management”-Dec. 3-23, 2014
Several existing in-vessel systems in BritishColumbia consist of a series of channels equippedwith a turner mounted on wheels that move on tracksplaced at the top of the channel. The turner serves asa mixing device. The channel contains a perforatedbottom for continuous or intermittent forced aeration.shows a possible four channel in-vesselmethod of composting with under-floor aeration.Retention time is approximately three weeks beforethe composting material is cured. Capacities ofoperations range from a few tonnes to hundreds oftonnes per day.
Table 3Specific limits for compost quality in order to ensure safe application
Parameters Concentration not to exceed * (mg/kg dry basis , except pH value and C/N ratio)
Arsenic 10.00
Cadmium 5.00
Chromium 50.00
Copper 300.00
Lead 100.00
Mercury 0.15
Nickel 50.00
Zinc 1000.00
C/N ratio 20-40
PH 5.5-8.5
*Compost (final product) exceeding the above stated concentration limits shall not be used for food crops. However, it may be utilized for purposes other than growing food crops
References:
1. Bhiday, M.R. (1994): ‘Earthworms in agriculture’. Indian Farming. 43(12): 31-34. Edwards, C.A. (1998): ‘The use of earthworms in the breakdown and management of organic wastes’. In: Edwards, C.A. (ed) Earthworm Ecology. St. Lucie Press, Boca Raton. 327-354.
2. Edwards, C.A. and Arancon, N. (2004): ‘Vermicomposts suppress plant pest and disease attacks’. In Rednova news: http://www.rednova.com.
3. Gaddie, R.E. and Douglas, D.E. (1975): ‘Earthworms for ecology and profit’. Scientific Earthworm Farming. Bookworm Publishing Company. 1: 180.
4. Garg, V.K. and Kaushik, P., (2005): ‘Vermistabilization of textile mill sludge spiked with poultry droppings by epigeic earthworm Eiseniafetida’. Biores. Tech. 96: 1063-1071.
468
Winter School on “Waste recycling and resource management”-Dec. 3-23, 2014
5. Gazette draft(2000). Municipal Solid Wastes (Management and Handling) Rules, published under the notification of the Government of India in the Ministry of Environment and Forests. http://envfor.nic.in/legis/hsm/mswmhr.html
6. Gunadi, B., Blount, C. and Edwards, C.A. (2002): ‘The growth and fecundity of E. Fetida(Savigny) in cattle solids pre-composted for different periods’. In Pedobiologia. 46: 15-23.
7. Ismail, S.A. (1997): ‘Vermicology the biology of earthworms’. Hyderabad: Orient Longman. 92.
8. Munroe, G: ‘Manual of on-farm vermicomposting and vermiculture’. Organic Agriculture Centre of Canada. Available at: http://www.organicagcentre.ca/DOCs/Vermiculture_FarmersManual_gm.pdf.
9. Nagavallemma, K.P., Wani, S.P., Stephane, L., Padmaja, V.V., Vineela, C., BabuRao, M. and Sahrawat, K.L. (2004): ‘Vermicomposting: Recycling wastes into valuable organic fertilizer’. Global Theme on Agro-ecosystems Report no. 8. Patancheru, Andhra Pradesh: International Crops Research Institute for the Semi-Arid Tropics. 20.
10. Saini, V.K., Sihag, R.C., Sharma, R.C., Gahlawat, S.K. and Gupta, R.K. (2008): ‘Relative efficacy of two methods of vermicomposting for biodegradation of organic wastes’. Int. J. Env. & waste mgmt. 2 (1/2).
11. Sample, K.T., Reid, B.J. and Fermor, T.R. (2001): Impact of composting strategies of the treatment of soils contaminated with organic pollutants: a review. Environ. Pollut. 112: 269-283.
12. SilkeRothenberger, Christian Zurbrügg, IftekharEnayetullah and A. H. Md. MaqsoodSinha (2006). Cities of Low- and Middle-Income Countries(A Users’ Manual). Waste Concern, Banani Model Town, Dhaka-Bangladesh; and Eawag, Duebendorf, Switzerland. pages:110
13. Sinha, R.K., Herat, S., Agarwal, S., Asadi, R. and Carretero, E. (2002): ‘Vermiculture technology for environmental management: Study of the action of the earthworms Eiseniafetida, Eudriluseuginaeand Perionyxexcavatuson biodegradation of some community wastes in India and Australia’. The Environmentalist. 22(2): 261-268.
14. Vermicomposting. E-report available at: http://www.worms.com/worm-pdfs/what%20vermicomposting.pdf .
15. Worm bin troubleshooting E-report available at: http://www.bae.ncsu.edu/topic/vermicomposting/vermiculture/worm_bin_troubleshooting.pdf
469

Winter School on “Waste recycling and resource management”-Dec. 3-23, 2014
Production of microbial enriched compost for higher crop yield
M.C. Manna
Indian Institute of Soil Science, Nabibagh, Berasia Road, Bhopal,462038 ( M.P.)
Most of the Indian soils are deficient in phosphorus. Low organic matter coupled with low native soil phosphorus is a constraint limiting the productivity of most of the soils particularly in Vertisols and Inceptisols area of India. Their efficient management is indispensable for the sustainability of production in different cropping systems. In view of ever escalating cost of chemical fertilizers the biodegradable organic wastes is only the way to supplement the nutrients and save as the cost of fertilizers.
Biodegradable organic wastes such as crop residues, agro industrial organic wastes, city garbage and forest litter have wide C/N ratios ranging from 80 to 110, and low concentration of available plant nutrients particularly N, P and K. On the basis of crop production levels, it is estimated that ten major crops (rice, wheat, sorghum, pearl millet, barley, finger millet, sugarcane, potato tubers and pulses) of India generate about 792 Mt of crop residues, in which 201 million tonnes is actually available that has nutrient potential of about 4.865 million tonnes of NPK. The potential availability of all animal excreta is about 792 million tonnes of which 287.45 million tonnes is actually available that potentially supply 3.474 million tonnes of plant nutrients. In recent survey, it is estimated that about 57 million tonnes of city wastes is generated every year from different cities of India that have nutrient potential of about 0.285 million tonnes of N, P and K. It is estimated that every million tonne increase in food grain production will produce 1.2- 1.5 million tonnes of crop residue and every million increases in cattle population will provide additional 1.2 million tonnes of dry dung per annum. Thus the estimated NPK supply from all the wastes including crop residues is 5.0, 6.25 and 9.25 million tonnes, respectively during the year 1991, 2011 and 2025.
Organic solid wastes generated by agriculture, domestic, commercial and industrial activities are often indiscriminately disposed on the soils. The disposal pattern of wastes also varies from season to season. However, under ordinary conditions of storage, there are tremendous losses of plant nutrients either by burning, uses as fuel cake, leaching or volatilization when manures remain exposed to sun and rain. Thus, composting is a microbiological and non-polluting safe method for disposal and recycling of these wastes by converting them into organic fertilizer. It is also known that the composts produce in India is of nutritionally low-grade quality. Thus, a sound technology is required to improve the quality of compost in the shortest possible time, where farmers can prepare the compost easily and improve its nutritional quality by the addition of cheap amendments such as rock phosphate and pyrites.
In India, about 260 million tonnes of rock phosphate deposit has been estimated at present. Rock phosphate (11-32 % P2O5) is available in different states of India such as, Udaipur (Rajasthan), Jhabua (Madhya Pradesh), Visakhapattanam (Andhra Pradesh), Purulia (West Bengal), Mussori (Uttaranchal) etc. Low-grade rock phosphate is used as a source of P for crop production. The other amendments such as pyrites (22% Fe and 22.5 % S), is available in large
470

Winter School on “Waste recycling and resource management”-Dec. 3-23, 2014
scale at Amjer (Jharkhand). During decomposition process substantial amount of nitrogen is lost as ammonia and to minimize the losses of nitrogen acidification of composting medium is essential. Thus, the pyrites addition is required to improve the overall manurial quality of decomposed biodegradable wastes and to accelerate the decomposition process; mineral amendments and bioinoculum need to be added in the composting process. During composting process addition of bioinoculum such as P-solubilizer and amendments such as pyrites enhances phosphorus solubilization/ mineralization from the rock phosphate and improved the manurial value of compost. The traditional technology of composting, if improved in terms of nutrients content, may help in arresting trends of nutrient depletions in soil to a greater extent.
Enrichement technology
Keeping in view, improving soil productivity, quality and nutrient status, addition of quality manures is of tremendous importance in agriculture, horticulture and plantation crops. A enriched phosphocompost technology has, thus, been developed at Indian Institute of Soil Science, Nabibagh, Berasia Road, Bhopal ( M.P.), using rock phosphate, pyrites, phosphate solubilizing organisms (Paecilomyces fusisporus, Aspergillus awamori) and P-solubilizing bacteria (Bacillus polymixa, Pseudomonau striata) and free living N2 fixer ( Azotobacter chroococcum ) as bioinoculum. Fungal culture was applied at the rate of 500 g mycelial mat per tonne of materials and bacterial cultural having 107 viable cell/ml was applied at the rate of 50 ml/kg materials on dry weight basis at 5 and 30 days of decomposition. For 1000 kg of enriched compost production by heap method, the total quantity of crop residue, fresh cow dung, rock phosphate, pyrites, urea and soil will be 1000, 200, 328, 120, 13 and 50 kg, respectively. After 110 days of decomposition enriched compost contains approximately 3.2 to 4.2 % P and 1.5 to 2.3 % N. The content of NH4-N and NO3-N varied from 0.12 to 0.54 and 0.28 to 0.90 g kg-1, respectively. Citrate-soluble P in phosphocompost ranged from 0.23 to 0.98 % and the content of water-soluble –P was about 6 to 10 fold lower than citrate-soluble-P in all the composts.
In the compost phosphate rocks, pyrites and bio-solids increase the manurial value as compared to FYM and ordinary compost. In view of the multi-nutritional deficiencies in Indian soils, an effort has been made to enrich manurial value particularly in respect of phosphorus, sulphur and N content.
1. Potential of rock phosphate use in India Out of the total reserves of 305.3 million tonnes of Rock phosphates in India, around 1.9 million (FAI, 2012-13) tonnes are mined every year. Out of this, around 1.7 million from Jhamarkotra, Rajasthan is used for direct application. Besides, around 7.3 million tonnes of rock phosphates are imported every year, mainly from Jordon, Egypt, and Morocco. We assume that around one million tone of rock phosphate can be made available for making of enriched compost by pooling from indigenous and imported rock phosphates. It is because the rock phosphate which is hitherto being used as direct application can be made more efficient in terms of P nutrient supplier when supplied through enriched compost.
471

Winter School on “Waste recycling and resource management”-Dec. 3-23, 2014
2. Potential of enriched compost use in India
For 1000 kg of enriched compost production by heap method, the total quantity of crop residue, fresh cow dung, rock phosphate, pyrites, urea and soil will be 1000, 200, 328, 120, 13 and 50 kg, respectively.
As per conservative estimation, the availability of crop residue is 201 million tonnes, and
the availability of fresh cow dung is 72 million tonnes out of 144 million tonnes since a large part has to invariably go in the making of dung cakes.
Hence, as per the above figures, it is the rock phosphate which is a limiting input in the
manufacture of enriched compost. With an assumed value of one million tone of rock phosphate that can be made available for making of enriched compost, we can produce 3.04 million of enriched compost.
3. Potential to substitute inorganic P fertilizers in India The computation showed that the approximate enriched compost generated would be
about 3 million tonnes per year that would be equivalent to about 1.89 million tonnes of P2O5 (enriched compost content about 6.30 % P2O5), which is equivalent to 11.81 million tonnes of single supper phosphate (SSP) and 3.94 million tonnes of di-ammonium phosphate (DAP). All in all the phosphocompost can substitute 24% of chemical fertilizers in terms of P requirement. This would tantamount to reduce the subsidy on P fertilizers to about 24%.
4. Composition of enriched phosphocompost
After 110 days of decomposition enriched compost contains approximately 3.2 to 4.2 % P and 1.5 to 2.3 % N. The content of NH4-N and NO3-N varied from 0.12 to 0.54 and 0.28 to 0.90 g kg-1, respectively. Citrate-soluble P in phosphocompost ranged from 0.23 to 0.98 % and the content of water-soluble –P was about 6 to 10 fold lower than citrate-soluble-P in all the composts. In the compost phosphate rocks, pyrites and bio-solids increase the manurial value as compared to FYM and ordinary compost. In view of the multi-nutritional deficiencies in Indian soils, an effort has been made to enrich manurial value particularly in respect of phosphorus, sulphur and N content.
5. Scope of enriched phosphocompost use in India
The scope of enriched compost is for application on pan Indian scale since this product would not have limitations of applying it to only acidic soils as in the case of rock phosphates because the latter does not have water soluble P. However, it would be more economical to apply the enriched compost in those soils that are low in available coupled with organic carbon. Such soils
472
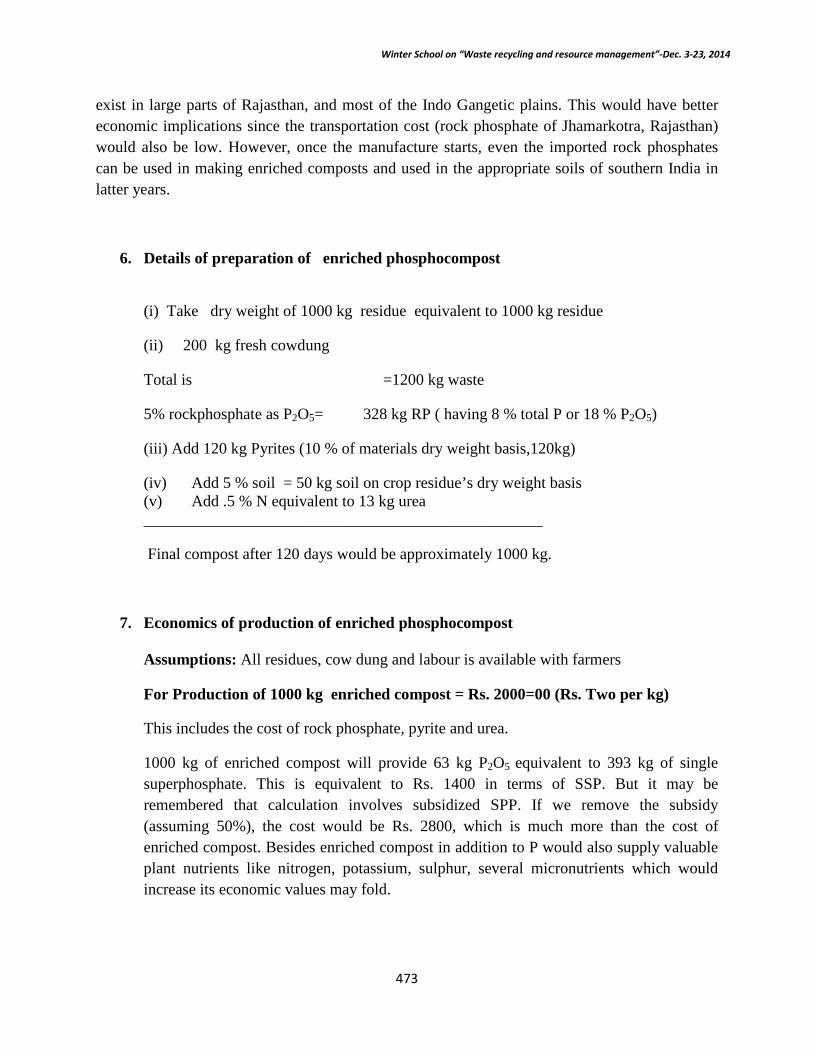
Winter School on “Waste recycling and resource management”-Dec. 3-23, 2014
exist in large parts of Rajasthan, and most of the Indo Gangetic plains. This would have better economic implications since the transportation cost (rock phosphate of Jhamarkotra, Rajasthan) would also be low. However, once the manufacture starts, even the imported rock phosphates can be used in making enriched composts and used in the appropriate soils of southern India in latter years.
6. Details of preparation of enriched phosphocompost
(i) Take dry weight of 1000 kg residue equivalent to 1000 kg residue
(ii) 200 kg fresh cowdung
Total is =1200 kg waste
5% rockphosphate as P2O5= 328 kg RP ( having 8 % total P or 18 % P2O5)
(iii) Add 120 kg Pyrites (10 % of materials dry weight basis,120kg)
(iv) Add 5 % soil = 50 kg soil on crop residue’s dry weight basis (v) Add .5 % N equivalent to 13 kg urea __________________________________________________
Final compost after 120 days would be approximately 1000 kg.
7. Economics of production of enriched phosphocompost
Assumptions: All residues, cow dung and labour is available with farmers
For Production of 1000 kg enriched compost = Rs. 2000=00 (Rs. Two per kg)
This includes the cost of rock phosphate, pyrite and urea.
1000 kg of enriched compost will provide 63 kg P2O5 equivalent to 393 kg of single superphosphate. This is equivalent to Rs. 1400 in terms of SSP. But it may be remembered that calculation involves subsidized SPP. If we remove the subsidy (assuming 50%), the cost would be Rs. 2800, which is much more than the cost of enriched compost. Besides enriched compost in addition to P would also supply valuable plant nutrients like nitrogen, potassium, sulphur, several micronutrients which would increase its economic values may fold.
473

Winter School on “Waste recycling and resource management”-Dec. 3-23, 2014
8. Field trials results and economics of enriched composts • In a three-years field study on soybean-wheat system, application of 100% NPK through
enriched compost to soybean and 50% NPK to succeeding wheat produced the highest yield and saved 25 kg N and 39.2 Kg P/ha.
• A five years-field study on Vertisols revealed that compost application @ 5 t ha-1 in combination with 75% NPK to soybean followed by 75% NPK applied to wheat produced higher productivity in soybean-wheat, sorghum-wheat and soybean +sorghum-wheat system compared to 100% NPK treatment and saved 37 kg N, 30 kg P and 15 kg K.
• To improve soil biological activities phospho-sulpho-nitro compost along with chemical fertilizer application is the best option compared to inorganic fertilizer alone.
• Phospho-sulpho-nitrocompost contains relatively higher amounts of available plant nutrients compared to conventional compost.
• Thus, phosphor-sulpho-nitro compost helps to produce higher yields of crops, quality of produce and maintain fertility status of soils. The use of enriched manure in field crops is also economically viable and safe to the environment.
As per conservative estimation, the availability of crop residue is 201 million tonnes. If
these residue are converted into enriched compost with available fresh cow dung (72 million tonnes out of 144 million tonnes) with improved method, then the computation showed that the approximate enriched compost generated would be about 136 million tonnes per year (50 % recovery basis) that would be equivalent to about 8.6 million tonnes of P2O5 (enriched compost content about 6.30 % P2O5), which is equivalent to 53 million tonnes of single supper phosphate (SSP) and 18 million tonnes of di-ammonium phosphate (DAP).
Thus, phosphate rich organic manure helps to produce higher yields of crops, quality
produce and maintain fertility status of soils. The use of enriched manure in field crops is also economically viable and safe to the environment.
474

Winter School on “Waste recycling and resource management”-Dec. 3-23, 2014
Green Manuring for Sustainable Agriculture
R.H. Wanjari Indian Institute of Soil Science, Bhopal
1. Introduction
With an introduction of high yielding varieties nutrient requirement of crop boosted with reference to traditional cultivars. Day by day cost of fertilizer is increasing. At the same time availability of manures is becoming sparse. Under such situation the farmers are orienting to some alternative like green manuring, an age old practice to sustain the soil. Green manuring is the practice of turning undecomposed green plant tissue into the soil. The function of a green manure crop is to add organic matter to the soil. As a result of the addition, the nitrogen supply of the soil may be increased and certain nutrients made more readily available, thereby increasing the productivity of the soil. Thus, practice of green manuring involves incorporation of plant material into the soil with a view to augment soil fertility. The plant material is mostly of leguminous plants. They are either grown in the same field where they are intended to be turned down or collected from outside and used in the stipulated field. Green manures in India have spread over a large areas but could not make a headway. However, there is a long way to go ahead in this direction. The use of green manuring presently in India is largely confined to paddy crop (Chandy). Therefore it needs to be popularized in other crops. The only important prior assessment is the suitability of green manure for the particular tract from the point of view of soil, water supply and climate. Wherever, there is scope for their introduction, it should be popularized without delay. Sometimes, the effect of green manure crop may not be experienced in the first instance. But its effect is definitely noticed on succeeding crops in crop rotation. It supplies plant nutrients and humus to the soil and helps conserving native plant nutrient. Humus keeps the soil particles knitted together thereby resisting loss of soil erosion.
As green manure possess a narrow C: N (carbon and nitrogen) ratio, great care must be taken in the planting of the main crop. The main crop has to be transplanted (e.g. paddy) or sown (eg. cereals) soon after the application of green manure crop. An interval of less than a week under assured water supply will be the optimum for the planting of the crop. Lot of care should be taken to conserve the nutrients. Otherwise loss of nitrogen as ammonia will take place during the initial stages of decomposition. It is often complained that a farmer loses a valuable season by growing the green manure crop. This problem can be easily solved by suggesting to grow green manure as a mixed crop of green manure and main crop is not feasible, the growing of green manure on bund or field boundaries is recommended. To supplement this, the green leaves from suitable plants can be collected and incorporated into the field directly. Thus, the farmer need not sacrifice a cropping season for growing a green manure crop. By making suitable
475

Winter School on “Waste recycling and resource management”-Dec. 3-23, 2014
adjustment in cropping technique and selecting the right green manure crop he can be sure of reaping rich dividends from the soil. In short, green manuring is a good practice to the soil as it stimulates crop growth.
Thus, the importance of organic manures in sustaining the productivity of soil in long term is realized by all the scientists, extension activists and farmers. Green manuring of crops results in spectacular increase in crop production. One hectare crop of green manure supplies as much as 40 to 80 kg of nitrogen to the field. Besides nitrogen which is the most sought-after and expensive plant nutrient, green manure also supplies micro-nutrients and organic matter lo the soil. Thus, the green manure can rightly be regarded as poor man's manure and an integral component of integrated management of plant nutrients in the soil.
2. Why Green Manuring ?
The green manuring helps in many ways to improve physical, chemical and biological health of the soil (Palaniappan and Annadurai, 2010). Thus, green manuring has a positive influence on the physical and chemical properties of the soil. Green manuring reclaims saline and alkali soils. Decomposing manure releases a large amount of organic acid which neutralizes the soil reaction. It helps to maintain the organic matter status of arable soils. Green manuring builds up the soil structure and improves tilth. It promotes formations of crumbs in heavy soils leading to better aeration and drainage. Depending on the amount humus formed, green manuring increases the water holding capacity of light soils. Green manure crops form a canopy cover over the soil and reduce the soil temperature and protect the soil from the erosive action of rain and water currents.
Green manure serves as a source of food and energy for the soil microbial population which multiplies rapidly in the presence of easily decomposable organic matter. The enhanced activities of soil organisms not only cause rapid decomposition of organic matter (EAP Publication). The enhanced activities of soil organisms not only cause rapid decomposition of the green manure but also result in the release of plant nutrients in available forms for use by the crops. Green manuring contributes 40 to 80 kg nitrogen per hectare to the field. Green manuring of high yielding rice variety with dhaincha increases the rice yield from 20- 30% depending on the soil type and other conditions. Besides supplying nitrogen, green manure also prevents loss of nitrogen by leaching and erosion. Vigorous root system of green manure keeps the soil particles bound together. Dhaincha is found to mobilize soil phosphorus and potassium and other trace elements likely to be deficient in surface layers and leaves them there in a readily available form. Many green manure crops have additional use as sources of food, feed and fuel. Certain
476

Winter School on “Waste recycling and resource management”-Dec. 3-23, 2014
green leaf manure crops serve the dual purpose of nutrient supply and fodder supply. Green leaves of perennial legume plants can be used for green leaf manuring. In the off season, green leaves can be fed to the cattie. The growth of green manure crops (especially, dhaincha and sunnhemp) is very fast. Within 40-50 days they accumulate 6-10 tonnes of biomass per hectare. However, decomposition is also very fast due to richness of nitrogen.
Green manure crops absorb nutrients from the lower layer of soils and leave them in the soil surface layer when ploughed in, for use by the succeeding crops. Green manure crops prevent leaching of nutrients to lower layers. Leguminous green manure plants harbour nitrogen fixing bacteria, rhizobia, in the rood nodules and fix atmospheric nitrogen. Green manure crops increase the solubility of lime phosphates, trace elements etc., through the activity organic acids during decomposition. A crop of green manure on an average is repotted to fix 60-100 kg nitrogen /ha in single season under favourable conditions. Green manuring helps to ameliorate soil problems. Sesbania aculeate (dhaincha), when applied to sodic soils continuously for four or five seasons, improves the permeability and helps to leach out the harmful sodic salts. The soil becomes fit for growing crops. Thus it enhances the crop yield and quality. Green manuring increases the yield of crops to an extent of 15 to 20 per cent compared to no green manuring. Vitamin and protein content of rice has been found to be increased by green manuring of rice crop. It also helps in controlling the pest in different crops. Certain green manure like Pongamia and Neem leaves are reported to have insect control effects. Thus, green manuring plays important role as a natural source of nutrients and found to be of multiple uses as per field situation.
3. Green Manure Crops
It can be mainly classified into two groups viz., legumes and non-legumes and further sub-divided under tow groups in each viz., green manure and green leaf manure (Fig. 1) (Palaniappan and Annadurai, 2010).
477

Winter School on “Waste recycling and resource management”-Dec. 3-23, 2014
Green Manures
Legumes Non-legumes
Green manure Green leaf Green manure Green leaf
manure manure
e.g. Dhiancha e.g. Gliricidia e.g. Sunflower e.g. Calotropis
Sunhemp Cassia Buck wheat Adathoda
It is well documented that the legume fixes free nitrogen from the atmosphere. They improve physical condition of the soil improved by cultivation and incorporation. In general, legumes are more succulent than the non-legumes and less soil moisture is utilized for their decomposition. They serve as cover crops by their vigorous growth e.g. clover, dhaincha and cowpea to smothered weeds. On the contrary, non legumes does not fix free atmospheric nitrogen except in specific plants which have root nodules produced by bacteria or fungi, e.g. casuarinas. They are not as succulent as legumes and hence require more soil moisture and time for decomposition.
4. Crops for Green Manuring
Green manuring is of two types (1) green manuring in situ and (2) green leaf manuring (Thorup-Kristensen, 2003). As is obvious from the name, green manuring in situ is carried out by growing green manure crops in the field itself where their use is intended. The crops which are grown for green manuring are also, therefore, grouped into two categories according to the type
478

Winter School on “Waste recycling and resource management”-Dec. 3-23, 2014
of green manuring. Many types of leguminous and non-leguminous plants are grown on bunds or wastelands for the purpose of utilizing their foliage as green manure.
a) Green manuring crops: The crops which can be grown in the field for in situ turning are called Green manuring crops. For example, Crotalaria juncea, Crotalaria mucronata, Crotalaria anagyroids, Sesbania aculeata, Sesbania speciosa, Phaseolus mungo, Phaseolus trilobus, Melilotus spp, Trifolium alexandrium, Cyamopsis tetragonoloba. Amongst these Crotalaria juncea is the most common green manure crop in India. It is used as a green manure in practically all the states of the country except the areas prone to water logging. It is sown with the break of the monsoon. It grows very fast and attains a height of 1-2 meter. It grows well even in poor soils. The plant contains a large proportion of herbage and does not become woody soon hence it is rapidly decomposable. About 20 to 25 ton of green matter can be obtained from a hectare in a duration of eight weeks. In addition to being a valuable green manure crop, it provides strong fibre for rope making. Similarly, Sesbania aculaeta (dhaincha) is a widely known as a green manure crop in India. It can tolerate water logging and alkalinity to a fair extent. It can also tolerate drought if germination has been sound. It is an ideal green manure crop for rice growing soils. In waterlogged fields it grows to a height of 1.5 to 1.8 meters in a very short time. The resistance of the crop to water logging could be appreciated by the fact that the dhaincha crop survives even after being submerged to a depth of about 60 cm for a week. This crop also grows well in alkaline soil and, therefore, can be used for the reclamation of saline and alkaline soil
Besides these crops, certain other crops are also used as green manure crops in one region or the other. Some varieties of Vigna grow very fast, establish quickly in both the seasons i.e. rabi and kharif and make a very good green manure. Lathyrus is grown in North India as a cover crop. It is annual and mostly grown in winter and establishes itself even when sown on standing rice before harvest.; Desmodium is sown as both cover and green manure crop. Cowpea which is mostly grown as a fodder crop, is a promising green manure crop. Other leguminous plants such as kulthi (Dolichos biflorus) and Lupinus spp are used to certain extent as green manures.
b) Green leaf manuring crops: In this case, green succulent leaves of leguminous or non-leguminous plants are used and incorporated by ploughing. Gliricidia maculate, Pongamia glabra, Calotropis gigantia, Tephrosia perpuria, Tephrosia candida, Indigofera teysmanuui, Sesbania speciosa, Ipomea carnea, Cassia tora are the commonly grown green leaf manure crops. Amongst these crops, Gliricidia maculate is mostly used under farmers’ situation. This plant thrives well in a variety of soils. Under certain climate it grows to a height of about 4.5 meter. During a year two cuttings can be taken; first at the beginning of the monsoon and the
479

Winter School on “Waste recycling and resource management”-Dec. 3-23, 2014
second in December. The fresh weight contains 0.49% nitrogen and 8.5% carbon. The yield of leafy material per plant according to the various observations, is about 22.5 kg after 10 years of planting. Leaves can be obtained for several years. The drawback with this plant is that it very often gets infested with mealy bugs
5. Green Manuring Technique
All the operations involved from sowing till turning in of green manures depends on the kind of crop. Their sowing time differs depending on the season and crop type. While going for green manuring technique one thing should be kept in mind that sowing time should be so adjusted as to bury it at a time when it furnishes its nutrients to the subsequent crop and the time the latter needs it. It will help to reduce loss of nutrients from the soil.
Green manure crops can be grown on any type of soils, provided there is sufficient rainfall or alternative irrigation facility. Poor sandy soils, in particular, benefit most by these practices. The heavy soils are also opened up with the incorporation of the organic matter. Green manure crops do not require any nitrogenous fertilizer as the nature itself has gifted them with the capacity to utilize atmospheric nitrogen. However, when the plant is young, root nodules are not so active. Therefore, application of 10-15 kg of nitrogen per hectare helps the crop to grow faster. Application of phosphorus is essential for sound growth of green manure crops. The placement of phosphate at the root zone has been tried. Certain impurities mixed with phosphatic fertilizer, serve as the source of micronutrients which are needed for the growth of crop. Potassium may be applied if need arises. For instance, Dhaincha often does not need any additional dose of potassic fertilizer as its extensively grown root system absorbs enough potash from the soil to meet its requirement.
Cultivation Technique for Dhaincha: As dhaincha (Sesbania aculeata) has the unique ability to flourish in a variety of soil and climate has made it adaptable throughout the country . Dhaincha can tolerate alkalinity to a level of pH 9.5 with salt concentration of more than 1% which is hazardous for all other commonly grown crops. The dhaincha crop should be sown soon after the break of the monsoon. In northern India, sowing may be undertaken from early June in Bihar, middle June in Uttar Pradesh and July in Punjab and Rajasthan. In these regions, wheat is harvested in March and the field is ploughed, harrowed and leveled in the first week of May. Fine soil tilth is required due to the small size of seed. The time for green manuring in case of sunnhemp, urd and dhaincha in Maharashtra is June or early July. The advantage of establishing the crop earlier than the onset of monsoon is to resist damage from the subsequent heavy rains. It
480

Winter School on “Waste recycling and resource management”-Dec. 3-23, 2014
should be sown 45-50 days before the stipulated date of rice transplanting. In Haryana, Punjab and western Uttar Pradesh where rice is mostly transplanted around first July, dhaincha should be sown around 15 May. The amount of seeds required for one hectare vary form 45 to 60 kg. Higher dose is required for saline and alkaline soils in the wake of lower germination due to excess salts.
Before sowing, seeds of dhaincha should be soaked overnight in water. The treatment of seed with Rhizobium culture has been found to give a good growth of crop. The culture for the various green manure crops is available with local agriculture universities. Seed treatment with rhizobium found beneficial to increase the biomass. Usually 5-6 irrigations are required for raising a 45 days old crop in summer. During germination, sufficient moisture in the soil at 5-10 cm depth is required. If possible one presowing irrigation is desired for good germination. The first irrigation after sowing is given to one week old crop subsequent irrigations are given as and when needed depending on rainfall. Where annual precipitation is less than 65 cm, alternative arrangement of irrigation is necessary.
5.1 Incorporation Stage
It is very important to plan for the stage of incorporation of green manure crops. It decides the success of whole process. When the green manure crops are grown and incorporated in the same field the best stage of incorporation is the flowering stage of the crop (Thorup-Kristensen, 2003). However, when green–leaf manuring is practiced by brining in the green plants grown elsewhere, no definite stage can be fixed as the green leaf manuring is controlled by many other factors. The plants used for green leaf manuring should be incorporated into the soil before they mature or attain the woody nature. Plants of very young nature also should not be incorporated as they will very easily decompose leaving little residual in the soil. Woody plants will decompose very slowly. Hence the best stage for incorporation of plants is either at the flowering stage or before they attain the woody texture.
5.2 Incorporation Time
The success of green manuring depends on the correct time of incorporating green matter into the soil and giving sufficient interval before sowing or planting the crop (Thorup-Kristensen, 2003). The manure, being a bulky one, is usually applied as basal dressing before the main crop is raised in the field. In India, green manure is applied as basal dressing except for some perennial crops. After incorporation, sufficient time is allowed for decomposition to take place
481

Winter School on “Waste recycling and resource management”-Dec. 3-23, 2014
and afterwards only the main crop is sown or planted. However, the time will vary according to the crop and other agronomic practices followed. The best results are achieved when a dhaincha crop of 45- 50 days old is incorporated into the soil just before transplantation of paddy. At this age dhaincha is in its pre-flowering stage and quite succulent. A 50-day old crop furnishes about 20-24 tonnes of biomass per hectare and supplies 95-115 kg of nitrogen in the same area. The crop should be ploughed in with the help of soil turning or disc plough. Ploughing buries the crop in 15-20 cm deep surface soil. Dhaincha for green manuring purpose should not be allowed to grow for more than 50 days or else the crop becomes fibrous. It takes longer time for a fibrous crop to decompose and liberate nutrients timely because of its high lignin content. A thumb rule for turning the crop of green manure is at the time when flowers have just started to emerge.
For example for sugarcane, sunnhemp is grown along with the main sugarcane crop and the green manure crop is incorporated after about 40 to 50 days growth at the time of earthling up. In the case of plantation crops, green manure grown in the same field or brought from outside is incorporated for the decomposition in the field. Usually about six to eight weeks time is found to be sufficient for the decomposition.
5.3 Application Method of Green Manure
The method of application varies from place to place depending upon other agronomic practices followed. In the case of green manuring when plants are grown in the same field where they are to be incorporated, the plants are cut at the proper state to the ground level, placed in the furrows and covered by the next furrow. With the availability of labour saving implements like green manure trampler, the plants are trampled by working the implement and later on leveling the field. This practice is possible where rice is transplanted. In broadcast crop, a suitable modification is necessary and usually the green manure crop is incorporated during the first weeding. In the case of green leaf manuring, the plants brought from other place where it is grown e.g. bunds. The leaves and tender twigs are incorporated in the soil.
5.4 Decomposition
Countless microorganisms participate in the decomposition of organic matter. The factors conducive to complete decomposition are the stage of maturity of the crop and the moisture level of the soil (Thorup-Kristensen, 2003). Desired results will follow if moisture content is high in the beginning, producing semi-aerobic conditions and low afterwards for inducing aerobic
482

Winter School on “Waste recycling and resource management”-Dec. 3-23, 2014
condition under which nitrification can take place. Decomposition, besides depending on moisture content of the soil, is also dependent on the composition of the green matter and the presence of available inorganic nutrients. In light soils, crop should be buried deeper than in heavy soils.
In the normal well-drained soil, the end products are mainly carbon dioxide, nitrate, sulphate and other resistant residues. The decomposition of green manure under waterlogged conditions, as in rice field, takes an entirely different course. It differs from the well drained aerated soil where it is slower and produces different end products. The principal gas produced by green manure decomposition under water logging condition is methane. Small amount of carbon dioxide, hydrogen and nitrogen are also formed. However, the major portion of methane is again convened by the microorganisms on soil surface into carbon dioxide. Blue green algae, which is very often found floating on the water of paddy fields absorbs this carbon dioxide and in return liberate oxygen. This oxygen is dissolved in water and ensures adequate oxygen supply to the paddy roots. Thus, green manuring stimulates the growth of the algae and the production of oxygen in the rice soils resulting in greater aeration or oxygenation of the roots. Green manure also produces some growth hormones and other bio-chemicals which stimulates the growth of paddy.
6. Crops Response to Green Manuring
Many studies on green manure crops of dhaincha, pillipesara, sunnhemp and green leaf manure crops of Gliricidia and Calotropis have shown their significant importance in increasing the yield of grain crops.
Rice: On an average paddy gives the response of 236 kg/ha. Except for Bihar, other response did not show any appreciable difference from state to state. However, in Andhra Pradesh and Tamil Nadu responses were somewhat loftier. One of the probable reasons for the low response there in Bihar is that rice is grown there under rainfed conditions and the rainfall is not enough to provide sufficient quantity of green manure or for its subsequent decomposition.
Wheat: Response of wheat to green manuring differs according to the availability of moisture (Dwivedi et al., 2003). Under irrigated condition experiments indicated more response (155 kg/ha) compared to unirrigated situation (98 kg/ha)(Chandy,).
483

Winter School on “Waste recycling and resource management”-Dec. 3-23, 2014
Sugarcane: Sugarcane responds significantly to green manuring to increase production. Response of sugarcane to green manuring was at the rate of 5604 kg/ha in Punjab and Uttar Pradesh.
Cotton: In the experiments, green manures viz. sunnhemp and urd were grown along with cotton and were turned in situ one month after the sowing of cotton. Responses observed were ambiguous. In Maharashtra, yield of cotton was reduced under both irrigated and un irrigated conditions, whereas in Tamil Nadu the yield was increased significantly.
7. Green Manuring Effect on Soil
Green manuring enhances physical, chemical and biological condition of the soil (Dwivedi et al., , 2003). Green manures supply nitrogen to the soil and consequently make it available to the plants. As most of the green manure crops are leguminous, they fix atmospheric nitrogen in their root nodules. As green manure crop is turned in, all the nitrogen fixed in the plant body is liberated in the soil in the form of ammonium. To sum up, leguminous green manures convert unavailable nitrogen of the atmosphere into available ammonium of the soil. Ammonium form of nitrogen can be easily converted into nitrate form by microorganisms. Decomposition is another important process after incorporation. Decomposing organic matter has a solubilizing effect on phosphorus, potassium and trace elements. There are several mechanisms through which phosphorus becomes available to the plants. The increased solubility of phosphorus might be owing to the production of a large quantity of carbon dioxide during decomposition of organic matter, resulting in lowering the pH of the soil solution. Carbon dioxide dissolved in water, helps in the conversion of mineral phosphate into organic phosphate which becomes available to the subsequent crops. Some of the phosphorus which is strictly fixed with iron and aluminium is also liberated for the crops' use.
The effect of green manuring on soil structure has been controversial. In some of the experiments conducted in this respect it is found that, tinder tropical conditions which are existing in our country, the green manures added is rapidly oxidized before it can be dispersed into the soil colloids. As a matter of fact, green manuring can either increase the humus content or the supply of available nitrogen in the soil, but it can rarely replenish both at the same time. Green manures play an effective role in the reclamation of saline and alkali soils. During decomposition of these manures, considerable amount of organic acid is liberated which brings down the pH of the soil, besides forming number of salts with the sodium of the exchangeable complex. This reduces the sodium content of the clay of the soil. Dhaincha has been found to be an ideal green manure crop for reclaiming saline and alkali soils.
484

Winter School on “Waste recycling and resource management”-Dec. 3-23, 2014
Green manuring also imparts buffering capacity to the soil which helps in keeping down the harmful effects of excessive salt concentration. To get the maximum benefit from green-manuring, the crop should be ploughed at a time when the moisture content of soil is low, so that the initial desiccating reactions may fix the organic complexes, and a highly buffered humified organic residues will help in reducing the concentration of sodium on clay colloids.
8. Conclusions
Green manuring represents a cheap and effective way of improving the soil fertility depending up on the moisture availability of soil. It improves the soil fertility in terms of nitrogen status in addition to other nutrients along with organic matter. For a green manure crop, a legume is preferable as it adds atmospheric nitrogen which is a distinct addition to the soil. Green manure crops serve as cover crop in the soil erosion areas and aids in conservation of moisture. It acts as a good amendment for the reclamation of problem soil like alkali soil. The success of green manuring is again depend on type of green manure; time, stage and depth of incorporation, rate of decomposition etc. Thus, it has the potential to improve the low fertility status of soil. A considerable reduction in the investment on fertiliser, the cost of which is increasing, could be achieved by green manuring. Green manuring can be an important component of low external input sustainable agriculture (LEISA) without sacrificing the level of productivity.
References
Chandy: A Booklet No. 66, Manures & fertilizers: MFS-3
Dwivedi BS, AK Shukla, VK Singh, RL Yadav (2003). Improving nitrogen and phosphorus use efficiencies through inclusion of forage cowpea in rice-wheat system in Indo-Gangatic Plains of India. Field Crops Research 80:167-193.
EAP Publication The Basics of Green Mnauring. By Prof. P Warman, Soil and Land resources, Department of Renewable Resources.
Thorup-Kristensen K, Magid J, Jensen LS (2003). Catch crops and green manures as biological tools in nitrogen management in temperate zones. Advances in Agronomy 79: 227-284.
Palaniappan, SP and Annadurai, K (2010). In: Organic Farming: Theory and Practices. Scientific Publishers (India), Jodhpur
485

Winter School on “Waste recycling and resource management”-Dec. 3-23, 2014
Recent Advances in BNF Researches
D.L.N. Rao
Indian Institute of Soil Science, Bhopal-462 038, M.P.
Nitrogen has revolutionized crop yields and food availability worldwide; the Haber-Bosch process of manufacturing ammonia is considered the most valuable invention of the previous millennium. But this has come at a substantial economic and environmental cost. Intensive cropping with use of high analysis fertilizers coupled with an enormous reduction in recycling of organics or other wastes has led to a continuous decline in the organic carbon levels in Indian soils, impaired soil physical properties, reduced soil biodiversity, aggravation of demand for nutrients not applied etc., all of which are contributing to stagnating yields and reduced factor productivity. Not surprisingly, there is a renewed emphasis now on biological technologies like composting, legume BNF, Biofertilizers, integrated nutrient management, and Biopesticides etc. For a recent review of biological nitrogen fixation in agricultural systems, refer to Rao (2015)
Recent Estimates of BNF
Nitrogen fixation, along with photosynthesis is the basis of all life on earth. Currently, approximately 2 tons of industrially-fixed nitrogen are needed as fertilizer for crop production to equal the effects of 1 ton of nitrogen biologically-fixed by legume crops. Therefore, biologically-fixed nitrogen influences the global nitrogen cycle substantially less than industrially-fixed nitrogen. World population has now been increasingly relying on nitrogen fertilizers in order to keep up with the demands of food and economic growth rates. As population is increasing, producing enough food in India will require us to increase N consumption by 2.5% per annum.
Biological nitrogen fixation (BNF) in natural terrestrial ecosystems contributes globally about 107 million tonnes of nitrogen (Galloway et al 2004) each year. Cultivation induced BNF in agricultural crops and fields adds another 33 m t per year (Smil 1999). Thus total terrestrial nitrogen fixation is 140 m t N/year. The break-up in agriculture is as follows: symbiotic BNF by Rhizobium associated with seed legumes- 10 m t/yr, leguminous cover crops (forages and green manures)- 12 m t/yr., non-Rhizobium N fixing species- 4 m t/yr, cyanobacteria in wet rice fields-4-6 m t/yr and endophytic N fixing organisms in sugarcane- 1-3 m t/yr. Relative to cultivation induced BNF, about 3 times as much N is fixed by the Haber-Bosch process, about 100 m t N per year of ammonia. The industrial fixation of nitrogen is increasing each year with the setting up of more plants.
From the average values of BNF in legumes, cereals, oilseed, fibre, horticultural and fodder crops in India cultivated over 190 million ha., a conservative estimate for BNF inputs in Indian agriculture, based on the responses measured in AICRP-BNF, amounts to 3.68 million tonnes every year. In forests, permanent pastures and grazing lands, miscellaneous tree crops, culturable wastelands, and fallow lands amounting to 121 m ha, a conservative
486

Winter School on “Waste recycling and resource management”-Dec. 3-23, 2014
estimate for BNF inputs from these lands works out to 0.52 million tonnes per year (Rao 2003) . Thus total BNF inputs in India amount to 4.20 million tonnes of nitrogen per year which (Rs. 4830/t; 100 US $/t) works out to Rs. 4410 crores every year. (approximately US$ 918 million). Considering that BNF efficiencies are at least twice that of fertiliser urea nitrogen, the corresponding monetary benefits would also be twice as much.
Recent Advances in Nitrogenase
The biological fixation of nitrogen is an anaerobic process catalyzed by the enzyme nitrogenase and requires a source of reductant, ATP and ammonia assimilating machinery. Enormous progress in almost all aspects of biological nitrogen fixation has been made in the past century, especially in the recent two decades, in genetics and biochemistry. Nitrogenase contains two metallo-components, dinitrogenase (Mo-Fe Protein) and and dinitrogenase reductase (Fe protein). One of the advances has been the determination of the crystallographic structures of both nitrogenase components. Nitrogenase is encoded by a set of operons which includes regulatory genes (such as nif LA), structural genes (such as nif HDK) and other supplementary genes. Klebsiella pneumoniae has been the most well studies and provides a model for the regulation, synthesis and assembly of nitrogenase. A 24kb base pair DNA region contains the entire K. pneumoniae nif cluster which contains 20 genes. In nitrogenase, the Fe protein (structurally encoded by nif H) specifically transfers electrons to the MoFe protein (structurally encoded by nif D and nif K) in a reaction that is coupled with the hydrolysis of Mg ATP. Structural similarities are apparent between nitrogenase and other electron transfer systems, including hydrogenases and the photosynthetic reaction centre. Chl L is similar to Nif H ( ̴ 35%), Chl NB is similar to both Nif D and Nif K ( ̴ 19%) .
Alternative nitrogenases were discovered more than 25 years ago in Azotobacter vinelandii which use vanadium, iron, instead of molybdenum in an environment lacking molybdenum. Streptomyces thermoautotrophicus is recently found to be able to fix dinitrogen, but it harbours a very unusual N2-fixing system which is not sensitive to O2, requires less ATP (4-12), and is not inhibited by CO. There may be more types of such prokaryotic nitrogenases with versatile features yet to be discovered. Because many prokaryotic enzymes do evolve into the eukaryotic version, it would be difficult to rule out the possibility of the existence of a eukaryotic nitrogenase. If eukaryotic nitrogenase does exist in nature, then it may well be utilizing light as an energy source. Efforts need to be made for searching for an eukaryotic nitrogenase.
Prospects of Cereal Nitrogen Fixation
There have been several cycles of research efforts to induce cereals to fix N (although the desirability and eventual benefits of such efforts are open to debate) after the initial high-hopes of the mid-seventies. The second major effort on rice and other non-legumes in the nineties also has not produced any “selection” or “bred” variety that can fix a substantial amount of N. Now a third attempt is “on” spurred by scientists in this area for reinvestment for BNF within cereals (rice, wheat, maize) driven by recent advances in understanding of nitrogen fixation biology. Three approaches are currently considered as promising and are discussed below.
487

Winter School on “Waste recycling and resource management”-Dec. 3-23, 2014
Root nodule symbioses in cereals
During bacterial recognition of a suitable plant host, rhizobia and legumes undergo signaling crosstalk, whereby the plant secretes flavonoids that trigger the bacteria to secrete nodulation (Nod) factors that promote nodule formation within the plant. Recently, Myc factors, which are part of the crosstalk between 70 to 90% of terrestrial plants (including cereals) and arbuscular mycorrhiza endosymbiotic fungi, were discovered to be very similar structurally to Nod factors. Most rhizobia enter root cells through a complex plant structure called an infection thread. Although further research is needed to understand infection thread development, some legumes and most actinorhizal plants are colonized by symbiotic bacteria through the more primitive root-hair-independent method of crack entry invasion, such as entry at epidermal damage points. These routes can be used initially for developing root nodule symbioses strategies in cereals.
Endophytes
It has been known for more than a century that some nitrogen-fixing endophytic bacteria form nodule-independent association with cereal crops. Pursuing this approach will also require screening for new cereal endophytes that fix nitrogen at high rates. Once these endophytes are identified and cultured they could be used in improved microbial inoculants. However this has some limitations which are discussed later.
Transfer of ‘Nif’ into Organelles
The direct transfer of nitrogen fixation (nif) genes to the plant will require engineering the complete biosynthetic pathway of the nitrogenase enzyme into cereals. It will also be necessary to find the correct sub-cellular, low-oxygen, environment to allow nitrogenase to function. Two logical places are chloroplasts and mitochodria; both can provide the high concentration of adenosine 5’ -triphosphate and reducing power required for nitrogenase activity. Chloroplast genomes of lower plants encode an oxygen-sensitive enzyme related to nitrogenase. Conversely, mitochondria have efficient oxygen-consuming respiratory enzymes, functioning oxygen-sensitive enzymes, and iron sulphur cluster machinery highly similar to the nitrogenase iron-sulphur cluster components. What is lacking is the development of a plant mitochondria transformation method; therefore, the nif genes could be transformed into the nuclear genome and the proteins targeted to mitochondria, with expression potentially regulated in a tissue or developmental-specific manner. However it is a major challenge to interface plastid physiology with requirements for nitrogenase activity. The technology is available but there are gaps in knowledge of both plant and microbial physiology.
Wither Endophyte N fixation ?
Three well known researches on free-living and endophytic N2-fixng bacteria associated with non-legumes and most notably with tropical grasses and cereal crops are- Azotobacter, Azospirillum and Gluconacetobacter. In all of them the initial premise that the bacteria increased plant growth due to N2-fixation has been revised to include other growth-stimulating effects of the bacteria like production of indole acetic acid.
488

Winter School on “Waste recycling and resource management”-Dec. 3-23, 2014
Heterotrophic N fixation
Acetylene-reduction assay has been used widely and indiscriminately for measuring N2-fixation but this assay has serious errors when applied to rhizosphere –associated or free-living N2-fixation measurements in soil. The ability of non-symbiotic or associative or endophytic nitrogen fixation to contribute agronomically significant quantities of nitrogen has been questioned by several workers (Giller and Merckx, 2003). The ultimate test of the contribution from N2-fixation is to measure the net inputs from N2-fixation over long periods (>10 years) in the field which sounds simple but it is difficult to control and measure all of the processes. Earlier claims for a significant role of N2-fixation from heterotrophic bacteria in experiments in UK put emphasis on this type of data, but examples where positive N balances over long periods in the field were described were later attributed to inputs from N2-fixation by cyanobacteria (blue-green algae) None of the studies which claim for substantial inputs from root associated or endophytic N2-fixation have excluded potential inputs due to N uptake from deep soil horizons or from cyanobacterial N2-fixation. The investigations in Brazil using 15 N aided N balances remain some of the best and most closely-controlled studies. But the huge amounts of tap water used for irrigation could contribute upto 20-30 kg N ha-1y-1 of unlabelled N (Urquiaga et al 1992).
Endophytic N fixation
Rhizosphere of cereals like rice is particularly abundant in species of Azospirillum and Pseudomonas and in members of the Enterobacteriaceae. In addition, various members of the genera Alcaligenes, Azotobacter, Burkholdera, Clostridium, Flavobacterium, Xanthobacter etc., have also been isolated from paddy field soil or wetland rice with regard to endophytic diazotrophs. Serratia marcescens inoculation of rice resulted in large numbers of this bacteria within intercellular spaces, senescing root cortical cells, aerenchyma, and xylem vessels but they were not observed within intact host cells (Gyaneshwar et al 2001). In rice endophytes may be only a relatively small subpopulation of a much larger rhizosphere diazotroph population and hence their actual contribution could be minor. There are fundamental question about how efficiently the endophytes can actually function within grasses when no obvious “symbiotic” structures appear to be present. In all N2-fixing symbioses identified so far, specialized organs have evolved to house the diazotrophs, such as nodules on legumes and actinorhizal plants, and leaf cavities in Azolla. At present, it is difficult to see how the apparently random distribution of bacteria within intercellular spaces, aerenchyma, dead cells, and xylem vessels that typifies endophytic associations cam perform functions analogous to those of such highly evolved organs
The ecological role of endophytes still remains uncertain. Simply demonstration of the presence of bacteria that actively express nitrogenase genes within a graminaceous plant does not mean that the amounts of N2-fixtion are of importance. Contributions of non-symbiotic N2-fixation for cereals or pastures under agricultural conditions need to be >20 kg N ha-1 yr-1 assimilated by the crop to make a useful difference in productivity. Of all the candidate crops, sugar cane remains the most likely candidate, not least because of the abundance of C in a readily utilizable form.
The role of N2-fixing endophytes thus remain open to question. Some requirements of future research to determine the amount of N derived from N2-fixation by endophytes will be to ascertain the relative abundance of non-N2-fixing bacteria and N2-fixers within the plants. A
489

Winter School on “Waste recycling and resource management”-Dec. 3-23, 2014
detailed and robust quantitative understanding of both the C and N budgets of grasses and their associated rhizosphere and endophytic bacteria is required to properly assess the potential of N2-fixation in these plants.
Recent advances in Legume BNF
Legumes have been estimated to contribute 20% of the nitrogen needed for global grain and oilseed production. They can potentially fix about 80% of their own N need and in addition can contribute to the yield of subsequent crops. But all these potential benefits can be harnessed only under certain conditions. Mere inclusion of a legume in a cropping system does not ensure high BNF. There can be two approaches to harness BNF: Improved crop, soil and water management to achieve maximum efficiency of BNF including Rhizobium inoculation or selection of host genotypes to ensure a higher proportion of nitrogen fixation in the plant (Pfix). Of these the first strategy is well known for almost 50 years and continues to play its rightful role. The second approach on host plants selection is more recent. There has also been a considerable revision of rhizobial taxonomy with the discovery of newer nodule inhabitants. The debate on indigenous versus exotic strains of rhizobia seems settled in favour of the former but specific instances remain of the superior performance of exotic strains for example the USDA strains of soybean. Selecting for High Nod legumes Presence of a large genotypic variability for traits such as nodule number, nodule mass have been known since early seventies and eighties for many legumes. However, an effort to use this variability in breeding for improved N2-fixation has been limited. In addition to the breeding method used for developing a material, absence of any natural selection pressure for nodulation or N2-fixation during its development may be responsible for the occurrence of the different nodulation types within a material even up to the release stage. This view gained strength from the fact that during a screening for high nodulating plants at high mineral N in soil, both high and low nodulating plants were observed in 85 out of 90 advanced breeding lines of chickpea (Rupela 1994). Using appropriate screening procedures several different nodulation types [high nodulating (HN), low nodulating (LN), non-nodulating (NN)] have been identified within several chickpea and pigeonpea cultivars (Rupela 1994). Preliminary studies of Venkateswarlu and Katyal (1994) also indicated plant to plant variability within cultivars of groundnut. High-nodulating (HN) selection generally grew better than the NN and LN selections of a given cultivar. At ICRISAT, the HN-selection of chickpea cultivar G 130 produced 31% more grains than its LN-selection at low soil N (N1) level. The HN-selection of G 130 yielded better even at high soil N (N2) level. At pH 9.0-9.2, a genotype selected for high-nodulation outperformed the four others used in the study of Rao et al 2002. Nodulation was reduced in all the five chickpea genotypes as the electrical conductivity increased from 1.1 to 8.1 dSm-1 but the high nodulating selection CSG 9372 had more tolerance and formed about 3x more nodules than the salt tolerant line (CSG 8927) even at 6.2 dS m-1.
The above studies thus suggest a scope of enhancing N2-fixation in legumes through host plant selection. But progress has been slow. One likely reason of slow progress may be due to the fact that it would take a multidisciplinary team to achieve success such a complex trait as nitrogen fixation, in addition to the complex trait ‘yield’ (it may be noted that breeding legumes
490

Winter School on “Waste recycling and resource management”-Dec. 3-23, 2014
for high yield, per say, has not been as successful as in cereals). Also, any breeding program has to combine several traits (such as pest and drought resistance) along with yield to ensure that the resultant materials are potentially acceptable to farmers. Much of the breeding work is conducted at research stations. Soils at research stations are likely to have higher soil nitrogen than at farmers' fields. High soil-N is known to suppress nitrogen fixation by legumes. For promoting N2-fixing traits, breeders should grow their legumes at low soil-N (preferably <10 µg mineral N g-1 soil) fields, prepared specially for the purpose. Breeders generally handle large numbers of genotypes and materials. In some materials, genes for N2-fixation may be co-segregating with genes for the other traits. It is likely, therefore, that trait combinations associated with enhanced N2-fixation will be identified if appropriate assessment methods are applied to the segregating populations. If genetic variation for N2-fixation existed in breeding populations, the high N2-fixing lines would be produced as a normal outcome. Recent developments in the field of genomics (particularly on Medicago and Lotus) would provide a better understanding of the expression and regulation of symbiotic genes. It should also open up opportunities for biotech assisted germplasm enhancement and bio-informatics assisted gene mining and utilization. These developments may lead to a better targeted breeding of legumes for high BNF than hitherto possible. Breeding for high N2-fixation is feasible and should also be on our research agenda (Rupela and Rao 2002).
Rhizobial Taxonomy Until 1992, there were four genera of root nodulating bacteria: Rhizobium, Bradyrhizobium, Sinorhizobium and Azorhizobium. Later, four more genera added were Mesorhizobium, Allorhizobium, Methylobacterium and Burkholderia. The nomenclature of some of the old species been revised (Young 1996). The study of new geographically dispersed host plants has been a source of many new genera and species and is expected to yield many more. More than 63 species of rhizobia are recognized. A number of new entrants include Devosia, Ochrobactrum and Phyllobacterium in alpha-proteo bacteria and Burkholderia and Cupriavidus in beta-proteobacteria. It should, however, be noted that these are not new bacteria. These were known or associated with their relevant legumes all along but due to the advances made in molecular biology techniques, their nomenclature has improved. For scientists interested in developing N2-fixation technologies for use on farmers’ fields this fast advancing nomenclature of the bacteria presents a complex situation. However, for all practical purposes, the symbiotic relationship between the bacteria forming root nodules in a given host legume remains same as ever and may not affect field oriented breeding programs on high N2-fixation.
Improving BNF through Soil Management
Conserving Soil Moisture:
Nodulation is highly sensitive to drought stress and sudden drought drastically reduces the functioning of the already formed nodules. Drought stress drastically reduces the number of rhizobia. BNF can be improved by modifying the soil hydro-thermal regimes through simple practices like straw mulching, reduced tillage, deep sowing etc (Wani et al 1995) and other soil moisture conservation like opening deep furrows (20 cm) after every 3 m distance to capture rain water (Venkateswarlu 2004).
491

Winter School on “Waste recycling and resource management”-Dec. 3-23, 2014
Correcting Soil Constraints:
Correcting soil constraints and alleviating nutrient deficiencies improves BNF inputs significantly as shown in a number of studies, particularly in acid soils. For example liming increased the grain yield of soybean by 60% in acid soils of Manipur; Lime + Rhizobium improved rhizobial population and grain yield (Raychaudhuri et al 1997). In acid soils of Orissa, application of micronutrients (molybdenum and cobalt) boosted nodulation and BNF in green gram. Rhizobium inoculation increased the grain yield (25.7%) resulting in additional N fixation of 7.1 kg N/ha and P uptake of 0.6 kg/ha. Application of micronutrients alongwith inoculation further enhanced the grain yield dramatically (+78.4%) over uninoculated control resulting in additional N fixation of 24 kg N ha-1 and additional P uptake of 3.4 kg ha-1 respectively (Pattanayak et al 2000). The inhibitory effect of salinity on root hair infection and symbiotic process leading to nodulation and nitrogen fixation in legumes is well known. Although some authors argued that it could be overcome by inoculating with salinity tolerant rhizobial strains and even proposed molecular manipulation for transferring `osm’ genes from other bacteria into rhizobia, it is clear that the success of a symbiotic function under stress is more dependent on the tolerance of the host plant rather the microsymbiont. Indeed, Rao and Sharma (1995) showed that the rhizobial strains most effective in normal soils are also the most effective ones under salinity stress. Rao et al (2002) further showed using 15N measurements, the crucial importance of selecting tolerant plant varieties to increase BNF under saline stress (discussed above). Organic Amendments Organics have been found to boost the proliferation of Rhizobium and enhance nodulation and nitrogen fixation in a number of legumes and oilseeds. Rhizobium inoculation increased the pod yield of groundnut by 391 kg ha-1 while application of FYM alone @ 5 Mg ha-1 increased the yield by 151 kg ha-1. Combined application of FYM and Rhizobium increased the yield by 729 kg ha-1. These and similar results in other legumes led to the recommendation released by from AICRP on BNF at Parbhani `Apply Rhizobium inoculants alongwith FYM @ 5 t/ha’. Addition of farm yard manure is known to boost microbial activity and rhizobial proliferation which results in improvement of BNF in legumes. Ndfa (nitrogen derived from air) in soybean improved from 46.1% in control to 62.5% at 4 Mg FYM ha-1 (Kundu et al. 1998). Other studies also showed beneficial influence of organics on legumes. FYM @4t/ha +VAM+ Rhizobium had best effect on clusterbean yield and soil microbial properties in an arid soil (Tarafdar and Rao 2001). Regular Inoculation Surveys on rhizobial populations in the AICRP on BNF for the major grain legumes have shown populations to be well below the threshold in all areas and below 100 cells/g. (Raverkar et al 2005) due to the extremely high soil temperature and drying of surface soil layers in summer. Recent studies on diversity of rhizobial populations in the AINP on Biofertilizers have also thrown up challenging issues for rhizobial strain selection strategies for major pulse growing regions in the country. In a five year survey of the entire state of Madhya Pradesh, it was found that wherever rhizobial inoculation was practiced by farmers along with FYM and fertilizer application (IPNS) there was best nodulation and grain yield (Rawat et al
492

Winter School on “Waste recycling and resource management”-Dec. 3-23, 2014
2008). This underscored the need to promote awareness for adoption of integrated approach in nutrient management along with use of good quality rhizobial inoculants to promote soybean yield and BNF.
Epilogue
There is an urgent need to improve the inputs of organics and BNF in Indian agriculture. Development of effective and competitive rhizobial strains tolerant to high temperature, drought and nitrate; acidity and other abiotic stresses is of continuing high priority. Soil management practices such as soil reclamation, correcting nutrient deficiencies, application of organics and screening of segregating material in legumes in low N soils are some of the quickest means to increase the contribution of BNF in Indian agriculture. Where inoculation is not feasible the selection/breeding for high nodulating cultivars could be an option. Developing transgenic inoculants, nitrogen-independent cereals, endophytic N fixation requires a very careful re-look and stronger justification for funding.
References Cheng, Q. (2008) Perspectives in Biological Nitrogen Fixation Research. Journal of
Integrative Plant Biology 50: 784-796.
Giller, K.E., and Merckx, R. (2003) Exploring the boundaries of N2-fixation in cereals and grasses: An hypothetical and experimental framework. Symbiosis 35: 3--17.
James, E.K., Gyaneshwer, P., Barraquio, W.L., Mathan, N., and Ladha, J.K. (2000) Endophytic diazotrophs associated with rice. In: The Quest for Nitrogen Fixation in Rice Eds. J.K. Ladha and P.M. Reddy, IRRI, Phillipines, pp. 119-140.
Rao, D.L.N., Giller, K.E., Yeo, A.R. and Flowers, T.J. (2002) The effects of salinity and sodicity upon nodulation and nitrogen fixation in chickpea (Cicer aretinum) Annals of Botany 89: 563--570.
Rao D.L.N. (2014) Recent Advances in Biological Nitrogen Fixation in Agricultural Systems. Proc. Ind. Natnl. Sci. Acad 80 Spl. Sec: 359-378.
Rupela, O, P and Rao, D.L.N. (2004). Breeding legumes for improved nitrogen (N2) fixation. In: Plant Breeding : Mendelian to Molecular Approaches, (eds.). H.K.Jain and M.C.Kharkwal, Narosa, New Delhi. pp. 719-748.
Smil, V. (1999) Nitrogen in crop production: an account of global flows. Global Biogeochem. Cycles 13: 647-662. Urquiaga S, Cruz KHS and Boddey RM (1992) Contribution of nitrogen fixation to sugar
cane: 15N and nitrogen balance estimates. Soil Science Society of America Journal 56: 105—114.
493

Winter School on “Waste recycling and resource management”-Dec. 3-23, 2014
Recent advances in Biofertilizers Research and Applications
D.L.N. Rao
Indian Institute of Soil Science, Bhopal-462 038, M.P
Introduction Intensive cropping with use of high analysis fertilizers coupled with an enormous reduction in recycling of organic materials is contributing to yield plateaus and reduced factor productivity. Thus there is a renewed emphasis on biological technologies like composting, legume BNF, biofertilizers, integrated nutrient management, and biopesticides etc. As population is increasing, producing enough food in India will require us to increase N consumption by 2.5% per annum. The total demand for fertilisers (N+P+K) is projected to increase to 41.6 million tonnes by 2020-21. The demand for N is expected to increase to about 23 million tonnes. The economic burden and environmental effects of applying such a huge quantity of additional fertilizer are obvious, so even if a small part of this increased demand for nitrogen and other fertilizers can be met from biological sources like biofertilizers, the likely savings are huge. The use efficiency of applied nutrients from chemical fertilizers is very poor and varies from 30-50% for N, 15-20% P, 8-12% S, 2-5% Zn, 1-2% for Fe and Cu for a range of crops- so all efforts must be made to improve fertilizer use efficiency by crops. Biofertilizers are known to not only improve yields and produce quality but also improve nutrient use efficiency. The use of cheap and eco-friendly inputs like biofertilizers is especially important for India where most of the farming will continue to be in the hands of small farmers. What are Biofertilizers?
Biofertilizers are preparations of living microorganisms that are useful for promotion of plant growth through a variety of mechanisms like biological nitrogen fixation, solubilization of insoluble phosphates and other nutrients, oxidation of sulfur, production of growth hormones and combating plant diseases. These include specific strains of bacteria, fungi and blue-green algae. Biofertilizers are useful agricultural input because of the following reasons:
1. Eco-friendly way of augumenting nutrient supply and promoting plant growth. 2. Biofertilizers can supplement about 25% of chemical fertilizers through biological
nitrogen fixation and solubilization of unavailable phosphates. 3. Cheap and an efficient source of nutrients. 4. Promotes plant growth through hormones and vitamin production. 5. Control and suppress soil borne diseases through various mechanisms. 6. Helps in mineralization of other plant nutrients in crop rhizosphere. 7. Increases crop yields by 10-20%. 8. Improve soil properties and sustains soil fertility.
494
Winter School on “Waste recycling and resource management”-Dec. 3-23, 2014
Types of Biofertilizers The biofertilizers that are most widely recommended for crops and produced in significant quantities are follows: Rhizobium Symbiotic nitrogen fixing bacteria of legumes which convert atmospheric nitrogen into available forms in the root nodules of legumes; recommended for seed inoculation. Azotobacter Non-symbiotic nitrogen fixing bacteria recommended for seed inoculation/ seedling dip of all cereals, oilseed, pulses, vegetable and horticultural crops. Azospirillum Associatively symbiotic, nitrogen fixing and plant growth promoting bacteria recommended for rice, maize, sugarcane, millets and vegetables for seed inoculation/ seedling dip. Phosphate Solubilising Bacteria (PSB) Various strains of Bacillus and Pseudomonas are known to solubilize insoluble soil phosphates and are recommended for seed and soil inoculation for all crops. Plant growth promoting rhizobacteria (PGPR) They promote plant growth through a variety of mechanisms like fixation of nitrogen, solubilisation of phosphate, production of growth hormones like auxins and gibberellins, antibiotics, siderophores, ammonia and HCN production and some of them also exhibit ACC deaminase activity. Examples include Bacillus and Pseudomonas, Azotobacter, Azospirillum etc. listed above. Rhizobium is also known to exert PGPR action on crops. Blue green algae (BGA) Non symbiotic nitrogen fixing cyanobacteria, recommended for rice, e.g., Nostoc, Anabaena, Aulosira, Tolypothrix etc. Azolla Water fern that has nitrogen fixing Anabaena as a micro-symbiont, recommended both as a green manure and as inoculant for rice paddies. VAM (Vesicular-Arbuscular Mycorhiza) are fungi which are associated with the roots of most higher plants and helps the plants in mobilizing macro- and micro-nutrients. In fact there are a number of other microorganisms that are useful as biofertilizers-for example Thiobacillus for S oxidation, Aspergillus and Penicillium for P solubilization, Silicon and potassium mobilizers, a number of newly reported PGPR like Burkholderia, Gluconacetobacter etc. All these are not discussed here as they are yet to become very popular from production point of view, the way others have become.
In fact most of the microorganisms listed above are poly-functional in nature. Many of them can solubilize phosphorus as well as act as PGPR. Even BGA are known to solubilize
495
Winter School on “Waste recycling and resource management”-Dec. 3-23, 2014
phosphate and produce growth promoting hormones. Therefore a more practical and useful way to classify biofertilizers from the view of application is into three groups: 1) Rhizobium 2) PGPR (Azotobacter, Azospirillum, Bacillus, Pseudomonas) 3) BGA and Azolla. We now have a significant repository of information on basic aspects of biological nitrogen fixation (BNF) as well as reliable and cost-effective technologies for enhancing the inputs of nitrogen and phosphorous into cropping systems and a valuable database on nutrient supply through biofertilizers. For most of the cultivated crops and soil types in India, indigenously adapted, efficient strains of rhizobia for legumes, non-symbiotic and associatively symbiotic bacteria for non-legumes, blue green algae for rice and phosphate solubilizing bacteria for all crops have been isolated, extensively screened and are being supplied to farmers all over India.
BNF and Rotational Benefits
High-yielding soybean plants need to meet their N requirement according to genetic potential for maximum grain yields. Biological nitrogen fixation (BNF) and mineral soil or fertilizer N are the main sources to obtain its N needs. BNF is the most sustainable and low cost source of N. It is estimated that BNF can meet 50-70 % of the N requirement of the soybean crop (Herridge et al., 2008; Salvagiotti et al., 2008).
In a 8 year long field experiment in a Vertisol, inoculation of soybean with rhizobia increased the grain yield by 10.1% (180 kg ha-1) but increase in wheat yields by inoculation with Azotobacter was only marginal (5.6%; 278 kg ha-1) (Rawat et al. 2013). There was always a positive balance of soil N after soybean harvest; an average of +28 kg N ha-1 yr-1 in control (nodulated by native rhizobia) compared to +41 kg N ha-1 yr-1 in Rhizobium inoculated plots. There was additional N uptake 14.9 kg N ha-1 by soybean due to Rhizobium inoculation and 20.9 kg N ha-1 by wheat crop due to Azotobacter inoculation and gain of +38.0 kg N ha-1 yr-1 to 0-15 cm soil layer after harvest of wheat; the total benefit to crops and soil due to the inoculants was 73.8 kg N ha-1 yr-1 after one soybean-wheat rotation. This strongly underscored the need to promote awareness of the benefits of microbial inoculation with rhizobia and PGPR to promote BNF.
Dubey (1998) reported additional N2-fixation due to Rhizobium inoculation to range from 76.1 to 137.6 kg ha-1 in central India. However, soil N measurements were not made in this study. Salvagiotti et al. (2008) pointed out that data from experiments in which soybean was fertilized with <10 kg N ha-1 showed that the relative contribution of N2-fixation was 58%. BNF ranged from 0 to 337 kg N ha-1, averaging 111 kg N ha-1. In the study of Rawat et al. (2013) quoted above , the inoculated soybeans removed 173 kg N ha-1. Because added N was low, and assuming a relative contribution from BNF to be similar to global estimates, the BNF contribution averaged 100 kg N ha-1 at a grain yield of ~2.0 Mg ha-1. The uninoculated soybeans (nodulated by native rhizobia) removed 158 kg N ha-1. All the additional N uptake due to Rhizobium inoculation came from BNF which amounted to ~ 15 kg ha-1
. There is a strong need to improve the strains used for bioinoculants (in order to overcome the competition from native
496

Winter School on “Waste recycling and resource management”-Dec. 3-23, 2014
strains) and also the quality of inoculants (to deliver higher cell load on the seeds) so as to increase the quantum of nitrogen gains due to rhizobial inoculation.
The rotational benefit of legumes and N credit for succeeding cereal crops are widely known. Recent reports on effects of Rhizobium inoculated soybean and Azotobacter inoculated wheat in a Vertisol showed a fertilizer nitrogen saving of 30 kg ha-1 in wheat (Rawat et al. 2013).
Plant Growth Promoting Rhizobacteria
Plant growth promoting rhizobacteria (PGPR) are known to improve nitrogen fixation in legumes by promoting nodulation, solubilization of fixed forms of phosphates in soil, production of phytohormones like indole acetic acid and gibberellins, production of siderophores for chelating iron and synthesis of low molecular weight compounds or enzymes that can modulate plant growth and development. PGPR are also reported to produce antibiotics that suppress deleterious rhizobacteria /plant pathogenic fungi or through other unidentified mechanisms. PGPR thus provide a healthy environment for better root growth, promote nodulation and Ndfa (nitrogen derived from air). All these lead to yield increases in soybean when rhizobia are co-inoculated with PGPR and VAM (vesicular arbuscular mycorrhizae). Soybean roots that are more thoroughly colonized by VAM fungi are more heavily nodulated by rhizobia; the beneficial influence of mycorrhiza have been attributed to increased IAA and ABA contents in roots, shoots and nodules of the mycorrhizal soybean plants (Murakami-Mizukami 1991), increased size and activity of nodules along with higher photosynthetic nutrient use efficiency in leaves and increased resistance to infection by the pathogen Pseudomonas syringae (Shalaby and Hanna 2000). PGPR inoculation is thought to be most effective for those cultivars which have a higher yield potential.
Inoculation of rhizobial strains of soybean in Vertisol field at the JNKVV, Jabalpur centre of the All India Network Project on Soil Biodiversity-Biofertilizers gave 17 % increase in seed yield; the best PGPR strains (Bacillus megaterium, B.subtilis and Lysinibacillus fusiformis P3, P10 and P25) gave 23% increase and the combinations of individual rhizobial strains with the PGPR as consortium gave 28% increase in seed yield of soybean.
Zinc deficiency not only affects crop yields, but also nutritional quality and human health. Microbial transformation of unavailable forms of soil zinc to plant available zinc is an important approach contributing to plant zinc nutrition and growth promotion. Sharma et al. (2012) reported the occurrence of zinc-solubilizing Bacillus strains in soils of Nimar region, Madhya Pradesh and two isolates KHBD-6 and KHBAR-1 as promising zinc solubilizers for increased assimilation of Zn in soybean seeds. Ramesh et al (2014) found that two strains of Bacillus aryabhattai MDSR7 and MDSR14 produced substantially higher soluble zinc content with significant decline in pH . They also had other PGPR traits like production of indole acetic acid, siderophores and ammonia. Inoculation of these strains substantially decreased the pH of rhizosphere soil and increased the dehydrogenase, β-glucosidase, auxin production, microbial respiration and microbial biomass-C in the rhizosphere of soybean and wheat. Inoculation also resulted in a depletion of organically complexed and calcium carbonate bound zinc and an increase in exchangeable and sesquioxide bound zinc in soil.
497

Winter School on “Waste recycling and resource management”-Dec. 3-23, 2014
Integrated Nutrient Management
Climate change induced drought and increasing temperatures would lead to a reduction in soil organic matter content. Soil organic matter is the mainstay of soil quality and the most important driver of microbial activity, and also determines the diversity. Soil organic carbon was the single most important component of soil that explained the variation in rhizobial population in dry land soils (Venkateswarlu et al. 1997). Hence there is a need to build up rhizobial populations by addition of organic materials as well as repeated inoculation of the desired strains. Addition of farm yard manure improves BNF in legumes. Nitrogen derived from air (Ndfa) in soybean improved from 46.1% in control to 62.5% with application of 4 Mg FYM ha-1 (Kundu et al. 1998). Beneficial effect of the combined application of FYM and Rhizobium gave synergistic effect and improved the grain yields and N uptake in legumes and led to the recommendation ‘Apply Rhizobium inoculants along with FYM @ 5 t/ha’ from the ICAR All India Coordinated Research Project on Biological Nitrogen Fixation (Rao et al. 2004). In a five year survey of the entire state of Madhya Pradesh, it was found that wherever rhizobial inoculation was practiced by farmers along with FYM and fertilizer application (Integrated Plant Nutrient Supply) there was best nodulation and grain yield (Rawat et al. 2008).
Mother–baby field trials, involving on-farm participation to introduce and test technology options, was used to evaluate the best possible nutrient management technologies in a soybean–wheat system on Vertisols deficient in N, P, S and Zn in Rajgarh, Madhya Pradesh, India (Reddy et al. 2013). Two sets of >90 baby trials conducted by farmers in 2007–2008 and 2009–2010 in 10 villages of Bhopal, Raisen and Vidisha districts of Madhya Pradesh showed the benefits of this INM technology. Balanced fertilization (BF) with recommended rates (kg ha-1) of 25 N, 26 P, 17 K, 20 S, and 5 Zn gave ca. 26% increase in soybean seed yield over the farmers’ practice (FP). Integrated Nutrient Management (INM) (50 % of the recommended inorganic fertilizer + 5 t FYM ha-1 + seed inoculation with Rhizobium) was superior and increased the seed yield by ca. 48 % over the farmers’ practice (FP).
In INM, the total nutrient requirement is met jointly by fertilizers, organics and biofertilisers in a balanced way. Though balanced nutrition through fertilizers alone may enhance crop productivity but it does not make the system sustainable because of less than optimum soil organic matter content, soil physical environment and (resultant) soil biological condition. Lack of sustainability must show up in the form of aggravation of early warning indicators like for example soil enzymes. Results from an on-farm experiment with soybean-wheat rotation in a farmer field in a Vertisol near Bhopal, Madhya Pradesh showed that organic carbon, bacterial and fungal counts and activity of soil enzymes during wheat growth increased just after two years and were higher in organic and INM than with fertilizers only (Rao 2013) .
Mixed Biofertilizers
The efficacy of various microbial inoculants in increasing the yields and saving nitrogen and phosphorus for pulses, oilseeds, cereals etc., has been convincingly proved in farmers’ fields in most agro-eco-zones. Mixed biofertilizers (BIOMIX) containing a consortium of N fixers, P solubilisers Plant growth promoting rhizobacteria (PGPR) and VAM fungi were found to
498

Winter School on “Waste recycling and resource management”-Dec. 3-23, 2014
promote the growth of cereals, legumes and oilseeds better and saved 25% NP fertilizers in crops. The effects are more beneficial if used along with fertilizers and organic fertilizers.
Under the National Project on Development and Use of Biofertilizers of the Government of India, 1050 field demonstrations were carried out in 25 states/union territories on all types of crops. Average yield increases were 13% in rice, 9% in wheat, 10% in millets, 13% in pulses, 14% in oil yielding crops, 10% vegetables. N savings were about 35 kg in rice and wheat, 30 kg in millets, 13 kg in pulses, 26 kg in oilseeds and 40 kg per hectare in vegetable crops. P savings (P2O5) were about 20 kg in rice and wheat, 6 kg in millets, 10 kg in pulses, oilseeds and vegetable crops. Demonstrations of Biofertilizers in Farmers’ Fields Rice Azolla or blue green algae can be applied to the rice fields directly. BGA inoculum is applied @ 10 kg/ha in flooded rice. The benefits of Azolla are twofold, firstly it fixes atmospheric nitrogen and secondly it acts as a green manure. For the purpose of biological nitrogen fixation apply Azolla@ of 3-4 kg/10 m2 ; for the purpose of green manure it is applied @ 10 t/ha. After application sufficient water should be maintained in the field to allow the growth of Azolla. Once it grows fully, it is incorporated into the soil. In Bihar the application of biofertilizers (Azospirillum, Pseudomonas and BGA), increased the rice yield by 10-20% in small and marginal farmers. Similarly in the North-East region of India in Assam the application of Azospirillum resulted in paddy yield of 42 q/ha which was 12.4% greater than with use of chemical fertilizers alone. In the same state, the Jorhat centre of our project developed a simple technique for home-stead multiplication of Azolla by the farmer for their domestic use and found that application @ 2-3 t/bigha resulted in addition of 4-8 kg nitrogen/rice crop (20-40 kg N/ha) giving 10-20 per cent increase in rice yield. Soybean, Wheat, Pearl millet, Groundnut The inoculation of Rhizobium to soybean in Vertisols increased the yield (by 1.8-2.4 q/ha) and added 15 kg N/ha in soil, which is available to the subsequent wheat crop. In soybean-wheat cropping system the use of biofertilizers in both crops (Rhizobium in soybean and Azotobacter in wheat), increased the yield of soybean by 10% and wheat by 5% and additionally saved 30 kg chemical nitrogen/ha in wheat. Following this biofertilization practice there was net addition of 15 kg N/ha in soybean and 21 kg N/ha in wheat along with addition of 38 kg/ha nitrogen in soil resulting in total benefit of around 75 kg N/ha. In the districts of Rajgarh and Vidisha in Madhya Pradesh, the application of Rhizobium and PSB through integrated plant nutrient management system (chemical fertilizers 50%, 5 t FYM/ha) increased the yield by 18% along with additional N uptake of 34 kg N, 3 kg P and 16 kg K/ha in soybean. In a five year survey of the entire state of Madhya Pradesh, it was found that wherever rhizobial inoculation was practiced by farmers along with FYM and fertilizer application (IPNS) there was best nodulation and grain yield. This underscored the need to promote awareness for adoption of integrated approach in nutrient management with due emphasis on crop residue/ manure recycling and increased use of good quality rhizobial inoculants to promote yield and BNF of legumes in Madhya Pradesh.
499

Winter School on “Waste recycling and resource management”-Dec. 3-23, 2014
With the use of Azotobacter, Azospirillum and PSB in farmers’ fields in Haryana, the grain yield of pearl millet increased by 5% and fodder yield by 6%. Similarly in Maharashtra, Rhizobium inoculation increased the pod yield by 391 kg ha-1 while application of FYM alone @ 5 Mg ha-1 increased the yield by 151 kg ha-1. Combined application of FYM and Rhizobium increased the yield by 729 kg ha-1. Nodulation, N and P uptake at 60 days as well as Rhizobium population in soil were all boosted due to combined application of FYM and Rhizobium. This led to the recommendation released at Parbhani “Apply Rhizobium inoculants along with FYM @ 5 t/ha”. In Gujarat, the inoculation of groundnut seeds with Rhizobium and PSB increased the yield by 10-12% along with additional increase in 6-10% N and 4-8% P. Vegetables Biofertilizers have so far been seen only as a means of augmenting nutrients through biological nitrogen fixation, phosphorous solubilization, etc. But recent researches reveal that they can improve fertilizer use efficiency and can be exploited for this purpose. Vegetables have a short growing cycle and are an essential part of human diet consumed daily. Balanced nutrients are required for high production of vegetables; therefore there is a need for the integrated use of different plant nutrients. In Orissa, under the All India Network Project on Biofertilizers, biofertilizers like Azotobacter, Azospirillum, Rhizobium (for leguminous vegetables) and PSB were used for cultivation of different vegetables either singly or along with FYM or vermicompost application to soil. The microbial inoculum was prepared by enrichment of FYM/vermicompost with different microorganisms (Azotobacter, Azospirillum, and PSB) and incubation which increases the microbial counts 10-15 fold. The effects were seen on different vegetables (beans, cowpea, okra, chilli, radish, mustard, potato, carrot, turmeric, brinjal, tomato, ginger, yam etc) resulting in yield increase by 8-12% for above ground and 25-30% for below ground vegetables. Bioinoculation of vegetables saved N and P fertilizer dose by 20-25%, improved the nutrient use efficiency by 12-36% for N, 18-28% for P, 9-15% for K and 16-18% for S. The use of biofertilizers also improved the quality of produce-for example in tomato anti-oxidants like lycopene increased by 13% and Vitamin C by 27 %. Curcumin content of turmeric increased by 10% in farmer field produce. So biofertilizers have an important role in improving the nutritional security of farmers. Kodo, Kutki and Ramtil The tribal areas of Dindori district of M.P have mainly shallow, skeletal soils. In this area agriculture is mainly rain fed. The livelihood of these farmers is based on cultivation of minor millets like Kodo, Kutki and oil seeds like Niger (Ramtil). Here the usage of chemical fertilizers and other agricultural chemicals is meagre. Hence the use of biofertilizer technology is extremely profitable. Biofertiliztion with Azotobacer, Azospirillum and PSB gave yield increases by 5-10% over farmers’ practice where no fertilizers are being used. IPNS treatment resulted in substantial yield increase ranging from 100-230% over farmers’ practice. Precautions in Biofertilizers Usage Biofertilizers must be purchased from a reliable company/agency. Sufficient care should be taken to check that the powder formulation is not dried out and there are no clods. The instructions printed on the packet should be followed closely. Biofertilizers should be protected from direct exposure to sunlight; store always in a cool place and do not mix with other
500

Winter School on “Waste recycling and resource management”-Dec. 3-23, 2014
chemical fertilizers. Take care while treating the seeds with Rhizobium and use specific Rhizobium inoculant for the specific legume crop. Treat the seeds by strictly following the instructions given and dry under shade. Sow the seeds immediately in the field; do not keep treated seeds until next day. Adoption of Biofertilizers by Farmers With proper usage, farmers have reported more vigorous crops (greenness), bolder grains and better yields. Soil application is preferred by most farmers. Adoption is easy in vegetable growing as it involves only dipping of seedlings and success is better since FYM is invariably applied and good irrigation regimes are maintained. This invariably led to improvement of the quality of the produce and better nutrient use efficiency. The B/C ratio of Biofertilizers is on the average ~15 and can even as high as 80. Adoption has been good wherever the manufacturer is doing “niche marketing”. Biofertilizers give very good benefits when used along with the organic sources like FYM, vermicompost, poultry manure, green manure and composts. Selected References
Ansari PG., Rao DLN, Pal KK (2014) Diversity and Phylogeny of Soybean Rhizobia in Central India Annals of Microbiology. DOI: 10.1007/s13213-013- 0799-2
Ramesh A, Sharma SK, Sharma MP, Yadav N, Joshi O P (2014). Inoculation of zinc solubilizing Bacillus aryabhattai strains for improved growth, mobilization and biofortification of zinc in soybean and wheat cultivated in Vertisols of central India. Applied Soil Ecology 73: 87-96.
Rao DLN (2013) Soil Biological Health and its Management. In: Soil Health Management: Productivity-Sustainability-Resource Management, Ed. H.L.S.Tandon, FDCO, New Delhi., pp 55-83.
Rao DLN, Pal KK (2003). Biofertilizers in Oilseeds Production–Status and Future Strategies. In: Proceedings of National Seminar on Stress management in oilseeds for attaining self-reliance in vegetable oils. Eds. Mangala Rai, Harvir Singh and D.M.Hegde. Indian Society of Oilseeds Research, DOR, Hyderabad, pp.195-220.
Rao DLN, Natarajan T, Ilamurugu K, Raut RS, Rawat AK (2004). Rhizobium inoculation of leguminous oilseeds-Results of on-farm and farmer’s of field demonstrations in the ICAR Coordinated Project on BNF. In: Symbiotic Nitrogen Fixation-Prospects for enhanced application in tropical agriculture. (Ed.) Rachid Serraj, Oxford & IBH Publishing Co. Pvt. Ltd. New Delhi. pp 301-309.
Rawat AK, Khatik SK, Rao DLN, Saxena, AK (2008) Soybean rhizobial inoculants survey in Madhya Pradesh. All India Network Project on Biofertilizers Bulletin, JNKVV, Jabalpur, pp 33.
501

Winter School on “Waste recycling and resource management”-Dec. 3-23, 2014
Rawat AK, Rao DLN, Sahu RK (2013) Effect of soybean inoculation with Bradyrhizobium and wheat inoculation with Azotobacter on their productivity and N turnover in a Vertisol. Archives of Agronomy and Soil Science 59: 1559-1571
Reddy KS, Mohanty M, Rao DLN, Rao A S, Pandey M, Singh M, Dixit SK, Dalal RC, Blamey FPC, Menzies NW (2013) Farmer Involvement in the Development and Adoption of Improved Nutrient Management Technologies Using the Mother–Baby Trial Approach in Vertisols. Proceedings of the National Academy of Sciences, India Section B: Biological Sciences, 1-12. DOI 10.1007/s40011-013-0243-1
Sharma SK, Sharma MP, Ramesh A, Joshi OP (2012). Characterization of zinc-solubilizing Bacillus isolates and their potential to influence zinc assimilation in soybean seeds. Journal of Microbiology and Biotechnology 23: 352-359.
502