wine cluster competitiveness in south australia and ... · south australia and piedmont (italy):...
TRANSCRIPT

Wine Cluster Competitiveness in
South Australia and Piedmont (Italy):
Strategies to address challenges resulting from the
Global Financial Crisis
Mr Francesco Spinoglio
Polytechnic of Turin Intern
Supervisor Adj. Prof. Nicola Sasanelli AM
State Development- Office of International Coordination
January 2013
1

2
Acknowledgments
The success of this report has been the result not only of my work, but also of others who
have helped me with the challenges that arose.
The first person that I would like to thank is Ms.Desi Angelis. I have always said to her:”
without you this experience would have been different”.
This work would not have been the same without Professor Kym Anderson, from the
University of Adelaide, Professor Larry Lockshin, from the University of South Australia,
Kym Teusner, entrepreneur from the Barossa Valley, Peter Hackworth, from the Wine
Grape Growers Council of South Australia and Paul Henry, founder of Winehero, a
marketing consultancy. Their opinion and their experience enhanced my knowledge in
this field and allowed me to have a greater understanding of the South Australian wine
industry dynamics.
A huge thank you to my colleagues from the Department of Premier and Cabinet and in
particular, Corey Ogilvy, for his infinite patience and help with every problem, no matter
how small. Thanks also to David Flores and Emmanuel Santos for the help they gave me
regarding economic issues and for the great times we shared.
Further, Andrea Dal Betto, Annalisa Leuzzi, Marco Sebastianelli and Federica Querin
contributed to making the internship in the DPC enjoyable and gave me important
suggestions during my research.
Last but not least, many thanks go to the Adj. Professor Nicola Sasanelli for all the
opportunities and guidance that he has given me during the past three months
Francesco Spinoglio
3

4

Table of contents Abstract ...........................................................................................................................................7 Introduction.....................................................................................................................................8 1 Overview on wine sector..............................................................................................................9 1.1 Why the Piedmont and South Australian wine sectors? .............................................................9 1.2 The product: Wine ....................................................................................................................10
1.2.1 Information asymmetry and quality signal strategies ........................................................10 1.2.2 Signal strategy in Europe: the appellation of origin system ..............................................12
1.3 World wine data at a glance......................................................................................................14 1.4 Wine Business at a glance ........................................................................................................16 1.5 Italian and Australian Wine Industry at a glance .................................................................16
1.5.1 Italian Wine Industry .........................................................................................................18 1.5.2 Australian Wine Industry (AWI) .......................................................................................19
1.6 Strategic positioning in wine sector..........................................................................................21 2 Cluster Theory Literature.........................................................................................................24 2.1 From the concept of district to the concept of cluster...............................................................24 2.2 Main actors involved in a cluster ..............................................................................................27 2.3 Several Cluster Models.............................................................................................................28
2.3.1 Porter’s Diamond...............................................................................................................28 2.3.2 Triple-Helix Model. ...........................................................................................................30 2.3.3 Markusen’s Models............................................................................................................31
2.4 Wine Cluster Map.....................................................................................................................32 2.5 Cluster Analysis Model ............................................................................................................33 3 Add-Value creation in South Australian Wine Cluster..........................................................34 3.1 South Australia data at a glance................................................................................................34 3.2 South Australian wine cluster area ...........................................................................................35 3.3 Overview on SA wine growth in the last two decades .............................................................37
3.3.1 Data of the growth .............................................................................................................38 3.3.2 Key aspects of the export growth.......................................................................................39
3.4 The South Australian Wine Cluster Diamond ..........................................................................42 3.4.1 Factor Conditions...............................................................................................................42 3.4.2 Firm, Strategy and Rivalry.................................................................................................44 3.4.3 Related and Supporting Industries .....................................................................................47 3.4.4 Demand Conditions ...........................................................................................................48
3.5 Sustaining a Competitive Advantage within the SA wine cluster ............................................50 3.5.1 Collaboration (horizontal and vertical) ..............................................................................50 3.5.2 Innovation System: the actors............................................................................................53
5

3.5.3 Marketing...........................................................................................................................57 4 Add-Value creation in the Piedmont Wine Cluster ................................................................62 4.1 Piedmont data at a glance .........................................................................................................62 4.2 Piedmont wine cluster area .......................................................................................................64 4.3 The Piedmont Wine Cluster Diamond......................................................................................66
4.3.1 Factor Conditions...............................................................................................................66 4.3.2 Firm, Strategy and Rivalry.................................................................................................67 4.3.2 Related and Supporting Industries .....................................................................................71 4.3.3 Demand Conditions ...........................................................................................................72
4.4 Sustaining a Competitive Advantage within the Piedmont wine cluster ..................................73 4.4.1 Piedmont’s Research & Development System ..................................................................73 4.4.2 Terroir as added-value in Piedmont wine marketing.........................................................78
5 Challenges facing South Australia and Piedmont after the Global Financial Crisis...........81 5.1 Challenges facing the SA Wine Cluster....................................................................................81
5.1.1 Unsustainable unit margin for commercial-premium wine ...............................................81 5.1.2 The Oversupply..................................................................................................................84
5.2 Challenges facing the Piedmont Wine Cluster .........................................................................87 5.2.1 Macroeconomic issues .......................................................................................................87 5.2.2 Management issues ............................................................................................................88 5.2.3. Industry structure issues....................................................................................................90
6 Suggestions to the South Australian and Piedmont wine clusters.........................................92 6.1 South Australia .........................................................................................................................92
6.1.1 Promoting the Geographic Indication System (GIs)..........................................................92 6.1.2 Taking advantage of currency appreciation.......................................................................93 6.1.3 Diversify distribution channels ..........................................................................................93 6.1.4 Consolidation into new markets and diversifying international markets...........................94 6.1.5 Cooperation between grape growers and wine producers .................................................94 6.1.6 Incentive for grape growers ...............................................................................................95 6.1.7 Exploiting growth in the domestic markets. ......................................................................95
6.2 Piedmont ...................................................................................................................................96 6.2.1 Building strategic visions within small enterprises ...........................................................96 6.2.2 Exploit export opportunities ..............................................................................................97 6.2.3 Investment marketing ........................................................................................................98 6.2.4 Cooperation within the Piedmont Cluster actors ...............................................................99
Findings and conclusion .............................................................................................................100 References....................................................................................................................................104 List of Interviews ........................................................................................................................108 Annexes........................................................................................................................................110
6

Abstract The aim of this report is to discuss the current issues resulting from the Global Financial
Crisis (GFC) in the wine sector within the South Australian and Piedmont wine cluster.
Moreover, it will emphasise the importance of the industrial cluster as a structure that has
a competitive advantage over the other actors involved.
This report begins with an explanation of the product considered and describes the
difficulty in adopting marketing strategies due to the nature of the product itself.
A review of the wine industry has also been prepared in order to better understand the
business models and the strategic positioning adopted by companies in the industry.
Following this, a literature review about the cluster theory and associated models
developed by key economists will be presented, focusing on wine clusters.
Taking cue from the Porter Diamond model, a qualitative analysis of the two clusters
was undertaken. As a result of this analysis, the main element that was determined was
that it created add-value for all the companies involved within both cluster systems.
Following this, the report will then analyse the challenges resulting from the GFC that
need to be addressed by companies in order to remain competitive.
In the final chapter, several suggestions useful to tackling the current challenges are
described. These are based on the author’s personal reflections of the analysis undertaken
and also on the opinion of several experts.
Keywords: Cluster, Piedmont, South Australia, Wine Industry, Global Financial Crisis
7

Introduction The global wine industry is changing at a rapid pace. During the last three decades, due to
the globalization of the markets and the presence of new international competitors, the
wine industry dynamics and the wine markets have changed and the companies have had
to address new challenges in order to remain competitive.
Overlooking the European countries such as France, Italy and Spain, new worldwide
competitors have emerged: Australia, USA, Chile, Argentina and South Africa represent
the main wine competitors and their ability to address new market trends makes them
competitive all over the world. The great influence that they have had on the global
market has led to scholars referring to them as the New World competitors, as opposed
to the Old World competitors represented by European countries.
Today, new changes are taking place as the result of the GFC in both Old and New
World competitors. This has meant that wine industry dynamics have been changing and
wine companies have been introducing innovation to their businesses and developing
new strategies to remain competitive.
Two different environments will be analysed in this report: the South Australian and the
Piedmont wine cluster.
In the framework of the existing collaboration between the Polytechnic University of
Turin and the Office of International Coordination within the Department of the Premier
and Cabinet, a strategic analysis of the wine sector in South Australia and Piedmont has
been developed.
8

9
1 Overview on wine sector
1.1 Why the Piedmont and South Australian wine sectors?
The decision to analyse wine sectors in South Australia (SA) and Piedmont was made for
several reasons:
• the wine sector in these two areas represents a perfect case of study about clusters
due to an interlinked network that this sector was able to create.
• Piedmont is representative of the Old World Competitor, while SA is
representative of a New World Competitor.
• The wine sector represents an important industry for the economy of the two
areas considered: in Italy, differently to manufacturing industries as they are
struggling to maintain their competitiveness in Italy due to the Far East cost
advantage, the wine industry is still a strong industry and may still represent a
competitive advantage even globalization and the GFC. About South Australian
wine industry, it demonstrated an incredible capacity to follow the international
market trends that led the country to become competitive in the last two decade.
SA represents the most important state of Australia within the wine sector,
particularly in terms of wine production, overseas exports and most famous
Australian wine regions.
• In both of these areas, the start of a new business growth occurred in the middle
of 1980: from 1986, to address “the methanol crisis1” in which Piedmont was
involved, the wine industry began to work in order to give trust and reputation
both in the domestic and international market. This date corresponds to the start
of a new era in South Australia as well: that is when the UK Masters of Wine
went to Australia to taste and tell the world about a goodness of Australian wines.
Moreover, wine critic Robert Parker played an important role in promoting
Australian wine within his books where he praises the taste of Shiraz from South
Australia.
• Both South Australia and Piedmont wine industry is composed by a majority of 1 In March 1986 the methanol wine scandal broke in Italy in March 1986. A network of unscrupulous traders used methanol to change the alcoholic proof of wine. The scandal had catastrophic consequences: more than twenty dead, tens of people poisoned.

micro and small enterprises.
• It’s absolutely meaningful to compare Piedmont and South Australia even though
the first is a region of Italy and the second is a state of Australia: arguing the wine
sector, several data demonstrates the reason of this comparison (Annex 1).
1.2 The product: Wine
Wine is a product worthy of interest in several aspects. Not only due to its historical,
cultural and social implications, but also due to its unique properties, partly due to alcohol
content, this has often been the focus of political and scientific debate. From an economic
point of view, the implications of the wine market are also numerous and worthy of
interest.
For centuries, wine has had the characteristics of a commodity, while today we are
witnessing a transformation of its functional use: wine is more tied to pleasure and
socializing and less relevant to nutrition and often wine is considered a luxury good.
From this change in the function of wine, in all countries, the demand is shifting towards
medium-high quality products, also understood as food security and this is a growing
concern for consumers. This process of evolution "from quantity to quality", is perfectly
exemplified by the wine market and is typical of many other foods.
Wine is one of the more complex categories. The number of variants of product (SKUs)
of the wine is significantly higher than that of other beverages or foods, due to the number
of attributes that define it and to the many facets of each attribute.
To increase the complexity and differentiation of wine, the diversity between techniques
of cultivation and production and consumption patterns are contributed. Nevertheless,
globalization is affecting the production of wine in recent decades. In this sense, the wine
markets provide an interesting case of ongoing globalization, of which it is possible to see
the stages and consequences (Hertzberg, 2008).
1.2.1 Information asymmetry and quality signal strategies
It is impossible to know the quality of a commodity before it has been purchased, which
then generates a situation of information asymmetry between the producer and the
consumer. The cost and the possibility to get information about the quality of goods leads
to distinguishing three different types of goods: search goods, experience goods and
10

credence goods (Nelson, 1970). The search goods indicate that it is easy to know about
the quality of goods before the purchase, while experience and credence goods represent
the goods where the quality is unknown before the purchase. Moreover, with credence
goods it’s also not possible to know the quality after the purchase. Wine is a typical
experience good because wine can only be tasted after purchase. The imperfect
information that characterizes this type of good leads to two economic problems:
• moral hazard;
• adverse selection.
Moral Hazard Moral hazard occurs when the party with more information about its actions or intentions
has a tendency or incentive to behave inappropriately or take advantage from the party
with less information. In the wine sector, since consumers do not know the real quality of
the wine, the producers, who have more information, might behave inappropriately (moral
hazard behaviour) selling low quality wine as premium wine. The honest producers may
face difficulties in competing against those who adopt opportunistic behaviour, resulting
in a general lowering of the quality of the offer.
Adverse Selection Adverse selection, due to the lack of information can cause consumers to buy goods of
inferior quality, as consumers tend to buy products sold at the lowest price. In other
words, the buyer cannot observe the quality and therefore is willing to pay a price
corresponding to the average quality (expected) of the products offered. This result is
excluded from the market of high quality manufacturers. The repetition of this mechanism
in the long run may lead to the disappearance of the market for the good (Akerlof, 1970).
The problem disappears when the consumer becomes aware of the quality of the product
through experience. A solution to information asymmetry is to provide information to
consumers (the uninformed) through the use of quality signals (Hertzberg, op.cit.).
There are several ways to signal the quality of the wine industry that may be firstly
clusters such as the following:
• private brands, focus on marketing campaign and advertising;
11

12
• country or region of origin, focus on the importance of the ‘terroir2’;
• vine‘s variety, that represents an easier way to give information to consumers.
In correlation with the second alternative, there is the appellation of origin system that
represents a kind of signal strategy based on the specific area of origin. Nevertheless the
system of appellation of origin is only used by the EU member states, while in the other
part of the world, this system does not exist.
Through investing on building a strong brand, a company can gain a reputation that is a
source of profit in the long term. For the seller it is not beneficial to behave
opportunistically to make a profit in the short term, as it risks losing not only deceived
customers, but also its reputation, that is capital. So that, the cost of investments needed to
build a reputation becomes an incentive to maintain a certain quality standard. At the
same time, consumers are willing to pay a premium for the brand, as it reduces search
costs and risk and simplifies the decision indicating the positioning of the product
(Shapiro, 1983).
The vine’s variety is another important factor in the choice of wine, overall in the New
World, where it is used as a brand (Jarvis et al., 2003) and is a key choice that is easy for
the inexperienced consumer because, it combines the taste of wine, cross country, types of
stores and price ranges (within certain limits).
It is useful to review the Europe system in terms of appellation of origin, in order to
understand their importance.
1.2.2 Signal strategy in Europe: the appellation of origin system
The imposition of quality standards, through the mechanism of appellation of origin, is
an effective solution to the problem of asymmetric information, particularly felt in the
wine market. This mechanism allows a reduction in the cost of searching for information
by the consumer and a surplus for the producer to fulfil the standards of quality, ensuring
its typicality and its uniqueness (Malorgio and Grace, 2006).
2 As a first approximation, terroir is defined as the complete set of local (natural and non‐man controlled)
conditions in which a particular wine or family of wines is produced, including soil type, weather conditions, topography and wine-making skills. The concept of terroir will be discussed later expanding this definition.

European law distinguishes wine by two broad categories: quality of wines produced in
specified regions (quality wines), subject to specific production rules, and table wines.
In Italy, the appellation of origin system, mainly governed by Law no.164/92, introduces
further classification. Table wines are divided into:
• Table wine, wine consumption that has no specific qualitative characteristics.
The label cannot report the name or geographic area origin, or the vines of the
grapes that compose it. Usually the wine may be the result of or a blend of a
cut, with grapes or wines from different geographical areas, varieties and / or
vintages.
• Wine IGT, ‘Indicazione GeograficaTipica’, which has a production and must
derive at least 85% of the geographical area whose name it bears, moreover it
can include the exact name of the grape variety and vintage.
The wines produced in specified regions are divided into:
• Wine DOC, ‘Denominazione di Origine Controllata’, whose entire production
cycle must comply with the rules of production, the wine doc is also subjected
before marketing to chemical analysis and special body quality controls
("tasting fees"), at the Chamber of Commerce.
• Wine DOCG, Denominazione di Origine Controllata e Garantita’, which must
satisfy stricter rules than the doc and pass additional quality controls before
bottling.
To make the denomination of the origin of wine recognizable, a pink or green strap is
placed on each bottle. To get the appellation of origin, a wine should respect several
boundaries: the maximum yield of grapes for hectare, the area of production, the yield of
transformation of grapes into wine, the alcoholic strength minimum natural alcoholic
strength of the consumer, the vineyards from which they can obtain wines, physic-
chemical characteristics, oenological practices and other technical parameters. The
denomination of origin is closely linked to the concept of terroir and demonstrates its
importance in the Italian wine sector. The number of wine with denomination of origin is
often used as a proxy of quality level production of each Italian region.
For wines with a higher level of quality, there are two possible strategies: adherence to an
appellation of origin or choice not to join any denomination or collect a mention that is
not to submit to the rules of production rules, considered to be too restrictive.
13

In the first case, you can enjoy the benefits of a brand that indicates the quality of the
product, sometimes supported by promotional consortia.
In second case, manufacturers may use innovative techniques or grapes not permitted by
the discipline and can also get high quality products, which are placed in brackets
DOC or DOCG wine prices. The decision to operate outside the areas of those names
should be supported by a name or trademark strong enough in the market to hold its own
against the competition, or alternatively by price low enough to not be in competition
directly with quality wine and IGT (Hertzberg, op.cit.).
1.3 World wine data at a glance
For the year 2010, as the OIV data show, the worldwide vineyard area was estimated at
being 7,585 million hectares (mha) (-14.89% over the average of the years 1986-1990).
Nevertheless, it may distinguish two different trends: the growth areas devoted to
viticulture in some countries outside Europe, the decline occurred in the European
Union, as a result of measures of a political nature and the contraction in consumption.
As the Institute of Service for the Agriculture Market (Ismea) estimated in 2011, Italy is
the third country with 652,000 hectares (ha), while in its latest vineyard survey (2011);
the Australian Bureau of Statistics (ABS) estimates that 160,300 ha are cultivated for
wine grapes in Australia.
During the 1980’s, the production of wine worldwide saw a decreasing trend, mainly as a
result of the decline in European production and consumption. From the 1990’s, world
production of wine swung from around 260 to 280 million hectolitres (mhl), in exception
of a peak at 300 mhl in 2004. In France and Italy, two of the leading wine producers in
the world, the decline in production lasted until the beginning of the new millennium,
after which the volumes produced by both countries was maintained between 45 and 55
mhl. However, globally, the trend has stopped decreasing since the beginning of the
1990’s because of the negative effect of the two leading countries was offset by the
increase in production from some countries, mainly outside Europe, such as Australia,
Chile, China, the United States, but also Spain (OIV, from 2004 to 2007).It is important
to note that the first three countries (France, Italy and Spain) represent near 47% of the
world’s wine production. Among the new competitors stand the United States,
14
Argentina, Chile and Australia that are close to the three European countries with a
production approaching 20%.
Both Italian and Australian production is following a negative trend from 2006: in Italy
the production was nearly 40 million hl in 2011 (-22%), while the Australian production
was nearly 11 mhl (-20%) (OIV, 2012).
The worldwide consumption of wine was greatly reduced from the mid-eighties and the
mid-nineties, when it reached 223 million hl. Since then, it is possible to identify a
positive trend, albeit slowly, and this has led to reach 241mhl in 2010. In 2005, the
European Union with 15 member states accounted for 54% of global consumption (OIV,
2007).Italy and France are the first consumer countries in absolute terms and consume
almost a quarter of the wine consumed in the world. In these countries, as well as in
Spain, the last thirty years the demand was subject to a sharp contraction, which is now
very slow or almost stopped. It has led to a decrease in consumption worldwide.
However, the fall in consumption in Europe was offset by rising consumption in
emerging markets, especially in USA, Australia and South Africa. To underline the
growth in consumption in China, which in recent years are the markets with the highest
growth rate: from the years 2000 to 2010, is grew near 50% (OIV, 2012).
International trade in wine, understood as the sum of exports from all sources, have been
growing for the past fifteen years. While in 1998 their average volume was 65mhl,
corresponding to near 38% of global production, during 2011 international trade had
reached nearly 100 mhl of the total world exports corresponding to near 50% of global
production (OIV, 2012). The growth of export propensity has covered all the major
manufacturers. In the countries of the Old World, due to the decrease in domestic
consumption, it have been necessary to divert their wines to new markets, while the
producers of the New World have always had as strategic goal the “conquest” of foreign
markets. In absolute terms, the largest global exporters are still France, Italy and Spain,
respectively, with shares of world exports equal to 19, 18 and 18% by volume and 19, 35
and 10% in value. Australia is the fourth largest exporter in terms of volume (OIV,
2012). The main importers of wine are countries with developed economies, with a small
production or not enough to cover the demand. The most important markets are
Germany, respectively, the United Kingdom and the United States, where it meets 41%
15

of the imported wine globally. It is important to underline the rate of growth in China
(+31%), representing one of the most attractive markets for the future (Ismea, 2012).
1.4 Wine Business at a glance
The wine business presents several intrinsic characteristics, whereby all the wine
producers and grape growers have to cohabit.
• A winery is a very capital-intensive enterprise due to the high initial investment
and the lagged cash flow associated with the time between the purchase of the
grapes and initial wine sales. In fact most new winery operations are forced to
seek debt capital. For these reasons, the wine industry is characterized by both a
high barrier of entry and a high barrier of exit.
• The wine business is characterized by high fixed costs concerning the grapes and
the vineyard’s management: it is not possible to change the cultivation of a vine in
the short term and removing and growing another vineyard means losing profit
during the year until the new vineyard produces wine (almost three years).
• Cash flow is not regular during the year and therefore, there is a period of high
expense and low revenue.
• The wine business is intrinsically linked with natural factors: each year differs
from the previous one and this is an exogenous aspect that influences both the
quality and the volume of the product. This aspect causes the wine industry to be
very volatile from year to year.
1.5 Italian and Australian Wine Industry at a glance
The first aspect of the Italian and Australian Wine Industry is the vast difference in terms
of industry concentration. As it is highlighted in Fig.1, the Italian industrial structure is
represented by a majority of small enterprises and even where there is a presence of
medium and large enterprises, their market share is not significantly high. Instead, in the
Australian industry, even though it is composed by a majority of small enterprises as
well, their market share represents only 38% and the first four firms represent more than
60%.
16

Fig.1 Share of four largest wineries in sales, selected countries, 2009
Australia Italy
Largest firm 23 6
2nd-4th
largest 39 4
Rest 38 90
Source: Anderson, 2010
This difference not only concerns Italy and Australia, but there is also a difference
between New World competitors, with large, multinational firms that have a high market
share, and Old World competitors, that have a fragmented market share. Nevertheless,
Italy presents one of the most fragmented wine industries in Europe, second only to
Germany.
Another important aspect is the legislation governing the provenance of wine grapes. As
discussed in the previous chapter, in Italy, as in all European countries, there is the
system of Appellation of Origin. Only where the grapes used for a specific wine fall
within a delineated area, can the wine be assigned the appellation of origin.
In Australia, the legislation concerning the appellation of origin, is less restrictive and
wine from a specific wine region can also contain grapes that were not cultivated in that
same region. The Geographic Indication system, established in 1993, officially
recognizes the Australian wine region, but the roles are not as strict as in Europe: for the
wine to be considered as being made in a specific region, 85% of the grapes must be
cultivated in that region. However, there are no limitations or rules regarding the
packaging, wine-making process or the yield per hectare. Another important difference is
that in Italy, the wine-making process must be in the territory of the grape provenance,
while in Australia this is not required. Australia wine companies therefore have some
significant advantages in terms of efficiency through:
• reaching economies of large scale and scope, utilizing one big plant to several
production;
• reducing logistic costs, positioning their plants in strategic locations.
17

18
1.5.1 Italian Wine Industry
The wine industry in Italy is characterized by several aspects that could be acknowledged
as clusters as follow:
• Heterogeneity of the regions. Even they are subject to Italian and European
agriculture laws and reforms, each region could be considered and analysed
separate in terms of industry, market and Institute of collaboration. The varieties
of vine cultivated, the marketing strategy, the research and development bodies
are often linked more with their specific region than with the whole country.
• Extreme industry fragmentation. The average size, both in terms of cultivated
surface, both in terms of production and wine making are quite small (Fig.2). The
surface of the vineyard for 74% of wine not exceeding two hectares, 81% of the
winery produces less than 100 hl of wine per year. The weight of the top five
companies in the Italian wine industry in terms of national turnover is 5%,
demonstrating a low concentration at the national level. The total number of
Italian wine enterprise is 164,554 in 2008, in which Apulia, Sicily and Piedmont
represent the three regions with the largest number3.
Fig.2 Italian Production 2012
Source: Ismea 2012
• Heterogeneity of the companies. In Italy there is a myriad of family owned firms,
companies with a juridical structure and also companies quoted in the trade,
demonstrating a wide range of different companies’ structure. Nevertheless, the
majority is represented by sole proprietor’s enterprises, the simpler juridical 3Unioncamere, 2009

19
structure, with a perceptual of 92.8% in 2008.
The fragmentation that characterizes not only Italy, but also all other European countries,
is an obstacle in achieving the critical mass necessary to have the volume and bargaining
power required to compete in global market. On the other hand its fragmentation enables
the maintenance of a wide variety of techniques and practices preventing homogenisation
that is occurring for other global products.
Nevertheless, the situation is complex: micro and small companies coexist with large
operators, such us grape growers with over 10 mha of vineyards and wineries that
produce more than 50 mhl annually. These wineries are able to exploit economies of
scale, play an important role on the international market and maintain relations with
national and international retailers and supermarkets and also with wholesalers that
supply boutique and Ho.re.ca4 sector.
The thousands of family-run businesses in the Italian territory often lack skilled
management, showing very limited knowledge of the market without being able to
understand the industry changes and new opportunities. This typically romantic vision of
the product 'wine', leads the small Italian companies to base their business in the
domestic market, often regional, without changing their strategic positioning or their
production addressing the changing international markets.
As a result of the onsite presence of differing stages of the production process and a
region with loyal clientele, these small businesses remain alive although they don’t make
any significant margins (Aimone et al., 2001).
However, there are several examples of small Italian firms that make the international
channel their primary sales channel following the trend of the international market and
basing their business on exports.
1.5.2 Australian Wine Industry (AWI)
As the other New World competitors, AWI have developed in recent years, precisely
from the eighties. In fact during this last three decade the industry growth was
impressive: from 506 wine producers in 1985 to 1,197 in 2000, with a growth rate of
130%5.
The Australian world wine business growth is the result of a deliberate strategy, the 4 Hotel/Restaurant/Cafeteria 5www.winebiz.com.au/statistics

20
result of planning a gradual penetration into foreign markets through the creation of a
brand-country (Wine Brand Australia). The combination of a series of events and
conditions (favourable exchange rates, the internal situation of overproduction, limited
wine consumption at the household level, cultural affinity with the U.S. and UK markets)
means that Australia identifies the Anglo-Saxon markets as the potential pool of
absorption of wine and undertakes a path of international growth based on exports.
In 1996, the most important body within the Australian wine industry, the Australian
Wine and Brandy Corporation (AWBC), now called Wine Australia developed a
strategic plan for the entire wine sector (Strategy 2025) now called “Vision 2025” as a
twenty-five year plan to undertake in affirming the country's wine industry in the global
competitive landscape. The following sentence, as Strategy 2025 explains, shows its
mission:
“The vision is that by the Year 2025 the Australian wine industry will achieve $4.5
billion in annual sales by being the world's most influential and profitable supplier of
branded wines, pioneering wine as a universal first choice lifestyle beverage”
The number of Australian wine producers listed in the Wine Industry Directory stood at
2,532, up from 2,477 at the end of 2011 (ABS). Accounting for closures and mergers, the
AWI showed a net gain of 55 wine producers in the year 2011, an increase of 2 per cent
from the previous year.
Currently, the structure is highly concentrated (especially compared to Italy’s Industry
dominated by micro-enterprises and small and medium size) with the first twenty-one
wine producers with 86%6 of total Australian production. Nevertheless, the industry has
a bipolar configuration in about 91% of companies that fall into the category of small
and medium-sized (Zanni et al., 2006). Despite the plethora of competitors, however, the
Australian Wine Industry is oligopolistic in structure. An industry is oligopolistic when it
yields a concentration ratio—the percentage of market share owned by the largest four
organizations in an industry—or greater than 40 per cent (McConnell and Brue (1993)
cited in Freeman, S., Weinman, D., 2000).
In fact, in Australia operate different national groups that have most of the market share
and differentiate their products not only in the wine market, but drinks in general: the
case of multinationals such as Pernod Ricard, Foster’s Group Limited, and Constellation 6 ibid

Brands, who develop their market especially abroad. Moreover these multinational
groups have plants and facilities in the USA and in Europe where they are able to
differentiate their risk and not depend only one market (Zanni et al., op cit.).
In spite of this big company, that own several brands and several wineries, there are
small enterprises with mono brands and mono plants that follow two different strategies:
• basing their business on the domestic market
• Export business model taking advantage by the market openness made by big
Australian companies.
1.6 Strategic positioning in wine sector
While wine is one of the world’s oldest commodities, the systemic organization,
infrastructure, packaging and marketing of this commodity is more recent (Alyward,
2006 p.4). Over the last thirty years, the world wine market has undergone profound
changes due to globalization, which have changed the structure of production and
organization. They have changed the range of products, the dynamics of international
trade and the marketing channels, as well as demand and consumer expectations. The
industry is moving away from its connotation predominantly agricultural and is
increasingly becoming an important industry, characterized with high levels of
competitiveness. Moreover, the consumption itself changed, such as moving the
preferences towards quality products and increasing market segmentation.
Adding to the globalization phenomenon, there have been several aspects contributing to
these changes, which involve:
• the ascent of the wines produced in countries where this industry has developed
only recently,
• the increase in consumption in New World countries
• the reduction in countries that historically are heavy users.
Often the new competitive landscape is interpreted on the basis of the dichotomy
between countries of the Old and New World wine (Anderson, 2004). This interpretation
however risks oversimplifying a complex and articulated wine industry context. It may
be more correct to recognize instead a confrontation between a group of companies
(located in the Old and New World), pursuing the "marketing oriented strategies”, and
companies that are remained anchored to a self-concept of quality and with insufficient
21

attention to demand and customers (Pomarici, 2005).
Wine competition is not only played in the national market, but in the global market. To
address this situation, firms have adopted new strategies that lead to processes of
concentration and internationalization, to exploit economies of scale and scope, in
production as well as in the distribution. The large enterprises are advantaged compared
to those of smaller dimensions, especially for wines belonging to the lower price ranges,
where the low margins make a cost differential discriminatory factor. Nevertheless, small
enterprises often base their business in the domestic market, but still play an important
role in a high quality product, particularly due to the interest of consumers towards
quality and origin (Pomarici, 2005).
Another factor that is helping to strengthen large companies is the high change in the
distribution structures of consumer goods, which include also the wine. The share of
sales of wine passing through the large-scale distribution today is near 60% (Federvini,
2012) in all Western countries. Therefore it becomes important to have the tools and
skills to supply it and to negotiate with it.
This changing environment has naturally enhanced competition and many firms have
made significant strategic, structural and competitive changes; gradually forming three
distinct types of wine firms (Vrontis et al, 2008):
• Global enterprises: active in all segments of the beverage industry. They
represent multinational group involved in different markets with different goods.
• large national wine enterprises: focused on wine production and operating in an
International context; they represent companies pursuing to obtain a market share
not only in the domestic market but in exports as well.
• SMEs with niche strategies: often their business is based on domestic market in
Old World competitors, while is based on also in export in New World
competitors.
The following scheme (Fig.3) illustrates the industry dynamics in the wine sector and
how the different companies are positioned within the market. However, it is only
indicative and there is no reason to think that each category could be positioned
differently.
The Scheme is formed by two Cartesian axes; the horizontal axis refers to the amplitude
of the horizontal market in which firms operate (from local to global), the vertical axis
represents the greater or lesser content of typical products, especially in relation to their
22

23
region of origin. The grey background represents the area of market, and would highlight
the two main evolution opportunities that companies can pursue.
Micro enterprises that produce typical and high quality wines, usually base their business
in the domestic market, given their low capabilities to meet the initial costs to be
competitive in the export market (marketing, knowledge of market trends and relation
with the distributor)7. Medium and Large Enterprises and Multinational groups are
usually able to compete both in domestic and international markets, taking advantage of
the globalization process and differentiating their revenues. Finally, small enterprises’
business is more based on local market, but some of them are also involved in
international exports.
Fig.3 Industry dynamics in wine sector
Source: Author’s elaboration
7Interview with K. Anderson

2 Cluster Theory Literature
2.1 From the concept of district to the concept of cluster The terms “clusters” and “industrial districts” are often used interchangeably although
they actually cover two distinct concepts. The concept of industrial districts stems from
Marshall’s work (1890), where the author argued that the dynamics of firm geographical
concentration leads to growth and organisational developments, enabling firms to reap
external scale economies. The ‘Marshall’ industrial district model emphasises the benefits
deriving from economic and business linkages. The concept of industrial districts was
introduced by Alfred Marshall in his Principles of Economics in 1890, which was aimed
at interpreting the shapes organization of the second industrial revolution. Marshall
focuses on the benefits offered by the division of labour, introduced into large enterprises
– which are vertically integrated - and operated at the local level with many small
companies specializing on the production itself. The advantages of large scale production
were already known with the term of economies of scale, while the justification of the
advantages that small businesses can obtain in the absence of large-scale production is
one of the many results that the analysis of Marshall provides: it outlines the concept of
external economics: the benefit generated by the territory concentration of more firms.
This concept links the reduction in the cost of production and new opportunities for
growth by exogenous shocks to the company, thus recognizing the role of the social and
institutional environment where the company is located. The territory is enhanced by
social and institutional variables, in addition to normal natural and geographical variables.
Marshall uses the term ‘industrial districts’ to describe the tendency of competitive firms
in similar industries to be located in the same geographical area and the advantages of this
type of location organization. This form of cluster is different from the concept of urban
agglomeration, which refers to companies from different fields located in the same urban
area, because companies are performing similar or interconnected activities.
Moreover Marshall noticed that production was not distributed evenly across the country,
but had a tendency to be located in a relatively small number of cities and that those
producers who were not located in these cities did not perform as well as those that were.
So instead of focusing on the individual location of firms relative to other factors as the
24

traditional location economists had, he changed his research focus towards the direct
benefits of co-location of firms and his model does not take into account the social
relations between cluster members.
That is why Marshall is usually cited in literature as the first to acknowledge the
connection between economic productivity of firms and business results with regard to
the location and proximity of economic actors.
Yet, from the pioneering contributions of Marshall, the importance of the socio-economic
aspect was emphasised, rather than the value-engineering on the industrial division of
work to external economies of agglomeration, the flow of information between the actors,
accumulation of tacit knowledge. Such a broad definition facilitates the empirical
application to many analyses carried out on Italian industrial districts, and opened a
theoretical debate that generated additional contributions from authors during the 80s and
90s. Marshall identified three overall sources, which were fostering spatial cluster
formation through increasing returns to scale in the long run that were caused by
economies of specialisation:
• Knowledge spill-over- Knowledge is generally believed to flow more easily
between local players than over longer distances. This influences the local inter-
firm cooperation.
• Labour pooling- Labour pooling benefits present and attracting new firms to a
certain geographical area. Pooling of labour is generally argued to have two types
of advantages: Knowledge transfer and improvement of industry skills.
• Cost advantages - The extended division of labour benefits the level of
specialization and leads to increased inter-firm cooperation with extensive activity
links and resource ties. Enhanced cooperation through sharing resources might
lead to sharing the cost of innovation.
Considering now the cluster concept and see its links to the industrial district. For many
economists the concept of clusters is the simple review by the international literature the
concept of industrial district, on the other hand, another school of thought gives the
cluster its own accurate identity and represents a form of evolution of the concept of
industrial district (Cooke, 2006)
It was with the study conducted by Michael E. Porter, regarding the competitive
advantages of nations, where the cluster concept became a subject of intense research and
economic analysis. Porter broadened the theories based on Marshall’s localisation
25

economies and described the cluster as an economic phenomenon that is placed in a
competitive environment, in which many businesses simultaneously compete and
collaborate to gain different economic advantages.
He defines clusters as "geographic concentrations of interconnected companies and
institutions in a particular field"(Porter, 1998) and he emphasizes two characteristics that
set clusters apart from industries or supply chains. First, the firms and organizations that
are part of a cluster usually belong to different industries that are related to each other,
and second, clusters may embrace downstream sales channels, suppliers of various
complementary products and services, as well as government agencies and non-profit
organizations that are useful for the core firms of the cluster.
So Porter’s analysis adds the process of innovation to the economic relations and flow of
goods that takes place inside the cluster through the transfer of information, know-how
and experience. After Porter, Morosini gives another important definition of clusters by
describing it as a socioeconomic entity characterized by a social community of people and
a population of economic agents localized in close proximity in a specific geographic
region (Morosini, 2004).
The difference between the meaning of district and cluster may be summarized as
follows. In the industrial district, more importance is given to the physical proximity,
which promotes the exchange of information and goods, and the presence of strong
institutions and social recognition that generates external economies for the benefit of
local businesses. In contrast, the clusters represent a geographical concentration of
enterprises operating in the same supply chain, more than in the same industry, and
having therefore strong vertical links between them. These are generally represented by
subcontracting between one or more leading enterprises and induced a plethora of small
business suppliers. The relationship between the firms in the cluster is less complex than
those of district firms, and physical proximity is less accentuated, all to the advantage of
long networks of global collaboration. So that, the globalization of sources of supply of
factors of production can be more easily inserted into the cluster concept, compared to the
traditional concept of district, historically linked to the "industrial roots" local.
26

2.2 Main actors involved in a cluster
It is possible to identify four main categories of players that are vital and usually needed
to start a cluster initiative and this includes:
• Companies
• Governments
• Financial Institutions
• Centres of Research
In addition to this, players have an important role where they formally or informally
promote interest in the cluster initiative amongst players involved. The term for this
description is called Institutions for Collaboration (IFCs):
• Chamber of Commerce
• Industry Associations
• Professional Associations
• Trade Unions
• Technology Transfer Organizations
• Quality Centres
• Think-Tanks
Connections amongst cluster players are characterised by simultaneous competition and
cooperation. Competition is the first market element also in clusters, as it delivers
important drivers for improving corporate performance and innovation. Competition
reduces prices, improves quality, enhances reliability as well as search for new products
and markets, and boosts innovation. At the same time, a relevant connection amongst
cluster players is cooperation in order to attract fresh resources and services that would
not otherwise be available to isolated participants and through cooperation firms achieve
economies of scale and scope. Trust and recognition are central to cluster operation
quality in terms of information exchange and knowledge flows. In this context trust lies in
sharing a vision and belief in mutually fruitful relations. Clusters are not temporary
solutions for all problems, but they provide a sense of direction and inner stability over
time. Their structure is however not rigid or static, and experience shows they actually
undergo different developmental stages.
27
2.3 Several Cluster Models
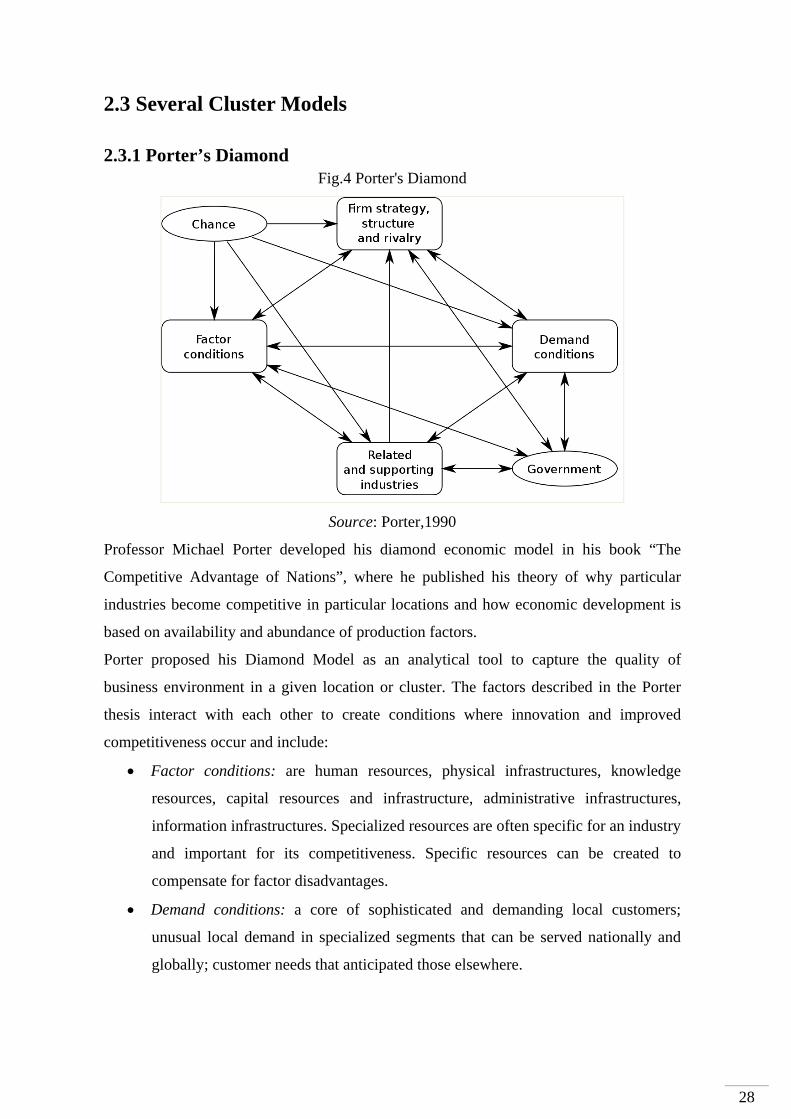
2.3.1 Porter’s Diamond Fig.4 Porter's Diamond
Source: Porter,1990
Professor Michael Porter developed his diamond economic model in his book “The
Competitive Advantage of Nations”, where he published his theory of why particular
industries become competitive in particular locations and how economic development is
based on availability and abundance of production factors.
Porter proposed his Diamond Model as an analytical tool to capture the quality of
business environment in a given location or cluster. The factors described in the Porter
thesis interact with each other to create conditions where innovation and improved
competitiveness occur and include:
• Factor conditions: are human resources, physical infrastructures, knowledge
resources, capital resources and infrastructure, administrative infrastructures,
information infrastructures. Specialized resources are often specific for an industry
and important for its competitiveness. Specific resources can be created to
compensate for factor disadvantages.
• Demand conditions: a core of sophisticated and demanding local customers;
unusual local demand in specialized segments that can be served nationally and
globally; customer needs that anticipated those elsewhere.
28

• Related and supporting industries: can produce inputs which are important for
innovation and internationalization. These industries provide cost-effective inputs,
but they also participate in the upgrading process, thus stimulating other
companies in the chain to innovate.
• Context for firm strategy and rivalry: constitute the fourth determinant of
competitiveness. The way in which companies are created, set goals and are
managed is important for success. But the presence of intense rivalry in the home
base is also important; it creates pressure to innovate in order to upgrade
competitiveness.
• Government: can influence each of the above four determinants of
competitiveness. Clearly government can influence the supply conditions of key
production factors, demand conditions in the home market, and competition
between firms. Government interventions can occur at local, regional, national or
international level.
• Chance: these events are occurrences that are outside of the control of a firm.
They are important because they create discontinuities in which some gain
competitive positions and some lose.
In Porter’s vision, another important factor for cluster development is the innovation and
the continuous exchange of information by:
• direct transfers based on technology or acquisition;
• indirect transfers through workforce migration or by analysis and observation of
the competition;
• in-direct transfers through spin-off by supporting new businesses based on ideas
and technologies resulting from research.
29

30
2.3.2 Triple-Helix Model.
Fig.5 Triple Helix Model
Source: Etzkowitz, 2002
Professor Henry Etzkowitz8, developed the Triple Helix Model in 2002 defining the
capitalisation and transfer of knowledge as based on close relationships between three
important factors for a cluster development:
• Universities and research centres are involved in projects, financed by the private
sector, to deliver technology, knowledge and to innovate; new business can be
created using spin-off technology and financial support from private companies;
• Business environment involves higher education in research projects and supports
private entrepreneurship;
• Government financed research; in the United States military research facilitates
the generation of economic clusters through outsourcing different services to
private companies; regional development initiatives and projects which support
the development of technology parks can represent the starting point for future
agglomerations that can lead to a cluster.
The Triple Helix Model is a spiral model of innovation that captures multiple reciprocal
relationships at different points in the process of knowledge capitalisation. The first
dimension of the Triple Helix Model is the internal transformation in each of the
components, such as the development of lateral ties among companies through strategic
8Professor Henry Etzkowitz, Senior Researcher, H-STAR Institute, Stanford University and Visiting Professor at School of Management, Birkbeck, London University and Edinburgh University Business School, UK.

31
alliances or an assumption of an economic development mission by universities. The
second is the influence of one helix upon another.
Among the components there is a relationship between academia-industry-governments
where each component is independent of the other but overlap in terms of innovation and
knowledge transfer. Also, each component has an equal role and takes over the leading
role as an innovation generator. This model differs from models where each factor is
independent of the other three without a clear relationship between them or from models
where education and research is part of a larger public system managed by the state.
2.3.3 Markusen’s Models
Based on the role of different cluster members and the interaction between them, Ann
Markusen9 defined four cluster models.
Markusen compares her models of modern clusters with the Marshal model where the
cluster is rather homogenous, comprising small firms that collaborate with each other, are
in direct competition or in a supplier-producer relationship. In this model, none of the
firms have the size and the force to directly control the cluster and only the common
market and the cluster dynamic defines its shape and development. In a hub-and-spoke
cluster, there are few dominant firms that represent the core of the cluster and are
surrounded by numerous small firms that are linked directly to them. The majority of
cluster firms represent suppliers of raw materials, of external services or are specialized in
a particular phase of the hub production process. The small firms trade directly with the
large ones and depend on their client strategy. The hub firms define the relationship inside
the cluster and its dynamics. Clear examples of hub-and-spoke clusters are found in the
automotive industry, like the Detroit Auto Cluster that concentrates around the “Big
Three” automotive manufacturers. In a satellite platform cluster, a group of branch
facilities of externally based multi-plant firms, are located in a particular geographic
region in order to benefit from governmental facilities or low costs with supplies and
workforce. A particular characteristic of the satellite platform is that there are no relations
between satellite firms and they are entirely controlled by the parent firm in the remote
location.
The last category, the state centred or state anchored cluster, is defined around a public, 9 Ann Markusen is professor of regional economics and planning; industrial organization; economic development at University of Minnesota.

governmental or non-profit organization that dominates the region and the economic
relation between cluster members. This entity is surrounded by numerous small firms that
benefit from public and private contracts. The state centred type can be compared to a
hub-and- spoke cluster in which there is one dominant key player that is not controlled by
the private sector.
Fig. 6 Marshallian and Markusen models
Source: Markusen, 2005
2.4 Wine Cluster Map
Wine Cluster both in Piedmont and South Australia is composed by several actors that are
involved, directly or indirectly, with wine business. To understand better this environment
it is useful to create Cluster Map.
Within the South Australian and Piedmont wine cluster there are grape growers, wine
producers, brand owners and a plethora of firms represented both by the suppliers of the
grape-growing and the supporters companies of wine producers. The former supply with
grape stock, fertilizer, pesticides, grape harvesting equipment, irrigation technology and
consulting services, the latter are represented by industries manufacturing bottles, screw-
caps, labels, winemaking equipment and barrels.
The wine cluster is also linked with agricultural, tourism and restaurant and also
comprises of viticulture and oenology research bodies, a range of institutions for
collaboration and a range of state and federal-level statutory bodies. (Nipe et Al, 2010)
32

Fig.7 Wine Cluster Map
Source: Author’s elaboration from Nipe at al., 2010
2.5 Cluster Analysis Model The Cluster analysis focussed on the following chapters is based on the Porter’s Diamond
cluster model. Nevertheless, the analysis, even if it follows the Porter scheme analysing
the four diamond’s aspect, will focus on issues that could be summarized as follows:
• Factors conditions, highlighting the competitive, and sometimes inimitable,
advantages that characterize the cluster and that may ensure their viability in the
future;
• Firms strategy, structure and rivalry section, illustrating the entrepreneur structure
of SA and Piedmont both for grape growers and wineries, explaining the main
characteristic aspects of the industry;
• Related and supporting industries explaining the most important companies that
support the wine sector in terms of manufacturing and service and tourism data
linked with wine;
• Demand conditions are dedicated to the analysis of the domestic demand in order
to understand local market trends.
33

34
3 Add-Value creation in South Australian Wine Cluster
3.1 South Australia data at a glance
The SA wine sector is the largest in Australia. In 2011, it accounted for 47.7% of the
general Australian production and for 46.9% of the total bearing area10. This data
demonstrates the dominance of SA in terms of production and vineyard hectares.
The importance of SA within the Australian wine industry is highlighted by export data as
well: it represents 57% of Australian exports in 2011 in terms of volume and 60% in
terms of value11. During 2010/11, the value of South Australian wine exports was
AUD$1.205bn and accounted for 17% of all SA exports (ABS, 2010). The total Gross
revenue on the last year was AUD$1,725 with a felt by 8% compare with the previously
year.
Fig.8: Winegrape production by State
(2011)
Fig.9: States’ contribution to the whole
Australian production wine (1997-2009)
Source: Wine Australia Source: Chandler, 2009
The SA wine industry employed nearly 11,000 people in 2011, more precisely there are
nearly 4,300 people employed in grape growing and 6,700 people employed in wine
manufacturing (Chandler, 2010). It represents 1.6 per cent of the State’s total
employment.
10 www.winebiz.com.au 11 www.wineaustralia/winefacts

35
3.2 South Australian wine cluster area In South Australia, as in Australia in general, from 1993 commenced the Geographical
Indication (GI), an official description of each Australian wine zone, region, and sub-
region. The purpose of GI system is to protect and promote the regional name and
limiting the use of the geographic zone to describe wines produced only by fruit grown
within that GI. In South Australia there are seven zone and eighteen distinctive regions12
(Fig.10).
The following regions are the most significant: Adelaide Hills, Barossa Valley, Clare
Valley, Eden Valley, Coonawarra, Langhorne Creek, McLaren Vale, Riverland.
Fig.10: SA wine area
Source: Wine Australia
These regions represent the location where vineyards, grape growers, wineries, facilities
and firms are collectively involved in wine. A key element within the cluster is also
Adelaide, the capital of South Australia where all federal and private organisations, wine
research centres and universities, distributors and wine export companies are located.
In 2011, in these eighteen regions there are nearly 76,495 hectares of vineyards (PIRSA,
2011). Looking at the economic contribution measures; it is interesting to point out
Anderson’s analysis, as per table below (Tab.1), about South Australian regions. The
analysis provides the regional comparison on the measures of:
12 http://www.winebiz.com.au/statistics/gic.asp

• $ value added to the national economy by each region’s grape and wine
production;
• Individual region’s share of the total value added by national grape and wine
production;
• Share of value added that grape and wine production represents for each region’s
economy;
• Grape and wine employment in each region;
• Individual region’s share of national grape and wine employment;
• Individual region’s grape and wine employment intensity relative to the national
economy.
Tab.1 Regional comparison in terms of grape and wine share of value add (GDP) and employment of total regional economy (AUD$ million and percent)
Source: Anderson, 2009
Barossa Valley and McLaren Vale have the highest scores in value added both at a
national level and in terms of employment: these are the most famous SA wine regions.
The Riverland region is the largest and during 2011 it accounted for more than half of
crushed grapes (South Australian Winegrape Crush Survey 2012 by Phylloxera and Grape
Industry Board of South Australia). Riverland, Barossa Valley and McLaren Vale
represent 67.3% of South Australia’s add value to the national economy and 66% of total
South Australians employed in the wine sector.
There is further important data to note: South Australia accounted for 38.2 per cent of the
nation’s grape and wine employment. The following graph shows the production trend in
the last ten years by South Australian regions.
36

The figure below (Fig.12) shows the tonnes crushed by the main South Australian region,
where Barossa Valley, Mclaren Vale and Langhorne Creek still represent the three first
regions.
Fig.12: Tonnes crushed by the main South Australian region (2001-2012)
Source: South Australian Winegrape Crush Survey 2012 by Phylloxera and Grape
Industry Board of South Australia
3.3 Overview on SA wine growth in the last two decades
It is useful illustrate some data concerning the last recent growth of South Australia, given
the importance that have given to Australian wine all over the world.
It was not only a process that involved the SA Wine Cluster but all of Australia.
The South Australian wine sector had a period of high growth from the nineties focusing
growth on exports that have increased by over 300% in volume since 1994 (ABS, 2010).
During those years a new era for the South Australian wine sector began: the growth and
profitability of wine business attracted large foreign companies to invest in this state. New
Australian winemakers entered in this business as well as new suppliers companies and,
because of the high export demand, also overseas distributors grew up. From this period
the South Australian Wine Cluster can be discussed: the wine sector is the core of a
system that involves several players in South Australia and creates a network where
manufacturing industries, logistic systems, tourism and food companies are involved.
Large growth started in the mid-1990’s, with a peak in 2005/2006 (Australian Bureau of
Statistics, 2009).
Strategy 2025 explained the export opportunities for Australian wineries and the
opportunities within domestic market and tourist activities. Moreover, it also outlined the
resources needed such us 40,000 hectares of new vineyards; 570 million litres (ml) of
37
38
extra processing capacity; 1,100 ml of new storage; 10,500 new workers and $5billion in
corporate, grower and equity funding (The Marketing Decade, op.cit.).
This document became the roadmap for dozens of wine company business plans and
industry organization agendas.
The growth peaked in 2006/2007, and then a period of new challenges began with new
global dynamics and strategies.
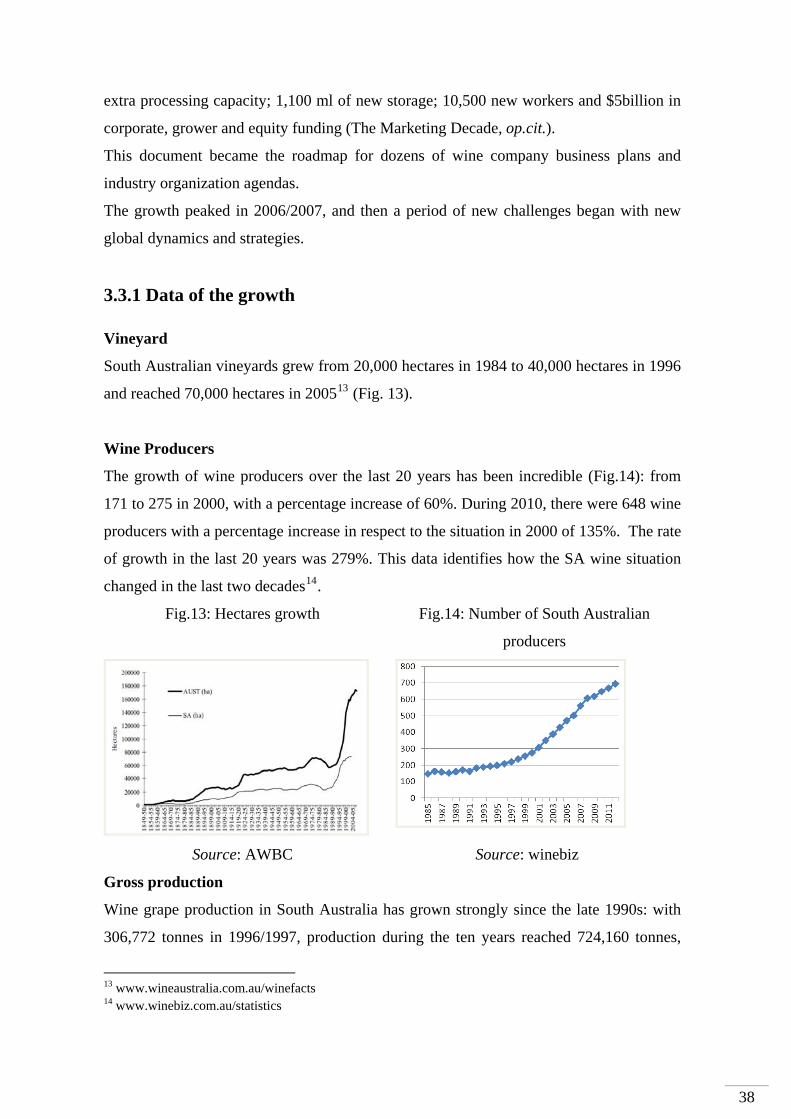
3.3.1 Data of the growth
Vineyard
South Australian vineyards grew from 20,000 hectares in 1984 to 40,000 hectares in 1996
and reached 70,000 hectares in 200513 (Fig. 13).
Wine Producers
The growth of wine producers over the last 20 years has been incredible (Fig.14): from
171 to 275 in 2000, with a percentage increase of 60%. During 2010, there were 648 wine
producers with a percentage increase in respect to the situation in 2000 of 135%. The rate
of growth in the last 20 years was 279%. This data identifies how the SA wine situation
changed in the last two decades14.
Fig.13: Hectares growth
Fig.14: Number of South Australian
producers
Source: AWBC Source: winebiz
Gross production
Wine grape production in South Australia has grown strongly since the late 1990s: with
306,772 tonnes in 1996/1997, production during the ten years reached 724,160 tonnes,
13 www.wineaustralia.com.au/winefacts 14 www.winebiz.com.au/statistics

39
more than double of those ten years earlier15.
During the 2006/07 season, because of the harsh weather conditions, including drought
(Chandler, op.cit.) marked the first years where the growth stopped its positive trend.
South Australian export data
It is certain that the South Australian wine cluster growth was driven by exports. Every
year the export trend in terms of volume was positive. In 2009, South Australian exports
accounted for 66% of Australian exports and have increased by over 400% by volume
since 199416. In these last two decades SA wine revenue through exports represent around
60-80% of the total revenue every year.
Fig.15: South Australian production and export, by volume
Source: ABS, Winefact, PIRSA Score Card
3.3.2 Key aspects of the export growth
Currency
There is an exogenous key aspect that makes this wide exportation possible: the
favourable exchange rates of the Australian Dollar. Australian wine exporters were
enhanced by a weak Australian dollar recording lows against the US dollar, the Japanese
yen and also the British pound. For instance it is shown in Fig.16 the trend of AU$ to
US$.Prior to 2000, the Australian dollar fell to around 50 cents to the US dollar and this
fact helped in making South Australian wines relatively cheap in international markets.
15Ibid 16Ibid

Fig.16: Australian dollar/US dollar exchange rate, January 1980 to January 2010, monthly
data
Source: Chandler, 2010
Government Reforms
There have been three main reforms that contributed in the Australian growth. First at all,
the change in liquor licensing laws in the United Kingdom in the 1970s, allowing
supermarkets to retail wine to the post-war baby boomers (by then adults).
The second important reform is represented by the tax breaks in 1993 which allowed a
rapid increase in vineyard expansion and the wine business became attractive and
profitable. In 1994, it was signed the Australia-EU Wine Agreement: it is a bilateral trade
agreement that help to consolidated the foundation for long term export helping to reduce
the high tariff and taxes rates in imported wine.
Actors
Exports are made not only by all the South Australian companies, but was also driven by
the large SA company and multinational groups, who have a global outlook and
established global brands with a large expenditure in marketing activities (The Marketing
Decade, Op.cit.).
During the growth, throughout mergers and acquisitions they reached economies of scale
and they were able to reduce their cost and to raise their bargaining power with the
retailers and the supermarkets.
“It was Australia’s larger wine companies who played the most significant role in
opening up global wine markets. From the late 1980s they had been regrouping for the
export challenge: Orlando was sold to management then on-sold to Pernod Ricard;
Penfolds, Wynns, Tollana and Lindemans united to form the basis of the new Southcorp
40

Group, opening up markets in the UK and the US through their old Philip Morris
allegiances; and companies such as Brown Brothers, Wolf Blass and Rosemount had
been doing the hard yards of UK market promotion since the mid-1980s.
These companies introduced Australia’s first global wine brands – Jacob’s Creek,
Lindemans Bin 65,Rosemount Diamond Label Series – and created a bow wave for the
dozens of other smaller makers keen to enter the United Kingdom.” (The Marketing
Decade, p.4 op. cit)
Principal Export Country
South Australia has focused on European and North American markets (during 2000 the
UK and US represent 66% by volume compared with 18% in 1985) rather than Asia (The
Marketing Decade, 2000). United Kingdom and United States represent nearly 45% of
export sales in 2008. The table below represents the export country in 2008.
Typology of exported wine
It is interesting to understand what kind of wine was sold overseas, when referring to
Australian exports. At first Australian exports were based on mid-price or premium sector
(from US$2.5 to US$7 per bottle). However big companies, taking advantage of the
awareness and loyalty of consumers on the “Australia Brand” and the low value of
currency, started to sell also basic quality wines both in bottles and in bulk.
Fig.17: Export market (2008)
Fig.18: Volumes of wine exports by price segment,
Australia, 1999-00 to 2008-09 (A$ per litre)
United Kingdom$309m 25%
United States of America$229m 19%
Canada$145m 12%
China & Hong Kong$137m 11%
Netherlands$57m 5%
New Zealand$55m 5%
Singapore$34m 3%
Other 104 Countries$249m20%
Source: PIRSA Score card Source: Anderson, 2010
41

3.4 The South Australian Wine Cluster Diamond Fig.19: South Australian wine diamond
Source: Author’s elaboration
3.4.1 Factor Conditions
Geographic Factors
The richness and diversity of its ‘terroir’. Each region may produce a range of varietals
not only in terms of variety, but also in terms of price points, from bulk to icon wines.
The Barossa Valley alone lays claim to 30 soil types. (Nipe et al, 2010).
The climate, even if it is normally a factor included into the term ‘terroir’, it undoubtedly
occupies a prominent role in SA wines: its importance is highlighted by the fact that in a
same region there are wines ‘cold temperatures’ and ‘warm temperatures’, which differ
greatly in their organoleptic properties. In addition, the country has a high solar radiation
and high temperatures, against which we resort to extensive use of intensive irrigation,
whereas in Europe it is forbidden by the law. (Zanni et al., 2006)
42

43
South Australia is naturally inclined to drought17 and this factor represents a limitation in
not only the viticulture sector, but for the entire agricultural sector. Given that, irrigation
system is needed in most South Australian vineyards and the cost of water impact on the
operative cost of almost all grape growers.
Infrastructures
The Adelaide port precinct represents the link with international markets and allows
export companies to easily reach these markets. South Australian ports have been
experiencing significant growth in export activity with record shipments of major
commodities including wine: it made export growth possible through continuing
investments in facilities and new route implementation18.
The high level of mechanization in vineyard work and the use of advanced technologies
in the basement are two additional factors that distinguish the South Australian wine
sector. The cultivation of vineyards is aimed at creating conditions that enable both high
yields and quality as opposed to the philosophy of European production, which combines
the density of the fruits in the vineyards with the quality of the grapes. At the same time
the vineyards allow the use of machinery for several operations and vintage. Significant
investments in technology, then, allow Australia to become one of the most advanced
countries in the world in the field of wine and winemaking techniques (Zanni et al.,
op.cit.).
Human factors
In the growing Australian winemaking sector, the skill of blending wine is a very
important role. The master blending processes produces assemblies that give the wine a
distinctive sensory profile. It happens due to a deep knowledge of the peculiarities of
individual varieties, and of key technical nature knowledge, that it is able to create the
blend (mixture literally) of grapes from vineyards located in different areas, combined to
optimize the final result according to the proportions of raw material in use and the tastes
of consumers. The master blending process is therefore the key figure in Australian
winemaking and the importance of the typical territorial, at least in some respects, are 17 A drought is a prolonged, abnormally dry period in which there is not enough water for users’ normal needs. Australia is the driest inhabited continent and its climate is highly variable. The last drought in South Australia was in 2006, when the average rainfall was the lowest since 1900 (Australian Government, Bureau of Meteorology) 18 www.flindersports.com.au

44
secondary factors in the process of characterization of wines (ibid).
3.4.2 Firm, Strategy and Rivalry
Supply Chain
Fig.20 South Australian wine supply chain scheme
Source: Author’s elaboration
There are three important aspects to highlight:
• The majority of grape growers are not involved in wine production and they only
sell their grapes to the wineries19.
• The presence of brand owners. In SA lots of wine producers have their brands
without making wine itself, but commission other wineries to make it. They use
their brand and they commercialize it up to the distribution channel. In fact, often
the wineries make wine for themselves and for other brand owners.
• Wineries often manage more than one brand in order to diversify its product
portfolio and penetrate several markets.
• Small winemakers, that have a low budget, often make the distributors promote
their products through marketing campaigns.
19 Interview to P. Hackworth

45
• Sometimes winemakers are vertically integrated along all the supply chain: they
have their vineyards, their cellar doors and their marketing strategy.
• Medium and large enterprises hold several wineries and manage several brands.
Two industries have been considered in this analysis: wine grape growers and wine
producers.
Wine Grape Growers
There are no companies with a dominant market share present (Ibis world, 2011). The last
analysis made by the Wine Growers Council of South Australia (WGCSA) found out
there is more than 3,626 growers in South Australia and in the Riverland region there
were close to 1,074 in 2011.
Independent grape growers represent the majority with a percentage of 96% of the total:
Barossa and McLaren Vale are the two regions with the highest number of winery
vineyards even their percentage remains over 90% (WGCSA, 2012)
Due to external variables such as climate, vintage, water supply and market condition, this
industry is highly volatile (Ibis world, op.cit.).
Grape growers are usually price takers; they are at the mercy of what happens
downstream and on the market trends: the price of their grapes depends on market
demand.20 Selling their products to wine producers, they can stipulate several types of
contracts that may differ both in duration and in price system. Referring to the price
system, they could deal a fixed price and each year, until the contract is valid, they
already know the grapes’ price, or a market price, that follow the demand condition.
During the past a lot of wineries stipulated long term contracts with fixed prices, so that
grape growers are not concerned about the market condition and keep the same grapes
cultivated even where they were no longer profitable.
Given high demand of their products during the past, the profit of the grape growers was
high. The price has risen more than four times the cost, whereas grape prices increased to
AU$1200 per tonne (Nipe et al., op.cit.).
From 2006 the situation is completely different: there is a business model risk that has to
be more sustainable on the future; in fact their dependence of supply-demand law linked
with the current oversupply situation pushed down prices to unsustainable levels. A
20Interview to P. Hackworth

46
growing number have exited grape production since the boom in early 2000 (15% of
growers in the Riverland alone) and, given the high labour and irrigation costs, not all the
growers will be able to cover operational costs in the last three years (Ibid).
Wine Producers
Within the Australian wine production industry, the South Australian wine producers
industry is oligopolistic (Reynolds, 2010). In SA there are 695 wine producers and they
represented 27.4% of Australia’s wine producers in 201121.
The market share is concentrated on six firms (Fig.21): Accolade Wines, British Premium
Company, The Yalumba Wine Company, Australian Vintage, Premium wine Brand and
Treasury Wine Estate, that represents nearly 60% of all the South Australian wine
production22. And the first ten wine companies represent nearly 70% of the total
production. These firms are either multinational groups or medium and large enterprises
and represent the most important Global companies.
Fig. 21: South Australian wine production’s share
Source: Author’s elaboration from winbiz data
The rest of the industry (685 firms) is represented by SMEs and having only 30% of
market share23.
In the last two decades the wine industry has attracted many players, due to the short term
profits received in the wine industry over the last 10 years, whereas marginal revenue
well exceeded marginal costs. The effect, that was predicted, was that eventually supply
would exceed demand with the consequent fall of price and profit (Reynolds, Op.cit.).
This industry specific factor currently makes it difficult for small firms to enter. There is
particular pressure on SMEs to have a clear, international strategic management approach
(Freeman, 2002).
21 www.winebiz.com.au/statistics/ 22Ibid 23Ibid

Institute for Collaboration (IfC)
There are several associations, statutory and industrial bodies that have helped the
development of the SA wine cluster throughout its history. IfCs operate across the entire
value chain, operating at both the federal and state level (Fig.22). They are involved in
disseminating industry and government information, R&D activities, marketing and
promotion. Annex 2 details all South Australian IfC’s.
Fig 22: Institute of Collaboration across the value chain
Source: Nipe et al.,2010
3.4.3 Related and Supporting Industries
Related manufacturing companies
A huge network of non-grape growing firms has developed into an SA cluster where there
are particularly strong and notable companies. There are both companies specialized in
product and services useful for grape growers, and companies that support other wine
companies.
Grape growers are supported by a number of firms that provide services such as
mechanized pruning, harvesting and summer trimming: one of the most important is
Tolley Viticulture. Other companies provide expert advice to vineyard owners on
planning and management, quality benchmarking and adapting vineyards to climate
change; for instance Davidson Viticulture is one of the most important.
South Australia is home to two of the largest wine bottle manufacturers in the world:
Owen Illinois and Amcor. Its Gawler plant, between Adelaide and the Barossa Valley,
47

48
produces over 400 million wine bottles a year providing 90% of the South Australian
wine cluster’s bottling needs24. In 2005, Amcor entered into the manufacture of metal
screw-caps industry to compete with the Adelaide-based Alcan. There are also 21 firms
supplying barrels, the most prominent being Henrich Cooperage (Nipe et al., op.cit.).
Related industries
The South Australian wine cluster is deeply related to food and tourism and supported by
it. The centrality of these clusters to each another prompted the South Australian
Government to produce the South Australia Food and Wine Tourism Strategy. This
strategy highlights that food and wine tourism in South Australia accounted for
$4.2 billion in expenditure in 2007 and set a target to achieve expenditure of $6.3 billion
by 2014 (Food and Wine Strategy 2009). Tourists to South Australia’s six main wine
regions visit an average of 4.4 cellar doors per visitor per region or an average of 4.75
million cellar door visits. During a holiday in South Australia 40% of international
visitors to SA visited at least one winery during their stay (Nipe et al., op.cit.). Moreover,
winery cellar doors are no longer simply a place to purchase wine, but it has become a
complete tourism experience, including services such as restaurants, accommodation,
tours, picnic and recreational facilities (Ibid).
Tourism is a significant challenge for small wineries that produce "hand-crafted wines" to
capitalize on wine tourism’s potential. For small wineries established in the new
millennium, their ability to tap wine tourism will determine their viability. Wine tourism
offers a strategy for small producers to overcome the barriers associated with the
international market, in which it is difficult to compete with large companies, providing
the perfect venue and way to lift brand values and attributes, influence customer
perceptions and ensure a higher margin on sales. Also large producers who are able to
"act small" in the way they present their wineries and products can also benefit from this
sector. (The Marketing Decade, op.cit)
3.4.4 Demand Conditions
Domestic demand has increased steadily in the last 20 years and is concentrated on
domestically produced wine: the OIV data (2012) shows that while in the 1995 the
24 www.amcor.com

consumption was around 3,275 hl of wine, in 2008 was 4,921 hl, with a growth of 50%.
There was a change in the sales of soft packs and bottled wine. In 2000-01, ABS (2011)
calculated soft packs accounted for 54.1% of domestic sales in 2010-2011 comprise 25%
of the total domestic sales. This demonstrates that the consumption is getting more
sophisticated, in fact from the year 2005/2006 bottled wine consumption overcame soft
pack consumption preferring bottled wines (Fig.23).
The growth in imports (Fig.24) may be partly explained by two aspects: the appreciation
of the Australian dollar over the last six years and possibly a growing sophistication and
knowledge of Australia. This means more competition in Australian market and the
companies that are more threatened are the micro and small enterprise without a skilled
management that put low attention on marketing and sales activity and base their business
on their local area without get new opportunity through the increase in Australian wine
demand. During the last three years wine imports have increased and during 2008
Australian-produced wine accounted for 87.4% of total domestic sales, while imports
accounted for 12.6%, up from 7.1% two years ago. The most important importer is
represented by New Zealand with 2.5 million unit cases, but France and also Italy are key
sources of imports (Morgan Stanley, 2009). Nevertheless, even that one third of the
revenue comes from domestic sales and in 2011 the value was $486m, the SA wine sector
presents an overdependence from export overseas that accounted for 70% in 2010/2011.
Precisely, the other issue is that 44% of exports are represented by England and the USA.
Fig.23: Domestic sales of wine by container
Fig.24: Imported wine in South Australia (1999-2009)
Source: ABS Source: Nipe at al. (2010)
Given that the South Australian population is nearly 1.650 million, the local state market
has not a wide base of potential consumers when compared with Old World countries.
49

3.5 Sustaining a Competitive Advantage within the SA wine cluster
Having illustrated the cluster environment created around the wine sector, this section
will analyse the strategies and dynamics that has enabled the SA wine sector to reach a
competitive advantage during these years.
It is possible to group the factors into three areas:
• Collaboration (horizontal and vertical)
• Innovation and Research & Development
• Marketing
3.5.1 Collaboration (horizontal and vertical)
Anderson (2006) explained that one of the factors that gave Australia a sustainable
competitive advantage was the collaboration, mergers and acquisition (M&A) of
companies. His analysis is described in the following two chapters.
3.5.1.1 Horizontal collaboration
The dynamics within the cluster led to different kinds of collaboration between the firms.
Two important factors contributed to the competitiveness in SA: the achievement of
economy of scale and the reduction of transaction costs.
There are two levels of collaboration between wine firms, vertical, that is between several
actors of the supply chain (grape growers, other input suppliers, winemakers, and wine
marketers); and horizontal, that is between different companies in the same industry.
Following the wine supply chain there are several steps before the product reaches the
final consumer. Usually the wine grape growers sell their products to the wineries that
create the wine in their own facilities. This typical relationship has led to a reduction in
transactions and research costs by the grape growers because of the presence of a winery
in their area and the contracts with wineries are consistent every year.
Another horizontal collaboration is between winemaking and wine marketing. With this
collaboration there are two key advantages:
• the first is about the direct knowledge of market trends that have led to understand
50

consumer preferences and as a consequence the product innovation by the
wineries;
• the second is the possibility to exploit low cost distribution channels e.g. e-
commerce and mail. Especially for small wineries, that have a low bargaining
power with the traditional distribution channels, this has presented great
opportunities.
Another example is wineries that are involved not only in cellar door sales, but also in
tourism activities and entertainment services.
3.5.1.2 Vertical collaborations and Mergers & Acquisition
Nevertheless, the economies of scale that help medium and large companies to grow
overseas were reached because of horizontal collaboration and mergers and acquisitions.
As Anderson noted ‘this innovation-inducing trend is occurring in many industries as part
of globalization’.
International alliances
This form of alliance occurred both at an international and national level.
The first one was helpful for South Australian companies for three main reasons:
• to access market knowledge and understand the trend in the markets abroad, it is
really expensive to acquire and reach distribution channels overseas.
• the alliance overseas makes it possible to compete in other markets without direct
foreign investment in new production and quickly, in spite of less control.
• in global and international finance where exchange rates are very volatile, a form
of currency hedging may be present in more than one country and the possibility
to make cross-border operations.
For instance, these are some important alliances between Australian and American
companies, such as the Foster’s Brewing Group and Napa Valley-based Beringer,
between Southcorp and California’s Mondavi and the acquisition of BRL Hardy’s by the
multinational Constellation Brands, and the absorption of Allied in 2005 into Pernot
Ricard.
51

Domestic Alliances
The SA wine cluster has attracted both large companies and multinational groups that
began to acquire small and medium wineries and encouraged SA medium enterprise to
get alliances among them. The main reason that has driven these industry changes, is the
opportunity to exploit economies of scale, high productivity and reduction of costs.
The growth in the SA wine sector has been driven by the increased export capacity of the
players within the SA wine cluster. The bargaining power with distributors that small and
medium enterprises have achieved throughout the aggregation under big industrial
companies, sources of greater quantities and renowned brands, has been crucial to
stimulate such export capacity increase. Nevertheless, this strategy did not in itself
because a reduction of the overall quality of South Australian wine products. In fact these
alliances were especially important to enterprises that wanted to change their strategy
from domestic boutique channel sales to large-scale channel sales as supermarket and
retail networks.
Domestically, the most notable acquisition took place with Southcorp in 2005 with the
takeover by the Foster’s group to form perhaps the world’s largest premium winemaker.
To highlight this important dynamic it is useful to reference the value of cross-border
mergers and acquisitions over the last thirty years: in particular the fact that M&A’s grew
at 25 per cent per year from 1987 to 1995, at 50 per cent in the late 1990s and in early
2000 and has slowed down in the past decade.
This is the reason that the industry of wine producers is oligopolistic and only a few firms
largely concentrate in market shares (in term of export plus domestic market).
In fact, ‘Some left-behind wineries will be disadvantaged by the new alliances among
more-progressive firms, but an alternative possibility is that even they could benefit as
those merging wineries improve their export performance. That could happen either by
getting in the slipstream of the progressive firms success abroad in promoting Australian
wine, or in supplying a less-crowded domestic market while the merging firms focus more
on markets abroad. ‘(Anderson, p.9 op.cit.).
52

3.5.2 Innovation System: the actors
The South Australian Innovation system is indeed centralized and the main important
actors are situated in Adelaide, providing R&D not only for the South Australian wine
industry, but for the whole Australian industry.
Key institutions who promote R&D activity are:
• Grape and Wine Research and Development Corporation (GWRDC), government
body devoted to financing R&D projects;
• Australian Wine Research Institute (AWRI), a national research body and member
of the Wine Innovation Cluster (WIC).
It is important to highlight that both these bodies operate and invest for the Australian
wine sector.
3.5.2.1 Grape and Wine Research and Development Corporation (GWRDC)
The GWRDC was established in 1991 under the Primary Industries and Energy Research
and Development Act 1989 and is an Australian Government Statutory Authority.
These activities focused on several aspects of the wine sector: enhancing the efficiency
and sustainability of grape and wine production, improving producer capability to manage
quality in order to satisfy market requirements, delivering product and process innovation.
In 2003–04, the GWRDC spent $14.2 million on research and development activities.
The GWRDC is funded by grape growers and winemakers, who pay levies in proportion
to their output, and the Federal Government provides matching funds.
‘Producers initially opted for low levies, but in 1999 growers and wineries agreed to
raise the research levy rates by more than one-third, to A$2 per tonne of grapes produced
and A$3 per tonne of wine grapes crushed. In 2005 the wineries raised their rate again,
to A$5 per tonne of wine grapes crushed. Since wine grape prices averaged around
A$700 per tonne over the five vintages to 2009, and wine sold for an average of around
A$4.50 per litre (or $4500 per tonne), the current rates are equivalent to less than 0.3
percent of the gross value of grape production and barely 0.1 percent of the gross value
of wine production, or well under 1 percent of value added in these two activities’
(Anderson p.14, 2010).
53

54
3.5.2.2 Wine Innovation Cluster (WIC)
The Wine Innovation Cluster (WIC) brings together four leading research agencies that
address the needs of the grape and wine sector:
• The Australian Wine Research Institute (AWRI)
• Commonwealth Scientific and Industrial Research Organization (CSIRO )
• South Australian Research & Development Institute (SARDI)
• The University of Adelaide
The research and innovation delivered by these organizations have in practice helped the
Australian wine sector achieve much of its success over the past few decades.
Each of these agencies is independent, with distinct capabilities and successes. The WIC
is located near Adelaide, at the Waite Research Precinct, highlighting the central role of
South Australia in wine research and development.25
The Australian Wine Research Institute (AWRI)
The AWRI is a private company owned by the Australian grape and wine industry.
To complement its R&D activities, the AWRI plays an important role in the
dissemination of knowledge throughout the sector, as well as fast-tracking uptake and
application of important research outcomes through its commercial Analytical Service.
AWRI's staff are specialists in traditional and cutting-edge disciplines such as:
biochemistry, organic and analytical chemistry, chemical engineering, chemo metrics,
fermentation management, knowledge and information management, mass spectrometry,
microbiology, metabolomics and systems biology, molecular biology, near infrared
spectroscopy, sensory science, viticulture, and winemaking26.
Commonwealth Scientific and Industrial Research Organization (CSIRO)
It is Australia's national science agency and one of the largest and most diverse scientific
research organizations in the world. CSIRO applies strategic research in the plant sciences
to promote profitable and sustainable agro-food, fibre and horticultural industries, develop
novel plant products, and improve natural resource management. CSIRO's grape and
wine research is focused on improving the performance of vineyards and grapevines to
give benefit to the entire production, processing and marketing chain.27
25 www.wineinnovationcluster.com.au 26 www.awri.com.au 27 www.csiro.au

55
South Australian Research & Development Institute (SARDI)
SARDI is acknowledged as a leading research & development institute delivering
innovation to enhance the food, fibre and bioscience industries and living environmental
systems. Its role is to provide research that delivers technical solutions and platforms to
target industries based on scientific excellence and contemporary needs. Viticulture has
long been a SARDI strength. Further strengths in Climate Applications and Plant & Soil
Health complement their viticulture capacities.28
3.5.2.3 Diffusion of the knowledge
It is necessary to disseminate the knowledge within the cluster overall when the market,
such as the SA markets, is mostly all overseas. Within the South Australian wine cluster
there is a plethora of association, research bodies and education institutes that make
possible the diffusion of knowledge and the improvement in innovation itself.
Some of these have played a central role in the SA innovation system.
Wine Australia
Wine Australia, previously called Australian Wine and Brandy Corporation (AWBC) is
an Australian Government authority founded in 1981. Its aim is to promote the Australian
wine industry all over the world and help Australian companies to start businesses
overseas. With global offices in Australia, London, The Hague, Tokyo, Vancouver, New
York, and Toronto, Wine Australia was able to understand market trends and ran a series
of collaborative wine marketing programs (Reynolds, Op. cit.).
Australian wine companies that decided to export their wines overseas, required accurate,
up to date information to be able to make better and effective strategic decisions.
However, often SMEs were not able to obtain current information and collect and manage
knowledge, so the role of the AWBC was for the dissemination of knowledge for the
whole industry which enabled all the companies to benefit from the information and
market trends. In fact Wine Australia was able to collect and analyse the wine industry
statistics and make it accessible information (Ibid).
Australian Bureau of Statistics (ABS)
Other important bodies that provide information and up to date analysis of the grape
28 www.sardi.sa.gov.au

56
growers and wineries industry was represented by the Australian Bureau of Statistics. The
importance of this service was demonstrate by the decision of the grape and wine industry
to allocate more expenditure of its R&D funds on commissioning the Australian Bureau
of Statistics (Anderson, Op. cit.).
Education and academic research
There are several facilities providing education, knowledge about viticulture, oenology
and wine economics including:
• University of Adelaide. Established in 1874, the University of Adelaide is
Australia's third oldest university. It is the Southern Hemisphere’s ‘premier wine
research and teaching university’. In fact several facilities and campus within
University of Adelaide are linked with wine education and research:
• the Roseworthy Campus, located near Barossa Valley and focuses on dry land
agriculture, natural resource management and animal production.
• the Waite Agricultural Research Institute, which was established in 1924 and
promote the education in agricultural fields delivering value to industry.
• Moreover the University has started an initiative linking all wine-related research
groups within the university called “The Wine 2030 Research Network “with the
aim to promote research to industry and to principal stakeholders.
• In February 2010 by the school of economic and the Wine research Network was
established the Wine Economics Research Centre with the aim to promote
research about wine economic about Australia and world wine industry.29
• University of South Australia (UniSA) offer courses and conducts research in
marketing and strategy focusing on wine industry and was established the Wine
Marketing Group, whit the aim to research into how people purchase wine and
strategic decision-making for wine companies30.
• National Wine Centre and Wine Cluster Innovation offer wine and oenology
courses as well as sommelier courses.
• Formal education in viticulture and oenology is made by The National Wine
Centre and Training Centre, situated in Adelaide,
29 www.adelaide.edu.au 30 www.unisa.edu.au/marketing

• Several other tertiary education institutions, such as a number of Technical and
Further Education (TAFE) campuses that provide practical viticulture training in
terms of marketing and sales;
As Anderson explained in his papers previously cited, Australia is four times as intense in
producing research papers on viticulture and oenology (Tab.2), exceeded only by Portugal
and Spain, adjusted for the size of each economy; and was 2.8 times as intense in the mid-
1990s when adjusted for the output of wine, that exceeded only by the United States.
In terms of research payoff, a benefit-cost study found that the 2002 portfolio of GWRDC
research projects was expected to yield a 9:1 benefit/cost ratio, and that a sample of past
projects yielded ratios ranging from 7:1 to 76:1 (McLeod 2002 cited in Anderson, 2010).
Tab.2: Wine research publications and national shares of global wine production volume
and global GDP, 1992-2006.
Source: Anderson, 2010
3.5.3 Marketing
Unlike other Western countries, where marketing strategies aim to influence the
preference of consumers, Australia wants to influence the preference creating the
knowledge of Australian wine all over the world. To do that, Australia started a great
country marketing campaign, in order to propagate the knowledge of Australian wine in
general. This centralized marketing campaign was coordinated by the Australian Wine
and Brandy Corporation (AWBC) that became the Australian Government authority
responsible for the promotion and regulation of the Australian wine industry (Reynolds,
57

op. cit.)
Changes in demand
The demand of Australia’s wine preferences have played an important role in the growth
of the Australian wine industry.
Australia, as other New world producers, upgraded the quality of their wine and took
advantage of the shift in consumer preference (Cusmano, 2011): in fact, since 1980 the
popularity of wine increased as a “beverage” and also inexperienced consumers started to
buy and consume wine (ibid). Australia exploited this evolution creating their own
competitive advantage: it quickly followed customer trend preferences increasing
marketing and branding efforts and chose to create the “Brand Australia”, choosing not to
promote the importance of terroir and single regions but to promote Australian wine as a
“popular-premium” segmented wine (ibid).
Another important aspect is the growing influence of Robert Parker’s Wine Advocate and
Wine Buyer’s Guide: in the nineties, it played an important role in influencing consumer
trends overall in the Anglo-Saxon market, where people were not yet educated about wine
culture, high alcohol, heavily fruited, oaked, red wines and Parker’s promotion for
Barossa Shiraz played a key role in popularizing ‘bold’ Australian reds (Nipe et al.,
op.cit.).
Market driven approach
One of the key factors that led to the success of Australian wine producers was
represented by the responsiveness to the customers: the production, the product
innovations and differentiation of wine followed what people wanted to buy (Chandler,
2010). For instance, “Australian chardonnay in the late 1980s and early 1990s had a
reputation for being over-oaked, ‘big’, ‘fat’ and ‘over-blown’. This turned consumers
away from Australian chardonnay towards other white wines, and the winemakers have
since responded by reducing the amount of oak and adjusting the winemaking techniques,
so that very few chardonnays produced in Australia now would match such a description,
and those that do are meeting the demand from those consumers who still prefer this style
(Ibis p.13).
The South Australian product, as other New World countries like Chile offer is better
suited to this shift in demand because it is more enjoyable and easier to choose and
58

understand. This was demonstrated between 1992 and 1997 of the New World’s share of
world wine exports (from 8 to 17%) (The Marketing Decade, op.cit.).
This capacity to follow the trend of customer preferences was made possible throughout
the knowledge of the markets abroad. In fact the two most important country exporters
are represented by the United States and Britain, the two countries where Australia has a
strong relationship: historically with the former, and in terms of company alliances with
the latter.
This market approach is strictly correlated with product innovation: most companies
make wine as the consumer desires. The Australian producer, released mental
bureaucracy and tradition, adopt a habit of mind that distorts the terms of the traditional
wine-growing: its task is to define a wine that will meet the desires and tastes of the
client’s goal. This mind-set defines a logical product / market that are typical of the
producers of the New World, particularly effective in the Anglo-Saxon markets.
The product
Chandler (2011) pointed out that the high standard of wine made in South Australia may
be largely explained by several key factors as follows:
• South Australian wine has been considered as a “Good value alternative”: South
Australian wines have been sold mostly for their economic value combined with
desired flavour profiles for consumers.
• Good winemaking and innovation technology: in South Australia, innovation
overcomes tradition with an increase in the quality of grapes picked, in vineyard
management and with progress made in wine chemistry and wine manufacturer.
• No ‘bad’ vintages have been produced since 1974.
• Cleanliness and “green” product, this last important aspect is represented by the
fact that South Australian wines were known for their cleanliness without
resulting in wine faults.
Brand
The promotion of the Brand played a key role in the international development of
Australia wines. Given that people all over the world were not aware of Australian wines,
the federal government identified the creation of brand awareness as the marketing
strategy as a priority, for Australian wine as a whole, instead of promoting independent
59
60
states or individual wine regions. In fact, the strategy utilized by the AWBC is to use the
"Australia” brand to export the wine and to make the consumer recognize them like an
“Umbrella Brand31”. It means that they did not put the attention on the individual region
and state but in order to promote the value of all Australian wine, the strategy was to put
the attention on the name “Australia”.
The choice of this brand strategy is perfectly coherent with the Australian wine strategy
itself: since 1990 Australian wine was not known all over the world and the first
promotion was not to promote only quality wine, but to penetrate the market and make
consumers of wine aware of their existence. They did not point on the preference of
consumers but on their awareness, necessary step for a product not known in other
markets.
Label
Another key factor is represented by the importance that Australian companies had given
to the label: a bottle of wine may be identified not by the hillside on which a grape is
grown or by the person who made it, but more easily to recognize the different name of
the grapes (Marketing Decade, Op.cit.). Given that, Australian wine labels are more easily
understood when compared with Old World Labels.
Considering the most important overseas markets are represented by the United States and
England, countries without wine tradition, this kind of strategy was successful as a result
of the simple labels that South Australian bottles have.
The label played a key role on the promotion of the Brand “Wine Australia”: promotion
of the Brand Australia written on the label: while on the label the variety, the geographic
area and the private brand are optional, the words ‘Produce in Australia/Australian wine’
are compulsory on the bottle sold both in domestic and international market.
Variety
Correlated with the importance of labels, is the importance of grape variety. Given the
low level of customer knowledge in Australian Wine both domestically and in Anglo-
Saxon countries, the variety is the key to the philosophy of marketing of Australian wines.
The traceability of the product to a particular variety of grape, often international, allows 31An umbrella brand can be referred to as a brand when a group of products possess the same brand name which is known as a family brand or an umbrella brand. Different products having different images are put together under one major brand or parent brand and are marketed by the firm.

a greater identification of the products, even by inexperienced consumers
The traceability of the product to a particular variety of grape, often international, allows
a greater identification of the products, even by inexperienced consumers. There is a dual
advantage of using the differentiation of the vine as a main attribute:
• leveraging on the existing awareness of the grape varieties where even the casual
wine consumer is probably familiar;
• to capture the customers interest and tempt them to purchase the same product
again.
Change in distribution channels
With this change there was also wine consumer buying changes and this aspect has had
one of the major effects on competition in the wine market (Gwynne,2008), in fact
supermarkets became the first distribution channel in terms of volume in the country
(Cusmano, op.cit.).
For instance, in the USA, the second important country for Australian wine exportation,
hypermarkets and supermarkets account for more than 40% of retail wine sales and 70
percent of the market is controlled by 20 of the largest wholesale companies (Castaldi
cited in Cusmano, op.cit.).This new dynamic in terms of distributors changed also the
dynamics within the wine industry itself, where small producers did not reach enough
quantity and bargaining power to put their products on the shelves. In fact, just because
supermarkets have opted to stock top selling wine brands from wineries with enough
quantity to reach a profit, this change in distribution channel has damaged small, often
micro, wineries both in the Old World and in the New World (Cusmano, Op.cit.). In fact,
lots of micro and small wineries put their attention on domestic markets, selling their
products through cellar doors and wine boutiques.
61

62
4 Add-Value creation in the Piedmont Wine Cluster
4.1 Piedmont data at a glance
Before analysing the Piedmont wine context, it is useful to underline that the legislative
framework of the wine sector is wide and varied: it is characterized by a superposition of
European, national and regional legislation, which is constantly being updated. The
essential rules that affect the sector are those that refer to the Common Market
Organization32 (CMO) wine, those that regulate the system of protected appellation of
origin and those governing the complex system of vineyard planting rights.
The most important reform that affects all the wine sector today is at the European level,
with the new OCM Wine33, effective from the 1st August 2008, with the aim to increase
the competitiveness of European wines overall in the international market. The main
activities that concern the reform are about:
• balancing the market by removing excessive wine production in order to
avoid, or at least reduce, the oversupply that affected European countries in
the last decade;
• changing non-competitive grape production to allow a rapid restructuring of
the sector,
• ensuring environmental protection in wine-growing regions through a fund
system aimed to be invested in these activities;
• promoting the denomination of origin wines abroad.
The long-term trend of vineyards in Piedmont shows a progressive contraction of the
vineyard: the area in the past fifty years has been reduced to about one third from 146,000
32 The common market organization (CMO) was created in 1962 within the framework of the common agricultural policy (CAP). The CMOs cover about 90% of the EU's agricultural production. They govern the production and sale of products or groups of products (cereals, vegetables, pork, eggs, wine, etc..) In order to ensure a stable income for farmers and a continuous supply of European consumers. The CMOs are the basic tools of the common agricultural market to the extent that eliminate barriers to intra-Community trade in agricultural products and maintain a common customs barrier against third countries. 33 To a more deeply reading about the new OCM wine, “OCM wine: a difficult transition to a commor strategy”, E.Pomarici, R.Sardone, 2009

63
to near 50,000 ha. The cultivator’s abandonment of the vine is a phenomenon that was
particularly common during the period from the late sixties to the beginning of the
nineties. According to the last survey of the Piedmont region34 in 2011, the Piedmont
vineyards accounted for approximately 8% of Italian vineyards with 45,051 ha and
approximately 6.2% of the Italian wine production with 2,682,701 hl produced.
The Piedmont region comes fifth in terms of production volume, but third in terms of
added-value35. It is interesting to show the quantity and the value trend in Piedmont
production in the last 30 years (Fig.25): a front of a halving of the amount on quantity, the
value rose fivefold, demonstrating a clear strategy focused on the promotion of quality
products.
Fig.25: Quality and quantity trend of Piedmont wine production
Source: ISTAT and INEA data
In addition, Piedmont is the Italian region with the largest number of wines with
appellation of origin: there are precisely 58 different types and they cover 85% of regional
production36( Fig.26).
34Anagrafe Unica data, update May 2012 35Istat, update May 2012 36Ismea, update February 2012

64
Fig.26. Number of Appellation of origin wines in Piedmont, by region (2012)
Source: Ismea
The wine sector in Piedmont has made exports of 1.176 million euros in 2010, with
approximately 16% of these exports being national wine exports and 32% of the total
value of exports being food from Piedmont37.
Piedmont exports 60% of the wine that is produced (compared to the Italian average of
47%), representing the second Italian region in terms of export volume: 70% of the
exported wine enters the European market, in particular Great Britain (21%), Germany
(18%), followed by France (6.3%) and Russia (5.4%)38. The remaining 30% goes to non-
European countries39: the most important market is the U.S., which accounts for about
10.5% of the total wine exported.
The Piedmont wine production industry employed nearly 5,685 people in wine
manufacturing40. Nevertheless, the number employed on the industrial side should be
integrated with the number of employment in Piedmont farms: a total of 20,452 farms in
201141, with at least one operator each.
4.2 Piedmont wine cluster area
The concentration of grape growing and winemaking activity is not uniform, rather it is
more developed in south-western Piedmont (Aimone et al., 2001).
The Piedmont wine cluster extends overall into three provinces:
37 www.iuv.it/corriere 38www.osservatorioagroalimentare.al.it/content/vino 39Ibid 40 Istat, 2001 41 Anagrafe agricola unica, May 2012

• Province of Asti, where two wine regions can be distinguished: Monferrato
Astigiano, Monferrato Casalese;
• Province of Alessandria, characterized by the Alto Monferrato and Colli
Tortonesi;
• Province of Cuneo, where there are Langhe and Roero wine region;
Considering the whole Piedmont areas, the wine cluster interests 600 municipalities.
Regarding the production of appellation of origin wines, 98% is produced in Langhe,
Roero and Montferrat wine areas.
Fig.27 Piedmont wine cluster area
Source: Ismea
The most up-to-date data by Anagrafe Agricola Unica (2012) shows that in three
provinces (Asti, Cuneo and Alexandria) is concentrated both the number of companies
that cultivate the vine, with a percentile of 83.5; and the hectares of Piedmont vineyards,
that is about 95% (Tab.3).
Tab.3 Number of wine companies with vineyards, by province
Source: Anagrafe Agricola Unica
65

66
4.3 The Piedmont Wine Cluster Diamond Fig.28 Piedmont wine diamond
Source: Author’s elaboration
4.3.1 Factor Conditions
Geographic Factors
The natural environment factors (soil and climatic conditions) are one of the elements that
give quality and uniqueness to Piedmonts raw materials. The natural factors are the basis
of the development of the sensory profile of the wine, affecting the organoleptic
characteristics and making them distinctive and recognizable (Zanni, Nosi, op.cit).
Given the presence of heterogeneity, unique ground composition and the Mediterranean
climate, it makes the growth of several varieties of grapes possible, both autochthones and
an international variety. Hence, the fifty-eight denominations of origin wines demonstrate
the wide variety of Piedmont vines. The presence of autochthones varieties42 make
Piedmont unique in the world; precisely there are five famous varieties all over the world:
Barberea, Nebbiolo, Dolcetto, Grignolino, Arneis, and Moscato. 42 Taking the definition by Luigi Moio, professor at the University of Naples, native means "variety identity of local identity."

Referring to M.Porter, autochthones varieties with their specificity and originality, allow
them to have a competitive advantage based on their inimitable, uniqueness and they are
linked with a particular area; unlike the international varieties that are easier to cultivate
in several territories. The wines made from these varieties often bear the name of the
territory and not the grape itself, testimony to the deep relationship between the types of
vines and the place of production.
Historical Factors
It was around the fifth century BC that Greece introduced viticulture to Piedmont, and
this was later spread further by the Romans. The secular tradition of winemaking and
wine culture that characterizes Piedmont viticulture represents a unique, competitive
advantage. It is important to highlight that these factors are unique and strategically
useful for Piedmont because the New World competitors are not able to create these
advantages due to their distinctiveness.
Innovation Factors
Piedmont is the Italian region with the strongest investment funded by the region in
research and development in the wine sector. As it will be explained in the following
chapter, several regional research institutes, associations and universities participate in the
process of innovation, which has led to an increase in the competitiveness of the
Piedmont wine industry.
4.3.2 Firm, Strategy and Rivalry
Supply chain
Wine production takes place through three types of upstream integration (Fig.29):
• farm wineries, which produce wine with their own grapes possibly supplemented
by grapes purchased on the intermediate market;
• industrial wineries, that produce wine with grapes exclusively purchased in the
mid-market or in contractual relations or agreements with wine producers
upstream;
67

68
• cooperative wineries43 that produces wine with grapes conferred by their members
and purchased on the intermediate market.
Fig.29 Piedmont wine supply chain scheme
Source: Author’s elaboration
Firm Rivalry
The last agricultural census shows that in Piedmont there were approximately 20,452
companies that cultivated the vine44.The majority have a vineyard area from 0,1 – 0,5 ha,
even they account for less than 4% of the total Piedmont surface area. Yet, more than
70% of the companies have less than two ha45. The presence of micro and small
enterprises characterize the wine industry. Dividing the wine producers by the number of
employees can be seen as in Piedmont there are only two companies with more than 250
employees (Tab.4): the great mass of small producers, with fewer than 20 employees,
accounts for approximately two-thirds of total employment in the sector46.
43 As the Italian Civil Code describes, a cooperative is a company established to manage a common enterprise which aims is to provide to the members themself (mutual purpose) those goods or services for which the cooperative was created. Speaking about cooperative wineries each member that is owner of vineyards and, instead of produce wine with a personal winery, they give their own fruits to the cooperative winery where the winemaking was done. Then, they participate and hare the profit. The vineyards area from where the grapes are picked and then crushed in a cooperative winery generally covers limited area around the location of the winery itself. 44 www.piemonteincifre.it 45 Piedmont data, 2012 46 Istat, 2001

69
Tab.4 Employment and unit local in wine sector Piedmont
Source: Istat, from Vitali 2008
Figure 30a and 30b illustrates the Piedmont production grouping the wine producers into
several range of quantity The Companies that produce no more than 100 hl of wine per
year represent namely 77% of wine producers. However, their production accounts for
only 4% of total production47. Referring to cooperatives, 11 per cent of them represent
over half of the cooperative wine production (56.2%). The majority of Piedmont
cooperatives produce form 10,001 to 50,000 hl, showing an average larger than the whole
of Piedmont’s wine company production.
Fig.30a Piedmont total production (2012) Fig.30b Piedmont cooperative wineries
production (2012)
Source: Ismea, 2012
According to Inea data (2009) the cooperative wineries account for 54 cooperatives, with
more than 14,000 members.
Cooperative winery production represents a relevant portion of the whole production. The
average per cent in Italy is approximately 46% and in Piedmont, it was 32% (Fig.31) in
2011. The cooperative production represented an important concentration tool for the
Piedmont wine industry: more than 70% of the 6,400 company’s members of a
cooperative have less than 2 hectares of vineyards, demonstrating the high correlation
between small farmers and cooperative wine production, with the latter that are able to
47 Ismea, Februrary 2012

70
give a commercial channel to the former. An important aspect is also represented by the
majority of the member are not companies or family business, but people that cultivate
the grapes as a ‘hobby’ or as a second work.
Fig.31 Cooperative wineries contribution in wine production by region (2011)
Source: Ismea, 2012
The industrial transformation has about 280 companies (in particular, located in the
province of Cuneo), which employs 3,300 employees and includes multinational
companies, which are only partially affected by local production48.
These figures demonstrate the huge fragmentation of wine producers and grape growers
that operate in Piedmont.
Institute for collaboration (IfC)
Given the high fragmentation of the Piedmont wine industry, the presence of Associations
that support the wine companies and grape growers in several aspects is necessary.
Associations help with:
• Promotion of their product, both in domestic and international markets.
• Technical and administrative support
• Dissemination of the innovation
The Piedmont consortia49 involved in the wine sector provide different advice to member
companies and performs key functions in the regulation of the appellation of origin
system:
48 Ismea, 2009 49 The consortium is a legally recognized voluntary aggregation that coordinates joint initiatives for the development of certain activities of enterprises or public institution. This type of aggregation can also be made between institutions. Referring to consortia in the wine sector, they are usually involved in the

71
• Protection and control of Appellation of origin wine
• Data collection, prices and market statistics
• Valorisation activities in favour of Piedmont appellation of origin
• Chemical laboratory activities and physical analysis
In Annex.3 the main Piedmonts and Italian Institute for Collaboration are collected.
4.3.2 Related and Supporting Industries
Related manufacturing companies
In the area of Canelli, in Montferrat, there is a district of technologies for the wine
industry in which companies that provide equipment for wine making and bottling
operate. These companies are combined in an association, called “Anformape” (National
Association of Machinery for winemaking and bottling) (Pernicone, 2007). Among them,
Enos and Fimer represent the most important companies.
The former produces labelling machines with glue and adhesive systems for small and
medium wine makers: 9.000 machines installed in the wine cellars all over the world.
The latter has become a leading company in the production of bottler machines, which
provide solutions for filling in all over the world, 18/20% for the Italian market.
The fragmentation and the low level of concentration are characterized not only by the
wine sector but the whole Piedmont industry. Hence, related companies that also provide
product and service need by the wine sector are small and medium enterprises without a
large market share. In fact a myriad of firms are involved in:
• Grape stock
• Grape harvesting equipment
• Bottles
• Barrel
• Winemaking facilities
Related industries
The Piedmont wine industry bares strong similarities with the Tourism and Food industry.
protection and management of the appellation of origin system, focusing on the protected wines labels of a specific area.

72
The last Censis survey shows that Italy has more than 4 million tourist with an annual
growth expected of approximately 8%. According to a survey by Vinitaly and
winenews.it50 in 2011, Piedmont and Tuscany were the preferred destinations for tourists
who were interested in wine.
According to the tenth report on wine tourism made by Censis and the association “Città
del Vino” in 2012, Cuneo was the most highly ranked Italian province in terms of quality
wine producers. Moreover, the provinces of Asti and Alessandria were ranked in the top
ten. There are two main associations involved with the promotion of wine tourism:
• Wine Tourism Movement; a non-profit association with the aim of promoting
wine tourism and improving the wine areas’ image and prestige, as well as their
economic development51. One of the most important events that Wine Tourism
Movement organized is “Open Wineries”, the annual event on the last Sunday of
May in which the wineries that participated make a free degustation during all the
day.
• “Piedmont on Wine”; born in the summer of 2008, Piedmont on Wine is founded
by the institutions of the Langhe and Roero (located in province of Cuneo) wine
sector and tourism, with the support of the Piedmont Region. The aims is to match
the needs of tourists, experts and journalists interested in the wines offering
meeting with wine producers, visits to wineries and cellar doors, information
about wineries and their products.52
4.3.3 Demand Conditions
Wine consumption in Italy has been in decline for the last three decades in terms of
volume, as in the other traditional producer countries. The trend shows a decline of over
30%: From a consumption of nearly 37 mhl at the end of year eighties to less than 25
million in 2010 (OIV, 2012).
Wine consumption per capita stood at just over 40 litres per year compared to more than
60 litres per year almost twenty years ago. From a geographical point of view, in 2010 the
North West, in which Piedmont is located, exceeded the North East, with a percentage of
50 www.winenews.it 51 www.movimentodelvino.it 52 www.piemonteonwine.it

57.8% of penetration. The Centre, the South and the Islands represented the areas with a
lower incidence of wine consumers (Hertzberg, op.cit.).
It is interesting to see the trend of consumption of wines with appellation of origin: it was
elevated even though the total consumption was less, demonstrating an increase in the
demand for quality by the consumer.
Another finding, from Federvini Association (2007) that demonstrates a growing
sophistication in customer preferences, is the relationship between sales of wine in bulk
and package wines: the decrease in consumption seems to be entirely caused by the drop
in sales of bulk wines, whilst packaged wines show a slightly positive trend.
4.4 Sustaining a Competitive Advantage within the Piedmont wine cluster
Having illustrated the cluster environment concerning the wine sector, this section will
analyse the strategies and dynamics that allow Piedmont to remain competitive both in the
domestic and international market. Two factors will be analysed:
• Innovation and Research & Development through public funding:
• Added value of Terroir.
4.4.1 Piedmont’s Research & Development System
The Piedmont wine innovation system is closely connected to the regional institutional
context, governed by regional funding based within the so-called Wine Regional Research
System.
Hence, Piedmont is the first Italian region in terms of scientific research in the wine field
funded internally by a region (Fig.31). The framework through which the Department of
Agriculture of the Regional Government of Piedmont funds science and research projects
in agriculture is called “Regional Programme for Research, Experimentation and
Demonstration”.
The following analysis is based on the work of Morrison and Rabellotti (2006), regarding
the wine innovation system in Piedmont.
73

Fig.32: Number of research in viticulture field with regional funds (2000-2003)
Source: Pernicone, 2007
The main organisations funded by the Regional Programme are public and private
research institutions, such as universities, regional or national research centres and
technical organisations, such as local extension agencies, laboratories, technical high
schools, technological centres.
In this context, collaboration between research institutions and technical organisations is
intended to favour the dissemination of the findings to end-users (e.g. firms), being the
latter key actors in the process of knowledge transfer.
Taking into account the total funding of the Programme in the period under analysis, it is
important to note that there is a continuous and significant increase from 800 thousand €
in 1990 to 2,6 €millions in 2005.
4.4.1.1 The main actors involved in WRRS
Universities
The Faculty of Agronomy within the University of Torino is playing a key role in
research and education on viticulture, offering several courses in viticulture and oenology
at both graduate and undergraduate level. Among them there is a recently established two-
year international Masters degree in viticulture and oenology, in collaboration with other
Italian and European universities.
Besides the University of Turin, other Italian Universities participate in the wine research
projects of Regione Piemonte; even they have been less frequently involved: the Catholic
University of Piacenza and the University of Bologna (Emilia Romagna), the University
of Firenze (Tuscany) and the University of Milan (Lombardy). In all these Universities
74

there are Faculties of Agronomy and departments with renowned research teams
specialised in wine-related studies.
Another important contribution is made by the Oenology School in Alba that offers a
technical high school degree in oenology. Technical schools in most cases participate in
research projects through the use of their laboratories and their vineyards.
The University play an important role also on the dissemination of the knowledge for both
industry and public sector through papers, seminar and convention,
Public Research Institute
The key research institutions participating to the R&D projects are the following:
• Institute of Plant Virology (IVV), a centre specialised on wine-related research
within to the National Research Council (CNR) network. Located at the Faculty
of Agronomy, IVV fulfil both basic and applied research, and offering
consultancy services to the Ministry of Agriculture and Forestry and to local
regional extension agencies as the Regional Advisory Phytopathological Service
and Tenuta Cannona. Its research is based on problems related to the diseases
caused by viruses and the improvement of the sanitary status of vines.
• Tenuta Cannona, a public company owned jointly by Regione Piemonte, some
local municipalities and Vignaioli Piemontesi, the main association of wine firms
in Piemonte. Tenuta Cannona is an experimental farm with its own vineyards and
testing laboratories, conducting research in the field of soil defense, analysis of
clones, wine making techniques and weather forecast techniques.
• Regional Advisory Phytopathological Service (Settore Fitosanitario Regionale
SFR), which is the public body responsible for monitoring sanitary problems in
agriculture. The SFR has three laboratories specialised in phytopathology,
agrochemical and agro-meteorological analysis, which are run by a qualified staff
of technicians.
Technical consultancy and professional oenologist They are winemakers professionals and laboratories and research (private facilities that
work as engineering consultancy) that perform analyses for wineries and assist in the
vineyard and in the cellar.
75

professional oenologist and technical consulting companies were born in Piedmont and in
rest of Italy in the 90s given that the wineries start to need their support in order to reach a
source of competitive advantage through innovation and products differentiation.
It can be divided into two groups:
• Independent professional oenologists. Consultant oenologists who work without a
support structure: they have several clients in the region and rely on laboratories
analysis of internal or external customer for technical analysis. They do not
participate in the process of creating new knowledge, but apply what they learn
with work experience or during conferences and seminars.
• Professional oenologists affiliated with consulting company. Winemakers are
carrying out their professional activities through a company technical advice, with
laboratories where they operate team of professionals, who use equipment
technical edge. This category of winemakers transmits knowledge gained through
experience and participation in conferences as the previous category, but they
participate to the creation of new knowledge. In fact the major consulting firms in
Piedmont, like Sinergo, SAGEA, Enosis, Bilab, Enocontrol, are composed not
only by professionals oenologist, but also supported by a laboratory in which they
also chemical or graduates in biotechnology and innovation food.
Associations and consortia
Vignaioli Piemontesi, the largest association of wine and grape producers in Italy, is a key
player in the Piedmont Wine Regional Research System. The association cover an
important role because they disseminate the knowledge for their associates that are often
represented by small enterprise without the capabilities to be update about the research
and the innovations
The association employs a team of technicians, who work closely with the associated
firms, and particularly, in small firms they are responsible of the whole vineyards
management in terms of agronomic aspect.
Other important actors that participate actively in the dissemination of results to local
farmers and wineries are represented by the consortia.
76

Companies
This category includes wineries in Piedmont (including cooperatives) that are engaged in
research and internal testing. They collaborate both with Piedmont Region, and with
universities or other institutions public research.
Therefore, companies are primarily those that use the knowledge created upstream but
participate to its creation in proportion to the size of the company.
It appears that the Piedmont wine innovation system in term of R&D involved several
actors, form public institution to private companies, from university to regional
associations. This led to a dissemination of information for all levels of the value chain
and made possible for small enterprises not to be isolated.
Nevertheless, there is a diffused opinion that a drawback of the regional system is the
fragmentation of research activities in too many institutes, departments and laboratories
and the duplication of results.
In the figure below (Fig.33) is shown the most active actors in R&D expenditure.
Fig.33: Piedmonts Institution more actively in research (1993 -
2001)
Source: Pernicone, 2007
77

4.4.2 Terroir as added-value in Piedmont wine marketing
A competitive advantage that Piedmont wine has to promote their products and that IfCs
and companies have to take advantage of is the link with territory and the role of terroir.
Given the complexity about the marketing in wines, this section does not seek to argue
about wine marketing, but to explain the importance about the terroir in Piedmont wine.
Originally encoded by the French, the link wine-territory is one of the strongest
characterizations of the Piedmont. More recently, the new international producers (such
as Australia and Chile) have diffused, alternatively, a culture in which the vine is not
linked with their place of origin, in order to close the competitive gap resulting from the
lack of a recognized winemaking history.
The concept of terroir, historically refers to an area or terrain, usually of limited size,
where the soil and microclimate give distinctive qualities to food products (Barham, 2003,
p. 131), is today a multi-dimensional concept and variously interpreted. Over time, in fact,
the word has enriched of meanings, not only attracting more natural features of an area,
but also intangible characteristics, linked with social, cultural and "spiritual" factors of a
place (Wilson, 1998; Rea, D’Antone, 2010). The terroir, given its connotation is not only
physical, but also historical and human, is therefore a means of communication with a
strong symbolic value for Piedmont. In this sense, the terroir becomes competitive
leverage and potentially peculiar brand of a macro system that owns the company and its
offerings.
Considering the scheme and the analysis carried out by Zanni and Nosi (2006), the
concept of terroir (Fig.34) could be composed by three components, tangible and
intangible, which understand better the process of exploitation of wines by the Italian
firms. It is useful to figure out the value that they assume within the strategy of Italian
companies.
78
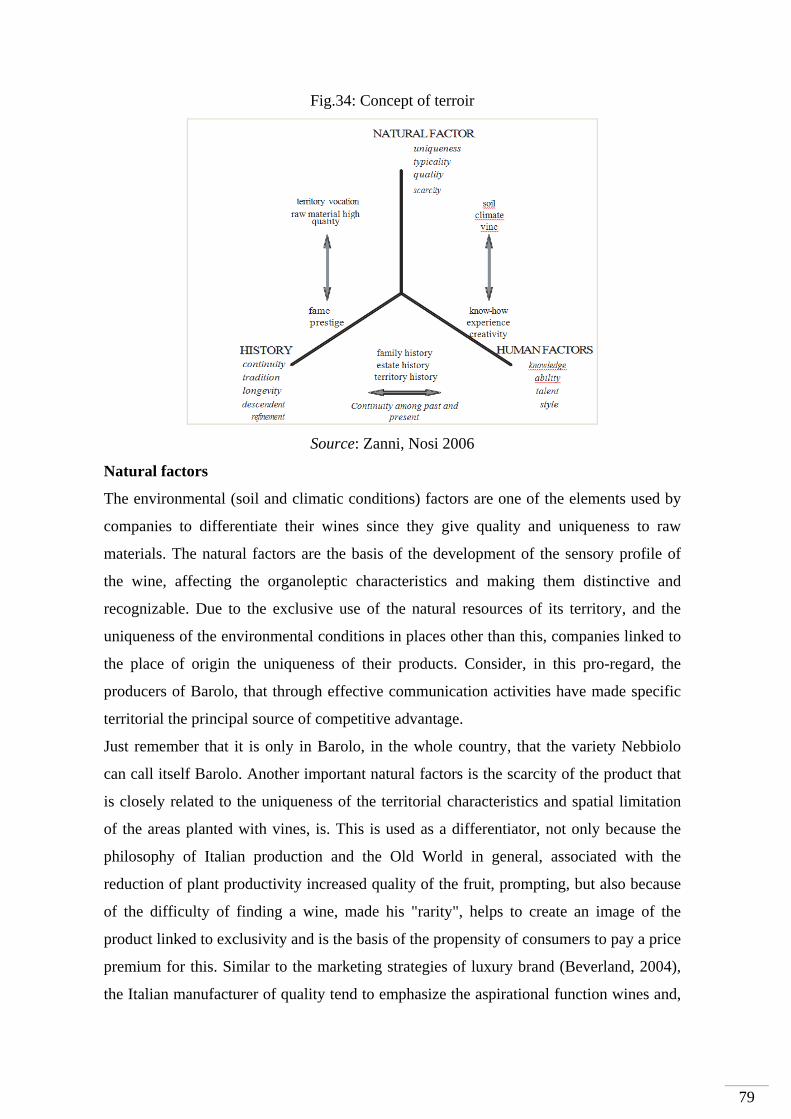
Fig.34: Concept of terroir
Source: Zanni, Nosi 2006
Natural factors
The environmental (soil and climatic conditions) factors are one of the elements used by
companies to differentiate their wines since they give quality and uniqueness to raw
materials. The natural factors are the basis of the development of the sensory profile of
the wine, affecting the organoleptic characteristics and making them distinctive and
recognizable. Due to the exclusive use of the natural resources of its territory, and the
uniqueness of the environmental conditions in places other than this, companies linked to
the place of origin the uniqueness of their products. Consider, in this pro-regard, the
producers of Barolo, that through effective communication activities have made specific
territorial the principal source of competitive advantage.
Just remember that it is only in Barolo, in the whole country, that the variety Nebbiolo
can call itself Barolo. Another important natural factors is the scarcity of the product that
is closely related to the uniqueness of the territorial characteristics and spatial limitation
of the areas planted with vines, is. This is used as a differentiator, not only because the
philosophy of Italian production and the Old World in general, associated with the
reduction of plant productivity increased quality of the fruit, prompting, but also because
of the difficulty of finding a wine, made his "rarity", helps to create an image of the
product linked to exclusivity and is the basis of the propensity of consumers to pay a price
premium for this. Similar to the marketing strategies of luxury brand (Beverland, 2004),
the Italian manufacturer of quality tend to emphasize the aspirational function wines and,
79

consistent with its position in the market, leverage symbolic attributes on the basis of the
prestige and preciousness of bottles.
The natural factors are related to the history as well as human factors. It is linked with the
first because the reputation of the territory is formed and consolidated over time through
the continuity and consistency of quality raw materials, confirming its vocation.
Concerning to the human factors, it is essential the human intervention to fully realize the
potential of the territory itself.
Human Factors
Human factors are one of the most important levers for the valorisation of products by
companies. Piedmont agronomists as well as winemakers are the "interpreters" of the
territory. It is through their knowledge and technical skills as well as their creativity that
are able to maximize the potential of the raw material used for the production of wine. It
is interesting to note that these figures are not strictly related to the place where the
company is located, but can come from different countries or regions.
History
The link to the past is one of the leading elements of business strategies of Piedmont wine
companies. The history of the estate, often inextricably linked to the history of the
owners, leads to enrich the wines with a variety of symbolic attributes able to break open
the imagination of consumers and is one of the most powerful tools of differentiation with
respect to the production of the New World. When the production of wine is an activity
that has been handed down from generation to generation, the marketing strategy of the
company tends to emphasize the history of the family or the story of the estate. The intent
is to emphasize the longevity and continuity of tradition, providing a unique identity to
wines, difficult to imitate by new producers.
All this means that companies are acting in a connotative of the territory on which they
are located, helping to define its image and increase its reputation.
Given this importance, the terroir is one of the main levies for the promotion and
identification of quality in Piedmont, as in the rest of Italy.
It is also demonstrated by the current appellation of origin system in Italy, where
Piedmont has the largest number of labels, is based on the concept of the uniqueness of
the terroir.
80
81
5 Challenges facing South Australia and Piedmont after the Global Financial Crisis
In the last five years the Global Financial Crisis (GFC) has impacted both at an
macroeconomics level, making changes in currencies, interest taxes, prices and cost of
living, and at a microeconomic level, made changes in families and companies.
The wine sector, as all other sectors, has been hit by these changes and the companies
have passed a tough period.
Yet, the period is characterized, as it is explained below, not only by the consequence of
the crisis but also by other tough market and industry situations that have to be addressed.
In this section this report will discuss the main challenging resulting from the GFC and
how the enterprises and the Institute for Collaboration should react to remain competitive.
As it will be explained, some companies have been hit harder than others and, at times,
they have to change key aspects of their strategy in order to remain competitive.
5.1 Challenges facing the SA Wine Cluster
Since 2008/2009 the export-driven growth of the South Australian wine has seen a
decline both in the value and in quantity. Several challenges may compromise the
sustainability of its medium and long-term viability in the global wine market. It is not
easy to define precisely all the factors caused by this situation because they are complex
and inter-linked, but may cluster into two issues – unsustainable margin of premium wine
and oversupply.
5.1.1 Unsustainable unit margin for commercial-premium wine
The low unit margin is a problem that hurt overall South Australian medium and large
wine producers that sell non-premium and commercial premium wine53, both in domestic
market and international market. The following aspects may further explain this issue.
53 Anderson and Negel (2011) define three category of wines: non-premium (below US$2.50 per litre pre-tax), commercial-premium (between US$2.50 and US$7.50 per litre pre-taxes at national border) and super-premium (above US$7.50 per litre pre-taxes). Commercial premium is represented by a 750ml bottle retail in Australia from AUD$4 to AUD$12)

82
Rising cost of producing wine
Vineyard labour costs are higher than competitors and South Australia’s drought situation
made irrigation facilities and water costs higher. These are the most important issues for
the future sustainability of large companies and multinational groups that follow a
strategy based on high quantities and low unit margin. It is getting really hard to compete
on cost with global competitors such as Chile, South Africa and Argentina where the cost
of production, both labour and capital cost production are lower. So that several
companies have transferred the bottle activity in foreign countries to take advantage of a
lower cost both of the activity itself and of the logistic costs to export bottle wine.
Another reason for this change is because of the duties, that are much more less whether
the wine is exported in bulk than in bottle54.
Power of the Supermarkets
Both in domestic and foreign markets, the supermarkets represent the most important
distribution channel in terms of volume. For instance, in the UK, that remains the main
export destination of Australia’s wine in volume terms and the primary recipient of the
increased low-value bulk wine that is being exported, Tesco and Sainsbury and other
minor supermarkets represent 85 per cent of distribution (Nipe at al, op. cit.). In this
situation, the price gets squeezed by the supermarkets, without taking into account the
implications for the margins of producers. For small enterprise it becomes impossible to
put their wines on supermarket shelves without passing through to the wholesale
distributor who have more bargaining power.
Referring specifically to export sales, the current price point for SA wine producers in
export markets specifically to the UK and the USA is getting unsustainable overall for the
commercial wine. The problem of export revenue after the GFC is demonstrated by the
data in the last four years: the value of exports declined by 21% in the UK and 24% in the
USA (PIRSA Scorecard, 2011).
Currency Appreciation
After the GFC, the appreciation of the Australian dollar against both the UK sterling and
the US dollar started, given the high growth rate of the Australian economy. This aspect
54 Interview with Paul Henry

has exerted additional pressure on the margins of SA wine producers in their two most
important export markets. Moreover, analysts suggest that the current value of the
Australian dollar is not a short-term volatility but will remain strong as a consequence of
Australia’s commodity exports
However, rather than the price of Australian wines rising in the US and the UK as a
consequence of this appreciation, the power of the supermarkets made them able to
squeeze further the Australian producers margin without recharging the price to the
consumers.
Tab.4: Changing in value in UK$ (2006-2010)
Source: Hackworth, 2011
Nevertheless, the low margin problem hurt also medium and large enterprise domestically
that based their business in cheap-premium wine with a price of around $7-10. Given high
fixed cost linked with their giant wineries, plant and equipment, their strategy is based on
sell high quantity of bottles and with an attractive and competitive price. The problem for
these big companies is that their costs are so high that the effective unit margin is getting
unsustainable.
Decline of ‘Brand Australia’
When, in 2000, the Australian dollar fell to US$0.5, South Australian large companies
exploited this situation not only by exporting premium and super premium wine, but they
also started to sell tonnes of basic and low quality wine. This strategy was profitable, but
only in the short term instead of building a long-term reputation.
This brand ‘Australia’ certainly helped to open up global markets to Australian wines, but
at the same time the brand did damage the reputation of Australian wine with
consequences because of the lack of a unique market segmented strategy. The result is
that the customers became confused about Australian wine, mainly because they didn’t
have precise information about the brand of high quality wines. The next step should be a
change in the marketing strategy: promoting specific regions instead of promoting
83

Australian wine in order to make the customer aware about the difference of Australian
wines, represented by low and cheap wines but also by high quality wines.
Referring specifically to the domestic market, as Professor L.Lockshin explain:
“When an Australian bottle of wine is sold in a retail for $7-8, the retailer margin takes
$2-3, the wine fees are near $2-3 and the producer keeps around $3 that have to cover
spent on marketing and sales, bottling and labels and wine grapes purchase.”
Nevertheless, the market of $7-8 wine bottles is really different to the market of $20 wine
bottles that is not affected by low margin problem.
Given these facts the GFC hurt the wineries which mainly based their profit on export
market than in domestic market that is why the big companies have been affected in their
business rather than small enterprises. Nevertheless, it is important to notice that some big
companies had differentiated their product range and even the cheap and premium wine is
getting less profitable, they remain competitive with their high quality range products. At
last, also several small enterprises are struggling to remain profitable. This category is
represented by small enterprise with vineyards that suffer of the same problems that
affected the independent grape growers.
5.1.2 The Oversupply
In the short-term, oversupplying represents one of the most critical aspects of the SA wine
cluster. The oversupply started in 2004/2005 and concerned all of Australia (Fig.35). It is
useful to highlight that this was not a problem resulting from the GFC. Nevertheless, it
has contributed to making the situation worse and as analysed by the Wine Grape
Growers Australia (WGGA) in November 2009, at least 20% of bearing vines in Australia
exceeded requirements and the surplus is about 100 million cases.
Fig.35: Supply / Demand for SA Crushed Grapes (2000-2009)
Source: Phylloxera and Grape Industry Board of SA
84

85
From the years 2004 to 2006 the supply of crushed grapes was at least 100,000 tonnes
larger than the demand.
Decrease of grape prices and squeeze of independent grape growers’ margin: some of
them were constricted to sell their grapes without make unit margin and consequently exit
the industry due to their inability to have a sustainable business. Moreover, a study
undertaken by Wine Grape Growers Council of South Australia (WGCSA) figure out that
South Australia grape growers do not exit their business for several reasons, such as lack
of vineyards buyer, high cost of remove vineyards, and lack of other work opportunities.
The most hit region was the Riverland region where more than 15% of grape growers
exited grape production between 2006/2009.
Nevertheless, it is important to highlight that in 2012 the problem of oversupply in South
Australia has mitigated because of three key factors:
• The growth of exports to China, that allowed the exceeded supply of wine to be
absorbed55;
• The low production vintage in 2010, 2011 and 201256.
• In the Riverland region, the biggest South Australian wine region, the increasing
demand from the four biggest wineries in the region (US-owned The Wine Group at
Loxton, Kingston Estate, Accolade Wines at Berri and Angove Wines at Renmark)
contributed to reduce oversupply and increase the price of grapes57.
Below, there are several factors that contributed to the oversupply.
Increase in growers and vineyards in the past two decades without boundaries
The boom of the 1990 and 2000 made the wine sector attractive and lots of new growers
entered the industry. This process was an incentive introduced by the government who
had reduced fees for planting new vineyards with tax breaks in 199358.
Uneconomic grapes
A study undertaken by the Wine Grape Growers Australia (WGGA) on the viability of
Australian vineyards shows that 17% of the fruit being produced in Australian vineyards
are ‘uneconomic’ due to their high cost in spite of the quality being achieved. This excess
55Interview to K. Teusner 56Interview with P. Hackworth 57The Advertiser: “Turnaround for Riverland grape growers”- Meredith Both, 10/07/2012 58Interview with P. Hackworth

86
in volume, made the grape growers industry unprofitable: in 2009 at least 27 million cases
of wine were sold below cost.
Moreover, amongst many grape growers in SA there is a lack of understanding of the
uncompetitive nature of low quality wine. This perspective is particularly prevalent
amongst the so-called ‘lifestyle’ or ‘hobby’ farmers in South Australia, farmers who have
a second income and are therefore able to sustain protracted financial loss. Nevertheless,
an important aspect comes out from this situation: the grape growers, even their grapes
were no more profitable, kept to cultivate them just because in short-medium term they
lose less money than they would have lost if they did not cultivate. This is an intrinsic
factor in wine business that concerns not only South Australia but the worldwide wine
sector.
Bullwhip effect59 within the supply chain
Bullwhip effect represents another factor that increases oversupply. In South Australia the
wine supply chain is characterized by many grape growers that sell their fruits to the
wineries, making the first completely dependent to the latter. A change in market demand,
due to lack of quick information within the supply chain, is seen later by the grape
growers and produce more than the demand needed.
Long term contracts
During the beginning of 2000 several wineries, overall medium and large wineries,
stipulated long term contract with grape growers, in this way there is no incentive to a
grape grower to respond to shifts in the market because they were locked into multi-year
set price contracts with producers. Two situation happened when the market price of some
variety felt down, depending by the type of long term contract stipulated: if the contract
was stipulate with fixed price, the wineries were in a tough situation, because of they still
bought at the price decided even the market price was lower; in opposite, if the contract
included market price option, the grape growers had to sell their grapes to a low price,
risking their profitable.
59 The bullwhip effect on the supply chain occurs when changes in consumer demand causes the companies in a supply chain to order more goods to meet the new demand. The bullwhip effect usually flows up the supply chain, starting with the retailer, wholesaler, distributor, manufacturer and then the raw materials supplier. This effect can be observed through most supply chains across several industries; it occurs because the demand for goods is based on demand forecasts from companies, rather than actual consumer demand.

87
5.2 Challenges facing the Piedmont Wine Cluster Given the historical period where European countries are experiencing, several issues are
impacting on the sustainability for the wine sector in Piedmont and all over the Europe in
general. The crisis affected the whole sector, nevertheless some companies are more
affected than others and the viability of their business is no more sustainable without
some changes.
These firms are micro and small enterprise that base their revenue on domestic market
without look over the Italian market60. Yet, as it will be explain the majority has not a
management with a knowledge of strategy and marketing but more on agricultural and
technical background that leads to a low knowledge about the market trend and the
changing that wine sector is doing in these last decade.
It may group the main issues into three group: macroeconomic, management and industry
structure issues.
5.2.1 Macroeconomic issues
The challenge carried by GFC, European crisis and Italian political61 situation have led to
several effects both in consumer and in the wine producers. In this section are briefly
presented three effects of this situation.
Decline of purchase power by the family
The increase of carbon, inflation and income taxes in the last two years has affected the
Italian population and has led to a decline in family savings over the past few years: in
2012, their value, according to the Istat data, was the worst data since 200062.
Household income, as measured by a survey of the Bank of Italy, are even lower than
those of 199163. Yet, this trend is continuing: in the second trimester of 2012, Istat refers
that the purchase power by the family is still in decline (-4.1% in respect to one year ago).
A survey made by Coldiretti and Swg64, point out that alimentary purchase was reduced
by 17% in the last year. Yet, between 2008 and 2012, Italian families reduced the budget
60 Interview with A. Ferrero 61 Refer to more specific text to explore the topic 62 http://www.ilsole24ore.com/art/notizie/2012-10-09/crisi-potere-acquisto-famiglie 63 http://www.federconsumatori.it/ShowDoc.asp?nid=20120126112351&t=news

88
for food expenditure by11 billion €, and the food of today actually cost 6% more than the
EU average65.
Given that wine is not necessarily an alimentary good, this data represents a threat to the
wine companies that may see a further decline in wine domestic consumption.
High taxation in agriculture sector66
The reforms to address the financial crisis consisted of an increase of taxation and were
not positive for agriculture. The increase of taxation went from 100-400%.
The first issue for the farmers and associated organizations is the introduction of a new
tax, called Imposta Municipale Unica (IMU), that consists of a tax on real estate. This
type of taxation was never applied to agricultural land and farm buildings. The new IMU
provides for the upward revision of all cadastral income and will tax the lodgings and all
property used for agricultural enterprises as cellars, warehouses, sheds, garages for tools,
farmhouses and agricultural employees' homes. All structures are often very extensive, so
their eventual taxation will produce figures for farms, especially in this time of crisis and
difficulty, you cannot afford to pay. The cadastral income will increase to around 50%.
The farms at a great sacrifice, have been the only ones who up to now have not dismissed
people. Now in the face of this new setback in taxes, one wonders if they can maintain
current employment levels and maintain their commitment to protect and safeguard the
environment.
More significant is the increase in excise duty on fuel, which may lead to a rise in the
price for immediate consumption of goods transported by road (about 90% of the food).
The diesel fuel is used for heating greenhouses, for the supply of mechanical means. The
fuel price increase has pushed the production costs of farmers up by 7.6% pa.
5.2.2 Management issues The changes resulting from globalization and the GFC make it clear that there is a lack of
skilled management people in Piedmonts small enterprises.
64 http://www.swg.it/ 65 www.universofood.net/index.php?option=com_content&view=article&id=642 66 Interview with R.Mirandola

89
Unskilled management67 characterize the majority of micro and small farming wineries
and small cooperative wineries. Regarding the first, this type of small enterprise presents
a lack of a corporate structure of the company itself and often the farm’s owner is often
also the winemaker and the grape grower. His knowledge is more technical and based
more on his experience in the vineyard work and wine making process than in
management subjects. Nevertheless, also small enterprise where the corporate structure is
more organized; present a huge lack of management skills in term of strategy, marketing
and finance. Regarding the strategy, Rossi underlines: “Entrepreneurs do not always
know this word; they cannot distinguish between strategic and operational decisions. For
instance, they are not aware that the choices of distribution channel have a strategic
validity, or that corporate communication is not just advertising.”
Regarding marketing - in terms of knowledge of the market trends, consumer’s
preference, and distribution channel - he explains: “Too often, these wine producers have
not understood that they need more of these skills than agricultural skills. There are two
fundamental investments: marketing and finance. Marketing is essential because it is not
enough to produce a quality product: it must be positioned in the minds of consumers, its
value should be communicated and must be "brought" to the consumer.
The lack of entrepreneurial skills is a consequence of the vision of the wine activity more
as “lifestyle” than a business; they do not care about new business opportunity and their
business just survives with their loyalty to local clients. Yet, the owner of the firms often
were just grape growers that started to make and sell wine, without the background
knowledge about management and marketing.
This lack of an organized corporate structure and unskilled management leads these firms
to have a limited vision about the markets and opportunities: they look at the globalization
as a threat instead as an opportunity68, in this way they don’t try to enhance their
capabilities, but remain in local market hoping that their business remains profitable.
Often these companies do not worry about the change of consumer preference69 as New
World producers do and are characterized by a product approach for which, according to
them, the high quality is enough to reach the consumer.
67 Interview with S.Zucca 68 Interview with M.Rossi 69 Interview with R. Mirandola
Yet, the lack of relationship with distributors also represents another consequence: both
small cooperative wineries and farm wineries sell their product directly to the consumers
without having the relation with supermarket or wholesalers, limiting their sales and
revenue margins.
5.2.3. Industry structure issues
It is possible to pinpoint two distinct types of micro and small companies most affected
by the crisis between grape growers that give, as members, their fruits to cooperative
wineries and micro farm wineries.
The first are in crisis for three main reasons:
• wineries are paid for grapes only after the entire product has been sold, so
normally more than one year after the harvest. This issue is interlinked with the
capacity by the firm to have a financial plan in order to make their business
sustainable even when their income cash flow at a low frequency
• the price of grapes (with the exception of Muscat grapes) in recent years has been
very low and did not cover full costs of production. A lot of grape growers
continue production even when their grape business is no longer profitable
because they have other income coming in.
In reference to the micro farm wineries, the problem is strictly interlinked with their
business approach discussed in the previous section: some of these firms think about wine
more as a lifestyle than as a business and have minimal knowledge about market trends
and consumer preferences.
Given the globalization and the decline in domestic demand carried by the European
crisis, several issues threaten the competitiveness of the Piedmont wine industry:
• difficulty to reach economy of scale and bargaining power with distribution
channel: given a low quantity production they are not able to reduce unit cost of
production and to increase their efficiency
• high domestic competition carried on by the high industry fragmentation: this lead
to a low margin for the wine producers given the presence of a myriad of
enterprises
• oversupply in domestic market and further squeeze of grape price.
90

However, the industry fragmentation also leads to positive aspects: the heterogeneity and
the differentiation of the products, the wineries and the winemaking process may be
representing a competitive advantage for the enterprise, overall on international markets.
A factor that limits the competitiveness of the firms is that there is not a precise marketing
or strategy to promote wine both in the domestic and foreign markets by the institution.
As Dott. Stefano Aimone explains: “The consortiums and associations of producers
support the companies or for legal issues either providing services, but they do not act as
an aggregator element in terms of marketing and common promotion strategy”.
Each business does promotion for itself and there is no help or incentives by public
institutions for a better understanding of market trends and then marketing the product.
This issue is the result by the high fragmentation that is characterized the Piedmont wine
industry.
Moreover, the lack in business skill is concerns also the corporate economy, today
essentially for the small enterprise need to better understand their financial account and
their cash flow in order to know how to hedge their business during declines or flat
periods that characterize the wine business. As Rossi explain “it is crucial because often
the financial resource is not scarce, but is used in the wrong way, inefficiently. More
attention to the investment policies, greater propensity to know the sources of financing,
these are the things to consider”.
Interlinked with inefficiently financial resource is the low attention to the reduction of
their cost: without skilled management these types of companies are often inefficient in
terms of production and distribution costs.
91

6 Suggestions to the South Australian and Piedmont wine clusters
6.1 South Australia
Some suggestions to the South Australian industry are provided in this section focussing
on marketing strategy, export factors and value chain issues.
6.1.1 Promoting the Geographic Indication System (GIs)
The Australia Wine and Brandy Corporation has played a central role in marketing and
branding Australian wines in key export markets in order to attract people that are not
aware of Australian wines. Now, forwarding order to move forward the following should
be considered:
• branding and marketing should be devolved to the regional and sub-regional levels
in order to highlight the uniqueness of each region.
• The promotion of GIs system should be implemented in both domestic and in
international markets.
• Given the wide wine produced in South Australia, and in Australia in general, it is
necessary to differentiate and make the consumers (international markets) aware
of the presence of high premium and iconic wine.
By promoting GIs it also could be useful to review the reputation in Anglo-Saxon
countries, where the majority of wine sold is non-premium as a bulk and commercial-
premium. Nevertheless this type of marketing has already started with several programs
with the aim to support regional promotion abroad and the GIs.
It is important to penetrate the market not only through a private brand of the companies,
but also through the geographic region in order to create an add value for the product
within the region.
92

93
6.1.2 Taking advantage of currency appreciation
The appreciation of the AUD, although one of the factors that made exports go into
decline, could represent a positive aspect in rebuilding the reputation in the Anglo-Saxon
market where Australian wine is often considered cheap wine70. Australian low quality
and cheap wines will likely be more expensive than New World competitors such us
Chile because of Chile’s lower cost and lower currency value. In this situation, it will be
more profitable for Australian companies to sell high quality wine than cheap wines.
In other words the appreciation of the currency could be an incentive to turn wine
production toward high quality and promote their products also with high price.
Taking this into consideration, it is also important to notice that at a company level, if
they have a huge presence in supermarkets and sell millions of litres of commercial-
premium wine, it will be really difficult to see them changing their strategy if they are
profitable71. That is also because the big companies need to sell high quantities of wine to
survive, given their business structure based on giant plants and fixed costs, so it is
meaningless to say that they should change their business toward high quality.
Nevertheless, given the low margin problem overseas they should consider investing in
marketing campaigns in order to enhance their reputation and sell their wine with a better
margin.
6.1.3 Diversify distribution channels
For the small-medium enterprises that do not have to make high selling volume to
survive, it could be important to diversify the distribution channels in main export
markets: they should move away from distributing wine through only large supermarkets
and explore alternative distribution channels. Also the small enterprise, through
wholesales and export entries could benefit in selling their product in boutiques abroad
and the retail sector. This would tackle the challenge of the large power disparity of SA
wine producers in relation to the supermarkets, but also assist with creating a more
distinctive and exclusive identity for the wine of South Australia’s regions.
70 Interview with K. Teusner 71 Interview with K. Anderson

94
6.1.4 Consolidation into new markets and diversifying international markets
More than half the actual exports rely on Anglo-Saxon markets. Given both the current
instability of the financial global markets and the consequent volatility of the currency
and the fact that consumer preference could be influenced and quickly changed, it is
important for South Australian companies to diversify their markets in order not to be
dependent by these two countries. China and India could represent two new markets with
opportunities. India, even if there are protection laws and wine is still considered just an
occasional beverage, the consumption growth was 5%.
It is China that represents the most important market with a consumption growth at about
20% and a sharp growth in value imports near 77% in 2008-200972.
Nevertheless, Australia represents the second highest importer country in China behind
France. Considering this, it is important to penetrate the market placing attention to the
reputation in order to make China not only a short run profitable market, but to build a
strong reputation.
So that it is important to create a great differentiation in wine but not more promote it as
‘Brand Australia’73, but put more attention on the GIs system. The China market is also a
key determinant for South Australia to reduce the problem of oversupply; in fact a lot of
China’s wines are blended with Australian bulk wines74.
Nevertheless, it is difficult to think that the growth in China market could be similar to the
export growth in the last boom: the different lifestyle, culture and language between
Australia and China make it more difficult to create a long term relation as in USA and
UK where these aspects are similar75.
6.1.5 Cooperation between grape growers and wine producers
It is necessary to reduce the bullwhip effect and to better understand the market dynamics.
Currently, grape growers are not able to quickly respond to the changes that have taken
place in the market because of an inadequate understanding of consumer trends.
72 http://www.inumeridelvino.it/2011/03/importazioni-di-vino-in-cina-aggiornamento-2010.html 73 Interview with K.Teusner 74 Interview with K.Anderson 75 Ibid

95
Yet, they should better understand their cost structure for vineyard management in order
to be more efficient.
On the other side, there should be a sort of understood cooperation between medium and
larger sized wineries and grape growers that should not exploit their bargaining power
squeezing too much of the grape growers margins.
6.1.6 Incentive for grape growers
A lot of grape growers still cultivate grapes that are no longer profitable for several
reasons76 and it seems really hard and difficult to make them change their business. The
only way is by incentives that make grape growers shift their production from
uneconomic fruits to economic fruits supporting them in removing vineyards.
Actually this recommendation is far from a possible to implement by state and industrial
bodies.
Yet, while overall in the United Kingdom the reputation of Australian wine is in decline
due to cheap wine (Chandler, op.cit.), it is important to notice that in Canada77,
Singapore, Switzerland78 the reputation of Australian wine is still strong as a result of a
better penetration into high quality segments.
6.1.7 Exploiting growth in the domestic markets.
Australian cultured wine is now different from twenty years ago and people appreciate
and are aware of good quality Australian wine. Nevertheless, imports are growing and
customer preferences could quickly change preferring European wine. So taking that into
consideration, South Australian companies should invest in marketing promotion not only
abroad but also all over the Australia. They should keep promoting cellar doors and
promoting their high quality wines not only for their loyal consumers in their surrounding
countryside but more broadly in the big Australian cities. This channel represents the
most important for small-high quality producers necessary for their future viability.
76 See ‘Responding to oversupply: SA wine grape growers hold on’ October 2012, Peter Hackworth and Sandy Hathway 77 Interview to K.Teusner 78 Interview to L.Lockshin

6.2 Piedmont Recommendations to the Piedmont sector concerns micro and small enterprises and the
importance that exports can have for their sustainability.
The objective is to expand and further improve the presence of Piedmont’s products in the
traditional importing countries and then grow rapidly into new markets. Referring to the
latter, it is necessary to identify the need to understand the market, because it is very
different in terms of culture, tradition and organization of economic relations. Their
growth potential is likely to develop in a period of medium length and some of these
markets will be accessible to smaller enterprises (SMEs) only if they are integrated into
networks capable of counterbalancing their individual weaknesses.
To achieve these objectives, companies need to grow their marketing skills, enhancing
their ability to generate competitive advantage and renew policies.
Companies should aim to have organizational models that are able to improve their
acquisition skills of key resources (among them knowledge) necessary for acquiring and
retaining strength, stability and authoritative relationships with customers and other
relevant stakeholders in markets where changes are rapid and unpredictable.
The new wine association Common Market Organization (CMO), established on 1
August 2008, is proposed as a tool to increase the competitiveness of European wines, to
give balance to the market by removing surplus wine production and non-
competitiveness, to allow a rapid restructuring of the sector, to ensure environmental
protection in wine-growing regions and preservation of quality policies and to simplify
the rules for appointing the interests of producers and consumers.
6.2.1 Building strategic visions within small enterprises
Small enterprises should be paying more attention towards the investment of resources
into strategic issues:
• Identify the best competitive strategies used in this field, analysing the
competitive environment and market
• Acquire the basic principles to build an effective accounting system of a
company and to design an adequate system of management control in order
provide for the monitoring of dynamic financial analysis of the costs
96

97
associated with management and support decision-making processes of
operational and strategic
• Develop skills in marketing for the wine sector, knowing languages,
techniques and strategies
• Presenting techniques and methods of distribution and logistics specific to the
various types business and the different business models.
• Collection and analysis of the costs, as well as the construction of an effective
cost reporting system
• Annual financial cash flow planning, in order to address the period with no
income cash flow.
It is important to underline that it is unrealistic to think that an owner of a small company,
after years of work, could start to think in this way and change their approach79 learning
these difficult management subjects.
Hence, the following recommendation could represent a solution:
• To be supported by Association and IfCs it is not only in the technical and
administrative field but also in the management of the companies itself;
• To rely on the next generation of wine producers who either purchase or
inherit companies, the management of these companies should have economic
or management background knowledge as in all industrial sectors to manage
an enterprise.
• To invest in an external consultant to periodically help the company and
together develop a medium-long term strategic plan.
6.2.2 Exploit export opportunities The interviews undertaken with several experts in the Piedmont wine sector illustrate that
all agree with the belief that, given the decline of the domestic demand due to the
macroeconomic situation, exports should represent a revenue source, which is also true
for small enterprises.
Obviously, export opportunities could be found just by those enterprises that hold enough
capability to be competitive in foreign markets: these capabilities concern the capacity to
bear expenditures both in marketing and product promotion and in the creation and
79 Interview with R.Mirandola

98
maintenance of the distributor’s relationship. To do that, an organized corporate structure
and a strategic vision are needed, returning to address the first issues explained before.
The factors that could make exports a source of revenue for small enterprises as well are:
• the great reputation of Made in Italy all over the world, overall in Japan, Korea,
China and in the USA80. So that, craft products, such us high quality wines have
enormous potential.
• The high instability of European economics led the EUR to depreciation and this
factor could represent an advantage for wine exporters.
• The more sophisticated consumer preferences in the USA, UK and Australia could
be an important change in the appreciation of Piedmont wines, sometimes too
complicated for consumers.
6.2.3 Investment marketing
Quality is not enough to be competitive: the wine has to be sold through marketing
campaigns that demonstrate the uniqueness of the intangible assets Piedmont wines
possess. Piedmont small companies have to focus on the exclusivity of their products and
on the intangible assets that Piedmont wines hold: the history, the territory, the tradition
and the intrinsic culture of Piedmont region81. These aspects are not imitable by any
country, and based on these factors, the Piedmont wine industry could take advantage of
its competitors. Two important intangible assets should be promoted both for the
domestic and international markets and for tourism, in order to acquire add value:
• the importance and the uniqueness of terroir on his myriad of faces, natural,
historical and human factors;
• the Piedmont wine not only as a product but as a “lifestyle”.
Moreover, internet is an essential channel of which enterprises should take advantage,
combining the experience of traditional communication with new technologies. Web
marketing can bring wine companies new business opportunities, consolidate market
shares, increase brand awareness, acquire new customers and increase sales.
80 Interview with N.Reinisch 81 Interview with A. Ferrero

99
6.2.4 Cooperation within the Piedmont Cluster actors
To compete in the international market, it is necessary to create a network where firms,
associations, consortia, Piedmont regional and province institutions are interlinked, so
that the marketing and the innovation processes can be lead efficiently82, with the aim of
promoting all the Piedmont wine areas. For instance, even though there are 22 consortia
that support small companies, they are often separated and each consortium supports only
one wine area. It is necessary that the whole of Piedmont, or at least the provinces of
Cuneo, Asti and Alessandria, is represented by one single association or consortium, so
that a common strategy in terms of marketing and export penetration can apply83.
In reference to this, it is important to note the establishment of a new consortium, called
“Piedmont: Land of perfection” that involves the six most important Piedmont consortia
and one cooperative winery84. The aim of the consortium came about in July thanks to the
mediation of the region, and it will be a central structure for the promotion and the
management of funds. The goal is to establish critical mass markets; overseeing the
consolidated markets and identifying new export market opportunities to make the
companies penetrate directly into these markets.
82 Interview with M.Rossi and S.Zucca 83 Interview with S.Aimone 84 The seven juridical members are: the Consortium of Asti DOCG, the Consortium of Barolo, Barbaresco, Alba, Langhe and Roero wines d'Acqui Consortium, the Consortium of Vini d'Asti and Monferrato, Manufacturers Moscato associates, the Winegrowers Piedmontese, the Cantina Sociale di Canelli.

Findings and conclusion
The analysis of the Piedmont and SA wine sector carried out in this report highlight
several findings.
The first group of findings concerns clusters: the cluster analysis shows several
differences (Tab.5) of cluster structure and competitive advantage. The table below shows
the key differences between the two clusters.
Tab.5 Key differences between the South Australian and Piedmont wine clusters
South Australia Piedmont
GIs Appellation of Origin system
International vine Autochthones vine
Master Blend Oenologist
Centralized R&D Decentralized R&D
Oligopolistic industry Industry extremely fragmentized
Young infrastructures Old infrastructures
Industrial and State bodies Myriad of Cooperation and Consortia
Common marketing strategies Fragmentized marketing strategies
Innovation and tradition
Blending process
Knowledge of consumer preferences
Extreme emphasis on labels and
packaging
History, Culture as intangible asset
Wine as lifestyle
Made in Italy
Extreme emphasis on Terroir
Source: Author’s elaboration
The other important finding concerns the whole strategic positioning that the companies
in Piedmont and SA, which represent the New World and the Old World competitors
respectively, might apt in the current industrial situation. The group of findings also
concern the GFC and how the companies have been affected. These results are illustrated
in the figure below (Fig.36) and summarize the highlights of the wine sector.
100
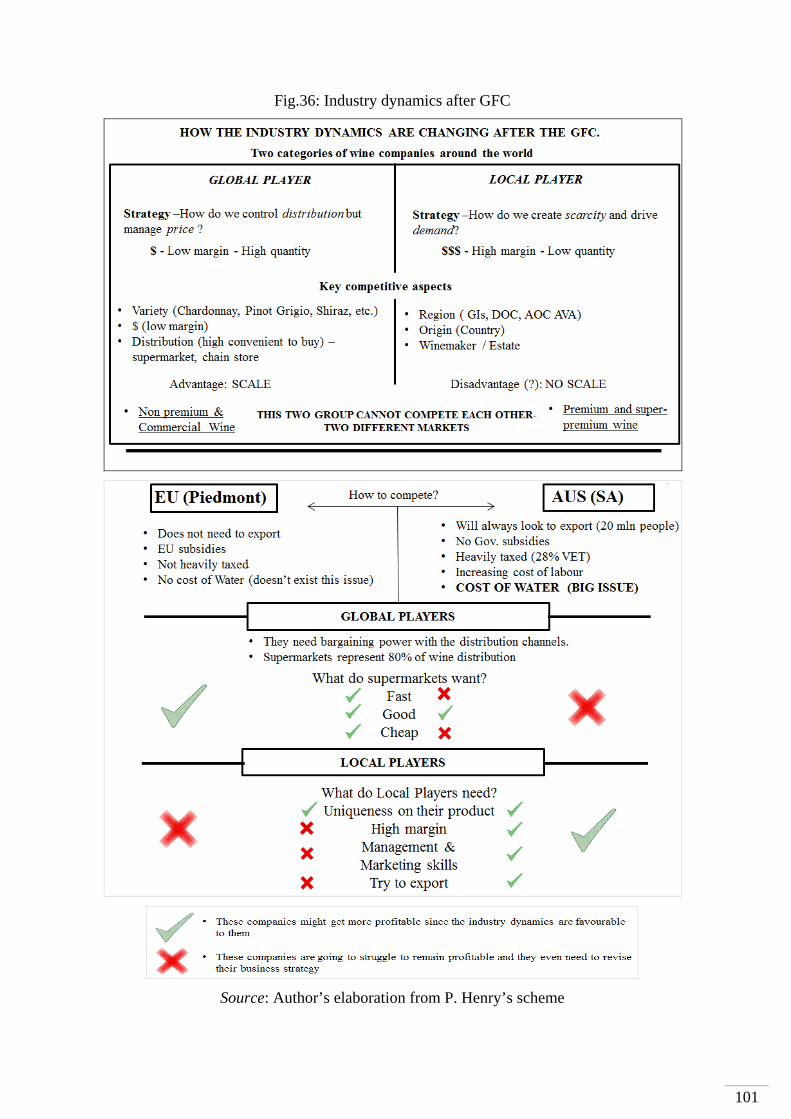
Fig.36: Industry dynamics after GFC
Source: Author’s elaboration from P. Henry’s scheme
101

The GFC has represented the trigger of a new market change all over the world and both
clusters in the wine industry have been affected. This means that the companies have had
to adapt to these changes and find new business opportunities to remain competitive in the
short and long term.
In Piedmont, the companies most affected are the micro and small enterprises (local
players) who don’t fully appreciate the need to change their strategies and so they
continue to follow the same business models they have in place, and hoping they will
survive. In South Australia, the actors that suffer proportionately through a loss of profit
are the medium and large enterprises (global players) who base their revenue on the
overall sales in english speaking countries.
This is the big and most interesting result: even though the GFC has damaged both the
areas analysed, the affected companies are different.
However, as in Piedmont and South Australia, the small enterprises, including small
grape growers with a minimal level of knowledge in financing, marketing and corporate
economy, are affected when it comes to business profitability. This type of inertia is
apparent both in South Australia and in Piedmont, highlighting the fact that these
companies believe that they do not require a sound management structure as is necessary
in the case of industrial activities. It does not refer to the terms of homologation of wine
products, as in the manufacturing sector, but in terms of management. It means that in
order to better understand the financial resources available and to find more efficient
ways to use them, more attention should be focussed on costs, not only in production
costs but also in marketing and sales costs. It also means understanding that marketing is
not only a communication activity, but a strategic activity interlinked with the choice of
distribution channels, the logistics and the production itself. In order to be able to
understand these issues, all enterprises need to increase their knowledge of marketing,
strategy and economic fields.
Referring to South Australian SME’s and large enterprises the situation is not going to be
better in the next few years because of the high production costs (including the increase in
labor and water costs) and low profits. This aspect might lead these companies not only to
move some activities abroad, such as bottle activities, but even to transfer their whole
production activities outside of Australia, seeking new countries where wine production is
much less expensive whilst exploiting cost advantage and to become more profitable.
102

Further, interesting results drawn from the research are the fact that some elements that
enable the Piedmont industry in becoming more competitive are reflected by some of
South Australia’s competitive elements. However, some of the competitive tactics used in
Piedmont, as an Old World representative could also be implemented and promoted in the
South Australian wine sector. Precisely, the Piedmont enterprises could focus on: the
consumer preference as a driver of the strategic company plan, the importance in the
promotion of intangible assets and wine marketing; the understanding that quality is not
enough to make a wine profitable, the importance of common strategy both in the
innovation process and in marketing promotions overseas. On the contrary, the
importance of a region’s promotion, the creation of scarcity and the add-value that the
terroir might give to wine, are elements that South Australian companies could better
implement to promote their product. Finally, while Piedmont could pay more attention to
exporting, South Australia could pay more attention to their domestic markets.
Besides the issues that both the cluster have to address, it is important to point out that in
the last few years some changes have already been taking place both in South Australia
and in Piedmont. This demonstrates that in both the systems ‘Cluster elements’ are
intended as a competitive advantage, where various companies, institute for
collaborations and related industries are connected, could represent the strong elements
that make addressing the current challenges possible.
In conclusion, some attention should be noted that the wine sector has always exhibited
and always will exhibit periods of high growth and highly profitable business, as well as
periods of decline, oversupply and low margins. Further, the changes in global dynamics -
such as currency changes, consumer preference shifts, new world competitors, alcohol
taxation and import/export tuition - can always be helpful to some countries and
detrimental to others. This is the nature of the wine business and every competitor - if
they want to remain competitive and sustain the viability of their business - should adjust
their strategic positioning, taking into account the market conditions and the industry
dynamics that characterize the present period.
103

References Aimone, S., Percivale, F., Peira G., Ciocchetti E. (2002).La cooperazione vitivinicola in Piemonte. Quaderni di Ricerca. Ires Piemonte
Aimone, S., Cagliero, R., &Cominotti, C. (2005). Filiere Politiche Agroindustriali in Piemonte. IresPiemonte
Akerlof, G. A. (1970) The market for “lemons”: quality uncertainty and the market mechanism, The Quarterly Journal of Economics, vol. 84, n. 3, pp. 488-500.
Anderson, K., &Nelgen, S. (2011). How does Australia rank in the various quality segments of the world ’ s wine markets? Wine Economics Research Centre Wine Policy brief No. 3
Anderson, K., &Nelgen, S. (2011). Wine’ s Globalization: New Opportunities , New Challenges. Wine Economics Research Centre Working Paper No . 0111.
Anderson, K. (2010). The New World in Globalizing Wine Markets: Lessons from Australia, Wine Economics Research Centre Working Paper No. 0910
Anderson, K. (2010). Contributions of the Innovation System to Australia’ s Wine Industry Growth. Wine Economics Research Centre Working Paper No. 0310
Anderson, K., Nilgen S., Valenzuela E., Wittwer G (2010). Economic contributions and characteristic of grapes and Wine in Australia’s Wine Regions. Wine Economics Research Centre Working Paper
Australian Bureau of Statistics, 2012. Australian Wine And Grape.
Aylward, D. K. (2006). The road to innovation�: experiences in the Australian wine industry. University of Wollongong Research Online.
Barbera F. (2010). Cultural Trauma and Institutional Change: the Rise of Quality in a regional Wine Production Market. University of Turin
Barham, E. (2003). Translating terroir: the global challenge of French AOC labeling. “Journal of Rural Studies”, 19, 2003, pp. 127-138.
Beverland, M. (2004). Uncovering “theory-in-use”:building luxury wine brands. “European Journal of Marketing”, Vol. 38, 3/4, 2004, pp. 446-466.
Cagliero, R., Trione, S. (2009). La competitività delle aziende vitivinicole piemontesi. Inea-Sede regionale per il Piemonte. Analisi Regionali 2009.
Chandler, N.(2010). Economic Issues No 27, Identifying the Main Economic Issues Facing the South Australian Wine Industry. South Australian Centre of Economic Studies.
104

Cooke, P. (2006). Problems and Prospects for Clusters in Theory and Practice. Centre for Advanced Studies, Cardiff University, DIME – Disseminating to and Interacting with Stakeholders, http://eprints.qut.edu.au/archive/00011222/01/11222.pdf
Davies, T., Edwards, D., Henschke, P., Hodder, S., Hook, J., Jaensch, L., Leake, M., et al. (2012). South Australian Winegrape Crush Survey 2012. Phylloxera and Grape Industry Board of South Australia.
Freeman, S., &Weinman, D. (2000). Benefits of “ clustering ” and niche strategies�: how SMEs in the Australian Wine Industry can develop a competitive advantage for international expansion . Globalisation�: Implications for Industries, 465–470.
Giuliani, E., Morrison, A., Rabellotti R. (2011). Innovation and Technological Catch up: The changing geography of wine production. Cheltenham: Edward Elgar
Government of South Australia (2010). Wine: A partnership 2010-2015
Government of South Australia-PIRSA (2009). Grape & Wine scorecard report 2007-08
Government of South Australia-PIRSA (2010). Grape & Wine scorecard report 2008-09
Government of South Australia-PIRSA (2011). Grape & Wine scorecard report 2009-10
Government of South Australia-PIRSA (2012). Grape & Wine scorecard report 2010-11
Hackworth P.(2011). Background Paper: The Oversupply of Winegrapes in South Australia. Wine GrapeCouncil of South Australia.
Hertzberg A. (2008). La domanda di vino in Italia�: analisi delle preferenze del consumatore. Università di Bologna. Dottorato di ricerca in economia agraria.
Ismea (2012). Gli scambi internazionali e nazionali nel 2011. Ismea (2012). Il mercato del vino: la congiuntura. Meeting della Cooperazione Piemontese. Jarvis, W., Rungie, C., Lockshin, L. (2003). Analysing Wine Behavioural Loyalty, International Wine Marketing Colloquium, Adelaide, luglio 2003 Malorgio, G., Grazia, C. (2006). The Economic Regulation of Quality in the Italian VQPRD sector: new perspectives?, 3rd International Wine Business & Marketing Research Conference, Ecole Nationale Supérieure Agronomique, Montpellier, 6-7-8/07/2006. Marshall, A.(1920). Principles of economics, 8th edition, London: Macmillan (original publication, 1890). Morosini, P. (2004). Industrial Clusters, Knowledge Integration and Performance, World Development, Vol. 32 No. 2 pp. 305-326.
105

Morrison A., Rabellotti R. (2006). The Role of Research in Wine: the Emergence of a Regional Research Area in an Italian Wine Production System. SEMeQ - Università del Piemonte Orientale
Nelson, P. (1970) Information and consumer behaviour, The Journal of Political Economy, vol.78, n. 2., pp. 311-329.
Nipe, A., Anna York, Dennis H, Jonathan F., Yasser B. (2010). The South Australian Wine Cluster - Microeconomics of Competitiveness. Harvard University
Nosi, C.(2012). Vino, prodotto “cognitivo” con mercati e modelli di marketing diversi. Article from Supplemento a L’informatore Agricolo (11/2012). P.18-21OIV (2012). Statistical report on world vitiviniculture 2012. OECD - Organisation for Economic Co-operation and Development. (2000). Local Partnership, Clusters and SME Globalisation. In OECD- Organisation for Economic Co-operation and Development. OIV (2007). Situazione del settore vitivinicolo mondiale nel 2007.
Pernicone, M. (2007). Il sistema della ricerca nel settore vitivinicolo: Le fonti di conoscenza di innovazione in Langhe e Monferrato. Quaderni SEMeQ. Università del Piemonte Orientale
Pomarici, E. (2005) Il mercato mondiale del vino: tendenze, scenario competitivo e dualismo tra vecchio e nuovo mondo, working paper n. 7/2005, Centro per la Formazione in Economia e Politica dello Sviluppo Rurale, Dip. di Economia e Politica Agraria, Università di Napoli Federico II. Porter M. (1996). What is strategy?. Harvard Business Review, Nov/Dec 1996 Porter, M. (1994). The role of location in Competition. Journal of Economics and Business. Vol.1 p.35-40 Porter, M. (1994). The Competitive Advantage of Nations, Free Press New York
Rea A.,D’Antone S. (2010). La sistemicità presupposto del valore della marca territoriale . Un ’ analisi sul mondo del vino Made in Italy.. Riviste Sinergie. n.83/10 p.179-200
Regione Piemonte (2012). Aziende e Vigneti. 50 anni di storia.RegionePiemonte Press.
Reynolds J. (2010). The Australian Wine Industry and the Impact of Knowledge-flow on Performance.
Rossi, M. (2007). Dinamiche competitive e modelli di business nel settore vitivinicolo. Il caso delle imprese campane. Ph. D. in Management and Corporate Governance. University of Sannio.
106

Shapiro, C. (1983) Premium for high quality products as returns to reputations, Quarterly Journal of Economics, vol. 98, pp. 659-680. South Australian Tourism Commission (2009) South Australian Food and Wine Tourism Strategy 2009-2014.
Strachan S., Rasmussen M., Stanford L., Scott J., Walker A., Kemp B., Lockshin L., Van der Lee P. (2000).The Marketing Decade. Setting the Australian Wine Marketing Agenda 2000>> 2010. Winemakers’ Federation of Australia, Australian Wine and Brandy Corporation
Trotta, L. (2012). Cluster and Automotive districts. Potential cooperation between South Australia and Piedmont. Greater Europe Desk- Office of coordination State Development.
Vitali, G. (2008). Le caratteristiche socio-economiche dei cluster di imprese in Piemonte. Rapporto di ricerca per Regione Piemonte, Direzione Industria, “Osservatorio settori produttivi industriali”. Istituto di ricerca sull’impresa e lo sviluppo.
Vrontis D., Thrassou A., Rossi M. (2011). Italian wine firm: strategic branding and financial performance. International Journal of Organizational Analysis. Vol 19, 4 p.288-304 Wine Australia (2007). Directions to 2025: An Industry Strategy for Sustainable Success.
Wilson, J.E.(1988).Terroir: the role of geology, climate, and culture in the making of French wines. Berkley, CA, University of California Press, 1998.
Zanni L., Nosi C. (2006). Strategie emergenti nel business vitivinicolo: un’analisi comparata tra Australia e Italia. Monografie Scienze Sociali. Cap.2 p.117-187
107

List of Interviews
South Australia Kym Teusner
Winemaker/Proprietor ‘Teusner wine’ company, Barossa Valley.
Interviewed 9 October 2012
Peter Hackworth
Executive Officer of the Wine Grape Council of South Australia (WGCSA).
Member of the Executive Committee of Wine Grape Growers Australia (WGGA).
Interviewed 30 October 2012
Kym Anderson
George Gollin Professor of Economics, School of Economics and Centre for International
Economic Studies, University of Adelaide.
Executive Director, Wine Economics Research Centre, University of Adelaide.
Interviewed 8 November 2012
Larry Lockshin
Professor and Head of the School of Marketing, University of South Australia.
Director of the Wine Marketing Group, University of South Australia.
President and founding Committee member of the Academy for Wine Business Research
(AWBR).
Interviewed 15 November 2012
Paul Henry
Founder of Winehero Australia.
General Manager - Market Development of the Australian Wine & Brandy Corporation
(2005-2011)
Interviewed 13 December 2012
108

Piedmont Raffaella Mirandola
Wine-growing and wine-producing consultant, Coldiretti, Montferrat.
Interviewed by email 3-18 October 2012
Norbert Reinisch
Director of Foreign Trade, ‘Braida’ company, Montferrat.
Interviewed by email 6 November 2012
Matteo Rossi
Assistant Professor in Corporate Finance, University of Sannio, Faculty of Economics
Science.
Interviewed by email 9 November 2012
Andrea Ferrero
Director of the Consortium for the Protection of Barolo Barbaresco Alba Langhe and
Roero.
President of Consortium ‘Piedmont: Land of Perfection’.
Interviewed by email 10 November 2012
Sergio Zucca
Commercial Director, ‘Braida’ company, Montferrat
Interviewed by email 11 November 2012
Stefano Aimone
Director in Economics policy division- Institute of Economics and Social Research
(IRES) -Piedmont
Interviewed by email 14 Dicember 2012
109

110
Annexes Annex 1. Comparison between South Australia and Piedmont wine industry Data 2011
Piedmont SA Hectares (ha) 47,042 74,885
Production (t) 480 682
Wine making (m litres) 268 477
% export/revenue 60 69
Value Export 1,176 m€ 1,205 m$
% of GDP (regional/state) considering expanded wine's chain (grape growing sector, wine making sector, trade, tourism, retail and service sector)
1385 (2008) 14 (2010)
Source: Ismea - Inea - Federvini - PIRSA scorecard - ABS
85 “La Filiera Vitivinicola ‘allargata’: il modello italiano, valori sul territorio piemontese”, Cueim, Deiagra

Annex 2. Australian and South Australian Institute for Collaboration
Source: Wine: A Partnership 2010-2015, Government of South Australia
111

Annex 3. Italian and Piedmonts main Institute for Collaborations (IfC) Piedmonts main IfCs Consortia In Piedmont 22 Consortia operate in the area and the most important are:
• Consortium for the Protection of Barolo Barbaresco Alba Langhe and Roero: Founded in 1934, today has 450 members involved in the production of all the DOC and DOCG wines of Langa and Roero
• Consortium for the Protection of Asti: established on 17 December 1932, it has accompanied the growth of Moscato and Asti in international markets ever since. It joined with 1,900 associate producers, including Moscato grape growers (independent farmers and members of wine growers’ cooperatives) and wine farms, wine growers’ cooperatives, wine makers and producers of sparkling wine.
• Consortium for the Protection of Asti and Monferrato Wines: it has 170 members and its core business is the promotion of the Barbera wine, an industry of huge importance for the region’s economy
Associations Moreover, it is important to highlight the presence Association of Piedmontese Vine Dressers (Vignaioli Piemontesi Association), the biggest association in Piedmont: it represents 43 wine growers’ cooperatives and 412 wine farms for a total of more than 7,000 vineyards that produce 850,000 hectolitres, 30% of all Piedmontese wine. Association of Moscatod’Asti Producers: it is a cooperative of 2,300 Moscato grape growers: 850 of these are, in turn, members of eight Moscato wine producing cooperatives. Its purpose is to help Moscato grape growers boost their income. Other Piedmont region Institution, agriculture division play a key role in the dissemination of the reform referred to wine industry and coordinated all the activities concerning their adaptation by the wine and grape growers companies. Moreover, it is active through:
• the Piedmontese Viticulture Observatory, monitoring industry sector; • Regional Programme for Research, Experimentation and Demonstration,
promoting research activities through regional fund.
Italian main IfCs Several bodies operate not only in Piedmont but in other Italian ares:
• ‘Federvini’, involved in Italian beverage trade activities; • ‘Coldiretti’ and ‘Confederazione Italiana Agricoltori’, that represents the
small-medium agriculture enterprises; • ‘Unione Italiana Agricoltori’, that is more representative of medium to large
agriculture enterprises. • the Institute of Service for the Agriculture Market (Ismea), that provide
industry and market research for all the Italian region; • the National Institute of Agri Economy (Inea), a public research body in the
agriculture sector.
112