australian wine industry cellar door research study … · australian wine industry cellar door...
TRANSCRIPT

AUSTRALIAN WINE INDUSTRY
CELLAR DOOR RESEARCH STUDY 2013
INTERIM REPORT to GRAPE AND WINE RESEARCH & DEVELOPMENT CORPORATION
Research Organisation: University of South Australia
School of Marketing
Adelaide SA 5001, Australia
Date: January 2014
Principal Investigator: A/Professor Johan Bruwer
Project Number: USA-1204

Disclaimer, Confidentiality and Acknowledgement
This report has been compiled from the research study conducted under the direction of the Chief Investigator, A/Professor
Johan Bruwer, at the cellar doors of 79 wineries in 15 wine regions across Australia during the period 15 April to 7 July 2013.
The report represents information obtained from authentic and highly regarded sources. Every reasonable effort has been
made to give reliable data and information but the authors and the publisher cannot assume responsibility for the validity of
all material or for the consequences of their use (see the Appendix for details on sample recruitment and validity).
Recipients of this report are advised to exercise due caution and diligence in sharing and distributing the report and its
contents. The authors request that recipients of this report reference and acknowledge the source when utilising, sharing or
referring to the data and information it contains for the purposes of internal and external stakeholders, employees and sales,
marketing, wine tourism and any other business activities: Copyright reserved, 2014.
Acknowledgement:
This study would not have been possible without the invaluable assistance of the cellar door staff at the wineries who handled
most of the logistical aspects of the survey’s administration on the Research Team’s behalf. The Research Team members
are researchers based in the School of Marketing at the University of South Australia and in the School of Psychology at
Charles Sturt University (Professor Anthony Saliba). Their respective roles in this project are as follows:
A/Professor Johan Bruwer (Chief Investigator) Professor Larry Lockshin (Partner Investigator)
Professor Anthony Saliba (Partner Investigator)
Mr Martin Hirche (Research Associate) Contact Details:
Postal: School of Marketing, University of South Australia, City West Campus, Adelaide, SA 5001. Australia
Phone: +61 +8 8302 0135
E-Mail: [email protected]
Cellar Door Visitor Research Study 2013 GWRDC USA-1204 © Copyright, 2014
ii
Report Contents Page o Research Objectives 1
o Key Findings 2
o Socio-demographics of the Cellar Door Visitors 3
o Tourist Behaviour and Visitation Characteristics of the Cellar Door Visitors 6
o Sources of Information Used by the Cellar Door Visitors Prior to the Visit 8
o Motivations for Visiting the Cellar Door 9
o Wine Club Membership Metrics of the Cellar Door Visitors 10
o Rating the Cellar Door Visit and the Incidence of Previous Visitation 11
o Perception of the Visited Wine Region’s Characteristics and Importance of Region of Origin 13
o Buying and Related Behaviour of Visitors at the Cellar Door 15
o Prior Awareness and Actual Experience of the Winery’s Wine Brands 17
o Wine Brand Range KPIs, Purchase Behaviour and Likelihood of Future Purchase 18
o Normal Wine Consumption Behaviour of the Visitors as Consumers 22
o Special Interest Focus: Regional Comparisons 26
Cellar Door Visitor Profiles of the Wine Regions 26
Buying Behaviour Metrics of Cellar Door Visitors of the Wine Regions 27
Characteristics of the Wine Regions and Visit History 28
Wine Consumption Metrics of the Cellar Door Visitors of the Wine Regions 29
Wine Club Members’ Demographic Profiles and Buyer Behaviour Metrics 30
o Appendix 31
Research Methodology and Cautionary Note 31
Future Research 32

Cellar Door Visitor Research Study 2013 GWRDC USA-1204 © Copyright, 2014
iii
List of Tables Page
1 Gender, Age and Educational Status of the Cellar Door Visitors 3
2 Marital Status, Household Size and Place of Permanent Residence of the Cellar Door Visitors 4
3 Annual Household Income (Before Taxes) of the Cellar Door Visitors 5
4 Incidence of Having Visited the Specific Wine Region in the Past 6
5 Duration of Trip or Period of Stay in the Specific Wine Region 7
6 Awareness of the Winery Visited BEFORE Undertaking the Cellar Door Visit 8
7 Sources of Information Used by the Cellar Door Visitors BEFORE Visiting the Winery 8
8 Motivations for Visiting the Winery’s Cellar Door 9
9 Wine Club Membership Metrics of the Cellar Door Visitors 10
10 Rating of Overall Experience and Intention to Visit the Cellar Door Again Within the Next 12 Months 11
11 Number of Previous Visits made by the Visitors to the Specific Winery’s Cellar Door 12
12 Characteristics of Australian Wine Regions (Overall) - Regional Winescape/Image 13
13 Importance of Region of Origin in the Decision when Buying Wine in a Retail Store, Restaurant, or Elsewhere 14
14 Incidence of Buying and the Amount Spent on Non-Wine (Accessory) Items and on Wine Items at the Cellar Door 15
15 Purpose of the Wine Purchase at the Cellar Door and Time Period Before All the Wine Bought Will Have 16 Been Consumed
16 The Winery’s Wine Brand - Previous Awareness/Actual Experience 17
17 The Winery’s Wine Brand Range Dynamics and KPIs at the Cellar Door 18
18 Likelihood of Buying Any of the Winery’s Wines in the Next 3 Months from Specific Wine Retail Venues 19
19 Brand Range Dynamics and Metrics and Envisaged Consumption Occasions 20
20 Whether Visitors Left the Cellar Door with Knowledge of Where the Winery’s Wines Can be Bought in Future 21 (Other than at the Cellar Door)

Cellar Door Visitor Research Study 2013 GWRDC USA-1204 © Copyright, 2014
iv
List of Tables (Cont.) Page
21 Frequency, Quantity and Total Expenditure of the Visitors’ Normal Wine Consumption as Consumers 22
22 Role in the Household in terms of Wine Buying and Consumption 23
23 Wine Type Consumption Breakdown (Last 12 Months) 24
24 Wine Type Consumption Breakdown (Last 12 Months): Australian versus Imported Wine 24
25 Wine Channel Purchase Breakdown (Last 12 Months) 25
26 Regional Comparisons: Gender, Age, Educational Status, Household Income and Residential Origin of the 26 Cellar Door Visitors
27 Regional Comparisons: Buyer Behaviour at Cellar Door, Awareness/Actual Experience of the Winery’s Wines 27 and Visit History
28 Regional Comparisons: Characteristics of the Individual Wine Regions and Visit History 28
29 Regional Comparisons: Wine Consumption Metrics of the Cellar Door Visitors as Consumers 29
30 Regional Comparisons: Profiles and Buyer Behaviour Metrics of Cellar Door Visitors Who Are Members of a Wine Club 30

Cellar Door Visitor Research Study 2013 GWRDC USA-1204 © Copyright, 2014
1
Research Objectives
The overall purpose of this research project is to develop a better understanding of wine consumers’ purchase and consumption patterns before,
during, and as a direct consequence of their visits to wineries, with the cellar door being the hub of their experience. This research report is the
first of two reports as the research project is of a longitudinal nature.
More specifically the project’s objectives are to determine:
- Who the cellar door visitors are (socio-demographics), their wine consumption metrics, and relationship with the winery and region.
- The nature and extent of the cellar door visitors’ buying behaviour at the cellar door and the likelihood of them buying the brand in future.
- The relationship that cellar door visitors have had with the winery’s brand prior to visiting the cellar door.
- The characteristics of the wine region as perceived by the cellar door visitors.
In the two follow-up surveys executed at two 3-monthly intervals after the cellar door visit the project’s objectives are to:
- Determine the effect of the cellar door visit on wine consumption in terms of regionality, type/style, and price/quality.
- Track the incidence and extent of purchase (and repurchase) of the wineries’ wines at off-premise, on-premise and direct mode channels
among a cohort of winery cellar door visitors.
- Establish the nature of communication resulting from a cellar door visit, for example word-of-mouth, etc.
Please note that the results of the follow-up surveys will be reported in the final research report later in 2014.
Cellar Door Visitor Research Study 2013 GWRDC USA-1204 © Copyright, 2014
2
Key Findings
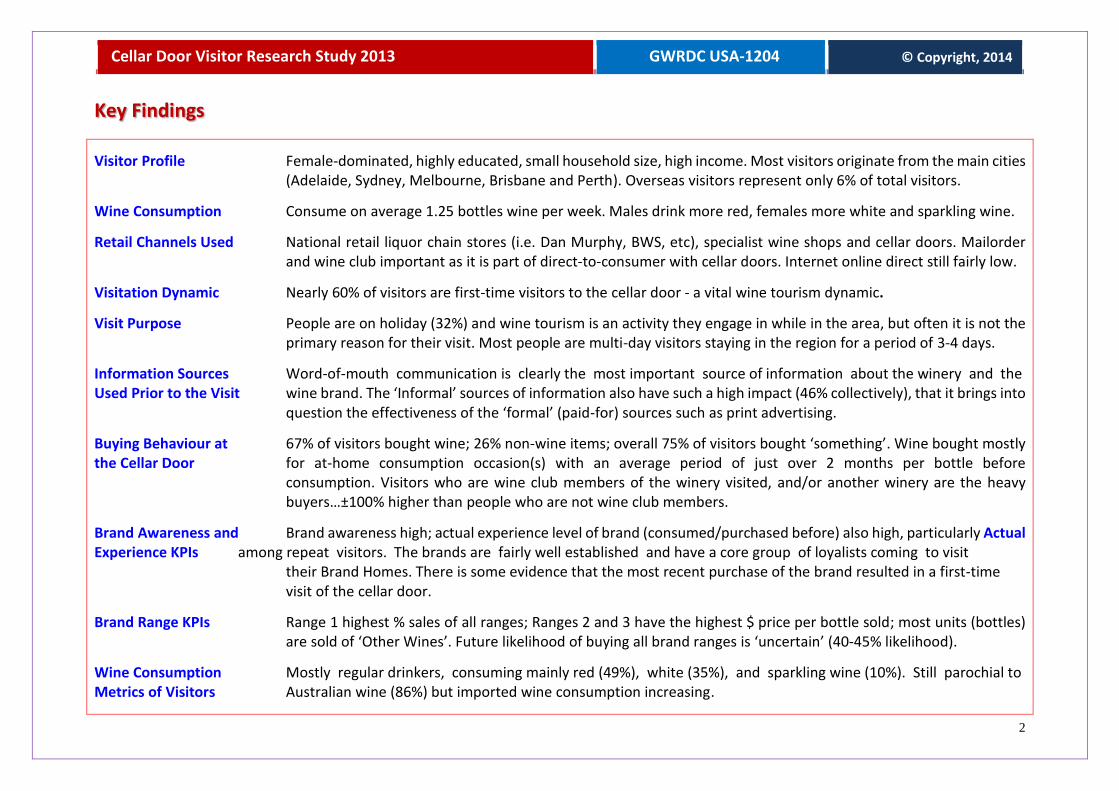
Visitor Profile Female-dominated, highly educated, small household size, high income. Most visitors originate from the main cities (Adelaide, Sydney, Melbourne, Brisbane and Perth). Overseas visitors represent only 6% of total visitors.
Wine Consumption Consume on average 1.25 bottles wine per week. Males drink more red, females more white and sparkling wine.
Retail Channels Used National retail liquor chain stores (i.e. Dan Murphy, BWS, etc), specialist wine shops and cellar doors. Mailorder and wine club important as it is part of direct-to-consumer with cellar doors. Internet online direct still fairly low.
Visitation Dynamic Nearly 60% of visitors are first-time visitors to the cellar door - a vital wine tourism dynamic.
Visit Purpose People are on holiday (32%) and wine tourism is an activity they engage in while in the area, but often it is not the primary reason for their visit. Most people are multi-day visitors staying in the region for a period of 3-4 days.
Information Sources Word-of-mouth communication is clearly the most important source of information about the winery and the Used Prior to the Visit wine brand. The ‘Informal’ sources of information also have such a high impact (46% collectively), that it brings into
question the effectiveness of the ‘formal’ (paid-for) sources such as print advertising.
Buying Behaviour at 67% of visitors bought wine; 26% non-wine items; overall 75% of visitors bought ‘something’. Wine bought mostly the Cellar Door for at-home consumption occasion(s) with an average period of just over 2 months per bottle before consumption. Visitors who are wine club members of the winery visited, and/or another winery are the heavy buyers…±100% higher than people who are not wine club members.
Brand Awareness and Brand awareness high; actual experience level of brand (consumed/purchased before) also high, particularly Actual Experience KPIs among repeat visitors. The brands are fairly well established and have a core group of loyalists coming to visit
their Brand Homes. There is some evidence that the most recent purchase of the brand resulted in a first-time visit of the cellar door.
Brand Range KPIs Range 1 highest % sales of all ranges; Ranges 2 and 3 have the highest $ price per bottle sold; most units (bottles) are sold of ‘Other Wines’. Future likelihood of buying all brand ranges is ‘uncertain’ (40-45% likelihood).
Wine Consumption Mostly regular drinkers, consuming mainly red (49%), white (35%), and sparkling wine (10%). Still parochial to Metrics of Visitors Australian wine (86%) but imported wine consumption increasing.
Cellar Door Visitor Research Study 2013 GWRDC USA-1204 © Copyright, 2014
3
Socio-demographics of the Cellar Door Visitors
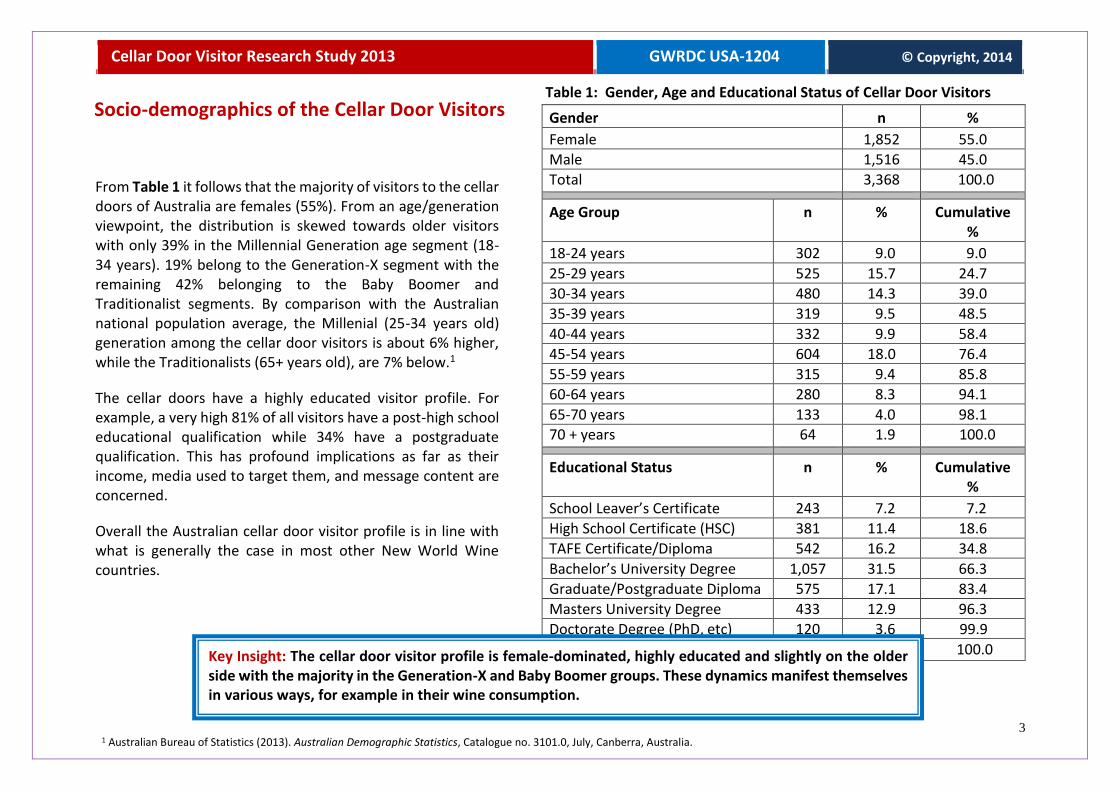
From Table 1 it follows that the majority of visitors to the cellar doors of Australia are females (55%). From an age/generation viewpoint, the distribution is skewed towards older visitors with only 39% in the Millennial Generation age segment (18-34 years). 19% belong to the Generation-X segment with the remaining 42% belonging to the Baby Boomer and Traditionalist segments. By comparison with the Australian national population average, the Millenial (25-34 years old) generation among the cellar door visitors is about 6% higher, while the Traditionalists (65+ years old), are 7% below.1
The cellar doors have a highly educated visitor profile. For example, a very high 81% of all visitors have a post-high school educational qualification while 34% have a postgraduate qualification. This has profound implications as far as their income, media used to target them, and message content are concerned.
Overall the Australian cellar door visitor profile is in line with what is generally the case in most other New World Wine countries.
Table 1: Gender, Age and Educational Status of Cellar Door Visitors
Gender n %
Female 1,852 55.0
Male 1,516 45.0
Total 3,368 100.0
Age Group n % Cumulative %
18-24 years 302 9.0 9.0
25-29 years 525 15.7 24.7
30-34 years 480 14.3 39.0
35-39 years 319 9.5 48.5
40-44 years 332 9.9 58.4
45-54 years 604 18.0 76.4
55-59 years 315 9.4 85.8
60-64 years 280 8.3 94.1
65-70 years 133 4.0 98.1 70 + years 64 1.9 100.0
Educational Status n % Cumulative %
School Leaver’s Certificate 243 7.2 7.2
High School Certificate (HSC) 381 11.4 18.6
TAFE Certificate/Diploma 542 16.2 34.8
Bachelor’s University Degree 1,057 31.5 66.3
Graduate/Postgraduate Diploma 575 17.1 83.4
Masters University Degree 433 12.9 96.3
Doctorate Degree (PhD, etc) 120 3.6 99.9
Other 3 0.1 100.0
Key Insight: The cellar door visitor profile is female-dominated, highly educated and slightly on the older side with the majority in the Generation-X and Baby Boomer groups. These dynamics manifest themselves in various ways, for example in their wine consumption.
1 Australian Bureau of Statistics (2013). Australian Demographic Statistics, Catalogue no. 3101.0, July, Canberra, Australia.

Cellar Door Visitor Research Study 2013 GWRDC USA-1204 © Copyright, 2014
4
Socio-demographics of Cellar Door Visitors (Cont.)
The cellar door visitors are from multi-person households with an average of 2.78 persons living under the same roof (Table 2). The social nature of wine consumption is underlined by the fact that on average 2.04 of the 2.27 persons of legal drinking age living in the household, consume wine.
The majority (78%) of people who live in the same household are either married or co-habiting, with the balance of 22% living in either single (18%) or multi-person households (4%), whether divorced, separated, or widowed.
The main feeder source of visitors is South Australia* (36%), mainly from Adelaide. New South Wales has a strong presence (20%), mainly from Sydney, with Victoria next (18%), mainly from Melbourne. The remaining states and overseas countries (6%) collectively provide ‘only’ 26% of all the visitors. Overall, a wine region’s main feeder source is a main city within the state where the region is located.
* Please note that due to logistical issues, the number of respondents surveyed at cellar doors in South Australia is disproportionately high and could have skewed the results (see Cautionary Note on page 31).
Table 2: Marital Status, Household Size and Place of Permanent Residence
Marital Status %
Married or de-facto partner (co-habiting) 77.9
Single 17.5
Divorced 2.4
Separated 1.3 Widowed/widower 0.9
Household Size Mean
Persons under 18 years old 0.51 persons
Persons 18 years and older 2.27 persons
Persons 18 years and older who drink wine 2.04 persons Total household size 2.78 persons
Place of Permanent Residence % Cumulative %
South Australia (SA)* 36.4 36.4
New South Wales (NSW) 19.6 56.0
Victoria (VIC) 17.9 73.9
Queensland (QLD) 9.3 83.2
Western Australia (WA) 7.7 90.9
Overseas Country 5.8 96.7
Tasmania (TAS) 1.8 98.5
Australian Capital Territory (ACT) 1.3 99.8 Northern Territory (NT) 0.2 100.0
Key Insight: The main feeder sources of wine tourists are the main cities of South Australia, New South Wales, Victoria, Queensland and Western Australia. This highlights the key target markets for promotional efforts and the locations, specifically Adelaide (SA), Sydney (NSW), Melbourne (VIC), and Brisbane (QLD) and Perth (WA) where the multiplier effect of the wine tourism experience into the retail off-and on-trade is likely to be the greatest.
Cellar Door Visitor Research Study 2013 GWRDC USA-1204 © Copyright, 2014
5
Socio-demographics of Cellar Door Visitors (Cont.)
Table 3: Annual Household Income (Before Taxes) of the Visitors
Income Category % Cumulative %
Less than $25,000 3.1 3.1
$25,000 to $39,999 3.5 6.6
$40,000 to $49,999 3.6 10.2
$50,000 to $59,999 5.6 15.8
$60,000 to $74,999 8.7 24.5
$75,000 to $99,999 15.0 39.5
$100,000 to $149,999 23.7 63.2
$150,000 to $199,999 18.1 81.3
$200,000 to $249,999 7.6 88.9
$250,000 or more 11.1 100.0
Household Income (mean) $134,164 -
Income Category Male (%) Female (%)
Less than $30,000 2.9 3.3
$30,000 to $39,999 2.9 3.9
$40,000 to $49,999 3.6 3.6
$50,000 to $59,999 5.3 5.8
$60,000 to $74,999 7.9 9.3
$75,000 to $99,999 14.4 15.6
$100,000 to $149,999 22.9 24.5
$150,000 to $199,999 18.7 17.6
$200,000 to $249,999 8.6 6.8
$250,000 or more 12.8 9.6
Household Income (mean) $139,637 $129,594
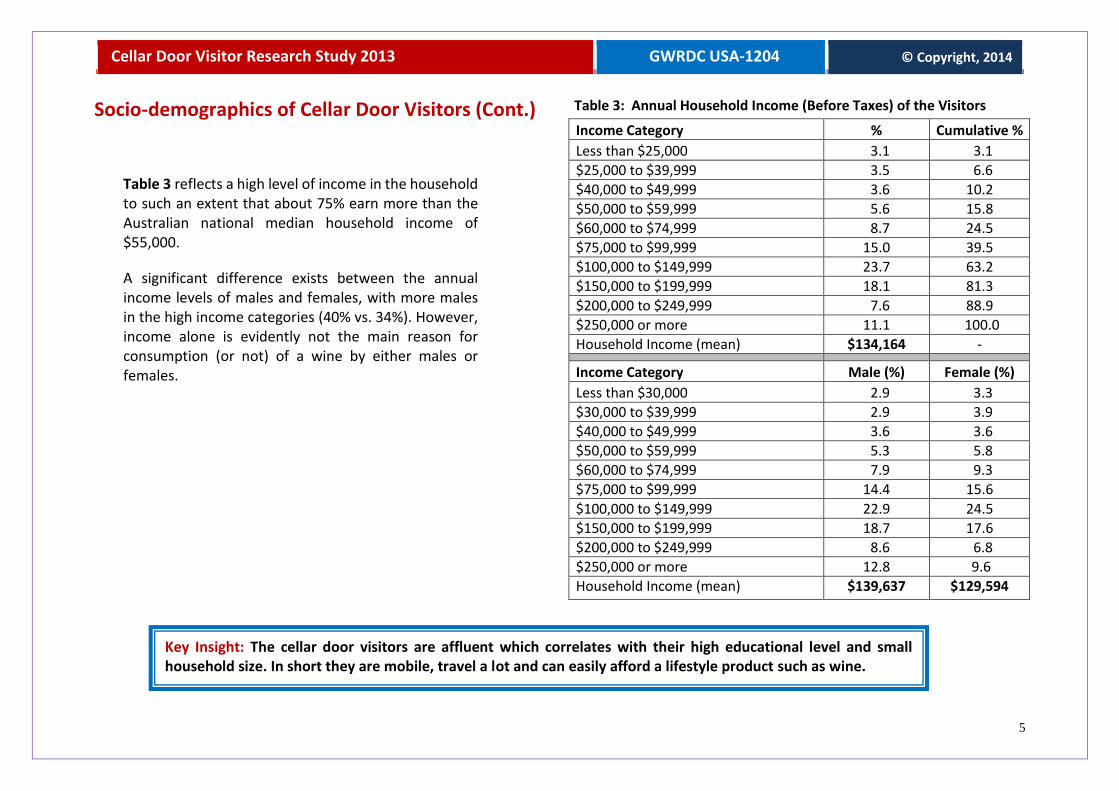
Table 3 reflects a high level of income in the household to such an extent that about 75% earn more than the Australian national median household income of $55,000.
A significant difference exists between the annual income levels of males and females, with more males in the high income categories (40% vs. 34%). However, income alone is evidently not the main reason for consumption (or not) of a wine by either males or females.
Key Insight: The cellar door visitors are affluent which correlates with their high educational level and small household size. In short they are mobile, travel a lot and can easily afford a lifestyle product such as wine.

Cellar Door Visitor Research Study 2013 GWRDC USA-1204 © Copyright, 2014
6
Tourist Behaviour and Visitation Characteristics
There is a direct relationship between the fact that 91% of visitors are from Adelaide, Sydney, Melbourne, Brisbane and Perth, or their surrounds (Table 2) and the 65% of people who are repeat visitors to the wine regions (Table 4). The number of first-time visitors is only 35% though, which could be an indicator of stagnation, or lack of promotion, but also strong brand awareness, on the positive side.
The level of repeat visitation means that there is a high level of familiarity with the wine regions among visitors with 47% having visited the region more than once (average overall = 3.3 times).
Wine tourism (visiting wineries to taste and/or buy wines) is the primary reason why people visit the region, with holidaying close behind. In combination, these two main purposes underline the fact that they visit the cellar door to have a pleasant, relaxed experience.
Table 4: Incidence of Having Visited the Specific Wine Region in the Past
Visit Incidence %
Have visited the Wine Region before 65.4
Have never visited the Wine Region before 34.6
Number of Times Visited % Cumulative %
0 (first-time visit ever) 34.6 34.6
1 18.8 53.4
2-5 29.2 82.6
6-10 11.0 93.6
11-20 4.6 98.2
20+ 1.8 100.0
Mean 3.25 times -
Main Purpose of the Visit %
Wine Tourism 44.8
Holiday 31.9
Visit friends or relatives 11.4
Just passing through 4.1
Business/conference 3.8
Recreation (eg. sport or hobby) 2.8
Other 1.2
Key Insight: The first-time versus repeat visitor dynamic is one of the most important in wine tourism. The percentage of repeat visitors signifies some familiarity with (and loyalty?) to the region and is a definite opportunity for them to build a relationship with the wine brand. If repeat visits are going to occur in future also as a result of their holidaying ‘habits’, then this opportunity is even greater.

Cellar Door Visitor Research Study 2013 GWRDC USA-1204 © Copyright, 2014
7
Tourist Behaviour and Visitation Characteristics (Cont.)
Table 5: Duration of Trip or Period of Stay in the Specific Wine Region
Duration of Trip/Period of Stay in the Region n %
Live here - not staying overnight 509 15.1
1-day trip from elsewhere - not staying overnight 1,273 37.8
Multi-day trip 1,586 47.1
Multi-day trip: - Mean
- Number of days stayed over in the region - 3.52 days
- Number of nights stayed over in the region - 2.78 nights
- Number of days spent on wine tourism only - 1.95 days
When Final Decision to Visit the Winery was Made % Cumulative %
As I was/we were passing by 20.4 20.4
During the last 24 hours 38.2 58.6
During the last week 20.4 79.0
During the last month 10.0 89.0
During the last 3 months 4.8 93.8
During the last 6 months 4.5 98.3
Other 1.7 100.0
Key Insight: People who visit the cellar doors do not stay in the region for very long, creating a rather narrow window of marketing opportunity. Multi-day visitors present an opportunity for forming co-marketing alliances with tourism providers such as the accommodation and food sectors and tour guides. The importance of this is underlined by the fact that an intervention by the winery (i.e. advertising, promotion, etc) is possible shortly before the cellar door visit as most people decide to visit it only once they have already arrived in the region.
With some wine regions located a long distance from a main city, the majority of visitors (47%) are on a multi-day trip to a region (Table 5). Whereas most of them overnight in the region they are visiting, it is insightful that 9.5% of the multi-day visitors overnight outside the region and drive back and forth - which is perhaps an opportunity lost for the local economy. In terms of 1-day visitors, 15% originated from within the region as they live there permanently (possibly an indication of loyalty), while 38% are from elsewhere outside the region.
Visitors are there primarily to have a holiday and in the process engage in wine tourism activities (see Table 4) and stay in the region for an average of just over 3.5 days, including 2.8 nights.
Whereas planning the trip to the wine region may happen well in advance, the final decision to visit the winery’s cellar door is made a very short time beforehand, for example 79% decided within 1 week and a 59% within the 24 hour period before actually visiting it.

Cellar Door Visitor Research Study 2013 GWRDC USA-1204 © Copyright, 2014
8
Sources of Information Used by Cellar Door Visitors Before the Visit
Table 6: Awareness of the Winery Visited BEFORE Undertaking the Visit
Awareness n %
Yes, I was aware (I have heard of it) 2,650 78.7
No, I was not aware (I have never heard of it)
718 21.3
Table 7: Sources of Information Used by the Cellar Door Visitors BEFORE Visit
Information Source Count Sample % Total %
Word-of-mouth (family, friends, colleagues) 1,696 50.4 22.6
Previous visits to this winery/region 1,055 31.3 14.0
Internet (winery’s own website) 807 24.0 10.7
Wine book, wine guide or map 596 17.7 7.9
Liquor store/wine shop 547 16.2 7.3
Local tourism bureau or visitor centre 419 12.4 5.6
Restaurant 352 10.5 4.7
Another winery in the wine region 341 10.1 4.5
Attending a wine festival or event 338 10.0 4.4
Tour guide or travel agent 270 8.0 3.6
Newspaper or magazine article 263 7.8 3.5
Billboards or road signage 248 7.4 3.3
Local accommodation provider (hotel, B&B) 230 6.8 3.1
Winery’s wine club 161 4.8 2.1
Social media (Facebook, Twitter, YouTube, etc) 131 3.9 1.7
Aussie Wine Month advertising campaign 31 0.9 0.4
Other sources 46 1.4 0.6
Total 7,531 - 100.0
Informal sources of information
Table 6 shows that 79% of the visitors are already aware of the winery before they even embark on their visit to its cellar door.
Word-of-mouth (WOM) is clearly the most used source of information with 50% citing it (Table 7). Previous visits to the winery/region (31%) rate second in usage. The top 5 sources are rounded off by the winery’s internet website (24%), Wine books, wine guides or maps (18%), and liquor/wine store (16%).
Visitors used on average a total of 2.24 different sources of information about the winery prior to visiting it.
Most notable is the fact that the so-called ‘informal’ sources of information collectively account for 46% of all the responses. This finding has important managerial implications.
Key Insight: Relationship marketing is of paramount importance in the quest to get information about the winery and the brand through to visitors who either are or can become customers. The effectiveness of the ‘informal’ sources in reaching them puts a big question mark behind the cost-benefit of using the ‘formal’ (paid-for) sources.

Cellar Door Visitor Research Study 2013 GWRDC USA-1204 © Copyright, 2014
9
Motivations for Visiting the Cellar Door
Key Insight: Visitors come to the cellar door to relax, have a good time and learn more about wine. Staff training should focus on developing the employees’ ability to satisfy these expectations.
Table 8: Motivations for Visiting the Winery’s Cellar Door
Motivation Factor % Incidence
Ranking Mean*
Ranking Position
Taste wine 65.4 2.25 1
Buy wine or other merchandise 56.6 2.77 3
Experience the atmosphere 39.9 3.07 8
Have a day out 38.9 2.97 6
Learn more about wine 29.9 3.03 7
Entertain myself and/or others 29.7 2.87 5
Find a unique wine 25.4 3.23 10
Socialize with others 21.4 3.19 9
Rural setting 21.2 3.51 13
Have lunch or dinner 18.4 2.72 2
Go on a winery tour 12.2 2.84 4
Find information 9.9 3.46 12
Meet the winemaker 7.1 3.32 11
* Visitors requested to rank their top 5 motivations (from 1 to 5) for visiting
Table 8 indicates that the typical wine tourism factors ‘to taste wine’ and ‘to buy wine’ are indeed the main motivating factors for visiting the cellar doors of the wineries.
Many visitors are also in pursuit of ‘to learn more about wine in general’; ‘to experience the atmosphere’; ‘have lunch or dinner’; ‘to have a day out’; and ‘to entertain themselves and/or others’. Most of the highly ranked motivations are quite hedonic in nature. Visitors are clearly in pursuit of a highly pleasurable experience.
Cellar Door Visitor Research Study 2013 GWRDC USA-1204 © Copyright, 2014
10
Wine Club Membership Metrics of the Cellar Door Visitors
Table 9: Wine Club Membership Metrics of the Cellar Door Visitors
Wine Club Membership of the Winery Visited on the Day
Yes - I am a member of the winery’s wine club I visited 10.7%
Period of membership of the winery’s wine club I visited (mean) 24.3 months
Wine Club Membership of Any Other Winery’s Wine Club
Yes - I am a member of another winery’s wine club 11.1%
Wine Club Membership (Overall) 19.6%
Preferred Frequency of Receiving Wine Club Offers
Monthly (once a month) 15.9%
3-Monthly (once every 3 months) 44.9%
6-Monthly (once every 6 months) 28.8%
Yearly (once a year) 9.0%
Other 1.4%
Key Insight: Wine club membership is a vital aspect in the direct-to-consumer marketing strategies of wineries. There is some evidence that wine club members are the high-yield visitors to the cellar door. Hence the development of strategies to (a) recruit, and (b) retain wine club members is critical and should be the focus of further research, similar to this study.
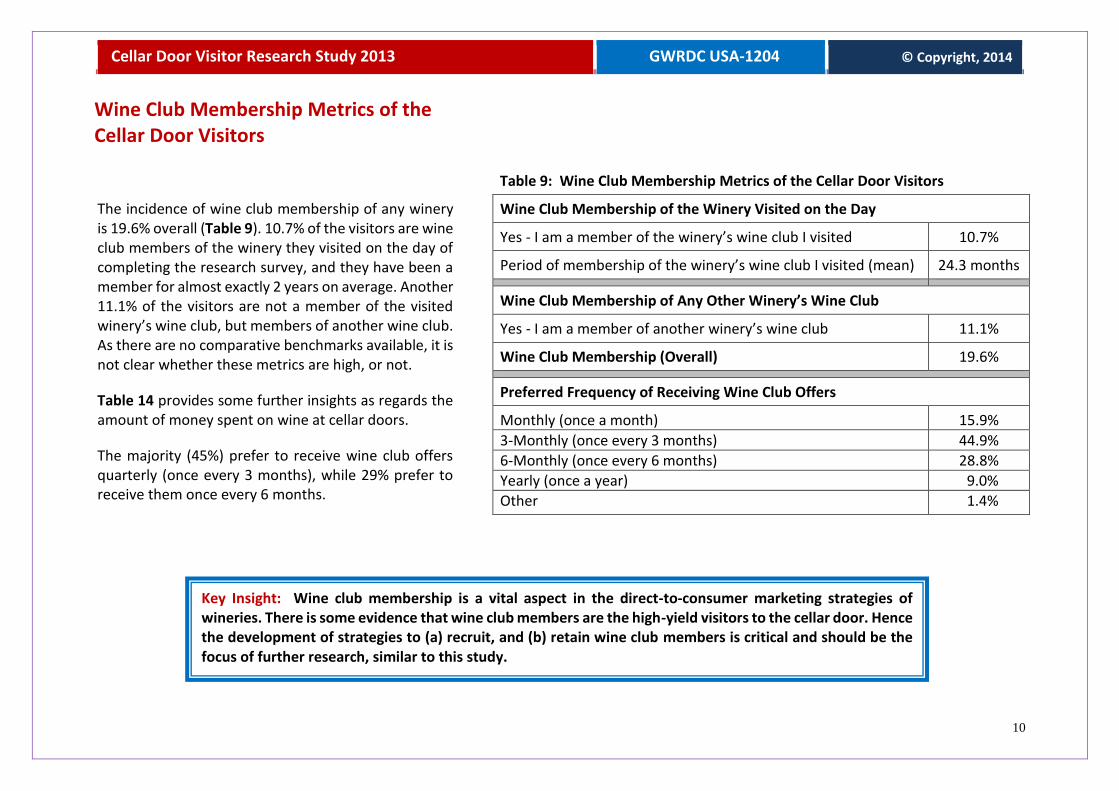
The incidence of wine club membership of any winery is 19.6% overall (Table 9). 10.7% of the visitors are wine club members of the winery they visited on the day of completing the research survey, and they have been a member for almost exactly 2 years on average. Another 11.1% of the visitors are not a member of the visited winery’s wine club, but members of another wine club. As there are no comparative benchmarks available, it is not clear whether these metrics are high, or not.
Table 14 provides some further insights as regards the amount of money spent on wine at cellar doors.
The majority (45%) prefer to receive wine club offers quarterly (once every 3 months), while 29% prefer to receive them once every 6 months.

Cellar Door Visitor Research Study 2013 GWRDC USA-1204 © Copyright, 2014
11
Rating the Cellar Door Visit - Overall Experience and Incidence of Previous Visitation
Key Insight: Converting first-time to repeat visitors who are highly involved with the brand is one of the most important objectives of the winery’s wine tourism strategy.
Visitors rate their overall experience at the cellar door as overwhelmingly positive (Table 10).
The bottom-line is however, whether this positive experience will in future translate into increased purchase and consumption of the winery’s wines. Table 16 provides some insights in this regard.
The majority of visitors (53%) indicate that they will visit the cellar door again within the next 12 months. Given that only 40% have visited it before (Table 11), this is a positive indicator of a growing base of loyal visitors/customers. The distance from its main sources, Adelaide, Sydney, Melbourne, Perth, Brisbane, etc. plus the fact that visitors have to stay overnight in some of the regions, is obviously a limiting factor in this regard.
Table 10: Rating of Overall Visit Experience and Intention to Visit Again Within the Next 12 Months
Rating of the Overall Visit Experience* %
Extremely negative (1) 0.1
Quite negative (2) 0.3
Somewhat negative (3) 0.7
Neither negative nor positive (4) 2.3
Somewhat positive (5) 9.4
Quite positive (6) 31.8
Extremely positive (7) 55.4
Visit Again Within the Next 12 Months# %
Almost no chance (1%)# 17.6
10% chance 4.9
20% chance 4.9
30% chance 5.0
40% chance 3.4
Fairly good chance (50%) 19.1
60% chance 4.4
70% chance 6.4
80% chance 7.7
90% chance 5.7
Practically certain (99%) 20.9 Visit likelihood (mean) 53.2
* (1)…..to….7: 7-point Likert Scale # (1%)….to…..(99%): 11-point Juster Scale measuring likelihood
Cellar Door Visitor Research Study 2013 GWRDC USA-1204 © Copyright, 2014
12
Rating the Cellar Door Visit - Overall Experience and Incidence of Previous Visitation (Cont.)
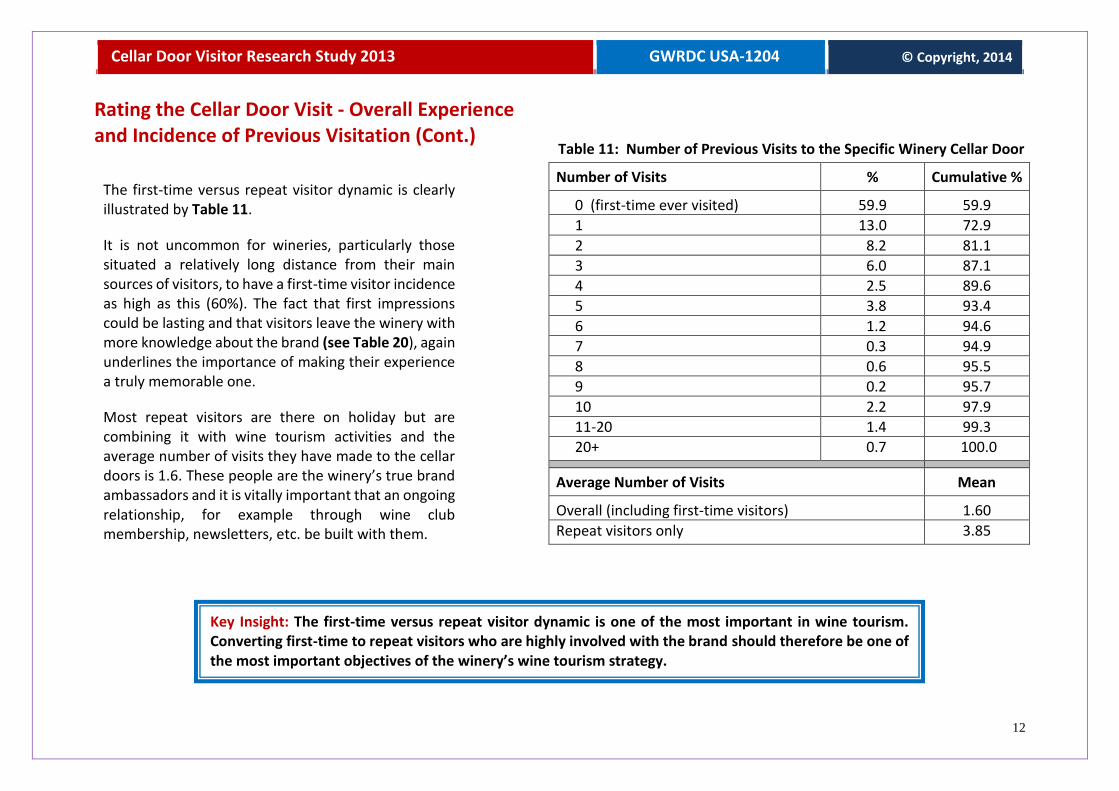
The first-time versus repeat visitor dynamic is clearly illustrated by Table 11.
It is not uncommon for wineries, particularly those situated a relatively long distance from their main sources of visitors, to have a first-time visitor incidence as high as this (60%). The fact that first impressions could be lasting and that visitors leave the winery with more knowledge about the brand (see Table 20), again underlines the importance of making their experience a truly memorable one.
Most repeat visitors are there on holiday but are combining it with wine tourism activities and the average number of visits they have made to the cellar doors is 1.6. These people are the winery’s true brand ambassadors and it is vitally important that an ongoing relationship, for example through wine club membership, newsletters, etc. be built with them.
Table 11: Number of Previous Visits to the Specific Winery Cellar Door
Number of Visits % Cumulative %
0 (first-time ever visited) 59.9 59.9
1 13.0 72.9
2 8.2 81.1
3 6.0 87.1
4 2.5 89.6
5 3.8 93.4
6 1.2 94.6
7 0.3 94.9
8 0.6 95.5
9 0.2 95.7
10 2.2 97.9
11-20 1.4 99.3
20+ 0.7 100.0
Average Number of Visits Mean
Overall (including first-time visitors) 1.60
Repeat visitors only 3.85
Key Insight: The first-time versus repeat visitor dynamic is one of the most important in wine tourism. Converting first-time to repeat visitors who are highly involved with the brand should therefore be one of the most important objectives of the winery’s wine tourism strategy.
Cellar Door Visitor Research Study 2013 GWRDC USA-1204 © Copyright, 2014
13
Perception of the Visited Wine Regions’
Characteristics
Table 12: Characteristics of Australian Wine Regions (Overall) - Regional Winescape/Regional Image
Regional Characteristic %
Wines 86.5
Scenery, natural environment* 78.0
Local food 57.5
Vineyard landscape 56.1
Atmosphere/climate/ambience 48.7
Friendly local residents 34.1
Reputation 29.7
Quality of the restaurants/pubs 29.2
Cleanliness 26.2
Proximity to a main city 24.0
Towns/villages 23.2
Value-for-money 22.0
Heritage and cultural attractions 20.7
Accommodation offered (hotels, B&Bs, apartments) 20.5
Other local products/cottage industries 18.3
Signage to get to and move through the region 18.0
Lack of urbanisation 17.7
Leisure time facilities 15.0
Availability of tourist information 13.7
Safety and security 11.3
Local transportation 2.7 Nightlife and entertainment 2.1
*Combined with scenery, natural environment = 52.5%
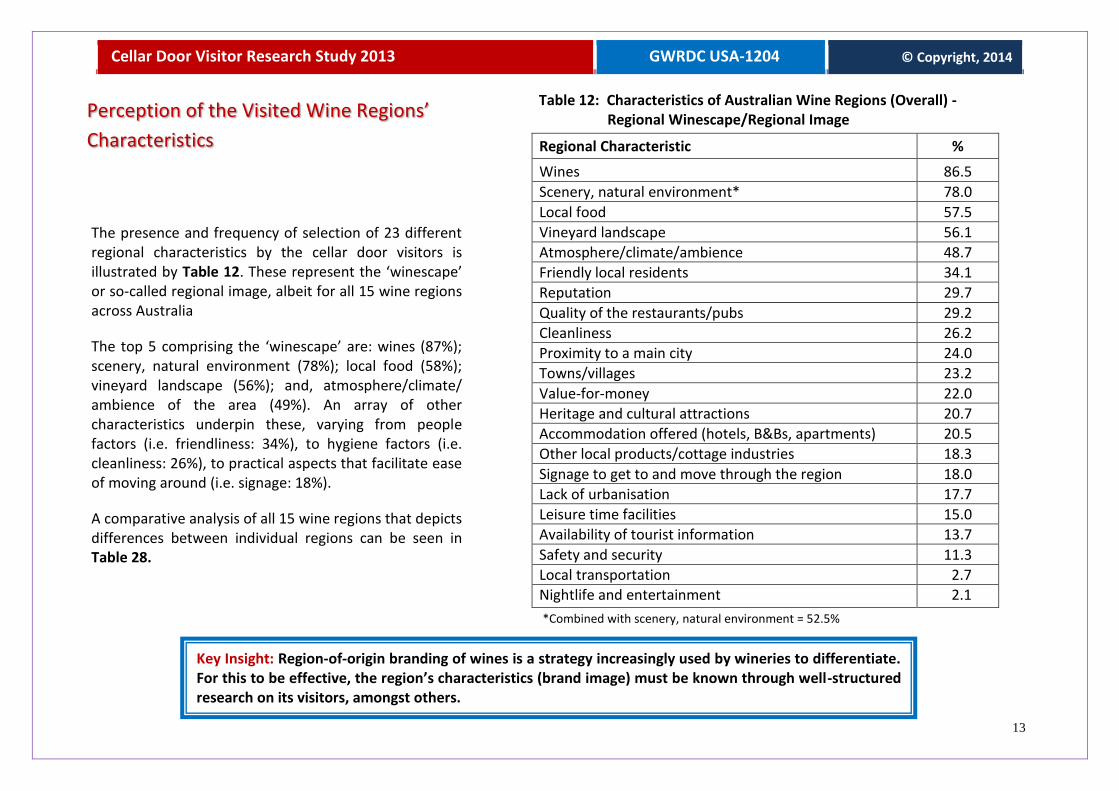
The presence and frequency of selection of 23 different regional characteristics by the cellar door visitors is illustrated by Table 12. These represent the ‘winescape’ or so-called regional image, albeit for all 15 wine regions across Australia
The top 5 comprising the ‘winescape’ are: wines (87%); scenery, natural environment (78%); local food (58%); vineyard landscape (56%); and, atmosphere/climate/ ambience of the area (49%). An array of other characteristics underpin these, varying from people factors (i.e. friendliness: 34%), to hygiene factors (i.e. cleanliness: 26%), to practical aspects that facilitate ease of moving around (i.e. signage: 18%).
A comparative analysis of all 15 wine regions that depicts differences between individual regions can be seen in Table 28.
Key Insight: Region-of-origin branding of wines is a strategy increasingly used by wineries to differentiate. For this to be effective, the region’s characteristics (brand image) must be known through well-structured research on its visitors, amongst others.

Cellar Door Visitor Research Study 2013 GWRDC USA-1204 © Copyright, 2014
14
Importance of Wine’s Region of Origin
Table 13: Importance of Region of Origin in the Decision when Buying Wine in a Retail Store, Restaurant, or Elsewhere
Importance Level Up to $14.99
per bottle $15.00-$24.99
per bottle $25 + per
bottle
Completely unimportant (1) 10.3% 5.4% 4.6%
Quite unimportant (2) 5.3% 1.0% 0.3%
Somewhat unimportant (3) 7.1% 4.2% 2.2%
Neither important nor unimportant (4) 37.0% 24.3% 17.1%
Somewhat important (5) 16.3% 22.9% 12.3%
Quite important (6) 11.7% 23.1% 24.9%
Extremely important (7) 12.3% 19.1% 38.6%
Total 100.0% 100.0% 100.0%
Mean Rating (overall) 4.28 5.04 5.61
(1)….to…..(7): 7-point Likert scale
Key Insight: Visitors to the cellar door get a ‘sense of place’ as a result of the interaction with the geographic area itself, the people (staff) and the wines. The combination of these elements shapes the overall brand image of the winery in the consumer’s mind.
From Table 13 it is clear that a wine’s region of origin is ‘somewhat important’ in the decision of the visitors when buying wine in a retail store, restaurant, or elsewhere.
Previous research2 has shown that the higher their involvement level with wine (not tested in this study), the more likely it is for the origin of the wine to increase in importance in their buying decision-making. There is also a clear trend of region of origin increasing in importance as a choice cue with increasing price.
2 Bruwer, J. and Buller, C. (2013). Product Involvement, Brand Loyalty and Country-of-Origin (COO) Brand Preferences of Japanese Wine Consumers, Journal of Wine Research, 24(1), 38-58.

Cellar Door Visitor Research Study 2013 GWRDC USA-1204 © Copyright, 2014
15
Buying and Related Behaviour at the Cellar Door
Table 14 shows that the cellar door visitors spent money on both non-wine and wine items.
In total, 75% of visitors spent some money at the cellar doors. Based on previous research this is a very good yield rate, as most wineries of similar type have a yield rate varying between 65%-75%. The average amount of money that visitors parted with is just over $90.
It is insightful that wine items made up the majority of the amount spent, while non-wine items accounted for the balance. The visitors who bought wine (67% overall) took away around 4.4 bottles with them for later use (see Table 15).
Table 14: Incidence of Buying and the Amount Spent on Non-Wine (Accessory) Items and on Wine Product Items at the Cellar Door
Non-Wine Items % Buying Amount Spent ($)*
Food/dining 17.1% $85.76
Merchandise items (eg. clothing, artifacts, etc)
4.6% $37.45
Wine tasting fee 4.3% $6.92
Wine tour/attendance of seminar/event 2.9% $93.12
Total amount spent on non-wine items# 25.7% $75.58
Wine Product Items % Buying Amount Spent*
Bought wine by-the-glass to drink at winery 7.6% $19.92
% Buying % Not Buying
Bought bottled wine to take away 66.7% 33.3%
Bottles Amount Spent*
Bottles bought and amount spent on wine 4.42 bottles $104.05
Bottles Amount Spent#
Total amount spent on wine (incl. non-buyers)
(2.94 bottles) $69.35
All Items % Buying Amount Spent**
% Visitors buying something and total spend 74.6% $90.30
* Average expenditure of only the visitors who actually bought the item
**Average expenditure of all the visitors whether they bought an item or nothing at all
# Average expenditure of all visitors on the item Key Insight: The yield rate for the sale of wine and non-wine items is only one performance benchmark for a winery’s cellar door. What is even more important, is whether the visit experience will translate into ongoing future sales in the off- and on-trade, and/or through direct marketing (i.e. wine club membership and/or online buying).

Cellar Door Visitor Research Study 2013 GWRDC USA-1204 © Copyright, 2014
16
Buying and Related Behaviour at Cellar Door (Cont.)
Key Insight: Wine taken to the visitor (consumer’s) home often remains within eyesight for a period that can stretch into several weeks, months, or even years. This proximity of the wine extends the period of awareness of the brand way beyond the actual visit and is a big positive from the winery’s viewpoint to strengthen its brand image.
Table 15: Consumption Occasion(s) for which the Wine was Purchased at the Cellar Door and Time Period Before All the Wine Bought Will Have Been Consumed
Consumption Occasion* for which Wine was Purchased %
‘Normal’ consumption at home with self/family 73.6
Consumption at home with guests 38.7
Celebration/special occasion at home 18.3
Gift for someone 12.5
Celebration/special occasion away from home 12.4
With others at their home away from own home 12.0
Cellaring at home for purpose of ageing the wine 11.6
BYO to a restaurant/pub/bar away from home 8.3
Don’t know yet 5.7
Consumption Rate of Wine Purchased % Mean
Visitors consuming all the wine within days 46.4 13.71 Days
Visitors consuming all the wine within months 33.0 3.62 Months
Visitors consuming all the wine within years 20.6 3.24 years
Average period before all the wine is consumed - 9.73 months
Average period per bottle before consumption - 2.17 months
*
*Wine(s) could have been purchased for more than 1 consumption occasion (total incidence >100%) n = 2,245 visitors who bought wine to take away
Visitors bought wine at the cellar door to consume at home in most instances (74%). Other purposes of note are to consume away from home, for example at a friend’s house, during a celebration occasion, as a gift for someone, or to keep it in cellar for some period of time (Table 15).
Whereas visitors who bought wine on average bought just over 4 bottles, the average period that it will take for all this wine to be consumed is almost 10 months, meaning that a period of roughly 2 months elapses before each bottle is consumed.
About 21% of the visitors who bought wine intend to keep it in cellar at home for a period of at least 1 year.

Cellar Door Visitor Research Study 2013 GWRDC USA-1204 © Copyright, 2014
17
Prior Awareness and Actual Experience of the Winery’s Wine Brands
Table 16: The Winery’s Wine Brand - Previous Awareness/Actual Experience
Awareness/Actual Experience of the Brand %
Ever HEARD of THIS WINERY (corporate brand) 78.7%
Ever HEARD of any of this winery’s WINES (product brands) 75.7%
Ever TRIED (DRUNK) any of this winery’s WINES (product brands) 64.3%
Ever PURCHASED any of this winery’s WINES (product brands) 57.7%
PURCHASED or CONSUMED any of this winery’s wines in LAST 3 MONTHS 33.8%
Key Insight: The baseline indicators in terms of the awareness, actual experience and recency of the experience with the wine brand form the basis for determining the multiplier effect that the cellar door visit has on future wine sales to the visitors.
The main purpose of this project is to track the effect of the cellar door experience on future sales of the wine brand. In order to achieve this, benchmarks relating to the current situation have to be established first (Table 16).
It is insightful that 64% of visitors had actually tried a wine of the winery before visiting the cellar door with that figure diluting somewhat to 58% who have actually purchased it in the past. Furthermore, 34% purchased and/or consumed it in the last 3 months before visiting the cellar door. This means the perception thereof is still quite ‘fresh’ in their memory and we would expect it to be instrumental in reinforcing and strengthening that perception. Overall, these levels of experience are high, relatively speaking.
It is also very important to note that 21% of visitors have not ever heard of the winery, meaning that they are completely unaware of the corporate brand.

Cellar Door Visitor Research Study 2013 GWRDC USA-1204 © Copyright, 2014
18
Wine Brand Range KPIs, Purchase Behaviour,
and Likelihood of Future Purchase
Table 17: The Winery’s Brand Range Dynamics and KPIs at the Cellar Doors
Brand Dynamics and KPIs Range 1 Range 2 Range 3 Other Wines
Tasted this wine on the day 62.7% 56.3% 43.5% 33.8%
Bought this wine on the day 30.6% 26.1% 19.4% 19.5%
Bought this wine after tasting it first 28.3% 24.3% 16.7% 15.9%
Number of bottles bought on the day* 3.26 2.91 2.62 3.50
Amount Spent on the day* $74.33 $72.32 $73.93 $68.97
Average amount spent per bottle* $22.80 $24.85 $28.22 $19.71
Likelihood of Buying in Next 3 Months
Almost no chance (1%) 12.5% 14.6% 17.0% 19.8%
10% chance 8.4% 8.4% 8.5% 7.0%
20% chance 8.5% 8.0% 9.9% 9.1%
30% chance 9.8% 10.9% 10.3% 10.1%
40% chance 10.0% 10.0% 9.6% 10.2%
Fairly good chance (50%) 14.7% 13.7% 12.6% 13.6%
60% chance 9.1% 9.4% 9.5% 8.2%
70% chance 7.6% 7.1% 6.7% 6.2%
80% chance 7.0% 7.4% 6.4% 5.3%
90% chance 4.4% 3.8% 4.1% 3.8%
Practically certain (99%) 8.0% 6.7% 5.5% 6.9%
Buying likelihood (mean) 45.2% 43.2% 40.7% 40.1%
* Figures pertain only to visitors who actually bought a specific wine from a range
Wineries participating in the study were asked to provide details of their best-selling brand range at cellar door (Range 1), 2nd best (Range 2), 3rd best (Range 3) and all other wines were grouped under ‘Other Wines’.
Table 17 indicates that the actual purchases of cellar door visitors tied in very closely with this categorisation. Range 1 was bought by most (31%) of the visitors, closely followed by Range 2 that was purchased by 26%, Range 3 with 19%, while 19% bought Other Wines. Overall, 21.3% of all tasted wines at cellar door were purchased.
Range 1 yielded the highest dollar sales with $74 spent on 3.3 bottles of wine on average by the visitors who bought it. The Other Wines category yielded the lowest average sales figure of $69 but the highest number of bottles sold (3.5 bottles). The split by wine type bought of the Other Wines category was: Red = 42%; White = 24%; Fortified = 22%; Sparkling = 8%; Rosé = 4%
The all-important likelihood of purchasing these wines in the immediate future is very similar across the ranges varying from 45% (Range 1) to 40% (Other Wines) and fall roughly in the broader category of “uncertain”. Thus, comparing these predictions with actual purchase/non-purchase in the follow-up surveys will be most insightful.
Key Insight: The intention to purchase likelihood of the individual brand ranges is the strongest indicator in the baseline study of whether the visit experience will translate into future sales of the wines. Whether this is a truly accurate indicator of actual purchase in future will only become apparent through the follow-up surveys.

Cellar Door Visitor Research Study 2013 GWRDC USA-1204 © Copyright, 2014
19
Wine Brand Range KPIs (Cont.)
Taking the likelihood of future purchase a step further, Table 18 pinpoints the likelihood of this purchase occurring at specific wine retail venues.
The results should be read in conjunction with the retail venues where the visitors normally buy their wines (see Table 25) and also whether the wines are in the first place available in say, a wine retail store near the visitor’s home. It is insightful that the likelihood of adopting the direct-to-consumer (DTC) pathway of the winery (through mailorder, wine club or online) is so high (55%). The likelihood that they will return to the cellar door within 3 months is also quite high (36%). This does auger well for further cementing their relationship with the brand.
Table 18: Likelihood of Buying Any of the Winery’s Wines in the Next 3 Months From Specific Wine Retail Venues
Likelihood of Buying in Next 3 Months
Wine Retail Store
Restaurant, Bar or Pub
Mailorder, Wine Club or Online
Cellar Door During Revisit
Almost no chance (1%) 16.0% 15.5% 31.4% 16.4%
10% chance 3.0% 4.7% 7.7% 4.2%
20% chance 3.3% 5.9% 6.7% 3.9%
30% chance 2.7% 6.5% 5.9% 3.7%
40% chance 3.2% 5.8% 4.2% 2.8%
Fairly good chance (50%) 23.8% 26.8% 17.5% 19.4%
60% chance 5.4% 7.3% 4.7% 5.4%
70% chance 10.2% 9.3% 5.2% 9.0%
80% chance 9.9% 8.7% 6.6% 9.4%
90% chance 6.8% 4.0% 2.4% 6.8%
Practically certain (99%) 15.7% 5.5% 7.7% 19.0%
Buying likelihood (mean) 55.1% 46.3% 55.4% 35.9%
Key Insight: Consumers will purchase wine where it is convenient for them, where they perceive to get good value and where they assume (or know) the product will be available for purchase. It is very important that the message regarding exactly where the wine is available for purchase be passed on to visitors by the cellar door staff.

Cellar Door Visitor Research Study 2013 GWRDC USA-1204 © Copyright, 2014
20
Wine Brand Range KPIs (Cont.)
Table 19: Brand Range Dynamics and Metrics and Envisaged Consumption Occasion
Brand Dynamics and KPIs Range 1 Range 2 Range 3 Other Wines
Tasted this wine on the day 62.7% 56.3% 43.5% 33.8%
Bought this wine on the day 30.6% 26.1% 19.4% 19.5%
Number of bottles bought on the day* 3.27 2.91 2.62 3.50
Amount Spent on the day* $74.31 $72.56 $73.99 $68.97
Average amount spent per bottle* $22.73 $24.94 $28.26 $19.71
Consumption Occasion for which Wine was Bought Range 1 Range 2 Range 3 Other Wines
‘Normal’ consumption at home with self/family 39.6% 37.3% 39.1% 40.3%
Consumption at home with guests 20.9% 21.1% 18.1% 20.3%
Celebration/special occasion at home 8.6% 9.3% 10.5% 9.1%
With others at their home away from own home 7.3% 6.9% 5.4% 5.0%
Celebration/special occasion away from home 6.0% 6.1% 6.3% 5.8%
Gift for someone 5.5% 4.4% 5.9% 8.0%
Cellaring at home for purpose of ageing the wine 4.8% 7.3% 7.3% 4.5%
BYO to a restaurant/pub/bar away from home 4.7% 4.5% 4.0% 3.2%
Don’t know yet 2.6% 3.1% 3.4% 3.8%
Total 100.0% 100.0% 100.0% 100.0%
* Figures pertain only to visitors who actually bought a specific wine from a brand range
Table 19 indicates that Range 1 wines were bought by most (31%) and tasted by most (53%) of the visitors, closely followed by Range 2 wines that were purchased by 26%, and Range 3 and Other Wines each bought by 19%.
Range 1 yielded the highest dollar sales with $74 spent on 3.3 bottles of wine on average by the visitors who bought it. Range 1 also accounted for most of the sales revenue in total (also refer to Table 17). Other Wines yielded the lowest sales per bottle ($19.74) as these wines represented the wineries’ cheaper products.
The future consumption occasions for which the wines were bought were largely (±70% of the time) for normal consumption at home (1st), consumption with guests at home (2nd), and for consumption on a special occasion/celebration at home (3rd).
Key Insight: The intention to purchase likelihood of the individual brand ranges is the strongest indicator in the baseline study of whether the visit experience will translate into future sales of the wines. Whether this is a truly accurate indicator of actual purchase in future will only become apparent through the follow-up surveys.
Cellar Door Visitor Research Study 2013 GWRDC USA-1204 © Copyright, 2014
21
Wine Brand Range KPIs (Cont.)
Key Insight: People who visit the cellar door present a unique (perhaps even once-off) opportunity for staff to ensure that the visitors know exactly where the winery’s wines are obtainable from at a nearest to their permanent place of residence.
Table 20: Whether Visitors Left the Cellar Door with Knowledge about Where the Winery’s Wines Can be Bought from in Future (Other than at the Cellar Door)
Statement %
I knew this already before visiting today 57.4
The cellar door staff told where to buy it today 28.6
I did not ask and I am not interested in knowing 10.2
I did not ask and I was not told by the cellar door staff 1.6
I did not ask but I am interested in knowing 1.0
I asked, but the cellar door staff did not know 0.7
I did not ask but assumed I will be able to figure it out (i.e. buy online) 0.5
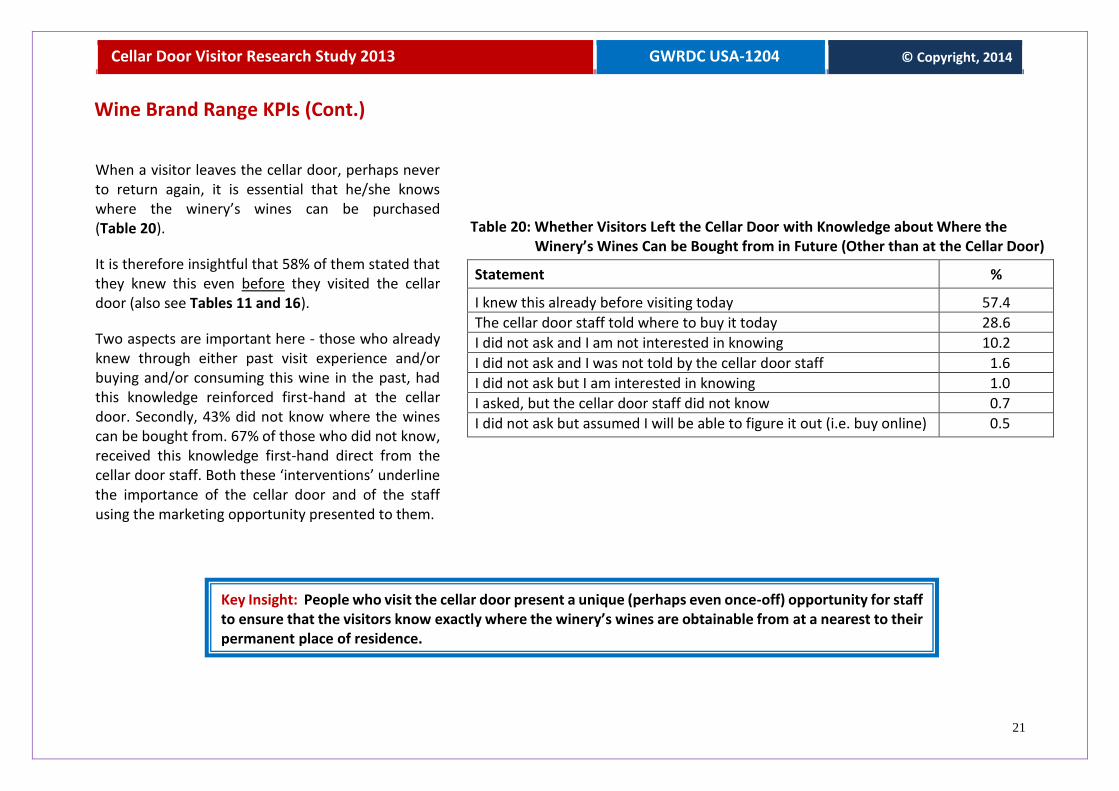
When a visitor leaves the cellar door, perhaps never to return again, it is essential that he/she knows where the winery’s wines can be purchased (Table 20).
It is therefore insightful that 58% of them stated that they knew this even before they visited the cellar door (also see Tables 11 and 16).
Two aspects are important here - those who already knew through either past visit experience and/or buying and/or consuming this wine in the past, had this knowledge reinforced first-hand at the cellar door. Secondly, 43% did not know where the wines can be bought from. 67% of those who did not know, received this knowledge first-hand direct from the cellar door staff. Both these ‘interventions’ underline the importance of the cellar door and of the staff using the marketing opportunity presented to them.

Cellar Door Visitor Research Study 2013 GWRDC USA-1204 © Copyright, 2014
22
Normal Wine Consumption Behaviour of the Cellar Door Visitors as Consumers
Table 21: Frequency, Quantity and Total Expenditure of the Visitors’ Normal Wine Consumption as Consumers
Frequency of Consumption % Cumulative %
More than once a week 59.5 59.5
Once a week 22.4 81.9
2 to 3 times per month 11.0 92.9
Once a month 4.2 97.1
Once every 2 to 3 months 1.2 98.3
Less often than once every 2 to 3 months 1.7 100.0
Personal Monthly Wine Consumption % Mean
Bottles (750 ml) 99.2 4.84
Cask wine (2.0 litres) 4.7 1.67
Total bottles (750 ml equivalent) - 5.01
% Mean
Household’s Expenditure on Wine per Month - $156.79
Household’s Monthly Wine Consumption
Bottles (750 ml) 99.2 9.06
Cask wine (2.0 litres) 6.7 2.65
Total bottles (750 ml equivalent) - 9.47
From Table 21 it follows that almost all (97%) of the visitors included in the survey, drink wine at least once per month.
They drink largely bottled wine (in standard size 750 ml bottles) at an average of 5.0 bottles of their household’s total consumption of 9.5 bottles per month. Their individual consumption level is therefore considerably higher than the average for Australia which is 28.7 litres (±38 bottles per year ≈ 3.1 bottles per month). This suggests that wine tourists are the higher volume wine consumers among the wine drinking population.
The average amount spent on wine per month by the household is $156.79 which averages out at ±$16.56 per bottle equivalent.
Key Insight: Wine tourists exhibit wine consumption patterns that are at the upper ranges of the national average and they should therefore be key target consumers for wineries.

Cellar Door Visitor Research Study 2013 GWRDC USA-1204 © Copyright, 2014
23
Normal Wine Consumption Behaviour (Cont.)
The cellar door visitor’s role in his/her household in terms of wine buying and consumption is an important factor in developing an understanding of their influence in the wine buying process.
Table 22 shows that most of the cellar door visitors were high up in the hierarchy in their households as far as wine is concerned either as the main buyer (77%) and/or main consumer (68%).
Key Insight: The roles a cellar door visitor have in his/her household’s wine role structure are indicative of his/her influence in the buying and consumption of wine in the household.
Table 22: Role in Household in terms of Wine Buying and Consumption
Role in Household %
Main wine buyer 76.6
Main wine consumer 67.8
Neither main wine buyer or consumer 8.6
Cellar Door Visitor Research Study 2013 GWRDC USA-1204 © Copyright, 2014
24
Normal Wine Consumption Behaviour (Cont.)
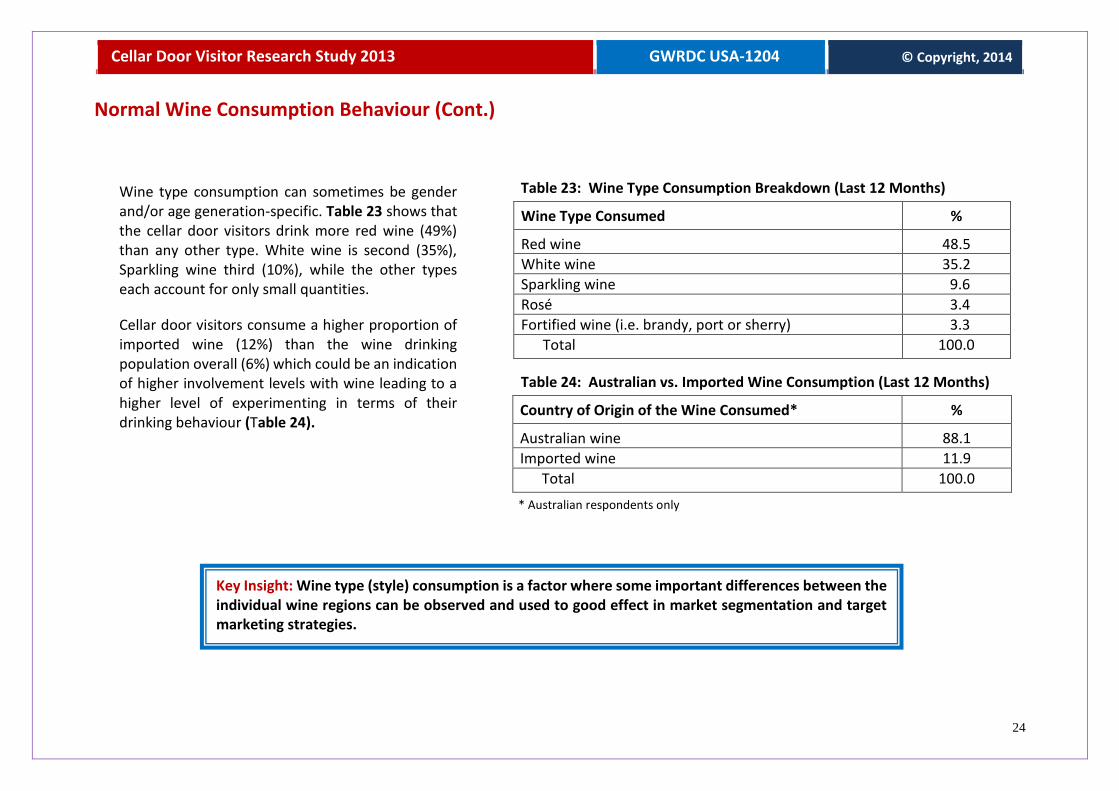
Wine type consumption can sometimes be gender and/or age generation-specific. Table 23 shows that the cellar door visitors drink more red wine (49%) than any other type. White wine is second (35%), Sparkling wine third (10%), while the other types each account for only small quantities.
Cellar door visitors consume a higher proportion of imported wine (12%) than the wine drinking population overall (6%) which could be an indication of higher involvement levels with wine leading to a higher level of experimenting in terms of their drinking behaviour (Table 24).
Key Insight: Wine type (style) consumption is a factor where some important differences between the individual wine regions can be observed and used to good effect in market segmentation and target marketing strategies.
Table 23: Wine Type Consumption Breakdown (Last 12 Months)
Wine Type Consumed %
Red wine 48.5
White wine 35.2
Sparkling wine 9.6
Rosé 3.4
Fortified wine (i.e. brandy, port or sherry) 3.3
Total 100.0
Table 24: Australian vs. Imported Wine Consumption (Last 12 Months)
Country of Origin of the Wine Consumed* %
Australian wine 88.1
Imported wine 11.9
Total 100.0
* Australian respondents only
Cellar Door Visitor Research Study 2013 GWRDC USA-1204 © Copyright, 2014
25
Normal Wine Consumption Behaviour (Cont.)
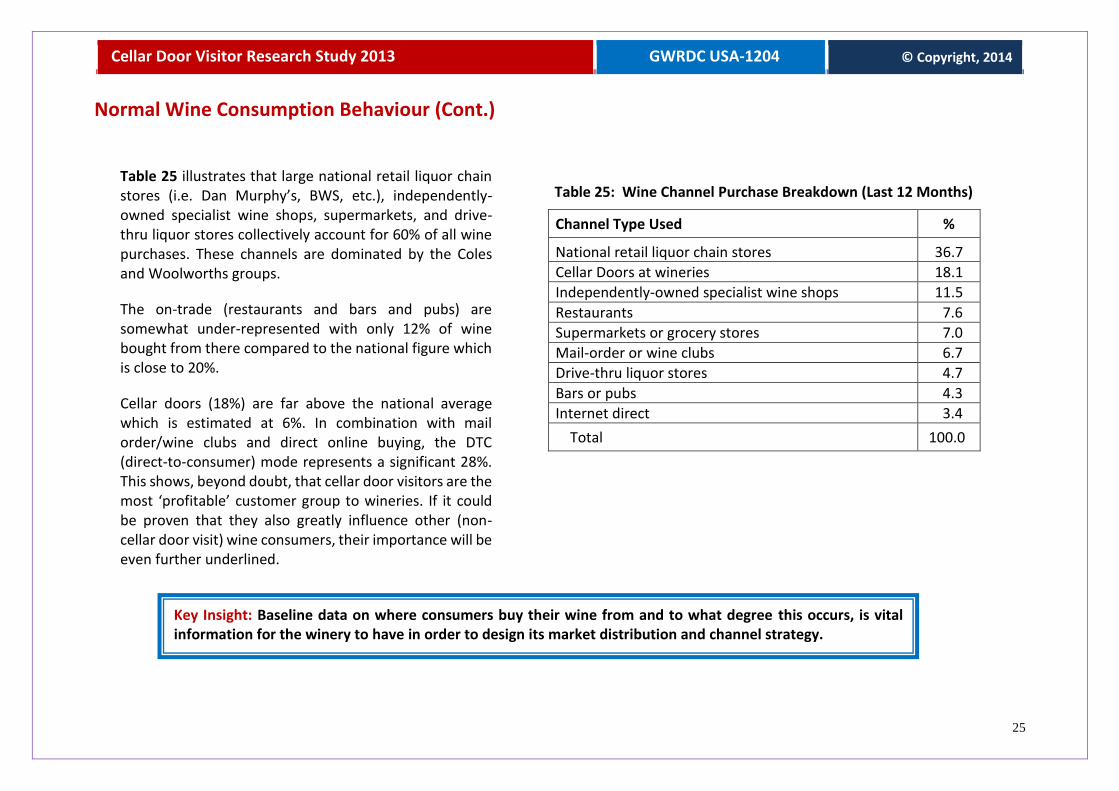
Key Insight: Baseline data on where consumers buy their wine from and to what degree this occurs, is vital information for the winery to have in order to design its market distribution and channel strategy.
Table 25: Wine Channel Purchase Breakdown (Last 12 Months)
Channel Type Used %
National retail liquor chain stores 36.7
Cellar Doors at wineries 18.1
Independently-owned specialist wine shops 11.5
Restaurants 7.6
Supermarkets or grocery stores 7.0
Mail-order or wine clubs 6.7
Drive-thru liquor stores 4.7
Bars or pubs 4.3
Internet direct 3.4
Total 100.0
Table 25 illustrates that large national retail liquor chain stores (i.e. Dan Murphy’s, BWS, etc.), independently-owned specialist wine shops, supermarkets, and drive-thru liquor stores collectively account for 60% of all wine purchases. These channels are dominated by the Coles and Woolworths groups.
The on-trade (restaurants and bars and pubs) are somewhat under-represented with only 12% of wine bought from there compared to the national figure which is close to 20%.
Cellar doors (18%) are far above the national average which is estimated at 6%. In combination with mail order/wine clubs and direct online buying, the DTC (direct-to-consumer) mode represents a significant 28%. This shows, beyond doubt, that cellar door visitors are the most ‘profitable’ customer group to wineries. If it could be proven that they also greatly influence other (non- cellar door visit) wine consumers, their importance will be even further underlined.

Cellar Door Visitor Research Study 2013 GWRDC USA-1204 © Copyright, 2014
26
Special Interest Focus: Regional Comparisons
Cellar Door Visitor Profiles of the Wine Regions
Key Insight: The socio-demographic profile of wine tourists to each wine region reflects the region’s positioning regarding the Australian wine tourism market as a whole and is a basic market segmentation basis. There are clear differences between the profiles of visitors to many of the regions, which must be acknowledged in developing regional marketing strategies
Table 26: Regional Comparisons - Gender, Age, Educational Status, Household Income and Residential Origin of the Cellar Door Visitors
Australia Total
Barossa Valley
McLaren Vale
Clare Valley
Adelaide Hills
Coona-warra
Yarra Valley
M’nington Peninsula
Ruther-glen
Hunter Valley
Mudgee Riverina Margaret
River Swan Valley
Tasmania Granite
Belt
Gender % % % % % % % % % % % % % % % %
Female 55.0 58.6 56.8 52.7 56.3 39.6 58.1 49.5 45.6 42.6 56.2 54.5 51.6 65.4 46.5 53.5
Male 45.0 41.4 43.2 47.3 43.7 60.4 41.9 50.5 54.4 57.4 43.8 45.5 48.4 34.6 53.5 46.5
Age Group
18-34 years 39.0 41.0 42.2 25.9 44.9 33.3 49.1 41.2 32.2 50.0 38.6 23.7 36.0 40.6 29.6 31.4
35-44 years 19.4 17.1 18.7 16.3 19.3 19.0 31.7 28.0 12.1 24.0 23.9 16.4 22.3 21.7 19.4 23.3
45-54 years 18.0 18.9 16.5 19.1 14.6 25.7 11.5 13.1 19.4 12.9 17.7 12.7 23.5 16.0 20.0 26.7
55-64 years 17.7 16.4 17.4 28.7 16.9 15.3 5.7 12.1 32.3 7.5 12.5 39.9 14.3 17.9 23.2 15.1
65 + years 5.9 6.6 5.2 10.0 4.3 6.7 2.0 5.6 4.0 5.6 7.3 7.3 3.9 3.8 7.8 3.5
Educational Status
High School Certificate 18.7 21.0 22.5 18.2 11.9 17.2 12.5 16.8 16.2 11.1 17.4 36.4 13.8 11.4 14.1 23.3
Undergrad qualification 47.7 49.4 48.4 49.1 47.3 42.8 59.5 32.7 50.0 53.7 48.2 34.5 46.0 48.0 38.1 51.0
Postgrad qualification 33.6 29.6 29.1 32.7 40.8 40.0 28.0 50.5 33.8 35.2 34.4 29.1 40.2 40.6 47.8 25.7
Annual Household Income
Mean ($) $134,164 $130,384 $117,676 $132,108 $137,556 $148,835 $135,874 $154,688 $129,104 $139,183 $156,479 $102,075 $163,867 $139,107 $139,866 $125,915
Permanent Residence
SA 36.4 47.9 65.0 50.0 59.2 42.4 4.9 0.9 3.2 - - - 2.0 1.9 3.9 -
NSW 19.6 13.8 8.6 16.4 11.6 5.7 3.9 6.5 21.8 87.0 92.2 70.3 15.3 7.5 23.4 3.5
VIC 17.9 16.3 8.6 13.6 6.6 43.4 70.9 76.7 59.7 3.7 0.9 18.5 8.0 2.8 27.3 1.2
QLD 9.3 9.2 5.8 9.1 9.3 3.8 8.7 1.9 3.2 3.7 2.6 3.7 10.7 3.8 11.7 90.6
WA 7.7 3.3 4.2 4.5 3.9 - 1.9 2.8 1.6 - - 1.9 55.3 71.8 7.1
Overseas 5.8 7.7 6.6 4.1 4.7 2.8 6.8 10.3 2.4 5.6 1.3 - 6.0 11.3 2.6 4.7
TAS 1.8 0.9 0.6 0.9 0.8 1.9 1.9 - 1.6 - 0.4 1.9 2.0 - 20.8 -
ACT 1.3 0.7 0.3 0.9 3.1 - 1.0 0.9 6.5 - 2.6 3.7 0.7 0.9 2.6 -
NT 0.2 0.2 0.3 0.5 0.8 - - - - - - - - - 0.6 -

Cellar Door Visitor Research Study 2013 GWRDC USA-1204 © Copyright, 2014
27
Buying Behaviour Metrics of the Cellar Door Visitors of the Wine Regions Table 27: Regional Comparisons - Buyer Behaviour at Cellar Door, Awareness/Actual Experience of the Winery’s Wines and Visit History
Australia Total
Barossa Valley
McLaren Vale
Clare Valley
Adelaide Hills
Coona-warra
Yarra Valley
M’nington Peninsula
Ruther-glen
Hunter Valley
Mudgee Riverina Margaret
River Swan Valley
Tasmania Granite
Belt
Visit History % % % % % % % % % % % % % % % %
Have visited winery before 40.1 38.1 42.1 36.8 39.1 36.8 35.2 40.2 52.8 59.3 31.8 36.4 43.1 52.3 26.5 61.6
Have never visited winery 59.9 61.9 57.9 63.2 60.9 63.2 64.8 59.8 47.2 40.7 68.2 63.6 56.9 47.7 73.5 38.4
Awareness or Experience % % % % % % % % % % % % % % % %
Heard of the winery (aware)
78.7 87.5 74.5 87.3 73.9 68.9 60.0 70.1 89.6 88.9 60.9 83.6 81.7 72.0 76.8 89.5
Heard of its wines (aware) 75.7 85.9 70.3 83.2 69.0 67.9 54.3 67.3 88.8 87.0 55.4 81.8 80.4 71.0 74.8 86.0
Tried its wine (experienced)
64.3 76.4 58.6 70.0 57.5 51.9 41.9 51.4 80.0 70.4 43.3 74.5 73.2 62.6 57.4 72.1
Bought/consumed its wine 57.7 69.8 51.3 64.1 49.4 43.4 35.2 44.9 78.4 66.7 36.5 65.5 69.3 56.1 51.0 67.4
Bought/consumed (last 3 mth) 33.8 43.5 26.3 34.5 24.9 19.8 21.9 30.8 52.8 42.6 24.0 36.4 42.5 33.6 30.3 38.4
Buying Behaviour
Non-Wine Items
% visitors buying 25.7% 21.7% 20.1% 11.8% 33.0% 15.1% 36.2% 55.1% 34.4% 27.8% 27.0% 7.3% 20.3% 47.7% 42.6% 36.0%
Amount spent ($) $75.58 $74.28 $87.58 $51.83 $91.98 $71.19 $74.26 $86.00 $64.38 $61.73 $52.11 $28.00 $114.42 $68.69 $56.23 $76.03
Wine-by-the-Glass
% visitors buying 7.6% 6.3% 6.2% 1.4% 8.4% 2.8% 14.3% 24.3% 12.0% 7.4% 4.7% - 4.6% 10.3% 16.8% 14.0%
Amount spent ($) $19.92 $17.05 $19.96 $23.33 $23.32 $15.00 $20.87 $26.54 $22.13 $19.75 $20.14 - $21.86 $17.55 $16.60 $17.08
Wine Bottles (Take Home)*
% visitors buying 66.7% 61.7% 61.4% 71.8% 60.9% 70.8% 70.5% 72.9% 83.2% 79.6% 77.7% 94.5% 61.4% 50.5% 78.7% 75.6%
Number of bottles 4.42 4.07 3.60 5.51 2.86 4.17 3.91 5.08 5.29 6.49 4.44 9.60 6.65 3.46 3.52 6.38
Amount spent ($) $104.05 $99.81 $90.33 $113.72 $85.71 $109.91 $102.96 $126.14 $112.61 $151.38 $108.73 $70.28 $161.36 $76.51 $99.55 $139.10
Price paid per bottle ($) $23.54 $24.52 $25.09 $20.63 $29.97 $26.36 $26.33 24.83 $21.29 $23.33 $24.49 $7.32 $24.27 $22.11 $28.28 $21.80
All Items (Wine + Non-wine)
% visitors buying something
74.6% 70.5% 68.0% 75.5% 75.5% 74.5% 80.0% 83.2% 85.6% 83.3% 81.5% 94.5% 68.6% 75.7% 88.4% 81.4%
Amount spent ($)** $121.02 $111.70 $109.42 $116.78 $111.94 $119.33 $128.62 $175.31 $138.42 $166.98 $122.02 $72.43 $179.70 $96.64 $118.89 $165.76
Amount spent ($) non-buyers#
$90.30 $78.79 $74.38 $88.11 $84.49 $88.93 $102.90 $145.82 $118.49 $139.15 $99.50 $68.49 $123.32 $73.16 $105.08 $134.92
* Average expenditure of only the visitors who actually bought the item
**Average expenditure of all the visitors whether they bought an item or nothing at all
# Average expenditure of all visitors on the item
Key Insight: The buyer behaviour metrics of its cellar door visitors reflect the degree to which each wine region has succeeded in terms of the yield rate at cellar door. It is also a comparative benchmark for positioning in the market against rival wine regions.

Cellar Door Visitor Research Study 2013 GWRDC USA-1204 © Copyright, 2014
28
Characteristics of the Wine Regions and Visit History
Key Insight: The socio-demographic profile of wine tourists to each wine region reflects the region’s positioning regarding the Australian wine tourism market as a whole and is a basic market segmentation basis.
Table 28: Regional Comparisons - Characteristics of the Individual Wine Regions and Visit History
Australia Total
Barossa Valley
McLaren Vale
Clare Valley
Adelaide Hills
Coona-warra
Yarra Valley
M’nington Peninsula
Ruther-glen
Hunter Valley
Mudgee Riverina Margaret
River Swan Valley
Tasmania Granite
Belt
Visit History % % % % % % % % % % % % % % % %
Have visited the region before 65.4 62.3 69.2 63.2 71.6 57.5 70.5 75.7 64.0 83.3 53.6 70.9 61.4 79.4 49.0 81.4
Have never visited the region 59.9 37.7 30.8 36.8 28.4 42.5 29.5 24.3 36.0 16.7 46.4 29.1 38.6 20.6 51.0 18.6
Number of visits (in last 3 years) 3.3 3.0 4.1 1.8 4.5 2.0 3.7 4.7 2.3 4.5 1.7 4.4 2.9 5.2 1.4 3.5
Wine Region Characteristics* % % % % % % % % % % % % % % % %
Wines 86.5 88.3 86.6 87.7 87.4 88.7 86.7 86.0 84.0 85.2 89.3 69.1 86.9 86.0 85.2 69.8
Scenery, natural environment** 68.0 82.4 75.8 83.2 87.4 61.3 78.1 75.7 71.2 70.4 75.1 60.0 78.4 81.3 73.5 70.9
Local food 57.5 60.9 55.5 50.5 64.4 43.4 61.0 59.8 53.6 35.2 59.2 38.2 64.1 57.9 59.4 55.8
Vineyard landscape 56.1 59.5 57.1 58.2 55.6 36.8 69.5 57.9 42.4 63.0 62.2 25.5 54.2 58.9 51.6 43.0
Atmosphere/climate/ambience 48.7 49.7 50.3 47.3 53.6 33.0 47.6 45.8 44.0 40.7 47.2 45.5 51.0 59.8 43.9 45.3
Friendly local residents 34.1 34.0 33.0 34.5 24.9 37.7 31.4 28.0 38.4 33.3 42.9 38.2 39.2 33.6 31.6 39.5
Reputation 29.7 31.5 31.2 29.5 26.4 38.7 28.6 28.0 41.6 35.2 21.5 23.6 30.1 22.4 27.1 20.9
Quality of the restaurants/pubs 29.2 29.5 24.2 29.5 31.4 31.1 27.6 30.8 36.0 26.2 31.8 36.4 37.3 26.2 23.9 31.4
Cleanliness 26.2 31.0 25.2 23.6 24.9 13.2 17.1 22.4 26.4 18.5 23.6 21.8 29.4 30.8 24.5 31.4
Proximity to a main city 24.0 22.8 29.2 19.1 37.9 6.6 34.3 28.0 11.2 27.8 17.2 9.1 15.7 35.5 20.0 18.6
Towns/villages 23.2 32.2 17.8 32.3 27.6 14.2 16.2 23.4 20.8 7.4 21.9 10.9 18.3 12.1 19.4 11.6
Value-for-money 22.0 20.5 20.8 25.5 16.9 20.8 20.0 13.1 29.6 22.2 24.0 47.3 20.9 31.8 20.0 29.1
Heritage and cultural attractions 20.7 23.1 18.3 31.8 21.5 15.1 12.4 8.4 24.0 16.7 20.2 27.3 17.0 18.7 23.9 14.0
Accommodation offered 20.5 19.5 12.6 32.3 9.2 31.1 21.9 15.9 23.2 31.5 40.8 14.5 31.4 8.4 15.5 36.0
Other local products/industries 18.3 20.7 17.8 15.5 21.8 7.5 19.0 17.8 23.2 9.3 21.0 12.7 17.0 17.8 11.6 16.3
Signage to and inside the region 18.0 18.1 15.8 22.3 14.9 12.3 18.1 16.8 18.4 7.4 18.0 25.5 17.0 21.5 24.5 27.9
Lack of urbanisation 17.7 17.6 15.2 23.6 18.4 10.4 12.4 18.7 16.8 18.5 24.0 14.5 19.6 21.5 14.2 20.9
Leisure time facilities 15.0 16.7 14.4 12.3 12.6 7.5 10.5 18.7 14.4 20.4 15.5 12.7 19.6 18.7 8.4 23.3
Availability of tourist information 13.7 15.3 13.4 16.8 7.3 11.3 13.3 9.3 19.2 7.4 12.4 16.4 18.3 15.0 9.0 17.4
Safety and security 11.3 12.6 12.4 12.3 10.3 3.8 3.8 9.3 7.2 5.6 12.9 12.7 10.5 12.1 11.0 14.0
Local transportation 2.7 6.5 3.9 1.8 4.6 7.5 1.0 1.9 1.6 1.9 7.3 16.4 7.2 1.9 1.9 5.8
Nightlife and entertainment 2.1 3.7 3.1 0.5 1.9 1.9 1.9 0.9 1.6 3.7 2.1 - 2.0 3.7 5.2 -
* Visitors provided with 23 generic regional characteristics - they could pick any that they value (‘pick any’ research technique)
** Scenery and natural settings of wineries combined

Cellar Door Visitor Research Study 2013 GWRDC USA-1204 © Copyright, 2014
29
Wine Consumption Metrics of the Cellar Door Visitors of the Wine Regions
Table 29: Regional Comparisons - Wine Consumption Metrics of the Cellar Door Visitors as Consumers
Australia Total
Barossa Valley
McLaren Vale
Clare Valley
Adelaide Hills
Coona-warra
Yarra Valley
M’nington Peninsula
Ruther-glen
Hunter Valley
Mudgee Riverina Margaret
River Swan Valley
Tasmania Granite
Belt
Consumption per Month*
Personal (750 ml. bottles) 5.01 4.77 4.67 5.69 4.96 5.75 4.40 5.44 5.07 5.35 5.08 4.47 5.40 4.80 5.84 6.07
Household (750 ml. bottles)
9.47 8.80 8.66 10.96 9.87 10.36 8.89 10.69 9.62 10.85 9.30 8.76 10.55 8.95 11.45 11.18
Household spend on wine
$156.79 $140.68 $141.17 $156.25 $172.99 $167.45 $152.52 $234.35 $154.62 $162.69 $159.72 $91.82 $213.52 $149.43 $206.54 $152.58
Average price paid per bottle
$16.56 $15.99 $16.30 $14.26 $17.53 $16.16 $17.16 $21.92 $16.07 $15.00 $17.17 $10.48 $20.24 $16.70 $18.04 $13.65
Wine Type Consumed % % % % % % % % % % % % % % % %
Red 48.5 45.7 49.9 52.5 47.2 59.1 53.4 50.7 44.4 49.1 50.2 44.5 51.3 39.4 43.2 50.2
White 35.2 36.0 34.1 33.4 37.3 27.6 33.6 33.5 35.2 36.2 35.7 42.3 35.2 40.7 36.8 32.9
Sparkling 9.6 10.6 8.7 9.0 8.6 9.1 8.4 11.6 12.9 9.0 7.3 3.7 7.7 10.1 15.6 8.7
Rosé 3.4 4.0 4.0 2.0 3.3 1.8 2.6 2.7 1.8 1.7 5.1 2.5 3.2 3.5 2.2 3.3
Fortified 3.3 3.7 3.3 3.1 3.6 2.4 2.0 1.5 5.7 4.0 1.7 7.0 2.6 6.3 2.2 4.9
Domestic vs. Imported % % % % % % % % % % % % % % % %
Australian wine 86.1 88.1 84.7 92.3 85.1 86.2 76.8 74.3 93.7 79.4 89.9 95.2 85.2 84.9 85.5 84.4
Imported wine 13.9 11.9 15.3 7.7 14.9 13.8 23.2 25.7 6.3 20.6 10.1 4.8 14.8 15.1 14.5 15.6
Wine Role in Household % % % % % % % % % % % % % % % %
Main buyer 76.6 76.6 76.9 73.6 78.9 81.1 67.6 76.6 76.0 81.5 76.8 70.9 70.6 74.8 80.6 84.9
Main consumer 67.8 69.8 67.3 61.8 72.0 63.2 63.8 68.2 60.0 66.7 71.2 65.5 71.2 63.6 66.5 69.8
Retail Channel Type** % % % % % % % % % % % % % % % %
National retail liquor chains
36.7 37.3 39.5 35.7 33.8 34.4 37.0 31.1 35.6 34.5 35.2 30.3 37.1 35.4 38.6 38.1
Cellar doors at wineries 18.1 15.8 19.5 18.6 18.5 24.4 14.7 20.1 21.5 24.2 18.0 29.9 13.7 15.6 14.0 24.0
Specialist wine shops 11.5 11.1 10.1 11.0 12.8 10.9 16.3 12.1 10.1 12.8 11.9 8.1 15.4 11.0 14.7 9.3
Restaurants 7.6 7.4 7.3 8.0 9.6 9.8 9.9 10.9 4.1 8.6 7.6 2.7 6.6 8.2 7.5 4.6
Supermarkets/ grocery stores
7.0 8.8 4.9 5.2 5.1 5.2 9.9 9.2 11.0 6.6 6.4 19.3 5.2 8.0 6.3 4.6
Mail-order or wine clubs 6.7 5.5 5.9 8.4 8.9 7.0 3.3 4.9 8.6 4.4 8.6 3.8 8.6 3.2 9.5 10.1
Drive-thru liquor stores 4.7 5.2 6.8 4.8 4.8 1.9 3.8 2.5 2.8 2.2 1.1 4.0 5.3 9.7 1.7 1.3
Bars or pubs 4.3 5.4 3.8 4.4 3.9 2.7 3.8 4.5 2.7 5.3 5.2 1.4 2.2 5.5 3.4 4.0
Internet direct 3.4 3.5 2.2 3.9 2.6 3.7 1.3 4.7 3.6 1.4 6.0 0.5 5.9 3.4 4.3 4.0
* 750 ml bottle equivalent of both bottled (750 ml) and cask (2.0 litre) wine ** Wine purchases per retail channel category during the past 12-month period
Key Insight: The socio-demographic profile of wine tourists to each wine region reflects the region’s positioning regarding the Australian wine tourism market as a whole and is a basic market segmentation basis.

Cellar Door Visitor Research Study 2013 GWRDC USA-1204 © Copyright, 2014
30
Wine Club Members’ Demographic Profiles and Buyer Behaviour Metrics
From Table 30 it follows that there is………
Table 30: Regional Comparisons - Demographic Profiles and Buyer Behaviour Metrics of Cellar Door Visitors Who Are Members of a Wine Club
Australia Total
Barossa Valley
McLaren Vale
Clare Valley
Adelaide Hills
Coona-warra
Yarra Valley
M’nington Peninsula
Ruther-glen
Hunter Valley
Mudgee Riverina Margaret
River Swan Valley
Tasmania Granite
Belt
Demographic Profile % % % % % % % % % % % % % % % %
Club Members 19.6 9.8 12.6 26.4 19.2 40.6 18.1 28.0 48.8 29.6 15.0 25.5 30.1 24.3 32.3 39.5
Male 50.5 47.1 52.2 44.8 40.0 67.4 52.6 50.0 57.4 62.5 40.0 42.9 54.3 38.5 62.0 41.2
Female 49.5 52.9 47.3 55.2 60.0 32.6 47.4 50.0 42.6 37.5 60.0 57.1 45.7 61.5 38.0 58.8
18-39 years old 35.4 29.9 35.6 39.7 36.0 30.2 42.1 43.3 42.6 43.8 37.1 21.4 32.6 50.0 24.0 32.4
40 years and older 64.6 70.1 64.4 60.3 64.0 69.8 57.9 56.7 57.4 56.2 62.9 78.6 67.4 50.0 76.0 67.6
Household Income (mean)
$148,520 $132,778 $139,732 $148,922 $153,500 $174,000 $157,368 $155,345 $135,790 $147,969 $161,667 $89,643 $191,087 $143,636 $154,043 $129,113
Non-Club Members 80.4 90.2 87.4 73.6 80.8 59.4 81.9 72.0 51.2 70.4 85.0 74.5 69.9 75.7 67.7 60.5
Male 43.7 40.8 41.9 48.1 44.5 55.6 39.5 50.6 51.6 55.3 44.4 46.3 45.8 33.3 49.5 50.0
Female 56.3 59.2 58.1 51.9 55.5 44.4 60.5 49.4 48.4 44.7 55.6 53.7 54.2 66.7 50.5 50.0
18-39 years old 51.7 52.3 53.1 32.7 60.5 45.2 65.9 55.8 28.6 68.4 55.1 31.7 52.3 52.5 50.5 46.2
40 years and older 48.3 47.7 46.9 67.3 39.5 54.8 34.1 44.2 71.4 31.6 44.9 68.3 47.7 47.5 49.5 53.8
Household Income (mean)
$130,704 $130,124 $114,573 $126,503 $133,655 $132,857 $131,012 $154,433 $123,056 $135,278 $155,528 $106,539 $151,827 $137,796 $156,397 $123,971
Buying at the Cellar Door
Club Members
% Buying wine to take home
78.8% 83.9% 81.1% 69.0% 70.0% 69.8% 68.4% 80.0% 90.2% 100.0% 85.7% 100.0% 71.7% 57.7% 78.0% 85.3%
Number of bottles bought 6.59 7.59 6.38 6.75 5.29 6.17 5.77 5.88 5.69 8.63 5.73 10.93 7.52 5.40 4.74 8.83
Amount spent on wine ($)*
$153.67 $165.11 $167.59 $133.40 $150.07 $163.67 $129.23 $146.94 $122.41 $202.36 $147.53 $97.11 $193.23 $127.00 $132.92 $191.01
Price paid per bottle $23.32 $21.75 $26.27 $19.76 $28.37 $26.53 $22.40 $24.99 $21.51 $23.45 $25.75 $8.85 $25.70 $23.52 $28.04 $21.63
Amount spent (all items) ($)**
$172.15 $182.82 $182.52 $133.28 $176.55 $175.65 $165.67 $184.65 $153.03 $223.18 $164.03 $97.11 $212.81 $135.13 $154.63 $210.44
Non-Club Members
% Buying wine to take home
63.7% 59.3% 58.6% 72.8% 58.8% 71.4% 70.9% 70.1% 76.6% 71.1% 76.3% 92.7% 57.0% 48.1% 79.0% 69.2%
Number of bottles bought 3.76 3.53 3.05 5.08 2.18 2.84 3.51 4.72 4.84 5.22 4.18 9.11 6.18 2.72 2.95 4.42
Amount spent on wine ($)*
$89.13 $89.75 $74.92 $107.05 $67.55 $74.07 $97.36 $116.89 $101.60 $121.17 $101.02 $60.40 $144.12 $57.09 $83.87 $97.28
Price paid per bottle $23.70 $25.42 $24.56 $21.07 $30.99 $26.08 $27.74 $24.77 $20.99 $23.21 $24.17 $6.63 $23.32 $20.99 $28.43 $22.01
Amount spent (all items) ($)**
$106.39 $101.85 $95.02 $110.82 $93.90 $82.96 $120.57 $171.24 $122.98 $136.98 $114.15 $63.34 $163.14 $83.17 $103.09 $132.25
* Average expenditure of only the visitors who actually bought the item ** Average expenditure of visitors who actually bought something (wine and/or non-wine items)
Key Insight: The person who is a wine club member of any winery is the highest yielding group of cellar door visitors - highest on buying incidence, highest on number of bottles of wine bought, and the highest spenders on wine, and overall on all items.

Cellar Door Visitor Research Study 2013 GWRDC USA-1204 © Copyright, 2014
31
Appendix
Research Methodology
This study forms part of a three-stage Cellar Door Visit Impact Tracking Research Project with the overall aim to determine the impact of the visitor experience at the cellar doors on current and future sales of the corporate wine brand and its respective brand ranges (lines).
Stage one (this research report) consisted of a study executed at the Brand Home’s cellar door on visitors during an 8-10 week period starting mid April and finishing in the first week of July 2013.
The primary data collection instrument was a purpose-designed highly structured questionnaire. The final questionnaire had a total of 33 questions of which most were close-ended. The questionnaire was programmed for use on an iPad with a direct link to a web-research platform. Respondents had the choice of completing the survey on either paper or by using the iPad provided. Respondents answered questionnaires within an 8-12 minute time period on average. The amount of time needed to complete the questionnaire (8-12 minutes) was explained to respondents and they were given an assurance of complete confidentiality regarding their personal information. Sample control factors that contributed to the quality of the data collected, included that the majority of the respondents were regular wine drinkers, consuming wine at least once in the previous 2 months. Both Australian permanent residents and overseas visitors were included in the study, although it will be difficult and even impractical to track brand purchases in a longitudinal study in several countries.
Staff working at the cellar doors were individually trained/briefed and given clear written instructions on ensuring randomness when recruiting visitors to participate in the survey. For example, only one respondent from a household could participate in the survey.
Following the completion of the surveys the contact email addresses of all respondents were checked to ensure they were valid and could be used in the follow-up surveys - 3,107 respondents (95%) fitted these criteria. Any duplications (respondents who completed the survey more than once) were also removed. Finally, the data was captured analysed and manipulated using a statistical software package.
Cautionary Note
Due to logistical issues encountered with the execution of the survey in some wine regions, some of the South Australian wine regions (namely Barossa, Valley, McLaren Vale and Adelaide Hills), and thus South Australia as a whole, have disproportionately high representation in the study as it was only within these regions that the researchers were able to boost the sample sizes on relatively short notice.
This could have resulted in the distortion of some of the results and due caution has to be exercised when using (i.e. benchmarking against) some of the data that represent the Australian (national) metrics.
Cellar Door Visitor Research Study 2013 GWRDC USA-1204 © Copyright, 2014
32
Future Research
Professionalism in the wine industry translates to increased competitiveness and ultimately in wine business success. It is therefore absolutely vital that scientific research studies yielding valid and reliable information such as this one be executed at regular intervals in future in order to establish benchmarks and monitor progress towards set strategic goals.
This research study has shown that the wineries have most of the factors in place in as far as their wine tourism offering is concerned to remain important wine tourism destinations. At the same time it also underlined that the wineries still have some work to do to optimize all of these further.