why monitor warfarin
TRANSCRIPT

POC INR Device Evaluation
Virginia POC Network August 14, 2012
Brad S. Karon, MD, PhD Associate Professor of Laboratory Medicine and
Pathology Mayo Clinic
Rochester, MN

©2011 MFMER | slide-2
Disclosures
• Financial: none
• Off label uses: none • Special thanks to Dr. Paula Santrach for
content of some slides

Learning objectives
• Define the issues to consider when choosing point of care INR devices
• List the advantages and disadvantages to measuring INR at the point of care
• Describe differences in accuracy between common point of care INR systems

Outline
• Why monitor warfarin therapy • Pros and cons of point of care INR • Choosing POC INR devices • Conclusions

A question for you…

Why monitor warfarin
Vitamin K Oxide Reductase
Reduced Vitamin K
Oxidized Vitamin K
Carboxylation
II, VII, IX,X Precursor
Active II, VII, IX, X
• Warfarin mechanism of action
Why monitor warfarin
• Major indications for warfarin therapy • Primary & secondary prevention of venous
thromboembolism • Prevention of systemic embolism in
patients with prosthetic heart valves or atrial fibrillation
©2011 MFM | slide-8
Why monitor warfarin
• Narrow therapeutic window • Variability in patient response
Genetics Co-morbidities
• Drug and diet interactions • Variability in laboratory testing methods • Time delay (~1 day) between dosing and
ability to measure response

©2011 MFMER | slide-9
Why monitor warfarin
• Target INR 2.0 – 3.0 INR 4.5: 2-3 fold increase in risk of bleeding INR 5.5: 5 fold increase INR >6.0: 8-10 fold increase

©2011 MFMER | slide-10
Why monitor warfarin Optimal Anticoagulation
for Mechanical Heart Valves
0
2
4
6
8
10
1.5 2.5 3.5 4.5 5.5
12
6.5
Thromboembolism Observed
Hemorrhage Observed
PT-INR
Eve
nt R
ate
(p
er 1
00 p
atie
nt y
ears
)

©2011 MFMER | slide-11
Why monitor warfarin
Variability in patient response
• Drugs, dietary supplements or herbal medicines Changes in absorption or clearance of warfarin Changes in synthesis or clearance of vitamin K dependent
factors Interference with other pathways of hemostasis (e.g.,
platelet function)

©2011 MFMER | slide-12
Why monitor warfarin Variability in patient response
• Diet and dietary supplements Higher content of vitamin K
• Disease Hepatic dysfunction
Impaired synthesis of coagulation factors Hypermetabolic states (e.g., fever)
Increased catabolism of factors

©2011 MFMER | slide-13
Why monitor warfarin Variability in patient response
• Artifact of testing variability Thromboplastins vary in responsiveness to coagulation
factor deficiency Different instrument reagent combinations can give different
results Protime (PT) values differ markedly between
instrument/platform combinations Standardization to the INR, but it’s not perfect INR = [PT (patient)/PT (geomean)]ISI
Thromboplastins with different ISI values tend to differ more in INR values

©2011 MFMER | slide-14
Why monitor warfarin
1.5
2.0
2.5
3.0
3.5
4.0
7 8 9 10 11 12 13 14 15 16 17 18 19 20 21 22 23 24 25 26 27 28
Sample no.
Ortho RecombiPlasTin (ISI 1.05) at 0 h Dade Thromboplastin C-Plus (ISI 1.85) at 0 h Dade Innovin (ISI 0.85) at 0 h
INR
Davis KD et al: Arch Pathol Lab Med 122:972, 1998

©2011 MFMER | slide-15
Why monitor warfarin Reasons for INR inaccuracy
• Based on ISI values derived from patients on stable anticoagulation Results less reliable early in therapy
• Instrument/reagent combinations • Incorrect ISI • Preanalytical variables

©2011 MFMER | slide-16
Why monitor warfarin
• Goal is to prevent venous thromboembolism while minimizing the risk of hemorrhage --Setting the right target range --Getting to the right target quickly --Staying in the therapeutic range as much as
possible

©2011 MFMER | slide-17
Why monitor warfarin
• Times of increased risk with sub- or supra-therapeutic levels Initiation of therapy Changes in medications and/or diet Illness, hospitalization Change of testing laboratory Transitions of care
Hospital discharge Provider change

©2011 MFMER | slide-18
Why monitor warfarin
• Success and safety of therapy contingent upon Patient knowledge & compliance Education opportunities during
therapy/measurement Provider knowledge, experience & diligence Need to follow up after INR result for treatment
recommendation? Systems of care delivery How good is system at ensuring INR
measurment at correct time/intervals, recommendations for treatment reach patient, patient understands recommendations

A question for you…

Pros and Cons
• When might POC INR program add value? When POC INR is reasonably accurate
compared to local INR reference method When system for warfarin monitoring is
improved in POC compared to non-POC environments
Real time education Real time warfarin dosage adjustment Better patient compliance monitoring Better patient outcome
Pros and Cons
• Pros Rapid turnaround
time—allows real-time education and dose adjustment
Easy to use Some waived Accessible No venipuncture
• Cons Comparability to laboratory
methods Outliers/fliers Cost Oversight issues Interferences (LMWH) Response during
initiation/termination of therapy
©2011 MFMER | slide-21

Pros and Cons
• Major studies comparing home INR monitoring with lab monitoring
• Heneghan et al., Lancet 2006;367:404-11 Systematic review of 14 randomized trials of self-
monitoring vs. routine care for INR adjustment Self monitoring and adjustment reduced risk of
thromboembolism and all-cause mortality but did not significantly reduce risk of major hemorrhage

Pros and Cons
• Major studies comparing home INR monitoring with lab monitoring
• THINRS randomized study of 2922 VA patients (N Engl J Med 2010;363:1608-20
Randomized patients to weekly home testing vs.
monthly high quality clinic testing No advantage of home testing in terms of rates of
thromboembolism, slightly more bleeding in POC group Patients preferred home testing Not a comparison of home INR vs. routine care

©2011 ER | slide-24
Choosing POC INR devices • Technical performance
Equivalency to your laboratory method – bias Reproducibility with intended sample type
Intra & inter device Cutoff for requiring confirmatory lab result Performance at key decision point(s)
• Health care setting
Number and commitment of users Patient populations (hospice, nursing home, oncology
clinic, pediatric clinic, etc) Stably anticoagulated? Able to understand instructions? Reasons for anticoagulation? Frequency of concurrent heparin use System for management dependent upon POC application

©2011 MFMER | slide-25
Choosing POC INR Monitors
• Varying thromboplastins (ISI) and endpoint detection methods
• Designed to use capillary whole blood • Designed primarily for patient use • Data management capabilities to enhance
professional use just starting to be available

Choosing POC INR Monitors
• Data on accuracy/precision of POC INR devices
• Many studies published • Focus on those comparing capillary whole
blood (POC) to plasma INR (lab) if that is intended use
• Note lab reference method used • Look at decision thresholds and
concordance in similar decision range

Choosing POC INR Monitors
• Mayo Study of 3 devices • Study period one:
50 patients had both Method A and Method B POC INR by capillary fingerstick (separate fingersticks), and lab analysis by venipuncture for plasma INR on MDA 180 using Innovin thromboplastin
• Study period two: 50 patients had both Method A and Method C
POC INR by capillary fingerstick (separate fingersticks) and lab analysis of plasma INR

Results: Study period one Method A vs. lab plasma
Median bias = 0.0 INR units
5 of 50 exceeded 0.5 INR units of reference method

Results: Study period one Method B vs. lab plasma
Median bias = - 0.1 INR units 1 of 50 exceeded 0.5 INR units
of reference method
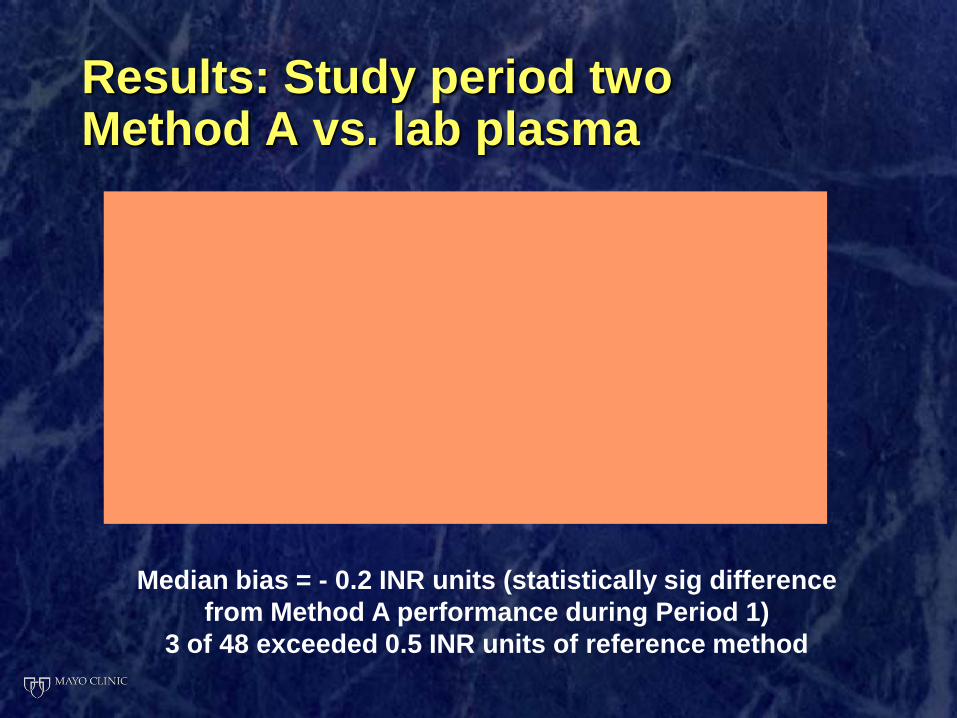
Results: Study period two Method A vs. lab plasma
Median bias = - 0.2 INR units (statistically sig difference from Method A performance during Period 1)
3 of 48 exceeded 0.5 INR units of reference method

Results: Study period two Method C vs. lab plasma
Median bias = 0.0 INR units 1 of 48 exceeded 0.5 INR units
of reference method

Overall distribution of results vs. reference plasma method
> 90% of POC results within 0.4 INR units of reference for Methods B and C
Difference between POC and lab plasma INR
0%
10%
20%
30%
40%
50%
60%
70%
80%
± 0.0-0.2 ± 0.3-0.4 ± 0.5-0.6 ± 0.7-1.0 ± >1.0
Difference in INR (POCT-Lab)
Perc
ent o
f val
ues
Method AMethod BMethod C

Study Conclusions
• Both Methods B and C capillary whole blood INR are closely correlated with plasma INR using Innovin
• Performance of capillary whole blood INR devices changes over time (relative to lab plasma), indicating a need for ongoing quality control/proficiency testing of these devices
• Lessons learned: Choose method with little systematic bias vs. lab reference, but don’t assume continued accuracy/bias over time

Older Mayo method comparison
0%10%20%30%40%50%60%70%80%
0-0.2 0.3-0.4 0.5-0.6 0.7-0.8 0.9-1.0 >1.0
Difference (POCT-Lab)
• Don’t assume that every method will match your lab

Precision assessment for POC INR
• Data from stabilized QC material overestimates precision
• If possible look at intra and inter-device precision using duplicate measurments from capillary fingersticks

Precision assessment for POC INR
0102030405060708090
% o
f pat
ient
s
0.0
- 0.2
0.3
- 0.4
0.5
- 0.6
0.7
- 0.8
0.9
- 1.0
>1.0
Difference
Intra-device Inter-device
> 90% repeat fingerstick INR measurements within 0.4 INR unit whether done with same or different device

Choosing POC INR Monitors • Look for minimal (≤ 0.2 INR unit) systematic bias
between POC capillary and lab plasma INR • Look for maximum clinical concordance,
generally measured as % values within 0.4-0.5 INR units
• Look for minimal outliers (≥ 1.0 INR unit), though outliers may be due to user or instrument errors
• Interference by heparin and LMWH, product labeling and data
• Range of hematocrits, labeling and data • Data management • Meaningful precision data difficult to gather

A question for you…

QUESTIONS and COMMENTS?