why is malaria associated with poverty? findings from a
TRANSCRIPT

RESEARCH ARTICLE Open Access
Why is malaria associated with poverty?Findings from a cohort study in ruralUgandaLucy S. Tusting1,2*, John Rek3, Emmanuel Arinaitwe3,4, Sarah G. Staedke3,4, Moses R. Kamya5, Jorge Cano1,Christian Bottomley6, Deborah Johnston7, Grant Dorsey8, Steve W. Lindsay9 and Jo Lines1
Abstract
Background: Malaria control and sustainable development are linked, but implementation of ‘multisectoral’intervention is restricted by a limited understanding of the causal pathways between poverty and malaria.We investigated the relationships between socioeconomic position (SEP), potential determinants of SEP, andmalaria in Nagongera, rural Uganda.
Methods: Socioeconomic information was collected for 318 children aged six months to 10 years living in100 households, who were followed for up to 36 months. Mosquito density was recorded using monthlylight trap collections. Parasite prevalence was measured routinely every three months and malaria incidencedetermined by passive case detection. First, we evaluated the association between success in smallholderagriculture (the primary livelihood source) and SEP. Second, we explored socioeconomic risk factors for human bitingrate (HBR), parasite prevalence and incidence of clinical malaria, and spatial clustering of socioeconomic variables.Third, we investigated the role of selected factors in mediating the association between SEP and malaria.
Results: Relative agricultural success was associated with higher SEP. In turn, high SEP was associated with lower HBR(highest versus lowest wealth index tertile: Incidence Rate Ratio 0.71, 95 % confidence intervals (CI) 0.54–0.93, P = 0.01)and lower odds of malaria infection in children (highest versus lowest wealth index tertile: adjusted Odds Ratio 0.52,95 % CI 0.35–0.78, P = 0.001), but SEP was not associated with clinical malaria incidence. Mediation analysis suggestedthat part of the total effect of SEP on malaria infection risk was explained by house type (24.9 %, 95 % CI 15.8–58.6 %)and food security (18.6 %, 95 % CI 11.6–48.3 %); however, the assumptions of the mediation analysis may not havebeen fully met.
Conclusion: Housing improvements and agricultural development interventions to reduce poverty merit furtherinvestigation as multisectoral interventions against malaria. Further interdisplinary research is needed to understandfully the complex pathways between poverty and malaria and to develop strategies for sustainable malaria control.
Keywords: Malaria, Socioeconomic, Poverty, Development, Housing, Wealth index, Uganda
* Correspondence: [email protected] of Disease Control, London School of Hygiene & TropicalMedicine, London, UK2Big Data Institute, Nuffield Department of Medicine, University of Oxford,Oxford, UKFull list of author information is available at the end of the article
© 2016 The Author(s). Open Access This article is distributed under the terms of the Creative Commons Attribution 4.0International License (http://creativecommons.org/licenses/by/4.0/), which permits unrestricted use, distribution, andreproduction in any medium, provided you give appropriate credit to the original author(s) and the source, provide a link tothe Creative Commons license, and indicate if changes were made. The Creative Commons Public Domain Dedication waiver(http://creativecommons.org/publicdomain/zero/1.0/) applies to the data made available in this article, unless otherwise stated.
Tusting et al. Infectious Diseases of Poverty (2016) 5:78 DOI 10.1186/s40249-016-0164-3
Multilingual abstractsPlease see Additional file 1 for translations of theabstract into the six official working languages of theUnited Nations.
BackgroundAs attention shifts to the Sustainable DevelopmentGoals, malaria control is at a pivotal juncture. The past15 years have seen a 37 % fall in annual global incidence[1], largely driven by the scale-up of long-lastinginsecticide-treated nets (LLINs), indoor residual sprayingand improved case management [2]. While these arehighly effective interventions, malaria is closely associ-ated with poverty and underdevelopment. Therefore, inthe long-term, there is arguably a need for more sustain-able control strategies that embrace non-health sectors,including agriculture, water and sanitation, and housing[3]. Historically, social and environmental changes con-tributed to malaria elimination in the USA and Europe[4]. Reflecting this, the 2013 Multisectoral Action Frame-work for Malaria outlined practical steps to target thesocial and environmental determinants of malaria [5].More recently the World Health Organization’s 2015Global Technical Strategy for Malaria and the comple-mentary Roll Back Malaria action plan both seek to linkmalaria control with sustainable development [6].Yet despite the potential value of a multisectoral ap-
proach to malaria, our understanding of how to targetsuch intervention remains poor [5]. Research on socio-economic risk factors for malaria has proliferated in thepast decade and studies in a range of African settingshave observed that the odds of malaria infection are onaverage doubled in children with the lowest socioeco-nomic position (SEP) (as measured by household wealthindex scores or parents’ educational status or occupa-tion), compared with children with the highest SEPwithin the same community [3]. However, to our know-ledge, no published studies have explicitly explored theunderlying causal pathways between household-levelpoverty and malaria. While there is evidence of reversecausality from malaria to poverty [7, 8], wealth in turncan help to protect against malaria. This protection maystem from better access to health care, LLIN coverage,treatment-seeking behaviour, housing quality and foodsecurity among other variables [9–11], yet the relativecontribution of these factors remains unknown. Further-more, few malaria studies have considered the determi-nants of rural poverty itself, limiting the evidence on thepotential overlap between development initiatives andmalaria control [5]. Here we aim to narrow these know-ledge gaps through a novel, interdisciplinary investiga-tion of the association between SEP, its determinants,and malaria among children in Nagongera, Uganda, arural area with high malaria transmission. To our
knowledge, the present study is the first explicitly to in-vestigate factors mediating the relationship between SEPand malaria.
MethodsStudy siteThe study was carried out between August 2011 andSeptember 2014 in Nagongera sub-country, Tororo,Uganda (00°46’10.6”N, 34°01’34.1”E). Malaria transmis-sion is intense with two annual peaks following the tworainy seasons (March to May and August to October).During 2011–2013 the estimated annual Plasmodiumfalciparum entomological inoculation rate was 125 [12]and malaria incidence in children was 2.8 episodes perperson year at risk [13]. 36 % of households have at leastone LLIN per two residents but IRS is not currentlydone [13]. Smallholder agriculture is the primary liveli-hood source. Average gross national income per capitain Uganda in 2014 was US$ 670 (current prices) [14].
Cohort studyThis study was part of a cohort study, described else-where, which was designed to compare temporalchanges in malaria incidence from the cohort with tem-poral changes in malaria test positivity rate from healthfacility based surveillance [12, 13]. All children aged sixmonths to 10 years and their primary caregivers (indi-viduals with primary responsibility for each child’s care)were enrolled in August-September 2011 from 100households randomly selected from an enumeration cen-sus of all households in the sub-county. Recruitmentwas dynamic such that eligible children reaching sixmonths were enrolled and children reaching 11 yearswere withdrawn. Households with no remaining studyparticipants were withdrawn and replaced. Participantswere followed for all healthcare needs at the study clinicfor seven days a week over 36 months, until September2014. All study participants were provided a LLIN at en-rollment and compliance was >99 % by self-report at thetime of routine clinic visits.New episodes of malaria were diagnosed by passive
case detection. Individuals presenting with a fever or his-tory of fever within the past 24 h with a positive bloodsmear were treated with artemether-lumefantrine (un-complicated malaria) or quinine (complicated malaria).In addition, participants were invited to make a routinevisit to the study clinic every three months. At each ofthese visits, a thick blood smear was taken to assess forparasitaemia. Thick and thin blood smears were stainedwith 2 % Giemsa and read blind. Blood smears wereconsidered negative when the examination of 100 highpower fields did not reveal asexual parasites. All bloodslides were read twice and discrepancies resolved by athird reviewer. In addition, all positive blood smears
Tusting et al. Infectious Diseases of Poverty (2016) 5:78 Page 2 of 11

with a parasite densities ≤20 000/μl based on the fieldreadings were re-read by an expert microscopist basedin Kampala and had to be confirmed to be consideredpositive in the final analyses.Indoor human biting rate (HBR), the number of
adult female Anopheles caught per house per night,was measured by one monthly catch per home usinga Centers for Disease Control and Prevention (CDC)light trap (Model 512; John W. Hock Company,Gainesville, FL). CDC light traps were positioned 1 mabove the floor at the foot of the bed, where a studyparticipant slept under a LLIN, and were set from7.00 pm until 7.00 am.
Conceptual frameworkCollection of socioeconomic data was guided by a pre-defined conceptual framework (Fig. 1), hypothesising
that: (1) relative agricultural success is associated withhigher SEP (Box 1), (2) higher SEP reduces malaria riskand (3) the effect of SEP on malaria risk is mediated bytreatment-seeking behaviour, house type and food securityamong other variables.
Household and women’s surveysSocioeconomic data were collected during three sur-veys: (i) a household survey conducted at baseline, (ii)a second household survey conducted after 24 monthsof follow-up in September-October 2013 and (iii) awomen’s survey, administered as a separate structuredquestionnaire alongside the second household survey.Both household surveys were administered to onedesignated adult respondent from each household, ifthey met four inclusion criteria: (1) usually resident,(2) present in the sampled household the night before
Fig. 1 Conceptual framework for the relationship between relative agricultural success, socioeconomic position (SEP) and malaria in Nagongera,Uganda. In sub-Saharan Africa, the odds of malaria infection are on average halved in children with the highest socioeconomic position (SEP)within a community, compared to children with the lowest SEP [3]. Household SEP may be approximated using a wealth index.‡ Wealthierchildren are hypothesised to have a lower risk of malaria due, among other factors, to: (1) greater disposable income, that makes prophylaxis,treatment and transport to clinics more affordable and therefore improves access to health care [9], (2) greater ownership and use of LLINs [9],(3) improved treatment-seeking behaviour among caregivers [9], (4) better housing, which lowers the risk of exposure to malaria vectors indoors[11, 16] and (5) greater food security, which reduces undernutrition and protein-energy malnutrition and possibly susceptibility to malaria infectionand progression to severe disease [10] (though the evidence is inconsistent [20]). Modern houses¶ were defined as those with cement, wood or metalwalls; a tiled or metal roof and closed eaves. All other houses were classified as traditional. Access to healthcare† and LLIN use† were not hypothesisedto be associated with SEP in this study population, since LLINs and all healthcare were provided by the study free of charge, but wealthier householdswere hypothesised to seek treatment more promptly than poorer households. Other household-level risk factors for malaria include distance to larvalhabitats, distance to village periphery, urbanicity and the density of livestock nearby, which were outside the scope of this study. In turn,malaria imposes costs that can cause poverty [7, 8], but this feedback loop was not analysed in this study. Heterogeneity in SEP is hypothesised to bedriven largely by relative success in smallholder agriculture, since agriculture is the primary livelihood source in Nagongera (Box 1). There are manyother determinants of SEP that are well studied outside the health sphere [18, 24], but we include here only non-agricultural income and access toremittances. Land area cultivated* is included as an indicator of relative agricultural success, but may also be a determinant of relative agriculturalsuccess among other factors which are outside the scope of this study. This conceptual framework is not an exhaustive representation of all malariarisk factors, confounders, mediators and causal associations, but includes only those analysed in this study. The conceptual frameworkadds greater complexity to those by de Castro [8] and Somi [7], which primarily demonstrate bi-directionality, while the present study ischiefly interested in dissecting the strands of the poverty-to-malaria direction
Tusting et al. Infectious Diseases of Poverty (2016) 5:78 Page 3 of 11

the survey, (3) aged at least 18 years and (4) agreed to pro-vide informed written consent. The women’s survey wasadministered to all adult women of childbearing age (18–49 years), resident in each study household, who met threeinclusion criteria: (1) usual female resident, (2) present inthe sampled household the night before the survey, (3)agreed to provide informed written consent. Householdswere excluded if no adult respondent could be located onmore than three occasions over two weeks.Variables for the wealth index were collected in the first
household survey (main mode of transport to the healthfacility) and in the second household survey (all otherwealth index variables). House construction was recordedthrough separate house visits by the entomology fieldteams during 2013 and validated by the second householdsurvey. Agricultural data were collected in the secondhousehold survey. The educational status of each child’smother or the eldest female caregiver in each child’shousehold was recorded in the women’s survey.
Data analysisData were collected using standardised record forms en-tered into Microsoft Access for follow-up of study
participants and using a paperless system for the house-hold and women’s surveys.
Wealth index and house typeWe used a wealth index previously developed for thestudy population [15]. In brief, principal component ana-lysis (PCA) was used to create the wealth index fromnine variables: ownership of (1) mobile telephones, (2)radios, (3) clocks, (4) cupboards, (5) sofas and (6) tables;(7) number of people per sleeping room; (8) access to animproved toilet and (9) main mode of transport to thehealth facility. Households were ranked by wealth scoresand grouped into tertiles to give a categorical measureof SEP. A definition of house type previously developedfor the study area was used [16]. Main wall material,main roof material and eave type were used to classifyhomes as either modern (wood, cement or brick walls; ametal or tiled roof and closed eaves) or traditional (allother homes).There were four components within the analysis that
evaluated: (1) the association between agricultural suc-cess and SEP, (2) risk factors for human biting rate(HBR), parasite prevalence and incidence of clinical mal-aria, including SEP, (3) spatial clustering of socioeco-nomic variables and (4) mediators of the associationbetween SEP and parasite prevalence.
(1)Association between agricultural success and SEP:Agricultural success was estimated throughhousehold survey questions on indicators withinfive domains, after Oya [17] and Scoones [18](Fig. 1): (1) land area cultivated, (2) farm labour,(3) capitalisation (access to advanced meansof production, such as pesticides or heavymachinery), (4) productivity and (5) marketengagement (proportion of produce sold versusused for own consumption). Cross tabulationsand Pearson’s chi-square test were used to explorethe associations between indicators of agriculturalsuccess, wealth index tertiles and food security.
(2)Risk factors for malaria: For each risk factor,including SEP, we modelled its association withHBR, parasite prevalence and incidence of clinicalmalaria. Negative binomial regression was used tomodel the number of Anopheles caught perhousehold per night and the number of malariacases per child with the number of catch nightsand person years included as offset terms. Theodds of malaria infection at the time of eachroutine clinic visit were modelled using logisticregression. For the clinical outcomes (parasiteprevalence and malaria incidence), age andgender were included in the model as covariatesand robust standard errors were used to adjust
Box 1. Understanding poverty reduction in rural Uganda
In low income countries, poverty reduction generally involves
decreased livelihood vulnerability, changes in livelihood activities
and increased incomes through a shift towards more productive
activities [24]. In rural areas, such activities are typically grounded in
agriculture, later diversifying to include non-agricultural activities
[17]. Indeed, agriculture is the primary source of livelihood for much
of the rural poor in developing countries. In Uganda, the net output
of agriculture comprised 24 % of gross domestic product and the
agricultural sector provided two-thirds of total employment in 2010
[31]. In much of rural Africa, heterogeneity in socioeconomic
position (SEP) can therefore be understood by examining relative
success in smallholder agriculture [17]. Often mistaken as
homogeneous, rural African populations encompass many classes
with different ambitions and constraints. Relative agricultural success
reflects the degree to which smallholder farmers successfully derive
a living from the land, sometimes using agricultural income to
upscale other enterprises. Agricultural success can be approximated
using indicators such as farm size, production performance (yield)
and labour hire, or by examining the processes of accumulation and
production that allow people to ‘hang in’ (maintain livelihood levels
through farming), ‘step up’ (invest in assets to expand current
activities, increase production and improve livelihoods), or to
accumulate resources to ‘step out’ (move into different activities
with higher returns) [18, 24].
Tusting et al. Infectious Diseases of Poverty (2016) 5:78 Page 4 of 11

for repeat measures (clustering) at the householdlevel.
(3)Spatial analysis of socioeconomic variables:Spatial autocorrelation (clustering) of threesocioeconomic variables (cultivated land area,wealth index scores and house type) was exploredat global scale using univariate Moran’s I and atlocal scale using univariate Anselin Moran’s I(Additional file 2).
(4)Mediation of the association between SEP andmalaria: We aimed to calculate the effect of SEPon malaria infection risk that is mediated throughtreatment-seeking behaviour, house type and foodsecurity using the algorithm described by Imai [19](Additional file 3; Fig. 1). This algorithm makes twoignorability assumptions which in practice willhold if there is no unmeasured confounding ofthe association between exposure and mediator,exposure and outcome or mediator and outcome,and there is no reverse causation.
ResultsStudy populationA total of 333 children in 107 total households were en-rolled between August 2011 and September 2014 (Fig. 2).The mean age of study children during follow-up was5.7 years and 153 (46 %) were female.
Wealth indexThe first principal component explained 29.3 % of over-all variability in the asset variables. The weight assignedto each variable was: cupboard (0.45), clock (0.43), sofa(0.41), table (0.37), mobile (0.30), toilet access (0.29),radio (0.29), people per sleeping room (0.19), mode oftransport to health facility (0.10). Wealthier householdsgenerally sought treatment for fever faster and had bet-ter education, housing and food security than poorerhouseholds (Table 1).
Association between agricultural success and SEPAll households grew crops and agriculture was the pri-mary source of income for 74 % of households. Wealth-ier households cultivated more land and had greateragricultural income, compared to the lowest tertiles.Wealthier households and those with larger farms alsoemployed more farm labour, were more likely to usean oxplough, owned more tropical livestock units andsold a greater proportion of their crops than poorerhouseholds and those with smaller farms (Table 2).Households with larger farms reported fewer prob-lems getting food to eat (P = 0.001) and ate meatmore frequently (P = 0.002).
Risk factors for malariaHuman biting rate (HBR)A total of 124,746 adult female Anopheles were caughtover 3489 collection nights, yielding an overall HBR of35.8 Anopheles per house per night. HBR was 29 %lower in the wealthiest households (highest versus lowestwealth index tertile: Incidence Rate Ratio (IRR) 0.71,95 % confidence intervals (CI) 0.54–0.93, P = 0.01) and47 % lower in households with good house construction,controlling for household SEP (modern versus trad-itional housing: adjusted IRR 0.53, 95 % CI 0.40–0.69, P< 0.001) (Table 3).
Malaria infectionA total of 3367 routine blood smears were taken ofwhich 1037 (30.8 %) were positive. All participants con-tributed at least one smear. Controlling for age and gen-der, the odds of infection were 49 % lower in childrenliving in modern housing (modern versus traditionalhousing: adjusted Odds Ratio (OR) 0.51, 95 % CI 0.36–0.71, P < 0.001), 48 % lower in wealthier children (high-est versus lowest wealth index tertile: adjusted OR 0.52,95 % CI 0.35–0.78, P = 0.001) and 36 % lower in childrenwith good food security (meat eaten 3–7 versus 0–2 daysper week: adjusted OR 0.64, 95 % CI 0.47–0.88, P =0.007) (Table 4).
248 during baseline screening85 during dynamic recruitment
85 children withdrawn after enrollment:43 reached 11 years of age18 moved out of study area 10 unable to locate for >120 days 10 inability to comply with study3 withdrew consent 1 death
4 resident in 2 households with no women surveyed
Household-level data collected for 333 of 333 study children.
Household-level data collected for 318 of 333 study children.
withdrawn before the survey
Women-level data collected for 301 of 333 study children.
Data missing for 15 (4.5%) children, resident in 7 households
3. Women's Survey (Sep-Oct 2013):
Data missing for 32 (9.6%) children:15 resident in 7 households withdrawn before the survey9 had no female caregiver aged 18-49yrs4 had a male primary caregiver only
2. Household Survey (Sep-Oct 2013):
107 total households enrolled:
333 total children enrolled:
248 children followed through 30 Sep 2014
1. Household Survey (at enrollment):
100 during baseline screening (19 Aug 2011 to 30 Sep 2011)7 during dynamic recruitment (1 Oct 2011 to 30 Sep 2014)
Fig. 2 Study profile for a cohort of children aged 6 months to tenyears (N = 333) in Nagongera, Uganda
Tusting et al. Infectious Diseases of Poverty (2016) 5:78 Page 5 of 11
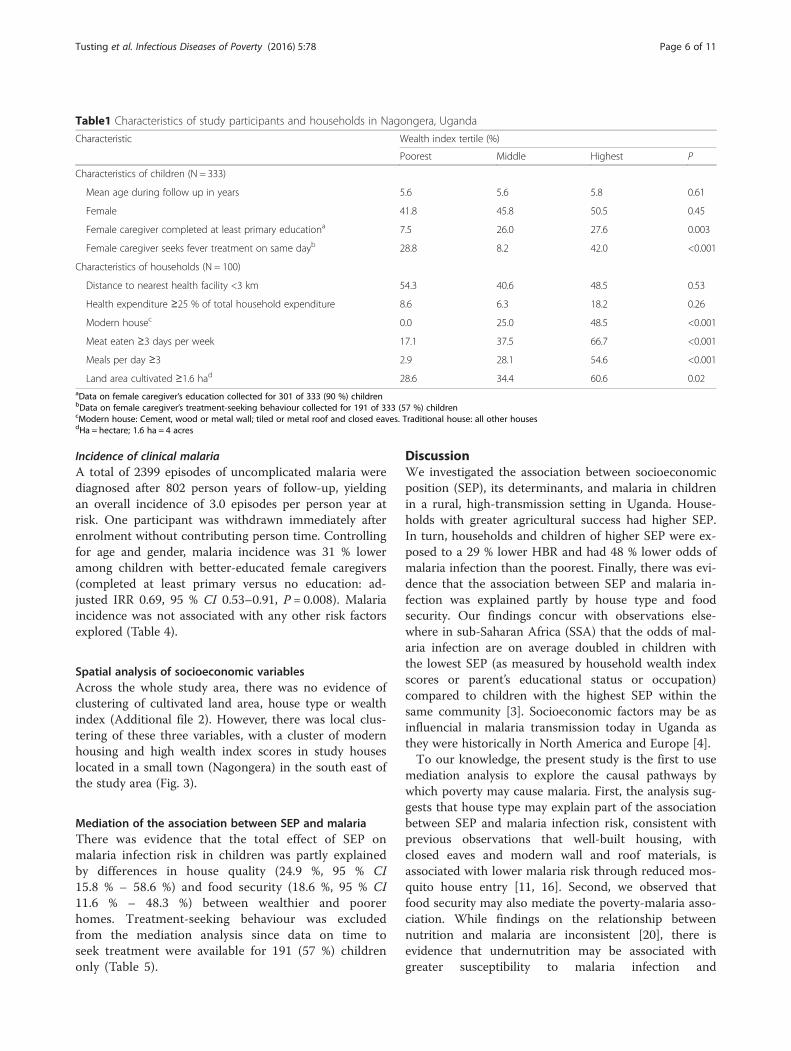
Incidence of clinical malariaA total of 2399 episodes of uncomplicated malaria werediagnosed after 802 person years of follow-up, yieldingan overall incidence of 3.0 episodes per person year atrisk. One participant was withdrawn immediately afterenrolment without contributing person time. Controllingfor age and gender, malaria incidence was 31 % loweramong children with better-educated female caregivers(completed at least primary versus no education: ad-justed IRR 0.69, 95 % CI 0.53–0.91, P = 0.008). Malariaincidence was not associated with any other risk factorsexplored (Table 4).
Spatial analysis of socioeconomic variablesAcross the whole study area, there was no evidence ofclustering of cultivated land area, house type or wealthindex (Additional file 2). However, there was local clus-tering of these three variables, with a cluster of modernhousing and high wealth index scores in study houseslocated in a small town (Nagongera) in the south east ofthe study area (Fig. 3).
Mediation of the association between SEP and malariaThere was evidence that the total effect of SEP onmalaria infection risk in children was partly explainedby differences in house quality (24.9 %, 95 % CI15.8 % – 58.6 %) and food security (18.6 %, 95 % CI11.6 % – 48.3 %) between wealthier and poorerhomes. Treatment-seeking behaviour was excludedfrom the mediation analysis since data on time toseek treatment were available for 191 (57 %) childrenonly (Table 5).
DiscussionWe investigated the association between socioeconomicposition (SEP), its determinants, and malaria in childrenin a rural, high-transmission setting in Uganda. House-holds with greater agricultural success had higher SEP.In turn, households and children of higher SEP were ex-posed to a 29 % lower HBR and had 48 % lower odds ofmalaria infection than the poorest. Finally, there was evi-dence that the association between SEP and malaria in-fection was explained partly by house type and foodsecurity. Our findings concur with observations else-where in sub-Saharan Africa (SSA) that the odds of mal-aria infection are on average doubled in children withthe lowest SEP (as measured by household wealth indexscores or parent’s educational status or occupation)compared to children with the highest SEP within thesame community [3]. Socioeconomic factors may be asinfluencial in malaria transmission today in Uganda asthey were historically in North America and Europe [4].To our knowledge, the present study is the first to use
mediation analysis to explore the causal pathways bywhich poverty may cause malaria. First, the analysis sug-gests that house type may explain part of the associationbetween SEP and malaria infection risk, consistent withprevious observations that well-built housing, withclosed eaves and modern wall and roof materials, isassociated with lower malaria risk through reduced mos-quito house entry [11, 16]. Second, we observed thatfood security may also mediate the poverty-malaria asso-ciation. While findings on the relationship betweennutrition and malaria are inconsistent [20], there isevidence that undernutrition may be associated withgreater susceptibility to malaria infection and
Table1 Characteristics of study participants and households in Nagongera, Uganda
Characteristic Wealth index tertile (%)
Poorest Middle Highest P
Characteristics of children (N = 333)
Mean age during follow up in years 5.6 5.6 5.8 0.61
Female 41.8 45.8 50.5 0.45
Female caregiver completed at least primary educationa 7.5 26.0 27.6 0.003
Female caregiver seeks fever treatment on same dayb 28.8 8.2 42.0 <0.001
Characteristics of households (N = 100)
Distance to nearest health facility <3 km 54.3 40.6 48.5 0.53
Health expenditure ≥25 % of total household expenditure 8.6 6.3 18.2 0.26
Modern housec 0.0 25.0 48.5 <0.001
Meat eaten ≥3 days per week 17.1 37.5 66.7 <0.001
Meals per day ≥3 2.9 28.1 54.6 <0.001
Land area cultivated ≥1.6 had 28.6 34.4 60.6 0.02aData on female caregiver’s education collected for 301 of 333 (90 %) childrenbData on female caregiver’s treatment-seeking behaviour collected for 191 of 333 (57 %) childrencModern house: Cement, wood or metal wall; tiled or metal roof and closed eaves. Traditional house: all other housesdHa = hectare; 1.6 ha = 4 acres
Tusting et al. Infectious Diseases of Poverty (2016) 5:78 Page 6 of 11

progression to severe disease [10] and that protein-energy malnutrition is associated with greater malariamorbidity and mortality [21]. Indeed, a previous study inour study district found that stunting (an indicator ofchronic malnutrition) was associated with a higher inci-dence of clinical malaria in children [22]. Conversely, it
is possible that our measure of food security was moreof a proxy for SEP than nutritional status [23].Identifying factors potentially mediating between SEP
and malaria provides evidence of a biologically plausiblemechanism for causality, yet the mediation analysis wassubject to a number of limitations. First, house quality
Table 2 Association between agricultural success, land area cultivated and household socioeconomic position in 100 households inNagongera, Uganda
Indicator Land area cultivated (%) Wealth index tertile (%)
<1.6 haa (N = 59) ≥1.6 ha (N = 41) P Poorest (N = 35) Middle (N = 32) Highest (N = 33) P
Land area cultivated
Land area cultivated (≥1.6 ha vs <1.6 ha)a - - - 28.6 34.4 60.6 0.02
Land ownership (all owned vs part rented) 35.6 51.2 0.12 45.7 34.4 45.5 0.57
Farm labour
Hired farm labour 50.9 61.0 0.32 42.9 43.8 78.8 0.004
Total number of farm workers(≥6 people vs 0–5 people)
25.4 51.2 0.008 17.1 31.3 60.6 0.001
Capitalisation and inputs
Ox-plough used, past 12 months 33.9 73.2 <0.001 34.3 40.6 75.8 0.001
Pesticides and herbicides used, past12 months
69.5 78.1 0.34 65.7 75.0 78.8 0.46
Access to credit for agriculture 15.3 29.3 0.09 17.1 18.8 27.3 0.55
Productivity
TLUb per household member(≥0.05 vs <0.05 TLU per person)
33.9 61.0 0.007 37.1 34.4 63.6 0.03
Market engagement
Total income from crop sales, past 12monthsc
27.1 51.2 0.002 20.0 31.3 60.6 0.01
Total income from crop and livestocksales, past 12 monthsd
18.6 40.0 0.001 11.4 18.8 53.1 0.001
Proportion of crops sold (≥25 % vs <25 %) 22.0 48.8 0.005 17.1 31.3 51.5 0.01
Non-agricultural income
Main source of household incomee - - - 11.4 15.6 21.2 0.27
Remittances received, past 12 months - - - 5.7 12.5 27.3 0.04aHa = hectare; 1.6 ha = 4 acresbTropical Livestock Units (TLUs) are a standardised method for quantifying livestock. One TLU corresponds approximately to 250 kg animal weight and totalTLUs are calculated by assigning region-specific weights to different livestock types. The following weights were assigned, after Chilonda and Otte: 0.5 per cattle,0.1 per goat, 0.01 per poultry or rabbit [32]cTotal income from all crop sales in the past 12 months: ≥US$ 80 versus < US$ 80 (2013 prices)dTotal income from crop and livestock sales in the past 12 months: ≥US$ 120 versus < US$ 120 (2013 prices)eMain source of household income: skilled labour versus remittances, agriculture or manual labour
Table 3 Socioeconomic risk factors for human biting rate in 100 households in Nagongera, Uganda
Characteristic HBR (Total collection nights)a IRR (95 % CI)b P
Wealth index tertile Poorest 41.5 (1136) 1 0.01
Middle 34.4 (1132) 0.86 (0.65–1.13)
Highest 28.8 (1110) 0.71 (0.54–0.93)
House typec Traditional 40.5 (2690) 1 <0.001
Modernd 19.9 (799) 0.53 (0.40–0.69)aHBR: Human biting rate: total adult female Anopheles caught/total collection nightsbIRR: Incidence rate ratio; CI: Confidence intervalcIRR for this variable was adjusted for household wealthdModern house: Cement, wood or metal wall; tiled or metal roof and closed eaves. Traditional house: all other houses
Tusting et al. Infectious Diseases of Poverty (2016) 5:78 Page 7 of 11

and food security together accounted for less than halfof the association between poverty and malaria infectionrisk, suggesting that other mediators remain un-accounted for. While treatment-seeking behaviour wasexcluded from the mediation analysis, wealthier house-holds sought treatment for fever more promptly thanpoorer households, so this variable merits future evalu-ation as a potential mediator. Additional potential medi-ators may include distance of households to the villageperiphery, housing density and, given the local clusteringof wealthier households, malaria risk in neighbouringhouseholds. Education level, while considered an indica-tor of SEP [15], arguably could also lie on the mediationpathway. Therefore our conceptual framework and ana-lysis were not exhaustive and provide only a preliminary
exploration of the complex relationships linking povertyand malaria. Second, the assumptions underlying themediation analysis may not have been fully met. For ex-ample, the costs of malaria can worsen poverty, resultingin reverse causality [7, 8], and the relationship betweenSEP and malaria may be confounded by environmentalfactors such as distance to larval habitats (alternatively,location might be on the causal pathway between SEPand malaria). While we aimed to omit from the wealthindex variables directly associated with malaria [15],some of the included assets may have been associatedwith both SEP and house type (e.g. sofa ownership ortoilet access). Third, we did not observe any associationbetween SEP and incidence of clinical malaria and theinterpretation of this finding is unclear.
Table 4 Socioeconomic risk factors for malaria in children aged six months to 10 years in Nagongera, Uganda
Characteristic Malaria infection Incidence of clinical malaria
PR (Total bloodsmears)a
OR (95 % CI)b P Malaria incidence(total person years)c
IRR (95 % CI)d P
Mean age during follow-up 6 m to <3 years 19.2 (657) 1 <0.001 4.1 (134) 1 <0.001
3 to <5 years 27.6 (699) 1.60 (1.18–2.18) 4.2 (177) 1.01 (0.85–1.19)
5 to <11 year 35.7 (2011) 2.34 (1.77–3.09) 2.3 (491) 0.54 (0.46–0.65)
Gender Female 29.9 (1518) 1 0.54 2.7 (361) 1 0.12
Male 31.5 (1849) 1.07 (0.86–1.35) 3.2 (441) 1.13 (0.97–1.32)
Wealth index tertile Lowest 38.4 (1087) 1 0.001 3.0 (258) 1 0.66
Middle 29.6 (1170) 0.65 (0.48–0.87) 3.1 (280) 1.12 (0.90–1.40)
Highest 25.3 (1010) 0.52 (0.35–0.78) 2.9 (241) 1.05 (0.83–1.34)
Female caregiver’s level of education None 33.4 (788) 1 0.21 3.5 (188) 1 0.005
Incomplete 1ry 31.7 (1703) 0.96 (0.68–1.36) 3.0 (406) 0.83 (0.69–1.01)
1ry or higher 26.6 (593) 0.74 (0.48–1.15) 2.4 (140) 0.69 (0.53–0.91)
Distance to health facility 3–6 km 33.4 (1994) 1 0.07 2.9 (474) 1 0.56
0–2 km 27.1 (1373) 0.75 (0.55–1.02) 3.1 (328) 1.06 (0.87–1.29)
Time for female caregiver to seektreatment for fever
≥1 day 29.5 (1434) 1 0.55 3.3 (342) 1 0.31
Same day 27.5 (509) 0.86 (0.51–1.42) 2.5 (120) 0.87 (0.67–1.13)
Proportion of household expenditureon health
<25 % 31.0 (3059) 1 0.65 3.1 (730) 1 0.15
25–50 % 34.1 (208) 1.15 (0.63–2.10) 2.0 (49) 0.73 (0.48–1.12)
House typee Traditional 32.9 (2794) 1 <0.001 3.0 (665) 1 0.67
Modern 20.4 (573) 0.51 (0.36–0.71) 2.7 (136) 0.93 (0.68–1.28)
People per sleeping room >2 people 31.9 (2752) 1 0.24 3.1 (656) 1 0.29
0–2 people 27.0 (515) 0.78 (0.51–1.19) 2.6 (123) 0.86 (0.64, 1.14)
Days eating meat per week 0–2 days 34.6 (2123) 1 0.007 3.0 (507) 1 0.71
3–7 days 24.7 (1144) 0.64 (0.47–0.88) 2.9 (271) 0.96 (0.77–1.20)
Meals per day 2 meals 33.1 (2439) 1 0.05 3.0 (581) 1 0.78
3–4 meals 25.6 (828) 0.72 (0.52–1.00) 2.9 (197) 0.96 (0.75–1.24)aPR: Plasmodium falciparum parasite rate: total positive blood smears/total blood smearsbOR: Odds Ratio adjusted for age at the time of the blood smear and gender. CI Confidence intervalcMalaria incidence per person year: total malaria episodes/total person years at riskdIRR: Incidence Rate Ratio adjusted for mean age during follow-up and gendereModern house: Cement, wood or metal wall; tiled or metal roof and closed eaves. Traditional house: all other houses
Tusting et al. Infectious Diseases of Poverty (2016) 5:78 Page 8 of 11

To identify potential cross-over between developmentinterventions and malaria control, we sought to under-stand better the heterogeneity in SEP in the study area.Overall we found that SEP was associated with increasedodds of malaria infection. In turn, SEP was associatedwith relative agricultural success, consistent with agricul-ture being a major livelihood source in Nagongera as inmuch of rural Africa [18, 24]. We also observed thatwealthier households had larger farms and were overallmore successful in agriculture than poorer households.Of course, wealthier households may invest more inagriculture and other enterprises, improving their overallproductivity. Yet it is also feasible that agricultural prod-uctivity limits household wealth and that land accessconstrains productivity in Nagongera, since there is ex-tensive land fragmentation stemming from the divisionof land over generations, which is likely to continue asthe Ugandan population expands from 39 million in
2015 to an estimated 102 million in 2050 [25]. Elsewherein SSA, rural poverty has been linked to lower vegeta-tion index scores, remoteness and poor soil fertility [26].While the conclusions that may be drawn from our ob-servational study are limited, our findings highlight theimportance of understanding malaria transmissionwithin the wider social and ecological landscape.By examining the relationship between poverty and
malaria, practical steps towards multisectoral interven-tion may be identified. First, there may be overlap be-tween poverty reduction and malaria control [3]. If thisis the case, interventions such as Farmer Field Schools(a group-based education approach) might be targetedin areas where agriculture is an important livelihoodsource to increase production and marketing capacitywhile incorporating training in Integrated Pest andVector Management [27]. If land access constrains prod-uctivity, diversification into non-agricultural activities
Fig. 3 Local cluster maps of wealth index score, house type and cultivated land area in 100 households in Nagongera, Uganda. Maps showresults from univariate Local Indicator of Spatial Association (LISA) analysis. A cluster of high wealth index scores overlapping with a cluster ofmodern housing is located in the south-east of the study area. Houses were classified as modern (cement, wood or metal walls; a tiled or metalroof and closed eaves) or traditional (all other houses). Wealth index score and land area cultivated were modelled as continuous variables
Table 5 Mediation analysis of the association between socioeconomic position and malaria infection in children aged six months to10 years in Nagongera, Uganda
Mediatingvariablea
Risk difference (95 % CI)b, high versus low SEPc Proportion of total effectof SEP that occurs throughmediator, % (95 % CI)
Direct effect of SEP Effect of SEP through mediator Total effect of SEP
House typed −8.6 (-15.6, -2.1) −2.9 (-5.5, -0.8) −11.5 (-18.1, -4.9) 24.9 (15.8, 58.6)
Food securitye −9.2 (-16.9, -2.2) −2.1 (-5.3, 0.0) −11.4 (-18.4, -4.4) 18.6 (11.6, 48.3)aTreatment-seeking behaviour was excluded from the mediation analysis since data on time to seek treatment were available for 191 of 333 (57 %) children onlybRisk difference adjusted for gender, age (<5 years vs 5–11 year) and clustering at the household levelcSEP: household socioeconomic position, modelled as a binary variable (middle and highest wealth index tertiles versus lowest wealth index tertile)dHouse type: modern (cement, wood or metal walls; and tiled or metal roof; and closed eaves) versus traditional (all other houses)eFood security: Meat consumed 3–7 days versus 0–2 days per week
Tusting et al. Infectious Diseases of Poverty (2016) 5:78 Page 9 of 11

may be necessary, alongside interventions to improveproductivity and market access among remainingfarmers. Second, since house quality is associated withmalaria risk, malaria control progammes could workwith other sectors to scale-up ‘healthy’ housing [28].Possible strategies may include microfinance initiatives,education and the use of model houses to encouragegood house design, or collaboration with other minis-tries and the private sector [29]. Third, should goodnutrition be protective against malaria, nutrition-sensistive interventions – including those related to agri-culture and food security – may be complementary tomalaria control.Our study has a number of limitations. First, the medi-
ation analysis was based on untestable assumptions(Additional file 3). Should these assumptions not hold,this would limit confidence in house quality and foodsecurity being mediators of the SEP-malaria relationshipand in their associated mediating effects. Throughoutour analysis, we assume that SEP affects malaria risk, yetreverse causality from malaria risk to SEP and agricul-tural productivity is highly probable [7, 8, 30]. Second,the conceptual framework was not an exhaustive repre-sentation and we were unable to investigate all causalpathways linking SEP and malaria, nor all potential de-terminants of poverty. Third, the wealth index is an im-perfect metric and its representation of underlying SEPis influenced by the variables included in the index [15].Fourth, our spatial analysis modelled few variables rele-vant to malaria. Finally, we studied only one populationat one time point, so the findings require future valid-ation in this and other settings. Despite the methodo-logical challenges, it is hoped that our analysis offers apreliminary insight into the complex relationshipbetween poverty and malaria, providing a framework forfuture interdisciplinary research.
ConclusionsHousing improvements and agricultural development in-terventions to reduce poverty merit further investigationas multisectoral interventions against malaria. Furtherinterdisplinary research is needed to understand fullythe complex pathways between poverty and malaria andto develop strategies for sustainable malaria control.
Additional files
Additional file 1: Multilingual abstracts in the six official workinglanguages of the United nations. (PDF 823 kb)
Additional file 2: Implementation of the spatial autocorrelation analysis.(PDF 857 kb)
Additional file 3: Implementation of the mediation analysis.(PDF 280 kb)
Additional file 4: Data files. (ZIP 15 kb)
AbbreviationsCI, confidence interval; HBR, human biting rate; IRR, incidence rate ratio;LISA, Local Indicator of Spatial Association; LLIN, long-lastinginsecticide-treated bednet; OR, odds ratio; PCA, principal componentanalysis; SEP, socioeconomic position; SSA, Sub-Saharan Africa; USA,United States of America
AcknowledgementsWe are grateful to the study participants and their families. We thank theInfectious Diseases Research Collaboration (IDRC) for administrative andtechnical support and the Malaria Centre at the London School of Hygiene& Tropical Medicine.
FundingThis work was supported by the Leverhulme Centre for Integrative Researchin Agriculture and Health; US National Institures of Health (U19AI089674);Research and Policy for Infectious Disease Dynamics (RAPIDD) program ofthe Science and Technology Directorate, US Department of HomelandSecurity, the Fogarty International Center (US National Institutes of Health);and the Bill & Melinda Gates Foundation (OPP1053338). The funding bodieshad no role in the design of the study and collection, analysis, andinterpretation of data and in writing the manuscript.
Availability of data and materialsThe authors confirm that all data underlying the findings are fully availablewithout restriction. All relevant data are available in Additional file 4.
Authors’ contributionsLST, EA, SGS, MK, GD and SWL conceived and designed the study. LST, EA,JR, SGS, MK and GD collected the data. LST and CB analysed the data andJC conducted the spatial analysis. LST and JC prepared the first draft of themanuscript. All authors had access to study data and reviewed the finalmanuscript.
Competing interestsThe authors declare that they have no competing interests.
Ethics approval and consent to participateEthical approval for the study was given by the Uganda National Council forScience and Technology; Makerere University School of Medicine Researchand Ethics Committee; University of California, San Francisco Committee forHuman Research and London School of Hygiene and Tropical MedicineEthics Committee.
Author details1Department of Disease Control, London School of Hygiene & TropicalMedicine, London, UK. 2Big Data Institute, Nuffield Department of Medicine,University of Oxford, Oxford, UK. 3Infectious Diseases Research Collaboration,Kampala, Uganda. 4Department of Clinical Research, London School ofHygiene and Tropical Medicine, London, UK. 5School of Medicine, MakerereUniversity College of Health Sciences, Kampala, Uganda. 6MRC TropicalEpidemiology Group, London School of Hygiene and Tropical Medicine,London, UK. 7Department of Economics, SOAS, University of London,London, UK. 8Department of Medicine, University of California, San Francisco,USA. 9School of Biological and Biomedical Sciences, Durham University,Durham, UK.
Received: 18 February 2016 Accepted: 24 June 2016
References1. WHO. World Malaria Report. Geneva: World Health Organization; 2015.2. Bhatt S, Weiss DJ, Cameron E, Bisanzio D, Mappin B, Dalrymple U, Battle KE,
Moyes CL, Henry A, Eckhoff PA, Wenger EA, Briët O, Penny MA, Smith TA,Bennett A, Yukich J, Eisele TP, Griffin JT, Fergus CA, Lynch M, Lindgren F,Cohen JM, Murray CL, Smith DL, Hay SI, Cibulskis RE, Gething PW. The effectof malaria control on Plasmodium falciparum in Africa between 2000 and2015. Nature. 2015;526:207–11.
3. Tusting LS, Willey B, Lucas H, Thompson J, Kafy HT, Smith R, Lindsay SW.Socioeconomic development as an intervention against malaria: asystematic review and meta-analysis. Lancet. 2013;382(9895):834.
Tusting et al. Infectious Diseases of Poverty (2016) 5:78 Page 10 of 11

4. Bruce-Chwatt L, de Zulueta J. The rise and fall of malaria in Europe. London:Oxford University Press; 1980.
5. RBM/UNDP. Multisectoral Action Framework for Malaria. Geneva: Roll BackMalaria/United Nations Development Programme; 2013.
6. RBM. Action and Investment to defeat Malaria 2016–2030 (AIM). Geneva:Roll Back Malaria Partnership; 2015.
7. Somi MF, Butler JRG. Is there evidence for dual causation between malariaand socioeconomic status? Findings from rural Tanzania. Am J Trop MedHyg. 2007;77:1020–7.
8. de Castro MC, Fisher MG. Is malaria illness among young children a causeor a consequence of low socioeconomic status? Evidence from the UnitedRepublic of Tanzania. Malar J. 2012;11:161.
9. Barat LM, Palmer N, Basu S, Worrall E, Hanson K, Mills A. Do malaria controlinterventions reach the poor? Am J Trop Med Hyg. 2004;71:174–8.
10. Caulfield LE, Richard S, Black RE. Undernutrition as an underlying cause ofmalaria morbidity and mortality in children less than five years old. Am JTrop Med Hyg. 2004;71:55–63.
11. Tusting LS, Ippolito M, Willey B, Kleinschmidt I, Dorsey G, Gosling RD,Lindsay SW. The evidence for improving housing to reduce malaria:a systematic review and meta-analysis. Malaria J. 2015;14:209.
12. Maxwell K, Smith DL, Hutchinson R, Kigozi R, Yeka A, Lavoy G, Kamya MR,Staedke SG, Donnelly MJ, Drakeley C, Greenhouse B, Dorsey G, Lindsay SW.Estimating the annual entomological inoculation rate for Plasmodiumfalciparum transmitted by Anopheles gambiae s.l. using three samplingmethods in three sites in Uganda. Malaria J. 2014;13:111.
13. Kamya MR, Arinaitwe E, Wanzira H, Katureebe A, Barusya C, Kigozi SP, KilamaM, Tatem AJ, Rosenthal PJ, Drakeley C, Lindsay SW, Staedke SG, Smith DL,Greenhouse B, Dorsey G. Malaria transmission, infection and disease at threesites with varied transmission intensity in Uganda: implications for malariacontrol. Am J Trop Med Hyg. 2015;92:903–12.
14. World Bank. Development Indicators. Washington DC: World Bank; 2016.Available: http://data.worldbank.org/indicator. Accessed 10 Feb 2016.
15. Tusting LS, Rek JC, Arinaitwe E, Staedke SG, Kamya M, Bottomley C,Johnston D, Lines J, Dorsey G, Lindsay SW. Measuring socioeconomicinequalities in relation to malaria risk: a comparison of metrics in ruralUganda. Am J Trop Med Hyg. 2016;94:650–8.
16. Wanzirah H, Tusting LS, Arinaitwe E, Katureebe A, Maxwell K, Rek J,Bottomley C, Staedke SG, Kamya M, Dorsey G, Lindsay SW. Mind thegap: house construction and the risk of malaria in Ugandan children.PLoS ONE. 2015;10(1):e0117396.
17. Oya C. The empirical investigation of rural class formation: methodologicalissues in a study of large- and middle-scale farmers in Senegal. Hist Mater.2004;12:289–326.
18. Scoones I, Marongwe N, Mavedzenge B, Murimbarimba F, Mahenehene J,Sukume C. Livelihoods after land reform in Zimbabwe: understandingprocesses of rural differentiation. J Agrarian Studies. 2012;12:503–27.
19. Imai K, Tingley D, Keele L. A general approach to causal mediation analysis.Psychol Methods. 2010;15:309–34.
20. Sazawal S, Black RE, Ramsan M, Chwaya HM, Stoltzfus RJ, Dutta A, DhingraU, Kabole I, Deb S, Othman MK, Kabole FM. Effects of routine prophylacticsupplementation with iron and folic acid on admission to hospital andmortality in preschool children in a high malaria transmission setting:community-based, randomised, placebo-controlled trial. Lancet. 2006;367:133–43.
21. Shankar AH. Nutritional modulation of malaria morbidity and mortality.J Infect Dis. 2000;182(1):S37–53.
22. Arinaitwe E, Gasasira A, Verret W, Homsy J, Wanzira H, Kakuru A, SandisonTG, Young S, Tappero JW, Kamya MR, Dorsey G. The association betweenmalnutrition and the incidence of malaria among young HIV-infected and-uninfected Ugandan children: a prospective study. Malar J. 2012;11:90.
23. Howe L, Galobardes B, Matijasevich A, Gordon D, Johnston D, OnwujekweO, Patel R, Webb EA, Lawlor DA, Hargreaves JR. Measuring socio-economicposition for epidemiological studies in low- and middle-income countries: amethods of measurement in epidemiology paper. Int J Epidemiol. 2012;41:871–86.
24. Dorward A. Integrating contested aspirations, processes and policy:development as hanging in, stepping up and stepping out. Dev PolicyRev. 2009;27:131–46.
25. World Bank. World Data Bank: Health Nutrition and Population Statistics:Population estimates and projections. 2016. Available: http://databank.worldbank.org/data/home.aspx. Accessed 4 April 2016.
26. Sedda L, Tatem AJ, Morley DW, Atkinson PM, Wardrop NA, Pezzulo C,Sorichetta A, Kuleszo J, Rogers DJ. Poverty, health and satellite-derivedvegetation indices: their inter-spatial relationship in West Africa. Int Health.2015;7(2):99–106.
27. Wielgosz B, Mangheni M, Tsegai D, Ringler C. Malaria in Uganda: improvedoutcomes when the health sector joins forces with agriculture. WashingtonDC: International Food Policy Research Institute (IFPRI); 2013.
28. RBM. Consensus statement on housing and malaria. Geneva: Roll BackMalaria Housing and Malaria Work Stream; 2015.
29. Anderson L, Simpson D, Stephens M. Durable housing improvements tofight malaria transmission: Can we learn new strategies from pastexperience? Atlanta: Habitat for Humanity International Global ProgramsDepartment; 2014.
30. Fink G, Masiye F. Health and agricultural productivity: Evidence fromZambia. J Health Econ. 2015;42:151–64.
31. World Bank. Africa Development Indicators 2012/13. Washington DC: WorldBank; 2013.
32. Chilonda P, Otte J. Indicators to monitor trends in livestock production atnational, regional and international levels. Livest Res Rural Dev. 2006;18:117.
• We accept pre-submission inquiries
• Our selector tool helps you to find the most relevant journal
• We provide round the clock customer support
• Convenient online submission
• Thorough peer review
• Inclusion in PubMed and all major indexing services
• Maximum visibility for your research
Submit your manuscript atwww.biomedcentral.com/submit
Submit your next manuscript to BioMed Central and we will help you at every step:
Tusting et al. Infectious Diseases of Poverty (2016) 5:78 Page 11 of 11