who benefits from ecosystem services? a case study for ... · a case study for central kalimantan,...
TRANSCRIPT
Who Benefits from Ecosystem Services? A Case Study for CentralKalimantan, Indonesia
Aritta Suwarno1 • Lars Hein1 • Elham Sumarga1,2
Received: 7 April 2015 / Accepted: 24 September 2015 / Published online: 14 October 2015
� The Author(s) 2015. This article is published with open access at Springerlink.com
Abstract There is increasing experience with the valua-
tion of ecosystem services. However, to date, less attention
has been devoted to who is actually benefiting from
ecosystem services. This nevertheless is a key issue, in
particular, if ecosystem services analysis and valuation is
used to support environmental management. This study
assesses and analyzes how the monetary benefits of seven
ecosystem services are generated in Central Kalimantan
Province, Indonesia, are distributed to different types of
beneficiaries. We analyze the following ecosystem ser-
vices: (1) timber production; (2) rattan collection; (3)
jelutong resin collection; (4) rubber production (based on
permanent agroforestry systems); (5) oil palm production
on three management scales (company, plasma farmer, and
independent smallholder); (6) paddy production; and (7)
carbon sequestration. Our study shows that the benefits
generated from these services differ markedly between the
stakeholders, which we grouped into private, public, and
household entities. The distribution of these benefits is
strongly influenced by government policies and in partic-
ular benefit sharing mechanisms. Hence, land-use change
and policies influencing land-use change can be expected
to have different impacts on different stakeholders. Our
study also shows that the benefits generated by oil palm
conversion, a main driver for land-use change in the pro-
vince, are almost exclusively accrued by companies and at
this point in time are shared unequally with local
stakeholders.
Keywords Ecosystem services � Beneficiaries � Benefits �Ecosystem accounting � Ecosystem management
Introduction
Ecosystem services (ES) are increasingly recognized as a
concept that can be used to assess the benefits humans
derive from ecosystems in support of ecosystem manage-
ment (Millennium Ecosystem Assessment (MA) 2005). The
concept of ES is broadly defined as the contributions of
ecosystems to economic and other human activity (TEEB
2010; UN et al. 2014; Haines-young and Potschin 2013).
Benefits from ES are not just a function of ecosystem
dynamics but also a function of the socio-economic system
(i.e., governance system, markets, and informal land use)
(Fisher et al. 2008a). Identification of benefits and benefi-
ciaries from ES is paramount to identify enhanced ecosys-
tem management options (Kettunen et al. 2009).
Several studies have described the concept of benefi-
ciaries and stakeholders of ES for spatial range and specific
ecological and economic processes (Hein et al. 2006;
TEEB 2010; Bagstad et al. 2014). Studies on how ES
benefits received by beneficiaries are altered due to land-
use change in several countries have also been conducted
from a regional (Tomich et al. 2004; Law et al. 2014) to
global scale (Lambin et al. 2003; Howe et al. 2014).
However, there is still insufficient insight in how different
stakeholders benefit from different types of ES and what
this means for ecosystem management (Daily et al. 2009)
The objective of our study is to analyze the benefits of
seven ES in Central Kalimantan Province, Indonesia, and
& Aritta Suwarno
1 Environmental System Analysis Group, Wageningen
University, PO Box 47, 6700 AA Wageningen,
The Netherlands
2 School of Life Science and Technology, Institut Teknologi
Bandung (ITB), Jalan Ganeca 10, Bandung 40132, Indonesia
123
Environmental Management (2016) 57:331–344
DOI 10.1007/s00267-015-0623-9

to examine how these benefits are distributed to different
types of beneficiaries. Our study was conducted in three
steps: First, we defined the beneficiaries based on the
spatial range of ES, related to specific ecological and
economic processes (Hein et al. 2006; Bagstad et al. 2014).
Second, we calculated the monetary benefits of ES based
on ecosystem accounting (UN et al. 2014). Third, we
analyzed the benefits received by different types of bene-
ficiaries among others based on existing government reg-
ulations in the forestry and agricultural sectors. Further, we
analyzed the potential gains and losses of land-use changes
through the calculation of total benefits of ES and the
estimation of damage costs of CO2 emissions (Interagency
Working Group on Social Cost of Carbon 2013).
We use the ecosystem accounting framework as the
methodological framework for our study. Ecosystem
accounting is a new area of environmental economic
accounting, which aims to measure ecosystem capital in a
way that is consistent with national accounts (Boyd and
Banzhaf 2007; UN et al. 2014; Edens and Hein 2013).
Ecosystem accounting provides a framework for analyzing
ecosystem condition, ecosystem service flow, and ecosys-
tem assets, using a set of physical and monetary indicators.
This approach analyzes the monetary value of production
and consumption based on exchange values at ‘arm’s
length.’ Contrary to welfare-based valuation approach, it
does not include consumer surplus.
The innovative aspects of our study are (1) the imple-
mentation of an ecosystem accounting approach to determine
themonetarybenefits ofES received by the different groupsof
beneficiaries and (2) linking this information to support
ecosystemmanagement. Given the importance of ES benefits
in supporting ecosystemmanagement, from the results of this
study,we aim to provide valuable input to establish ecosystem
management in Central Kalimantan Province.
Methodology
Study Area
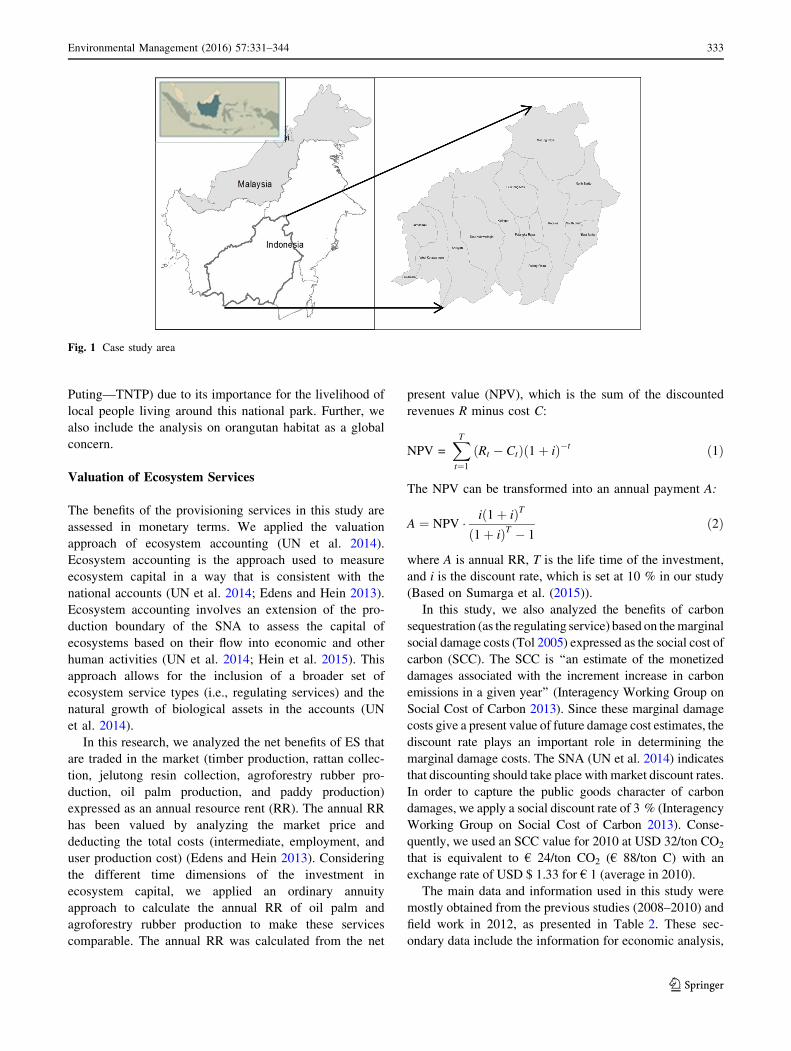
This study was conducted in Central Kalimantan Province,
Indonesia (Fig. 1). The province covers an area of
approximately 15.4 million ha of which 12.7 million ha is
designated forest (Ministry of Forestry 2011). The total
population in 2010 was 2.15 million, with a population
density of 14 people/km2. In terms of local GDP, forest and
agriculture (particularly oil palm) are the most important
sectors. The forests and peatlands of Central Kalimantan
are part of the biodiversity hotspot of Borneo’s forest and
believed to be among the most species-rich environments
in the world (Whitten et al. 2004). They provide vital
ecosystem benefits on a local, regional, and global scale
including livelihood products (e.g., timber and non-timber
products) (Meijaard et al. 2013); cultural services (e.g.,
nature recreation) (Hernandez-Morcillo et al. 2013; Plie-
ninger et al. 2013); and regulating services (e.g., storage of
vast amounts of carbon stock) (Paoli et al. 2010; Leh et al.
2013). However, rapid deforestation to further agricultural
and silvicultural development, particularly oil palm, in
Central Kalimantan has been a salient issue over the last
decade. From 2000 to 2008, the province lost approxi-
mately 0.9 million ha of forest (Koh et al. 2011; Broich
et al. 2011b). Some studies indicated the expansion of oil
palm plantation as the main driving factor of deforestation
in this province (Boer et al. 2012; Koh et al. 2011). The oil
palm expansion in Central Kalimantan Province has been
one of the fastest in Indonesia in the period 2000–2010
(Broich et al. 2011a; Koh et al. 2011; Gunarso et al. 2013).
Identification of Beneficiaries and Stakeholders
ES stakeholders can be defined as any group of individuals
who can affect or are affected by the ecosystem’s service
(Hein et al. 2006). ES beneficiaries benefit from ecosystem
goods or services either through active or passive con-
sumption, or through simple appreciation resulting from the
awareness of these services (Harrington et al. 2010; Nahlik
et al. 2012). The distinction between stakeholder and ben-
eficiary is related to the ability to influence ES provision and
the dependency on the ES. Each beneficiary should be
considered a stakeholder (Hein et al. 2006; Rastogi et al.
2010), but not all stakeholders are necessarily beneficiaries.
The ES benefits vary depending on the type of their indi-
vidual characteristics, spatial scale, and distance between
production area and the location of beneficiaries (Fisher et al.
2008b; Bagstad et al. 2014). In this study, we grouped bene-
ficiaries based on spatial extent and bio-economic process to
be consistent with the beneficiaries’ concept in the System of
National Accounts (SNA). The beneficiaries of ES are then
grouped into (1) private (large companies, small medium
enterprises (SMEs), smallholder with hired labor); (2) public
(governmental agencies at various levels); and (3) household
entities as presented in Table 1.
In this study, we selected six provisioning and one
regulating services which are important for the livelihood
of local people and the economic development in the dis-
trict and the province. These seven ES include (1) timber
production; (2) rattan collection; (3) jelutong resin (Dyera
costulata) collection; (4) rubber (Hevea brasiliensis) pro-
duction (based on permanent agroforestry system); (5) oil
palm production on three management scales (company,
plasma farmer and independent smallholder); (6) upland
paddy production; and (7) carbon sequestration. In this
study, we also include the analysis of nature recreation in
Tanjung Puting National Park (Taman Nasional Tanjung
332 Environmental Management (2016) 57:331–344
123
Puting—TNTP) due to its importance for the livelihood of
local people living around this national park. Further, we
also include the analysis on orangutan habitat as a global
concern.
Valuation of Ecosystem Services
The benefits of the provisioning services in this study are
assessed in monetary terms. We applied the valuation
approach of ecosystem accounting (UN et al. 2014).
Ecosystem accounting is the approach used to measure
ecosystem capital in a way that is consistent with the
national accounts (UN et al. 2014; Edens and Hein 2013).
Ecosystem accounting involves an extension of the pro-
duction boundary of the SNA to assess the capital of
ecosystems based on their flow into economic and other
human activities (UN et al. 2014; Hein et al. 2015). This
approach allows for the inclusion of a broader set of
ecosystem service types (i.e., regulating services) and the
natural growth of biological assets in the accounts (UN
et al. 2014).
In this research, we analyzed the net benefits of ES that
are traded in the market (timber production, rattan collec-
tion, jelutong resin collection, agroforestry rubber pro-
duction, oil palm production, and paddy production)
expressed as an annual resource rent (RR). The annual RR
has been valued by analyzing the market price and
deducting the total costs (intermediate, employment, and
user production cost) (Edens and Hein 2013). Considering
the different time dimensions of the investment in
ecosystem capital, we applied an ordinary annuity
approach to calculate the annual RR of oil palm and
agroforestry rubber production to make these services
comparable. The annual RR was calculated from the net
present value (NPV), which is the sum of the discounted
revenues R minus cost C:
NPV =XT
t¼1
Rt � Ctð Þð1þ iÞ�t ð1Þ
The NPV can be transformed into an annual payment A:
A ¼ NPV � ið1þ iÞT
ð1þ iÞT � 1ð2Þ
where A is annual RR, T is the life time of the investment,
and i is the discount rate, which is set at 10 % in our study
(Based on Sumarga et al. (2015)).
In this study, we also analyzed the benefits of carbon
sequestration (as the regulating service) based on themarginal
social damage costs (Tol 2005) expressed as the social cost of
carbon (SCC). The SCC is ‘‘an estimate of the monetized
damages associated with the increment increase in carbon
emissions in a given year’’ (Interagency Working Group on
Social Cost of Carbon 2013). Since these marginal damage
costs give a present value of future damage cost estimates, the
discount rate plays an important role in determining the
marginal damage costs. The SNA (UN et al. 2014) indicates
that discounting should take place with market discount rates.
In order to capture the public goods character of carbon
damages, we apply a social discount rate of 3 % (Interagency
Working Group on Social Cost of Carbon 2013). Conse-
quently, we used an SCC value for 2010 at USD 32/ton CO2
that is equivalent to € 24/ton CO2 (€ 88/ton C) with an
exchange rate of USD $ 1.33 for € 1 (average in 2010).
The main data and information used in this study were
mostly obtained from the previous studies (2008–2010) and
field work in 2012, as presented in Table 2. These sec-
ondary data include the information for economic analysis,
Fig. 1 Case study area
Environmental Management (2016) 57:331–344 333
123
the potential production of each service per year (yields),
and macroeconomic parameters in 2010.
Allocation of Benefits to Different Types
of Beneficiaries
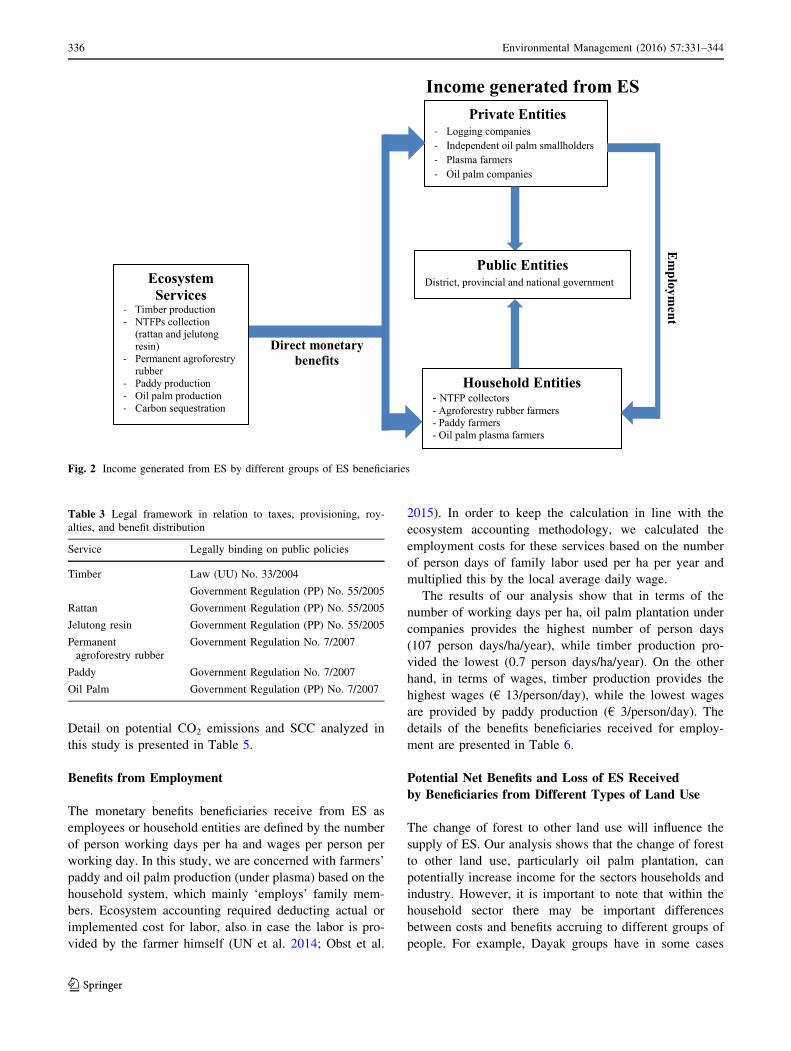
Beneficiaries receive benefits from ES through different
mechanisms. The allocation of benefits from ES received
by beneficiaries was analyzed to explore the way benefits
are shared between private, public, and household benefi-
ciaries based on the framework presented in Fig. 2. The
allocation of benefits to private entities was based on the
annual net benefits. The allocation of benefits to household
entities was based on annual benefits plus wages. The
shares of the benefits public entities received from ES were
calculated based on relevant public finance regulations
applied at different levels of government. For instance, the
share of benefits from timber production that public entities
received at the district level was based on Government
Regulation (PP) No. 55/2005 concerning the procedure for
governing timber and non-timber forest products and Law
No. 33/2004 concerning financial aspects of decentraliza-
tion. These regulations determine taxes, including tax on
timber and a land tax, and fees for extracting timber and
non-timber forest products both from natural forests and
plantation forests. Public finance regulations covered in
this study are presented in Table 3.
Potential Benefits in Different Land Uses
We explored the total monetary benefits private, public, and
household beneficiaries received from different land uses.
The total monetary benefits for each land-use type were
derived from the sum of the monetary benefits beneficiaries
received. The calculation of potential loss from carbon
emissions was conducted based on marginal damage costs,
capturing the cost of emitting a ton of carbon (CO2). We
applied the social cost of carbon (SCC) value for 2010 at €24/ton CO2, based on an assumed discount rate of 3 % (In-
teragency Working Group on Social Cost of Carbon 2013).
Results
Monetary Benefits Generated by Ecosystem Services
Provisioning Services
Compared to the other provisioning services that we ana-
lyzed, oil palm production provides the highest net benefit
per ha; however, it also leads to significant societal costs
related to CO2 emissions, in particular when oil palm is
cultivated on peatland. Oil palm production on peatlandTable
1Ecosystem
services
andtheirkey
beneficiariesanalyzedin
thisstudy(adoptedfrom
CICESandHaines-youngandPotschin
2013)
EScategory
ESsub-category
ESbenefitdomain
Beneficiaries
Private(largecompanies,
SMEs,sm
allholderswith
hired
labor)
Public(government
agencies
atvariouslevels;
global
communities)
Household
Provisioning
Traditional
agriculture
Uplandpaddyproduction
Paddyfarm
er
Rubber
productionunder
permanentagroforestry
system
Rubber
farm
er
Intensiveagriculture
Oilpalm
production
Oilpalm
companies
Independentsm
allholders
Plasm
afarm
er
Localcommunity
Forestharvesting
Tim
ber
production
Loggingcompany
Governmentat
district,
provincial,andnational
level
Localcommunity
Non-tim
ber
forest
product
(NTFP)—
Rattancollection
Governmentatdistrictlevel
Rattancollector
NTFP—
Jelutongresincollection
Governmentatdistrictlevel
Jelutongresincollector
Regulating
Climateregulation
CO2sequestration
Governmentat
district,
provincial,andnational
level;Global
community
Localcommunityat
thevillage
334 Environmental Management (2016) 57:331–344
123

generates an annualized resource rent for company,
smallholder, and plasma farmer of € 683/ha/year, € 395/ha/
year and € 451/ha/year, while on mineral soil, this is €902/ha/year, € 537/ha/year, and € 765/ha/year, respec-
tively. This difference reflects that the production costs, in
particular for plantation establishment, are higher for
peatland.
Timber production, both on peatland and mineral soil,
generates a resource rent of, on average, € 30/ha/year. This
relatively low value indicates that most of the forests in
Central Kalimantan have been heavily logged in the past
and that many of the commercial timber species (e.g.,
Gonystylus bancanus and Eusideroxylon zwageri) have
already been harvested. The benefits from other forest
products, in particular rattan and jelutong resin are con-
siderably higher, on average, for the forest areas in Central
Kalimantan, € 82/ha/year for rattan, and € 83/ha/year for
jelutong. However, generation of the resource rent from
these products is concentrated in the areas where there is
active management and harvest of rattan or jelutong. In
these areas, production can be as high as 1.3 ton/ha/year for
rattan and 0.5 ton/ha/year for jelutong (in case enrichment
planting of rattan or jelutong trees respectively has been
carried out) (Sapiudin 2009). The resulting resource rent
generated per ha, in these cases, amounts to € 110/ha/year
for rattan, respectively, € 157/ha/year for jelutong.
Rubber production captured in this study is produced
under a permanent agroforestry system with an average
yield of about 0.67 ton/ha/year for the mineral soil and 0.54
ton/ha/year for the peatland (Suyanto et al. 2009). Agro-
forestry rubber production on the mineral soil provides a
net benefit of € 112/ha/year, while production on peatland
provides a net benefit € 47/ha/year.
Paddy is the most important food crop produced in this
province. It is mainly grown by transmigrants who origi-
nally came from Java or Sumatra, although traditionally the
Dayak ‘Ngaju’ in the provinces of Central and West Kal-
imantan have been practicing swidden rice cultivation for
many generations (de Jong 1995). The average production
of paddy in this area is about 2.2 ton/ha/year on the mineral
soil and 1.7 ton/ha/year on the peatland. Paddy production
generates an average resource rent of € 287/ha/year on
mineral soil and € 184/ha/year on peatland. The large
majority of paddy production in Central Kalimantan is used
for local consumption.
Details of the results of the analysis on net benefits from
provisioning services are presented in Table 4.
Regulating Service (Carbon Sequestration)
The result of our analysis on monetary benefits from car-
bon sequestration shows that conversion of forest areas on
the peatland and mineral soil to oil palm plantation pro-
vides the lowest benefits due to high CO2 emissions.
Potential CO2 emission from converting forest to oil palm
on the peatland is about 85 ton/ha/year and on mineral soil
is about 25 ton/ha/year. The resulting monetary benefits
generated per ha, in these cases, amount to € -2040/ha/
year for the peatland and € -600/ha/year for mineral soil,
respectively. These results show that converting forest area
to oil palm plantation will increase the potential CO2
emission, which have become a global public concern.
Table 2 Details of the data used in this study
Ecosystem service Remark Sources
Timber production Financial report
Performance of logging activities
Two logging companies; Setiawan et al. (2011)
Rattan collection Economic analysis
Potential yield/ha
Iwan (2008); Martoniady (2009)
Jelutong resin collection Economic analysis
Potential yield/ha
Sapiudin (2009); Budiningsih and Effendi (2013)
Agroforestry rubber production Economic analysis
Potential yield/ha
(Herman and Las 2009); Suyanto et al. (2009)
Upland paddy production Economic analysis
Potential yield/ha
Nugroho (2008); Yandi (2008)
Oil palm production Economic analysis
Potential yield/ha
Two oil palm companies; Iksan and Abdussamad
(2010); Ismail (2010); Boer et al. (2012)
Carbon sequestration Potential CO2 emission
Social cost of carbon
Sanchez (2000); Agus et al. (2009); Hooijer et al.
(2010); Lim et al. (2012); Carlson et al.
(2012b); Carlson et al. (2012c); Interagency
working group on social cost of carbon (2013);
Agus et al. (2013); Gunarso et al. (2013)
Environmental Management (2016) 57:331–344 335
123
Detail on potential CO2 emissions and SCC analyzed in
this study is presented in Table 5.
Benefits from Employment
The monetary benefits beneficiaries receive from ES as
employees or household entities are defined by the number
of person working days per ha and wages per person per
working day. In this study, we are concerned with farmers’
paddy and oil palm production (under plasma) based on the
household system, which mainly ‘employs’ family mem-
bers. Ecosystem accounting required deducting actual or
implemented cost for labor, also in case the labor is pro-
vided by the farmer himself (UN et al. 2014; Obst et al.
2015). In order to keep the calculation in line with the
ecosystem accounting methodology, we calculated the
employment costs for these services based on the number
of person days of family labor used per ha per year and
multiplied this by the local average daily wage.
The results of our analysis show that in terms of the
number of working days per ha, oil palm plantation under
companies provides the highest number of person days
(107 person days/ha/year), while timber production pro-
vided the lowest (0.7 person days/ha/year). On the other
hand, in terms of wages, timber production provides the
highest wages (€ 13/person/day), while the lowest wages
are provided by paddy production (€ 3/person/day). The
details of the benefits beneficiaries received for employ-
ment are presented in Table 6.
Potential Net Benefits and Loss of ES Received
by Beneficiaries from Different Types of Land Use
The change of forest to other land use will influence the
supply of ES. Our analysis shows that the change of forest
to other land use, particularly oil palm plantation, can
potentially increase income for the sectors households and
industry. However, it is important to note that within the
household sector there may be important differences
between costs and benefits accruing to different groups of
people. For example, Dayak groups have in some cases
Table 3 Legal framework in relation to taxes, provisioning, roy-
alties, and benefit distribution
Service Legally binding on public policies
Timber Law (UU) No. 33/2004
Government Regulation (PP) No. 55/2005
Rattan Government Regulation (PP) No. 55/2005
Jelutong resin Government Regulation (PP) No. 55/2005
Permanent
agroforestry rubber
Government Regulation No. 7/2007
Paddy Government Regulation No. 7/2007
Oil Palm Government Regulation (PP) No. 7/2007
Ecosystem Services
- Timber production- NTFPs collection
(rattan and jelutong resin)
- Permanent agroforestry rubber
- Paddy production- Oil palm production- Carbon sequestration
Private Entities- Logging companies- Independent oil palm smallholders - Plasma farmers- Oil palm companies
Household Entities- NTFP collectors- Agroforestry rubber farmers- Paddy farmers- Oil palm plasma farmers
Direct monetary benefits
Employm
ent
Income generated from ES
Public EntitiesDistrict, provincial and national government
Fig. 2 Income generated from ES by different groups of ES beneficiaries
336 Environmental Management (2016) 57:331–344
123

sold (sometimes very cheaply) or lost their land to inde-
pendent smallholders or oil palm companies. In this case,
they have lost the opportunity of gaining benefits from
other ES without adequate compensation, even though they
may still receive benefits from oil palm production through
employment However, not all local people can be
employed on the plantations (McCarthy et al. 2012; Palupi
2014) and wages for casual labor are relatively low
(€ 3.5/day; see Table 6).
The conversion of forest to oil palm plantation, partic-
ularly on the peatland, generates high CO2 emissions.
Estimates for the CO2 emissions resulting from oil palm
development on peatland range from 875 to 2125 ton/ha for
the total period of 25 years, equal to 35–85 ton/ha/year
(Herman and Las 2009; Agus et al. 2010; Hooijer et al.
2010; Lim et al. 2012; Carlson et al. 2012a, b; Couwenberg
and Hooijer 2013). This results in social costs ranging from
€ -840/ha/year to € -2040/ha/year. On the other hand, a
permanent agroforestry system on peatland may generate
lower monetary benefits but also leads to much lower CO2
emissions. CO2 emissions from agroforestry systems
strongly depend on type of agroforestry and drainage depth
(if any drainage is applied). They vary from a small capture
of carbon to net CO2 emissions of 14.4 ton CO2/ha
Table 4 Annual resource rent from provisioning services
Soil
type
Ecosystem
services
Yield
(m3/ha/year;
ton/ha/year)
Price
(€/m3;
€/ton)
Gross
revenue
(€/ha/year)
Production cost (€/ha/year) Value
added
(€/ha/year)
Labor cost
(€/ha/year)Resource
rent
(€/ha/year)Intermediate
cost
(€/ha/year)
User cost
of fixed
assets
(€/ha/year)
Peatland Timber 0.86 118 101 62 0 39 9 30
Jelutong 0.28 342 96 6 0 90 7 83
Rubber 0.54 500 270 7 0 263 216 47
Oil palm (company) 19 123 1997 778 112 1107 424 683
Oil palm (smallholder) 12 123 1278 403 164 711 316 395
Oil palm
(plasma farmer)
16 123 1697 701 189 807 356 451
Paddy 1.7 238 405 80 6 319 135 184
Mineral soil Timber 0.86 118 101 62 0 39 9 30
Rattan 0.79 145 115 16 0 99 17 82
Rubber 0.67 500 335 7 0 328 216 112
Oil palm (company) 19 123 1997 637 84 1276 374 902
Oil palm (smallholder) 12 123 1278 338 123 817 280 537
Oil palm (plasma
farmer)
16 123 1697 471 142 1084 318 766
Paddy 2.22 238 528 87 7 434 147 287
Table 5 Potential CO2 emissions and its Social Cost of Carbon (SCC)
Soil type Land use CO2 emission
(ton/ha/year)
(- indicates emission,
? is sequestration)
SCC
Peatland Forest 19.4 465.6
Agroforestry -14.4 -345.6
Oil palm plantation -85 -2040
Agricultural land -27.3 -655.2
Mineral soil Forest 13.6 326.4
Agroforestry 7.3 175.2
Oil palm plantation -25 -600
Agricultural land 7.3 175.2
Environmental Management (2016) 57:331–344 337
123

(average from Agus et al. 2013; Sanchez 2000). We do not
consider methane emissions from paddy fields in our study
since all paddy fields in the study area are upland fields that
do not cause methane emissions (Inubushi et al. 2003; Hadi
et al. 2012). The results of our analysis on potential annual
benefits received by private, public, and household entities,
as well as potential losses due to the estimated CO2
emissions, are presented in Table 7.
Discussion
Who Benefits from Ecosystem Services?
People obtain benefits from ecosystems in different ways.
Our analysis of six provisioning and one regulating service
in Central Kalimantan Province shows the monetary ben-
efits received by different stakeholders. This study shows
that upland paddy production provides the highest mone-
tary benefits to household entities, while private and public
entities receive most from oil palm and timber production.
This study also shows how the monetary benefits from
timber, NTFPs (rattan and jelutong resin), and agroforestry
rubber are distributed to private, household, and public
entities.
NTFPs and agroforestry rubber are the main source of
local livelihoods in Central Kalimantan (Meijaard et al.
2013; Abram et al. 2014). However, the decrease in forest
quality and agroforestry rubber areas has consequently
decreased the stock of NTFPs and agroforestry rubber, and
influences the monetary benefits received by household and
public entities.
Oil palm production is a profitable venture in the case
study area, in spite of fluctuations in market prices.
Stakeholders have increasingly converted forest and agro-
forestry area to oil palm plantation, and have neglected the
NFTPs and agroforestry rubber. The local government has
seen oil palm plantation as an opportunity for economic
development in their area through the increase in the
number of jobs and also local people see it as an
employment opportunity. In addition, the national target
for CPO production has also supported this interest and
caused an increase in the expansion of oil palm plantation
in Indonesia.
The expansion of oil palm in Indonesia has been criti-
cized locally and internationally. One of the criticisms in
economic and social terms is related to the disadvantaged
position of local communities when negotiating land
transactions and business arrangements (Sirait 2009;
McCarthy and Cramb 2009; Rist et al. 2010; Larsen et al.
2012; Obidzinski et al. 2012; Budidarsono et al. 2013;
Dehen et al. 2013). An assessment of the characteristics of
the private entities connected to oil palm production
reveals that this activity is dominated by stakeholders with
a high capital outlay, due to the high cost of establishing oil
palm plantations. The cost of establishing an oil palm
plantation in the first 3 years, on an independent small-
holder scale, can be between € 428/ha/year and € 862/ha/
year (Iksan and Abdussamad 2010; Boer et al. 2012). The
break-even point can only be achieved with a minimum of
3 ha, assuming that smallholder farmers sell the fresh fruit
bunches (FFB) at the farm gate (Boer et al. 2012; Budi-
darsono et al. 2013). Smallholders with the capital to
establish oil palm are likely middle or upper class indi-
viduals with a close relationship with either an oil palm
company or a key person at the district, provincial, or
national level (Rist et al. 2010; Larsen et al. 2012; Dehen
et al. 2013). Hence, the monetary benefits from oil palm
production are mostly gained by companies and the elite
with only a small share of the benefits going to the local
communities and government through public regulations.
At the same time, some of the costs associated with
palm oil production (traffic, road maintenance, and local
externalities of oil palm plantations such as reduced access
to the forest) occur at the district level. In addition, the
rapid expansion of oil palm plantation in Central Kali-
mantan has also increased social conflicts associated with
labor allocation (Rist et al. 2010; Dehen et al. 2013). Oil
palm cultivation requires special skills that are more fre-
quent among migrant smallholders with prior exposure to
oil palm rather than for the local community with no prior
experience. This has caused the exclusion of local people
from this kind of work. The change in regulations gov-
erning partnerships in oil palm plantations, due to the
establishment of Ministry of Agriculture Regulation No.
98/2013 that replaced Regulation No. 5/2011, has also
created problems related to tenure and arrangements con-
cerning plasma systems (McCarthy et al. 2012; Potter
2012). According to this new regulation, the plantations
can no longer allocate 20 % of their concessions for plasma
farming; they must find this outside their concession. This
regulation is extremely difficult to implement in Central
Table 6 Benefits beneficiaries received for employment
Ecosystem
services
Number of
person days/ha
Wages
(€/person-day)Wages
(€/ha)
Timber 0.7 13 9
Rattan 3.1 5.4 17
Jelutong resin 1.2 5.8 7
Rubber 54 4 216
Paddy 49 3 147
Oil palm
Smallholder 80 3.5 280
Plasma 91 3.5 318
Company 107 3.5 374
338 Environmental Management (2016) 57:331–344
123
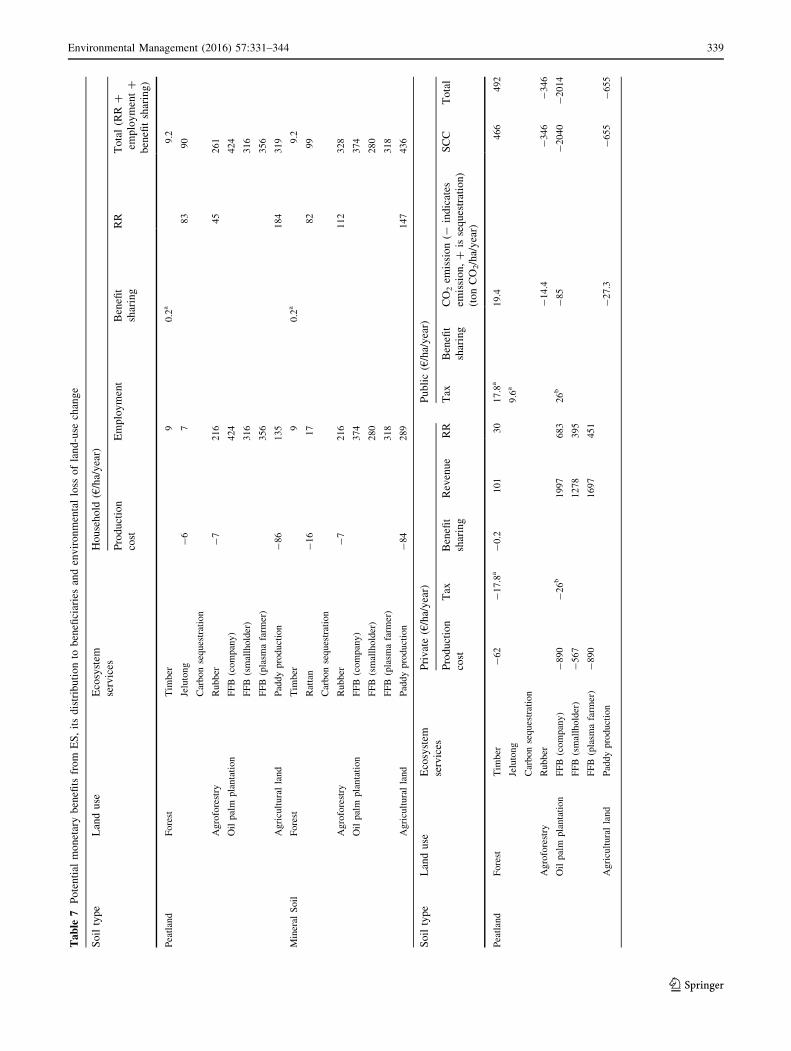
Table
7Potential
monetarybenefits
from
ES,itsdistributionto
beneficiariesandenvironmentalloss
ofland-use
change
Soiltype
Landuse
Ecosystem
services
Household
(€/ha/year)
Production
cost
Employment
Benefit
sharing
RR
Total(RR?
employment?
benefitsharing)
Peatland
Forest
Tim
ber
90.2
a9.2
Jelutong
-6
783
90
Carbonsequestration
Agroforestry
Rubber
-7
216
45
261
Oilpalm
plantation
FFB
(company)
424
424
FFB
(smallholder)
316
316
FFB
(plasm
afarm
er)
356
356
Agriculturalland
Paddyproduction
-86
135
184
319
Mineral
Soil
Forest
Tim
ber
90.2
a9.2
Rattan
-16
17
82
99
Carbonsequestration
Agroforestry
Rubber
-7
216
112
328
Oilpalm
plantation
FFB
(company)
374
374
FFB
(smallholder)
280
280
FFB
(plasm
afarm
er)
318
318
Agriculturalland
Paddyproduction
-84
289
147
436
Soiltype
Landuse
Ecosystem
services
Private(€/ha/year)
Public(€/ha/year)
Production
cost
Tax
Benefit
sharing
Revenue
RR
Tax
Benefit
sharing
CO2em
ission(-
indicates
emission,?
issequestration)
(tonCO2/ha/year)
SCC
Total
Peatland
Forest
Tim
ber
-62
-17.8a
-0.2
101
30
17.8
a19.4
466
492
Jelutong
9.6
a
Carbonsequestration
Agroforestry
Rubber
-14.4
-346
-346
Oilpalm
plantation
FFB(company)
-890
-26b
1997
683
26b
-85
-2040
-2014
FFB(smallholder)
-567
1278
395
FFB(plasm
afarm
er)
-890
1697
451
Agriculturalland
Paddyproduction
-27.3
-655
-655
Environmental Management (2016) 57:331–344 339
123

Kalimantan Province, since most of the recent transmi-
grants have become independent smallholders. Hence,
plantations prefer to buy up Dayak land for inadequate
levels of compensation to meet this regulation, which
eliminates the opportunity for Dayak groups to receive
other ES benefits, other than casual day labor (Palupi
2014). Problems related to environmental degradation have
also increased due to the impact of oil palm expansion on
deforestation, soil subsidence, hydrology, and climate
change (Germer and Sauerborn 2007; Larsen et al. 2012;
Yamamoto and Takeuchi 2012; Carlson et al. 2012b), see
also the related work of Sumarga and Hein (2014) and
Sumarga et al. (2015) in the same area.
Potential Benefits and Losses When Changing
a Forest Ecosystem to a Monoculture Plantation
ES trade-offs arise from management choices made by
humans, who intentionally change the type, magnitude, and
relative mix of services provided by an ecosystem. Trade-
offs occur when the provision of one ecosystem service is
reduced as a consequence of increased the use of another
(Rodrıguez et al. 2006). A common pattern of provisioning
services is that they compete with each other (Tilman et al.
2002; Rodrıguez et al. 2006). For example, an increase in
oil palm production will reduce the timber and NTFPs
production when oil palm is planted and replaces the forest.
Our analysis on potential benefits and losses in different
land uses shows that the conversion of forest to oil palm
plantation will increase the monetary benefits received by
private and household entities, and decrease the monetary
benefits received by public entities due to the absence of a
regulation governing the FFB. The conversion of forest to
oil palm plantation will also reduce the potential monetary
benefits from nature recreation. Our interview with stake-
holders in TNTP shows that this national park has gener-
ated the highest number of visitors (since visitors have
been recorded) among all the national parks in Central
Kalimantan. In 2010, the number of foreign visitors
reached 8422 and domestic visitors 2343. The report from
TNTP shows that in 2010, this national park has con-
tributed € 612,578 to the local economy and € 51,471 to thenational government (BTNTP 2012). However, the estab-
lishment of oil palm plantation around the buffer zone of
this national park has become a salient issue that might
reduce the environmental quality of TNTP and conse-
quently influence the number of visitors. Our interviews
with 50 boat operators and 150 tourists, during the period
July to September 2012, also show the high concern about
the water quality of the Sekoyer River. The reduction in
water quality is due to the recent establishment an oil palm
plantation (in 2011) in the buffer zone of TNTP. Most of
the tourists (125 of 150) stated that they were upset aboutTable
7continued
Soiltype
Landuse
Ecosystem
services
Private(€/ha/year)
Public(€/ha/year)
Production
cost
Tax
Benefit
sharing
Revenue
RR
Tax
Benefit
sharing
CO2em
ission(-
indicates
emission,?
issequestration)
(tonCO2/ha/year)
SCC
Total
Mineral
Soil
Forest
Tim
ber
-62
-17.8a
-0.2
101
30
17.82
13.6
326
351
Rattan
124
Carbonsequestration
Agroforestry
Rubber
7.3
175
175
Oilpalm
plantation
FFB(company)
-721
-26b
1997
902
26b
-25
-600
-574
FFB(smallholder)
-461
1278
537
FFB(plasm
afarm
er)
-613
1697
766
Agriculturalland
Paddyproduction
7.3
175
175
aBased
onGovernmentRegulationNo.55/2005
bLandacquisition,paidonce
for25years
(Boer
etal.2012)
340 Environmental Management (2016) 57:331–344
123

this environmental condition and most of the boat operators
(35 of 50) thought that it would reduce the number of
tourists visiting this national park in the future.
In environmental terms, converting forest to oil palm
plantation will increase the environmental risk of defor-
estation, soil subsidence and carbon emissions, as well as
decrease of biodiversity and the quality and quantity of
river water (Germer and Sauerborn 2007; Hooijer et al.
2012; Agus et al. 2013; Azhar et al. 2014). As we show, the
social costs related to CO2 emissions from oil palm on peat
are higher than the total benefits private and public bene-
ficiaries receive from oil palm production (cf. Sumarga
et al. 2015).
The conversion of forest to oil palm plantation will also
reduce the habitat of many endangered species such as the
orangutan. The orangutan is an endangered species listed in
appendix 1 of the convention on international trade in
endangered species (CITES) for flora and fauna. It is Asia’s
only remaining great ape, living only in Borneo and
Sumatera (Nellemann et al. 2007). Moreover, Central
Kalimantan is likely to have the world’s largest population
of orangutan at the provincial level. The total population of
wild orangutan in this province is about 33,000 individuals
and 61 % of them occur in protected areas (Wich et al.
2008). Based on the unique place of Central Kalimantan as
home to some 50 % of the remaining orangutan in the wild,
maintaining the habitat for this species should be of special
concern in particular in this province.
Policy Implications
The establishment of policy instruments in natural resource
management is vital when governing the distribution of ES
benefits to private, public, and household entities. These
instruments may not only ensure the sustainability of local
livelihoods but also secure environmental funding that
could be used to explore alternative and sustainable sources
of financing ES management (Kettunen et al. 2009). For
example, a reforestation fund from timber production could
be used to cover reforestation costs of degraded forest
areas.
Forest degradation and biodiversity loss has increased
the awareness of the need to improve sustainable forest and
land management in Indonesia. In response to that aware-
ness, the government of Indonesia has released various
regulations on sustainable forest management to govern the
extraction of timber and NFTPs (including carbon
sequestration), as well as nature recreation. The extraction
of timber, both from natural forest and/or plantation forest,
must be conducted according to certain regulations con-
cerning reforestation funds, taxes on forest resources, and
fees for concession permits. The national government also
released a regulation governing the system for NTFPs
collection and tariffs for entering a national park.
Considering the rapid deforestation and expansion of oil
palm in Indonesia, it is very important to analyze the
contribution of ES to forest ecosystems. Our analysis
shows that timber and NTFPs have provided the highest
benefits to public entities through Government Regulation
No. 55/2005 on sustainable forest management. This reg-
ulation governs reforestation funds, taxes on forest
resource, and fees for timber concession (both from natural
forest and/or plantation forest) and NTFPs collection.
However, the change in the value added tax (VAT) status
of agricultural products in Government Regulation No.
12/2001 has eliminated any contribution from oil palm
production to the public budget. In this regulation, FFB is
listed as a non-taxable agricultural products, and the
plantations (both companies and households) are only
required to pay the cost of obtaining land cultivation rights
(Hak Guna Usaha—HGU) of about € 208 to € 333/ha for
25 years and a land and building tax (PBB) of about € 10 to€ 15/ha/year (Boer et al. 2012).
The public finance regulation applied to the palm oil
sector is the tax on exporting CPO, kernel palm oil (KPO)
and their derivative products. The export tax on these
products is governed by the Ministry of Finance Regulation
No. 67/Pmk.011/2010, based on Annex No II of the Min-
istry of Finance Regulation No. 223/Pmk.011/2008. The
export tax is calculated in a progressive way, based on
international prices of these products in cost, insurance and
freight (CIF) Rotterdam. The export tax on CPO, KPO, and
its derivative products is amended annually by the national
government to increase the national revenue from the palm
oil sector. However, this revenue is not distributed to the
district and provincial governments. Considering the high
cost of maintaining the infrastructure in the district, par-
ticularly roads (due to heavy loads transporting CPO and
KPO), a request for a proportion of the income, from the
import/export tax on CPO and KPO, to be directed to the
producing district, was released by the Association of
Indonesian District Government (Asosiasi Pemerintah
Kabupaten Seluruh Indonesia—APKASI) at their meeting
on 5 July 2014.
In order to support the sustainable production of agri-
cultural products and address the environmental problems
caused by the conversion of forest to monoculture planta-
tions, there is a need to set up another policy instrument to
govern the benefit distribution from the agricultural sector,
particularly oil palm. This policy instrument should capture
environmental aspects on sustainable oil palm production
and secure the rights of local and poor people who depend
heavily on forest ecosystems in which the forests area are
converted to oil palm plantation. It is also important to
Environmental Management (2016) 57:331–344 341
123

revisit the financial regulation in this sector, to ensure that
the monetary benefits received by public entities.
Conclusions
This study assesses and analyzes the monetary benefits of
seven ES in Central Kalimantan and how these benefits are
allocated to different types of beneficiaries. This study
shows that oil palm production provides the highest mon-
etary benefits to private entities and lowest to public enti-
ties and local indigenous households, particularly Dayak
groups. The benefits generated by this service are almost
exclusively accrued by companies with at this point in time
very little if any benefit sharing with local stakeholders, in
particular when the local costs of oil palm expansion are
considered. Considering oil palm plantation establishment
as one driver of land-use change, there is a need to set up
additional policy instruments to govern the sustainability of
this product and to ensure that the monetary benefits are
received by public entities through a tax schedule. This
policy instrument should reflect the environmental indica-
tors for sustainable palm oil production and secure the
rights of local and poor people who depend heavily on
forest ecosystems. In addition, it is also important to link
up with the international carbon system in securing the
economic incentives under REDD?? schemes, particularly
if the government and communities decide to conserve
forest instead of converting them to oil palm plantation.
Acknowledgments We would like to thank Hans-Peter Weikard,
Matthias Schroter, Roy Remme, and Morgan Mutoko for their con-
structive comments on the manuscript. This research has been made
possible through ERC Grant 263027 (Ecospace).
Open Access This article is distributed under the terms of the
Creative Commons Attribution 4.0 International License (http://crea
tivecommons.org/licenses/by/4.0/), which permits unrestricted use,
distribution, and reproduction in any medium, provided you give
appropriate credit to the original author(s) and the source, provide a
link to the Creative Commons license, and indicate if changes were
made.
References
Abram NK, Meijaard E, Ancrenaz M et al (2014) Spatially explicit
perceptions of ecosystem services and land cover change in
forested regions of Borneo. Ecosyst Serv 7:116–127. doi:10.
1016/j.ecoser.2013.11.004
Agus F, Runtunuwu E, June T et al (2009) Carbon dioxide emission in
land use transition to plantation. J Litbang Pertan 28:119–126
Agus F, Gunarso P, Sahardjo BH et al (2010) Historical CO2
emissions from land use and land use change from the oil palm
industry in Indonesia, Malaysia and Papua New Guinea. In:
Killen TJ, Goon J (eds) Kuala Lumpur, pp 65–88
Agus F, Henson I, Sahardjo BH et al (2013) Review of emission
factors for assessment of CO2 emission from land use change to
oil palm in Southeast Asia. In: Killen TJ, Goon J (eds) Report
from the technical panels of the second RSPO GHG working
group. Roundtable on Sustainable Palm Oil, Kuala Lumpur
Azhar B, Lindenmayer DB, Wood J et al (2014) Ecological impacts
of oil palm agriculture on forest mammals in plantation estates
and smallholdings. Biodivers Conserv 23:1175–1191. doi:10.
1007/s10531-014-0656-z
Bagstad KJ, Villa F, Batker D et al (2014) From theoretical to actual
ecosystem services: mapping beneficiaries and spatial flows in
ecosystem service assessments. Ecol Soc. doi:10.5751/ES-
06523-190264
Boer R, Nurrochmat DR, Purwawangsa H, Ginting G (2012)
Reducing agricultural expansion into forests in Central Kali-
mantan Indonesia: analysis of implementation and financing
gaps. Bogor Agricultural University, Bogor
Boyd J, Banzhaf S (2007) What are ecosystem services? The need for
standardized environmental accounting units. Ecol Econ
63:616–626. doi:10.1016/j.ecolecon.2007.01.002
Broich M, Hansen M, Stolle F et al (2011a) Remotely sensed forest
cover loss shows high spatial and temporal variation across
Sumatera and Kalimantan, Indonesia 2000–2008. Environ Res
Lett 6:014010. doi:10.1088/1748-9326/6/1/014010
Broich M, Hansen MC, Potapov P et al (2011b) Time-series analysis
of multi-resolution optical imagery for quantifying forest cover
loss in Sumatra and Kalimantan, Indonesia. Int J Appl Earth Obs
Geoinform 13:277–291. doi:10.1016/j.jag.2010.11.004
Balai Taman Nasional Tanjung Puting (BTNTP) (2012) Analisis
ekonomi kegiatan wisata alam di Taman Nasional Tanjung
Puting. Balai Besar Taman Nasional Tanjung Puting. Kaliman-
tan Tengah, Indonesia
Budidarsono S, Susanti A, Zoomers A (2013) Oil palm plantations in
Indonesia : the implications for migration, settlement/resettlement
and local economic development. INTECH. doi:10.5775/5358
Budiningsih K, Effendi R (2013) Financial analysis Jelutung (Dyera
polyphylla) forest plantation in Central Kalimantan. Jurnal
Penelitian Hutan Tanaman 10(1):17–23
Carlson KM, Curran LM, Asner GP et al (2012a) Carbon emissions
from forest conversion by Kalimantan oil palm plantations. Nat.
Clim, Chang
Carlson KM, Curran LM, Asner GP et al (2012b) Carbon emissions
from forest conversion by Kalimantan oil palm plantations. Nat
Clim Chang 3:283–287. doi:10.1038/nclimate1702
Carlson KM, Curran LM, Ratnasari D et al (2012c) Committed
carbon emissions, deforestation, and community land conversion
from oil palm plantation expansion in West Kalimantan,
Indonesia. Proc Natl Acad Sci 109:7559–7564
Couwenberg J, Hooijer A (2013) Towards robust subsidence-based
soil carbon emission factors for peat soils in south-east Asia, with
special reference to oil palm plantations. Mires Peat 12:1–13
Daily GC, Polasky S, Goldstein J et al (2009) Ecosystem services in
decision making: time to deliver. Front Ecol Environ 7:21–28.
doi:10.1890/080025
De Jong W (1995) Recreating the forest: successful examples of
ethnoconservation among Dayak groups in Central West Kali-
mantan. In: Sandbukt O (ed) Management of tropical forests:
towards an integrated perspective. University of Oslo, Centre for
Development and the Environment, Oslo, Norway, pp 295–304
Dehen YA, Mustajab MM, Setiawan B, Anindita R (2013) Sustain-
ability analysis of palm oil plantation in central Kalimantan
province, Indonesia. J Econ Sustain Dev 6:175–183
Edens B, Hein L (2013) Towards a consistent approach for ecosystem
accounting. Ecol Econ 90:41–52. doi:10.1016/j.ecolecon.2013.
03.003
Fisher B, Turner K, Zylstra M et al (2008a) Ecosystem services and
economic theory: integration for policy-relevant research. Ecol
Appl 18:2050–2067
342 Environmental Management (2016) 57:331–344
123
Fisher B, Turner RK, Morling P (2008b) Defining and classifying
ecosystem services for decision making. Ecol Econ 68:643–653.
doi:10.1016/j.ecolecon.2008.09.014
Germer J, Sauerborn J (2007) Estimation of the impact of oil palm
plantation establishment on greenhouse gas balance. Environ
Dev Sustain 10:697–716. doi:10.1007/s10668-006-9080-1
Gunarso P from the TP of the 2nd GGWG of the R on SPO(R), Eko
Hartoyo M, Agus F, Killen TJ (2013) Oil palm and land use
change in Indonesia, Malaysia and Papua New Guinea. In: Killen
TJ, Goon J (eds) Reports from the technical panels of the 2nd
greenhouse gas working group of the Roundtable on Sustainable
Palm Oil (RSPO). pp 29–64
Hadi A, Fatah L, Affandi DN (2012) Greenhouse gas emissions from
peat soils cultivated to rice field. Oil Palm Veg. 17:105–114.
doi:10.5400/jts.2012.17.2.105
Haines-young R, Potschin M (2013) Common international classifi-
cation of ecosystem services (CICES): consultation on version 4.
University of Nottingham, UK
Harrington R, Anton C, Dawson TP et al (2010) Ecosystem services
and biodiversity conservation: concepts and a glossary. Biodi-
vers Conserv 19:2773–2790. doi:10.1007/s10531-010-9834-9
Hein L, van Koppen K, de Groot RS, van Ierland EC (2006) Spatial
scales, stakeholders and the valuation of ecosystem services.
Ecol Econ 57:209–228. doi:10.1016/j.ecolecon.2005.04.005
Hein L, Obst C, Edens B, Remme RP (2015) Progress and challenges
in the development of ecosystem accounting as a tool to analyse
ecosystem capital. Curr Opin Environ Sustain 14:86–92. doi:10.
1016/j.cosust.2015.04.002
Herman AF, Las I (2009) Analisis finansial dan keuntungan yang
hilang dari pengurangan emisi karbon dioksida pada perkebunan
kelapa sawit. J Litbang Pertan 28:127–133
Hernandez-Morcillo M, Plieninger T, Bieling C (2013) An empirical
review of cultural ecosystem service indicators. Ecol Indic
29:434–444. doi:10.1016/j.ecolind.2013.01.013
Hooijer A, Page S, Canadell JG et al (2010) Current and future CO2
emissions from drained peatlands in Southeast Asia. Biogeo-
sciences 7:1505–1514. doi:10.5194/bg-7-1505-2010
Hooijer A, Page S, Jauhiainen J et al (2012) Subsidence and carbon
loss in drained tropical peatlands. Biogeosciences 9:1053–1071.
doi:10.5194/bg-9-1053-2012
Howe C, Suich H, Vira B, Mace GM (2014) Creating win-wins from
trade-offs? Ecosystem services for human well-being: a meta-
analysis of ecosystem service trade-offs and synergies in the real
world. Glob Environ Chang 28:263–275. doi:10.1016/j.gloenv
cha.2014.07.005
Iksan S, Abdussamad (2010) Feasibility analysis of community oil
palm plantation development in Tanah Laut District, South
Kalimantan. Agroscientiae 3(1):111–116
Interagency Working Group on Social Cost of Carbon (2013)
Technical support document: technical update of the social cost
of carbon for regulatory impact analysis. United States
Government
Inubushi K, Furukawa Y, Hadi A et al (2003) Seasonal changes of
CO(2), CH(4) and N(2)O fluxes in relation to land-use change in
tropical peatlands located in coastal area of South Kalimantan.
Chemosphere 52:603–608. doi:10.1016/S0045-6535(03)00242-X
Ismail R (2010) Analisa kelayakan finansial proyek prmbangunan
kebun kelapa sawit pola revilatisai perkebunan dan pabrik
pengolahannya atas nama PT. AUS, Bogor
Iwan (2008) Analisis finansial agroforetri rotan di Teluk Teweh,
Kotawaringin Timur. Palangkaraya, Indonesia
Kettunen M, Bassi S, Gantioler S, ten Brink P (2009) Assessing
Socio-economic benefits of natura 2000—a toolkit for practi-
tioners (September 2009 edition). Output of the European
Commission project Financing Natura 2000: cost estimate and
benefits of Natura 2000 (Contract No.: 070307/2007/484403/
MAR/B2). Brussel, Belgium
Koh LP, Miettinen J, Liew SC, Ghazoul J (2011) Remotely sensed
evidence of tropical peatland conversion to oil palm. Proc Natl
Acad Sci USA 108:5127–5132. doi:10.1073/pnas.1018776108
Lambin EF, Geist HJ, Lepers E (2003) D Ynamics of L and -U Se and
L and -C Over C Hange in T Ropical R Egions. Annu Rev
Environ Resour 28:205–241. doi:10.1146/annurev.energy.28.
050302.105459
Larsen RK, Osbeck M, Jiwan N et al (2012) Competing water claims
in biofuel feedstock operations in central Kalimantan. Stock-
holm, Sweden
Law EA, Bryan BA, Meijaard E et al (2014) Ecosystem services from
a degraded peatland of Central Kalimantan: implications for
policy, planning and management. Ecol Appl 25:70–87
Leh MDK, Matlock MD, Cummings EC, Nalley LL (2013) Quan-
tifying and mapping multiple ecosystem services change in West
Africa. Agric Ecosyst Environ 165:6–18. doi:10.1016/j.agee.
2012.12.001
Lim K, Lim S, Parish H, Suharto R (2012) RSPO manual on best
management practices (BMPs) for existing oil palm cultivation
on peat. Kuala Lumpur, Malaysia
Martoniady (2009) Kontribusi rotan terhadap pendapatan petani di
Tumbang Talakan, Central Kalimantan. Palangkaraya, Indonesia
McCarthy JF, Cramb RA (2009) Policy narratives, landholder
engagement, and oil palm expansion on the Malaysian and
Indonesian frontiers. Geogr J 175:112–123. doi:10.1111/j.1475-
4959.2009.00322.x
McCarthy JF, Gillespie P, Zen Z (2012) Swimming upstream: local
indonesian production networks in ‘‘globalized’’ palm oil
production. World Dev 40:555–569. doi:10.1016/j.worlddev.
2011.07.012
Meijaard E, Abram NK, Wells JA et al (2013) People’s perceptions
about the importance of forests on Borneo. PLoS ONE 8:e73008.
doi:10.1371/journal.pone.0073008
Millennium Ecosystem Assessment (MA) (2005) Ecosystem and
human well-being: synthesis. Island Press, Washington DC
Ministry of Forestry (2011) Forest statistic book. Ministry of Forestry,
Jakarta, Indonesia
Nahlik AM, Kentula ME, Fennessy MS, Landers DH (2012) Where is
the consensus? A proposed foundation for moving ecosystem
service concepts into practice. Ecol Econ 77:27–35. doi:10.1016/
j.ecolecon.2012.01.001
Nellemann C, Milles L, Kaltenborn B et al (2007) The last stand of
the Orangutan—state of emergency: Illegal logging, fire and
palm oil in Indonesia’s national parks. UN Environmenta
Programme, GRID-Arendal, Arendal
Nugroho M (2008) Analisis efficiensi padi pasang surut dan lahan
kering di kecamatan Arut Selatan. Kabupaten Kotawaringin
Barat, Palangkaraya
Obidzinski K, Andriani R, Komarudin H, Andrianto A (2012)
Environmental and social impacts of oil palm plantations and
their implications for biofuel production in Indonesia. Ecol Soc.
17:25
Obst C, Hein L, Edens B (2015) National accounting and the
valuation of ecosystem assets and their services. Environ Resour
Econ. doi:10.1007/s10640-015-9921-1
Palupi S (2014) Palm oil industry and human rights: a case study on
oil palm corporations in central Kalimantan. The Institute for
Ecosoc Rights. Jakarta. Indonesia
Paoli GD, Wells PL, Meijaard E et al (2010) Biodiversity conserva-
tion in the REDD. Carbon Balance Manag 5:7. doi:10.1186/
1750-0680-5-7
Plieninger T, Dijks S, Oteros-Rozas E, Bieling C (2013) Assessing,
mapping, and quantifying cultural ecosystem services at
Environmental Management (2016) 57:331–344 343
123

community level. Land Use Policy 33:118–129. doi:10.1016/j.
landusepol.2012.12.013
Potter L (2012) New transmigration ‘‘paradigm’’ in Indonesia:
examples from Kalimantan. Asia Pac Viewp 53:272–287.
doi:10.1111/j.1467-8373.2012.01492.x
Rastogi A, Badola R, Hussain SA, Hickey GM (2010) Assessing the
utility of stakeholder analysis to protected areas management:
the case of Corbett National Park, India. Biol Conserv
143:2956–2964. doi:10.1016/j.biocon.2010.04.039
Rist L, Feintrenie L, Levang P (2010) The livelihood impacts of oil
palm: smallholders in Indonesia. Biodivers Conserv
19:1009–1024. doi:10.1007/s10531-010-9815-z
Rodrıguez JP, Beard TD, Bennett EM et al (2006) Trade-offs across
space, time, and ecosystem services. Ecol Soc 11:28
Sanchez PA (2000) Linking climate change research with food
security and poverty reduction in the tropics. Agric Ecosyst
Environ 82:371–383. doi:10.1016/S0167-8809(00)00238-3
Sapiudin (2009) Kontribusi peyadapan getah jelutung rawa (Dyera
pollyphylla Miq. Steenis) terhadap pendapatan masayarakat di
desa Kubu, kecamatan Kumai, kabupaten Kotawaringin Barat.
Faculty of Forestry, Lambung Mangkurat University
Setiawan B, Wessiani N, Andrian Y (2011) Perancangan SOP dan
biaya standard untuk melihat pencapaian target perusahaan
terhadap Rencana Kerja Tahunan (RKT) HPH di PT.X.
Surabaya, Indonesia
Sirait M (2009) Indigenous peoples and oil palm plantation expansion
in West Kalimantan, Indonesia. Universiteit van Amstedam and
Cordaid Memisa. The Netherlands
Sumarga E, Hein L (2014) Mapping ecosystem services for land use
planning, the case of Central Kalimantan. Environ Manag
54:84–97. doi:10.1007/s00267-014-0282-2
Sumarga E, Hein L, Edens B, Suwarno A (2015) Mapping monetary
values of ecosystem services in support of developing ecosystem
accounts. Ecosyst Serv 12:71–83. doi:10.1016/j.ecoser.2015.02.009
Suyanto, Khususiyah N, Sardi I et al (2009) Analysis of local
livelihoods from past to present in the Central Kalimantan ex-
mega rice project area. Bogor, Indonesia
TEEB (2010) The economics of ecosystems and biodiversity:
ecological and economic foundations. Earthscan, London and
Washington
Tilman D, Cassman KG, Matson PA et al (2002) Agricultural
sustainability and intensive production practices. Nature
418:671–677. doi:10.1038/nature01014
Tol RSJ (2005) The marginal damage costs of carbon dioxide
emissions: an assessment of the uncertainties. Energy Policy
33:2064–2074. doi:10.1016/j.enpol.2004.04.002
Tomich TP, Thomas DE, Van Noordwijk M (2004) Environmental
services and land use change in Southeast Asia: from recognition
to regulation or reward? Agric Ecosyst Environ 104:229–244.
doi:10.1016/j.agee.2004.01.017
United Nation (UN), European Union, Food and Agriculture Orga-
nization of the United Nations, International Monetary Fund,
Organisation for Economic Co-operation and Development, The
World Bank (2014) System of environmental and economic
accounting 2012: Central framework. United Nation, New York
Whitten T, van Dijk P, Meijaard L et al (2004) Hotspots revisited:
another look at earth’s richest and most endangered terrestrial
ecoregions. Cemex, Mexico
Wich SA, Meijaard E, Marshall AJ et al (2008) Distribution and
conservation status of the orang-utan (Pongo spp.) on Borneo
and Sumatra : how many remain? Oryx 42:329–339
Yamamoto Y, Takeuchi K (2012) Estimating the break-even price for
forest protection in Central Kalimantan. Environ Econ Policy
Stud 14:289–301. doi:10.1007/s10018-012-0030-x
Yandi A (2008) Analisis finansial pengusahaan padi di kecamatan
Kuala Kurun, kabupaten Gunung Mas. Palangkaraya, Indonesia
344 Environmental Management (2016) 57:331–344
123