understanding, modeling and valuing ecosystem services · alabama power’s motto: ... robert...
TRANSCRIPT

Understanding, Modeling and Valuing Ecosystem Services
Robert CostanzaGordon and Lulie Gund Professor of Ecological Economics and Director, Gund Institute of Ecological EconomicsRubenstein School of Environment and Natural ResourcesThe University of VermontBurlington, VT 05405 www.uvm.edu/giee

Full World Full World AnthroposphereAnthroposphere
Marc ImhoffBiosphericSciences Branch
NASA
QuickTime™ and aCinepak decompressor
are needed to see this picture.

Source: Stern review on the economics of climate change, 2006


QuickTime™ and a decompressor
are needed to see this picture.
Potential policy-relevant tipping elements in the climate system. (from Lenton et al. 2008)

In a full world context, what is “the economy” and what is it for?

”Empty World" Model of the Economy
Labor
Land
EconomicProcess
GoodsandServices
CulturalNorms andPolicy
IndividualUtility/welfare
Consumption(based on fixedpreferences)
Improvement
Education, Training,Research
Building
Investment(decisions about, taxesgovernment spending,education,science andtechnologypolicy, etc., basedon existing propertyrights regimes)
Property rights
Private Public
GNP
Manufacturedcapital
Per
fec t
Sub
stitu
tabi
li ty
Bet
wee
n F a
ctor
s

Empty World Energy
Planning?
Alabama Power’s motto:“Always on”
“With Electricity prices at least 15% below the national average, why not?

Human Capital EconomicProductionProcess
GoodsandServices
EvolvingCulturalNorms andPolicy
Well Being(Individual andCommunity)
Consumption(based on changing,adaptingpreferences)
Education, training,research.
BuildingInvestment(decisions about, taxescommunity spending,education, science andtechnology policy, etc., basedon complex propertyrights regimes)
Individual Public
GNP
Wastes
Common
Ecologicalservices/amenities
having, being
- having,- being
negative impacts on all forms of capital
being, doing, relating
Restoration,Conservation Natural Capital
ManufacturedCapital
having
positive impacts on human capital capacity
doing, relatingComplex propertyrights regimes
SolarEnergy
SocialCapital
Lim
ited
S ubs
titut
abilit
yBe
twee
n C
apita
l For
ms
“Full World” Model of the Ecological Economic System
Institutionalrules, norms, etc.
Materially closed earth system
Waste heat
From: Costanza, R., J. C. Cumberland, H. E. Daly, R. Goodland, and R. Norgaard. 1997. An Introduction to Ecological Economics. St. Lucie Press, Boca Raton, 275 pp.

The key is developing a
better understanding
of the opportunities
to create a sustainable
future with a high quality of
life

The Commons“ refers to all the gifts we inherit or create together. This notion of the commons designates a set of assets that have two characteristics:
they’re all gifts, andthey’re all shared.
A gift is something we receive, as opposed to something we earn. A shared gift is one we receive as members of a community, as opposed to individually. Examples of such gifts include air, water, ecosystems, languages, music, holidays, money, law, mathematics, parks, the Internet, and much more”.
Peter Barnes, Capitalism 3.0

QuickTime™ and aTIFF (Uncompressed) decompressor
are needed to see this picture.

TrumanEisenhower
Kennedy
Johnson
Reagan
G. H. W.Bush
NixonFord
Carter
ClintonG. W.Bush
Gross Production vs. Genuine Progress for the US, 1950 to 2002(source: Redefining Progress - http://www.rprogress.org)

ECOSYSTEM SERVICES
Gas regulation
Climate regulation
Disturbance regulation
Water regulation
Water supply
Erosion control and sediment retention
Soil formation
Nutrient cycling
Waste treatment
Pollination
Biological control
Refugia
Food production
Raw materials
Genetic resources
Recreation
Cultural
ECOSYSTEM FUNCTIONS
Regulation of atmospheric chemical composition.
Regulation of global temperature, precipitation, and other biologically mediatedclimatic processes at global, regional, or local levels. Capacitance, damping and integrity of ecosystem response to environmental fluctuations. Regulation of hydrological flows.
Storage and retention of water.
Retention of soil within an ecosystem.
Soil formation processes.
Storage, internal cycling, processing, and acquisition of nutrients.
Recovery of mobile nutrients and removal or breakdown of excess or xenic nutrients and compounds. Movement of floral gametes.
Trophic-dynamic regulations of populations.
Habitat for resident and transient populations.
That portion of gross primary production extractable as food.
That portion of gross primary production extractable as raw materials.
Sources of unique biological materials and products.
Providing opportunities for recreational activities.
Providing opportunities for non-commercial uses.
From: Costanza, R. R. d'Arge, R. de Groot, S. Farber, M. Grasso, B. Hannon, S. Naeem, K. Limburg, J. Paruelo, R.V. O'Neill,R. Raskin, P. Sutton, and M. van den Belt. 1997. The value of the world's ecosystem services and natural capital. Nature387:253-260
Ecosystem services are the benefits humans derive from ecosystem functioning

Ecosystem Services: the benefits humans derive from ecosystems
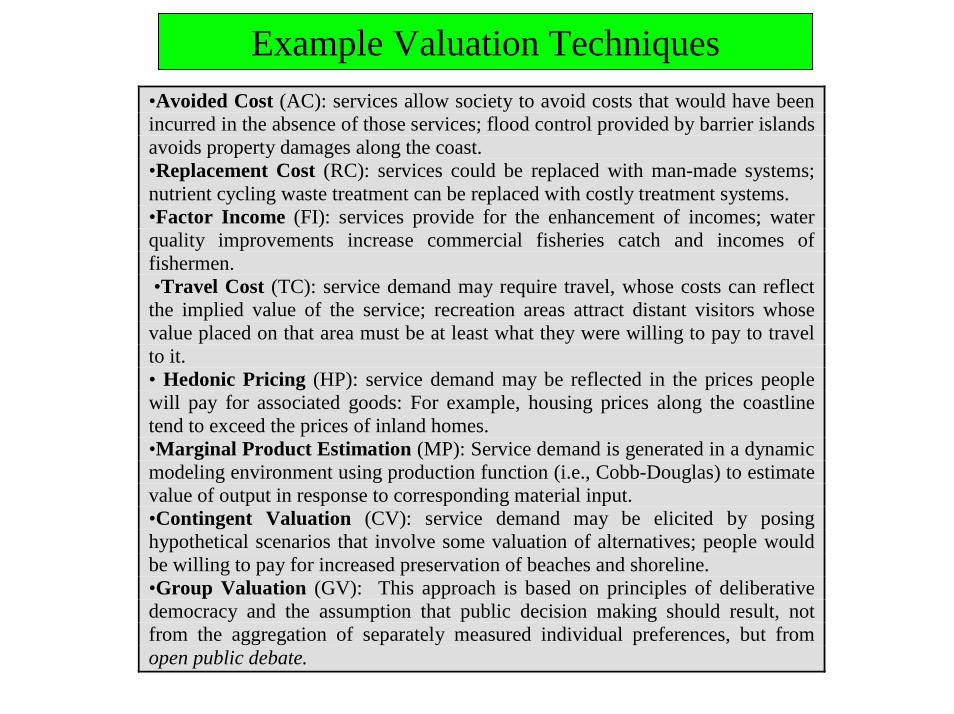
Example Valuation Techniques•Avoided Cost (AC): services allow society to avoid costs that would have been incurred in the absence of those services; flood control provided by barrier islands avoids property damages along the coast. •Replacement Cost (RC): services could be replaced with man-made systems; nutrient cycling waste treatment can be replaced with costly treatment systems. •Factor Income (FI): services provide for the enhancement of incomes; water quality improvements increase commercial fisheries catch and incomes of fishermen. •Travel Cost (TC): service demand may require travel, whose costs can reflect the implied value of the service; recreation areas attract distant visitors whose value placed on that area must be at least what they were willing to pay to travel to it. • Hedonic Pricing (HP): service demand may be reflected in the prices people will pay for associated goods: For example, housing prices along the coastline tend to exceed the prices of inland homes. •Marginal Product Estimation (MP): Service demand is generated in a dynamic modeling environment using production function (i.e., Cobb-Douglas) to estimate value of output in response to corresponding material input. •Contingent Valuation (CV): service demand may be elicited by posing hypothetical scenarios that involve some valuation of alternatives; people would be willing to pay for increased preservation of beaches and shoreline. •Group Valuation (GV): This approach is based on principles of deliberative democracy and the assumption that public decision making should result, not from the aggregation of separately measured individual preferences, but from open public debate.


Valuation of ecosystem services based on the three primary goalsof efficiency, fairness, and sustainability. ___________________________________________________________________________
Goal or Who Preference Level of Level of Specific Value Basis votes Basis Discussion Scientific Input Methods
Required Required ___________________________________________________________________________
Efficiency Homo Current low low willingness economius individual to pay
preferences
Fairness Homo Community high medium veil ofcommunicus preferences ignorance
Sustainability Homo Whole system medium high modeling naturalis preferences with
precaution ___________________________________________________________________________
from: Costanza, R. and C. Folke. 1997. Valuing ecosystem services with efficiency, fairness and sustainability as goals. pp: 49-70 in: G. Daily (ed.), Nature's Services: Societal Dependence on Natural Ecosystems. Island Press, Washington, DC, 392 pp.
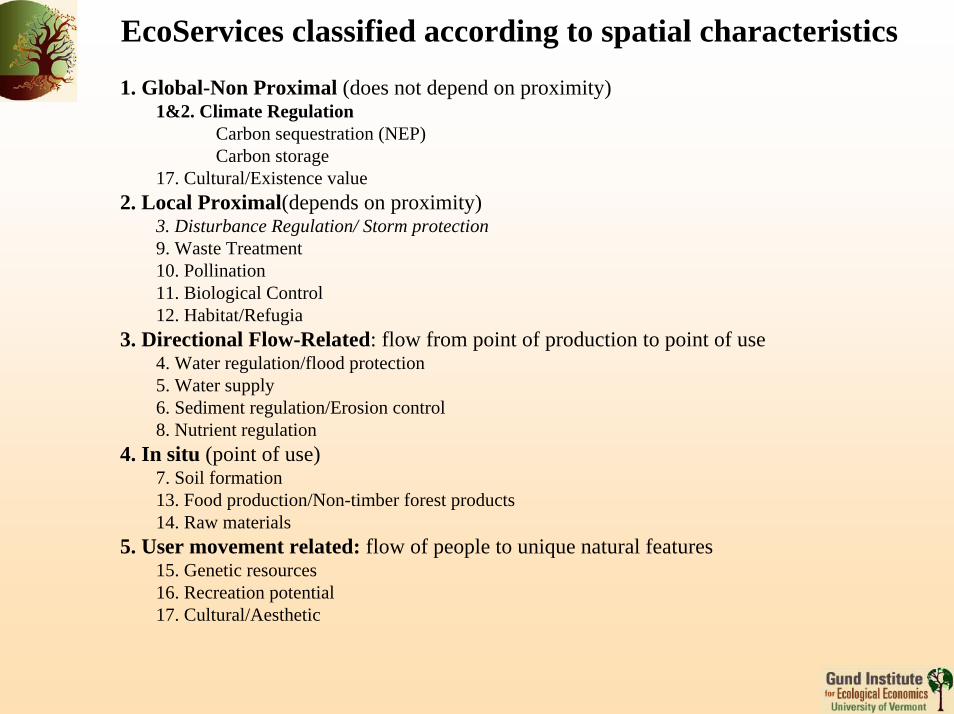
EcoServices classified according to spatial characteristics
1. Global-Non Proximal (does not depend on proximity)1&2. Climate Regulation
Carbon sequestration (NEP)Carbon storage
17. Cultural/Existence value2. Local Proximal(depends on proximity)
3. Disturbance Regulation/ Storm protection9. Waste Treatment10. Pollination11. Biological Control12. Habitat/Refugia
3. Directional Flow-Related: flow from point of production to point of use4. Water regulation/flood protection5. Water supply6. Sediment regulation/Erosion control 8. Nutrient regulation
4. In situ (point of use)7. Soil formation13. Food production/Non-timber forest products14. Raw materials
5. User movement related: flow of people to unique natural features15. Genetic resources16. Recreation potential17. Cultural/Aesthetic

EcoServices Classified According toRivalness and Excludability
Excludable Non-Excludable
MarketGoods andServices(most provisioning services)
Open AccessResources(some provisioning services) Rival
Public Goods and Services(most regulatory and cultural services)
CongestableServices(some recreation services)
Non-rival
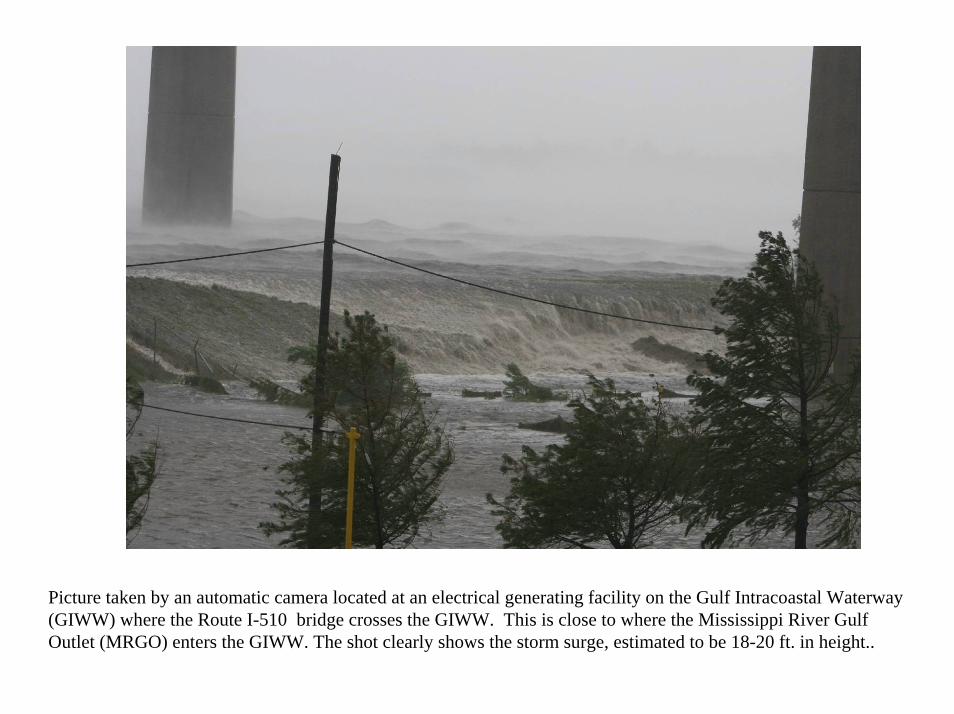
Picture taken by an automatic camera located at an electrical generating facility on the Gulf Intracoastal Waterway (GIWW) where the Route I-510 bridge crosses the GIWW. This is close to where the Mississippi River Gulf Outlet (MRGO) enters the GIWW. The shot clearly shows the storm surge, estimated to be 18-20 ft. in height..

1839187019932020
Past and Projected Wetland Loss in the Mississippi Delta (1839 to 2020)
NEW ORLEANS
Coastal Louisiana

History of coastal Louisiana wetland gain and loss over the last 6000 years, showing historical net rates of gain of approximately 3 km2/year over the period from 6000 years ago until about 100 years ago, followed by a net loss of approximately 65 km2/yr since then.

Global Storm Tracks 1980 - 2006

Figure 1. Typical hurricane swath showing GDP and wetland area used in the analysis.
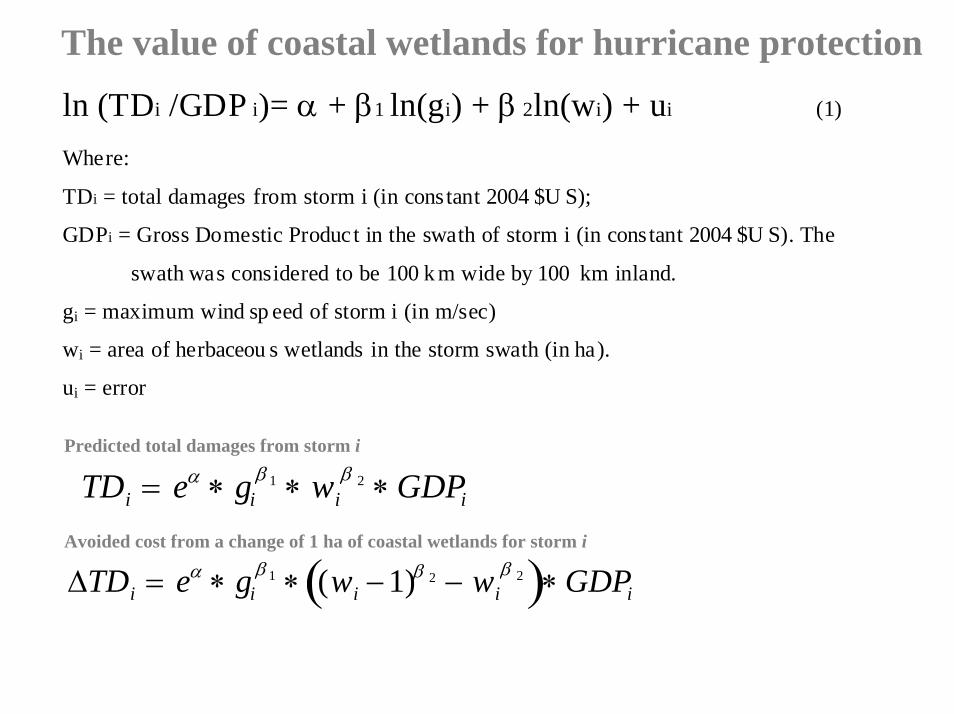
The value of coastal wetlands for hurricane protectionln (TDi /GDP i)= α + β1 ln(gi) + β 2ln(wi) + ui (1)
Where:
TDi = total damages from storm i (in constant 2004 $U S);
GDPi = Gross Domestic Produc t in the swath of storm i (in constant 2004 $U S). The
swath was considered to be 100 k m wide by 100 km inland.
gi = maximum wind sp eed of storm i (in m/sec)
wi = area of herbaceou s wetlands in the storm swath (in ha).
ui = error
Predicted total damages from storm i
TDi = eα ∗ giβ 1 ∗ wi
β 2 ∗GDPi
∆TDi = eα ∗ giβ 1 ∗ (wi −1)β 2 − wi
β 2( )∗GDPi
Avoided cost from a change of 1 ha of coastal wetlands for storm i

Figure 2. Observed vs. predicted relative damages (TD/GDP) for each of the hurricanes used in the analysis.
R2 = 0.60

$100
$1,000
$10,000
$100,000
$1,000,000
1,000 10,000 100,000 1,000,000
Area of coastal wetlands in average swath (ha)
A B
Figure 3. Area of coastal wetlands (A) in the average hurricane swath vs. the estimated marginal value per ha (MVsw) and (B) in the entire state vs. the total value (TVs) of coastal wetlands for storm protection.


•A loss of 1 ha of wetland in the model corresponded to an average $33,000 (median = $5,000) increase in storm damage from specific storms.
•Taking into account the annual probability of hits by hurricanes of varying intensities, the annual value of coastal wetlands ranged from $250 to $51,000/ha/yr, with a mean of $8,240/ha/yr (median = $3,230/ha/yr)
• Coastal wetlands in the US were estimated to currently provide $23.2 Billion/yr in storm protection services.
From: Costanza, R., O. Pérez-Maqueo, M. L. Martinez, P. Sutton, S. J. Anderson, and K. Mulder. 2008. The value of coastal wetlands for hurricane protection. Ambio (in press)

NATURE |VOL 387 | 15 MAY 1997 253
article
The value of the world’s ecosystemservices and natural capitalRobert Costanza*†, Ralph d’Arge‡, Rudolf de Groot§, Stephen Farberk, Monica Grasso†, Bruce Hannon¶,Karin Limburg#I, Shahid Naeem**, Robert V. O’Neill††, Jose Paruelo‡‡, Robert G. Raskin§§, Paul Suttonkk& Marjan van den Belt¶¶* Center for Environmental and Estuarine Studies, Zoology Department, and † Insitute for Ecological Economics, University of Maryland, Box 38, Solomons,Maryland 20688, USA‡ Economics Department (emeritus), University of Wyoming, Laramie, Wyoming 82070, USA§ Center for Environment and Climate Studies, Wageningen Agricultural University, PO Box 9101, 6700 HB Wageninengen, The NetherlandskGraduate School of Public and International Affairs, University of Pittsburgh, Pittsburgh, Pennsylvania 15260, USA¶ Geography Department and NCSA, University of Illinois, Urbana, Illinois 61801, USA# Institute of Ecosystem Studies, Millbrook, New York, USA** Department of Ecology, Evolution and Behavior, University of Minnesota, St Paul, Minnesota 55108, USA†† Environmental Sciences Division, Oak Ridge National Laboratory, Oak Ridge, Tennessee 37831, USA‡‡ Department of Ecology, Faculty of Agronomy, University of Buenos Aires, Av. San Martin 4453, 1417 Buenos Aires, Argentina§§ Jet Propulsion Laboratory, Pasadena, California 91109, USAkkNational Center for Geographic Information and Analysis, Department of Geography, University of California at Santa Barbara, Santa Barbara, California 93106,USA¶¶ Ecological Economics Research and Applications Inc., PO Box 1589, Solomons, Maryland 20688, USA. . . . . . . . . . . . . . . . . . . . . . . . . . . . . . . . . . . . . . . . . . . . . . . . . . . . . . . . . . . . . . . . . . . . . . . . . . . . . . . . . . . . . . . . . . . . . . . . . . . . . . . . . . . . . . . . . . . . . . . . . . . . . . . . . . . . . . . . . . . . . . . . . . . . . . . . . . . . . . . . . . . . . . . . . . . . . . . . . . . . . . . . . . . . . . . . . . . . . . . . . . . . . . . . . . . . . . . . . . . . . . . . . . . . . . . . . . . . . . . . . . . . . . . .
The services of ecological systems and the natural capital stocksthat produce them are critical to the functioning of theEarth’s life-support system. They contribute to human welfare, both directly and indirectly, and therefore representpart of the total economic value of the planet.We have estimated the current economic value of 17 ecosystem servicesfor 16 biomes, based on published studies and a few original calculations. For the entire biosphere, the value (most ofwhich is outside the market) is estimated to be in the range of US$16–54 trillion (1012) per year, with an average ofUS$33trillion per year. Because of the nature of the uncertainties, thismust be considered a minimum estimate. Globalgross national product total is around US$18 trillion per year.
2nd most cited article in the last 10 years in the Ecology/Environment area according to the ISI Web of Science.

Summary of global values of annualecosystem services (From: Costanza et al. 1997)
Value per ha
($/ha/yr)
Global Flow Value
(e12 $/yr) Biome Area
(e6 ha)
577 252
4052 22832 19004 6075 1610
804 969
2007 302 232
14785 9990
19580 8498
92
20.9 8.4
12.6 4.1 3.8 0.3 4.3
12.3 4.7 3.8 0.9 0.9 4.9 1.6 3.2 1.7
0.1
33.3
MarineOpen OceanCoastal
Estuaries Seagrass/Algae Beds Coral Reefs Shelf
TerrestrialForest
Tropical Temperate/Boreal
Grass/RangelandsWetlands
Tidal Marsh/Mangroves Swamps/Floodplains
Lakes/RiversDesertTundraIce/RockCroplandUrban
Total
36,302 33,200
3,102 180 200 62
2,660
15,323 4,855 1,900 2,955 3,898
330 165 165 200
1,925 743
1,640 1,400
332
51,625
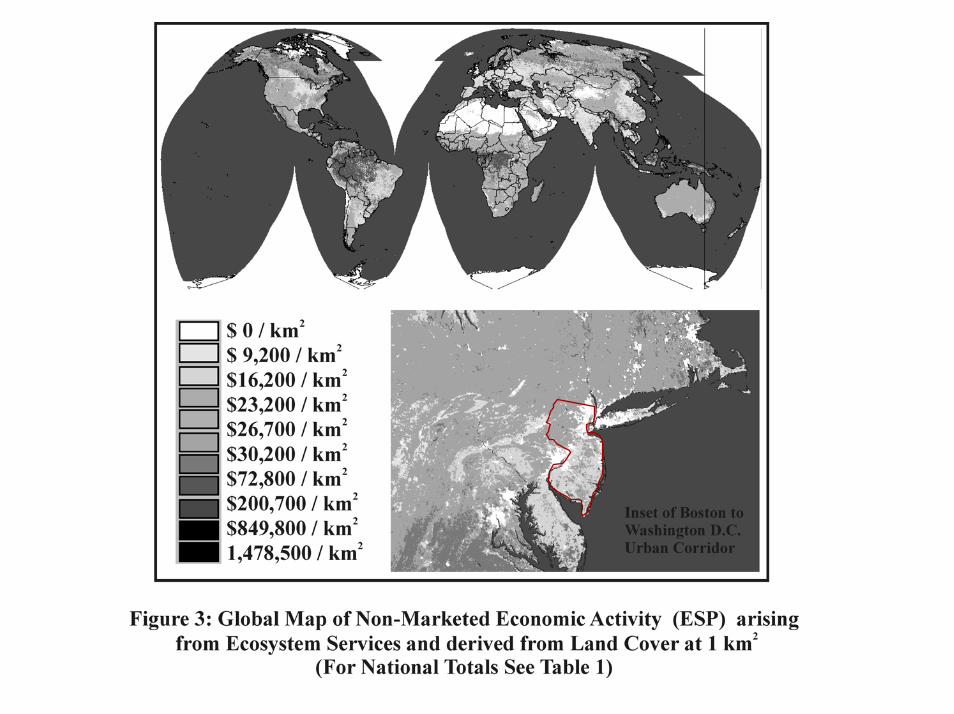

http://www.nj.gov/dep/dsr/naturalcap/

Problems with the Nature paper (as listed in the paper itself)1. Incomplete (not all biomes studied well - some not at all)2. Distortions in current prices are carried through the analysis3. Most estimates based on current willingness-to-pay or proxies4. Probably underestimates changes in supply and demand curves
as ecoservices become more limiting5. Assumes smooth responses (no thresholds or discontinuties)6. Assumes spatial homogeneity of services within biomes7. Partial equilibrium framework8. Not necessarily based on sustainable use levels9. Does not fully include “infrastructure” value of ecosystems10. Difficulties and imprecision of making inter-country
comparisons11. Discounting (for the few cases where we needed to convert from
stock to flow values)12. Static snapshot; no dynamic interactions
Solving any of these problems (except perhaps 6 which could go either way) will lead to larger values

Integrated Modeling of Humans Embedded in Ecological Systems
• Can be used as a Consensus Building Tool in anOpen, Participatory Process
• Multi-scale in time and space
• Acknowledges Uncertainty and Limited Predictability
• Acknowledges Values of Stakeholders
• Multiple Modeling Approaches, Cross-Calibration, and Integration
• Evolutionary Approach Acknowledges History, Limited Optimization, and the Co-Evolution Human Culture and Biology and the Rest of Nature


The Patuxent and Gwynns Falls Watershed Model s(PLM and GFLM)
http://www.uvm.edu/giee/PLMThis project is aimed at developing integrated knowledge and newtools to enhance predictive understanding of watershed ecosystems(including processes and mechanisms that govern the interconnect -ed dynamics of water, nutrients, toxins, and biotic components) andtheir linkage to human factors affecting water and watersheds. Thegoal is effective management at the watershed scale.
Participants Include:Robert CostanzaRoelof BoumansWalter BoyntonThomas MaxwellSteve SeagleFerdinando VillaAlexey VoinovHelena VoinovLisa Wainger

GUMBO (Global Unified Model of the BiOsphere)
Atmosphere
Anthropo-sphere
EcosystemServices
HumanImpacts
Natural Capital Human-madeCapital(includes Built CapitalHuman Capital,and Social Capital
SolarEnergy
Hydrosphere
Lithosphere
Biosphere
11 Biomes
From: Boumans, R., R. Costanza, J. Farley, M. A. Wilson, R. Portela, J. Rotmans, F. Villa, and M. Grasso. 2002. Modeling the Dynamics of the Integrated Earth System and the Value of Global Ecosystem Services Using the GUMBO Model. Ecological Economics 41: 529-560

1000
800
600
400
200
0
Wetland 3000
2500
2000
1500
1000
500
0
Ice and Rock
2000
1500
1000
500
0
Tundra6000
5500
5000
4500
4000
3500
3000
Grasslands
6000
5500
5000
4500
4000
3500
3000
Forests1000
800
600
400
200
0
Urban
4000
3000
2000
1000
0
21002050200019501900
Croplands2000
1500
1000
500
0
21002050200019501900
Desert
Years
Landuse Changes
23
22
21
20
°C
Global Temp
1300
1200
1100
1000
900
800
700
Gig
a To
n C
Atmospheric Carbon
0.4
0.3
0.2
0.1
0.0
met
ers
Sealevel 2000
1500
1000
500
0
Was
te e
quiv
alen
ts (n
orm
aliz
ed fo
r 190
0)
Waste
4.0
3.5
3.0
Gig
a To
n C
equ
ival
ents
Alternative Energy
12
10
8
6
4
2
0
Gig
a To
n C
Fossil Fuel extraction
1.0
0.8
0.6
0.4
0.2
0.0
uel_
Mar
ket_
Sha
re e
quiv
alen
ts (n
orm
aliz
ed fo
21002050200019501900Year
Fossil FuelMarket share
16
14
12
10
8
6
4
Gig
a To
n C
equ
ival
ents
2050200019501900Year
Total Energy
Startrek Big Goverment Ecoptopia Mad Max
Basecase Observations
Physics
20
15
10
5billi
ons
of in
divi
dual
s
Human Population
4.0
3.5
3.0
2.5
2.0
1.5
CIA
L_N
ETW
OR
K e
quiv
alen
ts (n
orm
aliz
ed fo
r21002050200019501900
Year
The Social Network
2000
1500
1000
500
0
Pro
duct
ivity
Inve
sted
Knowledge
8000
6000
4000
2000
0
Pro
duct
ivity
Inve
sted
Built Capital
800
600
400
200
0
Pro
duct
ivity
Inve
sted
Built capital per capita
300
250
200
150
100
50
0
Pro
duct
ivity
Inve
sted
Knowledgeper capita
1.2
1.0
0.8
0.6
0.4
0.2
_NE
TWO
RK
_Per
Cap
equ
ival
ents
(nor
mal
ize
21002050200019501900Year
Social network per capita
Ecotopia Startrek Mad Max Big Goverment Basecase Observations
0.030
0.025
0.020
0.015
0.010
0.005
0.000
Price on waste treatment
30
25
20
15
10
5
0
Price on soil formation
3.0
2.5
2.0
1.5
1.0
0.5
0.0
Price on Cultural and recreational service
20
15
10
5
0
Price on Nutrient cycling
10
8
6
4
2
0
Price on gas regulation
30
25
20
15
10
5
0
Price on Disturbance regulatiuon
10
8
6
4
2
0
2050200019501900Year
Climate price100
80
60
40
20
0
21002050200019501900Year
Energy price
7000
6000
5000
4000
3000
Waste_Treatment7.2
6.8
6.4
6.0
Soil Formation
24
20
16
12
Recreation and_Culture 0.9
0.8
0.7
0.6
Nutrient_Cycling
12
10
8
6
4
2
Gas_regulation
2.76
2.72
2.68
2.64
Disturbance Regulation
10.90
10.85
10.80
10.75
10.70
10.65
21002050200019501900Year
Climate Regulation500
400
300
200
100
21002050200019501900Year
Ecosystem services value
Ecotopia StartrekMad Max Big Goverment Basecase
1.0
0.8
0.6
0.4
0.2
Global_Welfare
80
60
40
20
GWP_per_Capita120
100
80
60
40
20
1989
dol
lars
GWP
0.16
0.12
0.08
0.04
Welfare_per_capita
0.20
0.16
0.12
0.08
21002050200019501900Year
food_per_capita2.0
1.5
1.0
0.5
21002050200019501900Year
Energy_per_Capita
10-4
10-3
are
per c
apita
equ
ival
ents
(nor
mal
ized
for 1
9
Welfare_GNP_Index
Ecotopia Startrek MadMax Big GovermentBasecase Observations

500
400
300
200
100
trill.
US
Dol
lars
(199
8)
2050200019501900Year
Ecosystem Services Value

Multiscale Integrated Modeling of
Ecosystem Services
(MIMES)www.uvm.edu/giee/mimes 1

Project Goals
Outcome 1. A suite of dynamic ecological economic computer models specifically aimed at integrating our understanding of ecosystem functioning, ecosystem services, and human well-being across a range of spatial scales.
Outcome 2. Development and application of new valuation techniques adapted to the public goods nature of most ecosystem services and integrated with the modeling work
Outcome 3. Web-based delivery of the integrated models & results to a broad range of potential users.

Major Accomplishments:
•Global network of collaborators (> 100, 14 countries)•Collaborative development of models (MIMES) including biophysical dynamics and valuation•Initial results and ongoing applications at calibration sites (Global, Vermont, Amazon, PNW, Mexico, Marine)•Web sites for collaboration, education, and model delivery•Publication of results in multiple venues•Commitments for applications to multiple sites around the world
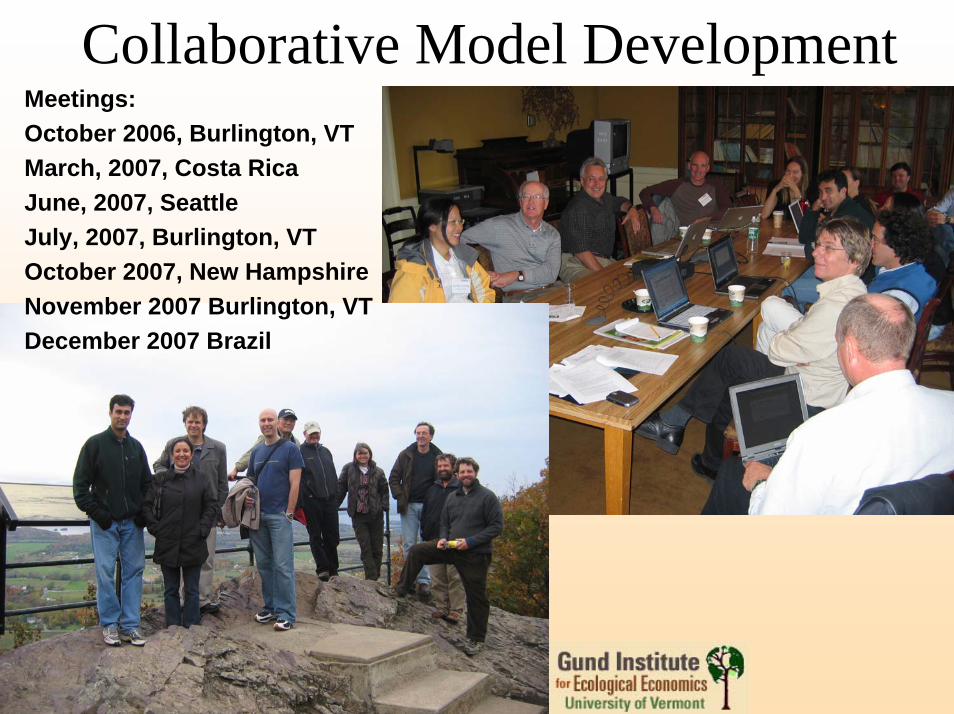
Collaborative Model DevelopmentMeetings:October 2006, Burlington, VTMarch, 2007, Costa RicaJune, 2007, SeattleJuly, 2007, Burlington, VTOctober 2007, New HampshireNovember 2007 Burlington, VTDecember 2007 Brazil

University of VermontAustin Troy FacultyRobert Costanza FacultyRoelof Boumans FacultySerguei Krivov FacultyAmos Baehr Graduate StudentEric Garza Graduate StudentGalen Wilkerson Graduate StudentGary Johnson Graduate StudentJuan Alvez Graduate StudentKarim Chichakly Graduate StudentKenneth Bagstad Graduate StudentMark Gately Graduate StudentRobin Kemkes-Wengell Graduate StudentShuang Liu Graduate StudentValerie EspositoGraduate StudentAzur Moulaert Project ManagerAnju Dahiya Modeling ExpertErnie Bufford Spatial Analysis LaboratoryJarlath O'Neil-Dunne Spatial Analysis LaboratorySean McFaden Spatial Analysis LaboratoryEneida Campos Gund Fellow, BrazilJoe Roman Gund FellowGuy Derry Web Developer
External Participants & Current PartnersCutler Cleveland Boston UniversityLes Kaufman Boston UniversityGiselle Samonte Tan Conservation International, DCKeith Alger Conservation International, DCMiroslav Honzak Conservation International, DCRodrigo Moura Conservation International, BrazilRosimeiry Portela Conservation International, DCBrett Bryan CSIRO, AustraliaSo-Min Cheong University of KansasDavid Batker Earth Economics, SeattleKen Lindeman Florida Institute of TechnologyKathy Hibbard National Center for Atmospheric ResearchRobert Muetzelfeldt SimulisticsJasper Taylor SimulisticsHal Mooney Stanford UniversityRalph Seppelt UFZ, GermanyPaul C. Sutton University of DenverSteve Farber University of PittsburghTrista Patterson USDA Forest Service, Juneau AKRudolf deGroot Wageningen UniversityAdemar Romeiro Unicamp, BrazilPaolo Sinisgalli Embrapa, BrazilLuis Steinle Camargo BrazilMaria Ramos Fasabien BrazilWilson Rotatori Correa BrazilDaniel Caixeta Andrade BrazilWilson Cabral Sousa BrazilColin Beer State University of New York ESFMarcos Amend Conservation Strategy Fund, BrazilDenis Ojima Colorado State UniversityFred Sklar South Florida Water Management DistrictDan Childers Florida International UniversityPaul West The Nature ConservancyBelinda Morris The Nature ConservancyRichard Howart Dartmouth CollegeBrett Bryan CSIROCharles Hopkinson Woods Hole Marine Biological LaboratoryKenneth Mulder Green Mountain CollegeRobin Naidoo World Wildlife Fund

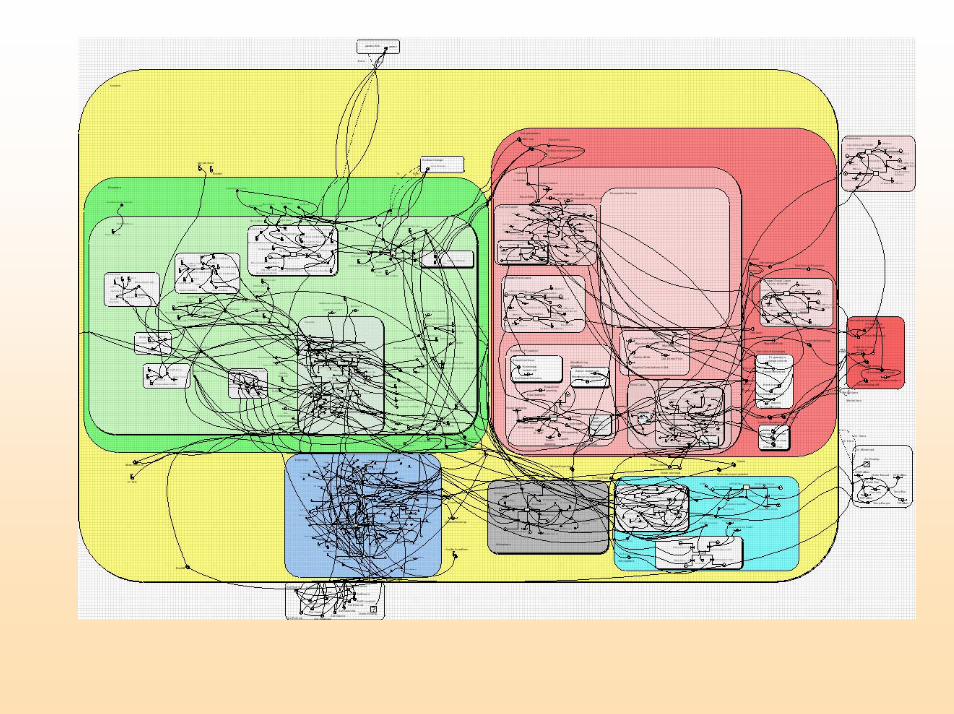
MIMESAncestry
Figure 1. MIMES ancestry, showing some of the models that have been incorporated in the MIMES framework.

The modeling software: Simile http://www.simulistics.com/

Mimes Version Control
C:\Documents and Settings\Roel\My Documents\My Models\MIMES\trunk\models

MIMESMulti-scale Integrated Models of Ecosystem Services
LocationBiosphere
Earth Surfaces
NutrientCycling
Hydrosphere Lithosphere Atmosphere
Anthroposphere
Cultures
Biodiversity
EcosystemServices
Water by
Reservoir
Geological Carbon
Ores
Earth Energy
Gasses
ExchangesBetweenLocations
Social Capital
Human Capital
Economie

Sea-viewing Wide Field-of-View Sensor (SeaWiFS) data on marine and terrestrial plant productivity
QuickTime™ and a decompressor
are needed to see this picture.
Biosphere

Three complementary and synergistic ways to include humans in models and modeling:
1. As “stakeholders” and active participants in the model conceptualization, development, construction, testing, scenario development, and implementation processes.
2. As “players” of the models where the model is used as both a decision aid and as a research tool to better understand human behavior in complex valuation and decision processes.
3. As “agents” programmed into the model based on better understanding of their goals and behavior gleaned through 1 and 2.
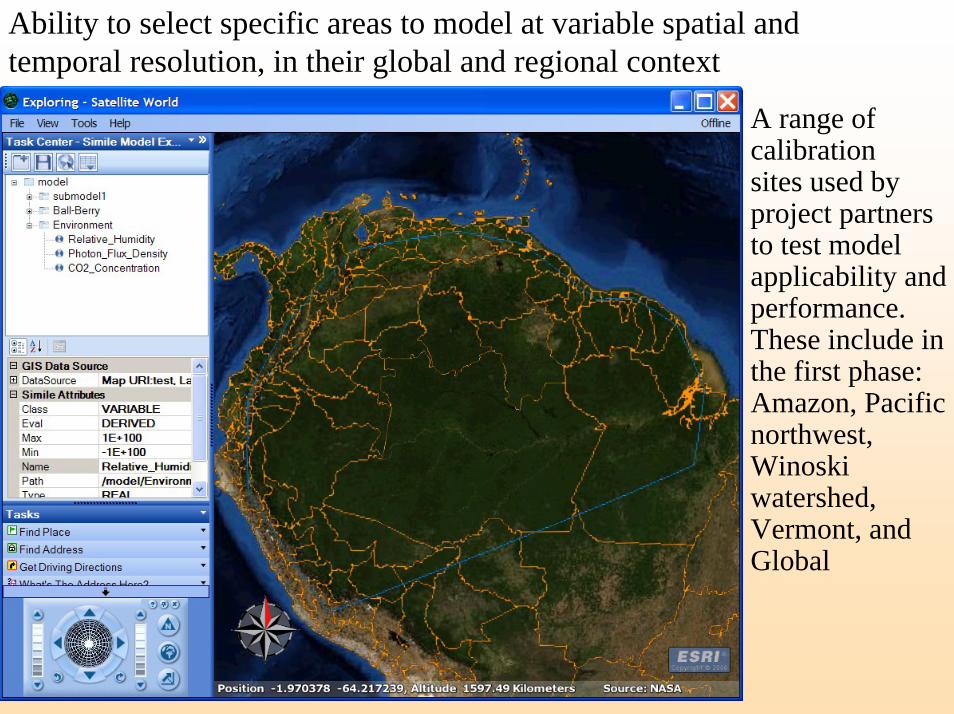
Ability to select specific areas to model at variable spatial and temporal resolution, in their global and regional context
A range of calibrationsites used by project partners to test model applicability and performance. These include in the first phase:Amazon, Pacific northwest, Winoskiwatershed, Vermont, and Global

Landuse
Soil drainage
type
Water regulation
Land Use
Soil Drainage type
Water Regulation

Ecosystems (% Area)
Croplands Wetlands
Urban
Forests
Tundra
Oceans43

1990 economic production in $ PPP by country
Research Households
AgricultureTransportation
Tourism Fisheries44

Ecosystem Services
Climate Regulation
Biological Regulation
Natural Hazard Mitigation
Cultural Heritage
Genetic Information
Inorganic Resources
45

Case studies under development

53

Tab to web

QuickTime™ and a decompressor
are needed to see this picture.
Atmosphere
Next Steps:1. Further development and testing of MIMES
2. Application to a large number of sites around the world in support of PES systems, carbon trading, national accounting, etc. in collaboration with local partners
3. make MIMES the most widely used and trusted system for ecosystem service modeling and evaluation in the world

A Few Conclusions:
•If the goal is sustainable human well-being, a good or services’ value is it’s relative contribution to achieving that goal, whether people perceive that contribution or not. Conventional, preference-based valuation techniques are therefore limited and not the only alternatives.
•Integrated modeling at multiple scales is an essential tool for understanding and quantifying the complex interdependencies and trade-offs in human systems embedded in ecological systems.••Ecosystem services are largely public goods (non-rival and non-excludable) which means that privatization and conventional markets will not work well (if at all). We need alternatives like PES systems, ecological tax reform, Full cost accounting, etc.


QuickTime™ and a decompressor
are needed to see this picture.
www.eoearth.org

Thank YouPapers mentioned in this talk available at:
www.uvm.edu/giee/publications:
MIMES website at:www.uvm.edu/giee/mimes