which governance mechanisms promote efficiency in reaching poor clients? evidence from rated...
TRANSCRIPT

European Financial Management, Vol. 18, No. 2, 2012, 218–239doi: 10.1111/j.1468-036X.2009.00524.x
Which Governance MechanismsPromote Efficiency in Reaching PoorClients? Evidence from RatedMicrofinance Institutions
Valentina HartarskaDepartment of Agricultural Economics and Rural Sociology, Auburn AL, 36849, USAE-mail: [email protected]
Roy MerslandSchool of Management, University of Agder, Kristiansand, NorwayE-mail: [email protected]
Abstract
This paper evaluates the effectiveness of several governance mechanisms onmicrofinance institutions’ (MFI) performance. We first define performance asefficiency in reaching many poor clients. Following the literature on efficiency inbanks, we estimate a stochastic cost frontier and measure output by the numberof clients. Therefore, we capture the cost minimisation goal and the goal ofserving many poor clients, both of which are pursued by MFIs. We next explorethe impact of measurable governance mechanisms on the individual efficiencycoefficients. The results show that efficiency increases with a board size of up tonine members and decreases after that. MFIs in which the CEO chairs the boardand those with a larger proportion of insiders are less efficient. The evidencealso suggests that donors’ presence on the board is not beneficial. We do notfind consistent evidence for the effect of competition, and we find weak evidencethat MFIs in countries with mature regulatory environments reach fewer clients,while MFIs regulated by an independent banking authority are more efficient.
Keywords: microfinance institutions, board, governance, performance, efficiency
JEL classification: G21, G30
The authors would like to thank an anonymous referee for helping improve the first draftof this paper, and also Clair Crutchley for useful comments, and participants of the FirstInternational Research Workshop on Microfinance Management and Governance, June 2008,at University of Agder, Kristiansand, Norway.
C© 2009 Blackwell Publishing Ltd
Which Governance Mechanisms Promote Efficiency in Reaching Poor Clients? 219
1. Introduction
Microfinance institutions (MFIs) provide banking services to the poor. An MFI mustserve as many poor customers as possible while remaining financially sustainable.Annual spending on microfinance worldwide amounts to between US$800 million and$1.5 billion (Hartarska and Holtmann, 2006). MFI governance is a challenge to thefurther development of the microfinance industry (CSFI, 2008) and investors, donors,and governments are looking for effective mechanisms of control to ensure that MFIsmake the best use of scarce resources.
While previous studies have estimated the impact of MFI governance mechanismsseparately along either social or financial dimensions (Hartarska, 2005; Mersland andStrøm, 2009), this paper takes simultaneously into account both objectives of MFIs inevaluating the effectiveness of various governance mechanisms. We take advantage ofan approach widely used to study efficiency in banks, modifying it to capture the dualityof MFIs (see Berger et al., 2001). We measure performance using efficiency coefficientsobtained from a stochastic cost frontier to capture the cost minimisation objective ofMFIs. Within the cost function, we measure output by the number of clients served inorder to capture the outreach objective of serving as many poor clients as possible (seeCaudill et al., 2009).
The banking literature suggests that, after directly accounting for input prices, outputquantity, technology-specific factors, and country characteristics, the remaining costinefficiency is managerial (Fries and Taci, 2005; Bos and Kool, 2006). In a second step,the (predicted) individual efficiency coefficients from the cost function estimation aremodelled as a function of measurable internal and external governance mechanisms.The internal governance factors are those related to the MFI board and include itssize, representations by various stakeholders and managerial capture. The externalfactors account for the weak market-disciplining mechanisms in microfinance, suchas a lack of private shareholders, the limited role of competition, and differences inregulation.
The results show that MFI efficiency is affected by certain governance mechanisms assuggested in the literature. In particular, MFIs are less efficient when the positions of theCEO and the board chair are merged; similarly, MFIs with a larger proportion of insiders(employees) on the board are less efficient. We also find that efficiency increases with aboard size of up to eight or nine members and decreases after that. The evidence suggeststhat donors’ presence on the board is not beneficial, while that of creditors may be. Wedo not find consistent evidence that competition improves efficiency, although we dofind weak evidence that MFIs in countries with mature regulatory environments couldreach more clients by operating as a unit regulated by the banking authorities.
The remainder of the paper is organised as follows. Section 2 reviews the relatedliterature and lays out the hypotheses to be tested. Section 3 describes the empiricalmethodology. Section 4 summarises the data. The results are discussed in Section 5,while Section 6 offers conclusions.
2. Literature Review
The literature has identified various links between firm performance and governance.MFIs operate as either non-profit or for-profit organisations in which shareholdersare quasi-owners (large institutional donors) or charities, and seldom regular privateinvestors. Therefore, a brief review of the existing corporate, banking, non-profit, and
C© 2009 Blackwell Publishing Ltd
220 Valentina Hartarska and Roy Mersland
microfinance governance literature is used to identify governance mechanisms relevantfor MFIs, and to formulate and test empirical hypotheses.
The first empirical study of this topic is Hartarska (2005), who uses survey datafrom a small sample of MFIs in Eastern Europe and Central Asia (ECA) to studyhow managerial compensation, board size and composition (stakeholder representation,gender, and skills), prudential regulations, external rating, and auditing affect financialperformance. Financial performance is measured by the return on assets, and outreachresults are measured by the number of borrowers and the depth of outreach (theclients’ poverty level). This study finds that some traditional control mechanisms,such as performance-based compensation, are ineffective, while others, such as boardindependence, improve performance. This work highlights the importance of identifyingbetter performance measures to capture the dual objective of MFIs, rather than usingthe traditional accounting-based ROA and number of clients. For example, boards witha higher proportion of donors were found to have lower sustainability but a better depthof outreach, while MFIs with client representation have better sustainability but serveborrowers who are less poor. Hartarska (2005) also does not find consistent evidencethat board size, regulation, audits, or ratings affect MFI outreach or sustainability.
Mersland and Strøm (2009) use a larger sample of rated MFIs and study whether andhow such aspects of the CEO/chairman duality, female CEOs, international directors,board size, and external factors affect financial performance and outreach. They alsofind no evidence that typical governance mechanisms work, but their results may also beaffected by not measuring simultaneously the dual objective. For example, they find thatMFIs with female CEOs have better ROA; that MFIs with dual CEO/chairman positionshave a higher portfolio yield and serve more clients but show no other measurableperformance difference; that MFIs with larger boards distribute smaller loans; and thatexternal factors play a limited role at best.
2.1 Internal governance
Internal governance includes control mechanisms within the firm, such as the MFI board.In a typical MFI, board members are not paid, but their incentives are aligned with thoseof stakeholders, because members are legally responsible for effective monitoring. Suchboard members offer their reputation as collateral and will try to minimise the riskof damaging it (Handy, 1995). Uncompensated board members volunteer their time,because the mission of the organisation matters to them. Those no longer committed tothe mission leave, and substitutions are made by the remaining board members based onmutually agreed-upon criteria (Fama and Jensen, 1983a). Directors may want to shirktheir responsibility or simply get along with managers rather than govern effectively,but peer policing is expected to decrease the incidence of inappropriate board behaviour(Fama and Jensen, 1983b).
In practice, MFIs want to identify board members who are able and willing todedicate the time needed to effectively monitor management (Labie, 2001). Since MFIs’managers strive to achieve outreach and sustainability, they reveal more information totheir boards than what would have been revealed under a single profit maximisationobjective (Hartarska, 2002). Thus, the board plays an important role in an MFI, and thisrole is best captured by evaluating the board’s impact on a performance measure thatcaptures the dual objectives of such organisations.
A significant part of the empirical literature has focused on the impact of board sizeon firm performance. Since free-riding is more likely in larger boards, there is evidence
C© 2009 Blackwell Publishing Ltd
Which Governance Mechanisms Promote Efficiency in Reaching Poor Clients? 221
that larger boards are less effective in corporations as well as in small firms (Yermack,1996; Eisenberg et al., 1998). Financial intermediaries usually have larger boards thando non-financial firms, but the empirical evidence shows both a positive and negativerelation between board size and performance (Adams and Mehran, 2003; Pathan et al.,2007). Studies on non-profit boards have suggested that larger boards may be moresuccessful because of the additional duties that board members take on in supervisingfundraising, but there is no empirical support for this claim (Oster and O’Reagan,2004).
Cheng (2008) finds evidence that larger corporate boards are associated with lessvariability in firm performance, because larger boards take longer to reach consensusand their decisions are less extreme. The dual objective of the MFI and the importanceof communicating stability to customers in an MFI would suggest that there may bebenefits to larger size. Yet thus far, the empirical evidence is mixed. Hartarska (2005)did not find consistent evidence of a positive impact of larger boards on a ROA, or onthe number of actual borrowers, while Mersland and Strøm (2009) found weak evidencethat MFIs with larger boards offer smaller-sized loans, suggesting the targeting of poorerclients.
Since none of these studies used a measure that captures outreach and sustainabilitysimultaneously, we propose the following hypothesis in its null form. Hypothesis 1. H0:Board size has no impact on performance. Moreover, we test for a quadratic relationbetween size and efficiency to determine whether the no impact results found up to thispoint were due to a possible non-linear relation between board size and performance.
Board composition reflects a board’s quality and its ability to monitor and advisethe manager (Boone et al., 2007). Several aspects of board composition are usuallyconsidered in the literature, and the impact of both independent directors and separatedCEO/Board Chair roles seems most important (Bhagat and Jefferie, 2002).1 Empiricalstudies, however, have found both a positive and a negative relation between theproportion of outside directors and firm performance (Mayers et al., 1997; Rosensteinand Wyatt, 1997).
The explanation given by the corporate governance literature is that when a firmoperates in a noisy environment, board monitoring costs are higher and there will be lessmonitoring. The empirical findings from high-growth firms show that they have smallerboards with a high proportion of insiders, since outside directors are less effective (Coleset al., 2008). Firms facing greater information asymmetry will have less independentboards because of the higher cost of monitoring (Linck et al., 2008). However, theexpected benefits of an inside director’s expert knowledge outweigh the expected costs ofmanagerial entrenchment when managerial and outside shareholder interests are closelyaligned, usually via equity-based compensation (Rosenstein and Wyatt, 1997). MFIs donot have typical shareholders and do not use high-powered incentives, because suchincentives may not be appropriate for managers pursuing double objectives (Hartarska,2005).
1 Some authors have argued that with endogenously chosen boards, differences in perfor-mance may be attributed to specification issues (Hermalin and Weisbach, 2003). Recently,however, a study by Cornett and Tehranian (2008) shows that if a firm’s performance is ad-justed for earning management, the measured importance of governance variables increasesand the impact of incentive-based compensation on corporate performance decreases; thus,the presence of independent outside directors, the institutional ownership of shares, andrepresentation on the board of directors can have a direct impact on performance.
C© 2009 Blackwell Publishing Ltd

222 Valentina Hartarska and Roy Mersland
Typically, banks have a larger proportions of outside directors, and empirical workfinds that the proportion of independent directors has a positive impact on performancein some banks (Adams and Mehran, 2003; Pathan et al., 2007). In non-profits, boards arecomprised mostly of outsiders, so the potential conflict between insiders and outsidersis less relevant.
The collapse of the MFI Corposol/Finansol in Colombia has been attributed to a lackof proper board independence and to poor oversight, both of which allowed too muchpower to be concentrated in the hands of one executive (Otero and Chu, 2002). Fora sample of MFIs in the ECA region, Hartarska (2005) finds that MFIs with a largerproportion of independent directors achieve better outreach, but she finds no effect onfinancial results. That is why estimating the impact on a measure that captures MFIs’additional objective of outreach is important. Therefore, we form Hypothesis 2. H0:The proportion of insiders on the board, measured as the proportion of employees onthe board, does not affect performance.
In some MFIs, the CEO is also the chairman of the board, in spite of previous callsto split the role. Such a duality may be a sign of CEO entrenchment (Hermalin andWeisbach, 1998), since then the CEO may pursue policies that allow him private benefits.Mersland and Strøm (2009) found that in MFIs, a CEO-chairman duality had a positiveimpact on portfolio yields and on the number of clients served. It did not, however,influence overall financial performance measures. The next hypothesis in null form isHypothesis 3, H0: MFIs in which the positions of CEO and board chair are split donot perform better than those in which the position is not split.
Given the specific organisational type of MFI, representatives of other stakeholderssuch as donors, clients, employees, and creditors may also be included on the boardto balance varying interests. The corporate governance literature in stakeholder systemcountries – for example, Germany, Japan, and France – studies the role of firms’ otherstakeholders, such as creditors, employees, customers, suppliers, and the government(Schmidt and Tyrell, 1997). This literature acknowledges the existence of various agencyconflicts, but argues that the success of the firm is in the best interests of all parties.For the German corporate governance system, in which employee representation onthe supervisory board is typically legally mandated, Fauver and Fuerst (2006) find thatlabour representation provides a powerful means of monitoring and reduces agencycosts, especially in firms with a greater need for coordination.
Previous evidence shows that having bankers on the board improves the value andperformance of German firms, perhaps by reducing the agency costs (Gorton andSchmidt, 2000). In the USA, bankers are rarely represented on boards of firms, becauseshareholder–creditor conflicts have been relatively unimportant (Kroszner and Strahan,2001).
Unlike most other boards, the MFI board may also include representatives of socialinvestors (when the organisation has raised funds in the external markets), donors, andclients. These groups of stakeholders may play a role similar to that of large blocksof stakeholders and may improve efficiency. The interests of each group may notcoincide with the interest of the other two groups – for example, investors may preferbetter returns, while donors and clients may prefer outreach, as suggested in Hartarska(2005). However, Mersland and Strøm (2009) do not find that these stakeholder groupsinfluence performance. Therefore, we formulate a fourth hypothesis. Hypothesis 4. H0:The proportion of each group of creditors, clients, and donors on the board does notaffect performance.
C© 2009 Blackwell Publishing Ltd
Which Governance Mechanisms Promote Efficiency in Reaching Poor Clients? 223
2.2 External factors
MFIs are remarkably diverse. They operate as regulated or unregulated, and areregistered as non-governmental organisations (NGOs), private banks, non-bank financialinstitutions, or member-owned cooperatives with various costs of ownership (Mersland,2009). However, Mersland and Strøm (2008) find a minimal difference in perfor-mance between shareholder-owned MFIs and other MFIs, and Herrmann and Frank(2002) provide similar evidence for foundation-owned firms versus private firms inGermany.
Regulation may impact MFI performance by changing the internal rules of theorganisation. Although prudential regulation imposed on MFIs accepting depositscan be justified, the cost of designing and enforcing regulatory policies to addressthe specific challenges of microfinance is substantial and may outweigh potentialbenefits. Regulation introduces the regulator as an additional stakeholder, and thismay lead to mission drift if the need to fulfil regulatory requirements diverts atten-tion away from the objective of serving the poor (e.g., by shifting the focus fromserving poor clients to improving capital adequacy ratios); this may hold back theinnovation in lending technology that has been the driving force behind MFIs’ abilityto expand outreach and serve poor clients (see ‘Special Issue on Microfinance’,forthcoming in World Development). In fact, summary statistics reported by the Mi-croBanking Bulletins show that regulated MFIs serve wealthier borrowers (www.themix.org).
Several cross-country studies find that regulatory status and regulatory power of thesupervisory body have no impact on financial sustainability or outreach (Hartarska,2009; Mersland and Strøm, 2009). However, Hartarska and Nadolnyak (2007) find thatbetter outreach (measured as the number of borrowers) is associated with higher levels ofsavings, suggesting an indirect effect of regulation on outreach if regulation is requiredfor deposit-taking activity. The next hypothesis to be tested in its null form is: Hypothesis5, H0: Bank regulation of MFIs and the level of regulatory burden in MFIs do notaffect performance.
Competition is another variable to consider. More intense competition may act as asubstitute for strong internal governance (Hart, 1983, Schmidt 1997). However, compe-tition may undermine institution-customer long-term relationships (Gorton and Winton,2003). Competition among mission-driven organisations can improve the match betweenmanagers and the non-profit organisation they choose to work for, thus improvingoverall efficiency, as shown by Besley and Ghatak (2004). However, McIntosh andWydick (2005) show that competition among non-profit lenders exacerbates asymmetricinformation problems regarding borrower indebtedness and causes more borrowers toseek additional debt, thus creating a negative externality that leads to worse loan contractsfor all borrowers.
Evidence from countries with competitive microfinance markets in individual coun-tries such as Bolivia and Uganda indicates that too much competition may decreaseprofitability, although it may lower interest rates that borrowers are charged, and thuspresumably may affect outreach (Porteous, 2006). Cross-country studies are mixed, withsome evidence of no impact (Mersland and Strøm, 2009) and weak evidence of positiveimpact (Hartarska and Nadolnyak, 2007).
Thus, the sixth hypothesis to be tested in the null form is H0: The intensity ofmicrofinance competition does not affect performance.
C© 2009 Blackwell Publishing Ltd
224 Valentina Hartarska and Roy Mersland
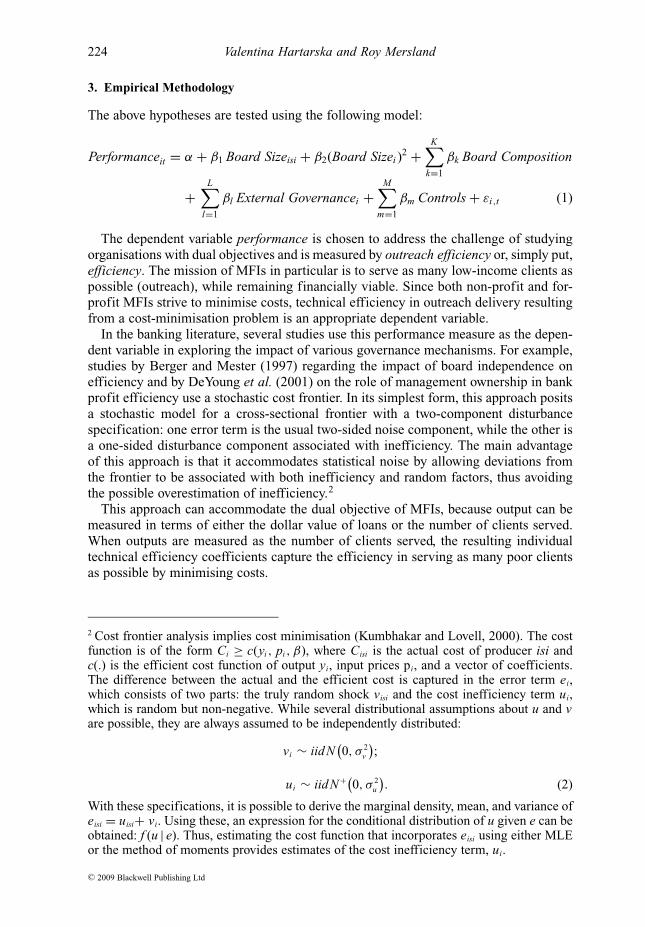
3. Empirical Methodology
The above hypotheses are tested using the following model:
Performanceit = α + β1 Board Sizeisi + β2(Board Sizei )2 +
K∑
k=1
βk Board Composition
+L∑
l=1
βl External Governancei +M∑
m=1
βm Controls + εi,t (1)
The dependent variable performance is chosen to address the challenge of studyingorganisations with dual objectives and is measured by outreach efficiency or, simply put,efficiency. The mission of MFIs in particular is to serve as many low-income clients aspossible (outreach), while remaining financially viable. Since both non-profit and for-profit MFIs strive to minimise costs, technical efficiency in outreach delivery resultingfrom a cost-minimisation problem is an appropriate dependent variable.
In the banking literature, several studies use this performance measure as the depen-dent variable in exploring the impact of various governance mechanisms. For example,studies by Berger and Mester (1997) regarding the impact of board independence onefficiency and by DeYoung et al. (2001) on the role of management ownership in bankprofit efficiency use a stochastic cost frontier. In its simplest form, this approach positsa stochastic model for a cross-sectional frontier with a two-component disturbancespecification: one error term is the usual two-sided noise component, while the other isa one-sided disturbance component associated with inefficiency. The main advantageof this approach is that it accommodates statistical noise by allowing deviations fromthe frontier to be associated with both inefficiency and random factors, thus avoidingthe possible overestimation of inefficiency.2
This approach can accommodate the dual objective of MFIs, because output can bemeasured in terms of either the dollar value of loans or the number of clients served.When outputs are measured as the number of clients served, the resulting individualtechnical efficiency coefficients capture the efficiency in serving as many poor clientsas possible by minimising costs.
2 Cost frontier analysis implies cost minimisation (Kumbhakar and Lovell, 2000). The costfunction is of the form Ci ≥ c(yi , pi , β), where Cisi is the actual cost of producer isi andc(.) is the efficient cost function of output yi, input prices pi, and a vector of coefficients.The difference between the actual and the efficient cost is captured in the error term ei,which consists of two parts: the truly random shock visi and the cost inefficiency term ui,which is random but non-negative. While several distributional assumptions about u and vare possible, they are always assumed to be independently distributed:
vi ∼ iidN(0, σ 2
v
);
ui ∼ iidN +(0, σ 2
u
). (2)
With these specifications, it is possible to derive the marginal density, mean, and variance ofeisi = uisi+ vi. Using these, an expression for the conditional distribution of u given e can beobtained: f (u | e). Thus, estimating the cost function that incorporates eisi using either MLEor the method of moments provides estimates of the cost inefficiency term, ui.
C© 2009 Blackwell Publishing Ltd

Which Governance Mechanisms Promote Efficiency in Reaching Poor Clients? 225
We first estimate a stochastic translog cost frontier of the form:
ln(C) = α0 +∑
j
α j ln(p j ) +∑
k
βk ln(yk) + 1
2
∑
j
∑
i
γ j i ln(p j ) ln(pi )
+ 1
2
∑
k
∑
l
δkl ln(yk) ln(yl) +∑
j
∑
k
ρ jk ln(p j ) ln(yk) + ln u + ln v
(3)
where C is total cost, yk are outputs, pj are input prices, α, β, γ, δ, andρ are parametersto be estimated, ln u is the inefficiency term assumed to be one-sided (half-normally dis-tributed), and ln ε is two-sided, normally distributed. Standard restrictions are imposed bydividing all prices and quantities by the price of physical capital. Individual coefficientsof technical efficiency are derived from this equation and are used as the dependentvariable to estimate equation (1). Specifically, cost efficiency CEi, is E(exp{−ui }|ei )and technical outreach efficiency is TEi = 1/CEisi and is used to study the impact ofgovernance variables (see Coelli et al., 2005 p. 265).3
In equation (3), output is measured as the number of borrowers or number of clients(borrowers and savers) to account for the outreach goal of serving as many clients aspossible, as in Caudill et al. (2009). For a robustness check, models with the volumeof loans as the dependent variable are also estimated. The inputs in the cost functionare labour, physical capital, and financial capital. The price of labour is the averageannual salary per employee calculated as personnel expense divided by the number ofemployees. The price of physical capital is the operating expenses minus personnelexpenses divided by fixed assets. The price of financial capital is the weighted cost ofcapital. The total costs (C) are defined as the sum of input prices and quantities.
Recent banking studies argue that firm-specific characteristics and, in cross-countrystudies, country-specific factors affect efficiency; therefore, MFI-specific variables andcountry dummies are also included in the cost frontier function (Fries and Taci, 2005;Bos and Kool, 2006). The literature review section also shows that several controlvariables must be included directly in the cost function, so that the resulting inefficiencyis attributed to managerial inefficiency, which in turn is affected by the governancemechanisms.
Therefore, we control for age, size, and portfolio risk levels, as we expect that learningoccurs over the life of the MFI and that, with the passage of time, managers gainexperience in that institution and environment (Caudill et al., 2009). We include adummy variable that takes the value of one if the MFI specifically targets women, andzero otherwise, since women have better repayment rates and loans to women maybe less expensive (Armendariz and Morduch, 2005). We also include a variable thatcontrols for non-profit status, links with international networks, and the provision ofnon-financial services, as recent studies have shown that these variables influence theperformance of the MFI (e.g., Lensink and Mersland, 2009).
The cost efficiency estimation, therefore, includes MFI age measured in years fromthe start of microfinance activity, MFI size measured in the log of the assets, and riskmeasured as the percentage of the portfolio more than 30 days overdue. Microfinanceproduction technology-specific variables included are Ownunit, which takes on the value
3 Battese and Coelli (1995) developed a one-stage model that has gained some popularity, butGreene (2002) argues that these models are developed for only truncated normal distribution,and in cross-country studies, would not represent a substantial improvement over the moretraditional technique, which is what we use in this paper.
C© 2009 Blackwell Publishing Ltd

226 Valentina Hartarska and Roy Mersland
of one if the MFI is an independent organisation (not a branch of a major MFI or adevelopment organisation), and zero otherwise; Purefinserv, which takes on the valueof one if the MFI only provides financial services (since some offer client training andother services), and zero otherwise; Intinitiated, which takes on the value of one if theMFI was created by an international organisation; Gender, which takes on the value ofone if the MFI targets women specifically, and NGO, which takes on the value of oneif the MFI is registered as a non-profit organisation.
The above factors are beyond managerial control, influence efficiency directly, andare included directly in the cost function. The estimated technical efficiency is a resultof managerial effort that is affected by governance mechanisms. Therefore, as in Bergerand Mester (1997) and DeYoung et al. (2001), efficiency coefficients are the dependentvariable in a second-stage regression to test how internal and external governancemechanisms influence managers’ performance in terms of the efficient delivery ofoutreach.
4. The Data
The dataset was constructed from publicly available data from www.ratingfund.org.It consists of all available risk assessment reports conducted by five major ratingagencies (MicroRate, Microfinanza, Planet Rating, Crisil, and M-Cril), as of June 2007.The methodologies applied by the rating agencies have been compared, and no majordifferences in how they assess MFIs relevant for this study have been found. Each of thefive rating agencies is approved to rate and assess MFIs according to the Rating Fundof the Consultative Group to Assist the Poor (CGAP). The MFIs in the sample openedup their accounts to the careful scrutiny of the rating agencies, and their rating reportsare publicly available, because (partial) funding for the rating itself was provided by theRating Fund.
The willingness of these MFIs to share their financial and organisational data anddonors’ willingness to make the data publicly available reflect the industry’s tendencytowards greater transparency. To date, the dataset analysed here remains the highest-quality, publicly available cross-section of data for MFIs worldwide. Alternative dataare collected and screened by the Micro Banking Bulletin, but they are not publiclyavailable (nor are they available to researchers), while data collected by the Mix Marketare self-reported and incomplete. Moreover, these two datasets do not contain governancedata.
The rating reports in the database are from 2000 to 2007, with the majority comingfrom the last four years. The reports contain financial information for up to four years.Financial values have been annualised and converted to US dollars using prevailingofficial exchange rates. The rating agencies differ in terms of the information they makeavailable in the reports. Thus, the variables consist of different numbers of observations,which are reflected in the different number of observations in the regressions.
The main dataset consists of 278 MFIs from 60 countries. Since not all MFIs havecomplete information that can be used to estimate efficiency, and since not all of themprovide detailed information on their governance, the data used consist of between 260and 380 annual observations depending on the model specification, or about 155 MFIsfrom 45 countries. Table 1 lists all countries and the total number of observations fromeach country.
Table 2 presents summary statistics for the variables used in this analysis. The firstpart contains variables used in the cost function. It shows that the average MFI included
C© 2009 Blackwell Publishing Ltd

Which Governance Mechanisms Promote Efficiency in Reaching Poor Clients? 227
Table 1
MFIs by country
This Table reports MFIs by country. The first column lists the name of the country, the second columnshows how many MFIs from that country are in the sample, and the last column shows the number ofannual observations in the sample.
Country name Number of MFIs Annual observations
Albania 3 9Argentina 1 4Armenia 1 2Azerbaijan 5 12Bangladesh 1 1Benin 3 7Bolivia 13 46Bosnia Herzegovina 7 22Brazil 8 28Bulgaria 1 4Cameroon 1 3Chile 1 4Colombia 1 2Croatia 1 2Dominican Republic 3 8Ecuador 13 34El Salvador 4 11Ethiopia 1 2Georgia 5 10Guatemala 3 7Haiti 1 3Honduras 6 15India 13 18Indonesia 1 1Jordan 2 6Kazakhstan 2 3Kyrgyzstan 1 3Mexico 10 34Moldova 1 3Morocco 3 6Mozambique 1 3Nicaragua 7 21Pakistan 1 1Paraguay 1 4Peru 16 58Philippines 4 4Romania 1 3Russian Federation 4 13Senegal 2 4Sri Lanka 1 1Tajikistan 3 5Togo 1 2Uganda 1 3Vietnam 1 3Yugoslavia 2 8
TOTAL 162 443
C© 2009 Blackwell Publishing Ltd
228 Valentina Hartarska and Roy Mersland
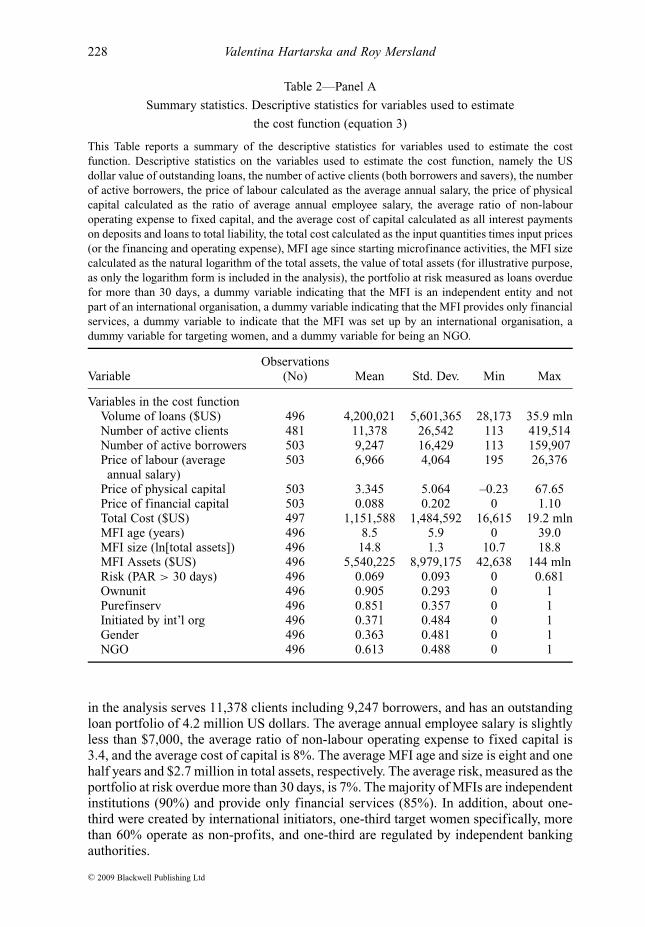
Table 2—Panel A
Summary statistics. Descriptive statistics for variables used to estimate
the cost function (equation 3)
This Table reports a summary of the descriptive statistics for variables used to estimate the costfunction. Descriptive statistics on the variables used to estimate the cost function, namely the USdollar value of outstanding loans, the number of active clients (both borrowers and savers), the numberof active borrowers, the price of labour calculated as the average annual salary, the price of physicalcapital calculated as the ratio of average annual employee salary, the average ratio of non-labouroperating expense to fixed capital, and the average cost of capital calculated as all interest paymentson deposits and loans to total liability, the total cost calculated as the input quantities times input prices(or the financing and operating expense), MFI age since starting microfinance activities, the MFI sizecalculated as the natural logarithm of the total assets, the value of total assets (for illustrative purpose,as only the logarithm form is included in the analysis), the portfolio at risk measured as loans overduefor more than 30 days, a dummy variable indicating that the MFI is an independent entity and notpart of an international organisation, a dummy variable indicating that the MFI provides only financialservices, a dummy variable to indicate that the MFI was set up by an international organisation, adummy variable for targeting women, and a dummy variable for being an NGO.
ObservationsVariable (No) Mean Std. Dev. Min Max
Variables in the cost functionVolume of loans ($US) 496 4,200,021 5,601,365 28,173 35.9 mlnNumber of active clients 481 11,378 26,542 113 419,514Number of active borrowers 503 9,247 16,429 113 159,907Price of labour (average 503 6,966 4,064 195 26,376annual salary)
Price of physical capital 503 3.345 5.064 –0.23 67.65Price of financial capital 503 0.088 0.202 0 1.10Total Cost ($US) 497 1,151,588 1,484,592 16,615 19.2 mlnMFI age (years) 496 8.5 5.9 0 39.0MFI size (ln[total assets]) 496 14.8 1.3 10.7 18.8MFI Assets ($US) 496 5,540,225 8,979,175 42,638 144 mlnRisk (PAR > 30 days) 496 0.069 0.093 0 0.681Ownunit 496 0.905 0.293 0 1Purefinserv 496 0.851 0.357 0 1Initiated by int’l org 496 0.371 0.484 0 1Gender 496 0.363 0.481 0 1NGO 496 0.613 0.488 0 1
in the analysis serves 11,378 clients including 9,247 borrowers, and has an outstandingloan portfolio of 4.2 million US dollars. The average annual employee salary is slightlyless than $7,000, the average ratio of non-labour operating expense to fixed capital is3.4, and the average cost of capital is 8%. The average MFI age and size is eight and onehalf years and $2.7 million in total assets, respectively. The average risk, measured as theportfolio at risk overdue more than 30 days, is 7%. The majority of MFIs are independentinstitutions (90%) and provide only financial services (85%). In addition, about one-third were created by international initiators, one-third target women specifically, morethan 60% operate as non-profits, and one-third are regulated by independent bankingauthorities.
C© 2009 Blackwell Publishing Ltd
Which Governance Mechanisms Promote Efficiency in Reaching Poor Clients? 229
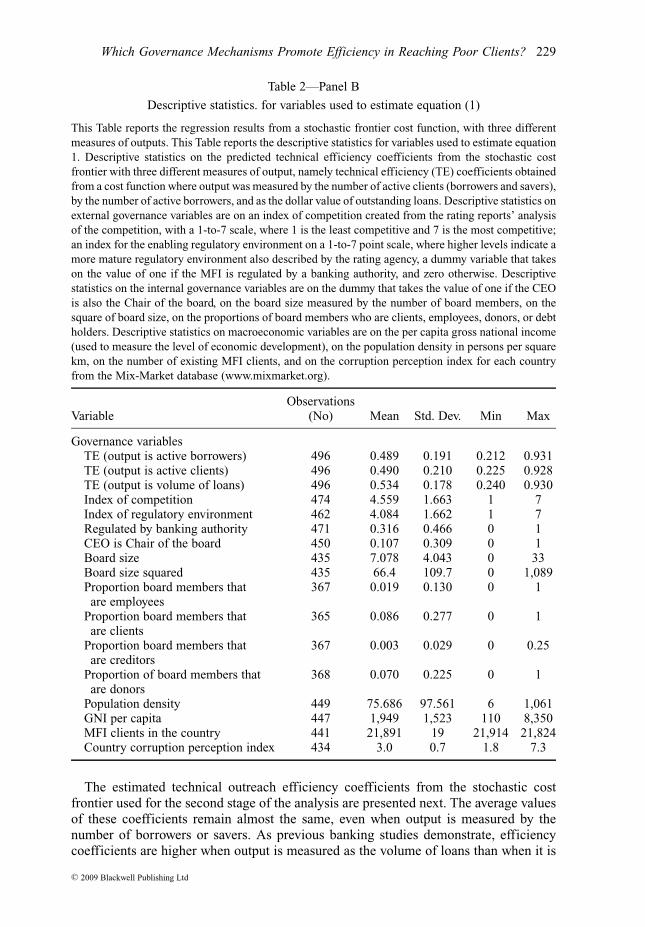
Table 2—Panel B
Descriptive statistics. for variables used to estimate equation (1)
This Table reports the regression results from a stochastic frontier cost function, with three differentmeasures of outputs. This Table reports the descriptive statistics for variables used to estimate equation1. Descriptive statistics on the predicted technical efficiency coefficients from the stochastic costfrontier with three different measures of output, namely technical efficiency (TE) coefficients obtainedfrom a cost function where output was measured by the number of active clients (borrowers and savers),by the number of active borrowers, and as the dollar value of outstanding loans. Descriptive statistics onexternal governance variables are on an index of competition created from the rating reports’ analysisof the competition, with a 1-to-7 scale, where 1 is the least competitive and 7 is the most competitive;an index for the enabling regulatory environment on a 1-to-7 point scale, where higher levels indicate amore mature regulatory environment also described by the rating agency, a dummy variable that takeson the value of one if the MFI is regulated by a banking authority, and zero otherwise. Descriptivestatistics on the internal governance variables are on the dummy that takes the value of one if the CEOis also the Chair of the board, on the board size measured by the number of board members, on thesquare of board size, on the proportions of board members who are clients, employees, donors, or debtholders. Descriptive statistics on macroeconomic variables are on the per capita gross national income(used to measure the level of economic development), on the population density in persons per squarekm, on the number of existing MFI clients, and on the corruption perception index for each countryfrom the Mix-Market database (www.mixmarket.org).
ObservationsVariable (No) Mean Std. Dev. Min Max
Governance variablesTE (output is active borrowers) 496 0.489 0.191 0.212 0.931TE (output is active clients) 496 0.490 0.210 0.225 0.928TE (output is volume of loans) 496 0.534 0.178 0.240 0.930Index of competition 474 4.559 1.663 1 7Index of regulatory environment 462 4.084 1.662 1 7Regulated by banking authority 471 0.316 0.466 0 1CEO is Chair of the board 450 0.107 0.309 0 1Board size 435 7.078 4.043 0 33Board size squared 435 66.4 109.7 0 1,089Proportion board members that 367 0.019 0.130 0 1are employees
Proportion board members that 365 0.086 0.277 0 1are clients
Proportion board members that 367 0.003 0.029 0 0.25are creditors
Proportion of board members that 368 0.070 0.225 0 1are donors
Population density 449 75.686 97.561 6 1,061GNI per capita 447 1,949 1,523 110 8,350MFI clients in the country 441 21,891 19 21,914 21,824Country corruption perception index 434 3.0 0.7 1.8 7.3
The estimated technical outreach efficiency coefficients from the stochastic costfrontier used for the second stage of the analysis are presented next. The average valuesof these coefficients remain almost the same, even when output is measured by thenumber of borrowers or savers. As previous banking studies demonstrate, efficiencycoefficients are higher when output is measured as the volume of loans than when it is
C© 2009 Blackwell Publishing Ltd

230 Valentina Hartarska and Roy Mersland
measured as the number of clients, but the difference for the average MFI in this sampleis only a few percent (53% versus 48%).
Summary statistics for internal and external governance variables are presented next.Board size is measured by the number of board members, and the square term is alsocalculated and included to capture the possible non-linear impact of this variable. Otherinternal governance variables include the proportion of clients, employees, donors, anddebt holders on the board, and a dummy that controls for a CEO’s dual role as the chairof the board. The average board in the sample consists of seven members; stakeholdergroups are included as members, but in small numbers only.4 For example, only 8% ofthe boards have employee representation and 3% have creditor representation; 11% and12% have donor and client representation, respectively (the averages for all boards being7 and 9%, respectively). This ex ante knowledge indicates that stakeholder representationis not very common in MFI boards, but this representation has been recommended, andit was important to find out if the results would show an impact. Finally, in 10% ofcases, the CEO is also the chairman of the board, indicating that there is a reasonableseparation of management and control but that the role of this duality in microfinancestill needs to be explored.
External governance mechanisms include several indexes: an index for the level ofcompetition, an index for the enabling regulatory environment and a dummy variablethat takes on the value of one if the MFI is regulated by a banking authority, and an indexof corruption perception. The level of competition is measured according to a subjectiveindex using a scale based on competition information provided in the rating reports andcompiled by the rater. We subjectively evaluate this information to indicate the level ofmarket competition on a 1-to-7-point scale, with 7 being the most competitive. Sincethe raters have multi-country experience and have rated dozens of MFIs, we expectthat they possess comparative information about countries and markets. Furthermore,since many MFIs have only local or regional coverage, proxies for a national level ofcompetition, such as relative numbers of MFI-clients or a Herfindahl type index wouldbe less reliable than this proxy.
Similarly, the influence of the enabling regulatory environment is measured by anindex of regulation that takes on values from 1 to 7, where higher levels indicate amore mature regulatory environment as judged by the rating agency in the writteninformation provided in the rating report. A dummy variable, which takes on the valueof one if the MFI is regulated by an independent banking authority, and zero otherwise,is also included in order to capture the impact of banking regulation in particular.Other controls are per capita gross national income (used to measure the level ofeconomic development), population density, number of existing MFI clients, and countrycorruption perception index from the Mix-Market database (www.mixmarket.org).
5. Discussion of the Results
We first estimate a cost frontier using all observations with available data for the variablesentering the cost function (described above). Next, the derived technical efficiency isregressed only on internal, only on external, and on both internal and external governance
4 Ex ante knowledge of the microfinance industry indicates that stakeholder representationis not very popular on MFI boards (Labie, 2001). Thus, when the rating reports providedinformation about board members, it was assumed to be worth reporting if some memberswere representing a special stakeholder group.
C© 2009 Blackwell Publishing Ltd
Which Governance Mechanisms Promote Efficiency in Reaching Poor Clients? 231
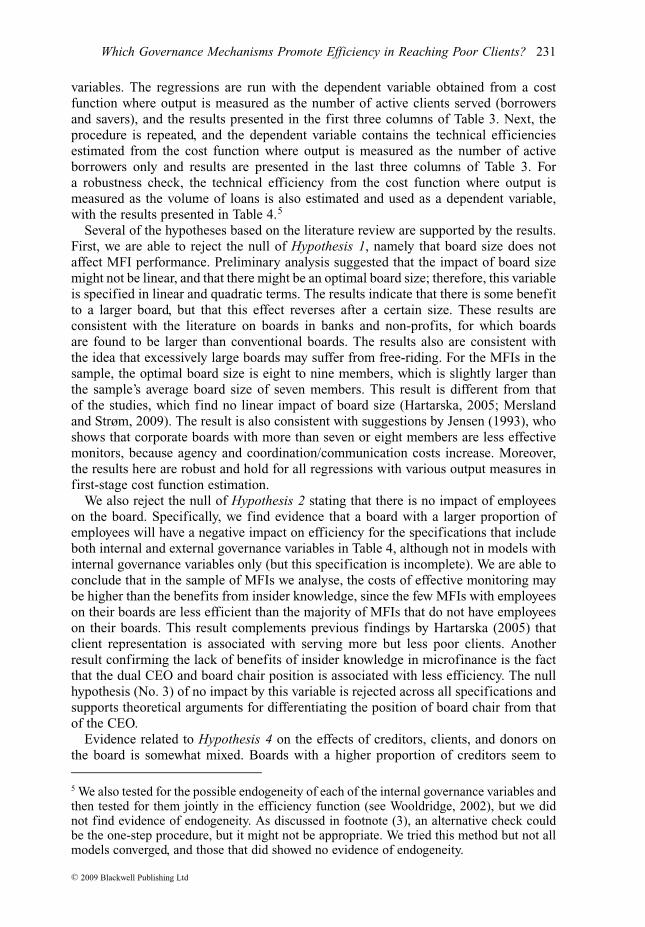
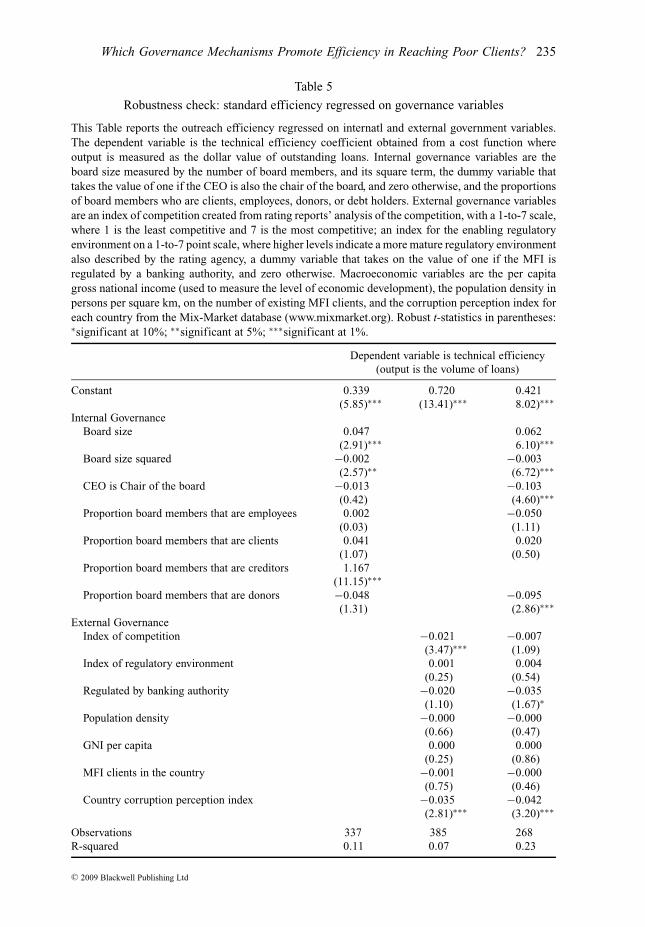
variables. The regressions are run with the dependent variable obtained from a costfunction where output is measured as the number of active clients served (borrowersand savers), and the results presented in the first three columns of Table 3. Next, theprocedure is repeated, and the dependent variable contains the technical efficienciesestimated from the cost function where output is measured as the number of activeborrowers only and results are presented in the last three columns of Table 3. Fora robustness check, the technical efficiency from the cost function where output ismeasured as the volume of loans is also estimated and used as a dependent variable,with the results presented in Table 4.5
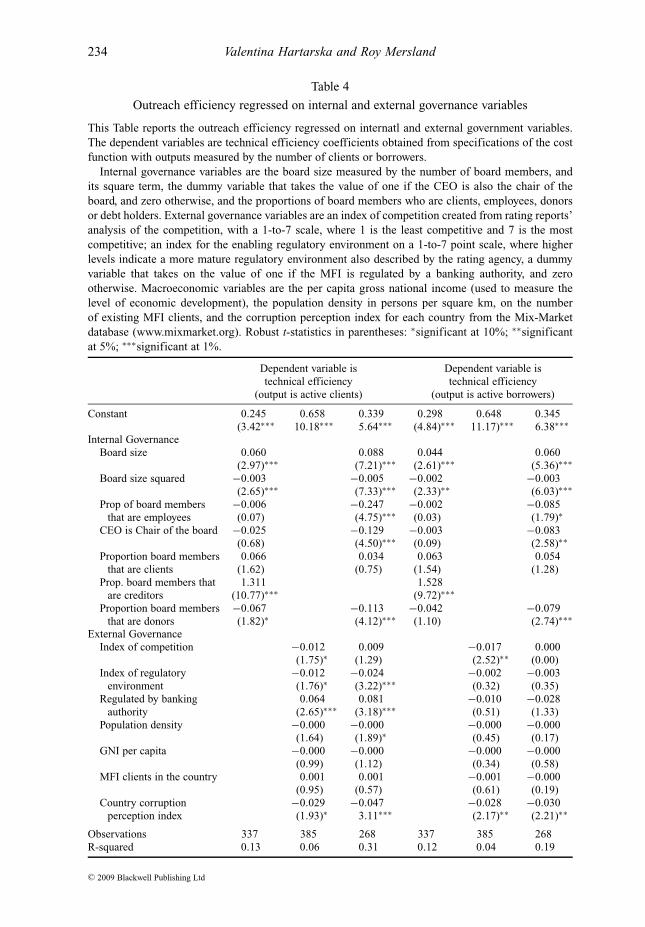
Several of the hypotheses based on the literature review are supported by the results.First, we are able to reject the null of Hypothesis 1, namely that board size does notaffect MFI performance. Preliminary analysis suggested that the impact of board sizemight not be linear, and that there might be an optimal board size; therefore, this variableis specified in linear and quadratic terms. The results indicate that there is some benefitto a larger board, but that this effect reverses after a certain size. These results areconsistent with the literature on boards in banks and non-profits, for which boardsare found to be larger than conventional boards. The results also are consistent withthe idea that excessively large boards may suffer from free-riding. For the MFIs in thesample, the optimal board size is eight to nine members, which is slightly larger thanthe sample’s average board size of seven members. This result is different from thatof the studies, which find no linear impact of board size (Hartarska, 2005; Merslandand Strøm, 2009). The result is also consistent with suggestions by Jensen (1993), whoshows that corporate boards with more than seven or eight members are less effectivemonitors, because agency and coordination/communication costs increase. Moreover,the results here are robust and hold for all regressions with various output measures infirst-stage cost function estimation.
We also reject the null of Hypothesis 2 stating that there is no impact of employeeson the board. Specifically, we find evidence that a board with a larger proportion ofemployees will have a negative impact on efficiency for the specifications that includeboth internal and external governance variables in Table 4, although not in models withinternal governance variables only (but this specification is incomplete). We are able toconclude that in the sample of MFIs we analyse, the costs of effective monitoring maybe higher than the benefits from insider knowledge, since the few MFIs with employeeson their boards are less efficient than the majority of MFIs that do not have employeeson their boards. This result complements previous findings by Hartarska (2005) thatclient representation is associated with serving more but less poor clients. Anotherresult confirming the lack of benefits of insider knowledge in microfinance is the factthat the dual CEO and board chair position is associated with less efficiency. The nullhypothesis (No. 3) of no impact by this variable is rejected across all specifications andsupports theoretical arguments for differentiating the position of board chair from thatof the CEO.
Evidence related to Hypothesis 4 on the effects of creditors, clients, and donors onthe board is somewhat mixed. Boards with a higher proportion of creditors seem to
5 We also tested for the possible endogeneity of each of the internal governance variables andthen tested for them jointly in the efficiency function (see Wooldridge, 2002), but we didnot find evidence of endogeneity. As discussed in footnote (3), an alternative check couldbe the one-step procedure, but it might not be appropriate. We tried this method but not allmodels converged, and those that did showed no evidence of endogeneity.
C© 2009 Blackwell Publishing Ltd

232 Valentina Hartarska and Roy Mersland
Table 3
Regression results from a stochastic frontier cost function, with three different
measures of outputs
This Table reports the regression results from a stochastic frontier cost function, with three differentmeasures of outputs. The dependent variable is total costs calculated as input quantities times inputprices. The cost function was estimated with three different measures of output; in the first column areresults from a specification where output is the number of active borrowers, in the second column areresults from a specification where output is the number of active clients (borrowers and savers), andthe third column contains results from a specification where output is the dollar value of outstandingloans. Other explanatory variables are the price of labour (the average annual employee salary) scaledby the price of physical capital (ratio of non-labour expense to net fixed assets), the price of financialcapital (financial costs to liability) also scaled by price of fixed capital, and their relevant interactionsshown in (3). Additional controls are MFIs’ age in years since the start of microfinance activities, MFIsize (natural logarithm of total assets), the portfolio at risk measured as loans overdue for more than30 days, a dummy variable taking the value of one if the MFI is an independent entity, and zero if apart of an international organisation; a dummy variable taking the value of one if the MFI providesonly financial services, and zero if it offers other services; a dummy variable taking the value of one ifthe MFI was set up by an international organisation, and zero otherwise; a dummy variable taking thevalue of one if the MFI targets women, and zero otherwise; and a dummy variable taking the value ofone if the MFI is organised as an NGO. t-statistics in parentheses: ∗significant at 10%; ∗∗significantat 5%; ∗∗∗significant at 1%.
Cost Cost Cost
Constant −10.849 −10.889 −11.418(−21.89)∗∗∗ (−19.52)∗∗∗ (−9.67)∗∗∗
Y (output is the number of borrowers) 0.266(8.61)∗∗∗
Y (output is the number of clients) 0.278(8.68)∗∗∗
Y (output is the volume of loans) 0.173(2.78)∗∗∗
Price of labour 0.464 0.461 0.368(19.26)∗∗∗ (18.12)∗∗∗ (14.24)∗∗∗
Price of financial capital 0.346 0.334 0.392(18.67)∗∗∗ (16.61)∗∗∗ (20.14)∗∗∗
Y∧2 0.079 0.079 0.037(5.70)∗∗∗ (6.04)∗∗∗ (2.13)∗∗
Price of labour∧2 0.042 0.034 0.062(2.67)∗∗∗ (2.07)∗∗ (3.44)∗∗∗
Price of financial capital∧2 0.118 0.111 0.111(13.25)∗∗∗ (11.34)∗∗∗ (12.08)∗∗∗
Pr of labour∗ Price of fin. capital −0.101 −0.092 −0.107(−10.12)∗∗∗ (−7.90)∗∗∗ (−10.12)∗∗∗
Y∗ Price of labour −0.004 −0.011 −0.050(−0.32) (−0.99) (−3.43)∗∗∗
Y∗ Price of financial capital −0.015 −0.014 0.024(−1.90)∗ (−1.73)∗ (2.43)∗∗
MFI age 0.006 0.001 0.006(1.45) (0.23) (1.38)
MFI size 0.634 0.636 0.641(23.83)∗∗∗ (23.37)∗∗∗ (10.37)∗∗∗
C© 2009 Blackwell Publishing Ltd

Which Governance Mechanisms Promote Efficiency in Reaching Poor Clients? 233
Table 3
Continued.
Cost Cost Cost
Risk 0.231 0.061 0.066(1.25) (0.30) (0.34)
Ownunit 0.014 0.015 0.009(0.14) (0.15) (0.08)
Purefinserv 0.092 0.072 0.042(1.18) (0.92) (0.49)
Initiated by int’l org 0.041 0.075 0.048(0.72) (1.30) (0.75)
Gender 0.093 0.120 0.273(1.50) (1.90)∗ (4.17)∗∗∗
NGO −0.003 0.056 0.010(−0.05) (0.95) (0.16)
Observations 461 443 468Chi-squared 8,386.91 8,199.92 7,577.20
be more efficient, but MFIs with a higher proportion of donors are less efficient, andthe latter lends credence to the argument that donors’ presence may ensure continuousfunding and thus impede incentives for cost minimisation and efficiency, as suggestedin Caudill et al. (2009). These results suggest that further investigation on the impactof various stakeholders is relevant and should be undertaken.
We are able to reject the null of Hypothesis 5 of no impact by regulation. MFIs inmarkets with more mature regulatory systems are less efficient in reaching more clients,but the effect seems to be driven by the ability to reach savers, since the same result is notfound in the alternative cost specifications where output is measured by the number ofactive borrowers or to the volume of loans. This suggests that in countries with a matureregulatory environment, MFIs find it more difficult to attract savers, perhaps becauseother banks collect the savings instead. This interpretation seems to be confirmed by thefact that MFIs regulated by an independent bank authority are more efficient at reachingmore clients (savers and borrowers, as in Table 3, Models 2 and 3) but less efficient atdistributing large volumes of loans (Table 4, Model 3).
The results regarding the role of competition are mixed. When only external factors areincluded in the regression, we find that MFIs in more competitive environments are lessefficient, contrary to expectations for non-financial firms as suggested by Hart (1983)and Schmidt (1997). This result does not hold when we control for internal governancefactors, however (Table 4). It seems that in the absence of effective internal mechanismsof control, competition by financial institutions and in MFIs may harm efficiency, sincelenders rely on long-term relationship to enforce contracts, and when the value of therelationship is destroyed by more lenders, MFIs are less efficient (Gorton and Winton,2003; McIntosh and Wydick, 2005). However, since the measure of competition is anindex based on raters’ opinions, the lack of impact by this variable suggests that ratersmay not be as well-informed about the market as expected (Hartarska and Nadolnyak,2008).
We also find that countries with a higher level of corruption have less efficientMFIs, while other environmental factors do not seem to affect efficiency. Microfinance
C© 2009 Blackwell Publishing Ltd
234 Valentina Hartarska and Roy Mersland
Table 4
Outreach efficiency regressed on internal and external governance variables
This Table reports the outreach efficiency regressed on internatl and external government variables.The dependent variables are technical efficiency coefficients obtained from specifications of the costfunction with outputs measured by the number of clients or borrowers.
Internal governance variables are the board size measured by the number of board members, andits square term, the dummy variable that takes the value of one if the CEO is also the chair of theboard, and zero otherwise, and the proportions of board members who are clients, employees, donorsor debt holders. External governance variables are an index of competition created from rating reports’analysis of the competition, with a 1-to-7 scale, where 1 is the least competitive and 7 is the mostcompetitive; an index for the enabling regulatory environment on a 1-to-7 point scale, where higherlevels indicate a more mature regulatory environment also described by the rating agency, a dummyvariable that takes on the value of one if the MFI is regulated by a banking authority, and zerootherwise. Macroeconomic variables are the per capita gross national income (used to measure thelevel of economic development), the population density in persons per square km, on the numberof existing MFI clients, and the corruption perception index for each country from the Mix-Marketdatabase (www.mixmarket.org). Robust t-statistics in parentheses: ∗significant at 10%; ∗∗significantat 5%; ∗∗∗significant at 1%.
Dependent variable is Dependent variable istechnical efficiency technical efficiency
(output is active clients) (output is active borrowers)
Constant 0.245 0.658 0.339 0.298 0.648 0.345(3.42∗∗∗ 10.18∗∗∗ 5.64∗∗∗ (4.84)∗∗∗ 11.17)∗∗∗ 6.38∗∗∗
Internal GovernanceBoard size 0.060 0.088 0.044 0.060
(2.97)∗∗∗ (7.21)∗∗∗ (2.61)∗∗∗ (5.36)∗∗∗Board size squared −0.003 −0.005 −0.002 −0.003
(2.65)∗∗∗ (7.33)∗∗∗ (2.33)∗∗ (6.03)∗∗∗Prop of board members −0.006 −0.247 −0.002 −0.085
that are employees (0.07) (4.75)∗∗∗ (0.03) (1.79)∗CEO is Chair of the board −0.025 −0.129 −0.003 −0.083
(0.68) (4.50)∗∗∗ (0.09) (2.58)∗∗Proportion board members 0.066 0.034 0.063 0.054
that are clients (1.62) (0.75) (1.54) (1.28)Prop. board members that 1.311 1.528
are creditors (10.77)∗∗∗ (9.72)∗∗∗Proportion board members −0.067 −0.113 −0.042 −0.079
that are donors (1.82)∗ (4.12)∗∗∗ (1.10) (2.74)∗∗∗External Governance
Index of competition −0.012 0.009 −0.017 0.000(1.75)∗ (1.29) (2.52)∗∗ (0.00)
Index of regulatory −0.012 −0.024 −0.002 −0.003environment (1.76)∗ (3.22)∗∗∗ (0.32) (0.35)
Regulated by banking 0.064 0.081 −0.010 −0.028authority (2.65)∗∗∗ (3.18)∗∗∗ (0.51) (1.33)
Population density −0.000 −0.000 −0.000 −0.000(1.64) (1.89)∗ (0.45) (0.17)
GNI per capita −0.000 −0.000 −0.000 −0.000(0.99) (1.12) (0.34) (0.58)
MFI clients in the country 0.001 0.001 −0.001 −0.000(0.95) (0.57) (0.61) (0.19)
Country corruption −0.029 −0.047 −0.028 −0.030perception index (1.93)∗ 3.11∗∗∗ (2.17)∗∗ (2.21)∗∗
Observations 337 385 268 337 385 268R-squared 0.13 0.06 0.31 0.12 0.04 0.19
C© 2009 Blackwell Publishing Ltd
Which Governance Mechanisms Promote Efficiency in Reaching Poor Clients? 235
Table 5
Robustness check: standard efficiency regressed on governance variables
This Table reports the outreach efficiency regressed on internatl and external government variables.The dependent variable is the technical efficiency coefficient obtained from a cost function whereoutput is measured as the dollar value of outstanding loans. Internal governance variables are theboard size measured by the number of board members, and its square term, the dummy variable thattakes the value of one if the CEO is also the chair of the board, and zero otherwise, and the proportionsof board members who are clients, employees, donors, or debt holders. External governance variablesare an index of competition created from rating reports’ analysis of the competition, with a 1-to-7 scale,where 1 is the least competitive and 7 is the most competitive; an index for the enabling regulatoryenvironment on a 1-to-7 point scale, where higher levels indicate a more mature regulatory environmentalso described by the rating agency, a dummy variable that takes on the value of one if the MFI isregulated by a banking authority, and zero otherwise. Macroeconomic variables are the per capitagross national income (used to measure the level of economic development), the population density inpersons per square km, on the number of existing MFI clients, and the corruption perception index foreach country from the Mix-Market database (www.mixmarket.org). Robust t-statistics in parentheses:∗significant at 10%; ∗∗significant at 5%; ∗∗∗significant at 1%.
Dependent variable is technical efficiency(output is the volume of loans)
Constant 0.339 0.720 0.421(5.85)∗∗∗ (13.41)∗∗∗ 8.02)∗∗∗
Internal GovernanceBoard size 0.047 0.062
(2.91)∗∗∗ 6.10)∗∗∗
Board size squared −0.002 −0.003(2.57)∗∗ (6.72)∗∗∗
CEO is Chair of the board −0.013 −0.103(0.42) (4.60)∗∗∗
Proportion board members that are employees 0.002 −0.050(0.03) (1.11)
Proportion board members that are clients 0.041 0.020(1.07) (0.50)
Proportion board members that are creditors 1.167(11.15)∗∗∗
Proportion board members that are donors −0.048 −0.095(1.31) (2.86)∗∗∗
External GovernanceIndex of competition −0.021 −0.007
(3.47)∗∗∗ (1.09)Index of regulatory environment 0.001 0.004
(0.25) (0.54)Regulated by banking authority −0.020 −0.035
(1.10) (1.67)∗
Population density −0.000 −0.000(0.66) (0.47)
GNI per capita 0.000 0.000(0.25) (0.86)
MFI clients in the country −0.001 −0.000(0.75) (0.46)
Country corruption perception index −0.035 −0.042(2.81)∗∗∗ (3.20)∗∗∗
Observations 337 385 268R-squared 0.11 0.07 0.23
C© 2009 Blackwell Publishing Ltd
236 Valentina Hartarska and Roy Mersland
policymakers argue that the environment matters, but we still do not know whichenvironmental factors do matter and how, and we do not find empirical evidence forthe factors studied here. At the same time, the lack of environmental influence mayalso support the argument that microfinance is less influenced by the macroeconomicenvironment, since it applies different loan methodologies, the institutions are oftenoperated by non-profits, and they serve more customers operating in the informal sectorthan do regular banks (Krauss and Walter, 2008).
6. Conclusions
The popularity of microfinance has attracted a great deal of attention and money, and ithas prompted investors, traditional donors, and governments to look for effective controlmechanisms to ensure that MFIs make the best use of scarce resources. Recent papershave indicated that governance affects the outreach and sustainability dimensions ofperformance (Hartarska, 2005; Mersland and Strøm, 2009). This paper evaluates theimpact of governance on a measure of performance that combines the dual objectivesof MFIs, outreach, and sustainability.
We use a quasi-intermediation approach similar to that used to study cost efficiencyin financial intermediaries. MFI performance is measured by individual technicalefficiency coefficients, obtained from a stochastic cost frontier estimation, that capturethe cost minimisation objective and, within the cost function, we measure output as thenumber of clients (savers and borrowers, and borrowers only) to capture the objectiveof serving as many clients as possible. The cost efficiency coefficients are transformedinto individual technical efficiency coefficients and regressed on internal and externalgovernance variables in a two-step procedure. The internal governance factors are boardsize, managerial capture of the board, and representation by various stakeholders. Theexternal factors are competition and regulation.
We find that some governance mechanisms suggested by the literature influenceMFIs’ efficiency. In particular, MFIs in which the positions of the CEO and board chairare merged are less efficient; similarly, MFIs with a larger proportion of insiders on theboard are less efficient. We also find that managerial efficiency increases with board sizeup to nine members and decreases after that. The evidence also suggests that donors’presence on the board is not beneficial, while that of creditors improves efficiency.The latter result should, however, be interpreted with caution, since very few MFIs inthis sample have creditors as directors, but perhaps this warrants further study. We donot find consistent evidence that the information on external governance mechanismsprovided by rating agencies improves efficiency, although we do find weak evidencethat MFIs in countries with a mature regulatory environment could reach more clients,mainly by operating as regulated financial institutions.
These findings indicate that most MFIs have already organised their internal gover-nance relatively successfully. Improvements could be obtained by separating the positionof CEO from that of board chair, minimising the presence of insiders and donors, andperhaps encouraging the presence of creditors, as well as by expanding the board toinclude no more than nine representatives. Since the poverty level of clients is notcaptured in this study, future work could build on this approach and develop a measureof performance that also accounts for this dimension of MFI outreach. In addition, furtherstudies and better data are needed to understand how MFI efficiency is influenced byexternal governance mechanisms, such as competition and regulation.
C© 2009 Blackwell Publishing Ltd

Which Governance Mechanisms Promote Efficiency in Reaching Poor Clients? 237
References
Adams, R. and Mehran, H., ‘Is bank holding company governance different?’ Economic Policy Review,Vol. 9(1), 2003, pp. 123–42.
Armendariz de Aghion, B. and Morduch, J., The Economics of Microfinance (Cambridge and London:MIT Press, 2005).
Battese, G. E. and Coelli, T. J., ‘A model of technical inefficiency effects in a stochastic frontierproduction function for panel data’, Empirical Economics, Vol. 20(2), 1995, pp. 325–32.
Berger, A., DeYoung, R. and Udell, G., ‘Efficiency barriers to the consolidation of the Europeanfinancial services industry’, European Financial Management, Vol. 7(1), 2001, pp. 117–30.
Berger, A. and Mester, L., ‘Inside the black box: what explains differences in the efficiencies offinancial institutions?’, Journal of Banking and Finance, Vol. 21, 1997, pp. 895–947.
Besley, T. and Ghatak, M., ‘Competition and incentives with motivated agents’, CEPR DiscussionPapers, no. 46412004 (London, 2004).
Bhagat, S. and Jefferie, R., The Econometrics of Corporate Governance Studies (Cambridge, MA:The MIT Press, 2002).
Boone, A., Field, L., Karpoff, J. and Raheja, C., ‘The determinants of corporate board size andcomposition: an empirical analysis’, Journal of Financial Economics, Vol. 85(1), 2007, pp. 66–101.
Bos, J. W. B. and Kool, C. J. M., ‘Bank efficiency: the role of bank strategy and the local marketsconditions’, Journal of Banking and Finance, Vol. 30, 2006, pp. 1953–74.
Caudill, G., Gropper, D. and Hartarska, V., ‘Which microfinance institutions are becoming more cost-effective with time? Evidence from a mixture model’, Journal of Money, Credit, and Banking,Vol. 41(4), 2009, pp. 651–72.
Cheng, S., ‘Board size and the variability of corporate performance’, Journal of Financial Economics,Vol. 87(1), 2008, pp. 157–76.
Coelli, T., Prasda Rao, D. S. and Battesse, G. E., An Introduction to Efficiency and ProductivityAnalysis (Dordecht, The Netherlands: Kluwer Academic Publishers, 2005).
Coles, J. L. D., Naveen, D. and Naveen, L., ‘Boards: does one size fit all?’, Journal of FinancialEconomics, Vol. 87(2), 2008, pp. 329–56.
Cornett, A. M. and Tehranian, H., ‘Corporate governance and pay-for-performance: the impact ofearnings management’, Journal of Financial Economics, Vol. 87(2), 2008, pp. 357–73.
CSFI, ‘Microfinance banana skins – risk in a booming industry’, in A. Hilton, ed., Banking BananaSkins Report (New York: Center for the Study of Financial Innovation, 2008), pp. 1–41.
DeYoung, R., Spong, K. and Sullivan, R., ‘Who is minding the store? Motivating and monitoringmanagers at small, closely held commercial banks’, Journal of Banking and Finance, Vol. 25, 2001,pp. 1209–43.
Eisenberg, T., Sundgren, S. and Wells, M., ‘Larger board size and decreasing firm value in smallfirms’, Journal of Financial Economics, Vol. 48, 1998, pp. 35–54.
Fama, E. and Jensen, M., ‘Ownership and control’, Journal of Law and Economics, Vol. 26, 1983a,pp. 349–71.
Fama, E. and Jensen, M., ‘Agency problems and residual claimants’, Journal of Law and Economics,Vol. 26, 1983b, pp. 327–49.
Fauver, L. and Fuerst, M. E., ‘Does good corporate governance include employee representation?Evidence from German corporate boards’, Journal of Financial Economics, Vol. 82(3), 2006,pp. 673–710.
Fries, S. and Taci, A., ‘Cost efficiency of banks in transition: Evidence from 289 banks in 15 post-communist countries’, Journal of Banking and Finance, Vol. 29, 2005, pp. 55–81.
Gorton, G. and Schmidt, F. A., ‘Universal banking and the performance of German firms’, Journal ofFinancial Economics, Vol. 58(1–2), 2000, pp. 29–80.
Gorton, G. and Winton, A., Financial Intermediation Handbook of the Economics of Finance,Corporate Finance, Handbooks in Economics, Vol. 21 (Amsterdam, North Holland: Elsevier,Vol. 1A, 2003), pp. 431–552.
Greene, W., Stochastic frontier estimation with panel data: a report (WHO, 2002).
C© 2009 Blackwell Publishing Ltd

238 Valentina Hartarska and Roy Mersland
Handy, F., ‘Reputation as collateral: an economic analysis of the role of trustees of nonprofits’,Nonprofit and Voluntary Sector Quarterly, Vol. 24(4), 1995, pp. 293–305.
Hart, O., ‘The market mechanism as an incentive scheme’, Bell Journal of Economics, Vol. 14, 1983,pp. 366–82.
Hartarska, V., ‘Three essays on financial services for the poor’, Ph.D. Dissertation (Columbus, OH:The Ohio State University, 2002).
Hartarska, V., ‘Governance and performance of microfinance institutions in Central and Eastern Europeand the Newly Independent States’, World Development, Vol. 33, 2005, pp. 1627–1643.
Hartarska, V., ‘The impact of outside control in microfinance’, Managerial Finance, Vol. 35(12), 2009,pp. 975–89.
Hartarska, V. and Holtmann, M., ‘An overview of recent developments in the microfinance literature’,Agricultural Finance Review, Vol. 66(2), 2006, pp. 147–65.
Hartarska, V. and Nadolnyak, D., ‘Do regulated microfinance institutions achieve better sustainabilityand outreach? Cross-country evidence’, Applied Economics, Vol. 39(10–12), 2007, pp. 1207–22.
Hartarska, V. and Nadolnyak, D., ‘Does rating help microfinance institutions raise funds? Cross-countryevidence’, International Review of Economics and Finance, Vol. 17(4), 2008, pp. 558–571.
Hermalin, B. E. and Weisbach, M. S., ‘Endogenously chosen boards of directors and their monitoringof the CEO’, American Economic Review, Vol. 88(1), 1998, pp. 96–118.
Hermalin, B. E. and Weisbach, M. S., ‘Board of directors as an endogenously determined institution:a survey of the economic literature’, Economic Policy Review, Vol. 9(1), 2003, pp. 7–20.
Herrmann, M. and Frank, G., ‘Performance and policy of foundation-owned firms in Germany’,European Financial Management, Vol. 8(3), 2002, pp. 261–79.
Jensen, M., ‘The modern industrial revolution, exit, and the failure of internal control system’, Journalof Finance, Vol. 48(3), 1993, pp. 831–80.
Krauss, N. A. and Walter, I., ‘Can microfinance reduce portfolio volatility?’, Working Paper No.FIN-06–034 (New York University, 2008). Available at http://ssrn.com/abstract=1300771.
Kroszner, R. S. and Strahan, P. E., ‘Bankers on boards: monitoring, conflicts of interest, and lenderliability’, Journal of Financial Economics, Vol. 62(3), 2001, pp. 415–52.
Kumbhakar, S. C. and Lovell, C. A., Stochastic Frontier Analysis (Cambridge and New York:Cambridge University Press, 2000).
Labie, M., ‘Corporate governance in microfinance organizations: a long and winding road’, Manage-ment Decision, Vol. 39, 2001, pp. 296–301.
Lensink, R. and Mersland, R., ‘Microfinance only or microfinance plus – does it matter forthe microbank?’ First European research conference on microfinance,2–4 June 2009, Brussels,Belgium.
Linck, J. S., Netter, J. M. and Yang, T., ‘The determinants of board structure’, Journal of FinancialEconomics, Vol. 87(2), 2008, pp. 308–28.
Mayers, D., Shivdasani, A. and Smith, Jr., C. W., ‘Board composition and corporate control: evidencefrom the insurance industry’, Journal of Business, Vol. 70(1), 1997, pp. 33–62.
McIntosh, C. and Wydick, B., ‘Competition and microfinance’, Journal of Development Economics,Vol. 78, 2005, pp. 271–98.
Mersland, R., ‘The cost of ownership in microfinance organizations’, World Development, Vol. 37(2),2009, pp. 469–78.
Mersland, R. and Strøm, R.Ø., ‘Performance and trade-offs in microfinance institutions – doesownership matter?’, Journal of International Development, Vol. 20(5), 2008, pp. 598–612.
Mersland, R. and Strøm, R.Ø., ‘Performance and governance in microfinance institutions’, Journal ofBanking and Finance, Vol. 33(4), 2009, pp. 662–69.
Oster, S. and O’Reagan, K., ‘Does structure and compensation of the board matter? The case ofnonprofit organizations’, Working Paper (Yale School of Management, 2004).
Otero, M. and Chu, M., ‘Governance and ownership of microfinance institutions’, in D. Drake andE. Rhyne, eds, The Commercialization of Microfinance (Bloomfield, CT: Kumarian Press, 2002),pp. 220–45.
C© 2009 Blackwell Publishing Ltd
Which Governance Mechanisms Promote Efficiency in Reaching Poor Clients? 239
Pathan, S., Skully, M. and Wickramanayake, J., ‘Board size, independence, and performance: ananalysis of Thaisibanks, Asia-Pacific Financial Markets, Vol. 14(3), 2007, pp. 211–27.
Porteous, D., ‘Competition and microcredit interest rates’, Focus Note 33 (CGAP, Washington, 2006),pp. 1–16.
Rosenstein, S. and Wyatt, J., ‘Inside directors, board effectiveness, and shareholder wealth’, Journalof Financial Economics, Vol. 44(2), 1997, pp. 229–50.
Schmidt, K. M., ‘Managerial incentives and product market competition’, Review of Economic Studies,Vol. 64, 1997, pp. 191–213.
Schmidt, R. H. and Tyrell, M., ‘Financial systems, corporate finance, and corporate governance’,European Financial Management, Vol. 3(3), 1997, pp. 333–61.
Wooldridge, J. M., Econometric Analysis of Cross Section and Panel Data (Cambridge and London:MIT Press, 2002).
Yermack, D., ‘Higher valuation of companies with a small board of directors’, Journal of FinancialEconomics, Vol. 40, 1996, pp. 185–212.
C© 2009 Blackwell Publishing Ltd