which aging group prone to have inadequate nutrient intake?: tua
TRANSCRIPT

Sains Malaysiana 45(9)(2016): 1381–1391
Which Aging Group Prone to Have Inadequate Nutrient Intake?: TUA Study(Kumpulan Penuaan yang Mana Lebih Cenderung Terhadap Pengambilan
Nutrien yang tidak Mencukupi?: Kajian TUA)
NIK NUR IZZATI NIK MOHD FAKHRUDDIN, SUZANA SHAHAR*, NURUL ATIQAH ABD AZIZ, HANIS MASTURA YAHYA & ROSLEE RAJIKAN
ABSTRACT
Older adults quite often had an inadequate diet leading to micronutrient deficiencies and impaired immune response with subsequent development of degenerative diseases. This study aimed to determine the adequacy of energy and nutrient intake and its distribution among three aging groups i.e. successful aging (SA), usual aging (UA) and mild cognitive impairment (MCI). This is a cross-sectional study involving a large sample size (n = 2322) of older adults recruited through multistage random sampling from four states of Malaysia. An interview was conducted to measure dietary intake, neurocognitive status and functional status by using the Diet History Questionnaire (DHQ), Mini-Mental State Examination (MMSE), Rey Auditory Learning Test (RAVLT), Geriatric Depression Scale (GDS), Instrumental Activity of Daily Living (IADL) and Quality of Life Questionnaire. For comparison of dietary intake, a sub-sample of 173 respondents from each aging groups were matched and selected using a comparative cross-sectional approach. Women in SA group had the highest mean intake of vitamin A, calcium (p <0.05), vitamin C, riboflavin and iron (p<0.001). The same aging group also achieved the highest RNI percentage for the same nutrients. More than 80% of respondents for all aging groups did not met the recommended nutrient intake (RNI) for vitamin E, thiamin, niacin, folate, calcium and zinc. In women, MCI respondents were more likely to have an inadequate intake of vitamin A, C, riboflavin and iron followed by UA and SA. Inadequate vitamin E, niacin, folate and calcium were prevalent among all gender and aging groups. There is a need to further distinguish specific dietary patterns associated with these three aging groups to promote optimal nutrient intake for cognitive health.
Keywords: Elderly; mild cognitive impairment; nutrients intake; successful ageing; usual ageing
ABSTRAK
Warga tua seringkali mengambil diet yang tidak mencukupi yang membawa kepada masalah kekurangan nutrien serta menjejaskan tindak balas imun dan menjurus kepada berlakunya penyakit degeneratif. Kajian ini bertujuan untuk menentukan pengambilan tenaga dan nutrien serta pengagihannya dalam kalangan tiga kumpulan penuaan iaitu penuaan berjaya (SA), penuaan biasa (UA) dan kecelaan kognitif ringan (MCI). Kajian hirisan lintang ini melibatkan saiz sampel warga tua yang besar (n=2322) yang dipilih berdasarkan persampelan rawak pelbagai peringkat dari empat buah negeri di Malaysia. Temu bual telah dijalankan untuk mengukur pengambilan makanan, status neurokognitif serta status kefungsian dengan menggunakan Soal Selidik Sejarah Diet (DHQ), Pemeriksaan Keadaan Mental Mini (MMSE), Ujian Pembelajaran Lisan Pendengaran Rey (RAVLT), Skala Kekecewaan Geriatrik (GDS), Alatan Aktiviti Hidup Seharian (IADL) dan Soal Selidik Kualiti Hidup. Bagi perbandingan antara kumpulan penuaan, sebanyak 173 sub sampel daripada setiap kumpulan telah dipadankan dan dipilih menggunakan pendekatan perbandingan hirisan lintang. Wanita dari kumpulan SA mempunyai min pengambilan vitamin A, kalsium (p<0.05), vitamin C, riboflavin dan zat besi (p<0.001) yang paling tinggi. Kumpulan penuaan yang sama juga mencapai peratusan Saranan Pengambilan Makanan (RNI) yang paling tinggi bagi nutrien tersebut. Lebih daripada 80% subjek untuk semua kumpulan penuaan tidak mencapai saranan bagi vitamin E, tiamin, niasin, folat, kalsium dan zink. Pengambilan vitamin A, C, riboflavin dan niasin yang tidak mencukupi lebih cenderung terjadi dalam kalangan wanita daripada kumpulan MCI, diikuti UA dan SA. Kesimpulannya, pengambilan vitamin E, niasin, folat dan kalsium yang tidak mencukupi lazim terjadi dalam kalangan semua jantina dan kumpulan penuaan. Oleh itu, terdapat keperluan dalam menetukan corak pemakanan yang lebih spesifik yang berkaitan dengan kumpulan penuaan tersebut bagi menggalakkan pengambilan nutrien yang optimum bagi kesihatan kognitif.
Kata kunci: Kecelaan kognitif ringan; pengambilan nutrien; penuaan berjaya; penuaan biasa; warga tua

1382
INTRODUCTION
Studies focusing on health-related behaviors frequently examine how a particular health-related behavior, such as caloric intake or regularity of physical activity, associated with successful aging, such as longevity, subjective well-being, or physical health. Recently, in addition to antioxidants (Wong et al. 2010), vitamin B (Doets et al. 2013; Vogiatzoglou et al. 2013), omega-3 fatty acid (Solfrizzi et al. 2010, 2009) i.e. EPA and DHA (Van Gelder et al. 2007) and folate (Morris et al. 2005), nutrients including calcium, magnesium and potassium have also been associated with risk of cognitive decline (Cherbuin et al. 2014). Definition of Mild Cognitive Impairment (MCI) was derived by Mayo Clinic (Petersen et al. 1999) which includes self-or informant-reported memory complaint, objective memory complaint, essentially preserved general cognitive functioning, preserved independence in functional abilities and absence of dementia. MCI was detected among 21.1% of urban elderly from low to middle housing residential areas in Cheras, Selangor and were associated with hypercholesterolemia in men and married status, no exercise practice, overweight and obesity in women (Lee et al. 2012). In a study of more than 2000 older individuals in Malaysia, the prevalence of successful agers was 13.8%, particularly among those in younger age, Chinese and had a higher education level and income (Hamid et al. 2012). However, little is known about the association between dietary inadequacy with cognitive decline and successful aging. Dietary intake known to be implicated in biological processes associated with vascular and Alzheimer’s pathology and may contribute to disease progression earlier in the disease process and require further attention. Since diet is highly modifiable and exerts its influence over the lifespan, it is imperative to have a better understanding on the association between SA, UA and MCI with energy and nutrient intake by which intervention are most likely to be effective. In this study, we have examined the data collected from a large population based sample (n=2322), of which 193 respondents from each aging groups were matched and selected for comparative cross-sectional study of nutrient intake and its adequacy in relation to cognition and successful aging.
MATERIALS AND METHODS
STUDY DESIGN AND RESPONDENTS
This is a large population based cross-sectional study among 2322 individuals aged 60 years and above recruited from four states of Malaysia namely Kelantan, Selangor, Perak and Johor, recruited through multistage random sampling between May 2013 and February 2014. These states were selected on the basis of random sampling. Malaysian elderly i.e. Malay, Chinese, or Indian and others aged 60 years and above were included in the study. Exclusion criteria include bedridden, had psychiatric problem such as depression, dementia, mute and deaf.
There were 123 respondents who did not meet the criteria due to MMSE score of less than 14, thus indicating dementia (MOH 2009). Out of 2199 respondents, 2073 have completed Diet History Questionnaire and were included in this analysis. There were 13 subjects who were excluded due to incomplete neurocognitive test and they were not assigned in any group. Further comparative cross-sectional study was used to perform energy and dietary intake analysis according to three aging groups, namely SA, UA and MCI. Respondents in the three groups were matched for gender, age (± 10 years) and ethnicity. A household visit was conducted to invite selected respondents to participate in health screening held at respective community centers, of which detail description of the methods has been published elsewhere (Shahar et al. 2015). The project was approved by the Research Ethics Committee of Universiti Kebangsaan Malaysia (UKM 1.5.3.5/244/NN-060-2013). Written inform consent to participate in the study was obtained from all respondents.
SOCIO-DEMOGRAPHIC VARIABLES
A pre-tested questionnaire was used to obtain socio-demographic information which includes gender, ethnicity, religion, age, marital status, years of formal education, living status and smoking and alcohol intake through face to face interview.
CLASSIFICATION OF SA, UA AND MCI
Respondents were classified according to particular aging groups according to study reported by Shahar et al. (2015).
DIETARY ASSESSMENT
Respondents were interviewed face to face to obtain their usual intake of food and drinks within a week using a validated Diet History Questionnaire (Shahar et al. 2000). Probing technique was applied to obtain information on the types of food and drinks, method of preparation, ingredients and amount for each food items consumed by the respondents. The amount of food consumed was estimated using household measurements such as cups, spoons, glass, bowls and plates. In addition, food atlas (Suzana et al. 2015) was used to facilitate identification of foods consumed. Assistance from family members was obtained for respondents who were unable to recall exactly the amount of food consumed. At the end of the session, the interviewers review the entire questionnaire with the respondents in order to ensure accuracy of the data collected.
DIETARY DATA ANALYSIS
Energy and nutrient composition of food consumed by each respondent was calculated using Nutritionist Pro Version 3.1.0 software. Foods that are not available in the software were computed manually according to standard recipes. Energy and nutrient content of these recipes were
1383
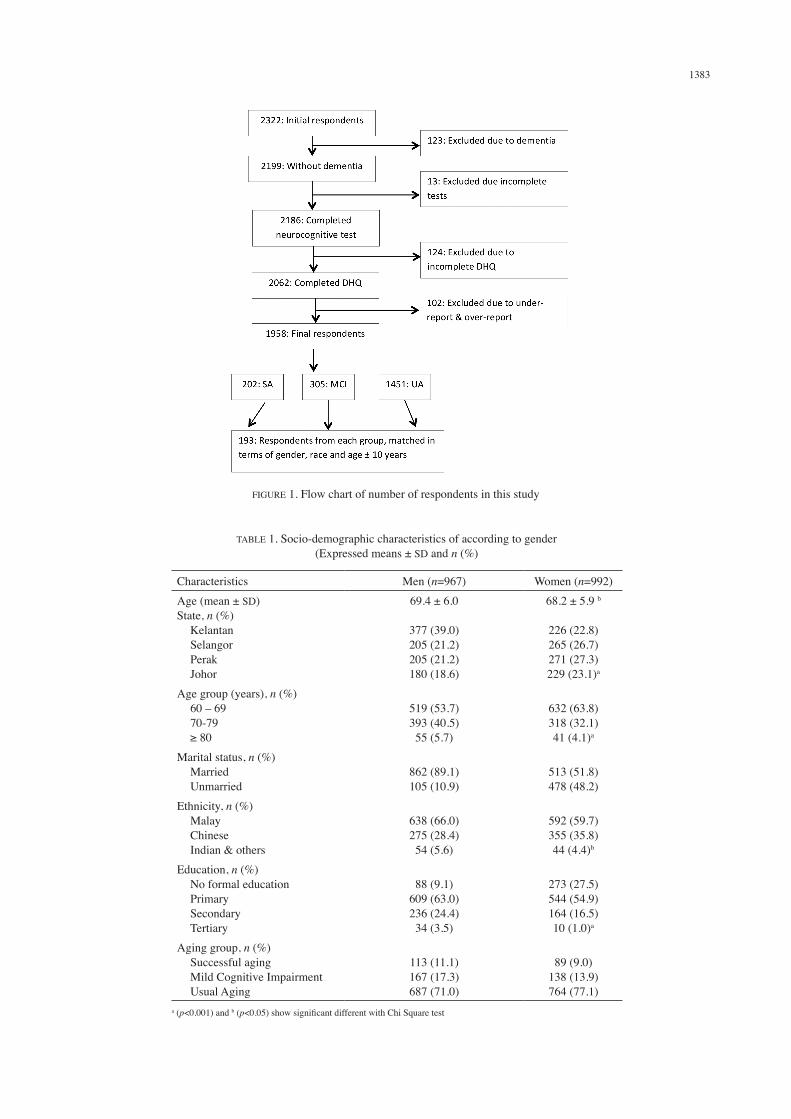
FIGURE 1. Flow chart of number of respondents in this study
TABLE 1. Socio-demographic characteristics of according to gender (Expressed means ± SD and n (%)
Characteristics Men (n=967) Women (n=992)Age (mean ± SD)State, n (%) Kelantan Selangor Perak Johor
69.4 ± 6.0
377 (39.0)205 (21.2)205 (21.2)180 (18.6)
68.2 ± 5.9 b
226 (22.8)265 (26.7)271 (27.3)229 (23.1)a
Age group (years), n (%) 60 – 69 70-79 ≥ 80
519 (53.7)393 (40.5)55 (5.7)
632 (63.8)318 (32.1)41 (4.1)a
Marital status, n (%) Married Unmarried
862 (89.1)105 (10.9)
513 (51.8)478 (48.2)
Ethnicity, n (%) Malay Chinese Indian & others
638 (66.0)275 (28.4)54 (5.6)
592 (59.7)355 (35.8)44 (4.4)b
Education, n (%) No formal education Primary Secondary Tertiary
88 (9.1)609 (63.0)236 (24.4)34 (3.5)
273 (27.5)544 (54.9)164 (16.5)10 (1.0)a
Aging group, n (%) Successful aging Mild Cognitive Impairment Usual Aging
113 (11.1)167 (17.3)687 (71.0)
89 (9.0)138 (13.9)764 (77.1)
a (p<0.001) and b (p<0.05) show significant different with Chi Square test

1384
analysed using the Malaysian Food Composition Tables (Tee et al. 1997) and the values were entered into the Nutritionist Pro software.
EVALUATION OF UNDER AND OVER-REPORTING
Respondents with reported energy intake below 2.5th percentile and 97.5th percentile were used to examine the prevalence of under and over-reporting (Konstantinova et al. 2008). Out of 2060, 102 respondents who were under and over reports were excluded from further analyses. Therefore, 1958 respondents were included in overall dietary analysis and 579 respondents for dietary analysis according to age groups (Figure 1).
DIETARY ADEQUACY
The results obtained from the dietary analyses were then compared to the Recommended Nutrient Intakes (RNIs) for Malaysians (NCFFN 2005) to determine dietary adequacy.
STATISTICAL ANALYSIS
All statistical analyses were performed using SPSS version 22.0 for Windows (SPSS Inc.). Data from Nutritionist Pro were transferred to SPSS. The nutrient intake distributions were presented in mean ± SD to characterize population intake levels for gender. One-way ANOVA was tested to observe the significant mean difference according to age groups. Descriptive data were showed in percentage and Chi Square Test.
RESULTS
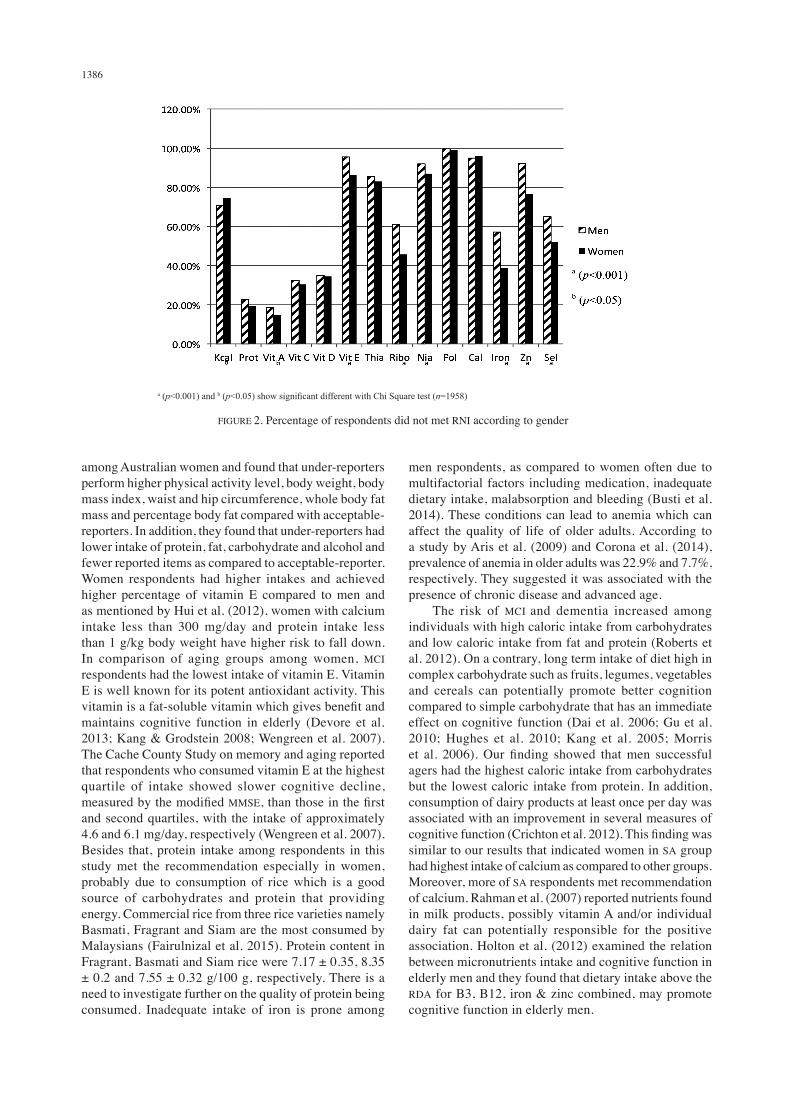
A total of 1958 respondents were included in the present analysis. As shown in Table 1, this study involved 50.6% women and 49.4% men, with men were significantly older than women (p<0.001). As expected, majority of the respondents were Malays, from Kelantan, with age ranged from 60 to 69 years old. In terms of marital status, majority of men were married. A total of 63.0% of men and 54.9% of women had primary education (p<0.001). In further subsample comparative cross-sectional analysis according to three aging groups, men from SA group were the youngest, followed by UA and MCI. Among women respondents, there was a significant difference in mean age between UA and MCI respondents, i.e. 69.1 ± 5.4 and 67.7 ± 5.2 years old, respectively (p<0.001). Both MCI men and women respondents had lower education years compared to UA respondents. There were 11 men and 2 women respondents in neither of the group in which their data to evaluate for aging groups were incomplete. Table 2 shows that energy intake of men (1770 ± 423 kcal/day) were significantly higher than women (1536 ± 369 kcal/day) (p<0.05). The energy intake for both gender did not meet recommendations. In our study, there were 2.4% and 2.5% respondents with under and over-reporting of energy intake, respectively. Mean intake for protein, carbohydrate, fat, niacin, iron and zinc was also
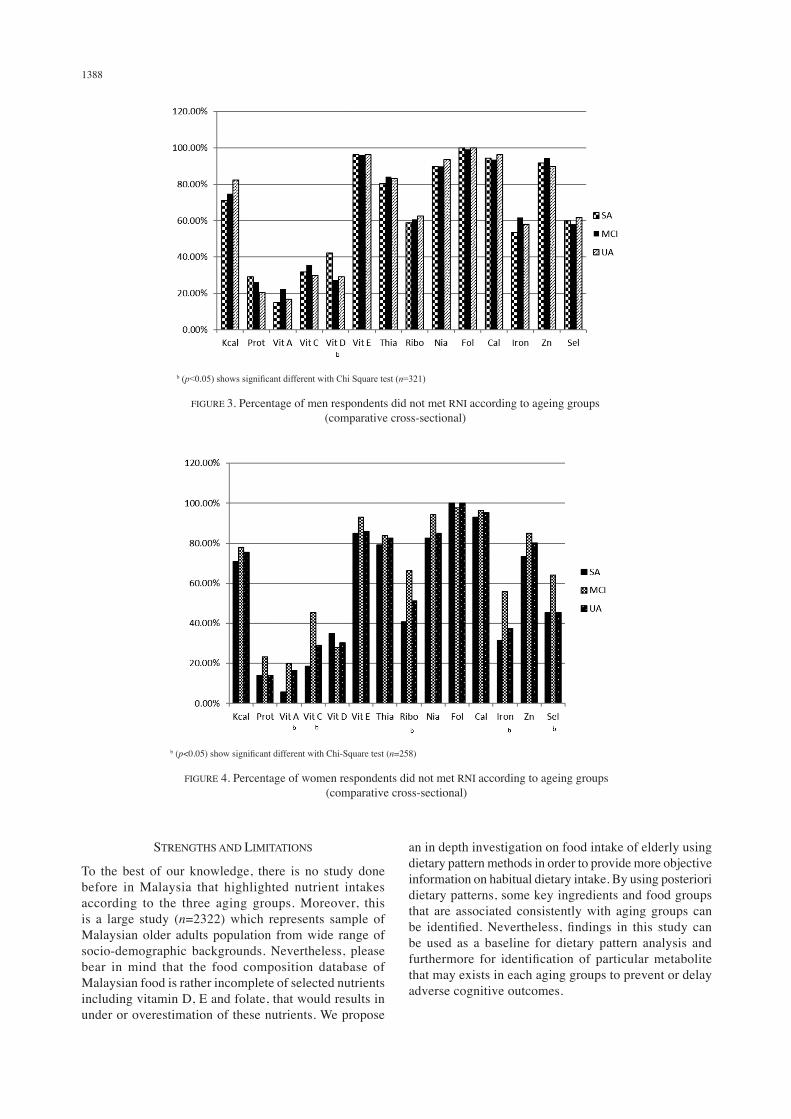
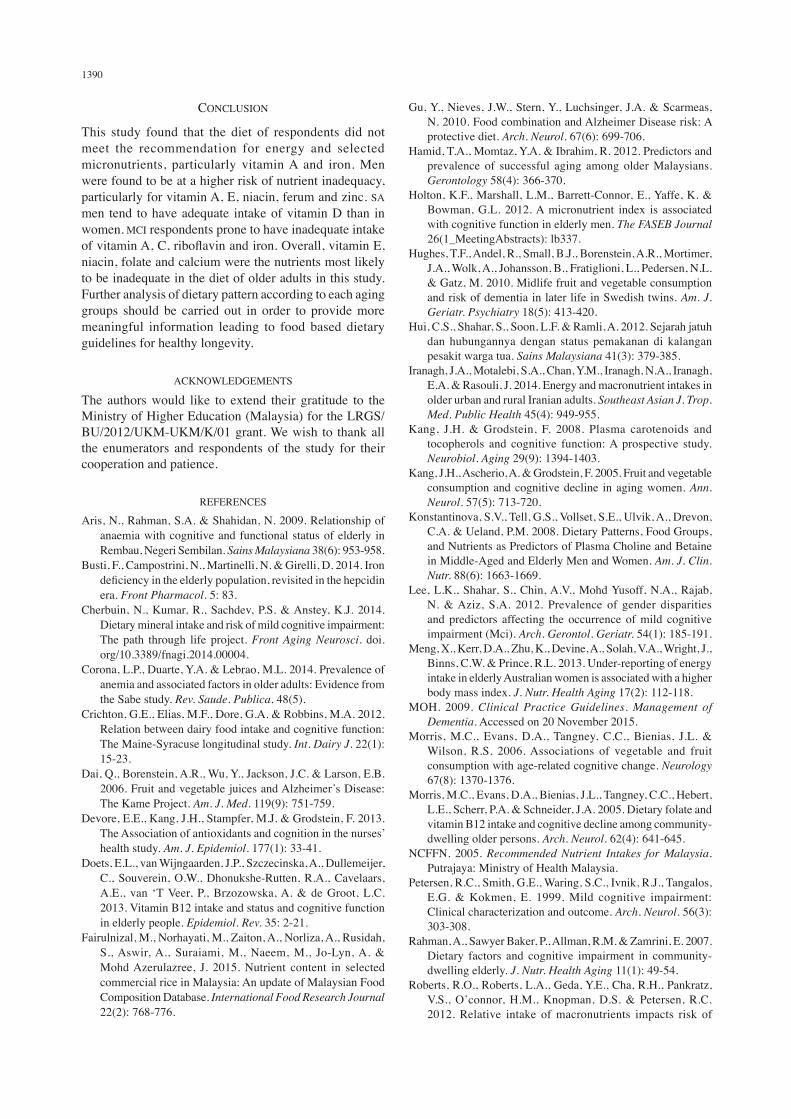
significantly higher in men as compared to women (p<0.001 for all parameters except niacin p<0.05). However, vitamin E intake in women (15.1 ± 72.6 mg/day) was significantly higher as compared to men (7.2 ± 37.4 mg/d) (p<0.05). Women respondents achieved higher percentage of protein, vitamin E, riboflavin, niacin, iron, zinc and selenium than men (p<0.001 for all parameters). Most of the respondents met the recommendation for protein, especially women. Because of that, protein composition among women subject was higher than men subject which is 17.6 ± 3.4%. Men respondents show higher composition of carbohydrate but lower composition in fat percentage. All respondents in this study meet recommendation for macronutrients. As shown in Figure 2, more than 80% of the respondents did not meet the recommendations for vitamin E, niacin, folate and calcium in both genders. Men did not met the recommendations for vitamin A, E, niacin, folate, iron and zinc as compared to women (p<0.001 for all parameters except p<0.05 for vitamin A). Table 3 shows no significant difference in energy and nutrients intake between all age groups among men. Men successful agers had highest carbohydrate composition per energy intake but lowest protein composition per energy intake as compared to UA respondents. In Table 4, women respondents with MCI had the lowest mean intake of vitamin A; 1127.5 ± 908.1 RE/d, vitamin C; 91.5 ± 63.0 mg/d, vitamin E; 4.1 ± 2.1 mg/d, riboflavin; 1.0 ± 0.4 mg/d, calcium; 452.6 ± 218.9 mg/d, iron; 11.8 ± 5.1 mg/d and zinc; 2.9 ± 1.4 mg/d, as compared to UA and SA (p<0.05 for all parameters except p<0.001 for riboflavin). This study showed that calcium intake was the highest among women SA as compared to UA and MCI. Adequacy of the diet examined with reference to the RNI (NCFFN 2005) shows a significantly higher percentage of SA respondents who met the recommendations for vitamin A, C, D, riboflavin, calcium and iron. Protein compositions per energy intake of women UA respondents were higher as compared to SA respondents. As shown in Figure 3, inadequate vitamin D intake was common among SA men respondents. However, in women, more than 80% of the respondents did not meet recommendation for vitamin E, thiamine, niacin, folate and calcium (Figure 4). The higher percentage of inadequate vitamin A, C, riboflavin and iron intake was observed among women in MCI group followed by UA and SA respondents (p<0.05 for all parameters).
DISCUSSION
Energy intake for both men and women respondents did not meet the recommendation. Similarly, Iranagh et al. (2014) have reported that energy intakes among 432 older urban and rural Iranian adults were lower than the Recommended Dietary Allowance (RDA). Low energy intake could be due to under reporting, however, in our study, under-reporting and over-reporting energy intake were excluded from analysis to avoid inaccuracy of data analysis and may complicate data interpretation as well. Meng et al. (2013) studied under-reporting energy intake

1385
TAB
LE 2
. Ene
rgy
and
nutri
ents
inta
ke fo
r all
resp
onde
nts a
ccor
ding
to g
ende
r (ex
pres
sed
as m
ean
± SD
)
Nut
rient
s M
en (n
= 9
78)
RN
I%
RN
IW
omen
(n =
993
)R
NI
% R
NI
Ener
gy (k
cal/d
)17
70 ±
423
2010
88.1
± 2
1.1
1537
± 3
70a
1780
86.3
± 2
0.8
Prot
ein
(g/d
)73
.8 ±
19.
659
.012
5.1
± 33
.367
.5 ±
20.
0a51
.013
2.4
± 39
.2a
Car
bohy
drat
e (g
/d)
245.
7 ±
71.8
-20
2.2
± 58
.0a
-
Fat (
g/d)
54.7
± 2
0.3
-50
.8 ±
17.
8a-
Vit
A (R
E/d)
1228
.5 ±
841
.260
0.0
204.
8 ±
140.
311
96.9
± 7
98.2
500.
0 –
600.
021
5.2
± 14
4.5
Vit
C (m
g/d)
113.
4 ±
79.1
70.0
162.
0 ±
113.
011
8.8
± 83
.770
.016
9.8
± 11
9.6
Vit
D (m
g/d)
0.3
± 2.
910
.0-1
5.0
2.5
± 19
.50.
3 ±
1.1
10.0
– 1
5.0
2.6
± 9.
1
Vit
E (m
g/d)
7.2
± 37
.410
.071
.9 ±
374
.515
.2 ±
72.
6b7.
520
2.0
± 96
8.5a
Thia
min
(mg/
d)1.
6 ±
3.8
1.2
133.
3 ±
318.
01.
5 ±
3.5
1.1
136.
4 ±
314.
3
Rib
oflav
in (m
g/d)
1.2
± 0.
51.
395
.4 ±
35.
31.
2 ±
0.5
1.1
110.
6 ±
45.5
a
Nia
cin
(mg/
d)10
.6 ±
3.8
16.0
66.4
± 2
3.7
10.1
± 3
.8b
14.0
72.3
± 2
7.3a
Fola
te (m
g/d)
10
5.3
± 70
.540
0.0
26.3
± 1
7.6
107.
5 ±
79.8
400.
026
.9 ±
19.
9
Cal
cium
(mg/
d)52
7.4
± 23
7.8
800.
0-10
00.0
56.4
± 2
5.6
511.
2 ±
245.
410
00.0
51.1
± 2
4.5a
Iron
(mg/
d)14
.0 ±
5.1
14.0
99.8
± 3
6.7
13.1
± 5
.2a
11.0
119.
1 ±
47.1
a
Zinc
(mg/
d)3.
8 ±
2.0
6.2
– 6.
760
.0 ±
31.
23.
4 ±
1.8a
4.3
– 4.
975
.8 ±
39.
6a
Sele
nium
(mg/
d)23
.9 ±
18.
929
– 3
379
.6 ±
63.
524
.1 ±
17.
523
.0 –
25.
010
1.3
± 74
.0a
CH
O c
ompo
sitio
n (%
)55
.3 ±
7.8
52.7
± 8
.1a
Prot
ein
com
posi
tion
(%)
16.9
± 3
.317
.6 ±
3.4
a
Fat c
ompo
sitio
n (%
)27
.8 ±
7.2
29.6
± 7
.0a
a (p<
0.00
1) a
nd b (
p<0.
05) s
how
sign
ifica
nt d
iffer
ent w
ith in
depe
nden
t t-te
st
1386
among Australian women and found that under-reporters perform higher physical activity level, body weight, body mass index, waist and hip circumference, whole body fat mass and percentage body fat compared with acceptable-reporters. In addition, they found that under-reporters had lower intake of protein, fat, carbohydrate and alcohol and fewer reported items as compared to acceptable-reporter.Women respondents had higher intakes and achieved higher percentage of vitamin E compared to men and as mentioned by Hui et al. (2012), women with calcium intake less than 300 mg/day and protein intake less than 1 g/kg body weight have higher risk to fall down. In comparison of aging groups among women, MCI respondents had the lowest intake of vitamin E. Vitamin E is well known for its potent antioxidant activity. This vitamin is a fat-soluble vitamin which gives benefit and maintains cognitive function in elderly (Devore et al. 2013; Kang & Grodstein 2008; Wengreen et al. 2007). The Cache County Study on memory and aging reported that respondents who consumed vitamin E at the highest quartile of intake showed slower cognitive decline, measured by the modified MMSE, than those in the first and second quartiles, with the intake of approximately 4.6 and 6.1 mg/day, respectively (Wengreen et al. 2007). Besides that, protein intake among respondents in this study met the recommendation especially in women, probably due to consumption of rice which is a good source of carbohydrates and protein that providing energy. Commercial rice from three rice varieties namely Basmati, Fragrant and Siam are the most consumed by Malaysians (Fairulnizal et al. 2015). Protein content in Fragrant, Basmati and Siam rice were 7.17 ± 0.35, 8.35 ± 0.2 and 7.55 ± 0.32 g/100 g, respectively. There is a need to investigate further on the quality of protein being consumed. Inadequate intake of iron is prone among
men respondents, as compared to women often due to multifactorial factors including medication, inadequate dietary intake, malabsorption and bleeding (Busti et al. 2014). These conditions can lead to anemia which can affect the quality of life of older adults. According to a study by Aris et al. (2009) and Corona et al. (2014), prevalence of anemia in older adults was 22.9% and 7.7%, respectively. They suggested it was associated with the presence of chronic disease and advanced age. The risk of MCI and dementia increased among individuals with high caloric intake from carbohydrates and low caloric intake from fat and protein (Roberts et al. 2012). On a contrary, long term intake of diet high in complex carbohydrate such as fruits, legumes, vegetables and cereals can potentially promote better cognition compared to simple carbohydrate that has an immediate effect on cognitive function (Dai et al. 2006; Gu et al. 2010; Hughes et al. 2010; Kang et al. 2005; Morris et al. 2006). Our finding showed that men successful agers had the highest caloric intake from carbohydrates but the lowest caloric intake from protein. In addition, consumption of dairy products at least once per day was associated with an improvement in several measures of cognitive function (Crichton et al. 2012). This finding was similar to our results that indicated women in SA group had highest intake of calcium as compared to other groups. Moreover, more of SA respondents met recommendation of calcium. Rahman et al. (2007) reported nutrients found in milk products, possibly vitamin A and/or individual dairy fat can potentially responsible for the positive association. Holton et al. (2012) examined the relation between micronutrients intake and cognitive function in elderly men and they found that dietary intake above the RDA for B3, B12, iron & zinc combined, may promote cognitive function in elderly men.
a (p<0.001) and b (p<0.05) show significant different with Chi Square test (n=1958)
FIGURE 2. Percentage of respondents did not met RNI according to gender

1387
TAB
LE 3
. Ene
rgy
and
nutri
ents
inta
ke fo
r men
resp
onde
nts a
ccor
ding
to a
gein
g gr
oups
(exp
ress
ed a
s mea
n ±
SD)
Cha
ract
eris
tics
SA (n
= 1
07)
MC
I (n
= 10
7)U
A (n
= 1
07)
Age
68.0
± 5
.6a
69.4
± 5
.4a
69.3
± 5
.1a
Educ
atio
n ye
ars
8.1
± 4.
25.
5 ±
3.1a
5.8
± 3.
5a
Nut
rient
sR
NI
% R
NI
% R
NI
% R
NI
Ener
gy (k
cal/d
)20
1017
51 ±
452
87.1
± 2
2.5
1722
± 4
1285
.7 ±
20.
517
37 ±
390
86.4
± 2
0.8
Prot
ein
(g/d
)59
.069
.6 ±
21.
011
8.0
± 35
.571
.7 ±
19.
012
1.6
± 32
.275
.2 ±
18.
712
7.5
± 31
.7C
HO
(g/d
)-
251.
3 ±
76.1
-23
8.1
± 68
.8-
237.
8 ±
63.8
-Fa
t (g/
d)-
51.8
± 1
7.8
-52
.8 ±
17.
8-
53.9
± 1
7.1
-V
it A
(RE/
d)60
0.0
1224
.5 ±
789
.420
4.1
± 13
1.6
1235
.6 ±
938
.320
5.9
± 15
6.4
1219
.7 ±
762
.520
3.2
± 12
7.1
Vit
C (m
g/d)
70.0
112.
3 ±
72.8
160.
5 ±
103.
963
.2 ±
6.1
146.
5 ±
90.3
112.
0 ±
72.5
160.
0 ±
103.
6V
it D
(mg/
d)10
.0-1
5.0
0.3
± 0.
62.
2 ±
4.5
0.3
± 1.
12.
3 ±
7.7
0.2
± 0.
81.
7 ±
5.5
Vit
E (m
g/d)
10.0
4.6
± 2.
745
.5 ±
27.
14.
5 ±
2.6
26.4
± 2
.64.
7 ±
2.3
47.3
± 2
3.3
Thia
min
(mg/
d)1.
22.
4 ±
5.9
202.
8 ±
492.
02.
1 ±
5.0
176.
3 ±
419.
62.
4 ±
5.7
201.
4 ±
479.
0R
ibofl
avin
(mg/
d)1.
31.
3 ±
0.5
100.
7 ±
39.2
1.2
± 0.
593
.1 ±
35.
61.
2 ±
0.4
91.4
± 2
8.0
Nia
cin
(mg/
d)16
.010
.7 ±
4.5
67.2
± 2
8.4
10.2
± 3
.763
.7 ±
23.
210
.7 ±
3.3
66.8
± 2
0.7
Fola
te (m
g/d)
400.
011
0.7
± 66
.027
.7 ±
15.
598
.3 ±
80.
224
.6 ±
20.
198
.6 ±
61.
724
.6 ±
15.
4C
alci
um (m
g/d)
800.
0-10
00.0
526.
8 ±
215.
157
.4 ±
23.
752
3.0
± 28
2.4
55.9
± 2
8.7
512.
5 ±
186.
954
.7 ±
21.
2Ir
on (m
g/d)
14.0
13.7
± 5
.097
.8 ±
35.
513
.6 ±
5.9
97.1
± 4
2.1
13.6
± 4
.697
.0 ±
32.
5Zi
nk (m
g/d)
6.2
– 6.
73.
7 ±
2.1
57.2
± 3
2.1
3.5
± 1.
755
.2 ±
26.
43.
9 ±
1.8
62.2
± 2
8.7
Sele
nium
(mg/
d)29
- 33
28.1
± 2
2.9
92.7
± 7
6.2
23.5
± 1
8.8
78.5
± 6
33.7
23.4
± 1
8.4
78.7
± 6
2.8
CH
O c
ompo
sitio
n (%
)57
.2 ±
7.4
b55
.2 ±
7.7
54.7
± 7
.3b
Prot
ein
com
posi
tion
(%)
16.0
± 3
.3b
16.9
± 3
.117
.5 ±
3.1
b
Fat c
ompo
sitio
n (%
)26
.6 ±
6.0
27.6
± 6
.427
.9 ±
6.6
a (p<
0.00
1) a
nd b (
p<0.
05) s
how
sign
ifica
nt d
iffer
ent w
ith O
ne-w
ay A
NO
VA te
st
1388
b (p<0.05) shows significant different with Chi Square test (n=321)
FIGURE 3. Percentage of men respondents did not met RNI according to ageing groups (comparative cross-sectional)
b (p<0.05) show significant different with Chi-Square test (n=258)
FIGURE 4. Percentage of women respondents did not met RNI according to ageing groups (comparative cross-sectional)
STRENGTHS AND LIMITATIONS
To the best of our knowledge, there is no study done before in Malaysia that highlighted nutrient intakes according to the three aging groups. Moreover, this is a large study (n=2322) which represents sample of Malaysian older adults population from wide range of socio-demographic backgrounds. Nevertheless, please bear in mind that the food composition database of Malaysian food is rather incomplete of selected nutrients including vitamin D, E and folate, that would results in under or overestimation of these nutrients. We propose
an in depth investigation on food intake of elderly using dietary pattern methods in order to provide more objective information on habitual dietary intake. By using posteriori dietary patterns, some key ingredients and food groups that are associated consistently with aging groups can be identified. Nevertheless, findings in this study can be used as a baseline for dietary pattern analysis and furthermore for identification of particular metabolite that may exists in each aging groups to prevent or delay adverse cognitive outcomes.

1389
TAB
LE 4
. Ene
rgy
and
nutri
ents
inta
ke fo
r wom
en re
spon
dent
s acc
ordi
ng to
age
ing
grou
ps (e
xpre
ssed
as m
ean
± SD
)
Cha
ract
eris
tics
SA (n
= 8
6)M
CI (
n =
86)
UA
(n =
86)
Age
65.3
± 5
.267
.7 ±
5.2
a69
.1 ±
5.4
a
Educ
atio
n ye
ars
7.6
± 4.
33.
4 ±
3.0a
3.2
± 3.
4a
Nut
rient
sR
NI
% R
NI
% R
NI
% R
NI
CH
O (g
/d)
-21
0.5
± 56
.0-
196.
7 ±
60.9
-20
0.4
± 49
.6-
Fat (
g/d)
-52
.8 ±
20.
0-
49.3
± 1
9.0
-50
.9 ±
18.
0-
Vit
A (R
E/d)
500.
0 –
600.
014
72.9
± 1
000.
4b27
3.3
± 17
6.7b
1127
.5 ±
908
.1b
203.
8 ±
165.
9b12
16.4
± 8
28.3
160.
6 ±
17.3
Vit
C (m
g/d)
70.0
141.
6 ±
81.0
a20
2.3
± 11
5.7a
91.5
± 6
3.0a
130.
7 ±
90.0
a12
0.3
± 84
.0a
171.
8 ±
120.
0a
Vit
D (m
g/d)
10.0
– 1
5.0
0.3
± 0.
93.
2 ±
9.0b
0.3
0.8
± 2.
0b0.
61.
9 ±
5.1
Vit
E (m
g/d)
7.5
10.0
± 4
6.6
133.
6 ±
621.
04.
1 ±
2.1b
55.3
± 2
7.4b
31.4
± 1
18.1
b41
8.7
± 15
75.2
b
Thia
min
(mg/
d)1.
11.
9 ±
4.8
176.
0 ±
435.
51.
6 ±
3.6
143.
4 ±
323.
21.
4 ±
2.8
126.
1 ±
256.
9a
Rib
oflav
in (m
g/d)
1.1
1.3
± 0.
6a12
2.1
± 52
.3a
0.4a
93.2
± 3
6.8a
1.2
± 0.
510
6.1
± 45
.4N
iaci
n (m
g/d)
14.0
10.4
± 4
.174
.6 ±
29.
39.
3 ±
3.2
66.3
± 2
3.1
10.5
± 3
.575
.1 ±
25.
2Fo
late
(mg/
d)40
0.0
114.
7 ±
72.9
28.7
± 1
8.2
88.8
± 8
4.1
22.2
± 2
1.0
116.
9 ±
80.8
29.2
± 2
0.2
Cal
cium
(mg/
d)10
00.0
554.
9 ±
257.
3b55
.5 ±
25.
7b45
2.6
± 21
8.9b
45.3
± 2
1.9b
523.
7 ±
216.
352
.4 ±
21.
6Ir
on (m
g/d)
11.0
13.8
± 5
.2b
125.
1 ±
47.6
b11
.8 ±
5.1
b10
7.1
± 46
.7b
13.2
± 5
.011
9.9
± 45
.3Zi
nk (m
g/d)
4.3
– 4.
93.
6 ±
1.8b
77.9
± 3
8.3
2.9
± 1.
4b65
.5 ±
31.
93.
4 ±
1.5
76.1
± 3
2.9
Sele
nium
(mg/
d)23
.0 –
25.
027
.5 ±
19.
411
3.7
± 79
.722
.3 ±
19.
293
.7 ±
80.
027
.6 ±
18.
411
6.8
± 76
.7Pr
otei
n in
take
(g/k
g)1.
2 ±
0.3
1.1
± 0.
41.
2 ±
0.4
CH
O c
ompo
sitio
n (%
)53
.4 ±
7.4
52.6
± 9
.01.
2 ±
0.4
Prot
ein
com
posi
tion
(%)
16.8
± 3
.2b
17.7
± 3
.018
.1 ±
3.5
b
Fat c
ompo
sitio
n (%
)29
.9 ±
7.2
29.6
± 7
.929
.4 ±
6.1
a (p<
0.00
1) a
nd b (
p<0.
05) s
how
sign
ifica
nt d
iffer
ent w
ith O
ne-w
ay A
NO
VA te
st
1390
CONCLUSION
This study found that the diet of respondents did not meet the recommendation for energy and selected micronutrients, particularly vitamin A and iron. Men were found to be at a higher risk of nutrient inadequacy, particularly for vitamin A, E, niacin, ferum and zinc. SA men tend to have adequate intake of vitamin D than in women. MCI respondents prone to have inadequate intake of vitamin A, C, riboflavin and iron. Overall, vitamin E, niacin, folate and calcium were the nutrients most likely to be inadequate in the diet of older adults in this study. Further analysis of dietary pattern according to each aging groups should be carried out in order to provide more meaningful information leading to food based dietary guidelines for healthy longevity.
ACKNOWLEDGEMENTS
The authors would like to extend their gratitude to the Ministry of Higher Education (Malaysia) for the LRGS/BU/2012/UKM-UKM/K/01 grant. We wish to thank all the enumerators and respondents of the study for their cooperation and patience.
REFERENCES
Aris, N., Rahman, S.A. & Shahidan, N. 2009. Relationship of anaemia with cognitive and functional status of elderly in Rembau, Negeri Sembilan. Sains Malaysiana 38(6): 953-958.
Busti, F., Campostrini, N., Martinelli, N. & Girelli, D. 2014. Iron deficiency in the elderly population, revisited in the hepcidin era. Front Pharmacol. 5: 83.
Cherbuin, N., Kumar, R., Sachdev, P.S. & Anstey, K.J. 2014. Dietary mineral intake and risk of mild cognitive impairment: The path through life project. Front Aging Neurosci. doi.org/10.3389/fnagi.2014.00004.
Corona, L.P., Duarte, Y.A. & Lebrao, M.L. 2014. Prevalence of anemia and associated factors in older adults: Evidence from the Sabe study. Rev. Saude. Publica. 48(5).
Crichton, G.E., Elias, M.F., Dore, G.A. & Robbins, M.A. 2012. Relation between dairy food intake and cognitive function: The Maine-Syracuse longitudinal study. Int. Dairy J. 22(1): 15-23.
Dai, Q., Borenstein, A.R., Wu, Y., Jackson, J.C. & Larson, E.B. 2006. Fruit and vegetable juices and Alzheimer’s Disease: The Kame Project. Am. J. Med. 119(9): 751-759.
Devore, E.E., Kang, J.H., Stampfer, M.J. & Grodstein, F. 2013. The Association of antioxidants and cognition in the nurses’ health study. Am. J. Epidemiol. 177(1): 33-41.
Doets, E.L., van Wijngaarden, J.P., Szczecinska, A., Dullemeijer, C., Souverein, O.W., Dhonukshe-Rutten, R.A., Cavelaars, A.E., van ‘T Veer, P., Brzozowska, A. & de Groot, L.C. 2013. Vitamin B12 intake and status and cognitive function in elderly people. Epidemiol. Rev. 35: 2-21.
Fairulnizal, M., Norhayati, M., Zaiton, A., Norliza, A., Rusidah, S., Aswir, A., Suraiami, M., Naeem, M., Jo-Lyn, A. & Mohd Azerulazree, J. 2015. Nutrient content in selected commercial rice in Malaysia: An update of Malaysian Food Composition Database. International Food Research Journal 22(2): 768-776.
Gu, Y., Nieves, J.W., Stern, Y., Luchsinger, J.A. & Scarmeas, N. 2010. Food combination and Alzheimer Disease risk: A protective diet. Arch. Neurol. 67(6): 699-706.
Hamid, T.A., Momtaz, Y.A. & Ibrahim, R. 2012. Predictors and prevalence of successful aging among older Malaysians. Gerontology 58(4): 366-370.
Holton, K.F., Marshall, L.M., Barrett-Connor, E., Yaffe, K. & Bowman, G.L. 2012. A micronutrient index is associated with cognitive function in elderly men. The FASEB Journal 26(1_MeetingAbstracts): lb337.
Hughes, T.F., Andel, R., Small, B.J., Borenstein, A.R., Mortimer, J.A., Wolk, A., Johansson, B., Fratiglioni, L., Pedersen, N.L. & Gatz, M. 2010. Midlife fruit and vegetable consumption and risk of dementia in later life in Swedish twins. Am. J. Geriatr. Psychiatry 18(5): 413-420.
Hui, C.S., Shahar, S., Soon, L.F. & Ramli, A. 2012. Sejarah jatuh dan hubungannya dengan status pemakanan di kalangan pesakit warga tua. Sains Malaysiana 41(3): 379-385.
Iranagh, J.A., Motalebi, S.A., Chan, Y.M., Iranagh, N.A., Iranagh, E.A. & Rasouli, J. 2014. Energy and macronutrient intakes in older urban and rural Iranian adults. Southeast Asian J. Trop. Med. Public Health 45(4): 949-955.
Kang, J.H. & Grodstein, F. 2008. Plasma carotenoids and tocopherols and cognitive function: A prospective study. Neurobiol. Aging 29(9): 1394-1403.
Kang, J.H., Ascherio, A. & Grodstein, F. 2005. Fruit and vegetable consumption and cognitive decline in aging women. Ann. Neurol. 57(5): 713-720.
Konstantinova, S.V., Tell, G.S., Vollset, S.E., Ulvik, A., Drevon, C.A. & Ueland, P.M. 2008. Dietary Patterns, Food Groups, and Nutrients as Predictors of Plasma Choline and Betaine in Middle-Aged and Elderly Men and Women. Am. J. Clin. Nutr. 88(6): 1663-1669.
Lee, L.K., Shahar, S., Chin, A.V., Mohd Yusoff, N.A., Rajab, N. & Aziz, S.A. 2012. Prevalence of gender disparities and predictors affecting the occurrence of mild cognitive impairment (Mci). Arch. Gerontol. Geriatr. 54(1): 185-191.
Meng, X., Kerr, D.A., Zhu, K., Devine, A., Solah, V.A., Wright, J., Binns, C.W. & Prince, R.L. 2013. Under-reporting of energy intake in elderly Australian women is associated with a higher body mass index. J. Nutr. Health Aging 17(2): 112-118.
MOH. 2009. Clinical Practice Guidelines. Management of Dementia. Accessed on 20 November 2015.
Morris, M.C., Evans, D.A., Tangney, C.C., Bienias, J.L. & Wilson, R.S. 2006. Associations of vegetable and fruit consumption with age-related cognitive change. Neurology 67(8): 1370-1376.
Morris, M.C., Evans, D.A., Bienias, J.L., Tangney, C.C., Hebert, L.E., Scherr, P.A. & Schneider, J.A. 2005. Dietary folate and vitamin B12 intake and cognitive decline among community-dwelling older persons. Arch. Neurol. 62(4): 641-645.
NCFFN. 2005. Recommended Nutrient Intakes for Malaysia. Putrajaya: Ministry of Health Malaysia.
Petersen, R.C., Smith, G.E., Waring, S.C., Ivnik, R.J., Tangalos, E.G. & Kokmen, E. 1999. Mild cognitive impairment: Clinical characterization and outcome. Arch. Neurol. 56(3): 303-308.
Rahman, A., Sawyer Baker, P., Allman, R.M. & Zamrini, E. 2007. Dietary factors and cognitive impairment in community-dwelling elderly. J. Nutr. Health Aging 11(1): 49-54.
Roberts, R.O., Roberts, L.A., Geda, Y.E., Cha, R.H., Pankratz, V.S., O’connor, H.M., Knopman, D.S. & Petersen, R.C. 2012. Relative intake of macronutrients impacts risk of

1391
Wengreen, H.J., Munger, R.G., Corcoran, C.D., Zandi, P., Hayden, K.M., Fotuhi, M., Skoog, I., Norton, M.C., Tschanz, J., Breitner, J.C. & Welsh-Bohmer, K.A. 2007. Antioxidant intake and cognitive function of elderly men and women: The Cache county study. J. Nutr. Health Aging 11(3): 230-237.
Wong, S.H., Rajikan, R., Das, S. & Lee, L.K. 2010. Antioxidant intake and mild cognitive impairment among elderly people in Klang Valley: A pilot study. Sains Malaysiana 39(4): 689-696.
Nik Nur Izzati Nik Mohd Fakhruddin, Suzana Shahar*, Nurul Atiqah Abd Aziz & Roslee RajikanDietetic Programme, Centre of Healthcare SciencesFaculty of Health SciencesUniversiti Kebangsaan MalaysiaJalan Raja Muda Abdul Aziz50300 Kuala Lumpur, Federal TerritoryMalaysia
Hanis Mastura YahyaNutrition Programme, Centre of Healthcare SciencesFaculty of Health SciencesUniversiti Kebangsaan MalaysiaJalan Raja Muda Abdul Aziz50300 Kuala Lumpur, Federal TerritoryMalaysia
*Corresponding author; email: [email protected]
Received: 3 January 2016Accepted: 28 April 2016
mild cognitive impairment or dementia. J. Alzheimers Dis. 32(2): 329-339.
Shahar, S., Omar, A., Vanoh, D., Hamid, T.A., Mukari, S.Z., Din, N.C., Rajab, N.F., Mohammed, Z., Ibrahim, R., Loo, W.H., Meramat, A., Kamaruddin, M.Z., Bagat, M.F. & Razali, R. 2015. Approaches in methodology for population-based longitudinal study on neuroprotective model for healthy longevity (TUA) among Malaysian older adults. Aging Clin. Exp. Res. DOI: 10.1007/s40520-015-0511-4.
Shahar, S., Earland, J. & Abdulrahman, S. 2000. Validation of a dietary history questionnaire against a 7-D weighed record for estimating nutrient intake among rural elderly Malays. Malays J. Nutr. 6(1): 33-44.
Solfrizzi, V., Frisardi, V., Capurso, C., D’introno, A., Colacicco, A.M., Vendemiale, G., Capurso, A. & Panza, F. 2010. Dietary fatty acids in dementia and predementia syndromes: Epidemiological evidence and possible underlying mechanisms. Ageing Res. Rev. 9(2): 184-199.
Solfrizzi, V., Frisardi, V., Capurso, C., D’introno, A., Colacicco, A.M., Vendemiale, G., Capurso, A. & Panza, F. 2009. Dietary fatty acids and predementia syndromes. Scientific World Journal 9: 792-810.
Suzana, S., Nik Shanita, S., Zahara, A.M. & Hasnah, H. 2015. Atlas of Food Exchanges & Portion Sizes. 3rd ed. Kuala Lumpur: MDC Publisher.
Tee, E., Ismail, M., Nasir, M. & Khatijah, I. 1997. Nutrient Composition of Malaysian Foods. 4th ed. Kuala Lumpur: Institute for Medical Research.
Van Gelder, B.M., Tijhuis, M., Kalmijn, S. & Kromhout, D. 2007. Fish consumption, N-3 fatty acids, and subsequent 5-Y cognitive decline in elderly men: The Zutphen elderly study. Am. J. Clin. Nutr. 85(4): 1142-1147.
Vogiatzoglou, A., Smith, A.D., Nurk, E., Drevon, C.A., Ueland, P.M., Vollset, S.E., Nygaard, H.A., Engedal, K., Tell, G.S. & Refsum, H. 2013. Cognitive function in an elderly population: Interaction between vitamin B12 status, depression, and apolipoprotein E Epsilon4: The Hordaland homocysteine study. Psychosom. Med. 75(1): 20-29.