where science and creativity meet
TRANSCRIPT

ANNUAL REPORT 2020
WHERE SCIENCE AND CREATIVITY MEET

FULL-YEAR 2020 RESULTS
Company Financials
$4.38ADJUSTED EPS*
$5.1BILLION
$5.70ADJUSTED EPS EX AMORTIZATION*
ADJUSTED OPERATING PROFIT*
$730MILLION
SALES
Earned Economic Dividend for Gender Equality (EDGE) Move level certification, globally, making it the first – and currently the only – company to earn this level of recognition
Named to CDP’s A Lists for Water Security and Climate Change for the second and fifth consecutive year, respectively
A“ ”
LISTER
2020YEAR IN REVIEW
Awarded the 2020 EcoVadis platinum sustainability rating, a new and more highly selective designation introduced by the internationally recognized platform earlier in the year
Announced the opening of a new creation, application and innovation center for our Taste division in Dubai, UAE to better serve our customers’ unique needs and drive growth in the African, Middle Eastern, Turkish and Indian markets
IFF shareholders voted to approve the previously proposed merger of IFF and DuPont’s Nutrition & Biosciences with more than 99 percent of the votes cast in favor
Modified our production facilities to manufacture and distribute hand sanitizer for first responders and other organizations around the world during pandemic
Named for the first time to the Dow Jones Sustainability Indices (DJSI) for both the 2020 World and North America, which validates our leadership position in sustainability performance and underscores our commitment to executing on key environmental, social and governance (ESG) priorities
In an unpredictable year, all of us at IFF have so much to be proud of. Our teams have responded to the challenges of this year with grit, determination, creativity and an even greater passion for the work we do and the essential role IFF plays in consumer end markets around the world. The resolve I have seen across our global organization is an incredible testament to the people who make IFF such an incredible purpose-driven organization.
DEAR FELLOW SHAREHOLDERS, CUSTOMERS & EMPLOYEES
Andreas FibigChairman and
Chief Executive Officer
* Adjusted Operating Profit, Adjusted Operating Profit Ex Amortization, Adjusted EPS, Adjusted EPS ex Amortization & Adjusted EBITDA are Non-GAAP metrics.

32
We have also realigned our global organization into four divisions to successfully integrate our business with N&B, meet our synergy commit-ments, anticipate customer needs faster and deliver on our long-term growth and profitability goals. We recently announced that our combined Taste, Food & Beverage division will now be called Nourish. To nourish is to feed with purpose, a commitment that guides IFF’s partnership with all our stakeholders. In addition to Nourish, the combined company’s divisions include Scent, which pioneers the discovery and development of ingredients that create unique fragrances for fine perfumes, beauty, personal care and household goods; Health & Biosciences, a leading innovation partner developing safer, healthier and more sustainable solutions across a broad range of consumer product, industrial and agricultural sectors; and Pharma Solutions, a trusted leader in a highly regulated industry that develops the ingredients, products and applications that support the global production of pharma and dietary supplements.
As we uphold our commitment to fostering an inclusive culture, with values that support our promises to our people, our stakeholders and our planet, we recognize that we have a duty to act sustainably – and with compassion – to leverage our enhanced scale to Do More Good in all of our communities.
IFF is proudly certified for diversity, equity and inclusion leadership around the world, most recently achieving Economic Dividend for Gender Equality (EDGE) Move certification globally for our empowering employee environment. Having received certification in 21 countries – the largest number of countries ever certified by EDGE at one time – IFF is the first and only company to earn this level of recognition, which serves as a testament to our company’s commitment to full gender parity. In addition to this latest honor, we are pleased to hold several other important diversity & inclusion certifications, including from Diversity Inc., Human Rights Campaign, and the signing of the U.N. Global LGBTI Standards of Conduct for Business and the U.N. Women’s Empowerment Principles. At IFF, we benefit from the rich array of perspectives and contributions of people of unique backgrounds, experiences and cultures. It also allows us to reflect and respond to a broad customer base around the world – serving as a key driver of our long-term success. Throughout the year, we accelerated specific plans and actions with clear objectives, milestones and KPIs to ensure we are moving in the right direction and are resolutely committed to keep doing our part in the fight against social injustice.
We continue to focus on strengthening our responsible sourcing program and natural ingredient supply chains, implementing breakthrough en-vironmental standards across our innovation platform. Building on our EcoEffective+ environmental initiative that defines our 2025 emissions goals and our long-standing commitment to the Paris Climate Agreement, IFF was named to CDP’s A Lists for Water Security and Climate Change for the second and fifth consecutive year, respectively, placing us among a prestigious group of global environmental leaders with Double-A distinction. We were also named to the Barron’s 100 Most Sustainable Companies list for the third consecutive year, joining the ranks of 99 leading U.S. companies assessed for environmental, social and corporate governance practices, and were named for the first time to the 2020 World Index and North America Dow Jones Sustainability Indices, a family of best-in-class benchmarks for investors who have recognized that sustainable business practices are critical to generating long-term shareholder value. At the end of 2020 we were also awarded the 2020 EcoVadis platinum sustainability rating, a new and more highly selective designation introduced by the internationally recognized platform which we placed in the top 1% of companies that were
Our experiences throughout 2020 revealed IFF’s truly essential role for our customers all over the world. More than anything, the past year has confirmed that IFF is so much more than an ingredients and solutions supplier. We are a force for good for our customers, our communities and our world. Amid the challenges of the past year, I have witnessed astounding resilience, collaboration, flexibility and innovation across our organization as we continued to deliver for all our stakeholders.
I have always believed deeply in the power of our people when faced with a challenge. Throughout the pandemic, IFFers fearlessly and passionately acted above and beyond expectations – with speed, agility and an unshakeable commitment to our craft – in line with our commitment to Do More Good.
Our teams found creative ways to leverage IFF’s unique capabilities and innovative spirit to support COVID-19 relief. We modified our production facilities to manufacture and distribute hand sanitizer for first responders and other organizations around the world; developed a new scent, Hope 2020, to do our part to bring positivity through olfactive design; partnered with Harvard Medical School and Massachusetts General Hospital to create the first globally-developed early detection smell test for asymptomatic carriers; and donated food and other necessary sanitization items to local orphanages, hospitals and police stations across India, just to name a few. The ways in which our teams managed supply chain disruptions and customer demand and adapted our ways of working, while ensuring meaningful contribution to our communities in need, is remarkable.
Importantly, we remained focused on achieving our strategic growth initiatives, including the completion of our combination with DuPont’s Nutrition & Biosciences (N&B) business. This milestone is the next and final step in IFF’s industry-defining transformation into a global leader in high-value ingredients and solutions for global food, beverage, home and personal care and health and wellness markets. Throughout the year, our integration teams worked tirelessly to finalize the organization’s leadership, operational structure, brand identity and foundational vision – all key to realizing the full potential of our exciting new company.
Our leadership team believes passionately in the importance of our commitment to lead as a purpose-driven enterprise. We have established a unified identity that echoes across the divisions and teams of our global organization, and that captures our obsession for combining a passion for creativity with the rigors of cutting-edge science. IFF’s core purpose – Applying science and creativity for a better world – and central vision – Be the partner for essential solutions – guide our customer-centric strategy to push past traditional industry boundaries. We are committed to be a force for a better and more sustainable future – to do more good for our people, customers and communities. These statements will accelerate the long-term success of our business while encouraging our teams to inspire and empower others, unleash new discoveries and challenge the status quo to promote lasting societal impact.
With our combination with N&B officially completed in February 2021, we are now reimagining what it means to partner with our customers through a platform at the forefront of consumer and commercial product development and an enhanced ability to deliver in-demand, differentiated solutions. Guided by our customer-centric approach, unmatched R&D capabilities and a storied legacy of artistry, we are forging our way forward as the new industry leader. We are meeting and exceeding our customers’ evolving needs, unlocking long-term value and accelerating our tireless pursuit of the most differentiated ingredients and solutions in the industry.

10-KInternational Flavors & Fragrances
4
Andreas FibigChairman and Chief Executive Officer
* Adjusted Operating Profit, Adjusted Operating Profit Ex Amortization, Adjusted EPS, Adjusted EPS ex Amortization & Adjusted EBITDA are Non-GAAP metrics.
assessed. These honors are a testament to the hard work of our Operations and Sustainability teams across the globe.
Amid the challenges and complexity of 2020 due to ongoing pandemic, we finished the year with solid financial results. For the full year, we generated nearly $5.1 billion in sales, with an adjusted operating profit margin ex-cluding amortization at 18.1% and adjusted earnings per share excluding amortization of $5.70. These results are a direct testament to the diversity of our business and the resilience and dedication of our global teams to deliver performance across the organization.
We continue to benefit from our significant business in the most in-demand end-markets, such as Packaged Food & Beverage and Hygiene & Disinfection products, all of which performed remarkably well. Yet, segments such as Fine Fragrance and Food Service categories have been particularly affected by COVID-19 challenges. Fortunately, the steps we’ve taken to expand upon our offerings – bolstered by our acquisition of Frutarom in 2018 and, most recently, our merger with N&B – have provided us with the stability and market position necessary to navigate the current environment.
Reflecting on my journey as CEO since 2014, it is clear that IFF is a much stronger organization today than ever before. Together with N&B, IFF is now a $30 billion market capitalization company, with pro forma 2020 revenue of more than $11 billion and $2.5 billion of EBITDA – more than doubling the position we held just one year ago.
If you recall, six years ago we promised a bold re-invention of our company – one that excites and delights, reaches more customers and end consumers than ever before, and challenges the historical premise of what it means to be a consumer goods and commercial products leader. I am proud to say we are delivering on that promise with a continued sense of curiosity and desire to push traditional boundaries. Looking toward the future, our commitment to our employees, our customers, our end consumers, our stakeholders and our planet will guide everything we do as we truly reimagine what it means to partner with our stakeholders – and serve our world.
As we look back on 2020 and look ahead to the remainder of 2021 and beyond, I want to thank you for supporting our organization throughout this journey. Your continued partnership, keen insights and invaluable perspectives have allowed us to make our dreams a reality.
It is my great honor and privilege to lead us through a new era of IFF. Together, we are well-positioned to seize the unbelievable opportunities ahead of us, deliver sustainable growth for years to come and accelerate our role as a leading force for good around the world.
Thank you.

UNITED STATES SECURITIES AND EXCHANGE COMMISSIONWashington, D.C. 20549
FORM 10-KÍ ANNUAL REPORT PURSUANT TO SECTION 13 OR 15(d)
OF THE SECURITIES EXCHANGE ACT OF 1934For the fiscal year ended December 31, 2020
OR
‘ TRANSITION REPORT PURSUANT TO SECTION 13 OR 15(d)OF THE SECURITIES EXCHANGE ACT OF 1934
For the transition period from toCommission File Number 1-4858
INTERNATIONAL FLAVORS & FRAGRANCES INC.(Exact name of registrant as specified in its charter)
New York 13-1432060(State or other jurisdiction
of incorporation or organization)(I.R.S. Employer Identification No.)
521 West 57th Street, New York, NY 10019-2960
Registrant’s telephone number, including area code (212) 765-5500
SECURITIES REGISTERED PURSUANT TO SECTION 12(b) OF THE ACT:Title of Each Class Trading Symbol Name of Each Exchange on Which Registered
Common Stock, par value 12 1/2¢ per share IFF New York Stock Exchange6.00% Tangible Equity Units IFFT New York Stock Exchange0.500% Senior Notes due 2021 IFF 21 New York Stock Exchange1.750% Senior Notes due 2024 IFF 24 New York Stock Exchange1.800% Senior Notes due 2026 IFF 26 New York Stock Exchange
SECURITIES REGISTERED PURSUANT TO SECTION 12(g) OF THE ACT:None
Indicate by check mark if the registrant is a well-known seasoned issuer, as defined in Rule 405 of the Securities Act. Yes Í No‘Indicate by check mark if the registrant is not required to file reports pursuant to Section 13 or Section 15(d) of the Act. Yes ‘ No ÍIndicate by check mark whether the registrant (1) has filed all reports required to be filed by Section 13 or 15(d) of the Securities Exchange
Act of 1934 during the preceding 12 months (or for such shorter period that the registrant was required to file such reports), and (2) has beensubject to such filing requirements for the past 90 days. Yes Í No ‘
Indicate by check mark whether the registrant has submitted electronically every Interactive Data File required to be submitted pursuant toRule 405 of Regulation S-T (§232.405 of this chapter) during the preceding 12 months (or for such shorter period that the registrant was required tosubmit such files). Yes Í No ‘
Indicate by check mark whether the Registrant is a large accelerated filer, an accelerated filer, a non-accelerated filer, a smaller reportingcompany, or an emerging growth company. See the definitions of “large accelerated filer,” “accelerated filer,” “smaller reporting company,” and“emerging growth company” in Rule 12b-2 of the Exchange Act.Large accelerated filer Í Accelerated filer ‘ Non-accelerated filer ‘ Smaller reporting company ‘ Emerging growth company ‘
If an emerging growth company, indicate by checkmark if the registrant has elected not to use the extended transition period for complyingwith any new or revised financial accounting standards provided pursuant to Section 13(a) of the Exchange Act. ‘
Indicate by check mark whether the registrant has filed a report on and attestation to its management’s assessment of the effectiveness of itsinternal control over financial reporting under Section 404(b) of the Sarbanes-Oxley Act (15 U.S.C. 7262(b)) by the registered public accountingfirm that prepared or issued its audit report. Í
Indicate by check mark whether the registrant is a shell company (as defined in Rule 12b-2 of the Exchange Act). Yes ‘ No ÍThe aggregate market value of the voting stock held by non-affiliates of the Registrant was $13,567,537,235 as of June 30, 2020.As of February 15, 2021, there were 248,726,256 shares of the registrant’s common stock, par value 12 1/2¢ per share, outstanding.
DOCUMENTS INCORPORATED BY REFERENCEPortions of the registrant’s proxy statement for the 2021 Annual Meeting of Shareholders (the “IFF 2021 Proxy Statement”) are incorporated
by reference in Part III of this Form 10-K.
INTERNATIONAL FLAVORS & FRAGRANCES INC.
TABLE OF CONTENTS
PAGE
PART I
ITEM 1. Business . . . . . . . . . . . . . . . . . . . . . . . . . . . . . . . . . . . . . . . . . . . . . . . . . . . . . . . . . . . . . . . . . . . . 1
ITEM 1A. Risk Factors . . . . . . . . . . . . . . . . . . . . . . . . . . . . . . . . . . . . . . . . . . . . . . . . . . . . . . . . . . . . . . . . . 13
ITEM 1B. Unresolved Staff Comments . . . . . . . . . . . . . . . . . . . . . . . . . . . . . . . . . . . . . . . . . . . . . . . . . . . . 36
ITEM 2. Properties . . . . . . . . . . . . . . . . . . . . . . . . . . . . . . . . . . . . . . . . . . . . . . . . . . . . . . . . . . . . . . . . . . . 36
ITEM 3. Legal Proceedings . . . . . . . . . . . . . . . . . . . . . . . . . . . . . . . . . . . . . . . . . . . . . . . . . . . . . . . . . . . . 38
ITEM 4. Mine Safety Disclosures . . . . . . . . . . . . . . . . . . . . . . . . . . . . . . . . . . . . . . . . . . . . . . . . . . . . . . . 39
PART II
ITEM 5. Market for Registrant’s Common Equity, Related Stockholder Matters and Issuer Purchasesof Equity Securities . . . . . . . . . . . . . . . . . . . . . . . . . . . . . . . . . . . . . . . . . . . . . . . . . . . . . . . . . . . 40
ITEM 6. Selected Financial Data . . . . . . . . . . . . . . . . . . . . . . . . . . . . . . . . . . . . . . . . . . . . . . . . . . . . . . . . 41
ITEM 7. Management’s Discussion and Analysis of Financial Condition and Results of Operations . . . 42
ITEM 7A. Quantitative and Qualitative Disclosures About Market Risk . . . . . . . . . . . . . . . . . . . . . . . . . . 62
ITEM 8. Financial Statements and Supplementary Data . . . . . . . . . . . . . . . . . . . . . . . . . . . . . . . . . . . . . . 62
ITEM 9. Changes in and Disagreements with Accountants on Accounting and Financial Disclosure . . . 63
ITEM 9A. Controls and Procedures . . . . . . . . . . . . . . . . . . . . . . . . . . . . . . . . . . . . . . . . . . . . . . . . . . . . . . . 63
ITEM 9B. Other Information . . . . . . . . . . . . . . . . . . . . . . . . . . . . . . . . . . . . . . . . . . . . . . . . . . . . . . . . . . . . 63
PART III
ITEM 10. Directors, Executive Officers and Corporate Governance . . . . . . . . . . . . . . . . . . . . . . . . . . . . . 64
ITEM 11. Executive Compensation . . . . . . . . . . . . . . . . . . . . . . . . . . . . . . . . . . . . . . . . . . . . . . . . . . . . . . . 64
ITEM 12. Security Ownership of Certain Beneficial Owners and Management and Related StockholderMatters . . . . . . . . . . . . . . . . . . . . . . . . . . . . . . . . . . . . . . . . . . . . . . . . . . . . . . . . . . . . . . . . . . . . . 64
ITEM 13. Certain Relationships and Related Transactions and Director Independence . . . . . . . . . . . . . . 64
ITEM 14. Principal Accountant Fees and Services . . . . . . . . . . . . . . . . . . . . . . . . . . . . . . . . . . . . . . . . . . . 64
PART IV
ITEM 15. Exhibits and Financial Statement Schedules . . . . . . . . . . . . . . . . . . . . . . . . . . . . . . . . . . . . . . . . 65
ITEM 16. Form 10-K Summary . . . . . . . . . . . . . . . . . . . . . . . . . . . . . . . . . . . . . . . . . . . . . . . . . . . . . . . . . 131
SIGNATURES . . . . . . . . . . . . . . . . . . . . . . . . . . . . . . . . . . . . . . . . . . . . . . . . . . . . . . . . . . . . . . . . . . . . . . . 132

PART I
In this report, we use the terms “IFF,” “the Company,” “we,” “us” and “our” to refer to InternationalFlavors & Fragrances Inc. and its subsidiaries.
ITEM 1. BUSINESS.
On February 1, 2021, pursuant to an Agreement and Plan of Merger (the “Merger Agreement”) with DuPontde Nemours, Inc. (“DuPont”), a wholly owned subsidiary of IFF merged with and into Nutrition & Biosciences,Inc. (“N&B”), a subsidiary of DuPont formed to hold the Nutrition and Biosciences business (the “N&BBusiness”, and such transaction, the “N&B Transaction”). The shares issued in the Merger representedapproximately 55.4% of the common stock of IFF on a fully diluted basis, after giving effect to the Merger, as ofFebruary 1, 2021.
As a result of the N&B Transaction, and following our 2018 acquisition of Frutarom Industries Ltd., wehave expanded our global leadership positions, which now include high-value ingredients and solutions in theFood & Beverage, Home & Personal Care and Health & Wellness markets, and across key Taste, Texture, Scent,Nutrition, Enzymes, Cultures, Soy Proteins, Pharmaceutical Excipients, Biocides and Probiotics categories.
As the information provided throughout this report is historical, it primarily reflects information about theCompany as of December 31, 2020, without giving effect to the N&B Transaction or the N&B Business.
Sales in 2020 were approximately $5.1 billion, which management believes, made us the second largestcompany in the taste, scent, nutrition and specialty ingredient industry during the period. During the past fewyears, we have diversified our customer base and leveraged our technical expertise to significantly expand ourglobal small and mid-sized customer base. Based on 2020 sales, approximately 35% were global consumerproducts companies and approximately 65% were small and mid-sized companies. During 2020, our 25 largestcustomers accounted for 39% of our sales. In 2020, no customer accounted for more than 10% of sales.
Our business is geographically diverse, with sales in the U.S. representing approximately 20% of sales in2020. No other country represented more than 6% of sales.
In 2020, we operated our business across two segments: Taste and Scent. As a result of the N&BTransaction, our business is now organized in four business segments: Nourish (a combination of IFF’s Tastebusiness with N&B’s Food & Beverage business), Scent, Health & Biosciences and Pharma Solutions.
Our Product Offerings
As of December 31, 2020, our business consisted of our Taste and Scent segments.
Taste
As a leading creator of flavor offerings, we help our customers deliver on the promise of delicious andhealthy foods and drinks that appeal to consumers. While we are a global leader, our Taste business operatesregionally in nature, with different formulas that reflect local taste preferences. Consequently, we manage ourTaste business geographically, creating products in our regional creative centers which allows us to satisfy localtaste preferences, while also helping to ensure regulatory compliance and production standards. We developthousands of different flavors and taste offerings for our customers, most of which are tailor-made, and wecontinually develop new formulas to meet changing consumer preferences and customer needs.
Our Taste business comprises a diversified portfolio across flavor compounds, savory solutions, inclusions,nutrition and specialty ingredients and flavor ingredients.
Flavor Compounds. Our flavor compounds provide unique flavors that are ultimately used by our customersin savory products (soups, sauces, meat, fish, poultry, snacks, etc.), beverages (juice drinks, carbonated or
1
flavored beverages, spirits, etc.), sweets (bakery products, candy, cereal, chewing gum, etc.) and dairy products(yogurt, ice cream, cheese, etc.).
Savory Solutions. Savory solutions include marinades or powder blends of flavors, natural colors,seasonings, functional ingredients and natural anti-oxidants that are primarily designed for the meat and fishindustry.
Inclusions. Inclusions provide taste and texture by, among other things, combining flavorings with fruit,vegetables and other natural ingredients for a wide range of food products, such as health snacks, baked goods,cereals, pastries, ice cream and other dairy products.
Nutrition and Specialty Ingredients. Our nutrition and specialty ingredients primarily consist of naturalhealth ingredients, natural food protection, natural colors and flavor ingredients. Natural health ingredientsinclude natural ingredients derived from plants and herbs, which provide, or are perceived as providing, healthbenefits. These ingredients are used in dietary supplements, functional food, infant and elderly nutrition,cosmetics, personal care and other over-the-counter products. Natural food protection ingredients consist ofnatural antioxidants and anti-microbials used for natural food preservation and shelf life extension to beverages,cosmetic and healthcare products, and pet food and feed additives. These ingredients reduce the oxidativedeterioration and/or microbiology load that leads to rancidity or loss of flavor, color, and nutritional value.Natural colors comprise a wide array of natural colors and fruit and vegetable concentrates for food, beverageand cosmetics.
Flavor Ingredients. The flavor ingredients market includes natural flavor extracts, specialty botanicalextracts, distillates, essential oils, citrus products, aroma chemicals and natural gums and resins. Such ingredientsare used for food, beverage and flavors, and are often sold directly to food and beverage manufacturers who usethem in producing consumer products.
Scent
Our global Scent business creates fragrance compounds and fragrance ingredients that are integral elementsin the world’s finest perfumes and best-known household and personal care products. We believe our uniqueportfolio of natural and synthetic ingredients, global footprint, innovative technologies and know-how, deepconsumer insight and customer intimacy make us a market leader in scent products.
Our Scent business is a vertically integrated operation, originating in our research facilities with thedevelopment of natural, synthetic and proprietary molecules and innovative delivery systems, progressing to ourcreative centers, application laboratories and consumer insight teams where our perfumers partner with ourcustomers to create unique fragrance compounds for use in a variety of end-use products. We produce theseproducts in our manufacturing facilities in a consistent, high-quality and cost-effective manner. We also producecosmetic active and functional ingredients for use in cosmetics. By providing our fragrance development teamswith an extensive portfolio of innovative, high-quality and effective ingredients to support their creativity, we areable to provide our customers with a unique identity for their brands. These ingredients or fragrance compoundscan then be combined with our innovative delivery systems which are key differentiators in the growth of ourconsumer fragrance portfolio.
Fragrance Compounds. Fragrance compounds are unique and proprietary combinations of multipleingredients that are ultimately used by our customers in their consumer goods. Our creative and commercialteams within fragrance compounds are organized into two broad categories, fine fragrances and consumerfragrances.
Our fine fragrances focus on perfumes and colognes. Our scientists and perfumers collaborate to developnew molecules, new natural extractions and innovative processes to create unique and inspiring fragrances. Wehave created some of the industry-leading fine fragrance classics as well as cutting-edge niche fragrances, asevidenced by the number of top sellers and award winners.
2

Our consumer fragrances include three end-use categories of products:
‰ Fabric Care, including laundry detergents, fabric softeners and specialty laundry products;
‰ Home Care, including household cleaners, dishwashing detergents and air fresheners; and
‰ Body Care, including personal wash, hair care and toiletries products.
Ingredients. Fragrance ingredients consist of natural and synthetic, and active and functional ingredients thatare used internally and sold to third parties, including competitors, for use in the preparation of compounds.While the principal role of our fragrance ingredients facilities is to support our fragrance compounds business,we utilize our excess manufacturing capacity to manufacture and sell certain fragrance ingredients to thirdparties. We believe that this business allows us to leverage our fixed costs while maintaining the security of oursupply for our perfumers and ultimately our customers. Fragrance ingredients available for sale to third partiesinclude innovative ingredients that leverage our manufacturing experience as well as a limited amount of cost-competitive, commodity ingredients. Fragrance ingredients also include our cosmetic active and functionalingredients, which provide biologists and cosmetic chemists with innovative solutions to address cosmeticchallenges such as skin aging and hair protection. With our separate fragrance and active and functionalingredients, plus additional botanicals and delivery systems, we believe we are a leader in the industry with thebreadth of our product portfolio.
Organization in 2021, following the N&B Transaction
As a result of the N&B Transaction, we will now be organized in four segments: Nourish, Scent, Health &Biosciences, and Pharma Solutions.
The Nourish segment consists of most of our legacy Taste segment, N&B’s Food & Beverage division andthe food protection business of N&B’s Health & Biosciences division. This segment comprises an innovative andbroad portfolio of natural-based ingredients to enhance nutritional value, texture and functionality in a widerange of beverage, dairy, bakery, confectionery and culinary applications.
The Scent segment consists of our legacy Scent segment as well as, effective January 2, 2021, our FlavorIngredients business.
The Health & Biosciences segment contains N&B’s Health & Biosciences division, with the exception offood protection, which is part of our Nourish division, as well as parts of our Nutrition and Specialty Ingredientsofferings. This segment is the biotechnology driven portfolio of the N&B Business, where enzymes, foodcultures, probiotics and specialty ingredients for food and non-food applications are developed and produced.The Health & Biosciences business includes a biotechnology-driven probiotics portfolio, that produces culturesfor use in fermented foods such as yogurt, cheese and fermented beverages. It also uses industrial fermentation toproduce enzymes and microorganisms that provide product and process performance benefits to householddetergents, animal feed, ethanol production and brewing.
The Pharma Solutions segment consists of N&B’s Pharma Solutions division, which is one of the world’slargest producers of cellulosics and alginates-based pharma excipients, and is used to improve the functionalityand delivery of active pharmaceutical ingredients, including controlled or modified drug release formulations,and enable the development of more effective pharma solutions.
Consumer Insights, Research and Product Development Process
The markets in which we compete require constant innovation to remain competitive. Consumer preferencestend to drive change in our markets, and as science evolves and sustainability continues to be a key factor tocustomers and consumers, we must continue to strengthen our research and development platforms and adapt ourcapabilities to provide differentiated products.
3
Consumer Insights
We believe that the first step to creating an innovative and unique product experience begins with gaininginsight into the consumer and emerging trends. By developing a deep understanding of what consumers valueand prefer through our consumer insight programs, we are better able to focus our research and development andcreative efforts.
Our consumer science, insight and marketing teams interpret trends, monitor product launches, analyzequantitative market data and conduct numerous consumer interviews annually. Our sensory experts directresearch programs exploring topics such as fragrance performance, the psychophysics of sensory perception(including chemesthetic properties such as warming, cooling and tingling), the genetic basis for flavor andfragrance preference and the effects of aromas on mood, performance, health and well-being.
Based on this information, we develop innovative and proprietary programs to evaluate potential productsthat enable us to understand the emotional connections between a prospective product and the consumer. Webelieve this ability to pinpoint the likelihood of a product’s success translates into stronger brand equity, resultingin increased returns and greater market share gains for our customers as well as for IFF.
Research and Development
We consider our research and development infrastructure to be one of our key competencies and critical toour ability to provide differentiated products to our customers. We focus and invest substantial resources in theresearch and development of new and innovative molecules, compounds, formulations and technologies and theapplication of these to our customers’ products. Using the knowledge gained from our consumer insightsprograms and business unit needs, we strategically focus our resources around key research and developmentplatforms that address or anticipate consumer needs or preferences. By aligning our capabilities and resources tothese platforms, we ensure the proper support and focus for each program so that they can be further developedand eventually accepted for commercial application.
As of December 31, 2020, we have been granted 430 patents in the United States, since 2000, and have 564pending patent applications. We have developed many unique molecules and delivery systems for our customersthat are used as the foundations of successful flavors and fragrances around the world.
We have historically conducted our principal basic research and development activities in Union Beach,New Jersey, where we employ scientists and application engineers who collaborate with our other research anddevelopment centers around the world, to support the:
‰ discovery of new materials;
‰ development of new technologies, such as delivery systems;
‰ creation of new compounds; and
‰ enhancement of existing ingredients and compounds.
Following the N&B Transaction, we expect that our principal basic research and development activities willcontinue in Union Beach, New Jersey, as well as in Wilmington, Delaware, Palo Alto, California, Barbrand,Denmark, and Leiden, The Netherlands. The N&B Business has strong product and application developmentpipelines built upon a global network that includes research and development, as well as regulatory and productstewardship capabilities.
As of December 31, 2020, we employed approximately 2,600 people globally in research and developmentactivities, including in key basic research and development centers in Union Beach, New Jersey, Tilburg, TheNetherlands, Neuilly and Grasse, France, and Nanjing, China.
4
Our ingredients research program discovers molecules found in natural substances and creates newmolecules that are subsequently tested for their sensorial value. To broaden our offerings of natural, innovativeand unique products, we have established a number of collaborations with research institutions and othercompanies throughout the world. We may also consider acquiring companies that could provide access to newtechnologies.
The development of new and customized flavor and fragrance compounds is a complex process calling uponthe combined knowledge of our scientists, flavorists and perfumers. Scientists from various disciplines work inproject teams with flavorists and perfumers to develop flavor and fragrance compounds with consumer preferredperformance characteristics. The development of new flavor and fragrance compounds requires (i) an in-depthknowledge of the flavor and fragrance characteristics of the various ingredients we use, (ii) an understanding ofhow the many ingredients in a consumer product interact and (iii) the creation of controlled release and deliverysystems to enhance flavor and fragrance performance. To facilitate this process, we have a scientific advisoryboard that provides external perspectives and independent feedback on our research and development andsustainability initiatives.
Creative Application
Through our global network of creative centers and application laboratories, we create or adapt the basicflavors or fragrances compounds that we have developed in the research and development process tocommercialize for use in our customers’ consumer products. Our global creative teams consist of perfumers,fragrance evaluators and flavorists, as well as marketing, consumer science, consumer insights and technicalapplication experts, from a wide range of cultures and nationalities. In close partnership with our customers’product development groups, our creative teams create the sensory experiences that our customers are seeking inorder to satisfy consumer demands in each of their respective markets.
New flavor and fragrance development is driven by a variety of sources including requests from ourcustomers, who are in need of specific flavors and fragrances for use in a new or modified consumer product, oras a result of internal initiatives stemming from our consumer insights program. Our product development teamworks in partnership with our scientists and researchers to optimize the consumer appeal and relevance of ourflavors and fragrances. We use a collaborative process between our researchers, our product development teamand our customers to perfect the flavors and fragrances so they are ready to be included in the final consumerproduct.
In addition to creating new flavors and fragrances, our researchers and product development teams advisecustomers on ways to improve their existing products by moderating or substituting current ingredients withmore readily accessible or less expensive materials enhancing their yield. This often results in creating a bettervalue proposition for our customers.
Our flavors and fragrances compound formulas are treated as trade secrets and remain our proprietaryassets. Our business is not materially dependent upon any individual patent, trademark or license.
Supply Chain
We strive to provide our customers with consistent and quality products on a timely and cost-effective basisby managing all aspects of the supply chain, from raw material sourcing through manufacturing, qualityassurance, regulatory compliance and distribution.
Procurement
In connection with the manufacture of compounds, we use natural ingredients and, primarily in ourfragrance compounds, synthetic ingredients. As of December 31, 2020, we purchased approximately 124,500different raw materials sourced from an extensive network of domestic and international suppliers anddistributors.
5
The N&B Transaction will significantly increase the number of natural products that we will source, and thepercentage of our ingredients that are natural or crop-related. Natural ingredients are derived from flowers, fruitsand other botanical products, as well as from animal and marine products, and commodity crops like wheat, cornand soy. They contain varying numbers of organic chemicals that are responsible for the fragrance, flavor,antioxidant properties and nutrition of the natural products. Natural products are purchased directly from farms orin processed and semi-processed forms. Some natural products are used in compounds in the state in which theyare obtained and others are used after further processing. Natural products, together with various chemicals, arealso used as raw materials for the manufacture of synthetic ingredients by chemical processes.
In order to ensure our supply of raw materials, achieve favorable pricing and provide timely transparencyregarding inflationary trends to our customers, we continue to focus on:
‰ purchasing under contract with fixed or formula-based pricing for set time periods;
‰ entering into supplier relationships to gain access to supplies we would not otherwise have;
‰ implementing indexed pricing;
‰ reducing the complexity of our formulations;
‰ evaluating the profitability of whether to buy or make an ingredient; and
‰ sourcing from local countries with our own procurement professionals.
Manufacturing and Distribution
As of December 31, 2020, we had 242 manufacturing facilities, creative centers and application laboratorieslocated in 47 different countries. Our major manufacturing facilities are located in the United States, TheNetherlands, Spain, Great Britain, Germany, Indonesia, Turkey, Brazil, Mexico, Slovenia, China, India, andSingapore. Based on the regional nature of the Taste business and the logistical concerns regarding the fragilenature of transporting raw materials, we have typically established smaller manufacturing facilities in our localmarkets that are focused on local needs. Products within the Scent business are typically composed ofcompounds that are more stable and more transportable. Consequently, we have fewer manufacturing facilitieswithin our Scent business, which produce compounds and ingredients for global distribution.
During the last few years, we undertook an initiative to optimize our global operations footprint toefficiently and cost-effectively deliver value to our global customers. During 2020, we announced the closure ofeleven sites, of which five sites were in Europe, Africa and Middle East, four sites were in North America andtwo sites were in Greater Asia. As a continuation of this initiative, we expect to close approximately nineadditional manufacturing sites by the end of 2021.
Our supply chain initiatives are focused on increasing capacity and investing in key technologies. Withinour more mature markets, we tend to focus on consolidation and cost optimization as well as the implementationof new technologies. In addition to our own manufacturing facilities, we develop relationships with third parties,including contract manufacturing organizations, that expand our access to the technologies, capabilities andcapacity that we need to better serve our customers.
Sustainability
Over the past several years, we have redefined the way we envision sustainability. Moving from thetraditional “take-make-dispose” model, we have embraced the circular economy model — one that is restorativeand regenerative by design, which we believe is key in safeguarding the well-being of consumers, the health ofour planet and the integrity of our business.
Customers and consumers of our products want to know if the products they are purchasing are responsiblysourced and produced in an environmentally conscious manner. Our sustainability vision and strategy are
6

designed to address these global trends, and we are committed to making real progress happen at everyopportunity. Following the N&B Transaction and the Frutarom acquisition, we have been working on evaluatingour expanded environmental footprint and integrating and updating the N&B Business and Frutarom’ssustainability practices to align them with legacy IFF sustainability practices.
In line with our purpose of applying science and creativity for a better world, our sustainability goalsinclude:
‰ Reducing Our Environmental Footprint —we seek to leverage synergies to reduce our operational impactin ways that will mitigate climate change, conserve water and reduce waste.
‰ Strengthening Responsible Sourcing —we seek to ensure ethical practices in our supply chain, reduceimpact to the environment and support workers and grower communities.
‰ Driving Sustainable Innovation —we seek to embed regenerative approaches and circular designprinciples into our products, processes and R&D pipeline.
‰ Embracing People and Communities —we seek to nurture an inclusive culture where we celebratediversity and give back to the communities where we source and operate.
In 2020, we were named for the first time to the Dow Jones Sustainability Indices, a family of best-in-classbenchmarks for investors who recognize that sustainable business practices are critical to generating long-termshareholder value. Named to both the 2020 World Index and the North America Index, this distinction validatesIFF’s leadership position in sustainability performance and underscores our commitment to executing on keyenvironmental, social and governance (ESG) priorities. We were also awarded the 2020 EcoVadis platinumsustainability rating, a highly selective designation by EcoVadis, a leading platform for monitoring sustainabilityin global supply chains. This distinction places IFF in the top 1% of companies assessed in the areas ofEnvironment, Labor & Human Rights, Ethics and Sustainable Procurement. In addition, among otherdistinctions, in 2019 we were named one of Barron’s 100 Most Sustainable Companies for the third consecutiveyear and listed in the FTSE4Good Index series as well as in the Euronext Vigeo World 120 Index for ESGperformance.
Our commitment to good governance starts with our Board and Executive Committee and is supported by astrong governance framework. This framework is implemented through our organization with frequentcommunications and trainings on best practices in governance, risk management, business conduct, complianceand ethics. Moreover, we adhere to the highest standards of ethics, integrity, honesty and respect in our dealingswith each other and our business partners. To maintain those relationships and our strong reputation, we have arobust program to ensure compliance with our Codes.
For more detailed information about our sustainability programs and performance, please refer to our annualsustainability report.
Governmental Regulation
We develop, produce and market our products in a number of jurisdictions around the world and are subjectto federal, regional and local legislation and regulations in various countries. Our products, which among otherindustries, are intended for use in food, beverage, pharmaceutical industries, home and personal care are subjectto strict quality and regulatory standards and environmental laws and regulations. We in turn are required to meetstrict standards which, in recent years, have become increasingly stringent and affect both existing as well as newproducts. While the cost of compliance with such laws and regulations leads to higher overall capitalexpenditure, which can be significant in certain periods, we do not know of any material capital expendituresnecessary to comply with such laws and regulations. We continue to monitor existing and pending laws andregulations and while the impact of regulatory changes cannot be predicted with certainty, compliance has nothad, and is not expected to have a material adverse effect on capital expenditure, earnings or competitiveposition.
7
Our products and operations are subject to regulation by governmental agencies in each of the markets inwhich we operate. These agencies include (1) the Food and Drug Administration and equivalent internationalagencies that regulate flavors, pharmaceutical excipients and other ingredients in consumer products, (2) theEnvironmental Protection Agency and equivalent international agencies that regulate our manufacturingfacilities, as well as fragrance products (including encapsulation systems) and microbial products, (3) theOccupational Safety and Health Administration and equivalent international agencies that regulate the workingconditions in our manufacturing, research laboratories and creative centers, (4) local and international agenciesthat regulate trade and customs, (5) the Drug Enforcement Administration and other local or internationalagencies that regulate controlled chemicals that we use in our operations, (6) the Chemical Registration/Notification authorities that regulate chemicals that we use in, or transport to, the various countries in which wemanufacture and/or market our products, and (7) the U.S. Department of Agriculture and equivalent internationalauthorities with respect to, among other things, labeling of consumer products. We have seen an increase inregistration and reporting requirements concerning the use of certain chemicals in a number of countries, such asRegistration, Evaluation, Authorization and Restriction of Chemicals (“REACH”) regulations in the EuropeanUnion, as well as similar regulations in other countries. The acquisitions of Frutarom and N&B will broaden thelandscape of regulatory compliance requirements applicable to IFF.
In addition, we are subject to various rules relating to health, work safety and the environment at the localand international levels in the various countries in which we operate. Our manufacturing facilities throughout theworld are subject to environmental standards relating to air emissions, sewage discharges, the use of hazardousmaterials, waste disposal practices and clean-up of existing environmental contamination. In recent years, therehas been an increase in the stringency of environmental regulation and enforcement of environmental standards,and the costs of compliance have risen significantly, a trend we expect will continue in the future.
Competition
The markets for taste and scent are part of a larger market that supplies a wide variety of ingredients andcompounds used in consumer products. The broader market includes functional foods and food additives,including seasonings, texturizers, spices, enzymes, certain food-related commodities, and fortified products, aswell as nutritional ingredients, supplements and active cosmetic ingredients.
The global market for taste and scent has expanded, primarily as a result of an increase in demand for, andan increase in the variety of, consumer products containing flavors and fragrances.
The market for taste and scent is highly competitive. Based on annual sales, our main competitors consist of(1) other large global flavor and fragrance manufacturers, Givaudan, Firmenich and Symrise, (2) mid-sizedcompanies, (3) numerous regional and local manufacturers and (4) consumer product companies who maydevelop their own flavors or fragrances.
We believe that our ability to create products with the sustainability related attributes customers expect andcompete successfully in the flavors and fragrances sub-market is based on:
‰ our in-depth understanding of consumers,
‰ vertical integration,
‰ innovation and technological advances from our research and development activities and our perfumersand flavorists,
‰ our ability to tailor products to customers’ needs,
‰ our ability to manufacture products on a global scale, and
‰ broad-based regulatory capabilities.
8

Large multi-national customers and, increasingly, mid-sized customers, may limit the number of theirsuppliers by placing some on “core lists,” giving them priority for development and production of their new ormodified products. To compete more successfully, we must make continued investments in customerrelationships and tailor our research and development efforts to anticipate customers’ needs, provide effectiveservice and secure and maintain inclusion on these “core lists.”
Private label manufacturers, mostly medium-sized, local or small food manufacturers, constitute a growingsegment in the flavor market. Over the last decade, with the strengthening of supermarket chains, onlineplatforms and growing consumer price consciousness, consumption of private label products has grown at afaster rate than the brand food industry rate. We believe that new business opportunities will continue to arisefrom these clients as they are increasing their demand for products that are similar to existing products in themarket, distinctive premium products, as well as more innovative products.
The global demand for functional foods, food additives, natural ingredients, nutritional ingredients andsupplements and active cosmetic ingredients is also growing. With our recent acquisitions, we have expanded ourofferings to include products within the functional food ingredient market, including ingredients focused onimproving the health and wellness characteristics of a consumer good, the nutritional supplement and infantnutrition markets and the cosmetic actives market. While the three other large global flavor and fragrancemanufacturers, Givaudan, Firmenich and Symrise, are active in these areas, we also compete with specialtychemical companies, other large multi-national companies and smaller regional and local participants that offerproducts that address these same needs.
Our People
The success of our business is built on our talented employees. At December 31, 2020, we hadapproximately 13,700 employees worldwide, of whom approximately 2,000 are employed in the United States.With the completion of the N&B Transaction, we added more than 10,000 employees around the world, of whomapproximately 30% are employed in the United States.
Culture and Values
Our culture is based on our five corporate values of empowerment, expertise, innovation, integrity andresponsibility, and the expression of these values can be seen and felt throughout our history. Our employeesappreciate that they contribute to products that touch and enhance the lives of millions of people around theworld. In 2020, we implemented a high-performing culture employee engagement initiative designed to furtherunderscore three key attributes of our culture: extreme accountability, bias toward action and effectivecollaboration. Throughout the year, we engaged with employees around the world as part of this initiative,including senior leader speakers, employee training, employee recognition programs and designating a largenumber of local employee ambassadors.
Leadership and Development
Our leadership development efforts empower employees to become forward-looking, inspiring and capabledecision-makers, agents of change and great leaders. To cultivate our employees’ talent and build sustainablelong-lasting careers at IFF, we offer specialized courses for employees globally by partnering with leadinginstitutions and universities to help provide the latest training and development offerings at all levels. We alsooffer to our employees an extensive library of on-demand courses and materials on leadership, management andprofessional skills development. These offerings complement our talent acquisition strategy and organized andpersonalized feedback process, supported by industry-leading assessment tools.
9
Diversity and Inclusion
We believe that our differences make us great, as captured in our diversity and inclusion (D&I) vision:“Your Uniqueness Unleashes Our Potential.” To that end, we are dedicated to nurturing a truly inclusive and fairculture through the three pillars of our D&I mission:
‰ Our People embody the mosaic of the markets we serve and are empowered to transform the future
‰ Our Spirit nurtures an inclusive and fair culture where every voice is valued and heard
‰ Our World embraces diversity of thought and strives to do more good, creating a better future for all
In 2020, IFF developed and delivered a broad range of initiatives to support our D&I vision. As part ofIFF’s journey to gender parity, the Company in 2020 underwent a rigorous global verification process andattained the Economic Dividends for Gender Equity (EDGE) certification at the MOVE level in 21 countriesworldwide, which included an examination of our gender balance across our talent pipeline, gender pay equity,the effectiveness of our framework of policies and practices that ensure equitable career flows and our ability tofoster an inclusive workplace culture for all employees. IFF also achieved 100% scores in the Disability EqualityIndex and achieved the title of best employer for LGBTQ+ employees rating with 100% scores in the HumanRights Campaign Corporate Equality Index and the HRC Equidad Mexico. At the same time, employee resourcegroups known as “colleague communities” continue to thrive and grow with women@iff and pride@iff openingnew chapters at our offices around the world and new colleague communities launching in 2020, such as SoulBlack (Brazil), Black Excellence (USA), as well as SERVE, which supports veteran and first responder issues.
Occupational Health & Safety
Employee safety is one of the cornerstones of our business. Our occupational health and safety managementsystem requires and encourages employees and supervised contractors at sites globally to uphold IFF’s protocols,report any incidents and suggest improvements that will increase the safety of work sites. Our safetymanagement system in each country is based on local regulations. In the absence of country-specificrequirements, IFF guidelines are implemented, which are based on U.S. Occupational Safety and HealthAdministration (OSHA) standards. To work toward a safer workplace, we have put in place a set of protocols andprograms related to three areas of focus: (a) safety governance (setting and updating comprehensive safetypolicies and procedures), (b) safety training of employees on local requirements and IFF policies, and (c) safetyculture characterized by awareness and communication. In response to the COVID-19 pandemic, we have beenfollowing the requirements of governmental authorities and taking additional preventative and protectivemeasures to ensure the safety of our workforce. Moreover, we have developed return-to-workplace protocols andmandatory site guidelines to continue to protect the health and safety of employees at each location and topromote an orderly and phased return for employees who have been working from home.
Availability of Reports
We make available free of charge on or through the “Investors” link on our website, www.iff.com, allmaterials that we file electronically with the Securities and Exchange Commission (“SEC”), including our annualreport on Form 10-K, quarterly reports on Form 10-Q, current reports on Form 8-K, and amendments to thosereports, filed or furnished pursuant to Section 13(a) or 15(d) of the Securities Exchange Act of 1934, as amended,as soon as reasonably practicable after electronically filing such materials with, or furnishing them to, the SEC.During the period covered by this Form 10-K, we made all such materials available through our website as soonas reasonably practicable after filing such materials with the SEC.
The SEC maintains an Internet website, www.sec.gov, that contains reports, proxy and informationstatements and other information that we file electronically with the SEC.
A copy of our Corporate Governance Guidelines, Code of Conduct, and the charters of the AuditCommittee, Compensation Committee and Nominating and Governance Committee of the Board of Directors areposted on the “Investors” section of our website, www.iff.com.
10

Our principal executive offices are located at 521 West 57th Street, New York, New York 10019(212-765-5500).
Executive Officers of Registrant
The current executive officers of the Company, as of February 22, 2021, are listed below.
Name Age Position
Andreas Fibig . . . . . . . . . . . . . 58 Chair of the Board and Chief Executive OfficerRustom Jilla . . . . . . . . . . . . . . 59 Executive Vice President and Chief Financial OfficerKathy Fortmann . . . . . . . . . . . 53 President, NourishSimon Herriott . . . . . . . . . . . . 57 President, Health & BiosciencesNicolas Mirzayantz . . . . . . . . . 58 President, ScentAngela Strzelecki . . . . . . . . . . 54 President, Pharma SolutionsFrancisco Fortanet . . . . . . . . . 52 Executive Vice President, Global Operations OfficerJennifer Johnson . . . . . . . . . . . 46 Executive Vice President, General CounselSusana Suarez-Gonzalez . . . . 51 Executive Vice President, Chief Human Resources and Diversity and
Inclusion OfficerVic Verma . . . . . . . . . . . . . . . 52 Executive Vice President, Chief Information OfficerGregory Yep . . . . . . . . . . . . . . 55 Executive Vice President, Chief Research & Development, Global
Integrated Solutions & Sustainability OfficerMichael DeVeau . . . . . . . . . . . 40 Senior Vice President, Chief Investor Relations & Communication
OfficerEtienne Laurent . . . . . . . . . . . 55 Senior Vice President, Corporate Strategy and Cost SynergiesGreg Soutendijk . . . . . . . . . . . 52 Senior Vice President, Commercial Excellence
Andreas Fibig has served as our Chair since December 2014 and Chief Executive Officer since September2014. Mr. Fibig has been a member of our Board of Directors since 2011. Mr. Fibig joined us from BayerHealthCare Pharmaceuticals, the pharmaceutical division of Bayer AG, where he served as President andChairman of the Board of Management. Prior to Bayer HealthCare Pharmaceuticals, Mr. Fibig held a number ofpositions of increasing responsibility at Pfizer Inc., a research-based pharmaceutical company, including asSenior Vice President in the US Pharmaceutical Operations group and as President, Latin America, Africa andMiddle East.
Rustom Jilla has served as our Executive Vice President and Chief Financial Officer since January 2020.From July 2015 to January 2020, Mr. Jilla served as Executive Vice President and Chief Financial Officer ofMSC Industrial Direct Co., Inc., a US-listed distributor of metalworking and maintenance repair operationsproducts. Prior to this, Mr. Jilla held group CFO roles with the Dematic Group, a global automated systemssolutions provider, and with Ansell Limited, an Australian-listed global leader in protective solutions. Earlier,Mr. Jilla worked at PerkinElmer Inc. and The BOC Group in various finance & product management leadershiproles, and he began his career with PricewaterhouseCoopers LLP. He is member of both the Institute ofChartered Accountants of Sri Lanka and the Chartered Institute of Management Accountants, United Kingdom.
Kathy Fortmann has served as our President, Nourish since October 2020. From April 2020 to October2020, Ms. Fortmann served as Global Head of Strategy & Cross-Fertilization for the Taste Division (nowNourish). Ms. Fortmann joined us from FrieslandCampina Ingredients at Royal FrieslandCampina, amultinational dairy cooperative, where she served as Business Group President from September 2017 to March2020. Prior to that, Ms. Fortmann served as a member of the Cargill Executive Team from January 2014 toSeptember 2017 and, earlier, as President, running Food Ingredients Businesses and setting up Cargill GlobalBusiness Services to provide IT, Human Resources, Finance, Transportation & Logistics, and Procurementservices. Ms. Fortmann started her career as a chemical engineer with DuPont, where she held a number ofpositions in the U.S.A. and Europe.
11
Simon Herriott has served as President, Health & Biosciences since February 2021. From 2019 to February2021, Mr. Herriott was Vice President and Global Business Director, Health & Biosciences for the N&BBusiness and from 2016 to 2019, he served as Global Business Director, Bioactives, Industrial Biosciences andVice President, Danisco Inc. Mr. Herriott was employed by DuPont’s predecessor or formerly affiliatedcompanies for 15 years and held a variety of roles, including Global Business Director, Biomaterials, IndustrialBiosciences and leadership positions for various businesses that are currently part of DuPont’s Non-Coresegment.
Nicolas Mirzayantz has served as our President, Scent since October 2018. Mr. Mirzayantz originally joinedour Company in 1988 and was our Group President, Fragrances from January 2007 to October 2018.Mr. Mirzayantz has also served as a member of our Temporary Office of the Chief Executive Officer, our SeniorVice President, Fine Fragrance and Beauty Care and Regional Manager, North America, our Senior VicePresident, Fine Fragrance and Beauty Care, and our Vice President Global Fragrance Business Development.
Angela Strzelecki has served as President, Pharma Solutions since February 2021. From 2019 to February2021, Dr. Strzelecki was Platform Leader, Pharma Solutions for the N&B Business. From 2013 to 2019,Dr. Strzelecki held a variety of leadership positions at Dupont or its formerly affiliated companies, includingPlatform Leader, Pharma Solutions for the Nutrition and Health business, Planning Director – CorporatePlanning and M&A , Global Business Director – Electronics & Communications, and the North AmericaBusiness Director – Building Innovations.
Francisco Fortanet has served as our Executive Vice President, Global Operations Officer since August2015. Prior to his current role, Mr. Fortanet held various leadership positions within the Company, includingserving as Frutarom Integration lead and Senior Vice President, Operations, Vice President, GlobalManufacturing Compounding, Vice President, Global Manufacturing, Regional Director of North AmericaOperations, the Project Manager of a special project in Ireland, and as Plant Manager in Hazlet, New Jersey.Mr. Fortanet started his career in IFF-Mexico.
Jennifer Johnson has served as Executive Vice President, General Counsel since February 2021. From 2019to February 2021, Dr. Johnson served as Associate General Counsel for the N&B Business. Dr. Johnson joinedDuPont’s predecessor or formerly affiliated companies in 2013, where she led the legal team for DuPont’sformer Industrial Biosciences business as Associate General Counsel and subsequently served as Assistant ChiefIntellectual Property Counsel for Industrial Biosciences. Prior to joining DuPont, Dr. Johnson was a Partner atthe law firm of Finnegan, Henderson, Farabow, Garrett & Dunner, L.L.P.
Susana Suarez-Gonzalez has served as our Executive Vice President, Chief Human Resources andDiversity & Inclusion Officer since February 2021. From November 2016 to February 2021,Dr. Suarez-Gonzalez served as our Executive Vice President, Chief Human Resources Officer. From 2014 to2016, Dr. Suarez-Gonzalez was Senior Vice President, Global Operations & Centers Expertise, HumanResources of Fluor Corporation, an engineering construction company. Dr. Suarez-Gonzalez began her career atFluor Corporation in 1991, and during her 25 years with the company, she held various leadership positionsacross several business groups and functions including construction, marketing, sales, project engineering andhuman resources.
Vic Verma has served as our Executive Vice President, Chief Information Officer since February 2021 andhad previously served as our Senior Vice President, Chief Information Officer from 2016 to February 2021.Before joining the Company, Mr. Verma served as Vice President of Global Infrastructure Operations atAmerican Express, a multinational financial services company. Prior to that, Mr. Verma held several otherleadership positions at American Express as well as Vice President, Division CIO and management consultingroles with GlaxoSmithKline, Bristol Myers Squibb and PricewaterhouseCoopers.
Gregory Yep has served as our Executive Vice President, Chief Research & Development, Global IntegratedSolutions & Sustainability Officer since February 2021. From June 2016 to February 2021, he serves as our
12

Executive Vice President, Chief Research & Development and Sustainability Officer. From January 2015 to June2016, Dr. Yep was Senior Vice President of Research, Development & Applications with The Kerry Group, ataste and nutrition company. Prior to The Kerry Group, Dr. Yep was Senior Vice President of R&D at PepsiCo, amultinational food, snack and beverage corporation, and was Global Vice President, Application Technologies atGivaudan Flavors and Fragrances, a multinational manufacturer of flavors, fragrances and active cosmeticingredients. Earlier in his career, Dr. Yep was at McCormick & Company, a flavor, seasonings and spicescompany, where he held executive roles of increasing responsibility in food science.
Michael DeVeau has served as our Senior Vice President, Chief Investor Relations & CommunicationsOfficer since February 2021 and had previously served as our Vice President, Investor Relations,Communications, and Chief of Staff from September 2014 to February 2021, as well as divisional ChiefFinancial Officer, Scent from 2018 to 2020 and head of Corporate Strategy from 2016 to 2018. Since joining theCompany in 2009 as head of investor relations, Mr. DeVeau has held various roles of increasing scope andresponsibility in communications, finance and strategy. Prior to joining the Company, he served in leadershippositions in investor relations, finance and corporate development at PepsiCo, a multinational food, snack andbeverage company. Mr. DeVeau began his career as an Equity Research Analyst at Citigroup InvestmentResearch.
Etienne Laurent has served as Senior Vice President, Corporate Strategy & Cost Synergies since February2021. From 2014 to February 2021, Mr. Laurent served as Divisional CFO for the N&B Business. Earlier, heheld a variety of positions at DuPont’s predecessor or formerly affiliated companies, including EMEA regionalCFO, Leader of Sourcing and Logistics for the EMEA region, and multiple roles in Treasury, Controllership,Audit and FP&A.
Greg Soutendijk has served as Senior Vice President, Commercial Excellence since February 2021. From2015 to February 2021, Mr. Soutendijk was Senior Vice President, Corporate Development. Mr. Soutendijkjoined the Company in The Netherlands as Vice President, Global Fragrance Ingredient Sales in 2006 andsubsequently served as Regional General Manager for Fragrances, Greater Asia and Regional General Manager,Greater Asia. Earlier in his career, Mr. Soutendijk held various positions at IFF and Bush Boake Allen, acompany acquired by IFF. Prior to joining IFF, Mr. Soutendijk worked in Investment Banking for Credit SuisseGroup.
ITEM 1A. RISK FACTORS.
Risk Factor Summary
The following summary highlights some of the principal risks that could adversely affect our business,financial condition or results of operations. This summary is not complete and the risks summarized below arenot the only risks we face. These risks are discussed more fully further below in this section entitled “RiskFactors” in Item 1A. of this report. These risks include, but are not limited to, the following:
‰ The COVID-19 pandemic may materially and adversely impact our operations, financial condition,results of operations and cash flows.
‰ The integration of the N&B Business may present significant challenges, and we may not realizeanticipated synergies and other benefits of the N&B Transaction.
‰ We have a substantial amount of indebtedness following the N&B Transaction, which could materiallyadversely affect our financial condition.
‰ We have incurred, and will incur, substantial direct and indirect costs as a result of the N&B Transaction.
‰ In connection with the N&B Transaction, we are required to abide by potentially significant restrictionswhich could limit our ability to undertake certain corporate actions (such as the issuance of commonstock or the undertaking of a merger or consolidation) that otherwise could be advantageous.
13
‰ We may be unable to provide (or obtain from third-parties) the same types and level of services to theN&B Business that historically have been provided by DuPont, or may be unable to provide (or obtain)them at the same cost.
‰ Our business, financial condition and results of operations may be adversely affected if we cannotnegotiate terms that are as favorable as those DuPont has received when we replace contracts after theclosing of the N&B Transaction.
‰ Our success will also depend on relationships with third parties and our pre-existing customers and thepre-existing customers of the N&B Business, which relationships may be affected by customer or third-party preferences or public attitudes about the N&B Transaction. Any adverse changes in theserelationships could adversely affect the our business, financial condition or results of operations.
‰ We may not realize all the synergies and other benefits anticipated from the Frutarom acquisition, whichcould adversely affect our business.
‰ If we are unable to successfully market to our expanded and diverse customer base, our operating resultsand future growth may be adversely affected.
‰ Failure to successfully establish and manage acquisitions, collaborations, joint ventures or partnershipscould adversely affect our growth.
‰ Our business is highly competitive, and if we are unable to compete effectively our sales and results ofoperations will suffer.
‰ Our success depends on attracting and retaining talented people within our business. Significant shortfallsin recruitment or retention could adversely affect our ability to compete and achieve our strategic goals.
‰ A significant portion of our sales is generated from a limited number of large multi-national customers,which are currently under competitive pressures that may affect the demand for our products andprofitability.
‰ We may not successfully develop and introduce new products that meet our customers’ needs, which mayadversely affect our results of operations.
‰ Natural disasters, public health crises (such as the COVID-19 outbreak), international conflicts, terroristacts, labor strikes, political crisis, accidents and other events could adversely affect our business andfinancial results by disrupting development, manufacturing, distribution or sale of our products.
‰ A disruption in our supply chain, including the inability to obtain ingredients and raw materials from thirdparties, could adversely affect our business and financial results.
‰ Volatility and increases in the price of raw materials, energy and transportation, including due to climatechange, could harm our profits.
‰ A significant data breach or other disruption to our information technology systems could disrupt ouroperations, result in the loss of confidential information or personal data, and adversely impact ourreputation, business or results of operations.
‰ We have made investments in and continue to expand our business into emerging markets, which exposesus to certain risks.
‰ The impact of currency fluctuation or devaluation in the international markets in which we operate maynegatively affect our results of operations.
‰ International economic, political, legal, compliance and business factors could negatively affect ourfinancial statements, operations and growth.
‰ Economic uncertainty may adversely affect demand for our products which may have a negative impacton our operating results and future growth.
14

‰ Increasing awareness of health and wellness are driving changes in the consumer products industry, and ifwe are unable to react in a timely and cost-effective manner, our results of operations and future growthmay be adversely affected.
‰ We are subject to increasing customer, consumer and regulatory focus on sustainability issues, which mayresult in additional costs in order to meet new requirements or integrate the N&B Business and Frutaromwith our sustainability practices.
‰ Our performance may be adversely impacted if we are not successful in managing our inventory and/orworking capital balances.
‰ Any impairment of our tangible or intangible long-lived assets, including goodwill, may adversely impactour profitability.
‰ Our funding obligations for our pension and postretirement plans could adversely affect our earnings andcash flows.
‰ The expected phase out of the London Interbank Office Rate (“LIBOR”) could impact the interest ratespaid on our variable rate indebtedness and cause our interest expense to increase.
‰ Our business may be negatively impacted as a result of the United Kingdom’s departure from theEuropean Union.
‰ If we are unable to comply with regulatory requirements and industry standards, including thoseregarding product safety, quality, efficacy and environmental impact, we could incur significant costs andsuffer reputational harm which could adversely affect results of operations.
‰ Failure to comply with environmental protection laws may cause us to close, relocate or operate one ormore of our plants at reduced production levels, and expose us to civil or criminal liability, which couldadversely affect our operating results and future growth.
‰ We could be adversely affected by violations of the U.S. Foreign Corrupt Practices Act or similar U.S. orforeign anti-bribery and anti-corruption laws and regulations in the jurisdictions in which we operate.
‰ Defects, quality issues, inadequate disclosure or misuse with respect to the products and capabilities couldadversely affect our business, reputation and results of operations.
‰ Our ability to compete effectively depends on our ability to protect our intellectual property rights.
‰ Our results of operations may be negatively impacted by the outcome of uncertainties related to litigation.
‰ Changes in our tax rates, the adoption of new U.S. or international tax legislation, or changes in existingtax laws could expose us to additional tax liabilities that may affect our future results.
‰ The N&B Transaction could result in significant tax liability, and we may be obligated to indemnifyDuPont for any such tax liability imposed on DuPont.
‰ If we fail to comply with data protection laws in the U.S. and abroad, we may be subject to fines,penalties and other costs.
Risk Factors
We routinely encounter and address risks in conducting our business. Some of these risks may cause ourfuture results to be different — sometimes materially different — than we presently anticipate. Below arematerial risks we have identified that could adversely affect our business. How we react to material futuredevelopments, as well as how our competitors and customers react to those developments, could also affect ourfuture results.
15
Risks Related to Our Business and Industry
The COVID-19 pandemic may materially and adversely impact our operations, financial condition, resultsof operations and cash flows.
COVID-19 was identified in China in late 2019 and since then has spread globally. Government authorities,including those in countries where we have manufacturing and other operations, have taken various measures totry to contain this spread, such as the closure of non-essential businesses, reduced travel, the closure of retailestablishments, the promotion of social distancing and remote working policies where appropriate. Thesemeasures have impacted and may further impact our workforce and operations, and the operations of ourcustomers, vendors and suppliers.
The COVID-19 pandemic has subjected our operations, financial condition and results of operations to anumber of risks, including, but not limited to, those discussed below:
‰ Operations-related risks: Our manufacturing plants continue to operate world-wide in compliance withthe orders and restrictions imposed by government authorities in each of our locations, and we areworking with our customers to meet their specific shipment needs. Most plants have restored operationsto historical levels, notwithstanding that certain restrictions imposed to ensure safe operations remain inplace. In some instances, the N&B Business’s manufacturing sites have reduced certain operations orfurloughed employees in response to government measures, employee welfare concerns and the impact ofCOVID-19 on the global demand and supply chain. Some of our research and development and creativeapplications centers are operating on limited schedules or with a reduced workforce of essentialemployees as a result of certain safety measures implemented by us to limit the number of the on-siteworkforce.
Our ability to continue to supply our products is highly dependent on our ability to maintain the safetyof our workforce. The ability of employees to work may be significantly impacted by individualscontracting or being exposed to COVID-19, and our operations and financial results may be negativelyaffected as a result. We have developed return-to-workplace protocols and mandatory site guidelines tocontinue to protect the health and safety of employees at each location and to promote an orderly and phasedreturn for employees who have been working from home. While we are following the requirements ofgovernmental authorities and taking additional preventative and protective measures to ensure the safety ofour workforce, there can be no assurance that these measures will be successful, and to the extent thatemployees in our manufacturing or distribution centers contract COVID-19, we may be required totemporarily close those facilities, which may result in reduced production hours, more rigorous cleaningprocesses and other preventative and protective measures for employees. Workforce disruptions of thisnature may significantly impact our ability to maintain our operations and may adversely impact ourfinancial results.
Resolving such operational challenges has increased certain costs, such as labor, shipping, andcleaning, and the failure to resolve such challenges may result in our inability to deliver products to ourcustomers and reduce sales.
‰ Supply chain-related risks: We have experienced some disruption, primarily regarding distribution ofcertain raw materials and transport logistics in markets where governments have implemented the strictestregulations. More significant disruptions may occur if the COVID-19 pandemic continues to impactmarkets around the world. In addition, as a result of disruptions or uncertainty relating to the Covid-19pandemic, we are experiencing, and may continue to experience, increased costs, delays or limitedavailability related to raw materials, shipping and transportation resources, which has negativelyimpacted, and may continue to negatively impact, our margins and operating results.
‰ Customer-related risks: We are experiencing, and may continue to experience, changes in the demandand volume for certain of our products, including due to consumption or stocking behavior changes. Forexample, ingredients used in products sold mainly in retail outlets, such as fine fragrances or taste
16

products used in retail food services, have seen a decrease in demand as these outlets have closed due toCOVID-19 related restrictions. Similarly, the N&B Business experienced COVID-19 related declines indemand from food service distribution channels and for products for the oil and gas and select industrialend-markets, including for biorefinery and microbial control. In addition, we have received requests forextensions in payment terms from some customers in select markets whose products are experiencingreduced demand.
Although we do not currently anticipate any impairment charges related to COVID-19, the continuingeffects of a prolonged pandemic could result in increased risk to us of asset write-downs and impairments,including, but not limited to, equity investments, goodwill and intangibles. Any of these events couldpotentially result in a material adverse impact on our business and results of operations.
‰ Integration execution risks: The travel and operational restrictions related to Covid-19 have changed theway we operate, interact and collaborate internally and externally. If these restrictions persist, they mayimpact our ability to prepare and implement detailed integration plans in connection with the N&BBusiness needed to achieve our revenue and cost synergy targets.
‰ Market-related risks: The funding obligations for our pension plans will be impacted by the performanceof the financial markets, particularly the equity markets and interest rates. Lower interest rates and lowerexpected asset valuations and returns can materially impact the calculation of long-term liabilities such aspension liabilities. In addition, the volatility in financial and commodities markets may have adverseimpacts on other asset valuations such as the value of the investment portfolios supporting pensionobligations. If the financial markets do not provide the long-term returns that are expected, we could berequired to make larger contributions.
In addition to the risks noted above, COVID-19 may also heighten other risks described herein,including, but not limited to, risks related to a decrease in global demand for consumer products,manufacturing disruptions, disruption or cost increases in the supply chain, price volatility for raw materials,level of indebtedness, currency fluctuations and impairment of long-lived assets. The magnitude of theimpact of the COVID-19 pandemic, including the extent of its impact on our operating and financial results,will be determined by the length of time that the pandemic continues, and while government authorities’measures relating to COVID-19 may be relaxed if and when COVID-19 abates, these measures may bereinstated as the pandemic continues to evolve. The scope and timing of any such reinstatements aredifficult to predict and may materially impact our operations in the future. As COVID-19 continues toadversely impact the broader global economy, including negatively impacting economic growth andcreating disruption and volatility in the global financial and capital markets, which increases the cost ofcapital and adversely impacts the availability of and access to capital, this could negatively affect ourliquidity, which could in turn negatively affect our business, results of operations and financial condition.The COVID-19 pandemic may also affect our operating and financial results in a manner that is notpresently known to us or that we currently do not expect to present significant risks.
The integration of the N&B Business may present significant challenges, and we may not realizeanticipated synergies and other benefits of the N&B Transaction.
The combination of large, diverse and independent businesses is complex, costly and time-consuming.Designing and building our combined operating models along with the necessary business processes, systems andinfrastructure in connection with our combination with the N&B Business may divert significant managementattention and resources and disrupt our legacy business. The failure to meet the challenges involved in integratingthe businesses and to realize the anticipated benefits of the transaction could cause an interruption of, or a loss ofmomentum in, our business activities and could adversely affect our results of operations. The overallcombination with the N&B Business may also result in material unanticipated problems, expenses, liabilities,competitive responses, employee turnover and loss of customer and other business relationships. The difficultiesof integration include, among others:
‰ the diversion of management attention to integration matters;
17
‰ integrating operations and systems, including intellectual property and communications systems,administrative and information technology infrastructure and financial reporting and internal controlsystems, some of which may prove to be incompatible;
‰ conforming standards, controls, procedures and accounting and other policies, business cultures andcompensation structures between the businesses;
‰ integrating employees and attracting and retaining key personnel, including talent;
‰ retaining existing, and obtaining new customers and suppliers;
‰ integrating and managing the expanded operations of a significantly larger and more complex company;
‰ contingent liabilities that are larger than expected; and
‰ potential unknown liabilities, adverse consequences and unforeseen increased expenses associated withthe transaction.
Many of these factors are outside of our complete control and/or will be outside the control of the N&BBusiness, and any one of them could result in lower revenues, higher costs and diversion of management timeand energy, which could materially impact the business, financial condition and results of operations of ourbusiness. We bear full responsibility for any and all N&B liabilities and issues with N&B assets following theclosing of the N&B Transaction even if related to a breach of a representation under the Merger Agreement. Tothe extent any such N&B liabilities are larger than anticipated, or an issue with an N&B asset prohibits the N&BBusiness from performing as planned, it could have an adverse impact on our business, results of operations andfinancial condition.
In addition, even if the operations of the N&B Business are integrated successfully, the full benefits of thetransaction may not be realized, including, among others, the synergies, cost savings or revenue growth that areexpected. These benefits may not be achieved within the anticipated time frame or at all. Further, additionalunanticipated costs may be incurred in the integration of the N&B Business. All of these factors could causedilution to our earnings per share, decrease or delay the projected accretive effect of the N&B Transaction, andnegatively impact the price of IFF common stock following the N&B Transaction.
The substantial amount of indebtedness that we incurred in connection with the N&B Transaction couldmaterially adversely affect our financial condition.
In connection with the N&B Transaction, our consolidated indebtedness and that of our subsidiaries includethe indebtedness incurred by N&B in the debt financings completed prior to the N&B Transaction, increasing ourindebtedness by $7.5 billion. As of December 31, 2020, our total debt consisted of $4.4 billion. Despite our levelof indebtedness, we expect to continue to have the ability to borrow additional debt.
There may be circumstances in which required payments of principal and/or interest on our debt couldadversely affect our cash flows, our operating results or our ability to return capital to our shareholders.Furthermore, our degree of leverage could adversely affect our future credit ratings. If we are unable to maintainor improve our current investment grade rating, it could adversely affect our future cost of funding, liquidity andaccess to capital markets. In addition, our current level of leverage could increase our vulnerability to sustained,adverse macroeconomic weakness, limit our ability to obtain further financing, and our ability to pursue certainoperational and strategic opportunities, including large acquisitions. Our level of indebtedness as well as ourfailure to comply with covenants under our debt instruments, could adversely affect our business, results ofoperation and financial condition or our ability to return capital to our shareholders and the additional debtinstruments may subject us to additional covenants.
We have incurred, and will incur, substantial direct and indirect costs as a result of the N&B Transaction.
We have incurred, and will incur, substantial expenses or required investments in connection with and as aresult of completing the N&B Transaction, including financial advisory, legal, accounting, consulting and otherintegration related advisory fees and expenses, regulatory filings and filing and printing fees.
18

In addition, over a period of time following the closing, we expect to incur substantial expenses inconnection with transitioning, integrating and coordinating the businesses, operations, policies and procedures ofus and the N&B Business. While we have assumed that a certain level of transaction expenses will be incurred,factors beyond our control could affect the total amount or the timing of these expenses. Many of the expensesthat will be incurred, by their nature, are difficult to estimate accurately. These costs could adversely affect ourfinancial condition and results of operations prior to the transaction and of the combined businesses following thetransaction.
In connection with the N&B Transaction, we are required to abide by potentially significant restrictionswhich could limit our ability to undertake certain corporate actions (such as the issuance of common stockor the undertaking of a merger or consolidation) that otherwise could be advantageous.
During the two year period following the closing of the N&B Transaction, we and our respectivesubsidiaries are generally prohibited from taking certain actions that could cause certain aspects of the N&BTransaction and certain historic transactions undertaken by DuPont to fail to qualify as tax-free transactionsunless we receive either (i) an opinion of counsel or (ii) a ruling from the IRS or other applicable tax authority, ineither case acceptable to DuPont (in DuPont’s discretion), to the effect that such action or actions will not cause arelevant transaction to fail to qualify as a tax-free transaction. These restrictions may limit our ability to pursuecertain strategic transactions or engage in other transactions, including using IFF common stock to makeacquisitions and in connection with equity capital market transactions or disposing of certain businesses thatmight increase the value of our business.
We may be unable to provide (or obtain from third-parties) the same types and level of services to theN&B Business that historically have been provided by DuPont, or may be unable to provide (or obtain)them at the same cost.
As part of DuPont, the N&B Business received services from DuPont. Following the N&B Transaction, wewill need to replace these services either by providing them internally from our existing services or by obtainingthem from unaffiliated third parties. These services include certain corporate level functions of which theeffective and appropriate performance is critical to our operations following the N&B Transaction. WhileDuPont will provide certain services on a transitional basis pursuant to the transition services agreements enteredinto in connection with the N&B Transaction, the duration of such services is generally limited to no longer thanthree years from the date of the separation of DuPont and the N&B Business for information technology servicesand no longer than two years from the date of the separation of DuPont and the N&B Business for all otherservices. We may be unable to replace these services in a timely manner or on terms and conditions as favorableas those the N&B Business previously received from DuPont. The costs for these services could in the aggregatebe higher than the combination of our current costs and those reflected in the historical financial statements of theN&B Business. If we are not able to replace the services provided by DuPont or we are unable to replace them atthe same cost or is delayed in replacing the services provided by DuPont, our results of operations may bematerially adversely impacted.
Our business, financial condition and results of operations may be adversely affected following the N&BTransaction if we cannot negotiate terms that are as favorable as those DuPont has received when wereplace contracts after the closing of the N&B Transaction.
As a part of DuPont, the N&B Business has been able to benefit from DuPont’s financial strength, extensivebusiness relationships and purchasing power. Following the N&B Transaction, we will not be able to leverageDuPont’s financial strength, may not have access to all of DuPont’s extensive business relationships and may nothave purchasing power similar to what the N&B Business benefited from by being a part of DuPont prior to theN&B Transaction. It is therefore possible, whether as a result of routine renegotiations of terms in the ordinarycourse of business, or as part of a request for a renewal, replacement, or amendment of a contract, that we maynot be able to negotiate terms as favorable as those DuPont has received and in the aggregate it is possible thatthe loss or renegotiation of contracts in connection with the foregoing could adversely affect our business,
19
financial condition and results of operations following the closing of the N&B Transactions by increasing costsor decreasing revenues.
Our success will also depend on relationships with third parties and our pre-existing customers and thepre-existing customers of the N&B Business, which relationships may be affected by customer or third-party preferences or public attitudes about the N&B Transaction. Any adverse changes in theserelationships could adversely affect our business, financial condition or results of operations.
Our success will depend on the ability to maintain, renew and grow our relationships with pre-existingcustomers, suppliers and other third parties of ours and of the N&B Business, and our ability to establish newrelationships. There can be no assurance that our business will be able to maintain and renew pre-existingcontracts and other business relationships or enter into or maintain new contracts and other businessrelationships, on acceptable terms, if at all. The failure to maintain important business relationships could have amaterial adverse effect on our business, financial condition or results of operations.
We may not realize all the synergies and other benefits anticipated from the Frutarom acquisition, whichcould adversely affect our business.
The full benefits of the Frutarom acquisition depend on the continuing realization of cost synergies throughglobal footprint optimization across manufacturing, the realization of procurement synergies, organizational andoperational efficiencies in overhead expenses, as well as revenue growth and synergies by leveraging customerrelationships across a much broader customer base and cross-selling legacy IFF and Frutarom capabilities. Thesebenefits and the expected revenue growth may not be achieved within the anticipated time frame or at all.Further, additional unanticipated costs may be incurred as we continue to work towards achieving the full costand revenue synergies. If the anticipated benefits from the Frutarom acquisition are not fully realized, or takelonger to realize than expected, the value of our common stock, revenues, levels of expenses and results ofoperations may be adversely affected.
If we are unable to successfully market to our expanded and diverse customer base, our operating resultsand future growth may be adversely affected.
As a result of our acquisition of Frutarom and the N&B Transaction, the number of our customerssignificantly increased and became more diverse. Our historical customer base was primarily comprised of largeand medium-sized food, beverage and consumer products companies. Based on 2020 sales, we hadapproximately 33,000 customers, approximately 65% of which are small and mid-sized companies. Followingthe N&B Transaction, our customer base has further increased significantly. This substantial increase in anddiversity of our customer base requires us to adjust, among other things, our product development,manufacturing, distribution, marketing, customer relationship and sales strategy as well as adapt corporate,information technology, finance and administrative infrastructures to support different go-to-market models. Wemay experience difficulty managing the growth of a portfolio of customers that is more diverse in terms of itsgeographical presence as well as with respect to the types of services they require and the infrastructure requiredto deliver our products. If we are unable to successfully gain market share or maintain our relationships withthese customers, our future growth could be adversely affected.
Failure to successfully establish and manage acquisitions, collaborations, joint ventures or partnershipscould adversely affect our growth.
From time to time, we evaluate acquisition candidates that may strategically fit our business and/or growthobjectives. If we are unable to successfully integrate and develop acquired businesses, we could fail to achieveanticipated synergies and cost savings, including any expected increase in revenues and operating results, whichcould have a material adverse effect on our financial results. We may also incur asset impairment charges relatedto acquisitions that reduce our earnings.
Additionally, we also evaluate and enter into collaborations, joint ventures or partnerships from time to timeto enhance our research and development efforts or expand our product portfolios and technology. The process of
20

establishing and maintaining collaborative relationships is difficult and time-consuming to negotiate, documentand implement. We may not be able to successfully negotiate such arrangements or the terms of the arrangementsmay not be as favorable as anticipated. Furthermore, our ability to generate revenues from such collaborationswill depend on our partners’ abilities and efforts to successfully perform the functions assigned to them in thesearrangements and these collaborations may not lead to development or commercialization of products in the mostefficient manner, or at all. In addition, from time to time, we have acquired, and we may acquire, only a majorityinterest in companies and provided or may provide earnouts for the former owners along with the ability, at ouroption, or obligation, at the former owners’ option, to purchase the minority interests at a future date at anestablished price. These investments may have additional risks and may not be as efficient as other operations aswe may have fiduciary or contractual obligations to the minority investors and may rely on former owners for thecontinuing operation of the acquired business. If we are unable to successfully establish and manage thesecollaborative relationships and majority investments it could adversely affect our future growth.
Our business is highly competitive, and if we are unable to compete effectively our sales and results ofoperations will suffer.
The markets in which we compete are highly competitive. We face vigorous competition from companiesthroughout the world, including multi-national and specialized companies active in flavors, fragrances, enzymes,pharmaceutical excipients, nutrition and specialty ingredients, as well as consumer product companies whichmay develop their own flavors, fragrances or ingredients. In the flavors industry, we also face increasingcompetition from ingredient suppliers that have expanded their portfolios to include flavor offerings. Some of ourcompetitors specialize in one or more of our product sub-segments, while others participate in many of ourproduct sub-segments. In addition, some of our global competitors may have more resources than we do or mayhave proprietary products that could permit them to respond to changing business and economic conditions moreeffectively than we can. Consolidation of or partnerships among our competitors may exacerbate these risks.
As we continue to enter into adjacent markets, such as cosmetic ingredients, functional foods, specialty fineingredients and nutrition products, we may face greater competition-related risks in these markets than with ourcore historic flavor and fragrances businesses. For example, the specialty fine ingredients market is more pricesensitive than the flavors market and is characterized by relatively lower profit margins. Some fine ingredientsproducts are less unique and more replaceable than competitors’ products. There is no assurance that operatingmargins will remain at current levels, which could substantially impact our business, operating results andfinancial condition.
Competition in our business is based, among other things, on innovation, product quality, regulatorycompliance, pricing, quality of customer service, the support provided by marketing and application groups, andunderstanding of consumers. It is difficult for us to predict the timing, scale and success of our competitors’actions in these areas. In particular, the discovery and development of new products, protection of our intellectualproperty and development and retention of key employees are critical to our ability to effectively compete in ourbusiness. Advancement in technologies have also enhanced the ability of our competitors to develop substitutableproducts. Increased competition by existing or future competitors, including aggressive price competition, couldresult in the loss of sales, reduced pricing and margin pressure and could adversely impact our sales andprofitability.
Failing to identify and make capital expenditures to achieve growth opportunities, being unable to makenew concepts scalable, or failing to effectively and timely reinvest in our business operations, could result in theloss of competitive position and adversely affect our financial condition or results of operations.
Our success depends on attracting and retaining talented people within our business. Significant shortfallsin recruitment or retention could adversely affect our ability to compete and achieve our strategic goals.
Attracting, developing, and retaining talented employees, including our perfumers, scientists and flavorists,is essential to the successful delivery of our products and success in the marketplace. Furthermore, as we
21
continue to focus on innovation, our need for scientists and other professionals will increase. The ability to attractand retain talented employees is critical in the development of new products and technologies which is anintegral component of our growth strategy.
Competition for employees can be intense and if we are unable to successfully integrate, motivate andreward the acquired Frutarom employees, employees from the N&B Business or our current employees in ourcombined company, we may not be able to retain them. If we are unable to retain these employees or attract newemployees in the future, our ability to effectively compete with our competitors and to grow our business couldbe adversely affected.
A significant portion of our sales is generated from a limited number of large multi-national customers,which are currently under competitive pressures that may affect the demand for our products andprofitability.
During 2020, our 25 largest customers, each of which was a multi-national consumer products company,collectively accounted for 39% of our sales in the aggregate. Large multi-national customers’ market share,especially in the consumer product industry, continues to be pressured by new smaller companies and specialtyplayers that cater to or are more adept at adjusting to the latest consumer trends, including towards naturalproducts and clean labels, changes in the retail landscape (including e-commerce and consolidation), andincreased competition from private labels, which have resulted and may continue to result in decreased demandfor our products by such multi-national customers and volume erosion, especially in our Taste business.Furthermore, consolidations amongst our customers have resulted in larger and more sophisticated customerswith greater buying power and additional negotiating strength. If such trends continue, our sales could beadversely impacted if we are not able to replace these sales.
In addition, large multi-national customers and, increasingly middle market customers, continue to utilize“core lists” of suppliers to improve margins and profitability. Typically, these “core list” suppliers are then givenpriority for new or modified products. Recently, these customers are making inclusion on their “core lists”contingent upon a supplier providing more favorable commercial terms, including rebates, which could adverselyaffect our margins. We must either offer competitive cost-in-use solutions to secure and maintain inclusion onthese “core lists” or seek to manage the relationship without being on the “core-list.” If we choose not to pursue“core-list” status due to profitability concerns or if we are unable to obtain “core-list” status, our ability tomaintain our share of these customers’ future purchases could be adversely affected and therefore our futureresults of operations.
We may not successfully develop and introduce new products that meet our customers’ needs, which mayadversely affect our results of operations.
Our ability to differentiate ourselves and deliver growth largely depends on our ability to successfullydevelop and introduce new products and product improvements that meet our customers’ needs, and ultimatelyappeal to consumers. Innovation is a key element of our ability to develop and introduce new products. Wecannot be certain that we will be successful in achieving our innovation goals, such as the development of newmolecules, new and expanded delivery systems and other technologies. We currently spend approximately 7.0%of our sales on research and development; however, this investment level may vary in the future if availableresources to invest in research and development are limited due to our ongoing integration and restructuringefforts. Our research and development investments may only generate future revenues to the extent that we areable to develop products that meet our customers’ specifications, are at an acceptable cost and achieveacceptance by the targeted consumer market. Furthermore, there may be significant lag times from the time weincur research and development costs to the time that these research and development costs may result inincreased revenue. Consequently, even when we “win” a project, our ability to generate revenues as a result ofthese investments is subject to numerous customer, economic and other risks that are outside of our control,including delays by our customers in the launch of a new product, the level of promotional support for thelaunch, poor performance of our third-party vendors, anticipated sales by our customers not being realized orchanges in market preferences or demands, or disruptive innovations by competitors.
22

Natural disasters, public health crises (such as the COVID-19), international conflicts, terrorist acts, laborstrikes, political crisis, accidents and other events could adversely affect our business and financial resultsby disrupting development, manufacturing, distribution or sale of our products.
As a company engaged in the global development, manufacture and distribution of products, we are subjectto the risks inherent in such activities, including industrial accidents, environmental events, strikes and otherlabor disputes, product quality control issues, safety, licensing requirements and other regulatory issues, as wellas natural disasters, public health crises, such as pandemics or epidemics, international conflicts, terrorist actsand other external factors over which we have no control.
While we operate research and development, manufacturing and distribution facilities throughout the world,many of these facilities are extremely specialized and certain of our research and development or creativelaboratories facilities are uniquely situated to support our research and development efforts while certain of ourmanufacturing facilities are the sole location where a specific ingredient or product is produced. If our researchand development activities or the manufacturing of ingredients or products were disrupted, the cost of relocatingor replacing these activities or reformulating these ingredients or products may be substantial, which could resultin production or development delays or otherwise have an adverse effect on our margins, operating results andfuture growth.
For example, in December 2019, there was an outbreak of a novel strain of coronavirus (COVID-19) inWuhan, China that has since spread to other regions in China and the rest of the world. As a result of restrictionsimposed by governments to contain the outbreak, a portion of our manufacturing plants and offices were requiredto close. The outbreak may result in additional or more extensive travel restrictions, closures, disruptions ofbusinesses or facilities in affected regions around the world or lead to social, economic, political or laborinstability in the affected areas may impact our, our suppliers’ or our customers’ operations. The outbreak mayadversely affect our financial condition and results of operations. At this point, the extent of such impact isuncertain.
A disruption in our supply chain, including the inability to obtain ingredients and raw materials fromthird parties, could adversely affect our business and financial results.
In connection with our manufacture of our fragrance and flavor products, we often rely on third partysuppliers for ingredients and raw materials that are integral to our manufacture of such compounds. In addition,with the N&B Transaction, we significantly increased our natural products and, as a result, the percentage of ouringredients that are natural or crop-related has increased. Our purchases of raw materials are subject tofluctuations in market price and availability caused by weather conditions, climate change, as further discussedbelow, market conditions, governmental actions and other factors beyond our control affecting us and/or oursuppliers. Import alerts or specific country regulations may impair or delay our ability to obtain sufficientquantity of certain ingredients, raw materials and naturals at the relevant manufacturing facility. In addition, ouringredient or raw material suppliers, similar to us, are subject to risks, as applicable, inherent in agriculture,manufacturing and distribution on a global scale, including industrial accidents, environmental events, strikes andother labor disputes, disruptions in supply chain or information systems, disruption or loss of key research ormanufacturing sites, product quality control, safety and environmental compliance issues, licensing requirementsand other regulatory issues, as well as natural disasters, global or local health crisis, international conflicts,terrorist acts and other external factors over which they have no control. For example, as a result of the outbreakof COVID-19, the ability of our suppliers and vendors to provide products and services to us may be impaired ordelayed. These suppliers also could become insolvent or experience other financial distress. For example, in2017, a fire at the manufacturing facility of BASF Group (“BASF”), one of our suppliers, caused them to declarea force majeure and has resulted in industry disruption due to the lack of availability of certain ingredients usedin many fragrance compounds.
These risks are enhanced since we often rely on a limited number of suppliers for particular ingredients. Ifour suppliers are unable to supply us with sufficient quantities of ingredients and raw materials to meet our
23
needs, we would need to seek alternative sources of such materials or pursue our own production of suchingredients or direct acquisition of such raw materials. However, for certain of our ingredients and raw materialswe rely on a limited number of suppliers where there are not readily available alternatives. If we are unable toobtain or manufacture alternative sources of such ingredients or raw materials at a similar cost, we would seek to(i) reformulate our compounds and/or (ii) increase pricing to reflect the higher supply cost. However, if we arenot able to successfully implement any of these alternatives, we could experience disruptions in production,increased cost of sales and a corresponding decrease in gross margin or reduced sales, especially if ourcompetitors were able to more successfully adjust to such market disruption. At the same time, industry-widesupply disruptions, such as the one caused by the BASF incident, may lead to broader market shortages and salesvolatility. Such fluctuations and decrease in gross margin could have a material adverse effect on our business,results of operations and financial condition.
Volatility and increases in the price of raw materials, energy and transportation, including due to climatechange, could harm our profits.
We use many different raw materials for our business, particularly natural products, including essential oils,extracts and concentrates derived from fruits, vegetables, flowers, woods and other botanicals, animal products,raw fruits, organic chemicals and petroleum-based chemicals, as well as, in connection with the N&B Business,gelatin, glycols, cellulose processed grains (including dextrose and glucose), guar, locust bean gum, organicvegetable oils, peels, saccharides, seaweed, soybeans, and sugars and yeasts. We have experienced pricevolatility with respect to raw materials. For example, there has been industry-wide price volatility of certainingredients used in fragrance compounds due to the BASF incident. In 2019 and 2020, we experienced increasesin the prices of certain naturals. In addition, in connection with the outbreak of COVID-19, we may experienceprice volatility of certain raw materials as a result of restrictions on travel and movement and other measuresenacted by countries around the world to contain the spread of COVID-19.
Natural products represent approximately sixty percent of our raw material spend, and we expect suchvolatility to continue in the near future. In addition, because we offer a substantial number of natural productofferings and often rely on a limited number of suppliers for certain products, this risk may be exacerbated. Thereis growing evidence that carbon dioxide and other greenhouse gases in the atmosphere may have an adverseimpact on global temperatures, weather and precipitation patterns, growing and harvesting conditions, and thefrequency and severity of extreme weather and natural disasters, such as floods, wildfires, droughts and waterscarcity. To the extent such climate change effects have a negative impact on crop size and quality, it couldimpact the availability and pricing of these natural products. If we are unable to increase the prices to ourcustomers of our products to offset raw material and other input cost increases, or if we are unable to achievecost savings to offset such cost increases, we could fail to meet our cost expectations and our profits andoperating results could be adversely affected. Increases in prices of our products to customers may lead todeclines in sales volumes, and we may not be able to accurately predict the volume impact of price increases,which could adversely affect our financial condition and results of operations.
Similarly, synthetic commodities dependent on oil feedstock are affected by climate policies and energyproduction restrictions and pricing. Energy prices are subject to significant volatility caused by, among otherthings, market fluctuations, supply and demand prices are subject to significant volatility caused by, among otherthings, market fluctuations, supply and demand, currency fluctuations, production and transportation disruptions,climate change and weather conditions, and other world events. As we source many of our raw materials globallyto help ensure quality control, if the cost of energy, shipping or transportation increases and we are unable to,timely and fully, pass along these costs to our customers, our profit margins would be adversely affected. Inconnection with our combination with the N&B Business, a majority of the revenue generated by N&BBusiness’s former Pharma Solutions segment, and to a lesser extent, the N&B’s former Food & Beverage andHealth & Biosciences segments, is pursuant to contracts which are subject to renewal annually or allow price tobe adjusted annually under certain circumstances, including changes in raw material costs. Furthermore,increasing our prices to our customers could result in long-term sales declines or loss of market share if our
24

customers find alternative suppliers or choose to reformulate their consumer products to use fewer ingredients,which could have an adverse long-term impact on our results of operations. Our ability to price our productscompetitively to timely reflect volatility in prices of raw material and ingredients is critical to maintain and growour sales. To mitigate our sourcing risk, we maintain strategic stock levels for critical items. However, if we donot accurately estimate the amount of raw materials that will be used for the geographic region in which we willneed these materials or competitively price our products, our margins could be adversely affected.
A significant data breach or other disruption to our information technology systems could disrupt ouroperations, result in the loss of confidential information or personal data, and adversely impact ourreputation, business or results of operations.
We rely on information technology systems, including some managed by third-party providers, to conductbusiness and support our business processes, including those relating to product formulas, product development,manufacturing, sales, order and invoice processing, production, distribution, internal communications andcommunications with third parties throughout the world, processing transactions, summarizing and reportingresults of operations, complying with regulatory, tax or legal requirements, and collecting and storing customer,supplier, employee and other stakeholder information. Cyber security incidents, data breaches and operationaldisruptions are constantly evolving, becoming more sophisticated and are conducted by groups and individualswith a wide range of expertise and motives, including foreign governments, cyber terrorists, cyber criminals andmalicious employees and other insiders and outsiders. We and our third-party providers are subject to risks posedby such incidents, which can take many forms, including code anomalies, “Acts of God,” data leakage, hardwareor software failures, human error, cyber extortion, password theft or introduction of viruses, malware, andransomware, including through phishing emails.
A disruption to our information technology systems could result in the loss of confidential business,customer, supplier or employee information, litigation or fines and may require substantial investigations, repairsor replacements, or impact our ability to summarize and report financial results in a timely manner, resulting insignificant financial, legal, and relational costs and potentially harming our reputation and adversely impactingour operations, customer service and results of operations. As we work on upgrading and integrating N&B’s andFrutarom’s systems, these risks may be exacerbated. Additionally, a security or data breach could require us todevote significant management and financial resources to address the problems created, and, as a result of theprivate rights of action provided for under the EU’s General Data Protection Regulation (the “GDPR”), theCalifornia Consumer Privacy Act (the “CCPA”) and other laws relating to data protection and privacy in otherjurisdictions, in the event of such breaches, additional private litigation against us may result. These types ofadverse impacts could also occur in the event the confidentiality, integrity or availability of company, customer,supplier or employee information are compromised due to a data loss by us or a trusted third party. We or thethird parties with which we share information may not discover any such incidents and loss of information for asignificant period of time after the incident occurs. In addition, as a result of COVID-19, we are facing increasedoperational challenges as we take measures to support and protect employee health and safety, includingimplementing work-from-home policies for employees. In particular, our remote work arrangements, coupledwith stay-at-home orders, may pose challenges for our employees and our IT systems and extended periods ofremote work arrangements could introduce operational risk, including cybersecurity and IT systems managementrisks. Although we have developed systems and processes that are designed to protect our data and customer dataand to prevent data loss and other security breaches and expect to continue to expend additional resources tobolster these protections, these security measures cannot provide absolute security and we may be unable todetect or prevent a breach or disruption in the future. Additionally, while we have insurance coverage designed toaddress certain aspects of cyber risks in place, such insurance coverage may be insufficient to cover all losses orall types of claims that may arise.
We have made investments in and continue to expand our business into emerging markets, which exposesus to certain risks.
As part of our growth strategy, we have increased our presence in emerging markets by expanding ourmanufacturing presence, sales organization and product offerings in these markets, and we expect to continue to
25
expand our business in these markets. With our acquisition of Frutarom in 2018 and the closing of the N&BTransaction in February 2021, each of which also had a significant presence in emerging markets, our business inthese markets has meaningfully grown. In addition to the currency and international risks described below, ouroperations in these markets may be subject to a variety of other risks. Emerging markets typically have aconsumer base with limited or fluctuating disposable income and customer demand in these markets mayfluctuate accordingly. As a result, decrease in customer demand in emerging markets may have an adverse effecton our ability to execute our growth strategy.
Further, there is no assurance that our existing products, variants of our existing products or new productsthat we make, manufacture, distribute or sell will be accepted or be successful in any particular developing oremerging market, due to local or global competition, product price, cultural differences, consumer preferences orotherwise. In addition, emerging markets may have weak legal systems which may affect our ability to enforceour intellectual property and contractual rights, exchange controls, unstable governments and privatization orother government actions that may affect taxes, subsidies and incentive programs and the flow of goods andcurrency. In conducting our business, we move products from one country to another and may provide services inone country from a subsidiary located in another country. Accordingly, we are vulnerable to abrupt changes intrade, customs and tax regimes in these markets. If we are unable to expand our business in developing andemerging markets, effectively operate, or manage the risks associated with operating in these markets, or achievethe return on capital we expect from our investments in these markets, our operating results and future growthcould be adversely affected.
The impact of currency fluctuation or devaluation in the international markets in which we operate maynegatively affect our results of operations.
We have significant operations outside the U.S., the results of which are reported in the local currency andthen translated into U.S. dollars at applicable exchange rates for inclusion in our consolidated financialstatements. The exchange rates between these currencies and the U.S. dollar have fluctuated and will continue todo so in the future. For example, as of July 1, 2018, we concluded that Argentina’s economy is highlyinflationary under US GAAP, as it has experienced cumulative inflation of approximately 100% or more over athree-year period. While our current operations in Argentina represent less than 3% of our consolidated net salesand less than 1% of our consolidated total assets, continuing inflation in Argentina could adversely affect ourprofitability in a specific period. Changes in exchange rates between these local currencies and the U.S. dollarwill affect the recorded levels of sales, profitability, assets and/or liabilities. Additionally, volatility in currencyexchange rates may adversely impact our financial condition, cash flows or liquidity. Although we employ avariety of techniques to mitigate the impact of exchange rate fluctuations, including sourcing strategies and alimited number of foreign currency hedging activities, we cannot guarantee that such hedging and riskmanagement strategies will be effective, and our results of operations could be adversely affected.
International economic, political, legal, compliance and business factors could negatively affect ourfinancial statements, operations and growth.
We operate on a global basis, with manufacturing and sales facilities in or supply arrangements withcompanies based in the U.S., Europe, Africa, the Middle East, Latin America, and Greater Asia. During 2020,approximately 80% of our combined net sales were to customers outside the U.S. and we intend to continueexpansion of our international operations. As a result, our business is increasingly exposed to risks inherent ininternational operations. These risks, which can vary substantially by location, include the following:
‰ governmental laws, regulations and policies adopted to manage national economic and macroeconomicconditions, such as increases in taxes, austerity measures that may impact consumer spending, monetarypolicies that may impact inflation rates, employment regulations, currency fluctuations or controls andsustainability of resources;
‰ changes in environmental, health and safety regulations, such as regulations related to biodiversity or thecontinued implementation and evolution of the European Union’s REACH regulations and similar
26

regulations that are being evaluated and adopted in other markets, and the burdens and costs of ourcompliance with such regulations which may differ significantly across jurisdictions;
‰ increased environmental, health and safety regulations or the loss of necessary environmental permits incertain countries;
‰ increased product labeling and ingredient prohibitions in specific markets that may impact consumerpreference products costs and/or customer acceptance;
‰ the imposition of or changes in customs, tariffs, quotas, trade barriers, other trade protection measures,import or export licensing requirements, and sanctions on trade with certain countries, imposed by theU.S. or other countries, which could adversely affect our cost or ability to import raw materials or exportour products to surrounding markets;
‰ risks and costs arising from our ability to cater to local demand and customer preferences, language andcultural differences;
‰ changes in the laws and policies that govern foreign investment in the countries in which we operate,including the risk of expropriation or nationalization, the costs and ability to repatriate the profit that wegenerate in these countries;
‰ risks and costs associated with complying with anti-money laundering and counter-terrorism financinglaws;
‰ risks and costs associated with political and economic instability, bribery and corruption, anti-Americansentiment, and social and ethnic unrest in the countries in which we operate;
‰ difficulty in recruiting and retaining trained local personnel;
‰ natural disasters, global or local health crisis, pandemics (such as the COVID-19 pandemic), epidemics orinternational conflicts, including terrorist acts, political crisis, national and regional labor strikes in thecountries in which we operate, which could endanger our personnel, interrupt our operations or adverselyaffect the demand for our products, the results of certain regions or our global supply chain; or
‰ the risks of operating in developing or emerging markets in which there are significant uncertaintiesregarding the interpretation, application and enforceability of laws and regulations and the enforceabilityof contract rights and intellectual property rights.
The occurrence of any one or more of these factors could increase our costs and adversely affect our resultsof operations.
Economic uncertainty may adversely affect demand for our products which may have a negative impacton our operating results and future growth.
Our products are a subset of a wide assortment of global consumer products throughout the world.Historically, demand for consumer products using our products, such as flavors and fragrance compounds andingredients, was stimulated and broadened by changing social habits and consumer needs, population growth, anexpanding global middle-class and general economic growth, especially in emerging markets. However, impactsof the ongoing COVID-19 pandemic have resulted in increased volatility and economic uncertainty, and maylead to significant negative impacts on consumer spending, demand for our products, the ability for ourcustomers to pay or our suppliers to supply, our financial condition and the financial condition of our suppliers orcustomers. It is currently anticipated that these challenging economic uncertainties will continue to affect certainof our markets during 2021 which could adversely affect our sales, profitability and overall operating results.Even prior to COVID-19, the global economy had experienced significant recessionary pressures and declines inconsumer confidence and economic growth. The predictions surrounding the global recessionary economicenvironment has, and may in the near future, increase unemployment and underemployment, decrease salariesand wage rates, increase inflation or result in other market-wide cost pressures that will adversely affect demand
27
for consumer products in both developed and emerging markets. In addition, growth rates in the emergingmarkets have moderated from previous levels. Reduced consumer spending may cause changes in our customerorders including reduced demand for our flavors and fragrances compounds or ingredients, or ordercancellations. The timing of placing of orders and the amounts of these orders are generally at our customers’discretion. Customers may cancel, reduce or postpone orders with us on relatively short notice. Significantcancellations, reductions or delays in orders by customers could affect our quarterly results.
Increasing awareness of health and wellness are driving changes in the consumer products industry, and ifwe are unable to react in a timely and cost-effective manner, our results of operations and future growthmay be adversely affected.
We must continually anticipate and react, in a timely and cost-effective manner, to changes in consumerpreferences and demands, including changes in demand driven by increasing awareness of health and wellnessand demands for transparency or cleaner labels with respect to product ingredients by consumers and regulators.Consumers, especially in developed economies such as the U.S. and Western Europe, are rapidly shifting awayfrom products containing artificial ingredients to all-natural, healthier alternatives. In addition, there has been agrowing demand by consumers, non-governmental organizations and, to a lesser extent, governmental agenciesto provide more transparency in product labeling and our customers have been taking steps to address thisdemand, including by voluntarily providing product-specific ingredients disclosure. These two trends couldaffect the types and volumes of our ingredients and compounds that our customers include in their consumerproduct offerings and, therefore, affect the demand for our products. If we are unable to react to or anticipatethese trends in a timely and cost-effective manner, our results of operations and future growth may be adverselyaffected.
We are subject to increasing customer, consumer, shareholder and regulatory focus on sustainability,which may result in additional costs in order to meet new requirements or integrate the N&B Business andFrutarom with our sustainability practices.
Federal, state, local and foreign governments, our customers and consumers are becoming increasinglysensitive to environmental and other sustainability issues. In response, we have committed to a sustainabilitystrategy through which we continue to assess our combined environmental footprint following the N&BTransaction and the Frutarom acquisition, with the intent of identifying synergies, gaps and opportunities in oursustainability efforts.
As part of our assessment so far, we have been upgrading Frutarom’s sustainability practices to better alignthem to our legacy IFF practices and we have begun integrating the N&B Business’ practices, both of which mayrequire significant costs and time to implement. Our assessment may reveal additional gaps between the N&BBusiness or Frutarom operations on the one hand and our sustainability practices and goals on the other hand,which may require significant costs to remedy.
Despite our efforts, the increased focus on sustainability may result in new regulations and customerrequirements that could affect us. These could cause us to incur additional direct costs or to make changes to ouroperations in order to comply with any new regulations and customer requirements. We could also lose revenueif our customers divert business from us because we have not complied with their sustainability requirements orif we are not successful in integrating N&B Business’ and Frutarom’s sustainability metrics. These potentialcosts, changes and loss of revenue could have a material adverse effect on our business, results of operations andfinancial condition.
Our performance may be adversely impacted if we are not successful in managing our inventory and/orworking capital balances.
We evaluate our inventory balances of materials based on shelf life, expected sourcing levels, known usesand anticipated demand based on forecasted customer order activity and changes in our product/sales mix.
28

Efficient inventory management is a key component of our business success, financial returns and profitability.To be successful, we must maintain sufficient inventory levels and an appropriate product/sales mix to meet ourcustomers’ demands, without allowing those levels to increase to such an extent that the costs associated withstoring and holding other inventory adversely impact our financial results. If our buying decisions do notaccurately predict sourcing levels, customer trends or our expectations about customer needs are inaccurate, wemay have to take unanticipated markdowns or impairment charges to dispose of the excess or obsolete inventory,which can adversely impact our financial results. Additionally, we believe excess inventory levels of rawmaterials with a short shelf life in our manufacturing facilities subjects us to the risk of increased inventoryshrinkage. If we are not successful in managing our inventory balances and shrinkage, our results of and cashflows from operations may be negatively affected.
We sell certain accounts receivable on a non-recourse basis to unrelated financial institutions under“factoring” agreements that are sponsored, solely and individually, by certain customers. The cost ofparticipating in these programs was immaterial to our results in all periods. Should we choose not to participate,or if these programs were no longer available, it could reduce our cash flows from operations in the period inwhich the arrangement ends.
Any impairment of our tangible or intangible long-lived assets, including goodwill, may adversely impactour profitability.
A significant portion of our assets consists of long-lived assets, including tangible assets such as ourmanufacturing facilities, and intangible assets, including goodwill.
As a result of our recent acquisitions, including the 2018 acquisition of Frutarom, as of December 31, 2020,we had recorded approximately $8.3 billion of intangible assets and goodwill, including $4.3 billion of goodwillassociated with the acquisition of Frutarom. The N&B Transaction will add approximately $20.5 billion ofgoodwill and other intangible assets to IFF’s consolidated balance sheet. Our results of operations and financialposition in future periods could be negatively impacted should future impairments of our long-lived assets,including intangible assets or goodwill occur.
At least annually, we assess both goodwill and indefinite-lived intangible assets for impairment. We test forimpairment by comparing the estimated fair value of a reporting unit with its carrying amount. If the carryingamount of a reporting unit exceeds its estimated fair value, we record an impairment charge based on thedifference of the two. Intangible assets with finite lives are also tested for impairment when events or changes incircumstances indicate the carrying value may not be recoverable. Such events and changes in circumstancescould include a sustained decrease in our market capitalization, increased competition or unexpected loss ofmarket share, increased input costs beyond projections (for example due to regulatory or industry changes), ourinability to recognize the anticipated benefits of acquisitions, unexpected business disruptions (for example dueto a natural disaster, public health crises, such as pandemics or epidemics or loss of a customer, supplier, or othersignificant business relationship), acts by governments and courts, operating results falling short of projections,or significant adverse changes in the markets in which we operate.
Fair value determinations require considerable judgment and are sensitive to changes in underlyingassumptions, estimates and market factors. Estimating the fair value of reporting units requires us to makeassumptions and estimates regarding our business performance, future plans, future annual net cash flows,income tax considerations, discount rates, growth rates, and based on industry, economic, regulatory conditionsand other market factors. Moreover, management will make significant accounting judgments and estimates forthe application of acquisition accounting under GAAP, and the underlying valuation models. IFF’s business,operating results and financial condition could be materially and adversely impacted in future periods if IFF’saccounting judgments and estimates related to these models prove to be inaccurate.
To the extent any of our acquisitions, including the acquisitions of Frutarom and the N&B Business, do notperform as anticipated and our underlying assumptions and estimates related to their fair value determination are
29
not met, whether due to internal or external factors, the value of such assets may be negatively affected and wemay be required to record impairment charges.
Our funding obligations for our pension and postretirement plans could adversely affect our earnings andcash flows.
The funding obligations for our pension plans are impacted by the performance of the financial markets,particularly the equity markets and interest rates. Funding obligations are determined under governmentregulations and are measured each year based on the value of assets and liabilities on a specific date. If thefinancial markets do not provide the long-term returns that are expected under the governmental fundingcalculations, we could be required to make larger contributions. The equity markets can be very volatile, andtherefore our estimate of future contribution requirements can change dramatically in relatively short periods oftime. Similarly, changes in interest rates and legislation enacted by governmental authorities can impact thetiming and amounts of contribution requirements. An adverse change in the funded status of the plans couldsignificantly increase our required contributions in the future and adversely impact our liquidity.
Assumptions used in determining projected benefit obligations and the fair value of plan assets for ourpension and other postretirement benefit plans are determined by us in consultation with outside consultants andadvisors. In the event that we determine that changes are warranted in the assumptions used, such as the discountrate, expected long-term rate of return on assets, or expected health care costs, our future pension andpostretirement benefit expenses could increase or decrease. Due to changing market conditions or changes in theparticipant population, the assumptions that we use may differ from actual results, which could have a significantimpact on our pension and postretirement liabilities and related costs and funding requirements.
The expected phase out of the London Interbank Office Rate (“LIBOR”) could impact the interest ratespaid on our variable rate indebtedness and cause our interest expense to increase.
In 2017, the United Kingdom’s Financial Conduct Authority, which regulates LIBOR, announced that itintends to phase out LIBOR by the end of 2021. Currently there is no definitive information regarding the futureutilization of LIBOR or of any particular replacement rate. Borrowings under our revolving credit and term loanfacilities are at variable interest rates based on LIBOR. Although our revolving credit and term loan facilitiesinclude mechanics to facilitate the adoption by us and our lenders of an alternative benchmark rate in place ofLIBOR, no assurance can be made that such alternative rate will perform in a manner similar to LIBOR and mayresult in interest rates that are higher or lower than those that would have resulted had LIBOR remained in effect.
Our business may be negatively impacted as a result of the United Kingdom’s departure from theEuropean Union.
We currently manufacture goods in the United Kingdom for distribution in the European Union and vice-versa and therefore may be adversely affected as a result of the United Kingdom’s departure from the EuropeanUnion (“Brexit”) in 2020. The impact of the withdrawal could, among other outcomes, exacerbate the disruptionof the free movement of goods, services and people between the United Kingdom and the European Union,undermine bilateral cooperation in key geographic areas and significantly disrupt trade between the UnitedKingdom and the European Union or other nations as the United Kingdom pursues independent trade relations.In addition, Brexit has caused legal uncertainty, which could last indefinitely, and may potentially createdivergent national laws and regulations as the United Kingdom determines which European Union laws toreplace or replicate. Given the lack of comparable precedent, it is unclear what the financial, trade and legalimplications of the withdrawal of the United Kingdom from the European Union will be and how the withdrawalwill affect us. Adverse consequences concerning Brexit or the European Union could include deterioration inglobal economic conditions, instability in global financial markets, political uncertainty, volatility in currencyexchange rates, or adverse changes in the cross-border agreements currently in place, any of which could have anadverse impact on our financial results in the future.
30

Risks Related to Legal and Regulatory Considerations
If we are unable to comply with regulatory requirements and industry standards, including thoseregarding product safety, quality, efficacy and environmental impact, we could incur significant costs andsuffer reputational harm which could adversely affect results of operations.
The development, manufacture and sale of our products are subject to various regulatory requirements ineach of the countries in which our products are developed, manufactured and sold. In addition, we are subject toproduct safety and compliance requirements established by governments, non-governmental organizations,including industry or similar oversight bodies, or contractually by our customers, including requirementsconcerning product safety, quality and efficacy, environmental impacts (including packaging, energy and wateruse and waste management) and other sustainability or similar issues. Changes to regulations or theimplementation of additional regulations, especially in certain highly regulated markets served by us followingthe N&B Transaction, such as regulatory modernization of food safety laws and evolving standards andregulations affecting pharmaceutical excipients, microbials, or in reaction to new or next-generationtechnologies, including advances in protein engineering, gene editing and gene mapping, or novel uses ofexisting technologies has required and may in the future require us to reduce or remove certain ingredients,substances or processing aids from the product portfolio and may result in significant costs or capitalexpenditures or require changes in business practice that could result in reduced margins or profitability. We usea variety of strategies, methodologies and tools to minimize the likelihood of product or process non-compliancewith these regulations and standards by (i) monitoring regulatory developments and current product standards,(ii) assessing relative risks in our supply chain, (iii) monitoring internal and external performance and (iv) testingraw materials and finished goods. As concerns regarding safety, quality and environmental impact become morepressing, we may see new, more restrictive regulations adopted that impact our products. For example, theEuropean Chemicals Agency has proposed that the European Commission adopt a ban on microplastics,including those found in personal care items, detergents and cosmetics, to reduce plastics pollution. If this ban isadopted, we will be required to modify our products and/or innovate new solutions to replace microplastics in ourproducts. If we are unable to adapt to these new regulations or standards in a cost effective and timely manner,we may lose business to competitors who are able to provide compliant products.
Gaps in our operational processes or those of our suppliers or distributors can result in products that do notmeet our quality control or industry standards or fail to comply with the relevant regulatory requirements, whichin turn can result in finished consumer goods that do not comply with applicable standards and requirements.Products that are mislabeled, contaminated or damaged could result in a regulatory non-compliance event or evena product recall by the FDA or a similar foreign agency. Our contracts often require us to indemnify ourcustomers for the costs associated with a product non-compliance event, including penalties, costs andsettlements arising from litigation, remediation costs or loss of sales. As our flavors and fragrance compoundsand ingredients and our nutrition and health, food and beverage and pharma offerings are used in many productsintended for human use or consumption, these consequences would be exacerbated if we or our customer did notidentify the defect before the product reaches the consumer and there was a resulting impact at the consumerlevel. Such a result could lead to potentially large-scale adverse publicity, negative effects on consumer’s health,recalls and potential litigation, fines, penalties, sanctions or other regulatory actions. In addition, if we do nothave adequate insurance or contractual indemnification from suppliers or other third parties, or if insurance orindemnification is not available, the liability relating to product or possible third-party claims arising frommislabeled, contaminated or damaged products could adversely affect our business, financial condition or resultsof operations. Furthermore, adverse publicity about our products, or our customers’ products that contain ouringredients, including concerns about product safety or similar issues, whether real or perceived, could harm ourreputation and result in an immediate adverse effect on our sales and customer relationships, as well as require usto utilize significant resources to rebuild our reputation.
31
Failure to comply with environmental protection laws may cause us to close, relocate or operate one ormore of our plants at reduced production levels, and expose us to civil or criminal liability, which couldadversely affect our operating results and future growth.
Our business operations and properties procure, make use of, manufacture, sell, and distribute substancesthat are sometimes considered hazardous and are therefore subject to extensive and increasingly stringent federal,state, local and foreign laws and regulations pertaining to protection of the environment, including air emissions,sewage discharges, the use of hazardous materials, waste disposal practices and clean-up of existingenvironmental contamination.
Failure to comply with these laws and regulations or any future changes to them may result in significantconsequences to us, including the need to close or relocate one or more of our production facilities,administrative, civil and criminal penalties, fines, sanctions, litigation, costly remediation measures, liability fordamages and negative publicity. If we are unable to meet production requirements, we can lose customer orders,which can adversely affect our future growth or we may be required to make incremental capital investments toensure supply. For example, we recently completed negotiations with the Chinese government concerning therelocation of a second fragrance facility in China. Idling of facilities or production modifications has caused ormay cause customers to seek alternate suppliers due to concerns regarding supply interruptions and thesecustomers may not return or may order at reduced levels even once issues are remediated. If thesenon-compliance issues reoccur in China or occur or in any other jurisdiction, we may lose business and may berequired to incur capital spending above previous expectations, close a plant, or operate a plant at significantlyreduced production levels on a permanent basis, and our operating results and cash flows from operations may beadversely affected.
We could be adversely affected by violations of the U.S. Foreign Corrupt Practices Act or similar U.S. orforeign anti-bribery and anti-corruption laws and regulations in the jurisdictions in which we operate.
The global nature of our business, the significance of our international revenue and our focus on emergingmarkets create various domestic and local regulatory challenges and subject us to risks associated with ourinternational operations. The U.S. Foreign Corrupt Practices Act, or FCPA, and similar anti-bribery and anti-corruption laws and regulations in other countries generally prohibit companies and their intermediaries frommaking improper payments to foreign officials for the purpose of obtaining or keeping business or for othercommercial advantage. In addition, U.S. public companies are required to maintain records that accurately andfairly represent their transactions and have an adequate system of internal accounting controls. Under the FCPA,U.S. companies may be held liable for the corrupt actions taken by directors, officers, employees, agents, or otherstrategic or local partners or representatives. As such, if we or our intermediaries fail to comply with therequirements of the FCPA or similar legislation, governmental authorities in the U.S. and elsewhere could seekto impose substantial civil and/or criminal fines and penalties which could have a material adverse effect on ourbusiness, reputation, operating results and financial condition.
We operate or may pursue opportunities in some jurisdictions, such as China, India, Brazil, Russia andAfrica, that pose potentially elevated risks of fraud or corruption or increased risk of internal control issues. Incertain jurisdictions, compliance with anti-bribery laws may conflict with local customs and practices. From timeto time, we have conducted and will conduct internal investigations of the relevant facts and circumstances,control testing and compliance reviews, and take remedial actions, when appropriate, to help ensure that we arein compliance with applicable corruption and similar laws and regulations. For example, in August 2019, duringthe integration of Frutarom, we were made aware of allegations that two Frutarom businesses operatingprincipally in Russia and Ukraine made certain improper payments, including to representatives of a number ofcustomers. Our investigation substantiated the allegations that improper payments to representatives of customerswere made and that key members of Frutarom’s senior management at the time were aware of such payments.We did not uncover any evidence suggesting that such payments had any connection to the U.S. In addition,Frutarom grew through rapid acquisition and, as part of our integration efforts, we have implemented our anti-corruption and similar policies throughout a number of those acquired companies, many of which were notpreviously subject to these U.S. laws.
32

Detecting, investigating and resolving actual or alleged violations of the FCPA or other anti-bribery andanti-corruption laws and regulations is expensive, could consume significant time and attention of our seniormanagement and could subject us to investigations and inquiries by governmental and other regulatory bodies.Any allegations of non- compliance with such laws and regulations could have a disruptive effect on ouroperations in such jurisdiction, including interruptions of business or loss of third-party relationships, which maynegatively impact our results of operations or financial condition. Any determination that our operations oractivities are not in compliance with such laws and regulations could expose us to severe criminal or civilpenalties or other sanctions, significant fines, termination of necessary licenses and permits, and penalties orother sanctions that may harm our business and reputation.
Defects, quality issues, inadequate disclosure or misuse with respect to the products and capabilities couldadversely affect our business, reputation and results of operations.
Defects in, misuse of, quality issues with respect to or inadequate disclosure of risks relating to ourproducts, could lead to lost profits and other economic damage, property damage, personal injury or otherliability resulting in third-party claims, criminal liability, significant costs, damage to our reputation and loss ofbusiness. Any of these factors could adversely affect our business, financial condition and our results ofoperations.
Our ability to compete effectively depends on our ability to protect our intellectual property rights.
We rely on patents, trademarks, copyrights and trade secrets to protect our intellectual property rights. Weoften rely on trade secrets to protect our proprietary fragrance and flavor formulations, as well as ourmanufacturing processes, extract methodologies, and processes for our nutrition, natural colors for food andnatural antioxidants for food protection, as this does not require us to publicly file information regarding ourintellectual property. From time to time, a third party may claim that we have infringed upon or misappropriatedtheir intellectual property rights, or a third party may infringe upon or misappropriate our intellectual propertyrights. We could incur significant costs in connection with legal actions to assert our intellectual property rightsagainst third parties or to defend ourselves from third-party assertions of invalidity, infringement,misappropriation or other claims. Any settlement or adverse judgment resulting from such litigation couldrequire us to obtain a license to continue to use the intellectual property rights that are the subject of the claim, orotherwise restrict or prohibit our use of such intellectual property rights. Any required licensing fees may not beavailable to us on acceptable terms, if at all. For those intellectual property rights that are protected as tradesecrets, this litigation could result in even higher costs, and potentially the loss of certain rights, since we wouldnot have a perfected intellectual property right that precludes others from making, using or selling our productsor processes. The ongoing trend among our customers towards more transparent labeling could further diminishour ability to effectively protect our proprietary flavor formulations.
We vigilantly protect our intellectual property rights, including trade secrets. We have designed andimplemented internal controls intended to restrict access to and distribution of our respective intellectualproperty. Despite these precautions, our intellectual property is vulnerable to unauthorized access throughemployee error or actions, theft and cybersecurity incidents, and other security breaches. Protecting intellectualproperty related to biotechnology is particularly challenging because theft is difficult to detect and biotechnologycan be self-replicating. Accordingly, the impact of such theft can be significant.
For intellectual property rights that we seek to protect through patents, we cannot be certain that theserights, if obtained, will not later be opposed, invalidated, or circumvented. In addition, even if such rights areobtained in the U.S., the laws of some of the other countries in which our products are or may be sold do notprotect intellectual property rights to the same extent as the laws of the US. If other parties were to infringe onour intellectual property rights, or if our intellectual property rights were the subject of unauthorized accessleading to competitive pressure or if a third party successfully asserted that we had infringed on their intellectualproperty rights, it could materially and adversely affect our future results of operations by, among other things,(i) being required to cease production and marketing or reducing the price that we could obtain in the
33
marketplace for products which are based on such rights, (ii) increasing the royalty or other fees that we may berequired to pay in connection with such rights, (iii) limiting the volume, if any, of such products that we can sellor (iv) resulting in significant litigation costs and potential liability.
Our results of operations may be negatively impacted by the outcome of uncertainties related to litigation.
From time to time we are involved in a number of legal claims, regulatory investigations and litigation,including claims related to intellectual property, product liability, environmental matters and indirect taxes. Forinstance, product liability claims may arise due to the fact that we supply flavors and fragrances to the food andbeverage, functional food, pharma/nutraceutical and personal care industries. Our manufacturing and otherfacilities may expose us to environmental claims and regulatory investigations. In addition, as we expand ourproduct offering into functional food, nutraceuticals, and natural antioxidants, we may also be subject to claimsof false or deceptive advertising claims in the U.S., Europe and other foreign jurisdictions in which we offerthese types of products. These claims can arise as a result of function claims, health claims, nutrient contentclaims and other claims that impermissibly suggest therapeutic benefits for certain foods or food components.The cost of defending these claims or our obligations for direct damages and indemnification if we were foundliable could adversely affect our results of operations.
As a result of the N&B Transaction and the Frutarom acquisition, we assumed legal or environmentalclaims, regulatory investigations, and litigation, including product liability, patent infringement, commerciallitigation and other actions, and we may become involved in additional actions in the future arising from theacquired operations. Specifically, as the N&B Business and Frutarom had a significant number of facilitieslocated globally and a large number of customers, our exposure to legal claims, regulatory and environmentalinvestigations and litigation may increase. This could result in an increase in our cost for defense or settlement ofclaims or indemnification obligations if we were to be found liable in excess of our historical experience.
In addition, we are also the subject of a putative shareholder class action lawsuit filed in August 2019 afterwe disclosed that preliminary results of investigations indicated that Frutarom businesses operating principally inRussia and Ukraine had made improper payments to representatives of customers.
Our insurance may not be adequate to protect us from all material expenses related to pending and futureclaims and our current levels of insurance may not be available in the future at commercially reasonable prices.Any of these factors could adversely affect our profitability and results of operations.
Changes in our tax rates, the adoption of new U.S. or international tax legislation, or changes in existingtax laws could expose us to additional tax liabilities that may affect our future results.
We are subject to taxes in the U.S. and numerous foreign jurisdictions. Our future effective tax rates couldbe affected by changes in the mix of earnings in countries with differing statutory tax rates, changes in thevaluation of deferred tax assets and liabilities, changes in liabilities for uncertain tax positions, cost ofrepatriations or changes in tax laws or their interpretation. Any of these changes could have a material adverseeffect on our profitability.
We have and will continue to implement transfer pricing policies among our various operations located indifferent countries. These transfer pricing policies are a significant component of the management andcompliance of our operations across international boundaries and overall financial results. Many countriesroutinely examine transfer pricing policies of taxpayers subject to their jurisdiction, challenge transfer pricingpolicies aggressively where there is potential non-compliance and impose significant interest charges andpenalties where non-compliance is determined. However, governmental authorities could challenge these policiesmore aggressively in the future and, if challenged, we may not prevail. We could suffer significant costs relatedto one or more challenges to our transfer pricing policies.
We are subject to the continual examination of our income tax returns by the Internal Revenue Service, statetax authorities and foreign tax authorities in those countries in which we operate, and we may be subject to
34

assessments or audits in the future in any of the countries in which we operate. The final determination of taxaudits and any related litigation could be materially different from our historical income tax provisions andaccruals, and while we do not believe the results that follow would have a material adverse effect on our financialcondition, such results could have a material effect on our income tax provision, net income or cash flows in theperiod or periods in which that determination is made.
In addition, a number of international legislative and regulatory bodies have proposed legislation and beguninvestigations of the tax practices of multi-national companies and, in the European Union, the tax policies ofcertain European Union member states. One of these efforts has been led by the Organization for EconomicCo-operation and Development, an international association of 34 countries including the U.S., which hasfinalized recommendations to revise corporate tax, transfer pricing, and tax treaty provisions in membercountries. Since 2013, the European Commission (“EC”) has been investigating tax rulings granted by taxauthorities in a number of European Union member states with respect to specific multi-national corporations todetermine whether such rulings comply with European Union rules on state aid, as well as more recentinvestigations of the tax regimes of certain European Union member states. Under European Union law, selectivetax advantages for particular taxpayers that are not sufficiently grounded in economic realities may constituteimpermissible state aid. If the EC determines that a tax ruling or tax regime violates the state aid restrictions, thetax authorities of the affected European Union member state may be required to collect back taxes for the periodof time covered by the ruling. In late 2015 and early 2016, the EC declared that tax rulings, related to othercompanies, by tax authorities in Luxembourg, the Netherlands and Belgium did not comply with the EuropeanUnion state aid restrictions. If the EC or tax authorities in other jurisdictions were to successfully challenge taxrulings applicable to us in any of the member states in which we are subject to taxation or our internalintercompany arrangements, we could be exposed to increased tax liabilities.
In December 2017, the U.S. government enacted comprehensive tax legislation commonly referred to as theTax Cuts and Jobs Act (the “Tax Act”) that significantly revised the U.S. tax code effective January 1, 2018 by,among other things, lowering the corporate income tax rate from a top marginal rate of 35% to a flat 21%,limiting deductibility of interest expense and performance based incentive compensation, transitioning to aterritorial system and creating new taxes associated with global operations. The Tax Act impacted ourconsolidated results of operations during 2020 and is expected to continue to impact our consolidated results ofoperations in future periods. In future periods, we expect that our effective tax rate will be impacted by the lowerU.S. corporate tax rate that will initially be offset by the elimination of the deductibility of performance-basedincentive compensation, and other provisions of the Tax Act that may impact us prospectively. However, theultimate impact of the Tax Act will depend on additional regulatory or accounting guidance that may be issuedwith respect to the Tax Act and any operating and structural changes that we may undertake to permit us tobenefit from the new, lower U.S. tax rate prospectively. This could adversely affect our results of operations.
The N&B Transaction could result in significant tax liability, and we may be obligated to indemnifyDuPont for any such tax liability imposed on DuPont.
The completion of the N&B Transaction was conditioned upon the receipt by DuPont of an opinion that thetransaction generally will qualify as a tax-free reorganization. The tax opinion was based upon various factualrepresentations and assumptions, as well as certain undertakings made by DuPont, us and N&B. If any of thosefactual representations or assumptions were untrue or incomplete in any material respect, any undertaking was oris not complied with, or the facts upon which the opinion was based are materially different from the facts at theclosing of the N&B Transaction, the transaction may not qualify (in whole or part) for tax-free treatment.
The N&B spin-off and certain aspects of the pre-spin-off internal reorganizations to form N&B could betaxable to DuPont if N&B or we were to engage in a “Spinco Tainting Act” (as defined in the Tax MattersAgreement, by and among DuPont, N&B and IFF, a form of which is attached to IFF’s registration statement onForm S-4 (Registration Number 333-238072)). A Spinco Tainting Act is generally any action (or inaction) withinour control or under the control of N&B or their affiliates, any event involving our common stock or the common
35
stock of N&B or any assets of N&B or its subsidiaries, or any breach by N&B or any of its subsidiaries of anyfactual representations, assumptions, or undertakings made by it, in each case, that would affect thenon-recognition treatment of the spin-off and internal reorganizations for U.S. federal income tax purposes, asdescribed above. Under the Tax Matters Agreement, we and N&B will be required to indemnify DuPont for anytaxes resulting from a Spinco Tainting Act. If we or N&B were required to indemnify DuPont pursuant to theTax Matters Agreement as described above, this indemnification obligation may be substantial and could have amaterial adverse effect on us, including with respect to its financial condition and results of operations.
If we fail to comply with data protection laws in the U.S. and abroad, we may be subject to fines, penaltiesand other costs.
Legal requirements relating to the collection, storage, handling, use, disclosure, transfer, and security ofpersonal data continue to evolve, and regulatory scrutiny in this area is increasing around the world. Thisregulatory environment is increasingly challenging and may present material obligations and risks to ourbusiness, including significantly expanded compliance burdens, restrictions on transfer of personal data, costsand enforcement risks. For example, the European Union’s GDPR, which became effective in May 2018, greatlyincreases the jurisdictional reach of EU law and adds a broad array of requirements related to personal data,including individual notice and opt-out preferences, restrictions on and requirements for transfer of personal dataand the public disclosure of significant data breaches. Additionally, violations of the GDPR can result in fines ofas much as 4% of a company’s annual revenue. Other governments have enacted or are enacting similar dataprotection laws, including data localization laws that require data to stay within their borders. All of theseevolving compliance and operational requirements, restrictions on use of personal data, as well as the uncertaininterpretation and enforcement of laws, impose significant costs and regulatory risks that are likely to increaseover time. Our failure to comply with these evolving regulations could expose us to fines, sanctions, penaltiesand other costs that could harm our reputation and adversely impact our financial results.
ITEM 1B. UNRESOLVED STAFF COMMENTS.
None.
ITEM 2. PROPERTIES.
IFF principal properties as of December 31, 2020, are as follows:
Location Operation
United StatesCarrollton, TX(1) . . . . . . . . . . . . Production of flavor compounds; flavor laboratories.Hazlet, NJ . . . . . . . . . . . . . . . . . Production of fragrance compounds.Jacksonville, FL . . . . . . . . . . . . Production of fragrance ingredients.New York, NY(1) . . . . . . . . . . . . Fragrance laboratories; corporate headquarters.South Brunswick, NJ(1) . . . . . . . Production of flavor compounds and ingredients; flavor laboratories.Holmdel, NJ(1) . . . . . . . . . . . . . . Research and development center.Union Beach, NJ . . . . . . . . . . . . Research and development center.Philadelphia, PA . . . . . . . . . . . . Production of flavor compounds; flavor laboratories.
FranceNeuilly(1) . . . . . . . . . . . . . . . . . . Fragrance laboratories.Grasse . . . . . . . . . . . . . . . . . . . . Production of fragrance compounds and cosmetic ingredients.
Great BritainHaverhill . . . . . . . . . . . . . . . . . . Production of flavor compounds and ingredients, and fragrance
ingredients; flavor laboratories.
36

Location Operation
NetherlandsHilversum . . . . . . . . . . . . . . . . . Flavor and fragrance laboratories.Tilburg . . . . . . . . . . . . . . . . . . . Production of flavor compounds and ingredients, and fragrance
compounds.
SpainBenicarló . . . . . . . . . . . . . . . . . . Production of fragrance ingredients.
ArgentinaGarin . . . . . . . . . . . . . . . . . . . . . Production of flavor and fragrance compounds; flavor and fragrance
laboratories.
BrazilRio de Janeiro . . . . . . . . . . . . . . Production of fragrance compounds.Taubate . . . . . . . . . . . . . . . . . . . Production of flavor compounds and ingredients.
MexicoTlalnepantla . . . . . . . . . . . . . . . Production of flavor and fragrance compounds; flavor and fragrance
laboratories.
IndiaMumbai(2) . . . . . . . . . . . . . . . . . Flavor and fragrance laboratories.Sri City . . . . . . . . . . . . . . . . . . . Production of flavor and fragrance compounds and laboratories.
AustraliaDandenong . . . . . . . . . . . . . . . . Production of flavor compounds and flavor ingredients.
ChinaGuangzhou(2) . . . . . . . . . . . . . . . Production of fragrance compounds and flavor compounds.Shanghai(1)(2) . . . . . . . . . . . . . . . Flavor and fragrance laboratories.Zhangjiagang(2) . . . . . . . . . . . . . Production of flavor compounds.Yungpu(2) . . . . . . . . . . . . . . . . . . Production of flavor compounds.Jiande(2) . . . . . . . . . . . . . . . . . . . Production of fragrance ingredients.
IndonesiaJakarta . . . . . . . . . . . . . . . . . . . . Production of flavor compounds and ingredients; flavor and fragrance
laboratories.
ThailandBangkok(1) . . . . . . . . . . . . . . . . . Production of savory solutions.
JapanGotemba . . . . . . . . . . . . . . . . . . Production of flavor compounds.
SingaporeJurong(1) . . . . . . . . . . . . . . . . . . . Production of flavor and fragrance compounds.Science Park(1) . . . . . . . . . . . . . . Flavor and fragrance laboratories.
TurkeyGebze(1) . . . . . . . . . . . . . . . . . . . Production of flavor compounds.
SloveniaSkofja(1) . . . . . . . . . . . . . . . . . . . Production of flavor, food systems and savory powders.
IsraelKibbutz Givat-Oz(1)(3) . . . . . . . . Production of fragrance ingredients.Midgal H’aemeq(1) . . . . . . . . . . Production of health products.Haifa(1) . . . . . . . . . . . . . . . . . . . . Production of flavor compounds.
RussiaMoscow(1) . . . . . . . . . . . . . . . . . Production of savory solutions.
37
Location Operation
GermanyStadthagen . . . . . . . . . . . . . . . . . Production of health products.Emmerich . . . . . . . . . . . . . . . . . Production of food systems.Sittensen . . . . . . . . . . . . . . . . . . Production of savory solutions.Freilassing . . . . . . . . . . . . . . . . . Production of savory solutions.
(1) Leased.(2) Land is leased and building, machinery and equipment are owned.(3) We have a 93.4% interest in the subsidiary company that owns this facility.
The IFF principal executive offices and New York laboratory facilities are located at 521 West 57th Street,New York City.
The N&B Business’s corporate headquarters is currently located in Wilmington, Delaware. Itsmanufacturing, processing, marketing and research and development facilities, as well as regional purchasingoffices and distribution centers, are located throughout the world.
The N&B Business’s manufacturing sites, innovation centers and principal offices are located worldwidewith about 20 sites in Asia Pacific, 47 in Europe, Africa and Middle East, 13 in Latin America and 25 in theUnited States and Canada.
Our principal sites include facilities which, in the opinion of its management, are suitable and adequate fortheir use and have sufficient capacity for its current business needs and expected near-term growth.
ITEM 3. LEGAL PROCEEDINGS.
We are subject to various claims and legal actions in the ordinary course of our business.
Litigation Matters
On August 12, 2019, Marc Jansen filed a putative securities class action against IFF, its Chairman and CEO,and its then-CFO, in the United States District Court for the Southern District of New York. The lawsuit wasfiled after IFF disclosed that preliminary results of investigations indicated that Frutarom businesses operatingprincipally in Russia and Ukraine had made improper payments to representatives of customers. OnDecember 26, 2019, the Court appointed a group of six investment funds as lead plaintiff and Pomerantz LLP aslead counsel. On March 16, 2020, lead plaintiff filed an amended complaint, which added Frutarom and certainformer officers of Frutarom as defendants. The amended complaint alleges, among other things, that defendantsmade materially false and misleading statements or omissions concerning IFF’s acquisition of Frutarom, theintegration of the two companies, and the companies’ financial reporting and results. The amended complaintasserts claims under Section 10(b) of the Securities Exchange Act of 1934 and SEC Rule 10b-5, and under theIsraeli Securities Act-1968, against all defendants, and under Section 20(a) of the Securities Exchange Act of1934 against the individual defendants, on behalf of a putative class of persons and entities who purchased orotherwise acquired IFF securities on the New York Stock Exchange between May 7, 2018 and August 12, 2019and persons and entities who purchased or otherwise acquired IFF securities on the Tel Aviv Stock Exchangebetween October 9, 2018 and August 12, 2019. The amended complaint seeks an award of unspecifiedcompensatory damages, costs, and expenses. IFF, its officers, and Frutarom filed a motion to dismiss the case onJune 26, 2020.
Two motions to approve securities class actions were filed in the Tel Aviv District Court, Israel, in August2019, similarly alleging, among other things, false and misleading statements largely in connection with IFF’sacquisition of Frutarom and the above-mentioned improper payments. One motion (“Borg”) asserts claims underthe U.S. federal securities laws against IFF, its Chairman and CEO, and its former CFO. On November 8, 2020,
38

IFF and its officers filed their response to the Borg motion. The other motion (“Oman”) (following an initialamendment) asserted claims under the Israeli Securities Act-1968 against IFF, its Chairman and CEO, and itsformer CFO, and against Frutarom and certain former Frutarom officers and directors, as well as claims underthe Israeli Companies Act-1999 against certain former Frutarom officers and directors. On October 4, 2020, theOman plaintiff filed a motion to remove IFF and its officers from the motion and to add factual allegations fromthe U.S. amended complaint. Responses to the motion to amend the Oman motion were filed during November2020. The court granted the motion to amend the Oman motion on February 17, 2021.
On October 29, 2019, IFF and Frutarom filed a claim in the Tel Aviv District Court, Israel, against OriYehudai, the former President and CEO of Frutarom, and against certain former directors of Frutarom,challenging the bonus of US $20 million granted to Yehudai in 2018. IFF and Frutarom allege, among otherthings, that Yehudai was not entitled to receive the bonus because he breached his fiduciary duty by, among otherthings, knowing of the above-mentioned improper payments and failing to prevent them from being made. Theparties agreed, pursuant to the court’s recommendation, to attempt to resolve the dispute through mediation,which is still ongoing, during which the proceedings relating to this claim are stayed.
On March 11, 2020, an IFF shareholder filed a motion to approve a class action in Israel against, amongothers, Frutarom, Yehudai, and Frutarom’s former board of directors, alleging that former minority shareholdersof Frutarom were harmed as a result of the US $20 million bonus paid to Yehudai. The parties to this motionagreed to attempt to resolve the dispute through mediation to take place regarding the aforesaid claim againstYehudai, which as noted is still ongoing, during which the proceedings relating to this motion are stayed.
Investigation
On June 3, 2020, the Israel Police’s National Fraud Investigation Unit and the Israeli Securities Authoritycommenced an investigation into Frutarom and certain of its former executives, based on suspected bribery offoreign officials, money laundering, and violations of the Israeli Securities Act-1968. The National FraudInvestigation Unit and the Israeli Securities Authority have provided IFF and Frutarom with various orders. IFFis working to ensure compliance with such orders, all in accordance with, and subject to, Israeli law.
ITEM 4. MINE SAFETY DISCLOSURES.
Not applicable.
39
PART II
ITEM 5. MARKET FOR REGISTRANT’S COMMON EQUITY, RELATED STOCKHOLDERMATTERS AND ISSUER PURCHASES OF EQUITY SECURITIES.
Market Information.
Our common stock is principally traded on the New York Stock Exchange under the ticker symbol “IFF”.
Approximate Number of Equity Security Holders.
Title of ClassNumber of shareholders of record
as of February 15, 2021
Common stock, par value 12 1/2¢ per share 3,865
Issuer Purchases of Equity Securities.
None.
Performance Graph.
The following graph compares a shareholder’s cumulative total return for the last five fiscal years as if suchamounts had been invested in: (i) our common stock; (ii) the stocks included in the S&P 500 Index; and (iii) acustomized Peer Group. The graph is based on historical stock prices and measures total shareholder return,which takes into account both changes in stock price and dividends. The total return assumes that dividends werereinvested daily and is based on a $100 investment on December 31, 2015.
$100
Tota
l Sha
reho
lder
Ret
urn
Annual Index
12/31/202012/31/2015 12/31/2016 12/31/2017 12/31/2018 12/31/2019
$50
$250
$200
$150
International Flavors & Fragrances S&P 500 Index Peer Group
111.96
100.40
136.40130.42
126.26
119.12
171.49
160.68
203.04
176.63
101.48
126.10117.10105.87
132.49
100.00
100.00
SOURCE: S&P Capital IQ
40

Due to the international scope and breadth of our business, we believe that a Peer Group comprisinginternational public companies, which are representative of the customer group to which we sell our products, isthe most appropriate group against which to compare shareholder returns. See the table below for the list ofcompanies included in our Peer Group.
Peer Group Companies
Campbell Soup Company Kellogg CompanyChurch & Dwight Co., Inc. The Estée Lauder Companies Inc.The Clorox Company McCormick & Company, IncorporatedThe Coca-Cola Company McDonald’s CorporationColgate-Palmolive Company Nestle SAConagra Brands, Inc. PepsiCo, Inc.Edgewell Personal Care Company(1) The Procter & Gamble CompanyGeneral Mills, Inc. Unilever N.V.The Hershey Company YUM! Brands, Inc.Hormel Foods Corporation Symrise AGGivaudan SA
(1) Edgewell Personal Care has been included starting from July 1, 2015 when it spun off from Energizer Holdings.
ITEM 6. SELECTED FINANCIAL DATA.
INTERNATIONAL FLAVORS & FRAGRANCES INC.QUARTERLY FINANCIAL DATA
(UNAUDITED)
This data should be read in conjunction with the Consolidated Financial Statements and Notes thereto, andwith Item 7. Management’s Discussion and Analysis of Financial Condition and Results of Operations.
Fiscal Year Ended December 31, 2020
(DOLLARS IN THOUSANDS EXCEPT PER SHARE
AMOUNTS)First
QuarterSecondQuarter
ThirdQuarter
FourthQuarter Total Year
Net Sales . . . . . . . . . . . . . . . . . . . . . . . . . . . . $1,347,317 $1,198,773 $1,268,076 $1,270,073 $5,084,239Gross Profit* . . . . . . . . . . . . . . . . . . . . . . . . . 565,867 481,842 524,427 513,730 2,085,866Income before taxes . . . . . . . . . . . . . . . . . . . 153,508 103,065 105,500 79,298 441,371Net income . . . . . . . . . . . . . . . . . . . . . . . . . . 127,211 87,366 86,231 66,564 367,372Net income attributable to IFFstockholders* . . . . . . . . . . . . . . . . . . . . . . . 124,607 86,204 84,828 67,589 363,228
Net income per share — basic* . . . . . . . . . . . 1.16 0.75 0.76 0.57 3.25Net income per share — diluted* . . . . . . . . . 1.15 0.74 0.75 0.57 3.21
Fiscal Year Ended December 31, 2019
(DOLLARS IN THOUSANDS EXCEPT PER SHARE
AMOUNTS)First
QuarterSecondQuarter
ThirdQuarter
FourthQuarter Total Year
Net Sales . . . . . . . . . . . . . . . . . . . . . . . . . . . . $1,297,402 $1,291,568 $1,267,345 $1,283,769 $5,140,084Gross Profit* . . . . . . . . . . . . . . . . . . . . . . . . . 531,259 546,239 533,088 502,162 2,112,748Income before taxes . . . . . . . . . . . . . . . . . . . 134,576 169,481 156,866 96,529 557,452Net income . . . . . . . . . . . . . . . . . . . . . . . . . . 111,214 138,869 129,807 80,378 460,268Net income attributable to IFFstockholders* . . . . . . . . . . . . . . . . . . . . . . . 108,829 136,377 127,124 83,543 455,873
Net income per share — basic* . . . . . . . . . . . 0.97 1.21 1.15 0.71 4.05Net income per share — diluted* . . . . . . . . . 0.96 1.20 1.13 0.70 4.00
* The key variances quarter-over-quarter relate to the volume of restructuring, acquisition and integrationrelated charges which are included in the total of Non-GAAP adjustments. Refer to the Non-GAAPreconciliation in Item 7. Management’s Discussion and Analysis of Financial Condition and Results ofOperations for additional information.
41
ITEM 7. MANAGEMENT’S DISCUSSION AND ANALYSIS OF FINANCIAL CONDITION ANDRESULTS OF OPERATIONS.
(UNLESS INDICATED OTHERWISE, DOLLARS IN MILLIONS EXCEPT PER SHARE AMOUNTS)
Overview
Company Background
We are a leading innovator of sensory, food & beverage, pharmaceutical, health & wellness, home &personal care integrated solutions and ingredients that move the world. Our creative capabilities, global footprint,regulatory and technological know-how provide us a competitive advantage in meeting the demands of ourglobal, regional and local customers around the world.
Beginning in the first quarter of fiscal year 2020, we operated our business across two segments: Taste andScent. Following the recent closing of the N&B Transaction, our business is organized in four business segments:Nourish, Scent, Health & Biosciences and Pharma Solutions.
As a leading creator of flavor offerings, we help our customers deliver on the promise of delicious andhealthy foods and drinks that appeal to consumers. While we are a global leader, our Taste business operatesregionally in nature, with different formulas that reflect local taste preferences. Consequently, we manage ourTaste business geographically, creating products in our regional creative centers which allows us to satisfy localtaste preferences, while also helping to ensure regulatory compliance and production standards.
Our global Scent business creates fragrance compounds and fragrance ingredients that are integral elementsin the world’s finest perfumes and best-known household and personal care products. We believe our uniqueportfolio of natural and synthetic ingredients, global footprint, innovative technologies and know-how, deepconsumer insight and customer intimacy make us a market leader in scent products.
Impact of COVID-19 Pandemic
On March 11, 2020, the World Health Organization designated COVID-19 as a global pandemic. Variouspolicies and initiatives have been implemented around the world to reduce the global transmission of COVID-19,including the closure of non-essential businesses, reduced travel, the closure of retail establishments, thepromotion of social distancing and remote working policies where appropriate. IFF has been designated anessential business in most locations given that both its Taste and Scent products are used in the manufacture offood products as well as the manufacture of a range of cleaning and hygiene products. Accordingly, althoughthere continue to be minor disruptions, all of IFF’s manufacturing facilities remain open and continue tomanufacture products.
The COVID-19 pandemic remains a serious threat to the health of the world’s population and certaincountries and regions continue to suffer from outbreaks or have seen a recurrence of infections. Accordingly, theCompany continues to take the threat from COVID-19 seriously even as the adverse financial impact ofCOVID-19 on the Company has lessened.
For 2020, revenue was largely flat but this overall performance reflected strength in Consumer Fragrances,offset by declines in Fine Fragrances and most Taste categories, especially those in the food service area. Theimpact that COVID-19 will have on our consolidated results of operations in 2021 remains uncertain. Based onthe length and severity of COVID-19, we experience continued volatility as a result of retail and travel, consumershopping and consumption behavior. We will continue to evaluate the nature and extent of these potentialimpacts to our business, consolidated results of operations, segment results, liquidity and capital resources.
Although IFF does not currently anticipate any impairment charges related to COVID-19, the continuingeffects of a prolonged pandemic could result in increased risk of asset write-downs and impairments, including,
42

but not limited to, equity investments, goodwill and intangibles. Any of these events could potentially result in amaterial adverse impact on IFF’s business and results of operations.
Transaction with Nutrition & Biosciences, Inc.
On February 1, 2021, pursuant to the Merger Agreement with DuPont, a wholly owned subsidiary of IFFmerged with and into the N&B Business. The shares issued in the Merger represented approximately 55.4% ofthe common stock of IFF on a fully diluted basis, after giving effect to the Merger, as of February 1, 2021. TheN&B Business is an innovation-driven and customer-focused business that provides solutions for the global foodand beverage, dietary supplements, home and personal care, energy, animal nutrition and pharma markets. Thetransaction was made in order to strengthen IFF’s customer base and market presence, with an enhanced positionin the food & beverage, home & personal care and health & wellness markets. See Note 3 to the ConsolidatedFinancial Statements for additional information relating to the N&B Transaction.
2020 Financial Performance Overview
For a reconciliation between reported and adjusted figures, please refer to the “Non-GAAP FinancialMeasures” section.
Sales
Sales in 2020 decreased 1% on a reported basis and were flat on a currency neutral basis (which excludesthe effects of changes in currency by restating exchange ratios in effect for the current year based on the currencyof the underlying transaction). Scent sales increased 2% on a reported basis and 3% on a currency neutral basis.Taste sales decreased 3% on a reported basis and 2% on a currency neutral basis. The change in consolidatedreported and currency neutral sales was driven by strength in Consumer Fragrances and a slight increase inFragrance Ingredients, offset by volume reductions in most Taste product categories and Fine Fragrances. Theyear-on-year declines in sales of many product categories was partially due to travel and shelter-in-placerestrictions, in certain regions, as a result of COVID-19. The additional week of sales, or a 53rd week, in 2019also contributed to the year-on-year decline in sales.
Exchange rate variations had an unfavorable impact on net sales for 2020 of approximately 1%. The effectof exchange rates can vary by business and region, depending upon the mix of sales priced in U.S. dollars ascompared to other currencies.
Our 25 largest customers accounted for approximately 39% of total sales in 2020. In 2020, no customeraccounted for more than 10% of sales. A key factor for commercial success is our inclusion on strategiccustomers’ core supplier lists, which provides opportunities to expand and win new business. We are on the coresupplier lists of a large majority of our global and strategic customers within Taste and Scent.
Gross Margin
Gross margin decreased to 41.0% in 2020 from 41.1% in 2019, principally driven by unfavorable priceversus input costs and mix and sales volume reductions on existing business due, principally, to COVID-19,largely offset by the impact of productivity, integration and cross selling initiatives.
Operating profit
Operating profit decreased $98.8 million to $566.5 million (11.1% of sales) in 2020 compared to$665.3 million (12.9% of sales) in 2019. Foreign currency had a 2% unfavorable impact on operating profit inboth the 2020 and 2019 periods. Adjusted operating profit was $729.7 million (14.4% of sales) for 2020, adecrease from $793.1 million (15.4% of sales) for 2019, principally driven by unfavorable price versus inputcosts and mix and sales volume reductions on existing business due, principally, to COVID-19, partially offset bythe impact of productivity, integration and cross selling initiatives.
43
Results of Operations
Year Ended December 31, Change
(DOLLARS IN THOUSANDS EXCEPT PER SHARE
AMOUNTS) 2020 2019 20182020 vs.2019
2019 vs.2018
Net sales . . . . . . . . . . . . . . . . . . . . . . . . . . . . . . . . $5,084,239 $5,140,084 $3,977,539 (1.1)% 29.2%Cost of goods sold . . . . . . . . . . . . . . . . . . . . . . . . 2,998,373 3,027,336 2,294,832 (1.0)% 31.9%
Gross profit . . . . . . . . . . . . . . . . . . . . . . . . . . . . . 2,085,866 2,112,748 1,682,707Research and development (R&D) expenses . . . . 356,863 346,128 311,583 3.1% 11.1%Selling and administrative (S&A) expenses . . . . 948,833 876,121 707,461 8.3% 23.8%Restructuring and other charges, net . . . . . . . . . . 17,295 29,765 5,079 (41.9)% NMFAmortization of acquisition-relatedintangibles . . . . . . . . . . . . . . . . . . . . . . . . . . . . 192,607 193,097 75,879 (0.3)% 154.5%
Losses (gains) on sale of fixed assets . . . . . . . . . 3,784 2,367 (1,177) 59.9% NMF
Operating profit . . . . . . . . . . . . . . . . . . . . . . . . . . 566,484 665,270 583,882Interest expense . . . . . . . . . . . . . . . . . . . . . . . . . . 131,802 138,221 132,558 (4.6)% 4.3%Loss on extinguishment of debt . . . . . . . . . . . . . . — — 38,810 —% (100.0)%Other income, net . . . . . . . . . . . . . . . . . . . . . . . . . (6,689) (30,403) (35,243) (78.0)% (13.7)%
Income before taxes . . . . . . . . . . . . . . . . . . . . . . . 441,371 557,452 447,757Taxes on income . . . . . . . . . . . . . . . . . . . . . . . . . 73,999 97,184 107,976 (23.9)% (10.0)%
Net income . . . . . . . . . . . . . . . . . . . . . . . . . . . . . . $ 367,372 $ 460,268 $ 339,781Net income attributable to noncontrollinginterest . . . . . . . . . . . . . . . . . . . . . . . . . . . . . . . 4,144 4,395 2,479 (5.7)% 77.3%
Net income attributable to IFF stockholders . . . . 363,228 455,873 337,302
Net income per share — diluted . . . . . . . . . . . . . $ 3.21 $ 4.00 $ 3.79 (19.8)% 5.5%Gross margin . . . . . . . . . . . . . . . . . . . . . . . . . . . . 41.0% 41.1% 42.3% (10)bps (120)bpsR&D as a percentage of sales . . . . . . . . . . . . . . . 7.0% 6.7% 7.8% 30bps (110)bpsS&A as a percentage of sales . . . . . . . . . . . . . . . . 18.7% 17.0% 17.8% 170bps (80)bpsOperating margin . . . . . . . . . . . . . . . . . . . . . . . . . 11.1% 12.9% 14.7% (180)bps (180)bpsAdjusted operating margin . . . . . . . . . . . . . . . . . . 14.4% 15.4% 17.0% (100)bps (160)bpsEffective tax rate . . . . . . . . . . . . . . . . . . . . . . . . . 16.8% 17.4% 24.1% (60)bps NMF
Segment net salesTaste . . . . . . . . . . . . . . . . . . . . . . . . . . . . . . . . . . . $3,109,781 $3,200,520 $2,091,635 (2.8)% 53.0%Scent . . . . . . . . . . . . . . . . . . . . . . . . . . . . . . . . . . . 1,974,458 1,939,564 1,885,904 1.8% 2.8%
Consolidated . . . . . . . . . . . . . . . . . . . . . . . . . . . . . $5,084,239 $5,140,084 $3,977,539
NMF: Not meaningful
Cost of goods sold includes the cost of materials and manufacturing expenses. R&D includes expensesrelated to the development of new and improved products and technical product support. S&A expenses includeexpenses necessary to support our commercial activities and administrative expenses supporting our overalloperating activities including compliance with governmental regulations.
2020 IN COMPARISON TO 2019
Sales
Sales for 2020 totaled $5.1 billion, which decreased 1% on a reported basis and flat on a currency neutralbasis as compared to the prior year. Sales performance for the Scent segment reflected growth in ConsumerFragrances and a slight increase in Fragrance Ingredients, offset by declines in Fine Fragrances through the first
44

nine months of 2020. In the fourth quarter of 2020, Fine Fragrances saw a slight increase in sales when comparedto the comparable period of the prior year. Sales performance for the Taste segment reflected reduced sales inmost Taste categories, especially those related to retail food services.
Sales performance by segment was as follows:
%Change in Sales — 2020 vs. 2019
Reported Currency Neutral(1)
Taste . . . . . . . . . . . . . . . . . . . . . . . . . . . . . . . . . . . . . . . . . . . . . . . . . . . . . . . . . . . . -3% -2%Scent . . . . . . . . . . . . . . . . . . . . . . . . . . . . . . . . . . . . . . . . . . . . . . . . . . . . . . . . . . . . 2% 3%
Total . . . . . . . . . . . . . . . . . . . . . . . . . . . . . . . . . . . . . . . . . . . . . . . . . . . . . . . . -1% —%
(1) Currency neutral sales growth is calculated by translating prior year sales at the exchange rates for thecorresponding 2020 period.
Taste Sales
Taste sales in 2020 decreased 3% on a reported basis and 2% on a currency neutral basis versus the prioryear period. Performance was primarily driven by sales declines in all regions, except North America, primarilyfrom volume reductions due to reduced consumer demand, principally related to the COVID-19 pandemic,partially offset by new win performances (net of losses).
Scent Sales
Scent sales in 2020 increased 2% on a reported basis and 3% on a currency neutral basis. Sales growth in theScent business unit was led by Consumer Fragrances, primarily driven by new win performances (net of losses)and volume increases in most product offerings, such as fabric and home care items, to support consumerdemand related to the COVID-19 pandemic. Fragrance Ingredients also contributed to a slight increase in thegrowth of the Scent business unit, primarily driven by volume increases, offset by price reductions. Performancein the Scent business unit was offset by Fine Fragrances through the first nine months of 2020, primarily drivenby volume reductions caused by the disruption of consumer access to retail markets due to COVID-19. However,in the fourth quarter of 2020, Fine Fragrances sales grew slightly compared to the fourth quarter of 2019,primarily driven by new win performances (net of losses), offset by volume reductions.
Cost of Goods Sold
Cost of goods sold, as a percentage of sales, increased to 59.0% in 2020 compared to 58.9% in 2019.
Research and Development (R&D)
Overall R&D expenses, as a percentage of sales, increased to 7.0% in 2020 compared to 6.7% in 2019.
Selling and Administrative (S&A)
S&A expenses increased $72.7 million to $948.8 million, or 18.7% as a percentage of sales, in 2020compared to $876.1 million, or 17.0% as a percentage of sales, in 2019. Adjusted S&A expense increased by$19.8 million to $808.7 million (15.9% as a percentage of sales) in 2020 compared to $788.9 million (15.3% as apercentage of sales) in 2019. The increase in S&A expenses was due to higher employee related expenses(including bonuses to essential workers in 2020) and incentive compensation.
Restructuring and Other Charges
Restructuring and other charges decreased to $17.3 million in 2020 compared to $29.8 million in 2019primarily driven by the decrease in costs related to the 2019 Severance Plan (see Note 2 for additionalinformation).
45
Amortization of Acquisition-Related Intangibles
Amortization expenses decreased to $192.6 million in 2020 compared to $193.1 million in 2019.
Operating Results by Business Unit
We evaluate the performance of business units based on segment profit which is defined as operating profitbefore Restructuring and other charges, net, Global expenses (as discussed in Note 15 to the ConsolidatedFinancial Statements) and certain non-recurring items, net, Interest expense, Other (income) expense, net andTaxes on income. See Note 15 to the Consolidated Financial Statements for the reconciliation to Income beforetaxes.
For the Year EndedDecember 31,
(DOLLARS IN THOUSANDS) 2020 2019
Segment profit:Taste . . . . . . . . . . . . . . . . . . . . . . . . . . . . . . . . . . . . . . . . . . . . . . . . . . . . . . . . . . . . . . . $436,387 $482,394Scent . . . . . . . . . . . . . . . . . . . . . . . . . . . . . . . . . . . . . . . . . . . . . . . . . . . . . . . . . . . . . . . 357,281 349,445
Global Expenses . . . . . . . . . . . . . . . . . . . . . . . . . . . . . . . . . . . . . . . . . . . . . . . . . . . . . . . . . . (63,982) (38,759)Operational Improvement Initiatives . . . . . . . . . . . . . . . . . . . . . . . . . . . . . . . . . . . . . . . . . . — (2,267)Frutarom Integration Related Costs . . . . . . . . . . . . . . . . . . . . . . . . . . . . . . . . . . . . . . . . . . . (9,849) (55,160)Restructuring and Other Charges, net . . . . . . . . . . . . . . . . . . . . . . . . . . . . . . . . . . . . . . . . . . (17,295) (29,765)Losses on Sales of Assets . . . . . . . . . . . . . . . . . . . . . . . . . . . . . . . . . . . . . . . . . . . . . . . . . . . (3,784) (2,367)Employee Separation Costs . . . . . . . . . . . . . . . . . . . . . . . . . . . . . . . . . . . . . . . . . . . . . . . . . . (2,813) —FDA Mandated Product Recall . . . . . . . . . . . . . . . . . . . . . . . . . . . . . . . . . . . . . . . . . . . . . . . — (250)Frutarom Acquisition Related Costs . . . . . . . . . . . . . . . . . . . . . . . . . . . . . . . . . . . . . . . . . . . (1,465) (5,940)Compliance Review & Legal Defense Costs . . . . . . . . . . . . . . . . . . . . . . . . . . . . . . . . . . . . (3,278) (11,314)N&B Transaction Related Costs . . . . . . . . . . . . . . . . . . . . . . . . . . . . . . . . . . . . . . . . . . . . . . (28,100) (20,747)N&B Integration Related Costs . . . . . . . . . . . . . . . . . . . . . . . . . . . . . . . . . . . . . . . . . . . . . . . (96,618) —
Operating Profit . . . . . . . . . . . . . . . . . . . . . . . . . . . . . . . . . . . . . . . . . . . . . . . . . . . . . . . . . . . $566,484 $665,270
Profit marginTaste . . . . . . . . . . . . . . . . . . . . . . . . . . . . . . . . . . . . . . . . . . . . . . . . . . . . . . . . . . . . . . . 14.0% 15.1%Scent . . . . . . . . . . . . . . . . . . . . . . . . . . . . . . . . . . . . . . . . . . . . . . . . . . . . . . . . . . . . . . . 18.1% 18.0%Consolidated . . . . . . . . . . . . . . . . . . . . . . . . . . . . . . . . . . . . . . . . . . . . . . . . . . . . . . . . . 11.1% 12.9%
Taste Segment Profit
Taste segment profit decreased $46.0 million to $436.4 million (14.0% of segment sales) in 2020 from$482.4 million (15.1% of segment sales) in the comparable 2019 period. The decrease principally reflectedvolume reductions on existing business and unfavorable price versus input costs and mix, partially offset by newwin performances (net of losses), integration, cross selling and productivity initiatives.
Scent Segment Profit
Scent segment profit increased $7.8 million to $357.3 million (18.1% of segment sales) in 2020, comparedto $349.4 million (18.0% of segment sales) reported in 2019. The increase in segment profit principally reflectedthe impact of new win performances (net of losses) and productivity initiatives, partially offset by unfavorableprice versus input costs and mix.
Global Expenses
Global expenses represent corporate and headquarters-related expenses which include legal, finance, humanresources and R&D and other administrative expenses that are not allocated to an individual business unit. In2020, global expenses were $64.0 million compared to $38.8 million during 2019. The increase was principallydriven by higher incentive compensation expense in 2020 and lower gains from our currency hedging program.
46

Interest Expense
In 2020, interest expense decreased $6.4 million to $131.8 million, compared to $138.2 million in 2019.This decrease was primarily driven by repayments on the 2018 Term Loan Facility and TEUs. Average cost ofdebt was 3.0% for the 2020 and 2019 periods.
Other Income, Net
Other income, net, decreased approximately $23.7 million to $6.7 million of income in 2020 versus$30.4 million of income in 2019. The decrease was primarily driven by foreign exchange losses.
Income Taxes
The effective tax rate was 16.8% in 2020 as compared to 17.4% in 2019. The year-over-year decrease waslargely due to a more favorable mix of earnings and lower repatriation costs, partially offset by loss provisionsand the cost of global intangible low-taxed income (“GILTI”).
Excluding the $32.8 million tax benefit associated with the pre-tax Frutarom integration related costs,restructuring and other charges, net, losses on sale of assets, employee separation costs, a pension settlement,Frutarom acquisition related costs, compliance review & legal defense costs, N&B transaction related costs andN&B integration related costs, the adjusted effective tax rate for 2020 was 17.5%. For 2019, the adjustedeffective tax rate was 18.1% excluding the $26.2 million tax benefit associated with the pre-tax operationalimprovement initiatives, Frutarom integration related costs, restructuring and other charges, net, losses on sale ofassets, FDA mandated product recall, Frutarom acquisition related costs, compliance review & legal defensecosts and N&B transaction related costs. The year-over-year decrease was largely due to a more favorable mix ofearnings and lower repatriation costs, partially offset by loss provisions and the cost of GILTI.
2019 IN COMPARISON TO 2018
For a comparison of our results of operations for the fiscal years ended December 31, 2019 andDecember 31, 2018, see “Part II, Item 7. Management’s Discussion and Analysis of Financial Condition andResults of Operations” of Exhibit 99.1 to our Form 8-K for the fiscal year ended December 31, 2019, filed withthe SEC on June 18, 2020.
Liquidity and Capital Resources
Cash and Cash Equivalents
We had cash and cash equivalents of $649.5 million at December 31, 2020 compared to $606.8 million atDecember 31, 2019 and of this balance, a portion was held outside the United States. Cash balances held inforeign jurisdictions are, in most circumstances, available to be repatriated to the United States.
Effective utilization of the cash generated by our international operations is a critical component of ourstrategy. We regularly repatriate cash from our non-U.S. subsidiaries to fund financial obligations in the U.S. Aswe repatriate these funds to the U.S. we will be required to pay income taxes in certain U.S. states and applicableforeign withholding taxes during the period when such repatriation occurs. Accordingly, as of December 31,2020, we have a deferred tax liability of $47.1 million for the effect of repatriating the funds to the U.S.
Restricted Cash
As discussed in Note 1 to the Consolidated Financial Statements, restricted cash relates to amountsescrowed for various items including for payments to be made to former Frutarom option holders and foracquisition related payments. At December 31, 2020 we had a balance of $10.3 million (of which $7.3 million isincluded in Current Assets and $3.0 million is included in Other Assets) compared to $17.1 million atDecember 31, 2019.
47
Cash Flows from Operating Activities
Operating cash flows in 2020 were $714.1 million compared to $699.0 million in 2019 and $437.6 millionin 2018. The increase in operating cash flows from 2019 to 2020 was principally driven by changes primarilyrelated to accounts receivable, inventories, incentive compensation and accrued expenses, largely offset by lowercash earnings in the current year. The increase in operating cash flows from 2018 to 2019 was principally drivenby higher earnings from inclusion of our Frutarom acquisition and lower net working capital primarily related toaccounts receivable.
Working capital (current assets less current liabilities) totaled $1.2 billion at year-end 2020 compared to$1.4 billion at year-end 2019.
We have various factoring agreements in the U.S. and The Netherlands under which we can factor up toapproximately $100 million in receivables with a financial institution. Additionally, we maintain factoringprograms that are sponsored by certain customers. Under all of the arrangements, we sell the receivables on anon-recourse basis to unrelated financial institutions and account for the transactions as a sale of receivables. Theapplicable receivables are removed from our Consolidated Balance Sheet when the cash proceeds are received.
As of December 31, 2020, 2019 and 2018, we had sold receivables pursuant to these factoring programs ofapproximately $248.8 million, $205.7 million and $168.3 million, respectively. Participation in the variousprograms increased cash provided by operations by approximately $43.1 million, $37.7 million and $13.6 millionin 2020, 2019 and 2018, respectively. The cost of participating in these programs was approximately$4.4 million, $7.1 million, and $3.4 million in 2020, 2019, and 2018, respectively (see Note 1 for additionalinformation).
Cash Flows Used in Investing Activities
Net investing activities in 2020 utilized $187.5 million compared to $225.9 million and $5.0 billion in 2019and 2018, respectively. The decrease in cash paid for investing activities from 2019 to 2020 was primarily drivenby lower payments for acquisitions and lower spending on property, plant and equipment, partially offset bylower proceeds from disposal of assets in 2020 and cash paid on settlement of derivative instruments in 2020versus proceeds in 2019. The decrease in cash paid for investing activities from 2018 to 2019 was primarilydriven by higher payments for acquisitions in 2018. In 2019, we acquired certain companies as described in Note3 for approximately $49.1 million, net of cash acquired. In 2018, we acquired Frutarom for approximately$7.0 billion (net of cash acquired) of which $4.9 billion was paid in cash.
Additions to property, plant and equipment were $191.8 million, $236.0 million and $170.1 million in 2020,2019 and 2018, respectively (net of grants and other reimbursements from government authorities). Theseinvestments largely arise from our ongoing focus to align our manufacturing facilities with customer demand,primarily in emerging markets, and new technology consistent with our strategy.
In light of the COVID-19 pandemic, we have evaluated and re-prioritized our capital projects. We expectthat capital spending in 2021 will be approximately 4.5% of sales (net of potential grants and otherreimbursements from government authorities).
Frutarom Integration Initiative
We expect to achieve $145 million of synergy targets, with total savings in line with our originalexpectations. See Note 2 for additional information related to the Frutarom Integration Initiative.
Cash Flows Used in Financing Activities
Net cash used in financing activities in 2020 was $511.6 million, compared to $505.1 million in 2019 andcash provided by financing activities of $4.9 billion in 2018, respectively. The slight increase in 2020 versus
48

2019 was principally driven by higher repayments of debt and higher dividend payments, largely offset by cashproceeds from issuance of new long-term debt in the current year. The decrease in 2019 versus 2018 wasprincipally driven by Frutarom related financing activities in 2018, partially offset by higher dividend paymentsin 2019.
At December 31, 2020 and 2019, we had approximately $4.4 billion of debt outstanding.
We paid dividends totaling $322.6 million, $313.5 million and $230.2 million in 2020, 2019 and 2018,respectively. The cash dividend declared per share in 2020, 2019 and 2018 was $3.04, $2.96 and $2.84,respectively.
Our capital allocation strategy is primarily focused on debt repayment to maintain our investment graderating. We will also prioritize capital investment in our businesses to support the strategic long term plans. Weare also committed to maintaining our history of paying a dividend to investors determined by our Board ofDirectors at its discretion based on various factors.
We currently have a board approved stock repurchase program with a total remaining value of$279.7 million. As of May 7, 2018, we have suspended our share repurchases.
Capital Resources
Operating cash flow provides the primary source of funds for capital investment needs, dividends paid toshareholders and debt service repayments. We anticipate that cash flows from operations and availability underour existing credit facilities will be sufficient to meet our investing and financing needs. We regularly assess ourcapital structure, including both current and long-term debt instruments, as compared to our cash generation andinvestment needs in order to provide ample flexibility and to optimize our leverage ratios. We believe ourexisting cash balances are sufficient to meet our debt service requirements.
Transaction with Nutrition & Biosciences, Inc.
On February 1, 2021 (the “Closing Date”), we completed the transaction with DuPont de Nemours, Inc.(“DuPont”) to acquire its nutrition and biosciences business (the “N&B Business”) which had been transferred toNutrition & Biosciences, Inc., a Delaware corporation and wholly owned subsidiary of DuPont (“N&B”) in aReverse Morris Trust transaction. The N&B Business is an innovation-driven and customer-focused business thatprovides solutions for the global food and beverage, dietary supplements, home and personal care, energy, animalnutrition and pharma markets. We acquired 100% interest of N&B pursuant to definitive agreements, includingan Agreement and Plan of Merger (the “Merger Agreement”) entered into on December 15, 2019. Thetransaction was made in order to strengthen our customer base and market presence, with an enhanced position inthe food & beverage, home & personal care and health & wellness markets.
A wholly owned subsidiary of IFF merged with and into N&B in exchange for 141,740,461 shares of IFFcommon stock, par value $0.125 per share (“IFF Common Stock”) (collectively, the “N&B Transaction”), whichhad been approved in the special shareholder meeting that occurred on August 27, 2020 where IFF shareholdersvoted to approve the issuance of shares of IFF common stock in connection with the N&B Transaction pursuantto the Merger Agreement. In connection with the N&B Transaction, DuPont received a one-time $7.3 billionspecial cash payment (the “Special Cash Payment”). The shares issued in the Merger represented approximately55.4% of the common stock of IFF on a fully diluted basis, after giving effect to the Merger, as of February 1,2021 (see Note 3 for additional information).
Revolving Credit Facility and Term Loan Facilities
The Credit Agreements contain various covenants, limitations and events of default customary for similarfacilities for similarly rated borrowers, including the requirement for us to maintain, at the end of each fiscal
49
quarter, a ratio of net debt for borrowed money to Consolidated EBITDA in respect of the previous 12-monthperiod. Effective in the fourth quarter of 2020, the maximum permitted ratio of net debt to Consolidated EBITDAunder the Credit Agreements is 4.0 to 1.0 through the end of 2020, with step-downs over time. On and after theClosing Date of the N&B Transaction, the Company’s maximum permitted ratio of net debt to ConsolidatedEBITDA under the Credit Agreements is 4.75 to 1.0, stepping down to 3.50 to 1.0 over time (with a step-up if theCompany consummates certain qualified acquisitions).
As of December 31, 2020, we had no outstanding borrowings under our Revolving Credit Facility,$240 million outstanding under the 2018 Term Loan Facility and $200 million outstanding in borrowings underthe 2022 Term Loan Facility. The amount that we are able to draw down under the Revolving Credit Facility islimited by financial covenants as described below and in Note 9. As of December 31, 2020, our borrowingcapacity was approximately $627 million under the Revolving Credit Facility.
See Note 9 to the Consolidated Financial Statements for further information on our Credit Agreements.
Debt Covenants
At December 31, 2020 and 2019 we were in compliance with all financial and other covenants, includingthe net debt to adjusted EBITDA ratio. At December 31, 2020 our Net Debt/adjusted EBITDA(1) ratio was 3.43 to1 as defined by our Credit Agreements, well below the maximum levels in the financial covenants in our existingoutstanding credit facilities.
(1) Adjusted EBITDA and Net Debt, which are non-GAAP measures used for these covenants, are calculated inaccordance with the definition in the debt agreements. In this context, these measures are used solely toprovide information on the extent to which we are in compliance with debt covenants and may not becomparable to adjusted EBITDA and Net Debt used by other companies. Reconciliations of adjustedEBITDA to net income and net debt to total debt are as follows:
(DOLLARS IN MILLIONS)Year Ended
December 31, 2020
Net income . . . . . . . . . . . . . . . . . . . . . . . . . . . . . . . . . . . . . . . . . . . . . . . . . . . . . . . . . . . . . . . . . . $ 363.2Interest expense . . . . . . . . . . . . . . . . . . . . . . . . . . . . . . . . . . . . . . . . . . . . . . . . . . . . . . . . . . . . . . 131.8Income taxes . . . . . . . . . . . . . . . . . . . . . . . . . . . . . . . . . . . . . . . . . . . . . . . . . . . . . . . . . . . . . . . . . 74.0Depreciation and amortization . . . . . . . . . . . . . . . . . . . . . . . . . . . . . . . . . . . . . . . . . . . . . . . . . . . 325.4Specified items(1) . . . . . . . . . . . . . . . . . . . . . . . . . . . . . . . . . . . . . . . . . . . . . . . . . . . . . . . . . . . . . . 163.7Non-cash items(2) . . . . . . . . . . . . . . . . . . . . . . . . . . . . . . . . . . . . . . . . . . . . . . . . . . . . . . . . . . . . . 39.6
Adjusted EBITDA . . . . . . . . . . . . . . . . . . . . . . . . . . . . . . . . . . . . . . . . . . . . . . . . . . . . . . . . . . . . . $1,097.7
(1) Specified items for the 12 months ended December 31, 2020 of $163.7 million consist of Frutaromintegration related costs, restructuring and other charges, net, losses (gains) on sale of assets, employeeseparation costs, pension settlement, Frutarom acquisition related costs, compliance review & legal defensecosts, N&B transaction related costs and N&B integration related costs.
(2) Non-cash items represent all other adjustments to reconcile net income to net cash provided by operationsas presented on the Statement of Cash Flows, including stock-based compensation and gain on sale ofassets.
(DOLLARS IN MILLIONS)December 31,
2020
Total debt . . . . . . . . . . . . . . . . . . . . . . . . . . . . . . . . . . . . . . . . . . . . . . . . . . . . . . . . . . . . . . . . . . . . . . . $4,413.5Adjustments: . . . . . . . . . . . . . . . . . . . . . . . . . . . . . . . . . . . . . . . . . . . . . . . . . . . . . . . . . . . . . . . . . . . . .
Cash and cash equivalents . . . . . . . . . . . . . . . . . . . . . . . . . . . . . . . . . . . . . . . . . . . . . . . . . . . . . . (649.5)
Net debt . . . . . . . . . . . . . . . . . . . . . . . . . . . . . . . . . . . . . . . . . . . . . . . . . . . . . . . . . . . . . . . . . . . . . . . . . $3,764.0
50
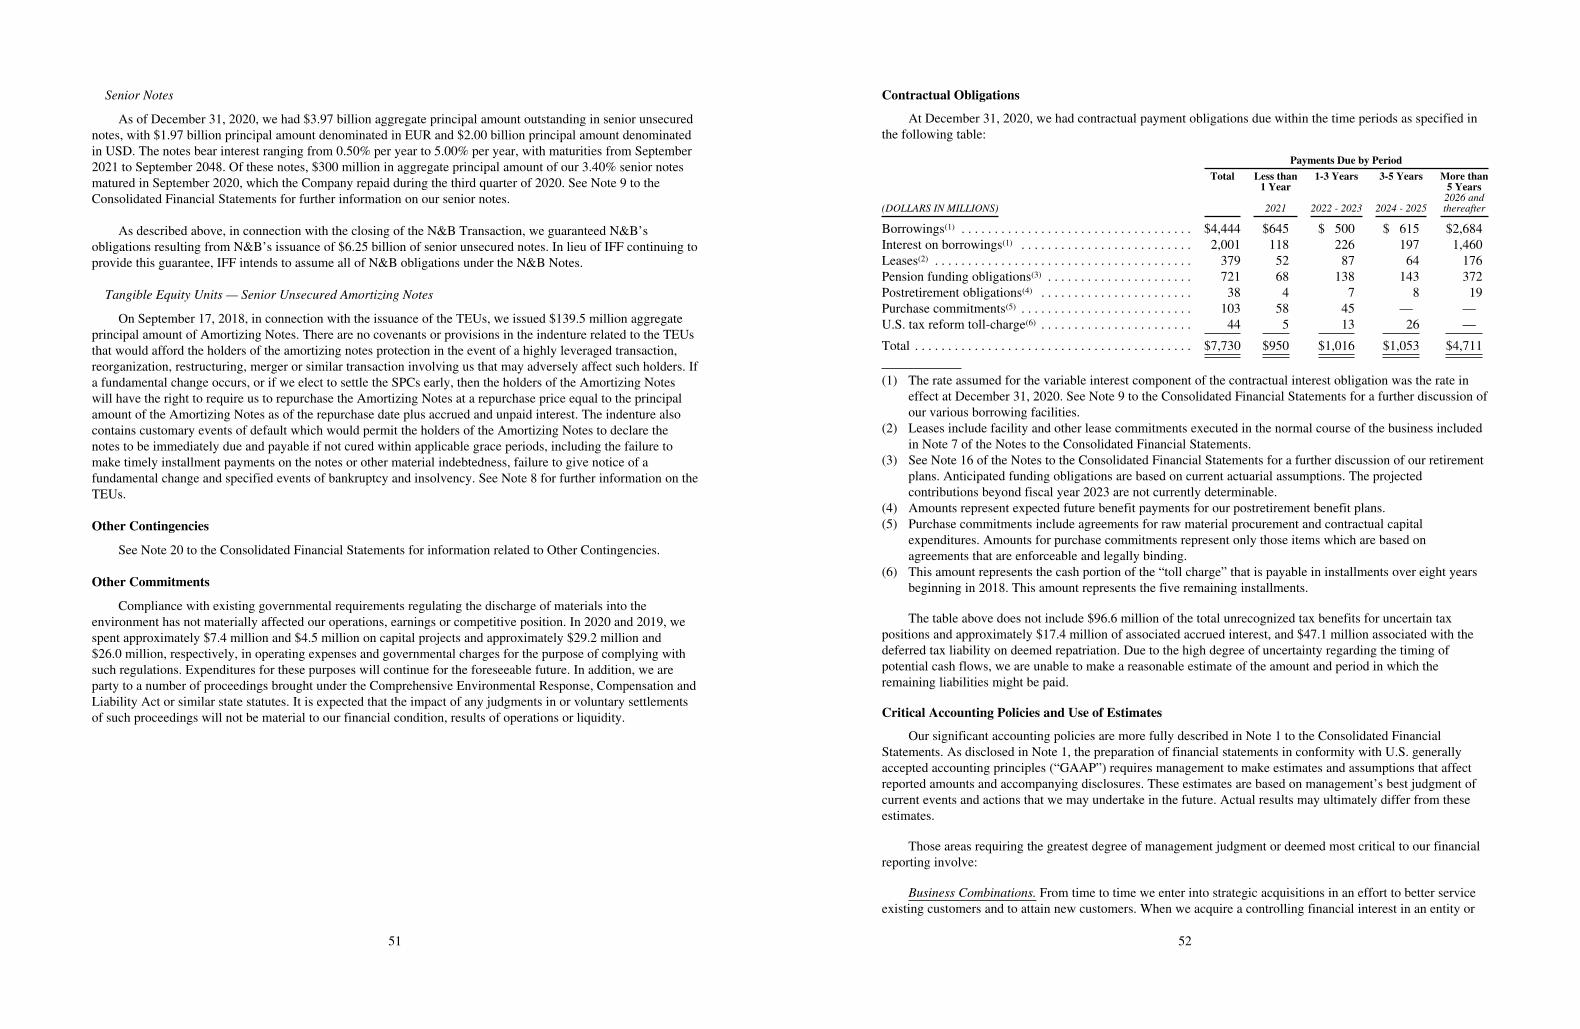
Senior Notes
As of December 31, 2020, we had $3.97 billion aggregate principal amount outstanding in senior unsecurednotes, with $1.97 billion principal amount denominated in EUR and $2.00 billion principal amount denominatedin USD. The notes bear interest ranging from 0.50% per year to 5.00% per year, with maturities from September2021 to September 2048. Of these notes, $300 million in aggregate principal amount of our 3.40% senior notesmatured in September 2020, which the Company repaid during the third quarter of 2020. See Note 9 to theConsolidated Financial Statements for further information on our senior notes.
As described above, in connection with the closing of the N&B Transaction, we guaranteed N&B’sobligations resulting from N&B’s issuance of $6.25 billion of senior unsecured notes. In lieu of IFF continuing toprovide this guarantee, IFF intends to assume all of N&B obligations under the N&B Notes.
Tangible Equity Units — Senior Unsecured Amortizing Notes
On September 17, 2018, in connection with the issuance of the TEUs, we issued $139.5 million aggregateprincipal amount of Amortizing Notes. There are no covenants or provisions in the indenture related to the TEUsthat would afford the holders of the amortizing notes protection in the event of a highly leveraged transaction,reorganization, restructuring, merger or similar transaction involving us that may adversely affect such holders. Ifa fundamental change occurs, or if we elect to settle the SPCs early, then the holders of the Amortizing Noteswill have the right to require us to repurchase the Amortizing Notes at a repurchase price equal to the principalamount of the Amortizing Notes as of the repurchase date plus accrued and unpaid interest. The indenture alsocontains customary events of default which would permit the holders of the Amortizing Notes to declare thenotes to be immediately due and payable if not cured within applicable grace periods, including the failure tomake timely installment payments on the notes or other material indebtedness, failure to give notice of afundamental change and specified events of bankruptcy and insolvency. See Note 8 for further information on theTEUs.
Other Contingencies
See Note 20 to the Consolidated Financial Statements for information related to Other Contingencies.
Other Commitments
Compliance with existing governmental requirements regulating the discharge of materials into theenvironment has not materially affected our operations, earnings or competitive position. In 2020 and 2019, wespent approximately $7.4 million and $4.5 million on capital projects and approximately $29.2 million and$26.0 million, respectively, in operating expenses and governmental charges for the purpose of complying withsuch regulations. Expenditures for these purposes will continue for the foreseeable future. In addition, we areparty to a number of proceedings brought under the Comprehensive Environmental Response, Compensation andLiability Act or similar state statutes. It is expected that the impact of any judgments in or voluntary settlementsof such proceedings will not be material to our financial condition, results of operations or liquidity.
51
Contractual Obligations
At December 31, 2020, we had contractual payment obligations due within the time periods as specified inthe following table:
Payments Due by Period
Total Less than1 Year
1-3 Years 3-5 Years More than5 Years
(DOLLARS IN MILLIONS) 2021 2022 - 2023 2024 - 20252026 andthereafter
Borrowings(1) . . . . . . . . . . . . . . . . . . . . . . . . . . . . . . . . . . . $4,444 $645 $ 500 $ 615 $2,684Interest on borrowings(1) . . . . . . . . . . . . . . . . . . . . . . . . . . 2,001 118 226 197 1,460Leases(2) . . . . . . . . . . . . . . . . . . . . . . . . . . . . . . . . . . . . . . . 379 52 87 64 176Pension funding obligations(3) . . . . . . . . . . . . . . . . . . . . . . 721 68 138 143 372Postretirement obligations(4) . . . . . . . . . . . . . . . . . . . . . . . 38 4 7 8 19Purchase commitments(5) . . . . . . . . . . . . . . . . . . . . . . . . . . 103 58 45 — —U.S. tax reform toll-charge(6) . . . . . . . . . . . . . . . . . . . . . . . 44 5 13 26 —
Total . . . . . . . . . . . . . . . . . . . . . . . . . . . . . . . . . . . . . . . . . . $7,730 $950 $1,016 $1,053 $4,711
(1) The rate assumed for the variable interest component of the contractual interest obligation was the rate ineffect at December 31, 2020. See Note 9 to the Consolidated Financial Statements for a further discussion ofour various borrowing facilities.
(2) Leases include facility and other lease commitments executed in the normal course of the business includedin Note 7 of the Notes to the Consolidated Financial Statements.
(3) See Note 16 of the Notes to the Consolidated Financial Statements for a further discussion of our retirementplans. Anticipated funding obligations are based on current actuarial assumptions. The projectedcontributions beyond fiscal year 2023 are not currently determinable.
(4) Amounts represent expected future benefit payments for our postretirement benefit plans.(5) Purchase commitments include agreements for raw material procurement and contractual capital
expenditures. Amounts for purchase commitments represent only those items which are based onagreements that are enforceable and legally binding.
(6) This amount represents the cash portion of the “toll charge” that is payable in installments over eight yearsbeginning in 2018. This amount represents the five remaining installments.
The table above does not include $96.6 million of the total unrecognized tax benefits for uncertain taxpositions and approximately $17.4 million of associated accrued interest, and $47.1 million associated with thedeferred tax liability on deemed repatriation. Due to the high degree of uncertainty regarding the timing ofpotential cash flows, we are unable to make a reasonable estimate of the amount and period in which theremaining liabilities might be paid.
Critical Accounting Policies and Use of Estimates
Our significant accounting policies are more fully described in Note 1 to the Consolidated FinancialStatements. As disclosed in Note 1, the preparation of financial statements in conformity with U.S. generallyaccepted accounting principles (“GAAP”) requires management to make estimates and assumptions that affectreported amounts and accompanying disclosures. These estimates are based on management’s best judgment ofcurrent events and actions that we may undertake in the future. Actual results may ultimately differ from theseestimates.
Those areas requiring the greatest degree of management judgment or deemed most critical to our financialreporting involve:
Business Combinations. From time to time we enter into strategic acquisitions in an effort to better serviceexisting customers and to attain new customers. When we acquire a controlling financial interest in an entity or
52

group of assets that are determined to meet the definition of a business, we apply the acquisition methoddescribed in ASC Topic 805, Business Combinations. In accordance with GAAP, the results of the acquisitionswe have completed are reflected in our financial statements from the date of acquisition forward.
We allocate the purchase consideration paid to acquire the business to the assets acquired and liabilitiesassumed based on estimated fair values at the acquisition date, with the excess of purchase price over theestimated fair value of the net assets acquired recorded as goodwill. If during the measurement period (a periodnot to exceed twelve months from the acquisition date) we receive additional information that existed as of theacquisition date but at the time of the original allocation described above was unknown to us, we make theappropriate adjustments to the purchase price allocation in the reporting period in which the amounts aredetermined.
Significant judgment is required to estimate the intangibles and fair value of fixed assets and in assigningtheir respective useful lives. Accordingly, we typically engage third-party valuation specialists, who work underthe direction of management, to assist in valuing significant tangible and intangible assets acquired.
The fair value estimates are based on available historical information, future expectations and assumptionsdeemed reasonable by management, but are inherently uncertain.
We typically use an income method to estimate the fair value of intangible assets, which is based onforecasts of the expected future cash flows attributable to the respective assets. Significant estimates andassumptions inherent in the valuations reflect a consideration of other marketplace participants, and include theamount and timing of future cash flows (including expected growth rates, discount rate and profitability), royaltyrates used in the relief of royalty method, customer attrition rates, product obsolescence factors, a brand’s relativemarket position and the discount rate applied to the cash flows. Unanticipated market or macroeconomic eventsand circumstances may occur, which could affect the accuracy or validity of the estimates and assumptions.
Determining the useful life of an intangible asset also requires significant judgment. All of our acquiredintangible assets (e.g., trademarks, product formulas, non-compete agreements and customer relationships) areexpected to have finite useful lives. Our estimates of the useful lives of finite-lived intangible assets are based ona number of factors including competitive environment, market share, brand history, operating plans and themacroeconomic environment of the regions in which the brands are sold.
The costs of finite-lived intangible assets are amortized through expense over their estimated lives. Thevalue of residual goodwill is not amortized, but is tested at least annually for impairment as described in thefollowing note. For acquired intangible assets, the remaining useful life of the trade names and trademarks,product formulas, and customer relationships was estimated at the point at which substantially all of the presentvalue of cumulative cash flows have been earned.
The periodic assessment of potential impairment of goodwill. We currently, as of December 31, 2020, havegoodwill of $5.59 billion. We test goodwill for impairment at the reporting unit level as of November 30 everyyear or more frequently if events or changes in circumstances indicate the asset might be impaired. A reportingunit is an operating segment or one level below an operating segment (referred to as a component) to whichgoodwill is assigned when initially recorded.
We identify our reporting units by assessing whether the components of our operating segments constitutebusinesses for which discrete financial information is available and management of each operating segmentregularly reviews the operating results of those components. We have identified eight reporting units under theTaste and Scent Segments: (1) Flavor Compounds (which includes the Taste reporting unit that was previouslyincluded in the former Frutarom segment, as well as Legacy IFF Flavor Compounds), (2) Fragrance Compounds,(3) Fragrance Ingredients, (4) Cosmetic Active Ingredients, (5) Savory, (6) Natural Product Solutions, (7) Fineand Specialty Ingredients (“FSI”) and (8) Inclusions.
53
For the annual impairment test as of November 30, 2020, we utilized Step 0 of the guidance in ASC Topic350, Intangibles – Goodwill and Other, which allows for the assessment of qualitative factors to determinewhether it is more likely than not that the fair value of a reporting unit is less than its carrying value. If, based ona review of qualitative factors, it is more likely than not that the fair value of a reporting unit is less than itscarrying value, a quantitative impairment test is performed by comparing the fair value of a reporting unit withits carrying amount. Based on a review of qualitative factors, we determined that for four of the reporting units, aquantitative (Step 1) impairment analysis was not necessary to determine if the carrying values of the reportingunit exceeded their fair values. For the other four reporting units (Savory, Natural Product Solutions, FSI, andInclusions), we determined that a Step 1 test was necessary.
We assessed the fair value of the reporting units primarily using an income approach. Under the incomeapproach, we determined the fair value by using a discounted cash flow method at a rate of return that reflects therelative risk of the projected future cash flows of each reporting unit, as well as a terminal value. We use themost current actual and forecasted operating data available. Key estimates and assumptions used in thesevaluations include revenue growth rates and profit margins based on our internal forecasts and historicaloperating trends, and our specific weighted-average cost of capital used to discount future cash flows.
In performing the quantitative test, we determined that the fair value of the four reporting units exceededtheir carrying values and, taken together with the results of the qualitative test, we determined that there was noimpairment of goodwill at any of our eight reporting units in 2020. Based on the quantitative impairment testperformed at November 30, 2020, we determined that the excess of fair values over their respective carryingvalues ranged from 35% to 105% for two reporting units (FSI and Inclusions). The remaining two reporting units(Savory and Natural Product Solutions) had less than 10% excess fair value over carrying value.
As of November 30, 2020, the Savory reporting unit had excess fair value over carrying value ofapproximately 5% and goodwill of $1.21 billion, and the Natural Product Solutions reporting unit had excess fairvalue over carrying value of approximately 1% and goodwill of $851.4 million. While management believes thatthe assumptions used in the impairment test were reasonable, changes in key assumptions, including, lowerrevenue growth, lower operating margin, lower terminal growth rates or increasing discount rates could result ina future impairment.
If current long-term projections for these reporting units are not realized or materially decrease, we may berequired to write-off all or a portion of the goodwill. Such charge could have a material effect on theConsolidated Statements of Operations and Balance Sheets.
The periodic assessment of potential impairment of long-lived assets. We review long-lived assets forimpairment when events or changes in business conditions indicate that their full carrying value may not berecovered. An estimate of undiscounted future cash flows produced by an asset or group of assets is compared tothe carrying value to determine whether impairment exists. If assets are determined to be impaired, the loss ismeasured based on an estimate of fair value using various valuation techniques, including a discounted estimateof future cash flows.
New Accounting Standards
See Note 1 to the Consolidated Financial Statements for a discussion of recent accounting pronouncements.
Non-GAAP Financial Measures
We use non-GAAP financial measures in this Form 10-K, including: (i) currency neutral metrics,(ii) adjusted gross margin, (iii) adjusted operating profit and adjusted operating margin, (iv) adjusted selling andadministrative expenses, and (v) adjusted effective tax rate. We also provide the non-GAAP measures adjustedEBITDA and net debt solely for the purpose of providing information on the extent to which we are incompliance with debt covenants contained in its debt agreements. Our non-GAAP financial measures are definedbelow.
54

These non-GAAP financial measures are intended to provide additional information regarding ourunderlying operating results and comparable year-over-year performance. Such information is supplemental toinformation presented in accordance with GAAP and is not intended to represent a presentation in accordancewith GAAP. In discussing our historical and expected future results and financial condition, we believe it ismeaningful for investors to be made aware of and to be assisted in a better understanding of, on aperiod-to-period comparable basis, financial amounts both including and excluding these identified items, as wellas the impact of exchange rate fluctuations. These non-GAAP measures should not be considered in isolation oras substitutes for analysis of our results under GAAP and may not be comparable to other companies’ calculationof such metrics.
Currency neutral metrics eliminate the effects that result from translating international currency to U.S.dollars. We calculate currency neutral numbers by comparing current year results to the prior year results restatedat exchange rates in effect for the current year based on the currency of the underlying transaction.
Adjusted gross margin excludes operational improvement initiatives, Frutarom integration related costs,FDA mandated product recall and Frutarom acquisition related costs.
Adjusted operating profit and adjusted operating margin excludes operational improvement initiatives,Frutarom integration related costs, restructuring and other charges, net, losses (gains) on sale of assets, employeeseparation costs, FDA mandated product recall, Frutarom acquisition related costs, compliance review & legaldefense costs, N&B transaction related costs and N&B integration related costs.
Adjusted selling and administrative expenses excludes Frutarom integration related costs, employeeseparation costs, Frutarom acquisition related costs, compliance review & legal defense costs, N&B transactionrelated costs and N&B integration related costs.
Adjusted effective tax rate excludes operational improvement initiatives, acquisition related costs, Frutaromintegration related costs, restructuring and other charges, net, losses (gains) on sale of assets, employeeseparation costs, FDA mandated product recall, pension settlement, Frutarom acquisition related costs,compliance review & legal defense costs, N&B transaction related costs, N&B integration related costs andredemption value adjustment to EPS.
Net Debt to Combined Adjusted EBITDA is the leverage ratio used in our credit agreements and defined asNet Debt (which is long-term debt less cash and cash equivalents) divided by Combined Adjusted EBITDA.However, as Adjusted EBITDA for these purposes was calculated in accordance with the provisions of the creditagreements, it may differ from the calculation used for other purposes.
A. Reconciliation of Non-GAAP Metrics
Reconciliation of Gross Profit
Year EndedDecember 31,
(DOLLARS IN THOUSANDS) 2020 2019
Reported (GAAP) . . . . . . . . . . . . . . . . . . . . . . . . . . . . . . . . . . . . . . . . . . . . . . . . . . . . . . $2,085,866 $2,112,748Operational Improvement Initiatives (a) . . . . . . . . . . . . . . . . . . . . . . . . . . . . . . . . . . . . . — 2,267Frutarom Integration Related Costs (c) . . . . . . . . . . . . . . . . . . . . . . . . . . . . . . . . . . . . . . 437 730FDA Mandated Product Recall (f) . . . . . . . . . . . . . . . . . . . . . . . . . . . . . . . . . . . . . . . . . — 250Frutarom Acquisition Related Costs (h) . . . . . . . . . . . . . . . . . . . . . . . . . . . . . . . . . . . . . 759 4,247
Adjusted (Non-GAAP) . . . . . . . . . . . . . . . . . . . . . . . . . . . . . . . . . . . . . . . . . . . . . . . . . . $2,087,062 $2,120,242
55
Reconciliation of Selling and Administrative Expenses
Year EndedDecember 31,
(DOLLARS IN THOUSANDS) 2020 2019
Reported (GAAP) . . . . . . . . . . . . . . . . . . . . . . . . . . . . . . . . . . . . . . . . . . . . . . . . . . . . . . . . . $948,833 $876,121Frutarom Integration Related Costs (c) . . . . . . . . . . . . . . . . . . . . . . . . . . . . . . . . . . . . . . . . . (8,640) (53,481)Employee Separation Costs (e) . . . . . . . . . . . . . . . . . . . . . . . . . . . . . . . . . . . . . . . . . . . . . . . (2,813) —Frutarom Acquisition Related Costs (h) . . . . . . . . . . . . . . . . . . . . . . . . . . . . . . . . . . . . . . . . (706) (1,693)Compliance Review & Legal Defense Costs (i) . . . . . . . . . . . . . . . . . . . . . . . . . . . . . . . . . . (3,278) (11,314)N&B Transaction Related Costs (j) . . . . . . . . . . . . . . . . . . . . . . . . . . . . . . . . . . . . . . . . . . . (28,100) (20,747)N&B Integration Related Costs (k) . . . . . . . . . . . . . . . . . . . . . . . . . . . . . . . . . . . . . . . . . . . . (96,618) —
Adjusted (Non-GAAP) . . . . . . . . . . . . . . . . . . . . . . . . . . . . . . . . . . . . . . . . . . . . . . . . . . . . . $808,678 $788,886
Reconciliation of Operating Profit
Year EndedDecember 31,
(DOLLARS IN THOUSANDS) 2020 2019
Reported (GAAP) . . . . . . . . . . . . . . . . . . . . . . . . . . . . . . . . . . . . . . . . . . . . . . . . . . . . . . . . . $566,484 $665,270Operational Improvement Initiatives (a) . . . . . . . . . . . . . . . . . . . . . . . . . . . . . . . . . . . . . . . . — 2,267Frutarom Integration Related Costs (c) . . . . . . . . . . . . . . . . . . . . . . . . . . . . . . . . . . . . . . . . . 9,849 55,160Restructuring and Other Charges, net (d) . . . . . . . . . . . . . . . . . . . . . . . . . . . . . . . . . . . . . . . 17,295 29,765Losses (Gains) on Sale of Assets . . . . . . . . . . . . . . . . . . . . . . . . . . . . . . . . . . . . . . . . . . . . . 3,784 2,367Employee Separation Costs (e) . . . . . . . . . . . . . . . . . . . . . . . . . . . . . . . . . . . . . . . . . . . . . . . 2,813 —FDA Mandated Product Recall (f) . . . . . . . . . . . . . . . . . . . . . . . . . . . . . . . . . . . . . . . . . . . . — 250Frutarom Acquisition Related Costs (h) . . . . . . . . . . . . . . . . . . . . . . . . . . . . . . . . . . . . . . . . 1,465 5,940Compliance Review & Legal Defense Costs (i) . . . . . . . . . . . . . . . . . . . . . . . . . . . . . . . . . . 3,278 11,314N&B Transaction Related Costs (j) . . . . . . . . . . . . . . . . . . . . . . . . . . . . . . . . . . . . . . . . . . . 28,100 20,747N&B Integration Related Costs (k) . . . . . . . . . . . . . . . . . . . . . . . . . . . . . . . . . . . . . . . . . . . . 96,618 —
Adjusted (Non-GAAP) . . . . . . . . . . . . . . . . . . . . . . . . . . . . . . . . . . . . . . . . . . . . . . . . . . . . . $729,686 $793,080
56

Reconciliation of Net Income and EPS
Year Ended December 31,2020 2019
(DOLLARS INTHOUSANDS)
Incomebeforetaxes
Taxes onincome (m)
Net IncomeAttributable
to IFF(n)
DilutedEPS(o)
Incomebeforetaxes
Taxes onincome (m)
Net IncomeAttributable
to IFF(n)
DilutedEPS (o)
Reported (GAAP) . . $441,371 $ 73,999 $363,228 $ 3.21 $557,452 $ 97,184 $455,873 $ 4.00OperationalImprovementInitiatives (a) . . . . — — — — 2,267 610 1,657 0.01
Acquisition RelatedCosts (b) . . . . . . . . — — — — (3,371) — (3,371) (0.03)
Frutarom IntegrationRelated Costs(c) . . . . . . . . . . . . . 9,849 1,459 8,390 0.07 55,160 12,461 42,699 0.38
Restructuring andOther Charges, net(d) . . . . . . . . . . . . . 17,295 3,991 13,304 0.12 29,765 6,797 22,968 0.20
Losses (Gains) onSale of Assets . . . . 3,784 770 3,014 0.03 2,367 572 1,795 0.02
Employee SeparationCosts (e) . . . . . . . . 2,813 302 2,511 0.02 — — — —
FDA MandatedProduct Recall(f) . . . . . . . . . . . . . — — — — 250 57 193 —
Pension Settlement(g) . . . . . . . . . . . . . 4,441 844 3,597 0.03 — — — —
Frutarom AcquisitionRelated Costs(h) . . . . . . . . . . . . . 1,465 448 1,017 0.01 5,940 794 5,146 0.05
ComplianceReview & LegalDefense Costs(i) . . . . . . . . . . . . . 3,278 736 2,542 0.02 11,314 2,522 8,792 0.08
N&B TransactionRelated Costs(j) . . . . . . . . . . . . . 28,100 1,579 26,521 0.23 20,747 2,354 18,393 0.16
N&B IntegrationRelated Costs(k) . . . . . . . . . . . . . 96,618 22,695 73,923 0.65 — — — —
Redemption valueadjustment to EPS(l) . . . . . . . . . . . . . — — — (0.02) — — — 0.02
Adjusted(Non-GAAP) . . . . $609,014 $106,823 $498,047 $ 4.38 $681,891 $123,351 $554,145 $ 4.88
(a) Represents accelerated depreciation related to plant relocations in India and China.(b) Represents adjustments to the fair value for an equity method investment in Canada which we began
consolidating in the second quarter of 2019.
57
(c) Represents costs related to the integration of the Frutarom acquisition. For 2020, costs primarily related toadvisory services, retention bonuses and performance stock awards. For 2019, costs principally related toadvisory services.
(d) For 2020, represents costs primarily related to the Frutarom Integration Initiative. For 2019, represents costsprimarily related to the Frutarom Integration Initiative and the 2019 Severance Program.
(e) Represents costs related to severance liabilities for two executives who have announced their retirement.(f) Represents additional claims that management paid to co-packers.(g) Represents pension settlement charges incurred in one of the Company’s UK pension plans.(h) Represents transaction-related costs and expenses related to the acquisition of Frutarom. For 2020, amount
primarily includes earn-out payments, net of adjustments, amortization for inventory “step-up” costs andtransaction costs principally related to the 2019 Acquisition Activity. For 2019, amount primarily includesamortization for inventory “step-up” costs and transaction costs.
(i) Costs related to reviewing the nature of inappropriate payments and review of compliance in certain othercountries. In addition, includes legal costs for related shareholder lawsuits.
(j) Represents transaction costs and expenses related to the transaction with N&B, principally related to legaland professional fees for capital raising activities.
(k) Represents costs primarily related to advisory services for the integration of the transaction with N&B,principally consulting fees.
(l) Represents the adjustment to EPS related to the excess of the redemption value of certain redeemablenoncontrolling interests over their existing carrying value.
(m) The income tax expense (benefit) on non-GAAP adjustments is computed in accordance with ASC 740using the same methodology as the GAAP provision of income taxes. Income tax effects of non-GAAPadjustments are calculated based on the applicable statutory tax rate for each jurisdiction in which suchcharges were incurred, except for those items which are non-taxable for which the tax expense (benefit) wascalculated at 0%. Where non-GAAP adjustments are subject to foreign tax credits or valuation allowances,such factors are taken into consideration in calculating the tax expense (benefit). For amortization, the taxbenefit has been calculated based on the statutory rate on a country by country basis.
(n) For 2020 and 2019, net income is reduced by income attributable to noncontrolling interest of $4.1M and$4.4M, respectively.
(o) The sum of these items does not foot due to rounding.
B. Foreign Currency Reconciliation
Operating Profit
Year EndedDecember 31,2020 2019
% Change — Reported (GAAP) . . . . . . . . . . . . . . . . . . . . . . . . . . . . . . . . . . . . . . . . . . . . . . . . . . . . (15)% 14%Items impacting comparability (1) . . . . . . . . . . . . . . . . . . . . . . . . . . . . . . . . . . . . . . . . . . . . . . . . . . . . . 7% 3%%Change — Adjusted (Non-GAAP) . . . . . . . . . . . . . . . . . . . . . . . . . . . . . . . . . . . . . . . . . . . . . . . . (8)% 17%Currency Impact . . . . . . . . . . . . . . . . . . . . . . . . . . . . . . . . . . . . . . . . . . . . . . . . . . . . . . . . . . . . . . . . . . 2% 2%%Change Year-over-Year — Currency Neutral Adjusted (Non-GAAP) (2)(3) . . . . . . . . . . . . . . (6)% 20%
(1) Includes items impacting comparability of $163.2 million for the year ended December 31, 2020 andincludes $127.8 million of items impacting comparability for the year ended December 31, 2019.
(2) 2019 item does not foot due to rounding.(3) Currency neutral amount is calculated by translating prior year amounts at the exchange rates used for the
corresponding 2020 period. Currency neutral operating profit also eliminates the year-over-year impact ofcash flow hedging.
58

Cautionary Statement Under the Private Securities Litigation Reform Act of 1995
Statements in this Form 10-K, which are not historical facts or information, are “forward-lookingstatements” within the meaning of The Private Securities Litigation Reform Act of 1995. Such forward-lookingstatements are based on management’s current assumptions, estimates and expectations and include statementsconcerning (i) the impacts of COVID-19 and our plans to respond to its implications; (ii) our combination withN&B, including the expected benefits and synergies of the N&B Transaction and future opportunities for thecombined company; (iii) our ability to achieve the anticipated benefits of the Frutarom acquisition, including$145 million of expected synergies; (iv) our ability to achieve our Vision 2021 strategy of accelerated revenueand profitability growth, (v) the growth potential of the markets in which we operate, including the emergingmarkets, (vi) expected capital expenditures in 2021, (vii) expectations regarding the Frutarom IntegrationInitiative, (viii) the expected costs and benefits of our ongoing optimization of our manufacturing operations,including the expected number of closings, (ix) expected cash flow and availability of capital resources to fundour operations and meet our debt service requirements; (x) our ability to innovate and execute on specificconsumer trends and demands; and (xi) our ability to continue to generate value for, and return cash to, ourshareholders. These forward-looking statements should be evaluated with consideration given to the many risksand uncertainties inherent in our business that could cause actual results and events to differ materially fromthose in the forward-looking statements. Certain of such forward-looking information may be identified by suchterms as “expect”, “anticipate”, “believe”, “intend”, “outlook”, “may”, “estimate”, “should”, “predict” andsimilar terms or variations thereof. Such forward-looking statements are based on a series of expectations,assumptions, estimates and projections about the Company, are not guarantees of future results or performance,and involve significant risks, uncertainties and other factors, including assumptions and projections, for allforward periods. Our actual results may differ materially from any future results expressed or implied by suchforward-looking statements. Such risks, uncertainties and other factors include, among others, the following:
‰ disruption in the development, manufacture, distribution or sale of our products from COVID-19 andother public health crises;
‰ risks related to the integration of N&B and the Frutarom business, including whether we will realize thebenefits anticipated from the acquisitions in the expected time frame;
‰ unanticipated costs, liabilities, charges or expenses resulting from the Frutarom acquisition and the N&BTransaction;
‰ risks related to the restrictions that we are required to abide by in connection with the N&B Transaction;
‰ our ability to provide the same types and level of services to the N&B Business that historically havebeen provided by DuPont, and our ability to maintain relationships with third parties and pre-existingcustomers of N&B.
‰ our ability to realize expected cost savings and increased efficiencies of the Frutarom integration and ourongoing optimization of our manufacturing facilities;
‰ our ability to successfully establish and manage acquisitions, collaborations, joint ventures or partnership;
‰ the increase in our leverage resulting from the additional debt incurred to pay a portion of theconsideration for Frutarom and its impact on our liquidity and ability to return capital to its shareholders;
‰ our ability to successfully market to our expanded and diverse Taste customer base;
‰ our ability to effectively compete in our market and develop and introduce new products that meetcustomers’ needs;
‰ our ability to retain key employees;
‰ changes in demand from large multi-national customers due to increased competition and our ability tomaintain “core list” status with customers;
‰ our ability to successfully develop innovative and cost-effective products that allow customers to achievetheir own profitability expectations;
59
‰ disruption in the development, manufacture, distribution or sale of our products from natural disasters,public health crises, international conflicts, terrorist acts, labor strikes, political crisis, accidents andsimilar events;
‰ the impact of a disruption in our supply chain, including the inability to obtain ingredients and rawmaterials from third parties;
‰ volatility and increases in the price of raw materials, energy and transportation;
‰ the impact of a significant data breach or other disruption in our information technology systems, and ourability to comply with data protection laws in the U.S. and abroad;
‰ our ability to comply with, and the costs associated with compliance with, regulatory requirements andindustry standards, including regarding product safety, quality, efficacy and environmental impact;
‰ our ability to react in a timely and cost-effective manner to changes in consumer preferences anddemands, including increased awareness of health and wellness;
‰ our ability to meet consumer, customer and regulatory sustainability standards;
‰ our ability to benefit from our investments and expansion in emerging markets;
‰ the impact of currency fluctuations or devaluations in the principal foreign markets in which we operate;
‰ economic, regulatory and political risks associated with our international operations;
‰ the impact of global economic uncertainty on demand for consumer products;
‰ our ability to comply with, and the costs associated with compliance with, U.S. and foreign environmentalprotection laws;
‰ our ability to successfully manage our working capital and inventory balances;
‰ the impact of the failure to comply with U.S. or foreign anti-corruption and anti-bribery laws andregulations, including the U.S. Foreign Corrupt Practices Act;
‰ any impairment on our tangible or intangible long-lived assets, including goodwill associated with theacquisition of Frutarom;
‰ our ability to protect our intellectual property rights;
‰ the impact of the outcome of legal claims, regulatory investigations and litigation;
‰ changes in market conditions or governmental regulations relating to our pension and postretirementobligations;
‰ the impact of changes in federal, state, local and international tax legislation or policies, including the TaxCuts and Jobs Act, with respect to transfer pricing and state aid, and adverse results of tax audits,assessments, or disputes;
‰ the impact of the United Kingdom’s departure from the European Union; and
‰ the impact of the phase out of the London Interbank Offered Rate (LIBOR) on interest expense.
The foregoing list of important factors does not include all such factors, nor necessarily present them inorder of importance. In addition, you should consult other disclosures made by the Company (such as in ourother filings with the SEC or in company press releases) for other factors that may cause actual results to differmaterially from those projected by the Company. Please refer to Part I. Item 1A., Risk Factors, of this Form 10-Kfor additional information regarding factors that could affect our results of operations, financial condition andliquidity.
We intend our forward-looking statements to speak only as of the time of such statements and do notundertake or plan to update or revise them as more information becomes available or to reflect changes in
60

expectations, assumptions or results. We can give no assurance that such expectations or forward-lookingstatements will prove to be correct. An occurrence of, or any material adverse change in, one or more of the riskfactors or risks and uncertainties referred to in this report or included in our other periodic reports filed with theSEC could materially and adversely impact our operations and our future financial results.
Any public statements or disclosures made by us following this report that modify or impact any of theforward-looking statements contained in or accompanying this report will be deemed to modify or supersedesuch outlook or other forward-looking statements in or accompanying this report.
61
ITEM 7A. QUANTITATIVE AND QUALITATIVE DISCLOSURES ABOUTMARKET RISK.
We operate on a global basis and are exposed to currency fluctuation related to the manufacture and sale ofour products in currencies other than the U.S. dollar. The major foreign currencies involve the markets in theEuropean Union, Great Britain, Mexico, Brazil, China, India, Indonesia, Australia, Russia and Japan, although allregions are subject to foreign currency fluctuations versus the U.S. dollar. We actively monitor our foreigncurrency exposures in all major markets in which we operate, and employ a variety of techniques to mitigate theimpact of exchange rate fluctuations, including foreign currency hedging activities.
We have established a centralized reporting system to evaluate the effects of changes in interest rates,currency exchange rates and other relevant market risks. Our risk management procedures include the monitoringof interest rate and foreign exchange exposures and hedge positions utilizing statistical analyses of cash flows,market value and sensitivity analysis. However, the use of these techniques to quantify the market risk of suchinstruments should not be construed as an endorsement of their accuracy or the accuracy of the relatedassumptions. For the year ended December 31, 2020, our exposure to market risk was estimated using sensitivityanalyses, which illustrate the change in the fair value of a derivative financial instrument assuming hypotheticalchanges in foreign exchange rates and interest rates.
We enter into foreign currency forward contracts with the objective of reducing exposure to cash flowvolatility associated with foreign currency receivables and payables, and with anticipated purchases of certainraw materials used in operations. These contracts, the counterparties to which are major international financialinstitutions, generally involve the exchange of one currency for a second currency at a future date, and havematurities not exceeding twelve months. The gain or loss on the hedging instrument and services is recorded inearnings at the same time as the transaction being hedged is recorded in earnings. At December 31, 2020, ourforeign currency exposures pertaining to derivative contracts exist with the Euro, Japanese Yen, British Pound,Australian Dollar and Indonesian Rupiah. Based on a hypothetical decrease or increase of 10% in the applicablebalance sheet exchange rates (primarily against the U.S. dollar), the estimated fair value of our foreign currencyforward contracts would increase by approximately $7.0 million. However, any change in the value of thecontracts, real or hypothetical, would be significantly offset by a corresponding change in the value of theunderlying hedged items.
We use derivative instruments as part of our interest rate risk management strategy. We have entered intocertain cross currency swap agreements in order to mitigate a portion of our net European investments fromforeign currency risk. As of December 31, 2020, these swaps were in a net liability position with an aggregatefair value of $23.4 million. Based on a hypothetical decrease or increase of 10% in the value of the U.S. dollaragainst the Euro, the estimated fair value of our cross currency swaps would change by approximately$34.7 million.
At December 31, 2020, the fair value of our EUR fixed rate debt was €2.1 billion. Based on a hypotheticaldecrease or increase of 10% in foreign exchange rates, the estimated fair value of our EUR fixed rate debt wouldchange by approximately $216.3 million.
At December 31, 2020, the fair value of our USD fixed rate debt was $2.5 billion. Based on a hypotheticaldecrease or increase of 10% in interest rates, the estimated fair value of our US fixed rate debt would change byapproximately $245.5 million.
We purchase certain commodities, such as natural gas, electricity, petroleum based products and certaincrop related items. We generally purchase these commodities based upon market prices that are established withthe vendor as part of the purchase process. In general, we do not use commodity financial instruments to hedgecommodity prices.
ITEM 8. FINANCIAL STATEMENTS AND SUPPLEMENTARY DATA.
See index to Consolidated Financial Statements on page 55. See Item 6 on page 35 for supplementalquarterly data.
62
ITEM 9. CHANGES IN AND DISAGREEMENTSWITH ACCOUNTANTS ON ACCOUNTING ANDFINANCIAL DISCLOSURE.
None.
ITEM 9A. CONTROLS AND PROCEDURES.
Evaluation of Disclosure Controls and Procedures and Changes in Internal Control over FinancialReporting.
Our Chief Executive Officer and Chief Financial Officer, with the assistance of other members of ourmanagement, have evaluated the effectiveness of our disclosure controls and procedures as of the end of theperiod covered by this Form 10-K. Based on such evaluation, our Chief Executive Officer and Chief FinancialOfficer have concluded that our disclosure controls and procedures are effective as of the end of the periodcovered by this Form 10-K.
We have established controls and procedures designed to ensure that information required to be disclosed inthe reports that we file or submit under the Exchange Act is recorded, processed, summarized and reported withinthe time periods specified in the Commission’s rules and forms and is accumulated and communicated tomanagement, including the principal executive officer and the principal financial officer, to allow timelydecisions regarding required disclosure.
Our Chief Executive Officer and Chief Financial Officer have concluded that there have not been anychanges in our internal control over financial reporting during the fourth quarter that have materially affected, orare reasonably likely to materially affect, our internal control over financial reporting.
Management’s Report on Internal Control Over Financial Reporting.
Our management is responsible for establishing and maintaining adequate internal control over financialreporting as defined in Rules 13a-15(f) and 15d-15(f) under the Securities Exchange Act of 1934. Our internalcontrol over financial reporting is a process designed to provide reasonable assurance regarding the reliability offinancial reporting and the preparation of financial statements for external purposes in accordance with generallyaccepted accounting principles.
Because of its inherent limitations, internal control over financial reporting may not prevent or detectmisstatements. Also, projections of any evaluation of effectiveness to future periods are subject to the risk thatcontrols may become inadequate because of changes in conditions, or that the degree of compliance with thepolicies or procedures may deteriorate.
Management assessed the effectiveness of our internal control over financial reporting as of January 1,2021. In making this assessment, management used the criteria set forth by the Committee of SponsoringOrganizations of the Treadway Commission (“COSO”) in its 2013 Internal Control — Integrated Framework.
Based on this assessment, management determined that, as of January 1, 2021, our internal control overfinancial reporting was effective.
PricewaterhouseCoopers LLP, our independent registered public accounting firm, has audited theeffectiveness of our internal control over financial reporting as of January 1, 2021 as stated in their report whichis included herein.
ITEM 9B. OTHER INFORMATION.
None.
63
PART III
ITEM 10. DIRECTORS, EXECUTIVE OFFICERS AND CORPORATE GOVERNANCE.
The information relating to directors and nominees of the Company is set forth in the IFF 2021 ProxyStatement and is incorporated by reference herein. The information relating to Section 16(a) beneficial ownershipreporting compliance that appears in the IFF 2021 Proxy Statement is also incorporated by reference herein. SeePart I, Item 1 of this Form 10-K for information relating to the Company’s Executive Officers.
We have adopted a Code of Conduct (the “Code of Conduct”) that applies to all of our employees, includingour chief executive officer and our chief financial officer. We have also adopted a Code of Conduct for Directorsand a Code of Conduct for Executive Officers (together with the Code of Conduct, the “Codes”). The Codes areavailable through the Investors — Governance link on our website at https://ir.iff.com/governance.
Only the Board of Directors or the Audit Committee of the Board may grant a waiver from any provision ofour Codes in favor of a director or executive officer, and any such waiver will be publicly disclosed. We willdisclose substantive amendments to and any waivers from the Codes provided to our chief executive officer,principal financial officer or principal accounting officer, as well as any other executive officer or director, on theCompany’s website: www.iff.com.
The information regarding the Company’s Audit Committee and its designated audit committee financialexperts is set forth in the IFF 2021 Proxy Statement and such information is incorporated by reference herein.
The information concerning procedures by which shareholders may recommend director nominees is setforth in the IFF 2021 Proxy Statement and such information is incorporated by reference herein.
ITEM 11. EXECUTIVE COMPENSATION.
The items required by Part III, Item 11 are incorporated herein by reference from the IFF 2021 ProxyStatement to be filed on or before May 1, 2021.
ITEM 12. SECURITY OWNERSHIP OF CERTAIN BENEFICIAL OWNERS ANDMANAGEMENTAND RELATED STOCKHOLDERMATTERS.
The items required by Part III, Item 12 are incorporated herein by reference from the IFF 2021 ProxyStatement to be filed on or before May 1, 2021.
ITEM 13. CERTAIN RELATIONSHIPS AND RELATED TRANSACTIONS, AND DIRECTORINDEPENDENCE.
The items required by Part III, Item 13 are incorporated herein by reference from the IFF 2021 ProxyStatement to be filed on or before May 1, 2021.
ITEM 14. PRINCIPAL ACCOUNTANT FEES AND SERVICES.
The items required by Part III, Item 14 are incorporated herein by reference from the IFF 2021 ProxyStatement to be filed on or before May 1, 2021.
64

PART IV
ITEM 15. EXHIBITS AND FINANCIAL STATEMENT SCHEDULES.
(a)(1) FINANCIAL STATEMENTS: The following consolidated financial statements, related notes, andindependent registered public accounting firm’s report are included in this Form 10-K:
Report of Independent Registered Public Accounting Firm . . . . . . . . . . . . . . . . . . . . . . . . . . . . . . . . . . . . . . 66Consolidated Statement of Income and Comprehensive Income for the years ended December 31, 2020,2019 and 2018 . . . . . . . . . . . . . . . . . . . . . . . . . . . . . . . . . . . . . . . . . . . . . . . . . . . . . . . . . . . . . . . . . . . . . . . 69
Consolidated Balance Sheet as of December 31, 2020 and 2019 . . . . . . . . . . . . . . . . . . . . . . . . . . . . . . . . . . 70Consolidated Statement of Cash Flows for the years ended December 31, 2020, 2019 and 2018 . . . . . . . . . 71Consolidated Statement of Shareholders’ Equity for the years ended December 31, 2020, 2019 and 2018 . . 72Notes to Consolidated Financial Statements . . . . . . . . . . . . . . . . . . . . . . . . . . . . . . . . . . . . . . . . . . . . . . . . . . 73
(a)(3) EXHIBITS . . . . . . . . . . . . . . . . . . . . . . . . . . . . . . . . . . . . . . . . . . . . . . . . . . . . . . . . . . . . . . . . . . . 126
(a)(2) FINANCIAL STATEMENT SCHEDULES
Schedule II — Valuation and Qualifying Accounts and Reserves for the years ended December 31, 2020,2019 and 2018 . . . . . . . . . . . . . . . . . . . . . . . . . . . . . . . . . . . . . . . . . . . . . . . . . . . . . . . . . . . . . . . . . . . . . . . S-1
All other schedules are omitted because they are not applicable or the required information is shown in thefinancial statements or notes thereto.
65
REPORT OF INDEPENDENT REGISTERED PUBLIC ACCOUNTING FIRM
To the Board of Directors and Shareholders of International Flavors & Fragrances Inc.
Opinions on the Financial Statements and Internal Control over Financial Reporting
We have audited the accompanying consolidated balance sheets of International Flavors & Fragrances Inc.and its subsidiaries (the “Company”) as of January 1, 2021 and January 3, 2020, and the related consolidatedstatements of income and comprehensive income, of shareholders’ equity and of cash flows for each of the threeyears in the period ended January 1, 2021, including the related notes and financial statement schedule listed inthe index appearing under Item 15(a)(2) (collectively referred to as the “consolidated financial statements”). Wealso have audited the Company’s internal control over financial reporting as of January 1, 2021, based on criteriaestablished in Internal Control -Integrated Framework (2013) issued by the Committee of SponsoringOrganizations of the Treadway Commission (COSO).
In our opinion, the consolidated financial statements referred to above present fairly, in all material respects,the financial position of the Company as of January 1, 2021 and January 3, 2020, and the results of its operationsand its cash flows for each of the three years in the period ended January 1, 2021 in conformity with accountingprinciples generally accepted in the United States of America. Also in our opinion, the Company maintained, inall material respects, effective internal control over financial reporting as of January 1, 2021, based on criteriaestablished in Internal Control - Integrated Framework (2013) issued by the COSO.
Change in Accounting Principle
As discussed in Note 1 to the consolidated financial statements, the Company changed the manner in whichit accounts for leases in 2019.
Basis for Opinions
The Company’s management is responsible for these consolidated financial statements, for maintainingeffective internal control over financial reporting, and for its assessment of the effectiveness of internal controlover financial reporting, included in Management’s Report on Internal Control over Financial Reportingappearing under Item 9A. Our responsibility is to express opinions on the Company’s consolidated financialstatements and on the Company’s internal control over financial reporting based on our audits. We are a publicaccounting firm registered with the Public Company Accounting Oversight Board (United States) (PCAOB) andare required to be independent with respect to the Company in accordance with the U.S. federal securities lawsand the applicable rules and regulations of the Securities and Exchange Commission and the PCAOB.
We conducted our audits in accordance with the standards of the PCAOB. Those standards require that weplan and perform the audits to obtain reasonable assurance about whether the consolidated financial statementsare free of material misstatement, whether due to error or fraud, and whether effective internal control overfinancial reporting was maintained in all material respects.
Our audits of the consolidated financial statements included performing procedures to assess the risks ofmaterial misstatement of the consolidated financial statements, whether due to error or fraud, and performingprocedures that respond to those risks. Such procedures included examining, on a test basis, evidence regardingthe amounts and disclosures in the consolidated financial statements. Our audits also included evaluating theaccounting principles used and significant estimates made by management, as well as evaluating the overallpresentation of the consolidated financial statements. Our audit of internal control over financial reportingincluded obtaining an understanding of internal control over financial reporting, assessing the risk that a materialweakness exists, and testing and evaluating the design and operating effectiveness of internal control based onthe assessed risk. Our audits also included performing such other procedures as we considered necessary in thecircumstances. We believe that our audits provide a reasonable basis for our opinions.
66

Definition and Limitations of Internal Control over Financial Reporting
A company’s internal control over financial reporting is a process designed to provide reasonable assuranceregarding the reliability of financial reporting and the preparation of financial statements for external purposes inaccordance with generally accepted accounting principles. A company’s internal control over financial reportingincludes those policies and procedures that (i) pertain to the maintenance of records that, in reasonable detail,accurately and fairly reflect the transactions and dispositions of the assets of the company; (ii) provide reasonableassurance that transactions are recorded as necessary to permit preparation of financial statements in accordancewith generally accepted accounting principles, and that receipts and expenditures of the company are being madeonly in accordance with authorizations of management and directors of the company; and (iii) provide reasonableassurance regarding prevention or timely detection of unauthorized acquisition, use, or disposition of thecompany’s assets that could have a material effect on the financial statements.
Because of its inherent limitations, internal control over financial reporting may not prevent or detectmisstatements. Also, projections of any evaluation of effectiveness to future periods are subject to the risk thatcontrols may become inadequate because of changes in conditions, or that the degree of compliance with thepolicies or procedures may deteriorate.
Critical Audit Matters
The critical audit matter communicated below is a matter arising from the current period audit of theconsolidated financial statements that was communicated or required to be communicated to the audit committeeand that (i) relates to accounts or disclosures that are material to the consolidated financial statements and(ii) involved our especially challenging, subjective, or complex judgments. The communication of critical auditmatters does not alter in any way our opinion on the consolidated financial statements, taken as a whole, and weare not, by communicating the critical audit matter below, providing a separate opinion on the critical auditmatter or on the accounts or disclosures to which it relates.
Goodwill Impairment Assessment - Savory and Natural Product Solutions Reporting Units
As described in Notes 1 and 5 to the consolidated financial statements, the Company’s consolidatedgoodwill balance was $5.6 billion as of January 1, 2021, and the goodwill associated with the Savory and NaturalProducts Solutions Reporting Units (“the Reporting Units”) was $1.21 billion and $851.4 million, respectively.Management tests goodwill for impairment at the reporting unit level as of November 30 every year or morefrequently if events or changes in circumstances indicate the asset might be impaired. Fair value is estimated bymanagement using a discounted cash flow model. Management determines the fair value of reporting units,including the Reporting Units, using key assumptions including revenue growth rates, profit margins and thespecific weighted-average cost of capital used to discount future cash flows.
The principal considerations for our determination that performing procedures relating to the goodwillimpairment assessment of the Reporting Units is a critical audit matter are (i) the significant judgment bymanagement when developing the fair value measurement of the Reporting Units; (ii) a high degree of auditorjudgment, subjectivity, and effort in performing procedures and in evaluating audit evidence relating tomanagement’s significant assumptions related to the revenue growth rates, profit margins and the specificweighted-average cost of capital used to discount future cash flows; and (iii) the audit effort involved the use ofprofessionals with specialized skill and knowledge.
Addressing the matter involved performing procedures and evaluating audit evidence in connection withforming our overall opinion on the consolidated financial statements. These procedures included testing theeffectiveness of controls relating to management’s goodwill impairment assessment, including controls over thevaluation of the Reporting Units. These procedures also included, among others, (i) testing management’sprocess for developing the fair value estimate; (ii) evaluating the appropriateness of the discounted cash flowmodel; (iii) testing the completeness and accuracy of underlying data used in the model; and (iv) evaluating the
67
significant assumptions used by management related to the revenue growth rates, profit margins and the specificweighted-average cost of capital used to discount future cash flows. Evaluating management’s assumptionsrelated to the revenue growth rates and profit margins involved evaluating whether the assumptions used bymanagement were reasonable considering (i) the current and past performance of the Reporting Units; (ii) theconsistency with external market and industry data; and (iii) whether the assumptions were consistent withevidence obtained in other areas of the audit. Professionals with specialized skill and knowledge were used toassist in the evaluation of the Company’s discounted cash flow model and the specific weighted-average cost ofcapital assumption used to discount future cash flows.
/s/ PricewaterhouseCoopers LLPNew York, New YorkFebruary 22, 2021
We have served as the Company’s auditor since 1957.
68

INTERNATIONAL FLAVORS & FRAGRANCES INC.
CONSOLIDATED STATEMENT OF INCOME AND COMPREHENSIVE INCOME
Year Ended December 31,
(DOLLARS IN THOUSANDS EXCEPT PER SHARE AMOUNTS) 2020 2019 2018
Net sales . . . . . . . . . . . . . . . . . . . . . . . . . . . . . . . . . . . . . . . . . . . . . . . . . . $5,084,239 $5,140,084 $3,977,539Cost of goods sold . . . . . . . . . . . . . . . . . . . . . . . . . . . . . . . . . . . . . . . . . . 2,998,373 3,027,336 2,294,832
Gross profit . . . . . . . . . . . . . . . . . . . . . . . . . . . . . . . . . . . . . . . . . . . . . . . . 2,085,866 2,112,748 1,682,707Research and development expenses . . . . . . . . . . . . . . . . . . . . . . . . . . . . 356,863 346,128 311,583Selling and administrative expenses . . . . . . . . . . . . . . . . . . . . . . . . . . . . . 948,833 876,121 707,461Restructuring and other charges, net . . . . . . . . . . . . . . . . . . . . . . . . . . . . 17,295 29,765 5,079Amortization of acquisition-related intangibles . . . . . . . . . . . . . . . . . . . . 192,607 193,097 75,879Losses (gains) on sale of fixed assets . . . . . . . . . . . . . . . . . . . . . . . . . . . . 3,784 2,367 (1,177)
Operating profit . . . . . . . . . . . . . . . . . . . . . . . . . . . . . . . . . . . . . . . . . . . . 566,484 665,270 583,882Interest expense . . . . . . . . . . . . . . . . . . . . . . . . . . . . . . . . . . . . . . . . . . . . 131,802 138,221 132,558Loss on extinguishment of debt . . . . . . . . . . . . . . . . . . . . . . . . . . . . . . . . — — 38,810Other income, net . . . . . . . . . . . . . . . . . . . . . . . . . . . . . . . . . . . . . . . . . . . (6,689) (30,403) (35,243)
Income before taxes . . . . . . . . . . . . . . . . . . . . . . . . . . . . . . . . . . . . . . . . . 441,371 557,452 447,757Taxes on income . . . . . . . . . . . . . . . . . . . . . . . . . . . . . . . . . . . . . . . . . . . . 73,999 97,184 107,976
Net income . . . . . . . . . . . . . . . . . . . . . . . . . . . . . . . . . . . . . . . . . . . . . . . . 367,372 460,268 339,781Net income attributable to noncontrolling interests . . . . . . . . . . . . . . . . . 4,144 4,395 2,479
Net income attributable to IFF stockholders . . . . . . . . . . . . . . . . . . . . . . 363,228 455,873 337,302
Other comprehensive income:Foreign currency translation adjustments . . . . . . . . . . . . . . . . . . . . . . . . . 88,132 23,953 (99,580)(Losses) gains on derivatives qualifying as hedges . . . . . . . . . . . . . . . . . (8,938) (2,678) 15,078Pension and postretirement liability adjustment . . . . . . . . . . . . . . . . . . . . (59,841) (35,942) 19,757
Comprehensive income attributable to IFF stockholders . . . . . . . . . . . . . $ 382,581 $ 441,206 $ 272,557
Net income per share — basic . . . . . . . . . . . . . . . . . . . . . . . . . . . . . . . . . $ 3.25 $ 4.05 $ 3.81Net income per share — diluted . . . . . . . . . . . . . . . . . . . . . . . . . . . . . . . . $ 3.21 $ 4.00 $ 3.79Average number of shares outstanding - basic . . . . . . . . . . . . . . . . . . . . . 112,162 111,966 87,551Average number of shares outstanding - diluted . . . . . . . . . . . . . . . . . . . 113,630 113,307 88,121
See Notes to Consolidated Financial Statements
69
INTERNATIONAL FLAVORS & FRAGRANCES INC.
CONSOLIDATED BALANCE SHEET
December 31,
(DOLLARS IN THOUSANDS) 2020 2019
ASSETSCurrent Assets:Cash and cash equivalents . . . . . . . . . . . . . . . . . . . . . . . . . . . . . . . . . . . . . . . . . . . . . . . . . . . . . . . $ 649,541 $ 606,823Restricted cash . . . . . . . . . . . . . . . . . . . . . . . . . . . . . . . . . . . . . . . . . . . . . . . . . . . . . . . . . . . . . . . . 7,295 17,122Receivables:
Trade . . . . . . . . . . . . . . . . . . . . . . . . . . . . . . . . . . . . . . . . . . . . . . . . . . . . . . . . . . . . . . . . . . . . 950,350 892,625Allowance for doubtful accounts . . . . . . . . . . . . . . . . . . . . . . . . . . . . . . . . . . . . . . . . . . . . . . (21,008) (16,428)
Inventories . . . . . . . . . . . . . . . . . . . . . . . . . . . . . . . . . . . . . . . . . . . . . . . . . . . . . . . . . . . . . . . . . . . 1,131,856 1,123,068Prepaid expenses and other current assets . . . . . . . . . . . . . . . . . . . . . . . . . . . . . . . . . . . . . . . . . . . 341,765 319,334
Total Current Assets . . . . . . . . . . . . . . . . . . . . . . . . . . . . . . . . . . . . . . . . . . . . . . . . . . . . . . . . 3,059,799 2,942,544
Property, plant and equipment, net . . . . . . . . . . . . . . . . . . . . . . . . . . . . . . . . . . . . . . . . . . . . . . . . . 1,458,185 1,386,920Goodwill . . . . . . . . . . . . . . . . . . . . . . . . . . . . . . . . . . . . . . . . . . . . . . . . . . . . . . . . . . . . . . . . . . . . . 5,593,252 5,497,596Other intangible assets, net . . . . . . . . . . . . . . . . . . . . . . . . . . . . . . . . . . . . . . . . . . . . . . . . . . . . . . . 2,727,175 2,851,935Other assets . . . . . . . . . . . . . . . . . . . . . . . . . . . . . . . . . . . . . . . . . . . . . . . . . . . . . . . . . . . . . . . . . . . 717,260 608,416
Total Assets . . . . . . . . . . . . . . . . . . . . . . . . . . . . . . . . . . . . . . . . . . . . . . . . . . . . . . . . . . . . . . . . . . $13,555,671 $13,287,411
LIABILITIES AND SHAREHOLDERS’ EQUITYCurrent Liabilities:Bank borrowings, overdrafts and current portion of long-term debt . . . . . . . . . . . . . . . . . . . . . . . $ 634,159 $ 384,958Accounts payable . . . . . . . . . . . . . . . . . . . . . . . . . . . . . . . . . . . . . . . . . . . . . . . . . . . . . . . . . . . . . . 555,687 510,372Dividends payable . . . . . . . . . . . . . . . . . . . . . . . . . . . . . . . . . . . . . . . . . . . . . . . . . . . . . . . . . . . . . 82,315 80,038Other current liabilities . . . . . . . . . . . . . . . . . . . . . . . . . . . . . . . . . . . . . . . . . . . . . . . . . . . . . . . . . . 631,565 576,822
Total Current Liabilities . . . . . . . . . . . . . . . . . . . . . . . . . . . . . . . . . . . . . . . . . . . . . . . . . . . . . 1,903,726 1,552,190
Other Liabilities:Long-term debt . . . . . . . . . . . . . . . . . . . . . . . . . . . . . . . . . . . . . . . . . . . . . . . . . . . . . . . . . . . . . . . . 3,779,359 3,997,438Retirement liabilities . . . . . . . . . . . . . . . . . . . . . . . . . . . . . . . . . . . . . . . . . . . . . . . . . . . . . . . . . . . . 326,495 265,370Deferred income taxes . . . . . . . . . . . . . . . . . . . . . . . . . . . . . . . . . . . . . . . . . . . . . . . . . . . . . . . . . . 593,369 641,456Other liabilities . . . . . . . . . . . . . . . . . . . . . . . . . . . . . . . . . . . . . . . . . . . . . . . . . . . . . . . . . . . . . . . . 532,135 502,366
Total Other Liabilities . . . . . . . . . . . . . . . . . . . . . . . . . . . . . . . . . . . . . . . . . . . . . . . . . . . . . . . 5,231,358 5,406,630
Commitments and Contingencies (Note 20)Redeemable noncontrolling interests . . . . . . . . . . . . . . . . . . . . . . . . . . . . . . . . . . . . . . . . . . . . . . . 97,552 99,043Shareholders’ Equity:Common stock 12 1/2¢ par value; 500,000,000 shares authorized; 128,526,137 and128,526,137 shares issued as of December 31, 2020 and December 31, 2019, respectively;and 106,937,990 and 106,787,299 shares outstanding as of December 31, 2020 andDecember 31, 2019, respectively . . . . . . . . . . . . . . . . . . . . . . . . . . . . . . . . . . . . . . . . . . . . . . . . 16,066 16,066
Capital in excess of par value . . . . . . . . . . . . . . . . . . . . . . . . . . . . . . . . . . . . . . . . . . . . . . . . . . . . . 3,853,401 3,823,152Retained earnings . . . . . . . . . . . . . . . . . . . . . . . . . . . . . . . . . . . . . . . . . . . . . . . . . . . . . . . . . . . . . . 4,156,168 4,117,804Accumulated other comprehensive loss:
Cumulative translation adjustments . . . . . . . . . . . . . . . . . . . . . . . . . . . . . . . . . . . . . . . . . . . . (284,911) (373,043)Accumulated (losses) gains on derivatives qualifying as hedges . . . . . . . . . . . . . . . . . . . . . . (6,870) 2,068Pension and postretirement liability adjustment . . . . . . . . . . . . . . . . . . . . . . . . . . . . . . . . . . . (405,760) (345,919)
Treasury stock, at cost (21,588,147 and 21,738,838 shares as of December 31, 2020 andDecember 31, 2019, respectively) . . . . . . . . . . . . . . . . . . . . . . . . . . . . . . . . . . . . . . . . . . . . . . . (1,016,941) (1,022,824)
Total Shareholders’ Equity . . . . . . . . . . . . . . . . . . . . . . . . . . . . . . . . . . . . . . . . . . . . . . . . . . . 6,311,153 6,217,304
Noncontrolling interest . . . . . . . . . . . . . . . . . . . . . . . . . . . . . . . . . . . . . . . . . . . . . . . . . . . . . . . . . . 11,882 12,244
Total Shareholders’ Equity including Noncontrolling interest . . . . . . . . . . . . . . . . . . . . . . . . 6,323,035 6,229,548
Total Liabilities and Shareholders’ Equity . . . . . . . . . . . . . . . . . . . . . . . . . . . . . . . . . . . . . . . . . . . $13,555,671 $13,287,411
See Notes to Consolidated Financial Statements
70

INTERNATIONAL FLAVORS & FRAGRANCES INC.
CONSOLIDATED STATEMENT OF CASH FLOWSYear Ended December 31,
(DOLLARS IN THOUSANDS) 2020 2019 2018
Cash flows from operating activities:Net income . . . . . . . . . . . . . . . . . . . . . . . . . . . . . . . . . . . . . . . . . . . . . . . . . . . . . . . . . . . . . . . . . . . . . . . $ 367,372 $ 460,268 $ 339,781Adjustments to reconcile to net cash provided by operating activities:
Depreciation and amortization . . . . . . . . . . . . . . . . . . . . . . . . . . . . . . . . . . . . . . . . . . . . . . . . . . . . 325,360 323,330 173,792Deferred income taxes . . . . . . . . . . . . . . . . . . . . . . . . . . . . . . . . . . . . . . . . . . . . . . . . . . . . . . . . . . (67,718) (59,279) 19,402(Gains) losses on sale of assets . . . . . . . . . . . . . . . . . . . . . . . . . . . . . . . . . . . . . . . . . . . . . . . . . . . 3,784 2,367 (1,177)Stock-based compensation . . . . . . . . . . . . . . . . . . . . . . . . . . . . . . . . . . . . . . . . . . . . . . . . . . . . . . . 35,798 34,482 29,401Loss on extinguishment of debt . . . . . . . . . . . . . . . . . . . . . . . . . . . . . . . . . . . . . . . . . . . . . . . . . . . — — 38,810Gain on deal contingent derivatives . . . . . . . . . . . . . . . . . . . . . . . . . . . . . . . . . . . . . . . . . . . . . . . . — — (12,505)Pension contributions . . . . . . . . . . . . . . . . . . . . . . . . . . . . . . . . . . . . . . . . . . . . . . . . . . . . . . . . . . . (24,227) (23,714) (22,433)Changes in assets and liabilities, net of acquisitions: . . . . . . . . . . . . . . . . . . . . . . . . . . . . . . . . . .
Trade receivables . . . . . . . . . . . . . . . . . . . . . . . . . . . . . . . . . . . . . . . . . . . . . . . . . . . . . . . . . . (60,979) 59,555 (49,958)Inventories . . . . . . . . . . . . . . . . . . . . . . . . . . . . . . . . . . . . . . . . . . . . . . . . . . . . . . . . . . . . . . . 17,924 (62,129) (117,641)Accounts payable . . . . . . . . . . . . . . . . . . . . . . . . . . . . . . . . . . . . . . . . . . . . . . . . . . . . . . . . . . 27,923 55,464 55,136Accruals for incentive compensation . . . . . . . . . . . . . . . . . . . . . . . . . . . . . . . . . . . . . . . . . . . 44,151 (22,357) (2,289)Other current payables and accrued expenses . . . . . . . . . . . . . . . . . . . . . . . . . . . . . . . . . . . . 57,341 5,488 (5,279)Other assets . . . . . . . . . . . . . . . . . . . . . . . . . . . . . . . . . . . . . . . . . . . . . . . . . . . . . . . . . . . . . . 14,709 (66,650) (19,219)Other liabilities . . . . . . . . . . . . . . . . . . . . . . . . . . . . . . . . . . . . . . . . . . . . . . . . . . . . . . . . . . . . (27,340) (7,860) 11,754
Net cash provided by operating activities . . . . . . . . . . . . . . . . . . . . . . . . . . . . . . . . . . . . . . . . . . . . . . . 714,098 698,965 437,575
Cash flows from investing activities:Cash paid for acquisitions, net of cash received . . . . . . . . . . . . . . . . . . . . . . . . . . . . . . . . . . . . . . — (49,065) (4,857,343)Additions to property, plant and equipment . . . . . . . . . . . . . . . . . . . . . . . . . . . . . . . . . . . . . . . . . . (191,794) (235,978) (170,094)Additions to intangible assets . . . . . . . . . . . . . . . . . . . . . . . . . . . . . . . . . . . . . . . . . . . . . . . . . . . . — (6,070) (3,326)Proceeds from disposal of assets . . . . . . . . . . . . . . . . . . . . . . . . . . . . . . . . . . . . . . . . . . . . . . . . . . 17,189 42,112 8,176Proceeds from disposal of subsidiaries, net of cash held . . . . . . . . . . . . . . . . . . . . . . . . . . . . . . . . — — 10,157Proceeds from unwinding of cross currency swap derivative instruments . . . . . . . . . . . . . . . . . . — 25,900 —Contingent consideration paid . . . . . . . . . . . . . . . . . . . . . . . . . . . . . . . . . . . . . . . . . . . . . . . . . . . . — (4,655) —Maturity of net investment hedges . . . . . . . . . . . . . . . . . . . . . . . . . . . . . . . . . . . . . . . . . . . . . . . . . (14,597) — (2,642)Proceeds from life insurance contracts . . . . . . . . . . . . . . . . . . . . . . . . . . . . . . . . . . . . . . . . . . . . . 1,739 1,890 1,837
Net cash used in investing activities . . . . . . . . . . . . . . . . . . . . . . . . . . . . . . . . . . . . . . . . . . . . . . . . . . . (187,463) (225,866) (5,013,235)
Cash flows from financing activities:Cash dividends paid to shareholders . . . . . . . . . . . . . . . . . . . . . . . . . . . . . . . . . . . . . . . . . . . . . . . (322,584) (313,510) (230,218)Decrease in revolving credit facility and short term borrowing . . . . . . . . . . . . . . . . . . . . . . . . . . (429) (1,021) (927)Deferred financing costs . . . . . . . . . . . . . . . . . . . . . . . . . . . . . . . . . . . . . . . . . . . . . . . . . . . . . . . . (3,205) — (33,668)Repayments of debt . . . . . . . . . . . . . . . . . . . . . . . . . . . . . . . . . . . . . . . . . . . . . . . . . . . . . . . . . . . . (347,001) (155,261) (376,625)Purchases of redeemable noncontrolling interest . . . . . . . . . . . . . . . . . . . . . . . . . . . . . . . . . . . . . . (21,566) — —Proceeds from issuance of long-term debt . . . . . . . . . . . . . . . . . . . . . . . . . . . . . . . . . . . . . . . . . . . 200,000 — 3,256,742Proceeds from sales of equity securities, net of issuance costs . . . . . . . . . . . . . . . . . . . . . . . . . . . — — 2,268,094Contingent consideration paid . . . . . . . . . . . . . . . . . . . . . . . . . . . . . . . . . . . . . . . . . . . . . . . . . . . . (8,684) (24,478) —Gain on pre-issuance hedges . . . . . . . . . . . . . . . . . . . . . . . . . . . . . . . . . . . . . . . . . . . . . . . . . . . . . — — 12,505Employee withholding taxes paid . . . . . . . . . . . . . . . . . . . . . . . . . . . . . . . . . . . . . . . . . . . . . . . . . (8,101) (10,787) (9,725)Purchase of treasury stock . . . . . . . . . . . . . . . . . . . . . . . . . . . . . . . . . . . . . . . . . . . . . . . . . . . . . . . — — (15,475)
Net cash (used in) provided by financing activities . . . . . . . . . . . . . . . . . . . . . . . . . . . . . . . . . . . . . . . . (511,570) (505,057) 4,870,703
Effect of exchange rate changes on cash, cash equivalents and restricted cash . . . . . . . . . . . . . . . . . . 20,862 7,381 (14,567)
Net change in cash, cash equivalents and restricted cash . . . . . . . . . . . . . . . . . . . . . . . . . . . . . . . . 35,927 (24,577) 280,476Cash, cash equivalents and restricted cash at beginning of year . . . . . . . . . . . . . . . . . . . . . . . . . . . . . . 623,945 648,522 368,046
Cash, cash equivalents and restricted cash at end of year . . . . . . . . . . . . . . . . . . . . . . . . . . . . . . . . $ 659,872 $ 623,945 $ 648,522
Supplemental Disclosures:Interest paid, net of amounts capitalized . . . . . . . . . . . . . . . . . . . . . . . . . . . . . . . . . . . . . . . . . . . . . . . . $ 127,553 $ 133,739 $ 117,581Income taxes paid . . . . . . . . . . . . . . . . . . . . . . . . . . . . . . . . . . . . . . . . . . . . . . . . . . . . . . . . . . . . . . . . . 132,789 126,172 116,138Accrued capital expenditures . . . . . . . . . . . . . . . . . . . . . . . . . . . . . . . . . . . . . . . . . . . . . . . . . . . . . . . . . $ 40,608 $ 39,466 $ 33,844
See Notes to Consolidated Financial Statements
71
INTERNATIONAL FLAVORS & FRAGRANCES INC.
CONSOLIDATED STATEMENT OF SHAREHOLDERS’ EQUITY
(DOLLARS IN THOUSANDS)Commonstock
Capital inexcess ofpar value
Retainedearnings
Accumulatedother
comprehensive(loss) income
Treasury stockNon-controlling
interest TotalShares Cost
Balance at December 31, 2017 . . . . . . . $14,470 $ 162,827 $3,870,621 $(637,482) (36,910,809) $(1,726,234) $ 5,092 $1,689,294
Net income . . . . . . . . . . . . . . . . . . . . . . 337,302 2,404 339,706Adoption of ASU 2014-09 . . . . . . . . . . 2,068 2,068Cumulative translation adjustment . . . . (99,580) (99,580)Gains on derivatives qualifying ashedges; net of tax $2,011 . . . . . . . . . 15,078 15,078
Pension liability and postretirementadjustment; net of tax ($5,052) . . . . . 19,757 19,757
Cash dividends declared ($2.84 pershare) . . . . . . . . . . . . . . . . . . . . . . . . . (253,577) (253,577)
Stock options/SSARs . . . . . . . . . . . . . . 2,152 46,474 2,188 4,340Impact of Frutarom acquisition . . . . . . 1,346,229 14,901,445 701,111 3,700 2,051,040Vested restricted stock units andawards . . . . . . . . . . . . . . . . . . . . . . . . (10,650) 164,064 7,692 (2,958)
Stock-based compensation . . . . . . . . . . 29,401 29,401Treasury share repurchases . . . . . . . . . . (108,109) (15,475) (15,475)Tangible equity units . . . . . . . . . . . . . . 1,596 2,266,498 2,268,094Redeemable NCI . . . . . . . . . . . . . . . . . . (2,848) (2,848)Dividends on noncontrolling interestand other . . . . . . . . . . . . . . . . . . . . . . (193) (773) (966)
Balance at December 31, 2018 . . . . . . . $16,066 $3,793,609 $3,956,221 $(702,227) (21,906,935) $(1,030,718) $10,423 $6,043,374Net income . . . . . . . . . . . . . . . . . . . . . . 455,873 3,729 459,602Adoption of ASU 2016-02 . . . . . . . . . . 23,094 23,094Adoption of ASU 2017-12 . . . . . . . . . . (981) 981 —Cumulative translation adjustment . . . . 22,972 22,972Losses on derivatives qualifying ashedges; net of tax ($505) . . . . . . . . . (2,678) (2,678)
Pension liability and postretirementadjustment; net of tax ($7,559) . . . . . (35,942) (35,942)
Cash dividends declared ($2.96 pershare) . . . . . . . . . . . . . . . . . . . . . . . . . (315,770) (315,770)
Stock options/SSARs . . . . . . . . . . . . . . 6,966 14,346 677 7,643Vested restricted stock units andawards . . . . . . . . . . . . . . . . . . . . . . . . (9,808) 153,751 7,217 (2,591)
Stock-based compensation . . . . . . . . . . 34,482 34,482Redeemable NCI . . . . . . . . . . . . . . . . . . (2,097) (2,097)Dividends on noncontrolling interestand other . . . . . . . . . . . . . . . . . . . . . . (633) (1,908) (2,541)
Balance at December 31, 2019 . . . . . . . $16,066 $3,823,152 $4,117,804 $(716,894) (21,738,838) $(1,022,824) $12,244 $6,229,548Net income . . . . . . . . . . . . . . . . . . . . . . 363,228 1,330 364,558Cumulative translation adjustment . . . . 88,132 88,132Losses on derivatives qualifying ashedges; net of tax $1,400 . . . . . . . . . (8,938) (8,938)
Pension liability and postretirementadjustment; net of tax ($9,185) . . . . . (59,841) (59,841)
Cash dividends declared ($3.04 pershare) . . . . . . . . . . . . . . . . . . . . . . . . . (324,861) (324,861)
Stock options/SSARs . . . . . . . . . . . . . . 759 57,652 2,743 3,502Vested restricted stock units andawards . . . . . . . . . . . . . . . . . . . . . . . . (8,111) 93,039 3,140 (4,971)
Stock-based compensation . . . . . . . . . . 35,798 35,798Redeemable NCI . . . . . . . . . . . . . . . . . . 1,803 1,803Dividends on noncontrolling interestand other . . . . . . . . . . . . . . . . . . . . . . (3) (1,692) (1,695)
Balance at December 31, 2020 . . . . . . . $16,066 $3,853,401 $4,156,168 $(697,541) (21,588,147) $(1,016,941) $11,882 $6,323,035
See Notes to Consolidated Financial Statements
72

INTERNATIONAL FLAVORS & FRAGRANCES INC.NOTES TO CONSOLIDATED FINANCIAL STATEMENTS
NOTE 1. NATURE OF OPERATIONS AND SUMMARY OF SIGNIFICANT ACCOUNTINGPOLICIES
Nature of Operations International Flavors & Fragrances Inc. and its subsidiaries (the “Registrant,”“IFF,” “the Company,” “we,” “us” and “our”) is a leading creator and manufacturer of taste, scent andcomplementary adjacent products, including cosmetic active and natural health ingredients, which are used in awide variety of consumer products. Our products are sold principally to manufacturers of perfumes andcosmetics, hair and other personal care products, soaps and detergents, cleaning products, dairy, meat and otherprocessed foods, beverages, snacks and savory foods, sweet and baked goods, dietary supplements, infant andelderly nutrition, functional food, and pharmaceutical and oral care products.
Fiscal Year End The Company has historically operated on a 52/53 week fiscal year generally ending onthe Friday closest to the last day of the year. For ease of presentation, December 31 is used consistentlythroughout the financial statements and notes to represent the period-end date. The 2020 fiscal year was a 52week period, the 2019 fiscal year was a 53 week period and the 2018 fiscal year was a 52 week period. For the2020, 2019 and 2018 fiscal years, the actual closing dates were January 1, January 3, and December 28,respectively.
Use of Estimates The preparation of financial statements in conformity with accounting principlesgenerally accepted in the United States requires management to make estimates and assumptions that affect thereported amounts and accompanying disclosures. These estimates are based on management’s best knowledge ofcurrent events and actions the Company may undertake in the future. Actual results may ultimately differ fromestimates.
Principles of Consolidation The consolidated financial statements include the accounts of InternationalFlavors & Fragrances Inc. and those of its subsidiaries. Significant intercompany balances and transactions havebeen eliminated. To the extent a subsidiary is not wholly owned, any related noncontrolling interests are includedas a separate component of Shareholders’ Equity.
Revenue Recognition Revenue from contracts with customers is recognized when the contract orpurchase order has received approval and commitment from both parties, has the rights of the parties andpayment terms (which can vary by customer) identified, has commercial substance, and collectability ofconsideration is probable.
For the Company’s Flavors and Fragrances Compounds products, revenue is recognized for the majority ofcontracts when the Company satisfies its performance obligation by transferring control of the goods to thecustomer. Revenue is recognized over time for a small number of contracts, and the amount of revenuerecognized is based on the extent of progress towards completion of the promised goods, using the outputmethod. With respect to a small number of contracts for the sale of compounds, the Company has an“enforceable right to payment for performance to date” and as the products do not have an alternative use, theCompany recognizes revenue for these contracts over time and records a contract asset using the output method.
For the Company’s Flavors and Fragrances Ingredients products, revenue is recognized for the majority ofcontracts when the Company satisfies its performance obligation by transferring control of the goods to thecustomer.
Sales are reduced, at the time revenue is recognized, for applicable discounts, rebates and sales allowancesbased on historical experience. Related accruals are included in Other current liabilities in the accompanyingConsolidated Balance Sheet. The Company considers shipping and handling activities undertaken after the
73
customer has obtained control of the related goods as a fulfillment activity. Net sales include shipping andhandling charges billed to customers. Cost of goods sold includes all costs incurred in connection with shippingand handling. See Note 11 for a further discussion on revenue recognition. See Note 11 for a further discussionon contract assets.
Foreign Currency Translation The Company translates the assets and liabilities of non-U.S. subsidiariesinto U.S. dollars at year-end exchange rates. Income and expense items are translated at average exchange ratesduring the year. Cumulative translation adjustments are shown as a separate component of Shareholders’ Equity.
Research and Development Research and development (“R&D”) expenses relate to the development ofnew and improved tastes or scents, technical product support and compliance with governmental regulation. Allresearch and development costs are expensed as incurred.
Cash and Cash Equivalents Cash and cash equivalents include highly liquid investments with maturitiesof three months or less at date of purchase.
Restricted Cash Restricted cash is comprised of cash or cash equivalents which has been placed into anaccount that is restricted for a specific use and from which the Company cannot withdraw the cash on demand.
The following table provides a reconciliation of cash, cash equivalents and restricted cash reported in theCompany’s statement of cash flows periods ended December 31, 2020 and December 31, 2019 to the amountsreported in the Company’s balance sheet as at December 31, 2020, December 31, 2019 and December 31, 2018.
(DOLLARS IN THOUSANDS) December 31, 2020 December 31, 2019 December 31, 2018
Current assets . . . . . . . . . . . . . . . . . . . . . . . . . . . . . . . . . . .Cash and cash equivalents . . . . . . . . . . . . . . . . . . . . . $649,541 $606,823 $634,897Restricted cash . . . . . . . . . . . . . . . . . . . . . . . . . . . . . . 7,295 17,122 13,625
Noncurrent assets . . . . . . . . . . . . . . . . . . . . . . . . . . . . . . . .Restricted cash included in Other assets . . . . . . . . . . 3,036 — —
Cash, cash equivalents and restricted cash . . . . . . . . . . . . $659,872 $623,945 $648,522
Accounts Receivable During 2019, the Company entered into certain factoring agreements in the U.S.and The Netherlands under which it can factor up to approximately $100 million of its trade receivables. Thefactoring agreements supplement the Company’s existing factoring programs that are sponsored by certaincustomers. Under all of the arrangements, the Company sells the trade receivables on a non-recourse basis tounrelated financial institutions and accounts for the transactions as sales of receivables. The applicablereceivables are removed from the Company’s Consolidated Balance Sheet when the cash proceeds are receivedby the Company. As of December 31, 2020, 2019 and 2018, the Company had sold receivables pursuant to thesefactoring programs of approximately $248.8 million, $205.7 million and $168.3 million, respectively.Participation in the various programs increased cash provided by operations by approximately $43.1 million,$37.7 million and $13.6 million in 2020, 2019 and 2018, respectively. The cost of participating in these programswas approximately $4.4 million, $7.1 million, and $3.4 million in 2020, 2019, and 2018, respectively and isincluded as a component of interest expense.
74

Inventories Inventories are stated at the lower of cost (on a weighted-average basis) or net realizablevalue. The Company’s inventories consisted of the following:
December 31,
(DOLLARS IN THOUSANDS) 2020 2019
Raw materials . . . . . . . . . . . . . . . . . . . . . . . . . . . . . . . . . . . . . . . . . . . . . . . . . . . . . . . . . $ 565,521 $ 565,071Work in process . . . . . . . . . . . . . . . . . . . . . . . . . . . . . . . . . . . . . . . . . . . . . . . . . . . . . . . . 38,496 44,532Finished goods . . . . . . . . . . . . . . . . . . . . . . . . . . . . . . . . . . . . . . . . . . . . . . . . . . . . . . . . . 527,839 513,465
Total . . . . . . . . . . . . . . . . . . . . . . . . . . . . . . . . . . . . . . . . . . . . . . . . . . . . . . . . . . . . $1,131,856 $1,123,068
Leases During the year ended December 31, 2019, the Company adopted ASU No. 2016-02, “Leases(Topic 842),” which requires most leases to be recognized on the balance sheet. The Company adopted thestandard using the modified retrospective approach with an effective date of December 29, 2018, the beginningof its 2019 fiscal year. Prior year financial statements were not recast. The Company elected various transitionprovisions available for expired or existing contracts, which allows the Company to carryforward historicalassessments of (1) whether contracts are or contain leases, (2) lease classification and (3) initial direct costs.
The Company determines if an arrangement is a lease at contract inception. A lease exists when a contractconveys to the customer the right to control the use of identified property, plant, or equipment for a period oftime in exchange for consideration. The definition of a lease embodies two conditions: (1) there is an identifiedasset in the contract that is land or a depreciable asset (i.e., property, plant, and equipment), and (2) the customerhas the right to control the use of the identified asset.
When the Company determines the arrangement is a lease, or contains a lease, at inception, it thendetermines whether the lease is an operating lease or a finance lease at the commencement date.
The Company leases property and equipment, principally under operating leases. In accordance with ASU2016-02, the Company records a right of use asset and related obligation at the present value of lease paymentsand, over the term of the lease, depreciates the right of use asset and accretes the obligation to future value. Someof the leases include rental escalation clauses, renewal options and/or termination options that are factored intothe determination of lease payments when appropriate. The Company has elected not to separate non-leasecomponents from lease components for all classes of leased assets.
When available, the Company uses the rate implicit in the lease to discount lease payments to present value,however, most of the Company’s leases do not provide a readily determinable implicit rate and the Companycalculates the applicable incremental borrowing rate to discount the lease payments based on the term of thelease at lease commencement. The incremental borrowing rate is determined based on the Company’s creditrating, currency and lease terms.
Upon adoption of the new guidance, the Company recorded a right-of-use asset of $308.3 million and totaloperating lease liabilities of $313.3 million. Additionally, the Company recorded a net increase to retainedearnings of approximately $23.1 million related to the recognition of deferred gains on certain sale-leasebacktransactions that occurred in prior years.
Long-Lived Assets
Property, Plant and Equipment Property, plant and equipment are recorded at cost. Depreciation iscalculated on a straight-line basis, principally over the following estimated useful lives: buildings andimprovements, 10 to 40 years; machinery and equipment, 3 to 20 years; information technology hardware andsoftware, 3 to 7 years; and leasehold improvements which are included in buildings and improvements, theestimated life of the improvements or the remaining term of the lease, whichever is shorter.
75
Finite-Lived Intangible Assets Finite-lived intangible assets include customer relationships, patents, tradenames, technological know-how and other intellectual property valued at acquisition and amortized on a straight-line basis over the following estimated useful lives: customer relationships, 11 - 23 years; patents, 11 - 15 years;trade names, 14 - 28 years; and technological know-how, 5 - 28 years.
The Company reviews long-lived assets for impairment when events or changes in business conditionsindicate that their carrying value may not be recovered. An estimate of undiscounted future cash flows producedby an asset or group of assets is compared to the carrying value to determine whether impairment exists. If assetsare determined to be impaired, the loss is measured based on an estimate of fair value using various valuationtechniques, including a discounted estimate of future cash flows.
Goodwill Goodwill represents the difference between the total purchase price and the fair value ofidentifiable assets and liabilities acquired in business acquisitions.
The Company tests goodwill for impairment at the reporting unit level as of November 30 every year ormore frequently if events or changes in circumstances indicate the asset might be impaired. A reporting unit is anoperating segment or one level below an operating segment (referred to as a component) to which goodwill isassigned when initially recorded.
The Company identifies their reporting units by assessing whether the components of their reportingsegments constitute businesses for which discrete financial information is available and management of eachreporting unit regularly reviews the operating results of those components. The Company has identified eightreporting units under the Taste and Scent Segments: (1) Flavor Compounds (which includes the Taste reportingunit that was previously included in the former Frutarom segment, as well as Legacy IFF Flavor Compounds), (2)Fragrance Compounds, (3) Fragrance Ingredients, (4) Cosmetic Active Ingredients, (5) Savory, (6) NaturalProduct Solutions, (7) Fine and Specialty Ingredients (“FSI”) and (8) Inclusions. These reporting units weredetermined based on the level at which the performance is measured and reviewed by segment management.
When testing goodwill for impairment, the Company has the option of first performing a qualitativeassessment to determine whether it is more likely than not that the fair value of a reporting unit is less than thecarrying amount. If the Company elects to bypass the qualitative assessment for any reporting units, or if aqualitative assessment indicates it is more likely than not that the estimated carrying value of a reporting unitexceeds its fair value, the Company performs a quantitative goodwill impairment test.
Under the quantitative goodwill impairment test, if a reporting unit’s carrying amount exceeds its fair value,the Company will record an impairment charge based on that difference, and the impairment charge will belimited to the amount of goodwill allocated to that reporting unit.
Income Taxes The Company accounts for taxes under the asset and liability method. Under this method,deferred income taxes are recognized for temporary differences between the financial statement and tax returnbases of assets and liabilities, based on enacted tax rates and other provisions of the tax law. The effect of achange in tax laws or rates on deferred tax assets and liabilities is recognized as income in the period in whichsuch change is enacted. Future tax benefits are recognized to the extent that the realization of such benefits ismore likely than not, and a valuation allowance is established for any portion of a deferred tax asset thatmanagement believes may not be realized.
The Company recognizes uncertain tax positions that it has taken or expects to take on a tax return. Pursuantto accounting requirements, the Company first determines whether it is “more likely than not” its tax positionwill be sustained if the relevant tax authority were to audit the position with full knowledge of all the relevantfacts and other information. For those tax positions that meet this threshold, the Company measures the amountof tax benefit based on the largest amount of tax benefit that it has a greater than 50% chance of realizing in afinal settlement with the relevant authority. Those tax positions failing to qualify for initial recognition are
76

recognized in the first interim period in which they meet the more likely than not standard. The Companymaintains a cumulative risk portfolio relating to all of its uncertainties in income taxes in order to perform thisanalysis, but the evaluation of its tax positions requires significant judgment and estimation in part because, incertain cases, tax law is subject to varied interpretation, and whether a tax position will ultimately be sustainedmay be uncertain.
Interest and penalties related to unrecognized tax benefits are recognized as a component of income taxexpense.
Retirement Benefits Current service costs of retirement plans and postretirement health care and lifeinsurance benefits are accrued. Prior service costs resulting from plan improvements are amortized over periodsranging from 10 to 20 years.
Financial Instruments Derivative financial instruments are used to manage interest and foreign currencyexposures. The gain or loss on the hedging instrument is recorded in earnings at the same time as the transactionbeing hedged is recorded in earnings. The associated asset or liability related to the open hedge instrument isrecorded in Prepaid expenses and Other current assets or Other current liabilities, as applicable.
The Company records all derivative financial instruments on the balance sheet at fair value. Changes in aderivative’s fair value are recognized in earnings unless specific hedge criteria are met. If the derivative isdesignated as a fair value hedge, the changes in the fair value of the derivative and of the hedged itemattributable to the hedged risk are recognized in Net income. If the derivative is designated as a cash flow hedge,the effective portions of changes in the fair value of the derivative are recorded in Accumulated othercomprehensive income (“AOCI”) in the accompanying Consolidated Balance Sheet and are subsequentlyrecognized in Net income when the hedged item affects earnings. Ineffective portions of changes in the fair valueof cash flow hedges, if any, are recognized as a charge or credit to earnings.
Software Costs The Company capitalizes direct internal and external development costs for certainsignificant projects associated with internal-use software and amortizes these costs over 7 years. Neitherpreliminary evaluation costs nor costs associated with the software after implementation are capitalized. Costsrelated to projects that are not significant are expensed as incurred.
Net Income Per Share Under the two-class method, earnings are adjusted by accretion of amounts toredeemable noncontrolling interests recorded at redemption value. The adjustments represent in-substancedividend distributions to the noncontrolling interest holders as the holders have a contractual right to receive aspecified amount upon redemption. As a result, earnings are adjusted to reflect this in-substance distribution thatis different from other common shareholders. In addition, the Company has unvested share based paymentawards with a right to receive nonforfeitable dividends and thus are considered participating securities which arerequired to be included in the computation of basic and diluted earnings per share.
Basic earnings (loss) per share represents the amount of earnings for the period available to each share ofcommon stock outstanding during the period. Basic earnings (loss) per share includes the effect of issuing sharesof common stock assuming (i) the prepaid stock purchase contracts (“SPC”) are converted into the minimumnumber of shares of common stock under the if-converted method, and (ii) an adjustment to earnings (loss) toreflect adjustments made to record the redeemable value of redeemable noncontrolling interests. Diluted earnings(loss) per share also includes the effect of issuing shares of common stock, assuming (i) stock options andwarrants are exercised, (ii) restricted stock units are fully vested under the treasury stock method, and (iii) theincremental effect of the prepaid SPC converted into the maximum number of shares of common stock under theif-converted method.
Stock-Based Compensation Compensation cost of all stock-based awards is measured at fair value on thedate of grant and recognized over the service period for which awards are expected to vest. The cost of such
77
stock-based awards is principally recognized on a straight-line attribution basis over their respective vestingperiods, net of estimated forfeitures.
Financing Costs Costs incurred in the issuance of debt are deferred and amortized as part of interestexpense over the stated life of the applicable debt instrument. Unamortized deferred financing costs relating todebt are presented as a reduction in the amount of debt outstanding on the Consolidated Balance Sheet.Unamortized deferred financing costs relating to the revolving credit facility are recorded in Other assets on theConsolidated Balance Sheet.
Redeemable Noncontrolling Interests Noncontrolling interests in subsidiaries that are redeemable forcash or other assets outside of the Company’s control are classified as mezzanine equity, outside of equity andliabilities, at the greater of the carrying value or the redemption value. The increases or decreases in the estimatedredemption amount are recorded with corresponding adjustments against Capital in excess of par value and arereflected in the computation of earnings per share using the two-class method.
Recent Accounting Pronouncements
In October 2020, the FASB issued Accounting Standards Updates (“ASU”) 2020-09, “Debt (Topic 470):Amendments to SEC Paragraphs Pursuant to SEC Release No. 33-10762” and 2020-10, “CodificationImprovements.” ASU 2020-09 is intended to amend and supersede various SEC paragraphs pursuant to theissuance of SEC Release No. 33-10762 and is effective on January 4, 2021. ASU 2020-10 is intended to improvethe consistency of the FASB Accounting Standards Codification (“Codification”) and clarify guidance byincluding all disclosure guidance in the appropriate Disclosure Section of the Codification to help reduce thelikelihood that disclosure requirements would be missed. ASU 2020-10 is effective for fiscal years beginningafter December 15, 2020, and early adoption is permitted for any annual or interim period within those fiscalyears. The Company has determined that both guidance will not have an impact on its Consolidated FinancialStatements and will have a minimal impact on its disclosures.
In March 2020, the FASB issued Accounting Standards Update (“ASU”) 2020-04, “Reference Rate Reform(Topic 848): Facilitation of the Effects of Reference Rate Reform on Financial Reporting.” The ASU is intendedto simplify various aspects related to the cessation of reference rates in certain financial markets that wouldotherwise create modification accounting or changes in estimate. This guidance is effective for the period fromMarch 12, 2020 to December 31, 2022. The Company has not adopted any of the optional expedients orexceptions through December 31, 2020 but will continue to evaluate the possible adoption of any such expedientsor exceptions during the effective period as circumstances evolve.
In December 2019, the FASB issued Accounting Standards Update (“ASU”) 2019-12, “Income Taxes(Topic 740): Simplifying the Accounting for Income Taxes.” The ASU is intended to simplify various aspectsrelated to accounting for income taxes. This guidance is effective for fiscal years beginning after December 15,2020, and for interim periods within those fiscal years, with early adoption permitted. The Company is currentlyevaluating the impact of this guidance, but does not expect this guidance to have a material impact on itsConsolidated Financial Statements.
In August 2018, the FASB issued ASU 2018-15, “Intangibles - Goodwill and Other - Internal - UseSoftware (Subtopic 350-40): Customer’s Accounting for Implementation Costs Incurred in a Cloud ComputingArrangement That Is a Service Contract (a consensus of the FASB Emerging Issues Task Force).” TheASU aligns the requirements for capitalizing implementation costs incurred in a hosting arrangement that is aservice contract with the requirements for capitalizing implementation costs incurred to develop or obtaininternal-use software (and hosting arrangements that include an internal-use software license). This guidance waseffective for fiscal years beginning after December 15, 2019, and for interim periods within those fiscal years,with early adoption permitted. The Company adopted the guidance effective the first day of its 2020 fiscal year.The adoption did not have an impact on its consolidated financial statements but may impact the Company in thefuture as and when it enters into cloud computing arrangements.
78
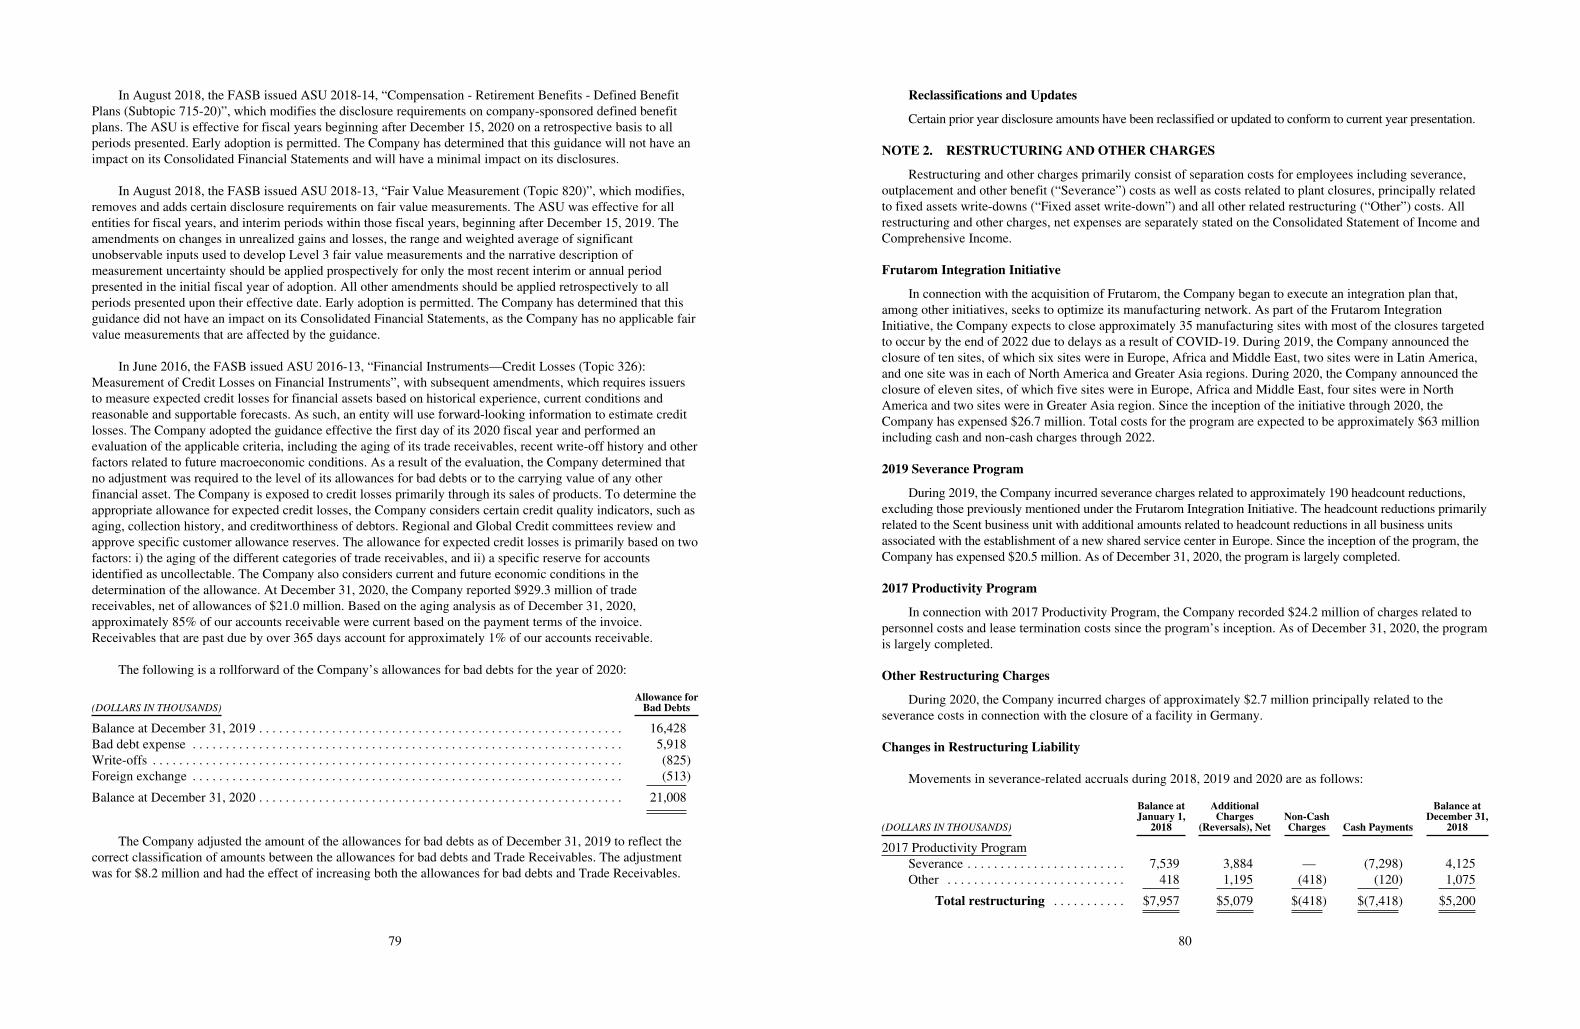
In August 2018, the FASB issued ASU 2018-14, “Compensation - Retirement Benefits - Defined BenefitPlans (Subtopic 715-20)”, which modifies the disclosure requirements on company-sponsored defined benefitplans. The ASU is effective for fiscal years beginning after December 15, 2020 on a retrospective basis to allperiods presented. Early adoption is permitted. The Company has determined that this guidance will not have animpact on its Consolidated Financial Statements and will have a minimal impact on its disclosures.
In August 2018, the FASB issued ASU 2018-13, “Fair Value Measurement (Topic 820)”, which modifies,removes and adds certain disclosure requirements on fair value measurements. The ASU was effective for allentities for fiscal years, and interim periods within those fiscal years, beginning after December 15, 2019. Theamendments on changes in unrealized gains and losses, the range and weighted average of significantunobservable inputs used to develop Level 3 fair value measurements and the narrative description ofmeasurement uncertainty should be applied prospectively for only the most recent interim or annual periodpresented in the initial fiscal year of adoption. All other amendments should be applied retrospectively to allperiods presented upon their effective date. Early adoption is permitted. The Company has determined that thisguidance did not have an impact on its Consolidated Financial Statements, as the Company has no applicable fairvalue measurements that are affected by the guidance.
In June 2016, the FASB issued ASU 2016-13, “Financial Instruments—Credit Losses (Topic 326):Measurement of Credit Losses on Financial Instruments”, with subsequent amendments, which requires issuersto measure expected credit losses for financial assets based on historical experience, current conditions andreasonable and supportable forecasts. As such, an entity will use forward-looking information to estimate creditlosses. The Company adopted the guidance effective the first day of its 2020 fiscal year and performed anevaluation of the applicable criteria, including the aging of its trade receivables, recent write-off history and otherfactors related to future macroeconomic conditions. As a result of the evaluation, the Company determined thatno adjustment was required to the level of its allowances for bad debts or to the carrying value of any otherfinancial asset. The Company is exposed to credit losses primarily through its sales of products. To determine theappropriate allowance for expected credit losses, the Company considers certain credit quality indicators, such asaging, collection history, and creditworthiness of debtors. Regional and Global Credit committees review andapprove specific customer allowance reserves. The allowance for expected credit losses is primarily based on twofactors: i) the aging of the different categories of trade receivables, and ii) a specific reserve for accountsidentified as uncollectable. The Company also considers current and future economic conditions in thedetermination of the allowance. At December 31, 2020, the Company reported $929.3 million of tradereceivables, net of allowances of $21.0 million. Based on the aging analysis as of December 31, 2020,approximately 85% of our accounts receivable were current based on the payment terms of the invoice.Receivables that are past due by over 365 days account for approximately 1% of our accounts receivable.
The following is a rollforward of the Company’s allowances for bad debts for the year of 2020:
(DOLLARS IN THOUSANDS)Allowance forBad Debts
Balance at December 31, 2019 . . . . . . . . . . . . . . . . . . . . . . . . . . . . . . . . . . . . . . . . . . . . . . . . . . . . . . . 16,428Bad debt expense . . . . . . . . . . . . . . . . . . . . . . . . . . . . . . . . . . . . . . . . . . . . . . . . . . . . . . . . . . . . . . . . . 5,918Write-offs . . . . . . . . . . . . . . . . . . . . . . . . . . . . . . . . . . . . . . . . . . . . . . . . . . . . . . . . . . . . . . . . . . . . . . . (825)Foreign exchange . . . . . . . . . . . . . . . . . . . . . . . . . . . . . . . . . . . . . . . . . . . . . . . . . . . . . . . . . . . . . . . . . (513)
Balance at December 31, 2020 . . . . . . . . . . . . . . . . . . . . . . . . . . . . . . . . . . . . . . . . . . . . . . . . . . . . . . . 21,008
The Company adjusted the amount of the allowances for bad debts as of December 31, 2019 to reflect thecorrect classification of amounts between the allowances for bad debts and Trade Receivables. The adjustmentwas for $8.2 million and had the effect of increasing both the allowances for bad debts and Trade Receivables.
79
Reclassifications and Updates
Certain prior year disclosure amounts have been reclassified or updated to conform to current year presentation.
NOTE 2. RESTRUCTURING AND OTHER CHARGES
Restructuring and other charges primarily consist of separation costs for employees including severance,outplacement and other benefit (“Severance”) costs as well as costs related to plant closures, principally relatedto fixed assets write-downs (“Fixed asset write-down”) and all other related restructuring (“Other”) costs. Allrestructuring and other charges, net expenses are separately stated on the Consolidated Statement of Income andComprehensive Income.
Frutarom Integration Initiative
In connection with the acquisition of Frutarom, the Company began to execute an integration plan that,among other initiatives, seeks to optimize its manufacturing network. As part of the Frutarom IntegrationInitiative, the Company expects to close approximately 35 manufacturing sites with most of the closures targetedto occur by the end of 2022 due to delays as a result of COVID-19. During 2019, the Company announced theclosure of ten sites, of which six sites were in Europe, Africa and Middle East, two sites were in Latin America,and one site was in each of North America and Greater Asia regions. During 2020, the Company announced theclosure of eleven sites, of which five sites were in Europe, Africa and Middle East, four sites were in NorthAmerica and two sites were in Greater Asia region. Since the inception of the initiative through 2020, theCompany has expensed $26.7 million. Total costs for the program are expected to be approximately $63 millionincluding cash and non-cash charges through 2022.
2019 Severance Program
During 2019, the Company incurred severance charges related to approximately 190 headcount reductions,excluding those previously mentioned under the Frutarom Integration Initiative. The headcount reductions primarilyrelated to the Scent business unit with additional amounts related to headcount reductions in all business unitsassociated with the establishment of a new shared service center in Europe. Since the inception of the program, theCompany has expensed $20.5 million. As of December 31, 2020, the program is largely completed.
2017 Productivity Program
In connection with 2017 Productivity Program, the Company recorded $24.2 million of charges related topersonnel costs and lease termination costs since the program’s inception. As of December 31, 2020, the programis largely completed.
Other Restructuring Charges
During 2020, the Company incurred charges of approximately $2.7 million principally related to theseverance costs in connection with the closure of a facility in Germany.
Changes in Restructuring Liability
Movements in severance-related accruals during 2018, 2019 and 2020 are as follows:
(DOLLARS IN THOUSANDS)
Balance atJanuary 1,
2018
AdditionalCharges
(Reversals), NetNon-CashCharges Cash Payments
Balance atDecember 31,
2018
2017 Productivity ProgramSeverance . . . . . . . . . . . . . . . . . . . . . . . . 7,539 3,884 — (7,298) 4,125Other . . . . . . . . . . . . . . . . . . . . . . . . . . . 418 1,195 (418) (120) 1,075
Total restructuring . . . . . . . . . . . $7,957 $5,079 $(418) $(7,418) $5,200
80

(DOLLARS IN THOUSANDS)
Balance atJanuary 1,
2019Additional
Charges, NetNon-CashCharges Cash Payments
Balance atDecember 31,
2019
2017 Productivity ProgramSeverance . . . . . . . . . . . . . . . . . . . . . . . $4,125 $(1,947) $— $ (1,072) $ 1,106Other . . . . . . . . . . . . . . . . . . . . . . . . . . . 1,075 — — (987) 88
Frutarom Integration InitiativeSeverance . . . . . . . . . . . . . . . . . . . . . . . — 6,110 — (2,072) 4,038Fixed asset write down . . . . . . . . . . . . . — 534 (534) — —Other . . . . . . . . . . . . . . . . . . . . . . . . . . . — 3,726 (145) (1,096) 2,485
2019 Severance ProgramSeverance . . . . . . . . . . . . . . . . . . . . . . . — 20,871 — (7,974) 12,897Other . . . . . . . . . . . . . . . . . . . . . . . . . . . — 471 — — 471
Total restructuring . . . . . . . . . . . $ 5,200 $29,765 $(679) $(13,201) $21,085
(DOLLARS IN THOUSANDS)
Balance atJanuary 1,
2020
AdditionalCharges
(Reversals), NetNon-CashCharges Cash Payments
Balance atDecember 31,
2020
2017 Productivity ProgramSeverance . . . . . . . . . . . . . . . . . . . . . . . $ 1,106 $ (917) $ — $ (189) $ —Other . . . . . . . . . . . . . . . . . . . . . . . . . . . 88 — — (88) —
Frutarom Integration InitiativeSeverance . . . . . . . . . . . . . . . . . . . . . . . 4,038 2,476 — (3,477) 3,037Fixed asset write down . . . . . . . . . . . . . — 11,356 (11,356) — —Other . . . . . . . . . . . . . . . . . . . . . . . . . . . 2,485 2,488 (100) (1,956) 2,917
2019 Severance ProgramSeverance . . . . . . . . . . . . . . . . . . . . . . . 12,897 (793) — (6,057) 6,047Other . . . . . . . . . . . . . . . . . . . . . . . . . . . 471 — — — 471
Other Restructuring ChargesSeverance . . . . . . . . . . . . . . . . . . . . . . . — 2,685 — (270) 2,415
Total restructuring . . . . . . . . . . . $21,085 $17,295 $(11,456) $(12,037) $14,887
Other includes supplier contract termination costs, consulting and advisory fees.
Charges by Segment
The following table summarizes the total amount of costs incurred in connection with these restructuringprograms by segment:
December 31,
(DOLLARS IN THOUSANDS) 2020 2019 2018
Taste . . . . . . . . . . . . . . . . . . . . . . . . . . . . . . . . . . . . . . . . . . . . . . . . . . . . . . . . . . . . $ 16,878 $10,045 $ 1,646Scent . . . . . . . . . . . . . . . . . . . . . . . . . . . . . . . . . . . . . . . . . . . . . . . . . . . . . . . . . . . . 2,791 12,093 3,433Shared IT & Corporate Costs(1) . . . . . . . . . . . . . . . . . . . . . . . . . . . . . . . . . . . . . . . (2,374) 7,627 —
Total Restructuring and other charges, net . . . . . . . . . . . . . . . . . . . . . . . . . . . . . . . $17,295 $29,765 $5,079
(1) The 2020 amount represents a reversal to the Shared IT & Corporate Costs.
NOTE 3. ACQUISITIONS
Transaction with Nutrition & Biosciences, Inc.
On February 1, 2021 (the “Closing Date”), the Company completed the combination of IFF and DuPont deNemours, Inc’s. (“DuPont”) nutrition and biosciences business (the “N&B Business”) which had been transferred
81
to Nutrition & Biosciences, Inc., a Delaware corporation and wholly owned subsidiary of DuPont (“N&B”) in aReverse Morris Trust transaction. The N&B Business is an innovation-driven and customer-focused business thatprovides solutions for the global food and beverage, dietary supplements, home and personal care, energy, animalnutrition and pharma markets. IFF acquired 100% interest of N&B pursuant to definitive agreements, includingan Agreement and Plan of Merger (the “Merger Agreement”) entered into on December 15, 2019. Thetransaction was made in order to strengthen IFF’s customer base and market presence, with an enhanced positionin the food & beverage, home & personal care and health & wellness markets.
On the Closing Date, a wholly owned subsidiary of IFF merged with and into N&B, with N&B surviving asa wholly owned subsidiary of IFF (the “Merger”). As of the effective time of the Merger, each issued andoutstanding share of common stock of N&B (except for shares of common stock of N&B held by N&B astreasury stock or by DuPont, which were canceled and ceased to exist and no consideration was delivered inexchange therefor) was converted into the right to receive one share of common stock of IFF. The Merger wascompleted in exchange for 141,740,461 shares of IFF common stock, par value $0.125 per share (or cashpayment in lieu of fractional shares), which had been approved in the special shareholder meeting that occurredon August 27, 2020 where IFF shareholders voted to approve the issuance of shares of IFF common stock inconnection with the N&B Transaction pursuant to the Merger Agreement. In connection with the N&BTransaction, DuPont received a one-time $7.3 billion special cash payment (the “Special Cash Payment”). Theshares issued in the Merger represented approximately 55.4% of the common stock of IFF on a fully dilutedbasis, after giving effect to the Merger, as of February 1, 2021.
The acquisition will be accounted for using the purchase method of accounting, and N&B’s assets, liabilitiesand results of operations will be included in the Company’s financial statements from the Closing Date.
On December 15, 2019, IFF and N&B entered into a commitment letter which provided $7.5 billion in anaggregate principal amount of senior unsecured bridge term loans (the “Bridge Loans”). On January 17, 2020,N&B entered into a term loan credit agreement, as amended on August 25, 2020, providing for unsecured termloan facilities in an aggregate principal amount of $1.25 billion (the “N&B Term Loan Facilities”), whichreduced the commitments under the Bridge Loans commitment letter by a corresponding amount. OnSeptember 16, 2020, N&B issued $6.25 billion of senior unsecured notes (the “N&B Notes”), which reduced theremaining commitments under the Bridge Loans commitment letter in their entirety. The Bridge Loanscommitment letter was also terminated as of such date. On the Closing Date, N&B borrowed $1.25 billion underthe N&B Term Loan Facilities. The N&B Notes, together with the N&B Term Loan Facilities, were used tofinance the Special Cash Payment and to pay related fees and expenses. Following the consummation of theN&B Transaction, all obligations of N&B with respect to the N&B Term Loan Facilities and the N&B Noteshave been guaranteed by IFF. In lieu of IFF continuing to provide these guarantees, IFF intends to assume all ofN&B obligations under the Term Loan Facilities and the N&B Notes and accordingly, these amounts will bereflected as long term debt in the accompanying Consolidated Balance Sheet.
Due to the limited time between the Closing Date and IFF’s filing of this Annual Report on Form 10-K forthe fiscal year ended December 31, 2020, the valuation report and initial accounting for the business combinationis not yet available and the Company is unable to disclose certain information required by ASC Topic 805,Business Combinations. The Company plans to provide preliminary purchase price allocation information inIFF’s Quarterly Report on Form 10-Q for the quarter ended March 31, 2021.
2019 Acquisition Activity
During the second quarter of 2019, the Company acquired the remaining 50% interest in an equity methodinvestee located in Canada. The purchase of the additional interest increased the Company’s ownership of theinvestee to 100%, and the acquired entity is managed under the Taste segment. The purchase price for theremaining 50% was approximately $37 million, including cash and an accrual for the amount expected to be paidin contingent consideration. The Company began to consolidate the results of the acquired entity from the date on
82

which it acquired the remaining 50% interest during the second quarter of 2019. Goodwill of approximately$30 million and intangible assets of $20 million were recorded in connection with the acquisition.
During the first quarter of 2019, the Company acquired 70% of a company in Europe and increased itsownership of an Asian company from 49% to 60%. The two acquired entities, which manufacture flavorproducts, are managed under the Taste segment. The total purchase price for the two acquisitions made in thefirst quarter of 2019 was $52 million, excluding cash acquired and including $19 million of contingentconsideration and deferred payments. The purchase price allocations have been performed and resulted ingoodwill of approximately $47 million and intangible assets of $28 million.
During the first quarter of 2020, the Company completed the purchase price allocations for all three of thetransactions that were made during 2019. As a result of finalizing the purchase price allocations, adjustmentswere recorded to increase fixed assets by $13 million, customer relationships and other intangible assets by$5 million and approximately $3 million related to deferred tax liabilities and to decrease goodwill by$15 million. The income statement impact of the finalization of purchase accounting was not material.
Pro forma information has not been presented as the entities acquired in 2019 are not material.
Frutarom
On October 4, 2018 (the “Frutarom Closing”), the Company completed its acquisition of 100% of FrutaromIndustries Ltd. (“Frutarom”), which was accounted for using the purchase method of accounting in accordancewith ASC Topic 805, Business Combinations, with IFF identified as the acquirer.
The Company paid approximately $7.0 billion for the acquisition, including $4.3 billion in cash and$2.0 billion in equity. At the Frutarom Closing, each issued and outstanding Frutarom ordinary share wasexchanged for $71.19 in cash and 0.2490 of a share of the Company’s common stock. A portion of Frutarom’sexisting debt was repaid concurrent with the Frutarom Closing. Frutarom’s debt, which was not legally assumedby IFF but was paid at the Frutarom Closing, was approximately $695.0 million. This made up the remainder ofthe purchase consideration. To finance the acquisition, the Company used cash on hand and borrowedapproximately $3.3 billion of additional debt, consisting of $2.8 billion of senior unsecured notes, $350.0 millionin term loans and $139.5 million of tangible equity units (“TEUs”). See Notes 8 and 9 for further details. TheCompany issued 14.9 million shares as a portion of the purchase consideration resulting in former Frutaromshareholders holding approximately 14% of the Company’s outstanding common stock as of the FrutaromClosing. Additionally, the Company issued 16,500,000 TEUs in an underwritten public offering for net proceedsof approximately $665.1 million.
NOTE 4. PROPERTY, PLANT AND EQUIPMENT, NET
Property, plant and equipment consisted of the following amounts:
December 31,
(DOLLARS IN THOUSANDS) 2020 2019
Asset TypeLand . . . . . . . . . . . . . . . . . . . . . . . . . . . . . . . . . . . . . . . . . . . . . . . . . . . . . . . . . . . $ 84,205 $ 73,170Buildings and improvements . . . . . . . . . . . . . . . . . . . . . . . . . . . . . . . . . . . . . . . . 932,256 831,579Machinery and equipment . . . . . . . . . . . . . . . . . . . . . . . . . . . . . . . . . . . . . . . . . . 1,524,574 1,366,041Information technology . . . . . . . . . . . . . . . . . . . . . . . . . . . . . . . . . . . . . . . . . . . . 251,157 231,858Construction in process . . . . . . . . . . . . . . . . . . . . . . . . . . . . . . . . . . . . . . . . . . . . 136,139 188,120
Total Property, Plant and Equipment . . . . . . . . . . . . . . . . . . . . . . . . . . . . . . . . . 2,928,331 2,690,768Accumulated depreciation . . . . . . . . . . . . . . . . . . . . . . . . . . . . . . . . . . . . . . . . . . . . . . (1,470,146) (1,303,848)
Total Property, Plant and Equipment, Net . . . . . . . . . . . . . . . . . . . . . . . . . . . . . . $1,458,185 $1,386,920
83
Depreciation expense was $130.7 million for the year ended December 31, 2020, and $130.2 million and$89.1 million for the years ended December 31, 2019 and 2018, respectively.
NOTE 5. GOODWILL AND OTHER INTANGIBLE ASSETS, NET
Goodwill
Movements in goodwill during the years ended December 31, 2018, 2019 and 2020 were as follows:
(DOLLARS IN THOUSANDS) Goodwill
Balance at January 1, 2018 . . . . . . . . . . . . . . . . . . . . . . . . . . . . . . . . . . . . . . . . . . . . . . . . . . . . . . . . . $1,156,288Acquisitions(a) . . . . . . . . . . . . . . . . . . . . . . . . . . . . . . . . . . . . . . . . . . . . . . . . . . . . . . . . . . . . . . . 4,253,541Disposals . . . . . . . . . . . . . . . . . . . . . . . . . . . . . . . . . . . . . . . . . . . . . . . . . . . . . . . . . . . . . . . . . . . (19,069)Foreign exchange . . . . . . . . . . . . . . . . . . . . . . . . . . . . . . . . . . . . . . . . . . . . . . . . . . . . . . . . . . . . . (12,372)
Balance at December 31, 2018 . . . . . . . . . . . . . . . . . . . . . . . . . . . . . . . . . . . . . . . . . . . . . . . . . . . . . . 5,378,388Acquisitions(b) . . . . . . . . . . . . . . . . . . . . . . . . . . . . . . . . . . . . . . . . . . . . . . . . . . . . . . . . . . . . . . . 98,411Frutarom measurement period adjustment . . . . . . . . . . . . . . . . . . . . . . . . . . . . . . . . . . . . . . . . . 30,876Foreign exchange . . . . . . . . . . . . . . . . . . . . . . . . . . . . . . . . . . . . . . . . . . . . . . . . . . . . . . . . . . . . . (10,079)
Balance at December 31, 2019 . . . . . . . . . . . . . . . . . . . . . . . . . . . . . . . . . . . . . . . . . . . . . . . . . . . . . . 5,497,596Measurement period adjustments(c) . . . . . . . . . . . . . . . . . . . . . . . . . . . . . . . . . . . . . . . . . . . . . . . (15,283)Foreign exchange . . . . . . . . . . . . . . . . . . . . . . . . . . . . . . . . . . . . . . . . . . . . . . . . . . . . . . . . . . . . . 110,939
Balance at December 31, 2020 . . . . . . . . . . . . . . . . . . . . . . . . . . . . . . . . . . . . . . . . . . . . . . . . . . . . . . $5,593,252
(a) Primarily relates to the Company’s acquisition of Frutarom.(b) Additions primarily relate to the 2019 Acquisition Activity. See Note 3 for details.(c) Measurement period adjustments relate to adjustments recorded in connection with completing the purchase
price allocation related to the 2019 Acquisition Activity. See Note 3 for details.
Reallocation of goodwill
In the first quarter of 2020, in connection with the reorganization of the Company’s reporting structure,certain entities were moved between reporting units. As a result of the movements, Goodwill was reallocatedbetween reporting units as follows:
(DOLLARS IN THOUSANDS)Increase (decrease) to
Goodwill
Cosmetic Active Ingredients . . . . . . . . . . . . . . . . . . . . . . . . . . . . . . . . . . . . . . . . . . . . . . . . . . . 85,235Natural Product Solutions . . . . . . . . . . . . . . . . . . . . . . . . . . . . . . . . . . . . . . . . . . . . . . . . . . . . . (57,102)Fine Ingredients . . . . . . . . . . . . . . . . . . . . . . . . . . . . . . . . . . . . . . . . . . . . . . . . . . . . . . . . . . . . . (25,256)Taste . . . . . . . . . . . . . . . . . . . . . . . . . . . . . . . . . . . . . . . . . . . . . . . . . . . . . . . . . . . . . . . . . . . . . . (2,877)
Total . . . . . . . . . . . . . . . . . . . . . . . . . . . . . . . . . . . . . . . . . . . . . . . . . . . . . . . . . . . . . . . . . . —
See Note 15 for further information on the reorganization.
Goodwill by segment was as follows:
December 31,
(DOLLARS IN THOUSANDS) 2020 2019
Taste . . . . . . . . . . . . . . . . . . . . . . . . . . . . . . . . . . . . . . . . . . . . . . . . . . . . . . . . . . . . . . . $4,859,531 $4,788,988Scent . . . . . . . . . . . . . . . . . . . . . . . . . . . . . . . . . . . . . . . . . . . . . . . . . . . . . . . . . . . . . . 733,721 708,608
Total . . . . . . . . . . . . . . . . . . . . . . . . . . . . . . . . . . . . . . . . . . . . . . . . . . . . . . . . . . . $5,593,252 $5,497,596
84

Annual Goodwill Impairment Test
For the annual impairment test as of November 30, 2020, the Company utilized Step 0 of the guidance inASC Topic 350, Intangibles – Goodwill and Other, which allows for the assessment of qualitative factors todetermine whether it is more likely than not that the fair value of a reporting unit is less than its carrying value.If, based on a review of qualitative factors, it is more likely than not that the fair value of a reporting unit is lessthan its carrying value, a quantitative impairment test is performed by comparing the fair value of a reporting unitwith its carrying amount. Based on a review of qualitative factors, the Company determined that for four of thereporting units, a quantitative (Step 1) impairment analysis was not necessary to determine if the carrying valuesof the reporting unit exceeded their fair values. For the other four reporting units (Savory, Natural ProductSolutions, FSI, and Inclusions), the Company determined that a Step 1 test was necessary.
The Company assessed the fair value of the reporting units primarily using an income approach. Under theincome approach, the Company determines the fair value by using a discounted cash flow method at a rate ofreturn that reflects the relative risk of the projected future cash flows of each reporting unit, as well as a terminalvalue. The Company uses the most current actual and forecasted operating data available. Key estimates andassumptions used in these valuations include revenue growth rates and profit margins based on internal forecastsand historical operating trends of the Company, and a specific weighted-average cost of capital used to discountfuture cash flows.
In performing the quantitative impairment test, the Company determined that the fair value of the fourreporting units exceeded their carrying values and, taken together with the results of the qualitative test, wedetermined that there was no impairment of goodwill at any of the Company’s eight reporting units in2020. Based on the quantitative impairment test performed at November 30, 2020, the Company determined thatthe excess of fair values over their respective carrying values ranged from 35% to 105% for two reporting units(FSI and Inclusions). The remaining two reporting units (Savory and Natural Product Solutions) had less than10% excess fair value over carrying value.
As of November 30, 2020, the Savory reporting unit had excess fair value over carrying value ofapproximately 5% and goodwill of $1.21 billion, and the Natural Product Solutions reporting unit had excess fairvalue over carrying value of approximately 1% and goodwill of $851.4 million. While management believes thatthe assumptions used in the impairment test were reasonable, changes in key assumptions, including, lowerrevenue growth, lower operating margin, lower terminal growth rates or increasing discount rates could result ina future impairment.
If current long-term projections for these reporting units are not realized or materially decrease, theCompany may be required to write-off all or a portion of the goodwill. Such charge could have a material effecton the Consolidated Statements of Operations and Balance Sheets.
85
Other Intangible Assets
Other intangible assets, net consisted of the following amounts:
December 31,
(DOLLARS IN THOUSANDS) 2020 2019
Asset TypeCustomer relationships . . . . . . . . . . . . . . . . . . . . . . . . . . . . . . . . . . . . . . . . . . . . . . . . $2,728,100 $2,653,446Technological know-how . . . . . . . . . . . . . . . . . . . . . . . . . . . . . . . . . . . . . . . . . . . . . . 479,254 468,256Trade names & patents . . . . . . . . . . . . . . . . . . . . . . . . . . . . . . . . . . . . . . . . . . . . . . . . 186,716 178,968Other . . . . . . . . . . . . . . . . . . . . . . . . . . . . . . . . . . . . . . . . . . . . . . . . . . . . . . . . . . . . . . 38,431 40,362
Total carrying value . . . . . . . . . . . . . . . . . . . . . . . . . . . . . . . . . . . . . . . . . . . . . . . . 3,432,501 3,341,032Accumulated AmortizationCustomer relationships . . . . . . . . . . . . . . . . . . . . . . . . . . . . . . . . . . . . . . . . . . . . . . . . (470,514) (302,047)Technological know-how . . . . . . . . . . . . . . . . . . . . . . . . . . . . . . . . . . . . . . . . . . . . . . (168,069) (135,269)Trade names & patents . . . . . . . . . . . . . . . . . . . . . . . . . . . . . . . . . . . . . . . . . . . . . . . . (37,935) (27,213)Other . . . . . . . . . . . . . . . . . . . . . . . . . . . . . . . . . . . . . . . . . . . . . . . . . . . . . . . . . . . . . . (28,808) (24,568)
Total accumulated amortization . . . . . . . . . . . . . . . . . . . . . . . . . . . . . . . . . . . . . . . (705,326) (489,097)
Other intangible assets, net . . . . . . . . . . . . . . . . . . . . . . . . . . . . . . . . . . . . . . . . . $2,727,175 $2,851,935
Amortization expense was $192.6 million for the year ended December 31, 2020, and $193.1 million and$75.9 million for the years ended December 31, 2019 and 2018, respectively. Amortization expense for the nextfive years and thereafter, based on valuations and determinations of useful lives, is expected to be as follows:
December 31,
(DOLLARS IN THOUSANDS) 2021 2022 2023 2024 2025
Estimated future intangible amortization expense . . . . $196,358 $192,303 $192,180 $192,180 $191,679
NOTE 6. OTHER ASSETS AND LIABILITIES, CURRENT AND NONCURRENT
Other current assets consisted of the following amounts:
December 31,
(DOLLARS IN THOUSANDS) 2020 2019
Value-added tax receivable . . . . . . . . . . . . . . . . . . . . . . . . . . . . . . . . . . . . . . . . . . . . . . . . . . $ 92,550 $ 78,526Income tax receivable . . . . . . . . . . . . . . . . . . . . . . . . . . . . . . . . . . . . . . . . . . . . . . . . . . . . . . 99,924 69,284Prepaid expenses . . . . . . . . . . . . . . . . . . . . . . . . . . . . . . . . . . . . . . . . . . . . . . . . . . . . . . . . . . 100,336 110,768Other . . . . . . . . . . . . . . . . . . . . . . . . . . . . . . . . . . . . . . . . . . . . . . . . . . . . . . . . . . . . . . . . . . . 48,955 60,756
Total . . . . . . . . . . . . . . . . . . . . . . . . . . . . . . . . . . . . . . . . . . . . . . . . . . . . . . . . . . . . . . . $341,765 $319,334
Other assets consisted of the following amounts:
December 31,
(DOLLARS IN THOUSANDS) 2020 2019
Operating lease right-of-use assets . . . . . . . . . . . . . . . . . . . . . . . . . . . . . . . . . . . . . . . . . . . . $299,266 $287,870Finance lease right-of-use assets . . . . . . . . . . . . . . . . . . . . . . . . . . . . . . . . . . . . . . . . . . . . . . 7,773 4,792Deferred income taxes . . . . . . . . . . . . . . . . . . . . . . . . . . . . . . . . . . . . . . . . . . . . . . . . . . . . . . 196,950 125,552Overfunded pension plans . . . . . . . . . . . . . . . . . . . . . . . . . . . . . . . . . . . . . . . . . . . . . . . . . . . 101,243 85,657Cash surrender value of life insurance contracts . . . . . . . . . . . . . . . . . . . . . . . . . . . . . . . . . . 49,386 47,578Other(a) . . . . . . . . . . . . . . . . . . . . . . . . . . . . . . . . . . . . . . . . . . . . . . . . . . . . . . . . . . . . . . . . . . 62,642 56,967
Total . . . . . . . . . . . . . . . . . . . . . . . . . . . . . . . . . . . . . . . . . . . . . . . . . . . . . . . . . . . . . . . $717,260 $608,416
(a) Includes land usage rights in China and long term deposits.
86

Other current liabilities consisted of the following amounts:
December 31,
(DOLLARS IN THOUSANDS) 2020 2019
Accrued payrolls and bonuses . . . . . . . . . . . . . . . . . . . . . . . . . . . . . . . . . . . . . . . . . . . . . . . . $132,608 $102,704Rebates and incentives payable . . . . . . . . . . . . . . . . . . . . . . . . . . . . . . . . . . . . . . . . . . . . . . . 64,383 49,938Value-added tax payable . . . . . . . . . . . . . . . . . . . . . . . . . . . . . . . . . . . . . . . . . . . . . . . . . . . . 19,940 20,729Interest payable . . . . . . . . . . . . . . . . . . . . . . . . . . . . . . . . . . . . . . . . . . . . . . . . . . . . . . . . . . . 29,398 32,417Current pension and other postretirement benefit obligation . . . . . . . . . . . . . . . . . . . . . . . . 12,804 11,972Accrued insurance (including workers’ compensation) . . . . . . . . . . . . . . . . . . . . . . . . . . . . 10,603 9,960Earn outs payable . . . . . . . . . . . . . . . . . . . . . . . . . . . . . . . . . . . . . . . . . . . . . . . . . . . . . . . . . 13,855 12,961Restructuring and other charges . . . . . . . . . . . . . . . . . . . . . . . . . . . . . . . . . . . . . . . . . . . . . . 14,887 21,085Short term operating lease obligation . . . . . . . . . . . . . . . . . . . . . . . . . . . . . . . . . . . . . . . . . . 40,515 37,744Short term financing lease obligation . . . . . . . . . . . . . . . . . . . . . . . . . . . . . . . . . . . . . . . . . . 3,107 1,931Accrued income taxes . . . . . . . . . . . . . . . . . . . . . . . . . . . . . . . . . . . . . . . . . . . . . . . . . . . . . . 42,414 42,141Other . . . . . . . . . . . . . . . . . . . . . . . . . . . . . . . . . . . . . . . . . . . . . . . . . . . . . . . . . . . . . . . . . . . 247,051 233,240
Total . . . . . . . . . . . . . . . . . . . . . . . . . . . . . . . . . . . . . . . . . . . . . . . . . . . . . . . . . . . . . . . $631,565 $576,822
NOTE 7. LEASES
The Company has leases for corporate offices, manufacturing facilities, research and development facilities,and certain transportation and office equipment, the majority of which are operating leases. The Company’sleases have remaining lease terms of up to 40 years, some of which include options to extend the leases for up to5 years.
The components of lease expense were as follows:
December 31,
(DOLLARS IN THOUSANDS) 2020 2019
Operating lease cost . . . . . . . . . . . . . . . . . . . . . . . . . . . . . . . . . . . . . . . . . . . . . . . . . . . . . . . . $61,624 $52,213Financing lease cost . . . . . . . . . . . . . . . . . . . . . . . . . . . . . . . . . . . . . . . . . . . . . . . . . . . . . . . . 3,984 2,235
The total rental expense, as calculated prior to the adoption of ASU 2016-02, for 2018 was approximately$42.4 million.
Supplemental cash flow information related to leases was as follows:
December 31,
(DOLLARS IN THOUSANDS) 2020 2019
Cash paid for amounts included in the measurement of lease liabilitiesOperating cash flow for operating leases . . . . . . . . . . . . . . . . . . . . . . . . . . . . . . . . . . . . $52,013 $51,444Operating cash flow for finance leases . . . . . . . . . . . . . . . . . . . . . . . . . . . . . . . . . . . . . . 167 64Financing cash flow for finance leases . . . . . . . . . . . . . . . . . . . . . . . . . . . . . . . . . . . . . . 3,667 2,204
Right-of-use assets obtained in exchange for lease obligationsOperating leases . . . . . . . . . . . . . . . . . . . . . . . . . . . . . . . . . . . . . . . . . . . . . . . . . . . . . . . 62,609 29,823Finance leases . . . . . . . . . . . . . . . . . . . . . . . . . . . . . . . . . . . . . . . . . . . . . . . . . . . . . . . . . 6,073 2,833
87
Supplemental balance sheet information related to leases was as follows:
December 31,
(DOLLARS IN THOUSANDS) 2020 2019
Operating LeasesOperating lease right-of-use assets(1) . . . . . . . . . . . . . . . . . . . . . . . . . . . . . . . . . . . . . $299,266 $287,870
Other current liabilities(2) . . . . . . . . . . . . . . . . . . . . . . . . . . . . . . . . . . . . . . . . . . . . . . 40,515 37,744Operating lease liabilities(3) . . . . . . . . . . . . . . . . . . . . . . . . . . . . . . . . . . . . . . . . . . . . 264,717 253,367
Total operating lease liabilities . . . . . . . . . . . . . . . . . . . . . . . . . . . . . . . . . . . . . . . . . . . . . 305,232 291,111
Financing LeasesFinancing lease right-of-use assets(1) . . . . . . . . . . . . . . . . . . . . . . . . . . . . . . . . . . . . . 7,773 4,792Other current liabilities(2) . . . . . . . . . . . . . . . . . . . . . . . . . . . . . . . . . . . . . . . . . . . . . . 3,107 1,931Financing lease liabilities(3) . . . . . . . . . . . . . . . . . . . . . . . . . . . . . . . . . . . . . . . . . . . . 3,923 2,525
Total financing lease liabilities . . . . . . . . . . . . . . . . . . . . . . . . . . . . . . . . . . . . . . . . . . . . . 7,030 4,456
(1) Presented in Other assets in the Consolidated Balance Sheet.(2) Presented in Other current liabilities in the Consolidated Balance Sheet.(3) Presented in Other liabilities in the Consolidated Balance Sheet.
Weighted average remaining lease term and discount rate were as follows:
December 31,
2020 2019
Weighted average remaining lease term in yearsOperating leases . . . . . . . . . . . . . . . . . . . . . . . . . . . . . . . . . . . . . . . . . . . . . . . . . . . . . . . . . . . . . . 10.5 11.3Finance leases . . . . . . . . . . . . . . . . . . . . . . . . . . . . . . . . . . . . . . . . . . . . . . . . . . . . . . . . . . . . . . . . 2.9 3.3
Weighted average discount rateOperating leases . . . . . . . . . . . . . . . . . . . . . . . . . . . . . . . . . . . . . . . . . . . . . . . . . . . . . . . . . . . . . . 3.82%3.89%Finance leases . . . . . . . . . . . . . . . . . . . . . . . . . . . . . . . . . . . . . . . . . . . . . . . . . . . . . . . . . . . . . . . . 1.81%1.69%
Maturities of lease liabilities were as follows:
December 31,
(DOLLARS IN THOUSANDS) 2020 2019
Operating LeasesLess than 1 Year . . . . . . . . . . . . . . . . . . . . . . . . . . . . . . . . . . . . . . . . . . . . . . . . . . . . . . . . . $ 48,873 $ 49,1991-3 Years . . . . . . . . . . . . . . . . . . . . . . . . . . . . . . . . . . . . . . . . . . . . . . . . . . . . . . . . . . . . . . 83,679 81,8293-5 Years . . . . . . . . . . . . . . . . . . . . . . . . . . . . . . . . . . . . . . . . . . . . . . . . . . . . . . . . . . . . . . 63,788 60,489After 5 years . . . . . . . . . . . . . . . . . . . . . . . . . . . . . . . . . . . . . . . . . . . . . . . . . . . . . . . . . . . . 176,041 178,231Less: Imputed Interest . . . . . . . . . . . . . . . . . . . . . . . . . . . . . . . . . . . . . . . . . . . . . . . . . . . . (67,149) (78,637)
Total . . . . . . . . . . . . . . . . . . . . . . . . . . . . . . . . . . . . . . . . . . . . . . . . . . . . . . . . . . . . . . $305,232 $291,111
Financing LeasesLess than 1 Year . . . . . . . . . . . . . . . . . . . . . . . . . . . . . . . . . . . . . . . . . . . . . . . . . . . . . . . . . $ 3,127 $ 2,0361-3 Years . . . . . . . . . . . . . . . . . . . . . . . . . . . . . . . . . . . . . . . . . . . . . . . . . . . . . . . . . . . . . . 3,691 2,0733-5 Years . . . . . . . . . . . . . . . . . . . . . . . . . . . . . . . . . . . . . . . . . . . . . . . . . . . . . . . . . . . . . . 642 486After 5 years . . . . . . . . . . . . . . . . . . . . . . . . . . . . . . . . . . . . . . . . . . . . . . . . . . . . . . . . . . . . 5 26Less: Imputed Interest . . . . . . . . . . . . . . . . . . . . . . . . . . . . . . . . . . . . . . . . . . . . . . . . . . . . (435) (165)
Total . . . . . . . . . . . . . . . . . . . . . . . . . . . . . . . . . . . . . . . . . . . . . . . . . . . . . . . . . . . . . . $ 7,030 $ 4,456
88

Right-of-use assets by region were as follows:
December 31,
(DOLLARS IN THOUSANDS) 2020 2019
Operating LeasesNorth America . . . . . . . . . . . . . . . . . . . . . . . . . . . . . . . . . . . . . . . . . . . . . . . . . . . . . . . . . . $132,330 $143,556Europe, Africa and Middle East . . . . . . . . . . . . . . . . . . . . . . . . . . . . . . . . . . . . . . . . . . . . . 130,812 110,552Greater Asia . . . . . . . . . . . . . . . . . . . . . . . . . . . . . . . . . . . . . . . . . . . . . . . . . . . . . . . . . . . . 16,307 20,492Latin America . . . . . . . . . . . . . . . . . . . . . . . . . . . . . . . . . . . . . . . . . . . . . . . . . . . . . . . . . . . 19,817 13,270
Consolidated . . . . . . . . . . . . . . . . . . . . . . . . . . . . . . . . . . . . . . . . . . . . . . . . . . . . . . . . $299,266 $287,870
Financing LeasesNorth America . . . . . . . . . . . . . . . . . . . . . . . . . . . . . . . . . . . . . . . . . . . . . . . . . . . . . . . . . . $ 130 $ 246Europe, Africa and Middle East . . . . . . . . . . . . . . . . . . . . . . . . . . . . . . . . . . . . . . . . . . . . . 4,994 3,221Greater Asia . . . . . . . . . . . . . . . . . . . . . . . . . . . . . . . . . . . . . . . . . . . . . . . . . . . . . . . . . . . . 1,472 516Latin America . . . . . . . . . . . . . . . . . . . . . . . . . . . . . . . . . . . . . . . . . . . . . . . . . . . . . . . . . . . 1,177 809
Consolidated . . . . . . . . . . . . . . . . . . . . . . . . . . . . . . . . . . . . . . . . . . . . . . . . . . . . . . . . $ 7,773 $ 4,792
NOTE 8. TANGIBLE EQUITY UNITS
On September 17, 2018, the Company issued and sold 16,500,000, 6.00% TEUs at $50 per unit and receivedproceeds of $800.2 million, net of discounts and issuance costs of $24.8 million. Each TEU is comprised of: (i) aprepaid SPC to be settled by delivery of a specified number of shares of the Company’s common stock, and (ii) asenior amortizing note (“Amortizing Note”), with an initial principal amount of $8.45 and a final installmentpayment date of September 15, 2021. The Company pays equal quarterly cash installments of $0.75 perAmortizing Note on March 15, June 15, September 15, and December 15 of each year, with the exception of thefirst installment payment of $0.7333 per Amortizing Note which was due on December 15, 2018. In theaggregate, the annual quarterly cash installments will be equivalent to 6.00% per year. Each installment paymentconstitutes a payment of interest and a partial repayment of principal, computed at an annual rate of 3.79%. EachTEU may be separated by a holder into its constituent SPC and Amortizing Note after the initial issuance date ofthe TEUs, and the separate components may be combined to create a TEU after the initial issuance date, inaccordance with the terms of the SPC. The TEUs are listed on the New York Stock Exchange under the symbol“IFFT”.
The proceeds from the issuance of the TEUs were allocated to equity and debt based on the relative fairvalue of the respective components of each TEU as follows:
(IN MILLIONS, EXCEPT FAIR VALUE PER TEU) SPC Amortizing Note Total
Fair Value per TEU . . . . . . . . . . . . . . . . . . . . . . . . . . . . . . . . . . . . . . . . . . . . . $ 41.5 $ 8.5 $ 50.0
Gross Proceeds . . . . . . . . . . . . . . . . . . . . . . . . . . . . . . . . . . . . . . . . . . . . . . . . . $685.5 $139.5 $825.0Less: Issuance costs . . . . . . . . . . . . . . . . . . . . . . . . . . . . . . . . . . . . . . . . . . . . . 20.4 4.4 24.8
Net Proceeds . . . . . . . . . . . . . . . . . . . . . . . . . . . . . . . . . . . . . . . . . . . . . . . . . . . $665.1 $135.1 $800.2
The net proceeds of the SPCs were recorded as additional paid in capital, net of issuance costs. The netproceeds of the Amortizing Notes were recorded as debt, with deferred financing costs recorded as a reduction ofthe carrying amount of the debt in the Company’s consolidated balance sheet. Deferred financing costs related tothe Amortizing Notes are amortized through the maturity date using the effective interest rate method.
89
Unless settled early at the holder’s or the Company’s election, each SPC will automatically settle onSeptember 15, 2021 for a number of shares of common stock per SPC based on the 20 day volume-weightedaverage price (“VWAP”) of the Company’s common stock as follows:
VWAP of IFF Common Stock Common Stock Issued
Equal to or greater than $159.54 0.3134 shares (minimum settlement rate)Less than $159.54, but greater than $130.25 $50 divided by VWAPLess than or equal to $130.25 0.3839 shares (maximum settlement rate)
At any time prior to the second scheduled trading day immediately preceding September 15, 2021, anyholder of an SPC may settle any or all of its SPCs early, and the Company will deliver 0.3134 shares of itscommon stock for each SPC, subject to adjustment. Additionally, the SPCs may be redeemed in the event of afundamental change as defined in the SPC.
NOTE 9. DEBT
Debt consisted of the following at December 31:
(DOLLARS IN THOUSANDS)Effective
Interest Rate 2020 2019
2020 Notes(1) . . . . . . . . . . . . . . . . . . . . . . . . . . . . . . . . . . . . . . . . . . . . . . . 3.69% $ — $ 299,3812021 Euro Notes(1) . . . . . . . . . . . . . . . . . . . . . . . . . . . . . . . . . . . . . . . . . . . 0.82% 368,234 334,5612023 Notes(1) . . . . . . . . . . . . . . . . . . . . . . . . . . . . . . . . . . . . . . . . . . . . . . . 3.30% 299,311 299,0042024 Euro Notes(1) . . . . . . . . . . . . . . . . . . . . . . . . . . . . . . . . . . . . . . . . . . . 1.88% 613,564 558,1242026 Euro Notes(1) . . . . . . . . . . . . . . . . . . . . . . . . . . . . . . . . . . . . . . . . . . . 1.93% 978,134 890,1832028 Notes(1) . . . . . . . . . . . . . . . . . . . . . . . . . . . . . . . . . . . . . . . . . . . . . . . 4.57% 397,006 396,6882047 Notes(1) . . . . . . . . . . . . . . . . . . . . . . . . . . . . . . . . . . . . . . . . . . . . . . . 4.44% 493,992 493,5712048 Notes(1) . . . . . . . . . . . . . . . . . . . . . . . . . . . . . . . . . . . . . . . . . . . . . . . 5.12% 786,216 785,9962018 Term Loan Facility(1) . . . . . . . . . . . . . . . . . . . . . . . . . . . . . . . . . . . . 3.65% 239,817 239,6212022 Term Loan Facility (1) . . . . . . . . . . . . . . . . . . . . . . . . . . . . . . . . . . . . 1.73% 199,377 —Amortizing Notes(1) . . . . . . . . . . . . . . . . . . . . . . . . . . . . . . . . . . . . . . . . . . 6.09% 36,250 82,079Bank overdrafts and other . . . . . . . . . . . . . . . . . . . . . . . . . . . . . . . . . . . . . 1,560 3,131Deferred realized gains on interest rate swaps . . . . . . . . . . . . . . . . . . . . . 57 57
Total debt . . . . . . . . . . . . . . . . . . . . . . . . . . . . . . . . . . . . . . . . . . . . . . $4,413,518 $4,382,396Less: Short term borrowings(2) . . . . . . . . . . . . . . . . . . . . . . . . . . . . . . . . . (634,159) (384,958)
Total Long-term debt . . . . . . . . . . . . . . . . . . . . . . . . . . . . . . . . . . . . . $3,779,359 $3,997,438
(1) Amount is net of unamortized discount and debt issuance costs.(2) Includes bank borrowings, overdrafts and current portion of long-term debt.
2018 Term Loan Facility
On June 6, 2018, the Company entered into a Term Loan Credit Agreement (as amended on July 13, 2018,January 17, 2020 and August 25, 2020, the “2018 Term Loan Credit Agreement”) with Morgan Stanley SeniorFunding, Inc., as the administrative agent, and the lenders party thereto, pursuant to which the lenders thereundercommitted to provide, a senior unsecured term loan facility in an original aggregate principal amount of up to$350 million (the “2018 Term Loan Facility”), maturing on October 1, 2021.
Loans under the 2018 Term Loan Credit Agreement bear interest, at the Company’s option, at a per annumrate equal to either (x) an adjusted LIBOR rate plus an applicable margin varying from 0.75% to 2.00% or (y) abase rate plus an applicable margin varying from 0.00% to 1.00%, in each case depending on the public debtratings for non-credit enhanced long-term senior unsecured debt issued by the Company. Loans under the 2018
90

Term Loan Credit Agreement will amortize quarterly at a per annum rate of 10.0% of the aggregate principalamount of the loans made under the 2018 Term Loan Credit Agreement on the funding date, commencingDecember 31, 2018, with the balance payable on October 1, 2021. The Company may voluntarily prepay theterm loans without premium or penalty. The 2018 Term Loan Credit Agreement contains various covenants,limitations and events of default customary for similar facilities for similarly rated borrowers, including amaximum ratio of net debt to Consolidated EBITDA of 4.0x as of December 31, 2020, increasing to 4.75x onand after the closing of the N&B Transaction, with step-downs to 3.50x over time. As of December 31, 2020, theCompany was in compliance with all covenants under this 2018 Term Loan Facility. In 2019, the Company madepayments of $110 million on the 2018 Term Loan Facility.
2022 Term Loan Facility
On May 15, 2020, the Company entered into a Term Loan Agreement (as amended on August 25, 2020, the“2022 Term Loan Agreement”) with China Construction Bank Corporation, New York Branch, as administrativeagent, and the lenders party thereto, pursuant to which the lenders thereunder have committed to provide a seniorunsecured two year term loan facility in an aggregate principal amount of up to $200 million (the “2022 TermLoan Facility”). The loans under the 2022 Term Loan Agreement bear interest, at the Company’s option, at a perannum rate equal to either (x) an adjusted LIBOR rate plus an applicable margin varying from 1.225% to 2.475%or (y) a base rate plus an applicable margin varying from 0.225% to 1.475%, in each case depending on thepublic debt ratings for non-credit enhanced long-term senior unsecured debt issued by the Company. TheCompany may voluntarily prepay the term loans without premium or penalty, with the balance payable on thesecond anniversary of the funding date. There is no required amortization under the 2022 Term Loan Agreement.
As of December 31, 2020, the Company had $200 million outstanding in borrowings under the 2022 TermLoan Facility. The 2022 Term Loan Agreement contains various covenants, limitations and events of defaultcustomary for similar facilities for similarly rated borrowers, including a maximum ratio of net debt toConsolidated EBITDA of 4.0x as of December 31, 2020, increasing to 4.75x on and after the closing of the N&BTransaction, with step-downs to 3.50x over time. As of December 31, 2020, the Company was in compliancewith all covenants under this 2022 Term Loan Facility.
Revolving Credit Facility
On August 25, 2020, the Company entered into (i) the Second Amended and Restated Revolving CreditAgreement (the “Revolving Credit Agreement” and together with the 2018 Term Loan Credit Agreement and2022 Term Loan Agreement, the “Credit Agreements”), which amended and restated the Credit Agreement datedas of November 9, 2011, as previously amended and restated as of December 2, 2016, and further amended as ofMay 21, 2018, June 6, 2018, July 13, 2018 and January 17, 2020 among the Company, certain of its subsidiaries,the lenders party thereto and Citibank, N.A. as administrative agent, providing for a senior unsecured revolvingloan credit facility maturing June 6, 2023 (the “Revolving Credit Facility”).
The interest rate on the Revolving Credit Facility is, at the applicable borrower’s option, a per annum rateequal to either (x) an adjusted LIBOR rate plus an applicable margin varying from 1.25% to 2.50% or (y) a baserate plus an applicable margin varying from 0.25% to 1.50%, in each case depending on the public debt ratingsfor non-credit enhanced long-term senior unsecured debt issued by the Company.
The Revolving Credit Facility is available for general corporate purposes of each borrower and itssubsidiaries. The obligations under the Revolving Credit Facility are unsecured and the Company has guaranteedthe obligations of each other borrower under the Revolving Credit Facility. The Company pays a commitment feeon the aggregate unused commitments; such fee is not material. The Revolving Credit Agreement containsvarious covenants, limitations and events of default customary for similar facilities for similarly rated borrowers,including a maximum ratio of net debt to Consolidated EBITDA of 4.0x as of December 31, 2020, increasing to4.75x on and after the closing of the N&B Transaction, with step-downs to 3.50x over time.
91
In connection with the Revolving Credit Facility, the Company incurred $0.7 million of debt issuancecosts. As of December 31, 2020, the Company was in compliance with all covenants under this Revolving CreditFacility. As of December 31, 2020, total availability under the Revolving Credit Facility was $1.0 billion,with no outstanding borrowings. Under the amended terms of the Revolver Credit Agreement, the RevolvingCredit Facility increased from $1 billion to $2 billion upon completion of the N&B Transaction. As theRevolving Credit Facility is a multi-year revolving credit agreement, the Company classifies as long-term debtthe portion that it has the intent and ability to maintain outstanding longer than 12 months.
2018 Senior Unsecured Notes
On September 26, 2018, the Company issued $300 million aggregate principal amount of senior unsecurednotes that matured on September 25, 2020 (the “2020 Notes”). The 2020 Notes bear interest at a rate of 3.40%per year, payable semi-annually on March 25 and September 25 of each year, beginning March 25, 2019. Totalproceeds from the issuance of the 2020 Notes, net of underwriting discounts and offering costs, were$298.9 million. During the third quarter of 2020, the Company repaid the 2020 Notes resulting in a payment of$300 million of which approximately $200 million was from the net proceeds received under the 2022 TermLoan Agreement.
On September 25, 2018 the Company issued €300 million aggregate principal amount of senior unsecurednotes that mature on September 25, 2021 (the “2021 Euro Notes”). The 2021 Notes bear interest at a rate of 0.5%per year, payable annually on September 25 of each year, beginning September 25, 2019. Total proceeds fromthe issuance of the 2021 Notes, net of underwriting discounts and offering costs, were €297.7 million($349.5 million in USD).
On September 25, 2018, the Company issued €800 million aggregate principal amount of senior unsecurednotes that mature on September 25, 2026 (the “2026 Euro Notes”). The 2026 Notes bear interest at a rate of 1.8%per year, payable annually on September 25 of each year, beginning September 25, 2019. Total proceeds fromthe issuance of the 2026 Notes, net of underwriting discounts and offering costs, were €794.1 million($932.2 million in USD).
On September 26, 2018, the Company issued $400 million aggregate principal amount of senior unsecurednotes that mature on September 26, 2028 (the “2028 Notes”). The 2028 Notes bear interest at a rate of 4.45% peryear, payable semi-annually on March 26 and September 26 of each year, beginning March 26, 2019. Totalproceeds from the issuance of the 2028 Notes, net of underwriting discounts and offering costs, were$397.0 million.
On September 26, 2018, the Company issued $800 million aggregate principal amount of senior unsecurednotes that mature on September 26, 2048 (the “2048 Notes” and collectively with the 2021 Euro Notes, 2026Euro Notes, 2020 Notes, 2028 Notes, the “2018 Senior Unsecured Notes”). The 2048 Notes bear interest at a rateof 5.0% per year, payable semi-annually on March 26 and September 26 of each year, beginning March 26, 2019.Total proceeds from the issuance of the 2048 Notes, net of underwriting discounts and offering costs, were$787.2 million.
As discussed in Note 17, the 2021 Euro Notes and 2026 Euro Notes have been designated as a hedge of theCompany’s net investment in certain subsidiaries.
Tangible Equity Units — Senior Unsecured Amortizing Notes
On September 17, 2018, in connection with the issuance of the TEUs, the Company issued $139.5 millionaggregate principal amount of Amortizing Notes. The Amortizing Notes mature on September 15, 2021. Eachquarterly cash installment payment of $0.75 (or, in the case of the installment payment due on December 15,2018, $0.73333) per Amortizing Note will constitute a partial repayment of principal and a payment of interest,computed at an annual rate of 3.79%. Interest will be calculated on the basis of a 360 day year consisting of
92
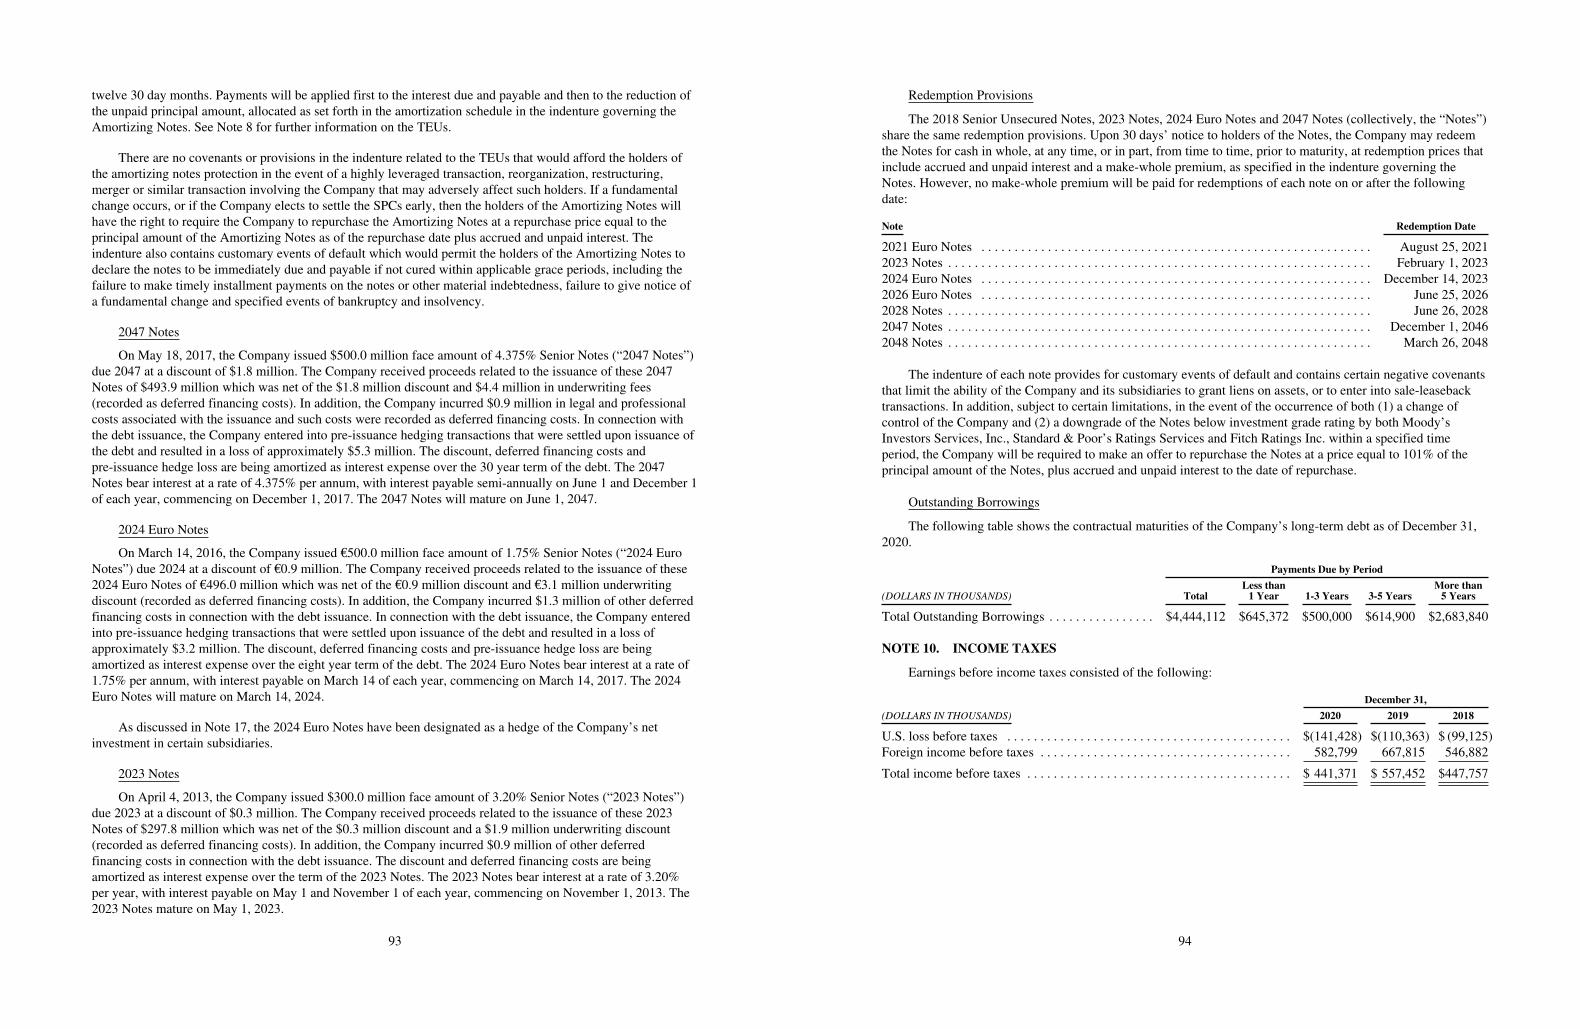
twelve 30 day months. Payments will be applied first to the interest due and payable and then to the reduction ofthe unpaid principal amount, allocated as set forth in the amortization schedule in the indenture governing theAmortizing Notes. See Note 8 for further information on the TEUs.
There are no covenants or provisions in the indenture related to the TEUs that would afford the holders ofthe amortizing notes protection in the event of a highly leveraged transaction, reorganization, restructuring,merger or similar transaction involving the Company that may adversely affect such holders. If a fundamentalchange occurs, or if the Company elects to settle the SPCs early, then the holders of the Amortizing Notes willhave the right to require the Company to repurchase the Amortizing Notes at a repurchase price equal to theprincipal amount of the Amortizing Notes as of the repurchase date plus accrued and unpaid interest. Theindenture also contains customary events of default which would permit the holders of the Amortizing Notes todeclare the notes to be immediately due and payable if not cured within applicable grace periods, including thefailure to make timely installment payments on the notes or other material indebtedness, failure to give notice ofa fundamental change and specified events of bankruptcy and insolvency.
2047 Notes
On May 18, 2017, the Company issued $500.0 million face amount of 4.375% Senior Notes (“2047 Notes”)due 2047 at a discount of $1.8 million. The Company received proceeds related to the issuance of these 2047Notes of $493.9 million which was net of the $1.8 million discount and $4.4 million in underwriting fees(recorded as deferred financing costs). In addition, the Company incurred $0.9 million in legal and professionalcosts associated with the issuance and such costs were recorded as deferred financing costs. In connection withthe debt issuance, the Company entered into pre-issuance hedging transactions that were settled upon issuance ofthe debt and resulted in a loss of approximately $5.3 million. The discount, deferred financing costs andpre-issuance hedge loss are being amortized as interest expense over the 30 year term of the debt. The 2047Notes bear interest at a rate of 4.375% per annum, with interest payable semi-annually on June 1 and December 1of each year, commencing on December 1, 2017. The 2047 Notes will mature on June 1, 2047.
2024 Euro Notes
On March 14, 2016, the Company issued €500.0 million face amount of 1.75% Senior Notes (“2024 EuroNotes”) due 2024 at a discount of €0.9 million. The Company received proceeds related to the issuance of these2024 Euro Notes of €496.0 million which was net of the €0.9 million discount and €3.1 million underwritingdiscount (recorded as deferred financing costs). In addition, the Company incurred $1.3 million of other deferredfinancing costs in connection with the debt issuance. In connection with the debt issuance, the Company enteredinto pre-issuance hedging transactions that were settled upon issuance of the debt and resulted in a loss ofapproximately $3.2 million. The discount, deferred financing costs and pre-issuance hedge loss are beingamortized as interest expense over the eight year term of the debt. The 2024 Euro Notes bear interest at a rate of1.75% per annum, with interest payable on March 14 of each year, commencing on March 14, 2017. The 2024Euro Notes will mature on March 14, 2024.
As discussed in Note 17, the 2024 Euro Notes have been designated as a hedge of the Company’s netinvestment in certain subsidiaries.
2023 Notes
On April 4, 2013, the Company issued $300.0 million face amount of 3.20% Senior Notes (“2023 Notes”)due 2023 at a discount of $0.3 million. The Company received proceeds related to the issuance of these 2023Notes of $297.8 million which was net of the $0.3 million discount and a $1.9 million underwriting discount(recorded as deferred financing costs). In addition, the Company incurred $0.9 million of other deferredfinancing costs in connection with the debt issuance. The discount and deferred financing costs are beingamortized as interest expense over the term of the 2023 Notes. The 2023 Notes bear interest at a rate of 3.20%per year, with interest payable on May 1 and November 1 of each year, commencing on November 1, 2013. The2023 Notes mature on May 1, 2023.
93
Redemption Provisions
The 2018 Senior Unsecured Notes, 2023 Notes, 2024 Euro Notes and 2047 Notes (collectively, the “Notes”)share the same redemption provisions. Upon 30 days’ notice to holders of the Notes, the Company may redeemthe Notes for cash in whole, at any time, or in part, from time to time, prior to maturity, at redemption prices thatinclude accrued and unpaid interest and a make-whole premium, as specified in the indenture governing theNotes. However, no make-whole premium will be paid for redemptions of each note on or after the followingdate:
Note Redemption Date
2021 Euro Notes . . . . . . . . . . . . . . . . . . . . . . . . . . . . . . . . . . . . . . . . . . . . . . . . . . . . . . . . . . . August 25, 20212023 Notes . . . . . . . . . . . . . . . . . . . . . . . . . . . . . . . . . . . . . . . . . . . . . . . . . . . . . . . . . . . . . . . . February 1, 20232024 Euro Notes . . . . . . . . . . . . . . . . . . . . . . . . . . . . . . . . . . . . . . . . . . . . . . . . . . . . . . . . . . . December 14, 20232026 Euro Notes . . . . . . . . . . . . . . . . . . . . . . . . . . . . . . . . . . . . . . . . . . . . . . . . . . . . . . . . . . . June 25, 20262028 Notes . . . . . . . . . . . . . . . . . . . . . . . . . . . . . . . . . . . . . . . . . . . . . . . . . . . . . . . . . . . . . . . . June 26, 20282047 Notes . . . . . . . . . . . . . . . . . . . . . . . . . . . . . . . . . . . . . . . . . . . . . . . . . . . . . . . . . . . . . . . . December 1, 20462048 Notes . . . . . . . . . . . . . . . . . . . . . . . . . . . . . . . . . . . . . . . . . . . . . . . . . . . . . . . . . . . . . . . . March 26, 2048
The indenture of each note provides for customary events of default and contains certain negative covenantsthat limit the ability of the Company and its subsidiaries to grant liens on assets, or to enter into sale-leasebacktransactions. In addition, subject to certain limitations, in the event of the occurrence of both (1) a change ofcontrol of the Company and (2) a downgrade of the Notes below investment grade rating by both Moody’sInvestors Services, Inc., Standard & Poor’s Ratings Services and Fitch Ratings Inc. within a specified timeperiod, the Company will be required to make an offer to repurchase the Notes at a price equal to 101% of theprincipal amount of the Notes, plus accrued and unpaid interest to the date of repurchase.
Outstanding Borrowings
The following table shows the contractual maturities of the Company’s long-term debt as of December 31,2020.
Payments Due by Period
(DOLLARS IN THOUSANDS) TotalLess than1 Year 1-3 Years 3-5 Years
More than5 Years
Total Outstanding Borrowings . . . . . . . . . . . . . . . . $4,444,112 $645,372 $500,000 $614,900 $2,683,840
NOTE 10. INCOME TAXES
Earnings before income taxes consisted of the following:
December 31,
(DOLLARS IN THOUSANDS) 2020 2019 2018
U.S. loss before taxes . . . . . . . . . . . . . . . . . . . . . . . . . . . . . . . . . . . . . . . . . . . $(141,428) $(110,363) $ (99,125)Foreign income before taxes . . . . . . . . . . . . . . . . . . . . . . . . . . . . . . . . . . . . . . 582,799 667,815 546,882
Total income before taxes . . . . . . . . . . . . . . . . . . . . . . . . . . . . . . . . . . . . . . . . $ 441,371 $ 557,452 $447,757
94

The income tax provision consisted of the following:
December 31,
(DOLLARS IN THOUSANDS) 2020 2019 2018
Current tax provisionFederal . . . . . . . . . . . . . . . . . . . . . . . . . . . . . . . . . . . . . . . . . . . . . . . . . . . . $ (8,813) $ 9,979 $ (11,568)State and local . . . . . . . . . . . . . . . . . . . . . . . . . . . . . . . . . . . . . . . . . . . . . . 1,149 429 1,709Foreign . . . . . . . . . . . . . . . . . . . . . . . . . . . . . . . . . . . . . . . . . . . . . . . . . . . . 149,381 146,055 98,433
Total current tax provision . . . . . . . . . . . . . . . . . . . . . . . . . . . . . . . . . 141,717 156,463 88,574
Deferred tax provisionFederal . . . . . . . . . . . . . . . . . . . . . . . . . . . . . . . . . . . . . . . . . . . . . . . . . . . . (7,943) (41,126) (8,287)State and local . . . . . . . . . . . . . . . . . . . . . . . . . . . . . . . . . . . . . . . . . . . . . . (2,057) 7,598 (7,092)Foreign . . . . . . . . . . . . . . . . . . . . . . . . . . . . . . . . . . . . . . . . . . . . . . . . . . . . (57,718) (25,751) 34,781
Total deferred tax (benefit) provision . . . . . . . . . . . . . . . . . . . . . . . . (67,718) (59,279) 19,402
Total taxes on income . . . . . . . . . . . . . . . . . . . . . . . . . . . . . . . . $ 73,999 $ 97,184 $107,976
Effective Tax Rate Reconciliation
Reconciliation between the U.S. federal statutory income tax rate to the actual effective tax rate was asfollows:
December 31,
(DOLLARS IN THOUSANDS) 2020 2019 2018
Statutory tax rate . . . . . . . . . . . . . . . . . . . . . . . . . . . . . . . . . . . . . . . . . . . . . . . . . . . . . . . . . . 21.0% 21.0% 21.0%Difference in effective tax rate on foreign earnings and remittances . . . . . . . . . . . . . . (6.9) (6.8) (6.1)Tax benefit from supply chain optimization . . . . . . . . . . . . . . . . . . . . . . . . . . . . . . . . . (5.0) (1.0) (3.0)Unrecognized tax benefit, net of reversals . . . . . . . . . . . . . . . . . . . . . . . . . . . . . . . . . . 5.7 3.4 2.9U.S. tax reform . . . . . . . . . . . . . . . . . . . . . . . . . . . . . . . . . . . . . . . . . . . . . . . . . . . . . . . — — (1.8)Deferred taxes on deemed repatriation . . . . . . . . . . . . . . . . . . . . . . . . . . . . . . . . . . . . . (0.2) 0.8 10.1Global intangible low-taxed income . . . . . . . . . . . . . . . . . . . . . . . . . . . . . . . . . . . . . . . 5.3 — 1.8U.S. foreign tax credit - general limitation . . . . . . . . . . . . . . . . . . . . . . . . . . . . . . . . . . (1.9) (1.2) (1.1)Acquisition costs . . . . . . . . . . . . . . . . . . . . . . . . . . . . . . . . . . . . . . . . . . . . . . . . . . . . . . 1.0 0.5 1.3Establishment (release) of valuation allowance on state deferred . . . . . . . . . . . . . . . . (0.4) 1.7 (1.5)State and local taxes . . . . . . . . . . . . . . . . . . . . . . . . . . . . . . . . . . . . . . . . . . . . . . . . . . . (0.6) (0.8) 0.6Other, net . . . . . . . . . . . . . . . . . . . . . . . . . . . . . . . . . . . . . . . . . . . . . . . . . . . . . . . . . . . . (1.2) (0.2) (0.1)
Effective tax rate . . . . . . . . . . . . . . . . . . . . . . . . . . . . . . . . . . . . . . . . . . . . . . . . . . 16.8% 17.4% 24.1%
The effective tax rate reflects the impact of a favorable mix of earnings and lower repatriation costs,partially offset by loss provisions and the cost of global intangible low-taxed income (“GILTI”).
On December 22, 2017, the U.S. government enacted comprehensive tax legislation commonly referred toas the Tax Cuts and Jobs Act (the “Tax Act”) that significantly revised the U.S. tax code effective January 1,2018. The Tax Act created significant international tax provisions, including GILTI. The Company has elected totreat GILTI as a current period cost if and when incurred. This tax position resulted in a net $23.3 million incometax expense for the year ended December 31, 2020, which includes a provision to return adjustment.
The U.S. consolidated group has historically generated taxable income after the inclusion of foreigndividends which has allowed the Company to realize its federal deferred tax assets. Foreign dividends are subjectto a 100% dividends received deduction under the Tax Act and do not serve as a source of federal taxableincome. However, as of December 31, 2020 the U.S. consolidated group is in a cumulative income position, and
95
is expected to continue to be in a cumulative income position principally due to the inclusion of global intangiblelow-taxed income and expects to realize tax benefits for the reversal of temporary differences. The correspondingU.S. federal taxable income is sufficient to realize $127.3 million in deferred tax assets as of December 31, 2020.
Further, as of December 31, 2020 the Company has maintained a valuation allowance of $12.6 million oncertain state tax attributes based on a state taxable income forecast. The main inputs into the forecast are the 2020taxable income projections. Changes in the performance of the North American business, the Company’s transferpricing policies and adjustments to the Company’s U.S. tax profile could impact the estimate.
Deferred Taxes
The deferred tax assets and liabilities consisted of the following amounts:
December 31,
(DOLLARS IN THOUSANDS) 2020 2019
Employee and retiree benefits . . . . . . . . . . . . . . . . . . . . . . . . . . . . . . . . . . . . . . . . . . . . . . $ 108,119 $ 87,924Credit and net operating loss carryforwards . . . . . . . . . . . . . . . . . . . . . . . . . . . . . . . . . . . . 270,699 220,156Intangible assets . . . . . . . . . . . . . . . . . . . . . . . . . . . . . . . . . . . . . . . . . . . . . . . . . . . . . . . . . 9,759 8,477Amortizable R&D expenses . . . . . . . . . . . . . . . . . . . . . . . . . . . . . . . . . . . . . . . . . . . . . . . . 30,027 15,477Gain on foreign currency translation . . . . . . . . . . . . . . . . . . . . . . . . . . . . . . . . . . . . . . . . . 46,071 3,285Interest limitation . . . . . . . . . . . . . . . . . . . . . . . . . . . . . . . . . . . . . . . . . . . . . . . . . . . . . . . . 50,978 39,867Inventory . . . . . . . . . . . . . . . . . . . . . . . . . . . . . . . . . . . . . . . . . . . . . . . . . . . . . . . . . . . . . . . 14,384 14,396Lease obligations . . . . . . . . . . . . . . . . . . . . . . . . . . . . . . . . . . . . . . . . . . . . . . . . . . . . . . . . 53,339 53,751Other, net . . . . . . . . . . . . . . . . . . . . . . . . . . . . . . . . . . . . . . . . . . . . . . . . . . . . . . . . . . . . . . 21,806 14,351
Gross deferred tax assets . . . . . . . . . . . . . . . . . . . . . . . . . . . . . . . . . . . . . . . . . . . . . . 605,182 457,684
Property, plant and equipment, net . . . . . . . . . . . . . . . . . . . . . . . . . . . . . . . . . . . . . . . . . . . (59,727) (49,158)Intangible assets . . . . . . . . . . . . . . . . . . . . . . . . . . . . . . . . . . . . . . . . . . . . . . . . . . . . . . . . . (585,635) (621,044)Right-of-use assets . . . . . . . . . . . . . . . . . . . . . . . . . . . . . . . . . . . . . . . . . . . . . . . . . . . . . . . (52,605) (53,555)Loss on foreign currency translation . . . . . . . . . . . . . . . . . . . . . . . . . . . . . . . . . . . . . . . . . (99) —Deferred taxes on deemed repatriation . . . . . . . . . . . . . . . . . . . . . . . . . . . . . . . . . . . . . . . . (47,144) (46,066)
Gross deferred tax liabilities . . . . . . . . . . . . . . . . . . . . . . . . . . . . . . . . . . . . . . . . . . . . (745,210) (769,823)Valuation allowance . . . . . . . . . . . . . . . . . . . . . . . . . . . . . . . . . . . . . . . . . . . . . . . . . . (257,171) (203,765)
Total net deferred tax liabilities . . . . . . . . . . . . . . . . . . . . . . . . . . . . . . . . . . . . . $(397,199) $(515,904)
Net operating loss carryforwards were $246.1 million and $207.9 million at December 31, 2020 and 2019,respectively. If unused, $42.1 million will expire between 2021 and 2040. The remainder, totaling$204.0 million, may be carried forward indefinitely. Tax credit carryforwards were $27.9 million and$18.5 million at December 31, 2020 and 2019, respectively. If unused, the $27.9 million will expire between2021 and 2040.
Of the $274.0 million deferred tax asset for net operating loss carryforwards and credits at December 31,2020, the Company considers it unlikely that a portion of the tax benefit will be realized. Accordingly, avaluation allowance of $225.8 million of net operating loss carryforwards and $10.0 million of tax credits hasbeen established against these deferred tax assets.
96

Uncertain Tax Positions
A reconciliation of the beginning and ending amount of unrecognized tax benefits is as follows:
December 31,
(DOLLARS IN THOUSANDS) 2020 2019 2018
Balance of unrecognized tax benefits at beginning of year . . . . . . . . . . . . . . . . . . . $74,799 $50,953 $38,162Gross amount of increases in unrecognized tax benefits as a result of positionstaken during a prior year . . . . . . . . . . . . . . . . . . . . . . . . . . . . . . . . . . . . . . . . . . . 10,445 20,361 9,751
Gross amount of decreases in unrecognized tax benefits as a result of positionstaken during a prior year . . . . . . . . . . . . . . . . . . . . . . . . . . . . . . . . . . . . . . . . . . . (274) (2,241) (5,362)
Gross amount of increases in unrecognized tax benefits as a result of positionstaken during the current year . . . . . . . . . . . . . . . . . . . . . . . . . . . . . . . . . . . . . . . . 24,400 13,274 14,677
The amounts of decreases in unrecognized benefits relating to settlements withtaxing authorities . . . . . . . . . . . . . . . . . . . . . . . . . . . . . . . . . . . . . . . . . . . . . . . . . (1,736) (3,575) (4,550)
Reduction in unrecognized tax benefits due to the lapse of applicable statute oflimitation . . . . . . . . . . . . . . . . . . . . . . . . . . . . . . . . . . . . . . . . . . . . . . . . . . . . . . . (8,739) (3,973) (1,725)
Balance of unrecognized tax benefits at end of year . . . . . . . . . . . . . . . . . . . . . . . . $98,895 $74,799 $50,953
At December 31, 2020, 2019 and 2018, there were $98.2 million, $73.6 million, and $47.3 million,respectively, of unrecognized tax benefits recorded to Other liabilities and $0.7 million, $1.2 million and$3.6 million recorded to Other current liabilities for 2020, 2019 and 2018, respectively. If these unrecognized taxbenefits were recognized, all the benefits and related interest and penalties would be recorded as a benefit toincome tax expense.
For the year ended December 31, 2020, the Company increased its liabilities for interest and penalties by$3.4 million, net, increased its liabilities for interest and penalties by $11.0 million, net for the year ended 2019,and reduced its liabilities for interest and penalties by $1.1 million, net for the year ended 2018. At December 31,2020, 2019 and 2018, the Company had accrued $17.3 million, $14.0 million and $3.0 million, respectively, ofinterest and penalties classified as Other liabilities, and $0.1 million to Other current liabilities for 2020. No suchliabilities were accrued for the year ended December 31, 2019 and 2018.
As of December 31, 2020, the Company’s aggregate provision for unrecognized tax benefits, includinginterest and penalties, was $116.3 million, associated with various tax positions principally asserted in foreignjurisdictions, none of which is individually material.
Other
Tax benefits credited to Shareholders’ equity were $0.1 million for the years ended December 31, 2020 and2019, and de minimis for the year ended December 31, 2018 associated with stock option exercises and PRSUdividends.
The Company regularly repatriates earnings from non-U.S. subsidiaries. As the Company repatriates thesefunds to the U.S. they will be required to pay income taxes in certain U.S. states and applicable foreignwithholding taxes during the period when such repatriation occurs. Accordingly, as of December 31, 2020, theCompany had a deferred tax liability of $47.1 million for the effect of repatriating the funds to the U.S.,attributable to various non-U.S. subsidiaries. There is no deferred tax liability associated with non-U.S.subsidiaries where we intend to indefinitely reinvest the earnings to fund local operations and/or capital projects.
The Company has ongoing income tax audits and legal proceedings which are at various stages ofadministrative or judicial review, of which the material items are discussed below. In addition, the Company hasother ongoing tax audits and legal proceedings that relate to indirect taxes, such as value-added taxes, capital tax,sales and use and property taxes, which are discussed in Note 20.
97
The Company also has several other tax audits in process and has open tax years with various taxingjurisdictions that range primarily from 2010 to 2019. Based on currently available information, the Companydoes not believe the ultimate outcome of any of these tax audits and other tax positions related to open tax years,when finalized, will have a material impact on its financial position.
NOTE 11. REVENUE RECOGNITION
On December 30, 2017, the first day of our 2018 fiscal year, the Company adopted ASU 2014-09, “Revenuefrom Contracts with Customers (Topic 606)”. Under Topic 606 (the “Revenue Standard”), revenue is recognizedto reflect the transfer of goods or services to customers in an amount that reflects the consideration to which weexpect to be entitled in exchange for those goods or services. The Company adopted the Revenue Standard usingthe modified retrospective method effective the first day of its 2018 fiscal year.
The Company recognizes revenue when control of the promised goods is transferred to its customers in anamount that reflects the consideration it expects to be entitled to in exchange for those goods. Sales, value added,and other taxes the Company collects are excluded from revenues. The Company receives payment in accordancewith standard customer terms.
The following table presents the Company’s revenues disaggregated by product categories:
December 31,
(DOLLARS IN THOUSANDS) 2020 2019 2018
TasteFlavor Compounds . . . . . . . . . . . . . . . . . . . . . . . . . . . . . . . . . . . . . . $2,737,079 $2,827,681 $1,990,985Flavor Ingredients . . . . . . . . . . . . . . . . . . . . . . . . . . . . . . . . . . . . . . . 372,702 372,839 100,650
Total Taste . . . . . . . . . . . . . . . . . . . . . . . . . . . . . . . . . . . . . . . . . 3,109,781 3,200,520 2,091,635Scent
Fragrance Compounds . . . . . . . . . . . . . . . . . . . . . . . . . . . . . . . . . . . . 1,577,528 1,544,654 1,496,493Fragrance Ingredients . . . . . . . . . . . . . . . . . . . . . . . . . . . . . . . . . . . . 396,930 394,910 389,411
Total Scent . . . . . . . . . . . . . . . . . . . . . . . . . . . . . . . . . . . . . . . . . 1,974,458 1,939,564 1,885,904
Total revenues . . . . . . . . . . . . . . . . . . . . . . . . . . . . . . . . . . $5,084,239 $5,140,084 $3,977,539
The following table presents the Company’s revenues disaggregated by region, based on the region of itscustomers:
December 31,
(DOLLARS IN THOUSANDS) 2020 2019 2018
Europe, Africa and Middle East . . . . . . . . . . . . . . . . . . . . . . . . . . . . . . . . $1,987,398 $2,081,758 $1,396,316Greater Asia . . . . . . . . . . . . . . . . . . . . . . . . . . . . . . . . . . . . . . . . . . . . . . . . 1,161,660 1,162,992 991,015North America . . . . . . . . . . . . . . . . . . . . . . . . . . . . . . . . . . . . . . . . . . . . . . 1,228,243 1,170,497 1,010,126Latin America . . . . . . . . . . . . . . . . . . . . . . . . . . . . . . . . . . . . . . . . . . . . . . 706,938 724,837 580,082
Total revenues . . . . . . . . . . . . . . . . . . . . . . . . . . . . . . . . . . . . . . . . . . $5,084,239 $5,140,084 $3,977,539
Flavor and Fragrance Compounds Revenues
The Company accounts for a contract when it has approval and commitment from both parties, the rights ofthe parties and payment terms (which vary by customer) are identified, the contract has commercial substance,and collectability of consideration is probable. Consistent with the Company’s past practice, the amount ofrevenue recognized is adjusted at the time of sale for expected discounts and rebates (“Variable Consideration”).
98

The Company generates revenues primarily by manufacturing customized taste and scent compounds for theexclusive use of our customers. The Company combines the shipment of goods with their manufacture to accountfor both shipment and manufacture as the sole performance obligation.
With respect to the vast majority of the Company’s contracts for Compounds products, the Companyrecognizes a sale at the point in time when it ships the product from its manufacturing facility to its customer, asthis is the time when control of the goods has transferred to the customer. The amount of consideration receivedand revenue recognized is impacted by the Variable Consideration the Company has agreed with its customers.The Company estimates Variable Consideration amounts for each customer based on the specific agreement, ananalysis of historical volumes and the current activity with that customer. The Company reassesses its estimatesof Variable Consideration at each reporting date throughout the contract period and updates the estimate until theuncertainty is resolved. During the current period, changes to estimates of Variable Consideration have beenimmaterial.
With respect to a small number of contracts for the sale of Compounds products, the Company recognizesrevenue over time as it manufactures customized compounds that do not have an alternative use and for whichthe contracts provide the Company with an enforceable right to payment, including a reasonable profit, at alltimes during the contract term commencing with the manufacturing of the goods. When revenue is recognizedover time, the amount of revenue recognized is based on the extent of progress towards completion of thepromised goods. The Company generally uses the output method to measure progress for its contracts as thismethod reflects the transfer of goods to the customer. Once customization begins, the manufacturing process isgenerally completed within a two week period. Due to the short time frame for production, there is littleestimation uncertainty in the process. In addition, due to the customized nature of the Company’s products,returns are not material.
Flavor and Fragrance Ingredients Revenues
The Company accounts for a contract when it has approval and commitment from both parties, the rights ofthe parties and payment terms (which vary by customer) are identified, the contract has commercial substance,and collectability of consideration is probable.
The Company generates revenues primarily by manufacturing Ingredients products for the use of ourcustomers. The Company combines the shipment of goods with their manufacture to account for both shipmentand manufacture as the sole performance obligation.
Generally, the Company recognizes a sale at the time when it ships the product from its manufacturingfacility to its customer, as this is the point when control of the goods or services has transferred to the customer.The amount of consideration received and revenue recognized is impacted by discounts offered to its customers.The Company estimates discounts based on an analysis of historical experience and current activity. TheCompany assesses its estimates of discounts at each reporting date throughout the contract period and updates itsestimates until the uncertainty has been resolved. During the current period, changes to estimates of discountshave been immaterial.
Contract Asset and Accounts Receivable
With respect to a small number of contracts for the sale of compounds, the Company has an “enforceableright to payment for performance to date” and as the products do not have an alternative use, the Companyrecognizes revenue for these contracts over time and records a contract asset using the output method. The outputmethod recognizes revenue on the basis of direct measurements of the value to the customer of the goods orservices transferred to date relative to the remaining goods or services promised under the contract.
99
The following table reflects the balances in the Company’s contract assets, accounts receivable and contractliabilities for the periods ended December 31, 2020 and December 31, 2019:
December 31,
(DOLLARS IN THOUSANDS) 2020 2019
Receivables (included in Trade receivables) . . . . . . . . . . . . . . . . . . . . . . . . . . . . . . . . . . . . . $950,350 $892,625Contract asset — Short term . . . . . . . . . . . . . . . . . . . . . . . . . . . . . . . . . . . . . . . . . . . . . . . . . 1,086 2,736Contract liabilities — Short term . . . . . . . . . . . . . . . . . . . . . . . . . . . . . . . . . . . . . . . . . . . . . 4,944 11,107
NOTE 12. NET INCOME PER SHARE
Basic and diluted net income per share is based on the weighted average number of shares outstanding. Areconciliation of shares used in the computation of basic and diluted net income per share is as follows:
December 31,
(DOLLARS IN THOUSANDS) 2020 2019 2018
Net IncomeNet income attributable to IFF stockholders . . . . . . . . . . . . . . . . . . . . . . . . . . . $363,228 $455,873 $337,302Adjustment related to (increase) decrease in redemption value of redeemablenoncontrolling interests in excess of earnings allocated . . . . . . . . . . . . . . . . 1,803 (2,097) (2,848)
Net income available to IFF stockholders . . . . . . . . . . . . . . . . . . . . . . . . . . . . . $365,031 $453,776 $334,454
SharesWeighted average common shares outstanding (basic)(1) . . . . . . . . . . . . . . . . . 112,162 111,966 87,551Adjustment for assumed dilution(2):
Stock options and restricted stock awards . . . . . . . . . . . . . . . . . . . . . . . . . 305 356 303SPC portion of the TEUs . . . . . . . . . . . . . . . . . . . . . . . . . . . . . . . . . . . . . . 1,163 985 267
Weighted average shares assuming dilution (diluted) . . . . . . . . . . . . . . . . . . . . 113,630 113,307 88,121
Net Income per ShareNet income per share — basic . . . . . . . . . . . . . . . . . . . . . . . . . . . . . . . . . . . . . . $ 3.25 $ 4.05 $ 3.81Net income per share — dilutive . . . . . . . . . . . . . . . . . . . . . . . . . . . . . . . . . . . . 3.21 4.00 3.79
(1) For the year ended December 31, 2020 and 2019, the TEUs were assumed to be outstanding at the minimumsettlement amount for weighted-average shares for basic earnings per share. See below for details.
(2) Effect of dilutive securities includes dilution under stock plans and incremental impact of TEUs. See belowfor details.
As discussed in Note 8, the Company issued 16,500,000 TEUs, consisting of a prepaid SPC and a senioramortizing note, for net proceeds of approximately $800.2 million on September 17, 2018. For the periodsoutstanding, the SPC portion of the TEUs were assumed to be settled at the minimum settlement amountof 0.3134 shares per SPC for weighted-average shares for basic earnings per share. For diluted earnings pershare, the shares were assumed to be settled at a conversion factor based on the VWAP per share of theCompany’s common stock not to exceed 0.3839 shares per SPC as of December 31, 2020 and 2019.
The Company has issued shares of Purchased Restricted Stock (“PRS”) and Purchased Restricted StockUnits (“PRSUs”) which contain nonforfeitable rights to dividends and thus are considered participating securitieswhich are required to be included in the computation of basic and diluted earnings per share pursuant to thetwo-class method. The two-class method was not presented since the difference between basic and diluted netincome per share for both common shareholders, PRS and PRSU holders was less than $0.04 per share as ofDecember 31, 2020 and less than $0.01 per share as of December 31, 2019 and 2018, and for each year thenumber of PRS and PRSUs outstanding as of December 31, 2020, 2019 and 2018 was immaterial. Net incomeallocated to such PRS and PRSUs during 2020, 2019 and 2018 was approximately $1.0 million each year.
100

An immaterial amount of Stock-Settled Appreciation Rights (“SSARs”) were excluded from thecomputation of diluted net income per share at December 31, 2020, 2019 and 2018.
NOTE 13. SHAREHOLDERS’ EQUITY
Dividends
Cash dividends declared per share were $3.04, $2.96 and $2.84 for the years ended December 31, 2020,2019 and 2018, respectively. The Consolidated Balance Sheet reflects $82.3 million of dividends payable atDecember 31, 2020. This amount relates to a cash dividend of $0.77 per share declared in December 2020 andpaid in January 2021. Dividends declared, but not paid as of December 31, 2019 and December 31, 2018 were$80.0 million ($0.75 per share) and $77.8 million ($0.73 per share), respectively.
Share Repurchases
In December 2012, the Board of Directors authorized a $250.0 million share repurchase program, whichcommenced in the first quarter of 2013. In August 2015, the Board of Directors approved an additional$250.0 million share repurchase authorization and extension through December 31, 2017. Based on the totalremaining amount of $56.1 million available under the amended repurchase program as of October 31, 2017, theBoard of Directors re-approved on November 1, 2017 a $250.0 million share repurchase authorization andextension for a total value of $300.0 million available under the program, which expires on November 1, 2022.
A summary of the stock repurchase activity under the stock repurchase program, reported based on the tradedate, is summarized as follows:
(DOLLARS IN THOUSANDS)Shares
Repurchased
Weighted-Average Priceper Share
Dollar AmountRepurchased
Year Ended December 31, 2018 . . . . . . . . . . . . . . . . . . . . . . . . . . . . . . 108,109 $143.15 $15,475
Based on the total remaining amount of $279.7 million available under the repurchase program, 2,569,517shares, or 2.3% of shares outstanding (based on the market price and weighted average shares outstanding as ofDecember 31, 2020) could be repurchased under the program as of December 31, 2020.
As of May 7, 2018, the Company has suspended its share repurchases.
NOTE 14. STOCK COMPENSATION PLANS
The Company has various equity plans under which its officers, senior management, other key employeesand Board of Directors may be granted options to purchase IFF common stock or other forms of stock-basedawards. Beginning in 2004, the Company granted Restricted Stock Units (“RSUs”) as the principal element of itsequity compensation for all eligible U.S.-based employees and a majority of eligible overseas employees.Vesting of the RSUs is solely time based; the vesting period is primarily 3 years from date of grant. For a smallgroup of employees, primarily overseas, the Company granted stock options prior to 2008.
The cost of all employee stock-based awards are principally recognized on a straight-line attribution basisover their respective vesting periods, net of estimated forfeitures. Total stock-based compensation expenseincluded in the Consolidated Statement of Income and Comprehensive Income was as follows:
December 31,
(DOLLARS IN THOUSANDS) 2020 2019 2018
Equity-based awards . . . . . . . . . . . . . . . . . . . . . . . . . . . . . . . . . . . . . . . . . . . . . . . . $35,798 $34,482 $29,401Liability-based awards . . . . . . . . . . . . . . . . . . . . . . . . . . . . . . . . . . . . . . . . . . . . . . . 3,865 4,128 2,517
Total stock-based compensation . . . . . . . . . . . . . . . . . . . . . . . . . . . . . . . . . . . . . . . 39,663 38,610 31,918Less tax benefit . . . . . . . . . . . . . . . . . . . . . . . . . . . . . . . . . . . . . . . . . . . . . . . . . . . . . (7,381) (7,305) (6,556)
Total stock-based compensation, net of tax . . . . . . . . . . . . . . . . . . . . . . . . . . . . . . . $32,282 $31,305 $25,362
101
The shareholders of the Company approved the Company’s 2015 Stock Award and Incentive Plan (the“2015 Plan”) on May 6, 2015. The 2015 Plan replaced the Company’s 2010 Stock Award and Incentive Plan (the“2010 Plan”) and provides the source for future deferrals of cash into deferred stock under the Company’sDeferred Compensation Plan (with the Deferred Compensation Plan being deemed a subplan under the 2015 Planfor the sole purpose of funding deferrals under the IFF Share Fund).
Under the 2015 Plan, a total of 1,500,000 shares are authorized for issuance in addition to 1,552,694 sharesremaining available under the 2010 plan that were rolled into the 2015 Plan. At December 31, 2020, 986,105shares were subject to outstanding awards and 967,650 shares remained available for future awards under all ofthe Company’s equity award plans, including the 2015 Plan (excluding shares not yet issued under open cycles ofthe Company’s Long-Term Incentive Plan).
The Company offers a Long-Term Incentive Plan (“LTIP”) for senior management. The targeted payout is50% cash and 50% IFF common stock at the end of the three-year cycle.
Up to and including the 2018-2020 cycle, the LTIP awards were earned based upon the achievement of:(i) defined Economic Profit (“EP”) targets (representing approximately one-third of the award value), and (ii) theCompany’s performance ranking of Total Shareholder Return as a percentile of the S&P 500 (“Relative TSR”)(representing approximately two-thirds of the award value). With respect to the 2019-2021 cycle, the LTIPawards are earned based upon the achievement of: (i) Relative TSR targets (now representing one-half of theaward value), and (ii) the Company’s achievement of a defined Leverage Ratio (representing one-half of theaward value). ). For the 2020-2022 cycle, the LTIP awards are earned based on the achievement of: (i) an annualLeverage Ratio for 2020 (representing one-sixth of the award value), (ii) a 2-year cumulative Leverage Ratio for2021-2022 (representing one-third of the award value), and (iii) Relative TSR targets (representing one-half ofthe award value).
EP measures operating profitability after considering (i) all operating costs, (ii) income taxes and (iii) acharge for the capital employed in the business. The Leverage Ratio measures Net debt as compared to a measureprofitability. When the award is granted, 50% of the target dollar value of the award is converted to a number of“notional” shares based on the closing price at the beginning of the cycle. For those shares whose payout is basedon Relative TSR, compensation expense is recognized using a graded-vesting attribution method, whilecompensation expense for the remainder of the performance shares (EP or Leverage Ratio targets for theapplicable cycle) is recognized on a straight-line basis over the vesting period based on the probable outcome ofthe performance condition.
The 2016-2018 cycle concluded at the end of 2018 and an aggregate 25,394 shares of common stock wereissued in March 2019. The 2017-2019 cycle concluded at the end of 2019 and an aggregate 14,579 shares ofcommon stock were issued in March 2020. The 2018-2020 cycle concluded at the end of 2020 and an aggregate7,484 shares of common stock will be issued in March 2021.
In 2006, the Board of Directors approved the Equity Choice Program (the “Program”) for seniormanagement. This program continues under the 2015 Plan. Eligible employees can choose from among threeequity alternatives and will be granted such equity awards up to certain dollar awards depending on theparticipant’s employment grade level. A participant may choose among (1) SSARs, (2) RSUs or (3) PRSUs.
SSARs and Options
SSARs are a contractual right to receive the value, in shares of Company stock, of the appreciation in ourstock price from the grant date to the date the SSARs are exercised by the participant. SSARs granted becomeexercisable on the third anniversary of the grant date and have a maximum term of 7 years. SSARs do not requirea financial investment by the SSARs grantee. Stock options require the participant to pay the exercise price at thetime they exercise their stock options. No stock options were granted in 2020, 2019 or 2018.
102

SSARs and options activity was as follows:
(SHARE AMOUNTS IN THOUSANDS)Shares Subject toSSARs/Options
WeightedAverage Exercise
Price
SSARs/Options
Exercisable
December 31, 2019 . . . . . . . . . . . . . . . . . . . . . . . . . . . . . . . . . . . . . 15 $138.73 1Granted . . . . . . . . . . . . . . . . . . . . . . . . . . . . . . . . . . . . . . . . . . . 27 133.10Exercised . . . . . . . . . . . . . . . . . . . . . . . . . . . . . . . . . . . . . . . . . — —Canceled . . . . . . . . . . . . . . . . . . . . . . . . . . . . . . . . . . . . . . . . . . — —
December 31, 2020 . . . . . . . . . . . . . . . . . . . . . . . . . . . . . . . . . . . . . 42 $135.01 1
The weighted average exercise price of SSARs and options exercisable at December 31, 2020, 2019 and2018 were $118.10, $118.10 and $64.96, respectively.
SSARs and options outstanding at December 31, 2020 was as follows:
Price Range
NumberOutstanding(in thousands)
Weighted AverageRemaining
Contractual Life(in years)
WeightedAverage
Exercise Price
AggregateIntrinsic Value(in thousands)
Over $115 . . . . . . . . . . . . . . . . . . . . . . . . . . . . . . . . 42 5.71 $135.01 $—
SSARs and options exercisable as of December 31, 2020 was as follows:
Price Range
NumberExercisable
(in thousands)
Weighted AverageRemaining
Contractual Life(in years)
WeightedAverage
Exercise Price
AggregateIntrinsic Value(in thousands)
Over $115 . . . . . . . . . . . . . . . . . . . . . . . . . . . . . . . . 1 1.34 $118.10 $—
The total intrinsic value of options/SSARs exercised during 2019 and 2018 totaled $0.2 million and$0.1 million, respectively.
As of December 31, 2020, there was $0.4 million of total unrecognized compensation cost related tonon-vested SSARs granted; such cost is expected to be recognized over a period of 0.9 years.
Restricted Stock Units
The Company has granted RSUs to eligible employees and members of the Board of Directors. Such RSUsare subject to forfeiture if certain conditions are not met. RSUs principally vest 100% at the end of 3 years andcontain no performance criteria provisions. An RSU’s fair value is calculated based on the market price of theCompany’s stock at date of grant, with an adjustment to reflect the fact that such awards do not participate individend rights. The aggregate fair value is amortized to expense ratably over the vesting period.
RSU activity was as follows:
Number of Shares(in thousands)
Weighted AverageGrant Date FairValue Per Share
December 31, 2019 . . . . . . . . . . . . . . . . . . . . . . . . . . . . . . . . . . . . . . . . . . . . . . 497 $130.24Granted . . . . . . . . . . . . . . . . . . . . . . . . . . . . . . . . . . . . . . . . . . . . . . . . . . . 212 121.55Vested . . . . . . . . . . . . . . . . . . . . . . . . . . . . . . . . . . . . . . . . . . . . . . . . . . . . (161) 130.99Forfeited . . . . . . . . . . . . . . . . . . . . . . . . . . . . . . . . . . . . . . . . . . . . . . . . . . (23) 128.29
December 31, 2020 . . . . . . . . . . . . . . . . . . . . . . . . . . . . . . . . . . . . . . . . . . . . . . 525 $126.62
103
The total fair value of RSUs that vested during the year ended December 31, 2020 was $19.5 million.
As of December 31, 2020, there was $26.4 million of total unrecognized compensation cost related tonon-vested RSUs granted under the equity incentive plans; such cost is expected to be recognized over aweighted average period of 1.7 years.
Purchased Restricted Stock and Purchased Restricted Stock Units
In 2014, the grant of awards under the Equity Choice program provided for eligible employees to purchaserestricted shares of IFF common stock and deposit them into an escrow account. For each share deposited inescrow by the eligible employee, the Company matched with a grant of a share of restricted stock or, fornon-U.S. participants, a restricted stock unit. The shares of restricted stock and restricted stock units generallyvest on the third anniversary of the grant date, are subject to continued employment and other specifiedconditions, and pay dividends if and when paid by the Company. Holders of restricted stock have, in mostinstances, all of the rights of stockholders, except that they may not sell, assign, pledge or otherwise encumbersuch shares. The PRSUs provide no such rights. During 2015, the Company modified the program so that allparticipants, including U.S. participants, began to receive a restricted stock unit instead of a share of restrictedstock. Restricted stock units pay dividend equivalents and do not have voting rights.
The following table summarizes the Company’s PRSU activity for the years ended December 31, 2020,2019 and 2018:
(DOLLARS IN MILLIONS) Issued Shares
AggregatePurchasePrice
CoveredShares
2020 . . . . . . . . . . . . . . . . . . . . . . . . . . . . . . . . . . . . . . . . . . . . . . . . . . . . . . . . . . 66,160 $8.7 33,0802019 . . . . . . . . . . . . . . . . . . . . . . . . . . . . . . . . . . . . . . . . . . . . . . . . . . . . . . . . . . 61,991 8.5 30,9962018 . . . . . . . . . . . . . . . . . . . . . . . . . . . . . . . . . . . . . . . . . . . . . . . . . . . . . . . . . . 66,674 9.3 33,337
PRSU activity was as follows:
(SHARE AMOUNTS IN THOUSANDS)Number ofShares
Weighted AverageGrant Date FairValue Per Share
December 31, 2019 . . . . . . . . . . . . . . . . . . . . . . . . . . . . . . . . . . . . . . . . . . . . . . . . . . . 168 $138.96Granted . . . . . . . . . . . . . . . . . . . . . . . . . . . . . . . . . . . . . . . . . . . . . . . . . . . . . . . . 66 131.31Vested . . . . . . . . . . . . . . . . . . . . . . . . . . . . . . . . . . . . . . . . . . . . . . . . . . . . . . . . . (41) 138.83Forfeited . . . . . . . . . . . . . . . . . . . . . . . . . . . . . . . . . . . . . . . . . . . . . . . . . . . . . . . — —
December 31, 2020 . . . . . . . . . . . . . . . . . . . . . . . . . . . . . . . . . . . . . . . . . . . . . . . . . . . 193 $136.37
The total fair value of PRSUs that vested during the year ended December 31, 2020 was $4.0 million.
As of December 31, 2020, there was $10.1 million of total unrecognized compensation cost related tonon-vested PRSUs granted under the equity incentive plans; such cost is expected to be recognized over aweighted average period of 1.6 years.
Liability Awards
The Company has granted cash-settled RSUs (“Cash RSUs”) to eligible employees that are paid out 100%in cash upon vesting. Such RSUs are subject to forfeiture if certain conditions are not met. Cash RSUsprincipally vest 100% at the end of three years and contain no performance criteria provisions. A Cash RSU’sfair value is calculated based on the market price of the Company’s stock at the date of the closing period and isaccounted for as a liability award. The aggregate fair value is amortized to expense ratably over the vestingperiod.
104

Cash RSU activity was as follows:
(SHARE AMOUNTS IN THOUSANDS) Cash RSUsWeighted Average Fair
Value Per Share
December 31, 2019 . . . . . . . . . . . . . . . . . . . . . . . . . . . . . . . . . . . . . . . . . . . . . . . 95 $126.35Granted . . . . . . . . . . . . . . . . . . . . . . . . . . . . . . . . . . . . . . . . . . . . . . . . . . . . . 50 108.84Vested . . . . . . . . . . . . . . . . . . . . . . . . . . . . . . . . . . . . . . . . . . . . . . . . . . . . . (30) 131.93Forfeited . . . . . . . . . . . . . . . . . . . . . . . . . . . . . . . . . . . . . . . . . . . . . . . . . . . . (4) 120.15
December 31, 2020 . . . . . . . . . . . . . . . . . . . . . . . . . . . . . . . . . . . . . . . . . . . . . . . 111 $108.84
The total fair value of Cash RSUs that vested during the year ended December 31, 2020 was $3.8 million.
As of December 31, 2020, there was $5.5 million of total unrecognized compensation cost related tonon-vested Cash RSUs granted under the equity incentive plans; such cost is expected to be recognized over aweighted average period of 1.9 years. The aggregate compensation cost will be adjusted based on changes in theCompany’s stock price.
NOTE 15. SEGMENT INFORMATION
During the first quarter of 2020, the Company reorganized its reporting structure and combined substantiallyall of the components of the former Frutarom reportable operating segment into the former Taste reportableoperating segment. Prior year amounts have been recast to conform to the current year reporting structure. As aresult of the reorganization, the Company is organized into two reportable operating segments, Taste and Scent;these segments align with the internal structure used to manage these businesses.
Taste is comprised of a diversified portfolio across flavor compounds, savory solutions, inclusions andnutrition and specialty ingredients. Flavor compounds provide unique flavors that are ultimately used by IFF’scustomers in savory products, beverages, sweets, and dairy products. Savory solutions include marinades orpowder blends of flavors, natural colors, seasonings, functional ingredients and natural anti-oxidants that areprimarily designed for the meat and fish industry. Inclusions provide taste and texture by, among other things,combining flavorings with fruit, vegetables, and other natural ingredients for a wide range of food products, suchas health snacks, baked goods, cereals, pastries, ice cream and other dairy products. Nutrition and specialtyingredients primarily consist of natural health ingredients, natural food protection, natural colors and flavoringredients. The flavor ingredients market includes natural flavor extracts, specialty botanical extracts, distillates,essential oils, citrus products, aroma chemicals, and natural gums and resins. Such ingredients are used for food,beverage, and flavors and are often sold directly to food and beverage manufacturers who use them in producingconsumer products.
Scent is comprised of (1) Fragrance Compounds, which are ultimately used by our customers in two broadcategories: Fine Fragrances, including perfumes and colognes, and Consumer Fragrances, including fragrancecompounds for personal care (e.g., soaps), household products (e.g., detergents and cleaning agents) and beautycare, including toiletries; (2) Fragrance Ingredients, consisting of synthetic and natural ingredients that can becombined with other materials to create unique fine fragrance and consumer compounds; and (3) CosmeticActive Ingredients, consisting of active and functional ingredients, botanicals and delivery systems to support ourcustomers’ cosmetic and personal care product lines. Major fragrance customers include the cosmetics industry,including perfume and toiletries manufacturers, and the household products industry, including manufacturers ofsoaps, detergents, fabric care, household cleaners and air fresheners.
The Company’s Chief Operating Decision Maker evaluates the performance of these reportable operatingsegments based on segment profit which is defined as operating profit before restructuring, global expenses (asdiscussed below) and certain non-recurring items, Interest expense, Other income (expense), net and Taxes onincome.
105
The Global expenses caption represents corporate and headquarter-related expenses which include legal,finance, human resources, certain incentive compensation expenses and other R&D and administrative expensesthat are not allocated to individual reportable operating segments.
Reportable segment information is as follows:
December 31,
(DOLLARS IN THOUSANDS) 2020 2019 2018
Net salesTaste . . . . . . . . . . . . . . . . . . . . . . . . . . . . . . . . . . . . . . . . . . . . . . . $3,109,781 $3,200,520 $2,091,635Scent . . . . . . . . . . . . . . . . . . . . . . . . . . . . . . . . . . . . . . . . . . . . . . . 1,974,458 1,939,564 1,885,904
Consolidated . . . . . . . . . . . . . . . . . . . . . . . . . . . . . . . . . . . . . $5,084,239 $5,140,084 $3,977,539
December 31,
(DOLLARS IN THOUSANDS) 2020 2019
Segment assetsTaste . . . . . . . . . . . . . . . . . . . . . . . . . . . . . . . . . . . . . . . . . . . . . . . $10,356,936 $10,319,779Scent . . . . . . . . . . . . . . . . . . . . . . . . . . . . . . . . . . . . . . . . . . . . . . . 3,056,211 2,757,491Global assets . . . . . . . . . . . . . . . . . . . . . . . . . . . . . . . . . . . . . . . . . 142,524 210,141
Consolidated . . . . . . . . . . . . . . . . . . . . . . . . . . . . . . . . . . . . . $13,555,671 $13,287,411
December 31,
(DOLLARS IN THOUSANDS) 2020 2019 2018
Segment profit:Taste . . . . . . . . . . . . . . . . . . . . . . . . . . . . . . . . . . . . . . . . . . . . . . . $436,387 $ 482,394 $ 419,264Scent . . . . . . . . . . . . . . . . . . . . . . . . . . . . . . . . . . . . . . . . . . . . . . . 357,281 349,445 325,901
Global expenses . . . . . . . . . . . . . . . . . . . . . . . . . . . . . . . . . . . . . . . . . . . (63,982) (38,759) (67,799)Operational Improvement Initiatives (a) . . . . . . . . . . . . . . . . . . . . . . . . — (2,267) (2,169)Acquisition Related Costs (b) . . . . . . . . . . . . . . . . . . . . . . . . . . . . . . . . . — — 1,289Frutarom Integration Related Costs (c) . . . . . . . . . . . . . . . . . . . . . . . . . (9,849) (55,160) (7,188)Restructuring and Other Charges, net (d) . . . . . . . . . . . . . . . . . . . . . . . . (17,295) (29,765) (4,086)(Losses) gains on Sale of Assets . . . . . . . . . . . . . . . . . . . . . . . . . . . . . . (3,784) (2,367) 1,177Employee Separation Costs (e) . . . . . . . . . . . . . . . . . . . . . . . . . . . . . . . . (2,813) — —FDA Mandated Product Recall (f) . . . . . . . . . . . . . . . . . . . . . . . . . . . . . — (250) 7,125Frutarom Acquisition Related Costs (g) . . . . . . . . . . . . . . . . . . . . . . . . . (1,465) (5,940) (89,632)Compliance Review & Legal Defense Costs (h) . . . . . . . . . . . . . . . . . . (3,278) (11,314) —N&B Transaction Related Costs (i) . . . . . . . . . . . . . . . . . . . . . . . . . . . . (28,100) (20,747) —N&B Integration Related Costs (j) . . . . . . . . . . . . . . . . . . . . . . . . . . . . . (96,618) — —
Operating Profit . . . . . . . . . . . . . . . . . . . . . . . . . . . . . . . . . . . . . . . . . . . 566,484 665,270 583,882
Interest expense . . . . . . . . . . . . . . . . . . . . . . . . . . . . . . . . . . . . . . . . . . . (131,802) (138,221) (132,558)Loss on extinguishment of debt . . . . . . . . . . . . . . . . . . . . . . . . . . . . . . — — (38,810)Other income, net . . . . . . . . . . . . . . . . . . . . . . . . . . . . . . . . . . . . . . . . . 6,689 30,403 35,243
Income before taxes . . . . . . . . . . . . . . . . . . . . . . . . . . . . . . . . . . . . . . . $441,371 $ 557,452 $ 447,757
Profit margin:Taste . . . . . . . . . . . . . . . . . . . . . . . . . . . . . . . . . . . . . . . . . . . . . . . 14.0% 15.1% 20.0%Scent . . . . . . . . . . . . . . . . . . . . . . . . . . . . . . . . . . . . . . . . . . . . . . . 18.1% 18.0% 17.3%Consolidated . . . . . . . . . . . . . . . . . . . . . . . . . . . . . . . . . . . . . . . . . 11.1% 12.9% 14.7%
(a) Represents accelerated depreciation related to plant relocations in India and China.
106

(b) Represents adjustments to the fair value for an equity method investment in Canada which we beganconsolidating in the second quarter of 2019.
(c) Represents costs related to the integration of the Frutarom acquisition. For 2020, costs primarily related toadvisory services, retention bonuses and performance stock awards. For 2019, costs principally related toadvisory services.
(d) For 2020, represents costs primarily related to the Frutarom Integration Initiative. For 2019, represents costsprimarily related to the Frutarom Integration Initiative and the 2019 Severance Program.
(e) Represents costs related to severance liabilities for two executives who have announced their retirement.(f) Represents additional claims that management paid to co-packers.(g) Represents transaction-related costs and expenses related to the acquisition of Frutarom. For 2020, amount
primarily includes earn-out payments, net of adjustments, amortization for inventory “step-up” costs andtransaction costs principally related to the 2019 Acquisition Activity. For 2019, amount primarily includesamortization for inventory “step-up” costs and transaction costs.
(h) Costs related to reviewing the nature of inappropriate payments and review of compliance in certain othercountries. In addition, includes legal costs for related shareholder lawsuits.
(i) Represents transaction costs and expenses related to the transaction with N&B, principally related to legaland professional fees for capital raising activities.
(j) Represents costs primarily related to advisory services for the integration of the transaction with N&B,principally consulting fees.
The Company has not disclosed revenues at a lower level than provided herein, such as revenues fromexternal customers by product, as it is impracticable for it to do so.
The Company had no customers that accounted for greater than 10% of consolidated net sales in 2020, 2019and 2018. The Company’s largest customer had net sales of $342.2 million, $336.1 million and $356.8 million in2020, 2019 and 2018, respectively. The majority of these sales were in the Scent reportable operating segment.
Long-lived assets, net, by country, consisted as follows:
December 31,
(DOLLARS IN THOUSANDS) 2020 2019
United States . . . . . . . . . . . . . . . . . . . . . . . . . . . . . . . . . . . . . . . . . . . . . . . . . . . . . . . . . . $ 389,335 $ 382,659Netherlands . . . . . . . . . . . . . . . . . . . . . . . . . . . . . . . . . . . . . . . . . . . . . . . . . . . . . . . . . . . 88,090 91,313Singapore . . . . . . . . . . . . . . . . . . . . . . . . . . . . . . . . . . . . . . . . . . . . . . . . . . . . . . . . . . . . . 63,446 68,751China . . . . . . . . . . . . . . . . . . . . . . . . . . . . . . . . . . . . . . . . . . . . . . . . . . . . . . . . . . . . . . . . 172,442 188,194Other . . . . . . . . . . . . . . . . . . . . . . . . . . . . . . . . . . . . . . . . . . . . . . . . . . . . . . . . . . . . . . . . 744,872 656,003
Consolidated . . . . . . . . . . . . . . . . . . . . . . . . . . . . . . . . . . . . . . . . . . . . . . . . . . . . . . $1,458,185 $1,386,920
Segment capital expenditures and depreciation and amortization consisted as follows:
Capital Expenditures Depreciation and Amortization
(DOLLARS IN THOUSANDS) 2020 2019 2018 2020 2019 2018
Taste . . . . . . . . . . . . . . . . . . . . . . . . . . . . . $107,322 $135,421 $ 82,712 $244,704 $247,791 $101,224Scent . . . . . . . . . . . . . . . . . . . . . . . . . . . . . 77,192 92,279 82,400 73,801 69,225 65,066Global assets . . . . . . . . . . . . . . . . . . . . . . . 7,280 8,278 4,982 6,855 6,314 7,502
Consolidated . . . . . . . . . . . . . . . . . . . $191,794 $235,978 $170,094 $325,360 $323,330 $173,792
107
Net sales are attributed to individual regions based upon the destination of product delivery and are asfollows:
Net Sales by Geographic Area
(DOLLARS IN THOUSANDS) 2020 2019 2018
Europe, Africa and Middle East . . . . . . . . . . . . . . . . . . . . . . . . . . . . . . . . $1,987,398 $2,081,758 $1,396,316Greater Asia . . . . . . . . . . . . . . . . . . . . . . . . . . . . . . . . . . . . . . . . . . . . . . . . 1,161,660 1,162,992 991,015North America . . . . . . . . . . . . . . . . . . . . . . . . . . . . . . . . . . . . . . . . . . . . . . 1,228,243 1,170,497 1,010,126Latin America . . . . . . . . . . . . . . . . . . . . . . . . . . . . . . . . . . . . . . . . . . . . . . 706,938 724,837 580,082
Consolidated . . . . . . . . . . . . . . . . . . . . . . . . . . . . . . . . . . . . . . . . . . . $5,084,239 $5,140,084 $3,977,539
Net Sales by Geographic Area
(DOLLARS IN THOUSANDS) 2020 2019 2018
Net sales related to the U.S. . . . . . . . . . . . . . . . . . . . . . . . . . . . . . . . . . . . $1,093,031 $1,052,654 $ 952,550Net sales attributed to all foreign countries . . . . . . . . . . . . . . . . . . . . . . . . 3,991,208 4,087,430 3,024,989
No non-U.S. country had net sales in any period presented greater than 6% of total consolidated net sales.
NOTE 16. EMPLOYEE BENEFITS
The Company has pension and/or other retirement benefit plans covering approximately one-fifth of activeemployees. In 2007, the Company amended its U.S. qualified and non-qualified pension plans under whichaccrual of future benefits was suspended for all participants that did not meet the rule of 70 (age plus years ofservice equal to at least 70 as of December 31, 2007). Pension benefits are generally based on years of serviceand compensation during the final years of employment. Plan assets consist primarily of equity securities andcorporate and government fixed income securities. Substantially all pension benefit costs are funded as accrued;such funding is limited, where applicable, to amounts deductible for income tax purposes. Certain otherretirement benefits are provided by general corporate assets.
The Company sponsors a qualified defined contribution plan covering substantially all U.S. employees.Under this plan, the Company matches 100% of participants’ contributions up to 4% of compensation and 75%of participants’ contributions from over 4% to 8%. Employees that are still eligible to accrue benefits under thepension plans are limited to a 50% match of up to 6% of the participants’ compensation.
In addition to pension benefits, certain health care and life insurance benefits are provided to qualifying U.S.employees upon retirement from IFF. Such coverage is provided through insurance plans with premiums basedon benefits paid. The Company does not generally provide health care or life insurance coverage for retiredemployees of foreign subsidiaries; such benefits are provided in most foreign countries by government-sponsoredplans, and the cost of these programs is not material.
The Company offers a non-qualified Deferred Compensation Plan (“DCP”) for certain key employees andnon-employee directors. Eligible employees and non-employee directors may elect to defer receipt of salary,incentive payments and Board of Directors’ fees into participant-directed investments which are generallyinvested by the Company in individual variable life insurance contracts it owns that are designed to informallyfund savings plans of this nature. The cash surrender value of life insurance is based on the net asset values of theunderlying funds available to plan participants. At December 31, 2020 and December 31, 2019, the ConsolidatedBalance Sheet reflects liabilities of $58.8 million and $50.9 million, respectively, related to the DCP in Otherliabilities and $28.6 million and $28.2 million, respectively, included in Capital in excess of par value related tothe portion of the DCP that will be paid out in IFF shares.
The total cash surrender value of life insurance contracts the Company owns in relation to the DCP andpost-retirement life insurance benefits amounted to $49.4 million and $47.6 million at December 31, 2020 and2019, respectively, and are recorded in Other assets in the Consolidated Balance Sheet.
108

The plan assets and benefit obligations of the defined benefit pension plans are measured at December 31 ofeach year.
U.S. Plans Non-U.S. Plans
(DOLLARS IN THOUSANDS) 2020 2019 2018 2020 2019 2018
Components of net periodic benefit costService cost for benefits earned(1) . . . . . $ 1,283 $ 1,378 $ 1,971 $ 23,952 $ 19,319 $ 18,738Interest cost on projected benefitobligation(2) . . . . . . . . . . . . . . . . . . . . 17,261 21,954 19,393 12,767 17,775 17,704
Expected return on plan assets(2) . . . . . . (28,322) (27,927) (30,994) (45,919) (43,480) (50,546)Net amortization of deferrals(2) . . . . . . . 7,939 5,464 6,592 15,322 11,654 11,798Settlements and curtailments(2) . . . . . . . — — — 4,473 189 —
Net periodic benefit cost . . . . . . . . . . . . (1,839) 869 (3,038) 10,595 5,457 (2,306)Defined contribution and otherretirement plans . . . . . . . . . . . . . . . . . 12,428 9,363 10,527 7,344 9,001 6,859
Total expense . . . . . . . . . . . . . . . . . $ 10,589 $ 10,232 $ 7,489 $ 17,939 $ 14,458 $ 4,553
Changes in plan assets and benefitobligations recognized in OCINet actuarial (gain) loss . . . . . . . . . . . . $ (1,204) $ (3,140) $ 69,945 $ 61,865Recognized actuarial loss . . . . . . . . . . . (7,883) (5,421) (20,437) (12,479)Prior service cost . . . . . . . . . . . . . . . . . . 102 — 367 —Recognized prior service (cost)credit . . . . . . . . . . . . . . . . . . . . . . . . . (56) (43) 642 636
Currency translation adjustment . . . . . . — — 27,605 6,584
Total (gain) loss recognized inOCI (before tax effects) . . . . . . $ (9,041) $ (8,604) $ 78,122 $ 56,606
(1) Included as a component of Operating Profit.(2) Included as a component of Other Income (Expense), net.
Postretirement Benefits
(DOLLARS IN THOUSANDS) 2020 2019 2018
Components of net periodic benefit costService cost for benefits earned . . . . . . . . . . . . . . . . . . . . . . . . . . . . . . . . . . . . . $ 603 $ 568 $ 755Interest cost on projected benefit obligation . . . . . . . . . . . . . . . . . . . . . . . . . . . 1,781 2,265 2,460Net amortization and deferrals . . . . . . . . . . . . . . . . . . . . . . . . . . . . . . . . . . . . . . (4,655) (4,919) (5,497)
Total credit . . . . . . . . . . . . . . . . . . . . . . . . . . . . . . . . . . . . . . . . . . . . . . . . . $(2,271) $(2,086) $(2,282)
Changes in plan assets and benefit obligations recognized in OCINet actuarial loss . . . . . . . . . . . . . . . . . . . . . . . . . . . . . . . . . . . . . . . . . . . . . . . . $ 4,944 $ 3,941Recognized actuarial loss . . . . . . . . . . . . . . . . . . . . . . . . . . . . . . . . . . . . . . . . . . (1,309) (1,132)Recognized prior service credit . . . . . . . . . . . . . . . . . . . . . . . . . . . . . . . . . . . . . 5,964 6,051
Total recognized in OCI (before tax effects) . . . . . . . . . . . . . . . . . . . . . . . $ 9,599 $ 8,860
109
The weighted-average actuarial assumptions used to determine expense at December 31 of each year are:
U.S. Plans Non-U.S. Plans
2020 2019 2018 2020 2019 2018
Discount rate . . . . . . . . . . . . . . . . . . . . . . . . . . . . . . . . . . . . . . . . . 3.26% 4.31% 3.69% 1.49% 2.22% 2.15%Expected return on plan assets . . . . . . . . . . . . . . . . . . . . . . . . . . . 5.60% 5.60% 6.20% 4.62% 4.87% 5.19%Rate of compensation increase . . . . . . . . . . . . . . . . . . . . . . . . . . . 3.25% 3.25% 3.25% 2.46% 1.93% 1.98%
Changes in the postretirement benefit obligation and plan assets, as applicable, are detailed in the followingtable:
U.S. Plans Non-U.S. PlansPostretirement
Benefits
(DOLLARS IN THOUSANDS) 2020 2019 2020 2019 2020 2019
Benefit obligation at beginning ofyear . . . . . . . . . . . . . . . . . . . . . . . . . . . $620,654 $562,043 $1,099,084 $ 957,935 $64,174 $59,625
Service cost for benefits earned . . . . . . . 1,283 1,378 23,952 19,319 603 568Interest cost on projected benefitobligation . . . . . . . . . . . . . . . . . . . . . . . 17,261 21,954 12,767 17,775 1,781 2,265
Actuarial (gain) loss . . . . . . . . . . . . . . . . 76,749 68,839 108,945 119,891 4,944 3,941Plan amendments . . . . . . . . . . . . . . . . . . . 102 — 367 — — —Adjustments for expense/tax containedin service cost . . . . . . . . . . . . . . . . . . . — — (1,293) (1,333) — —
Plan participants’ contributions . . . . . . . . — — 2,848 2,803 374 437Benefits paid . . . . . . . . . . . . . . . . . . . . . . (34,402) (33,560) (27,822) (28,977) (3,241) (2,662)Curtailments / settlements . . . . . . . . . . . . — — (11,125) (3,455) — —Translation adjustments . . . . . . . . . . . . . — — 85,774 13,935 — —Other . . . . . . . . . . . . . . . . . . . . . . . . . . . . (24) — 747 1,191 — —
Benefit obligation at end of year . . . $681,623 $620,654 $1,294,244 $1,099,084 $68,635 $64,174
Fair value of plan assets at beginning ofyear . . . . . . . . . . . . . . . . . . . . . . . . . . . $602,408 $532,381 $1,005,283 $ 896,782
Actual return on plan assets . . . . . . . . . . 106,255 99,904 83,625 100,163Employer contributions . . . . . . . . . . . . . . 3,710 3,683 21,123 20,031Participants’ contributions . . . . . . . . . . . — — 2,848 2,803Benefits paid . . . . . . . . . . . . . . . . . . . . . . (34,402) (33,560) (27,822) (28,977)Settlements . . . . . . . . . . . . . . . . . . . . . . . — — (11,125) (3,455)Translation adjustments . . . . . . . . . . . . . — — 70,282 16,982Other . . . . . . . . . . . . . . . . . . . . . . . . . . . . 58 — 748 954
Fair value of plan assets at end ofyear . . . . . . . . . . . . . . . . . . . . . . . $678,029 $602,408 $1,144,962 $1,005,283
Funded status at end of year . . $ (3,594) $ (18,246) $ (149,282) $ (93,801)
The amounts recognized in the balance sheet are detailed in the following table:
U.S. Plans Non-U.S. Plans
(DOLLARS IN THOUSANDS) 2020 2019 2020 2019
Other assets . . . . . . . . . . . . . . . . . . . . . . . . . . . . . . . . . . . . . . . . . . $ 54,330 $ 35,239 $ 46,913 $ 50,418Other current liabilities . . . . . . . . . . . . . . . . . . . . . . . . . . . . . . . . . (4,260) (4,193) (1,357) (1,179)Retirement liabilities . . . . . . . . . . . . . . . . . . . . . . . . . . . . . . . . . . . (53,664) (49,292) (194,838) (143,040)
Net amount recognized . . . . . . . . . . . . . . . . . . . . . . . . . . . . . $ (3,594) $(18,246) $(149,282) $ (93,801)
110

The amounts recognized in AOCI are detailed in the following table:
U.S. Plans Non-U.S. PlansPostretirement
Benefits
(DOLLARS IN THOUSANDS) 2020 2019 2020 2019 2020 2019
Net actuarial loss . . . . . . . . . . . . . . . . . . . . $133,741 $142,828 $454,420 $376,991 $ 19,071 $ 15,436Prior service cost (credit) . . . . . . . . . . . . . . 154 108 (2,474) (3,087) (21,174) (27,138)
Total AOCI (before tax effects) . . . . . $133,895 $142,936 $451,946 $373,904 $ (2,103) $(11,702)
U.S. Plans Non-U.S. Plans
(DOLLARS IN THOUSANDS) 2020 2019 2020 2019
Accumulated Benefit Obligation — end of year . . . . . . . . . . . . $679,957 $618,486 $1,243,461 $1,062,515
Information for Pension Plans with an ABO in excess ofPlan Assets:
Projected benefit obligation . . . . . . . . . . . . . . . . . . . . . . . $ 60,313 $ 55,714 $ 813,026 $ 656,574Accumulated benefit obligation . . . . . . . . . . . . . . . . . . . . 60,012 55,671 762,308 620,087Fair value of plan assets . . . . . . . . . . . . . . . . . . . . . . . . . . 2,389 2,229 616,830 512,356
Weighted-average assumptions used to determine obligationsat December 31Discount rate . . . . . . . . . . . . . . . . . . . . . . . . . . . . . . . . . . . 2.51% 3.26% 0.85% 1.50%
Rate of compensation increase . . . . . . . . . . . . . . . . . . . . . . . . . 3.25% 3.25% 2.55% 2.48%
(DOLLARS IN THOUSANDS) U.S. Plans Non-U.S. PlansPostretirement
Benefits
Estimated Future Benefit Payments2021 . . . . . . . . . . . . . . . . . . . . . . . . . . . . . . . . . . . . . . . . . . . . . . . . . $ 38,308 $ 29,364 $ 3,7372022 . . . . . . . . . . . . . . . . . . . . . . . . . . . . . . . . . . . . . . . . . . . . . . . . . 38,888 29,406 3,7482023 . . . . . . . . . . . . . . . . . . . . . . . . . . . . . . . . . . . . . . . . . . . . . . . . . 39,373 30,150 3,7352024 . . . . . . . . . . . . . . . . . . . . . . . . . . . . . . . . . . . . . . . . . . . . . . . . . 39,761 31,243 3,8402025 . . . . . . . . . . . . . . . . . . . . . . . . . . . . . . . . . . . . . . . . . . . . . . . . . 39,552 32,774 3,9002026 - 2030 . . . . . . . . . . . . . . . . . . . . . . . . . . . . . . . . . . . . . . . . . . . 192,040 180,230 19,351
ContributionsRequired Company Contributions in Following Year (2021) . . . . $ 4,364 $ 24,964 $ 3,737
The Company considers a number of factors in determining and selecting assumptions for the overallexpected long-term rate of return on plan assets. The Company considers the historical long-term returnexperience of its assets, the current and expected allocation of its plan assets and expected long-term rates ofreturn. The Company derives these expected long-term rates of return with the assistance of its investmentadvisors. The Company bases its expected allocation of plan assets on a diversified portfolio consisting ofdomestic and international equity securities, fixed income, real estate and alternative asset classes. The assetallocation is monitored on an ongoing basis.
The Company considers a variety of factors in determining and selecting its assumptions for the discountrate at December 31. For the U.S. plans, the discount rate was based on the internal rate of return for a portfolioof high quality bonds rated Aa or higher by either Moody’s or Standard & Poor’s with maturities that areconsistent with the projected future benefit payment obligations of the plan. For the Non-U.S. Plans, the discountrates were determined by region and are based on high quality long-term corporate bonds. Consideration hasbeen given to the duration of the liabilities in each plan when selecting the bonds to be used in determining thediscount rate. The rate of compensation increase for all plans and the medical cost trend rate for the applicableU.S. plans are based on plan experience.
111
The percentage of assets in the Company’s pension plans, by type, is as follows:
U.S. Plans Non-U.S. Plans
2020 2019 2020 2019
Cash and cash equivalents . . . . . . . . . . . . . . . . . . . . . . . . . . . . . . . . . . . . . . . . . . . . . . . 1% 1% 3% 1%Equities . . . . . . . . . . . . . . . . . . . . . . . . . . . . . . . . . . . . . . . . . . . . . . . . . . . . . . . . . . . . . 29% 13% 10% 14%Fixed income . . . . . . . . . . . . . . . . . . . . . . . . . . . . . . . . . . . . . . . . . . . . . . . . . . . . . . . . . 70% 86% 38% 37%Property . . . . . . . . . . . . . . . . . . . . . . . . . . . . . . . . . . . . . . . . . . . . . . . . . . . . . . . . . . . . . —% —% 8% 8%Alternative and other investments . . . . . . . . . . . . . . . . . . . . . . . . . . . . . . . . . . . . . . . . . —% —% 41% 40%
With respect to the U.S. plans, the expected return on plan assets was determined based on an assetallocation model using the current target allocation, real rates of return by asset class and an anticipated inflationrate. The target investment allocation is 20% equity securities and 80% fixed income securities.
The expected annual rate of return for the non-U.S. plans employs a similar set of criteria adapted for localinvestments, inflation rates and in certain cases specific government requirements. The target asset allocation, forthe non-U.S. plans, consists of approximately: 35% in fixed income securities; 35% in alternative investments;15% in equity securities; and 15% in real estate.
The following tables present the Company’s plan assets for the U.S. and non-U.S. plans using the fair valuehierarchy as of December 31, 2020 and 2019. The plans’ assets were accounted for at fair value and are classifiedin their entirety based on the lowest level of input that is significant to the fair value measurement. TheCompany’s assessment of the significance of a particular input to the fair value measurement requires judgment,and may affect the valuation of fair value assets and their placement within the fair value hierarchy levels. Formore information on a description of the fair value hierarchy, see Note 17.
U.S. Plans for the Year EndedDecember 31, 2020
(DOLLARS IN THOUSANDS) Level 1 Level 2 Level 3 Total
Cash Equivalents . . . . . . . . . . . . . . . . . . . . . . . . . . . . . . . . . . . . . . . . . . . $— $ 3,799 $— $ 3,799Fixed Income Securities
Government & Government Agency Bonds . . . . . . . . . . . . . . . . . . . — 19,002 — 19,002Corporate Bonds . . . . . . . . . . . . . . . . . . . . . . . . . . . . . . . . . . . . . . . . — 104,064 — 104,064Municipal Bonds . . . . . . . . . . . . . . . . . . . . . . . . . . . . . . . . . . . . . . . . — 6,480 — 6,480
Assets measured at net asset value(1) . . . . . . . . . . . . . . . . . . . . . . . . . . . . — — — 543,687
Total . . . . . . . . . . . . . . . . . . . . . . . . . . . . . . . . . . . . . . . . . . . . . $— $133,345 $— $677,032
Receivables . . . . . . . . . . . . . . . . . . . . . . . . . . . . . . . . . . . . . . . . . . . . $ 997
Total . . . . . . . . . . . . . . . . . . . . . . . . . . . . . . . . . . . . . . . . . . . . . $678,029
112

U.S. Plans for the Year EndedDecember 31, 2019
(DOLLARS IN THOUSANDS) Level 1 Level 2 Level 3 Total
Cash Equivalents . . . . . . . . . . . . . . . . . . . . . . . . . . . . . . . . . . . . . . . . . . . $— $ 4,431 $— $ 4,431Fixed Income Securities
Government & Government Agency Bonds . . . . . . . . . . . . . . . . . . . — 19,427 — 19,427Corporate Bonds . . . . . . . . . . . . . . . . . . . . . . . . . . . . . . . . . . . . . . . . — 112,137 — 112,137Municipal Bonds . . . . . . . . . . . . . . . . . . . . . . . . . . . . . . . . . . . . . . . . — 8,460 — 8,460
Assets measured at net asset value(1) . . . . . . . . . . . . . . . . . . . . . . . . . . . . — — — 456,606
Total . . . . . . . . . . . . . . . . . . . . . . . . . . . . . . . . . . . . . . . . . . . . . $— $144,455 $— $601,061
Receivables . . . . . . . . . . . . . . . . . . . . . . . . . . . . . . . . . . . . . . . . . . . . $ 1,347
Total . . . . . . . . . . . . . . . . . . . . . . . . . . . . . . . . . . . . . . . . . . . . . $602,408
(1) Investments that are measured at fair value using the net asset value per share (or its equivalent) practicalexpedient have not been classified in the fair value hierarchy. The fair value amounts presented in the tableabove are intended to permit reconciliation of the fair value hierarchy to the amounts presented in theConsolidated Balance Sheet. The total amount measured at net asset value includes approximately$200.8 million and $80.4 million in pooled equity funds and $342.9 million and $376.0 million in fixedincome mutual funds for the years ended December 31, 2020 and 2019, respectively.
Non-U.S. Plans for the Year EndedDecember 31, 2020
(DOLLARS IN THOUSANDS) Level 1 Level 2 Level 3 Total
Cash . . . . . . . . . . . . . . . . . . . . . . . . . . . . . . . . . . . . . . . . . . . . . . . $ 12,730 $ 18,864 $ — $ 31,594Equity Securities
U.S. Large Cap . . . . . . . . . . . . . . . . . . . . . . . . . . . . . . . . . . . 57,461 7,557 — 65,018U.S. Mid Cap . . . . . . . . . . . . . . . . . . . . . . . . . . . . . . . . . . . . 5 — — 5Non-U.S. Large Cap . . . . . . . . . . . . . . . . . . . . . . . . . . . . . . . 26,162 — — 26,162Non-U.S. Mid Cap . . . . . . . . . . . . . . . . . . . . . . . . . . . . . . . . 1,213 — — 1,213Non-U.S. Small Cap . . . . . . . . . . . . . . . . . . . . . . . . . . . . . . . 872 — — 872Emerging Markets . . . . . . . . . . . . . . . . . . . . . . . . . . . . . . . . 25,391 — — 25,391
Fixed Income SecuritiesU.S. Treasuries/Government Bonds . . . . . . . . . . . . . . . . . . . 97 — — 97U.S. Corporate Bonds . . . . . . . . . . . . . . . . . . . . . . . . . . . . . . — 43,119 — 43,119Non-U.S. Treasuries/Government Bonds . . . . . . . . . . . . . . . 162,947 — — 162,947Non-U.S. Corporate Bonds . . . . . . . . . . . . . . . . . . . . . . . . . 33,596 138,920 — 172,516Non-U.S. Asset-Backed Securities . . . . . . . . . . . . . . . . . . . . — 50,717 — 50,717Non-U.S. Other Fixed Income . . . . . . . . . . . . . . . . . . . . . . . 2,636 — — 2,636
Alternative Types of InvestmentsInsurance Contracts . . . . . . . . . . . . . . . . . . . . . . . . . . . . . . . — 247,426 274 247,700Derivative Financial Instruments . . . . . . . . . . . . . . . . . . . . . — 91,225 — 91,225Absolute Return Funds . . . . . . . . . . . . . . . . . . . . . . . . . . . . . 4,086 92,785 — 96,871Other . . . . . . . . . . . . . . . . . . . . . . . . . . . . . . . . . . . . . . . . . . . 11,191 2,565 18,837 32,593
Real EstateNon-U.S. Real Estate . . . . . . . . . . . . . . . . . . . . . . . . . . . . . . — — 94,286 94,286
Total . . . . . . . . . . . . . . . . . . . . . . . . . . . . . . . . . . . . . . . $338,387 $693,178 $113,397 $1,144,962
113
Non-U.S. Plans for the Year EndedDecember 31, 2019
(DOLLARS IN THOUSANDS) Level 1 Level 2 Level 3 Total
Cash . . . . . . . . . . . . . . . . . . . . . . . . . . . . . . . . . . . . . . . . . . . . . . . $ 5,921 $ — $ — $ 5,921Equity Securities
U.S. Large Cap . . . . . . . . . . . . . . . . . . . . . . . . . . . . . . . . . . . 58,926 25,616 — 84,542Non-U.S. Large Cap . . . . . . . . . . . . . . . . . . . . . . . . . . . . . . . 24,720 — — 24,720Non-U.S. Mid Cap . . . . . . . . . . . . . . . . . . . . . . . . . . . . . . . . 956 — — 956Non-U.S. Small Cap . . . . . . . . . . . . . . . . . . . . . . . . . . . . . . . 738 — — 738Emerging Markets . . . . . . . . . . . . . . . . . . . . . . . . . . . . . . . . 27,374 — — 27,374
Fixed Income SecuritiesU.S. Treasuries/Government Bonds . . . . . . . . . . . . . . . . . . . 108 — — 108U.S. Corporate Bonds . . . . . . . . . . . . . . . . . . . . . . . . . . . . . . — 32,013 — 32,013Non-U.S. Treasuries/Government Bonds . . . . . . . . . . . . . . . 117,890 — — 117,890Non-U.S. Corporate Bonds . . . . . . . . . . . . . . . . . . . . . . . . . 33,320 150,034 — 183,354Non-U.S. Asset-Backed Securities . . . . . . . . . . . . . . . . . . . . — 33,654 — 33,654Non-U.S. Other Fixed Income . . . . . . . . . . . . . . . . . . . . . . . 2,553 — — 2,553
Alternative Types of InvestmentsInsurance Contracts . . . . . . . . . . . . . . . . . . . . . . . . . . . . . . . — 152,025 266 152,291Derivative Financial Instruments . . . . . . . . . . . . . . . . . . . . . — 65,016 — 65,016Absolute Return Funds . . . . . . . . . . . . . . . . . . . . . . . . . . . . . 3,431 154,463 — 157,894Other . . . . . . . . . . . . . . . . . . . . . . . . . . . . . . . . . . . . . . . . . . . — 2,330 30,183 32,513
Real EstateNon-U.S. Real Estate . . . . . . . . . . . . . . . . . . . . . . . . . . . . . . — — 83,746 83,746
Total . . . . . . . . . . . . . . . . . . . . . . . . . . . . . . . . . . . . . . . $275,937 $615,151 $114,195 $1,005,283
Cash and cash equivalents are primarily held in registered money market funds which are valued using amarket approach based on the quoted market prices of identical instruments. Other cash and cash equivalents arevalued daily by the fund using a market approach with inputs that include quoted market prices for similarinstruments.
Equity securities are primarily valued using a market approach based on the quoted market prices ofidentical instruments. Pooled funds are typically common or collective trusts valued at their net asset values(NAVs).
Fixed income securities are primarily valued using a market approach with inputs that include broker quotesand benchmark yields.
Derivative instruments are valued by the custodian using closing market swap curves and market derivedinputs.
Real estate values are primarily based on valuation of the underlying investments, which include inputs suchas cost, discounted future cash flows, independent appraisals and market comparable data.
Hedge funds are valued based on valuation of the underlying securities and instruments within the funds.Quoted market prices are used when available and NAVs are used for unquoted securities within the funds.
Absolute return funds are actively managed funds mainly invested in debt and equity securities and arevalued at their NAVs.
114
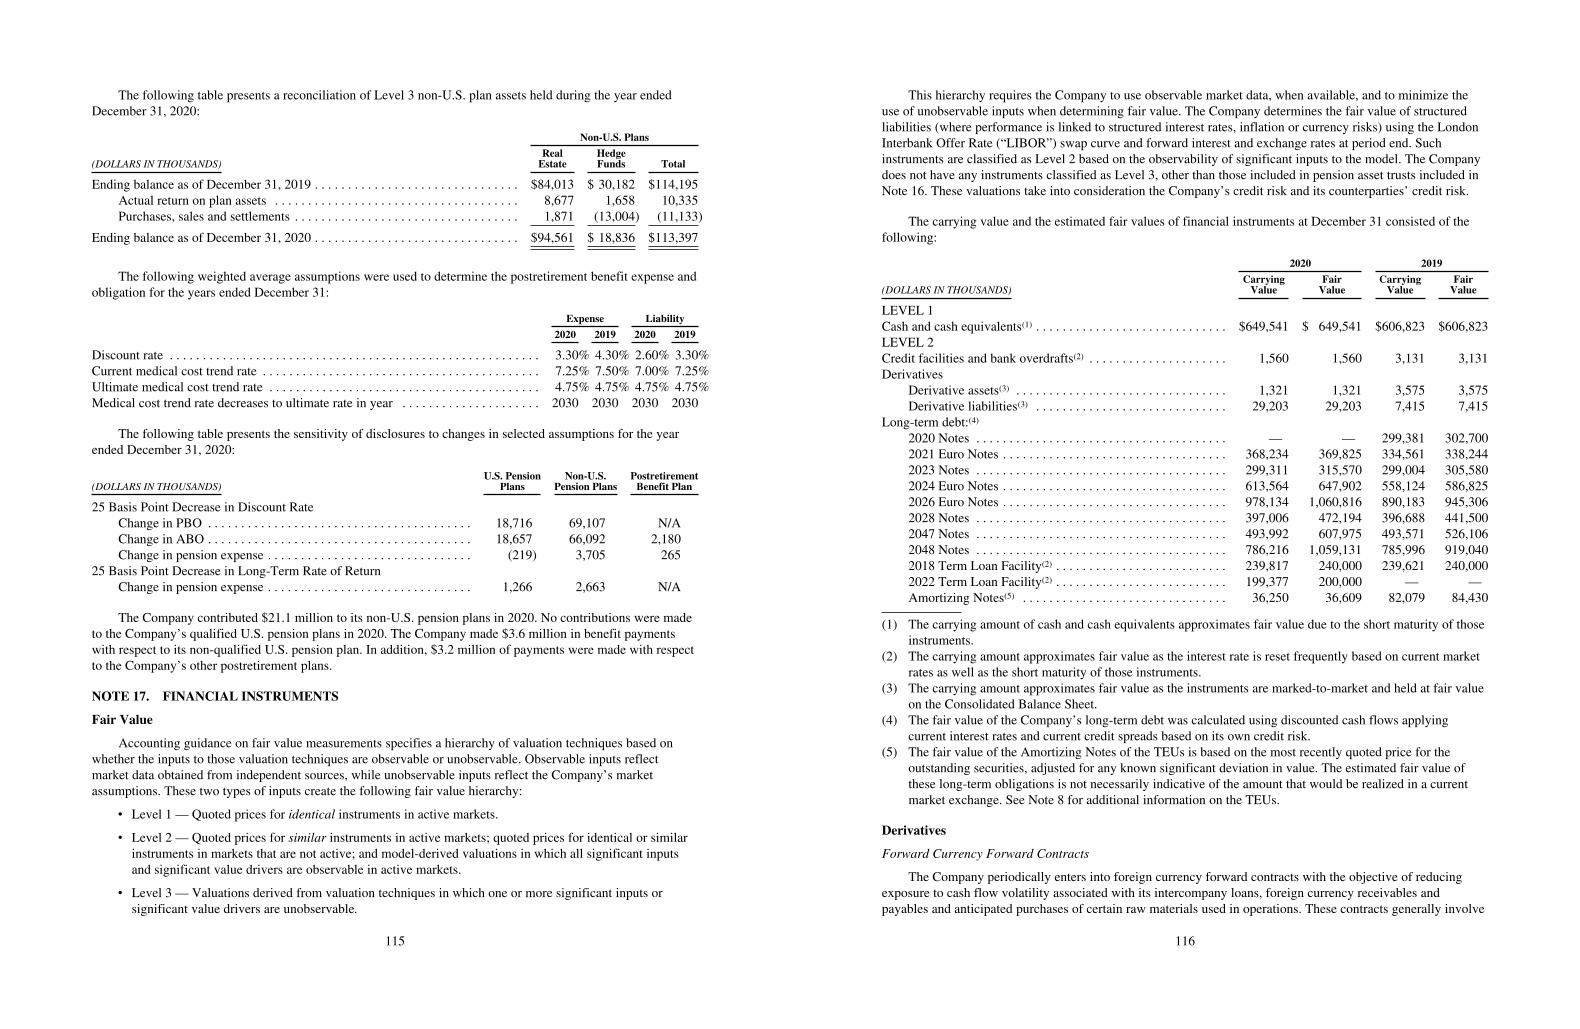
The following table presents a reconciliation of Level 3 non-U.S. plan assets held during the year endedDecember 31, 2020:
Non-U.S. Plans
(DOLLARS IN THOUSANDS)RealEstate
HedgeFunds Total
Ending balance as of December 31, 2019 . . . . . . . . . . . . . . . . . . . . . . . . . . . . . . . $84,013 $ 30,182 $114,195Actual return on plan assets . . . . . . . . . . . . . . . . . . . . . . . . . . . . . . . . . . . . . 8,677 1,658 10,335Purchases, sales and settlements . . . . . . . . . . . . . . . . . . . . . . . . . . . . . . . . . . 1,871 (13,004) (11,133)
Ending balance as of December 31, 2020 . . . . . . . . . . . . . . . . . . . . . . . . . . . . . . . $94,561 $ 18,836 $113,397
The following weighted average assumptions were used to determine the postretirement benefit expense andobligation for the years ended December 31:
Expense Liability
2020 2019 2020 2019
Discount rate . . . . . . . . . . . . . . . . . . . . . . . . . . . . . . . . . . . . . . . . . . . . . . . . . . . . . . . . 3.30% 4.30% 2.60% 3.30%Current medical cost trend rate . . . . . . . . . . . . . . . . . . . . . . . . . . . . . . . . . . . . . . . . . . 7.25% 7.50% 7.00% 7.25%Ultimate medical cost trend rate . . . . . . . . . . . . . . . . . . . . . . . . . . . . . . . . . . . . . . . . . 4.75% 4.75% 4.75% 4.75%Medical cost trend rate decreases to ultimate rate in year . . . . . . . . . . . . . . . . . . . . . 2030 2030 2030 2030
The following table presents the sensitivity of disclosures to changes in selected assumptions for the yearended December 31, 2020:
(DOLLARS IN THOUSANDS)U.S. Pension
PlansNon-U.S.
Pension PlansPostretirementBenefit Plan
25 Basis Point Decrease in Discount RateChange in PBO . . . . . . . . . . . . . . . . . . . . . . . . . . . . . . . . . . . . . . . . 18,716 69,107 N/AChange in ABO . . . . . . . . . . . . . . . . . . . . . . . . . . . . . . . . . . . . . . . . 18,657 66,092 2,180Change in pension expense . . . . . . . . . . . . . . . . . . . . . . . . . . . . . . . (219) 3,705 265
25 Basis Point Decrease in Long-Term Rate of ReturnChange in pension expense . . . . . . . . . . . . . . . . . . . . . . . . . . . . . . . 1,266 2,663 N/A
The Company contributed $21.1 million to its non-U.S. pension plans in 2020. No contributions were madeto the Company’s qualified U.S. pension plans in 2020. The Company made $3.6 million in benefit paymentswith respect to its non-qualified U.S. pension plan. In addition, $3.2 million of payments were made with respectto the Company’s other postretirement plans.
NOTE 17. FINANCIAL INSTRUMENTS
Fair Value
Accounting guidance on fair value measurements specifies a hierarchy of valuation techniques based onwhether the inputs to those valuation techniques are observable or unobservable. Observable inputs reflectmarket data obtained from independent sources, while unobservable inputs reflect the Company’s marketassumptions. These two types of inputs create the following fair value hierarchy:
‰ Level 1 — Quoted prices for identical instruments in active markets.
‰ Level 2 — Quoted prices for similar instruments in active markets; quoted prices for identical or similarinstruments in markets that are not active; and model-derived valuations in which all significant inputsand significant value drivers are observable in active markets.
‰ Level 3 — Valuations derived from valuation techniques in which one or more significant inputs orsignificant value drivers are unobservable.
115
This hierarchy requires the Company to use observable market data, when available, and to minimize theuse of unobservable inputs when determining fair value. The Company determines the fair value of structuredliabilities (where performance is linked to structured interest rates, inflation or currency risks) using the LondonInterbank Offer Rate (“LIBOR”) swap curve and forward interest and exchange rates at period end. Suchinstruments are classified as Level 2 based on the observability of significant inputs to the model. The Companydoes not have any instruments classified as Level 3, other than those included in pension asset trusts included inNote 16. These valuations take into consideration the Company’s credit risk and its counterparties’ credit risk.
The carrying value and the estimated fair values of financial instruments at December 31 consisted of thefollowing:
2020 2019
(DOLLARS IN THOUSANDS)CarryingValue
FairValue
CarryingValue
FairValue
LEVEL 1Cash and cash equivalents(1) . . . . . . . . . . . . . . . . . . . . . . . . . . . . . $649,541 $ 649,541 $606,823 $606,823LEVEL 2Credit facilities and bank overdrafts(2) . . . . . . . . . . . . . . . . . . . . . 1,560 1,560 3,131 3,131Derivatives
Derivative assets(3) . . . . . . . . . . . . . . . . . . . . . . . . . . . . . . . . 1,321 1,321 3,575 3,575Derivative liabilities(3) . . . . . . . . . . . . . . . . . . . . . . . . . . . . . 29,203 29,203 7,415 7,415
Long-term debt:(4)
2020 Notes . . . . . . . . . . . . . . . . . . . . . . . . . . . . . . . . . . . . . . — — 299,381 302,7002021 Euro Notes . . . . . . . . . . . . . . . . . . . . . . . . . . . . . . . . . . 368,234 369,825 334,561 338,2442023 Notes . . . . . . . . . . . . . . . . . . . . . . . . . . . . . . . . . . . . . . 299,311 315,570 299,004 305,5802024 Euro Notes . . . . . . . . . . . . . . . . . . . . . . . . . . . . . . . . . . 613,564 647,902 558,124 586,8252026 Euro Notes . . . . . . . . . . . . . . . . . . . . . . . . . . . . . . . . . . 978,134 1,060,816 890,183 945,3062028 Notes . . . . . . . . . . . . . . . . . . . . . . . . . . . . . . . . . . . . . . 397,006 472,194 396,688 441,5002047 Notes . . . . . . . . . . . . . . . . . . . . . . . . . . . . . . . . . . . . . . 493,992 607,975 493,571 526,1062048 Notes . . . . . . . . . . . . . . . . . . . . . . . . . . . . . . . . . . . . . . 786,216 1,059,131 785,996 919,0402018 Term Loan Facility(2) . . . . . . . . . . . . . . . . . . . . . . . . . . 239,817 240,000 239,621 240,0002022 Term Loan Facility(2) . . . . . . . . . . . . . . . . . . . . . . . . . . 199,377 200,000 — —Amortizing Notes(5) . . . . . . . . . . . . . . . . . . . . . . . . . . . . . . . 36,250 36,609 82,079 84,430
(1) The carrying amount of cash and cash equivalents approximates fair value due to the short maturity of thoseinstruments.
(2) The carrying amount approximates fair value as the interest rate is reset frequently based on current marketrates as well as the short maturity of those instruments.
(3) The carrying amount approximates fair value as the instruments are marked-to-market and held at fair valueon the Consolidated Balance Sheet.
(4) The fair value of the Company’s long-term debt was calculated using discounted cash flows applyingcurrent interest rates and current credit spreads based on its own credit risk.
(5) The fair value of the Amortizing Notes of the TEUs is based on the most recently quoted price for theoutstanding securities, adjusted for any known significant deviation in value. The estimated fair value ofthese long-term obligations is not necessarily indicative of the amount that would be realized in a currentmarket exchange. See Note 8 for additional information on the TEUs.
Derivatives
Forward Currency Forward Contracts
The Company periodically enters into foreign currency forward contracts with the objective of reducingexposure to cash flow volatility associated with its intercompany loans, foreign currency receivables andpayables and anticipated purchases of certain raw materials used in operations. These contracts generally involve
116

the exchange of one currency for a second currency at a future date, have maturities not exceeding twelve monthsand are with counterparties which are major international financial institutions.
Cash Flow Hedges
During the year ended December 31, 2017, the Company entered into several forward currency contractswhich qualified as cash flow hedges. The objective of these hedges is to protect against the currency riskassociated with forecasted U.S. dollar (“USD”) denominated raw material purchases made by Euro (“EUR”)functional currency entities which result from changes in the EUR/USD exchange rate. The effective portions ofcash flow hedges are recorded in OCI as a component of Gains/(Losses) on derivatives qualifying as hedges inthe accompanying Consolidated Statement of Income and Comprehensive Income. Realized gains/(losses) inAOCI related to cash flow hedges of raw material purchases are recognized as a component of Cost of goods soldin the accompanying Consolidated Statement of Income and Comprehensive Income in the same period as therelated costs are recognized.
Hedges Related to Issuances of Debt
Subsequent to the issuance of the 2021 Euro Notes and 2026 Euro Notes during the third quarter of 2018,the Company designated the debt as a hedge of a portion of its net European investments. Accordingly, thechange in the value of the debt that is attributable to foreign exchange movements is recorded in OCI as acomponent of foreign currency translation adjustments in the accompanying Consolidated Statement of Incomeand Comprehensive Income.
Subsequent to the issuance of the 2024 Euro Notes during the first quarter of 2016, the Company designatedthe debt as a hedge of a portion of its net European investments. Accordingly, the change in the value of the debtthat is attributable to foreign exchange movements is recorded in OCI as a component of foreign currencytranslation adjustments in the accompanying Consolidated Statement of Income and Comprehensive Income.
During the first quarter of 2016, the Company entered into and terminated two Euro interest rate swapagreements to hedge the anticipated issuance of fixed-rate debt. These swaps were designated as cash flowhedges. The effective portions of cash flow hedges are recorded in OCI as a component of Losses on derivativesqualifying as hedges in the accompanying Consolidated Statement of Income and Comprehensive Income. TheCompany incurred a loss of €2.9 million ($3.2 million) due to the termination of these swaps. The loss is beingamortized as interest expense over the life of the 2024 Euro Notes as discussed in Note 9.
During the fourth quarter of 2016 and the first quarter of 2017, the Company entered into interest rate swapagreements to hedge the anticipated issuance of fixed-rate debt, which are designated as cash flow hedges. Thevarious hedge instruments were settled upon issuance of the debt on May 18, 2017 and resulted in a loss ofapproximately $5.3 million. As discussed in Note 9, the loss is being amortized as interest expense over the lifeof the 2047 Notes.
Cross Currency Swaps
During the third quarter of 2019, the Company entered into a transaction to unwind the four cross currencyswaps designated as net investment hedges issued in the fourth quarter of 2018 and received proceeds of$33.6 million, including $7.7 of interest income. The gain arising from the termination of the swaps has beenincluded as a component of Accumulated other comprehensive loss. Following the termination of the existingswaps, (during the third quarter of 2019,) the Company entered into four new EUR/USD cross currency swapsthat mature through May 2023. The swaps all qualified as net investment hedges in order to mitigate a portion ofthe Company’s net European investments from foreign currency risk. During the third quarter of 2020, theCompany entered into a transaction to unwind two of the swaps issued in the third quarter of 2019 and paidproceeds of $14.6 million, net of accrued interest receivable of $2.2 million. The loss arising from thetermination of the swaps has been included as a component of accumulated other comprehensive loss. As of
117
December 31, 2020, the two remaining swaps were in a net liability position with an aggregate fair value of$23.4 million which was classified as other current liabilities. Changes in fair value related to cross currencyswaps are recorded in OCI.
The following table shows the notional amount of the Company’s derivative instruments outstanding as ofDecember 31, 2020 and December 31, 2019:
December 31,
(DOLLARS IN THOUSANDS) 2020 2019
Foreign currency contracts . . . . . . . . . . . . . . . . . . . . . . . . . . . . . . . . . . . . . . . . . . . . . . . . . . $220,804 $473,600Cross currency swaps . . . . . . . . . . . . . . . . . . . . . . . . . . . . . . . . . . . . . . . . . . . . . . . . . . . . . . 300,000 600,000
The following tables show the Company’s derivative instruments measured at fair value (Level 2 of the fairvalue hierarchy) as reflected in the Consolidated Balance Sheet as of December 31, 2020 and December 31,2019:
December 31, 2020
(DOLLARS IN THOUSANDS)
Fair Value ofDerivatives
Designated asHedging Instruments
Fair Value ofDerivatives NotDesignated as
Hedging InstrumentsTotal FairValue
Derivative assets(a)
Foreign currency contracts . . . . . . . . . . . . . . . . . . . $ 391 $930 $ 1,321Derivative liabilities(b)
Foreign currency contracts . . . . . . . . . . . . . . . . . . . 5,411 383 5,794Cross currency swaps . . . . . . . . . . . . . . . . . . . . . . . 23,409 — 23,409
Total derivative liabilities . . . . . . . . . . . . . . . . . . . . . . . . $28,820 $383 $29,203
December 31, 2019
(DOLLARS IN THOUSANDS)
Fair Value ofDerivatives
Designated asHedging Instruments
Fair Value ofDerivatives NotDesignated as
Hedging InstrumentsTotal FairValue
Derivative assets(a)
Foreign currency contracts . . . . . . . . . . . . . . . . . . . $1,310 $2,265 $3,575Derivative liabilities(b)
Foreign currency contracts . . . . . . . . . . . . . . . . . . . $ 797 $2,431 $3,228Interest rate swaps . . . . . . . . . . . . . . . . . . . . . . . . . . 4,187 — 4,187
Total derivative liabilities . . . . . . . . . . . . . . . . . . . . . . . . $4,984 $2,431 $7,415
(a) Derivative assets are recorded to Prepaid expenses and other current assets in the Consolidated BalanceSheet.
(b) Derivative liabilities are recorded as Other current liabilities in the Consolidated Balance Sheet.
The following table shows the effect of the Company’s derivative instruments which were not designated ashedging instruments in the Consolidated Statement of Income and Comprehensive Income for the years endedDecember 31, 2020 and December 31, 2019:
Amount of Gain (Loss)For the year ended
December 31, Location of Gain (Loss)Recognized in
Income on Derivative(DOLLARS IN THOUSANDS) 2020 2019
Foreign currency contracts . . . . . . . . . . . . . . . $9,319 $557 Other (income) expense, net
118

These net gains (losses) mostly offset any recognized gains (losses) arising from the revaluation of therelated intercompany loans during the same respective periods.
The following table shows the effect of the Company’s derivative instruments designated as cash flow andnet investment hedging instruments, net of tax, in the Consolidated Statement of Income and ComprehensiveIncome for the years ended December 31, 2020 and December 31, 2019 (in thousands):
Amount of Gain (Loss)Recognized in OCI on
Derivative(Effective Portion) Location of Gain
(Loss) Reclassifiedfrom AOCI into
Income(Effective Portion)
Amount of Gain (Loss)Reclassified from AOCI
into Income(Effective Portion)
For the years endedDecember 31,
For the years endedDecember 31,
2020 2019 2020 2019
Derivatives in Cash Flow HedgingRelationships:Foreign currency contracts . . . . . . . . . . . $ (9,796) $ (3,535) Cost of goods sold $4,720 $8,504Interest rate swaps (1) . . . . . . . . . . . . . . . . 858 857 Interest expense (858) (857)
Derivatives in Net Investment HedgingRelationships:Cross currency swaps . . . . . . . . . . . . . . . (13,450) — N/A — —
Non-Derivatives in Net Investment HedgingRelationships:2024 Euro Notes . . . . . . . . . . . . . . . . . . . (41,806) 5,440 N/A — —2021 Euro Notes & 2026 Euro Notes . . . (91,974) 11,969 N/A — —
Total . . . . . . . . . . . . . . . . . . . . . . . . $(156,168) $14,731 $3,862 $7,647
(1) Interest rate swaps were entered into as pre-issuance hedges for the Company’s bond offerings.
The ineffective portion of the above noted cash flow hedges and net investment hedges was not material forthe years ended December 31, 2020 and 2019.
The Company expects approximately $4.1 million (net of tax), of derivative gains included in AOCI atDecember 31, 2020, based on current market rates, will be reclassified into earnings within the next twelvemonths. The majority of this amount will vary due to fluctuations in foreign currency exchange rates.
NOTE 18. ACCUMULATED OTHER COMPREHENSIVE INCOME (LOSS)
The following tables present changes in the accumulated balances for each component of othercomprehensive income, including current period other comprehensive income and reclassifications out ofaccumulated other comprehensive income:
(DOLLARS IN THOUSANDS)
ForeignCurrencyTranslationAdjustments
(Losses) Gains onDerivativesQualifying as
Hedges
Pension andPostretirement
LiabilityAdjustment Total
Accumulated other comprehensive loss, net of tax, asof December 31, 2019 . . . . . . . . . . . . . . . . . . . . . . . $(373,043) $ 2,068 $(345,919) $(716,894)
OCI before reclassifications . . . . . . . . . . . . 88,132 (5,076) (73,735) 9,321Amounts reclassified from AOCI . . . . . . . . — (3,862) 13,894 10,032
Net current period other comprehensive income(loss) . . . . . . . . . . . . . . . . . . . . . . . . . . . . . . . . 88,132 (8,938) (59,841) 19,353
Accumulated other comprehensive loss, net of tax, asof December 31, 2020 . . . . . . . . . . . . . . . . . . . . . . . $(284,911) $(6,870) $(405,760) $(697,541)
119
(DOLLARS IN THOUSANDS)
ForeignCurrencyTranslationAdjustments
(Losses) Gains onDerivativesQualifying as
Hedges
Pension andPostretirement
LiabilityAdjustment Total
Accumulated other comprehensive (loss) income, netof tax, as of December 31, 2018 . . . . . . . . . . . . . . . $(396,996) $ 4,746 $(309,977) $(702,227)
OCI before reclassifications . . . . . . . . . . . . 23,953 4,969 (45,599) (16,677)Amounts reclassified from AOCI . . . . . . . . — (7,647) 9,657 2,010
Net current period other comprehensive income(loss) . . . . . . . . . . . . . . . . . . . . . . . . . . . . . . . . 23,953 (2,678) (35,942) (14,667)
Accumulated other comprehensive loss, net of tax, asof December 31, 2019 . . . . . . . . . . . . . . . . . . . . . . . $(373,043) $ 2,068 $(345,919) $(716,894)
(DOLLARS IN THOUSANDS)
ForeignCurrencyTranslationAdjustments
(Losses) Gains onDerivativesQualifying as
Hedges
Pension andPostretirement
LiabilityAdjustment Total
Accumulated other comprehensive (loss) income, netof tax, as of December 31, 2017 . . . . . . . . . . . . . . . $(297,416) $(10,332) $(329,734) $(637,482)
OCI before reclassifications . . . . . . . . . . . . (99,580) 8,011 9,717 (81,852)Amounts reclassified from AOCI . . . . . . . . — 7,067 10,040 17,107
Net current period other comprehensive income(loss) . . . . . . . . . . . . . . . . . . . . . . . . . . . . . . . . (99,580) 15,078 19,757 (64,745)
Accumulated other comprehensive (loss) income, netof tax, as of December 31, 2018 . . . . . . . . . . . . . . . $(396,996) $ 4,746 $(309,977) $(702,227)
The following table provides details about reclassifications out of AOCI to the Consolidated Statement ofComprehensive Income:
Year Ended December 31, Affected Line Item in theConsolidated Statementof Comprehensive Income(DOLLARS IN THOUSANDS) 2020 2019 2018
(Losses) gains on derivatives qualifying ashedges
Foreign currency contracts . . . . . . . . . . $ 5,394 $ 9,719 $ (7,089) Cost of goods soldInterest rate swaps . . . . . . . . . . . . . . . . . (858) (857) (864) Interest expenseTax . . . . . . . . . . . . . . . . . . . . . . . . . . . . . (674) (1,215) 886 Provision for income taxes
Total . . . . . . . . . . . . . . . . . . . . . . . . . . . . . . . $ 3,862 $ 7,647 $ (7,067) Total, net of income taxes
(Losses) gains on pension and postretirementliability adjustments
Prior service cost . . . . . . . . . . . . . . . . . . $ 6,550 $ 6,644 $ 7,752(a)
Actuarial losses . . . . . . . . . . . . . . . . . . . (29,629) (19,032) (20,645)(a)
Tax . . . . . . . . . . . . . . . . . . . . . . . . . . . . . 9,185 2,731 2,853 Provision for income taxes
Total . . . . . . . . . . . . . . . . . . . . . . . . . . . . . . . $(13,894) $ (9,657) $(10,040) Total, net of income taxes
(a) The amortization of prior service cost and actuarial loss is included in the computation of net periodicbenefit cost. Refer to Note 16 to the Consolidated Financial Statements for additional information regardingnet periodic benefit cost.
120

NOTE 19. CONCENTRATIONS OF CREDIT RISK
The Company does not have significant concentrations of risk in financial instruments. Temporaryinvestments are made in a well-diversified portfolio of high-quality, liquid obligations of government, corporateand financial institutions. There are also limited concentrations of credit risk with respect to trade receivablesbecause the Company has a large number of customers who are spread across many industries and geographicregions. The Company’s larger customers are each spread across many sub-categories of its segments andgeographical regions. The Company had no customer that accounted for more than 10% of its consolidated netsales for the years ended 2020, 2019 and 2018.
NOTE 20. COMMITMENTS AND CONTINGENCIES
Guarantees and Letters of Credit
The Company has various bank guarantees and letters of credit which are available for use to support itsongoing business operations and to satisfy governmental requirements associated with pending litigation invarious jurisdictions.
At December 31, 2020, the Company had total bank guarantees and standby letters of credit of approximately$48.7 million with various financial institutions. Included in the above aggregate amount is a total of $14.6 millionfor other assessments in Brazil for various income tax and indirect tax disputes related to fiscal years 1998-2011.There were no material amounts utilized under the standby letters of credit as of December 31, 2020.
In order to challenge the assessments in these cases in Brazil, the Company has been required to and hasseparately pledged assets, principally property, plant and equipment to cover assessments in the amount ofapproximately $7.7 million as of December 31, 2020.
Lines of Credit
The Company has various lines of credit which are available to support its ongoing business operations. Asof December 31, 2020, the Company had available lines of credit of $106.4 million with various financialinstitutions, in addition to the $626.9 million of capacity under the Credit Facility. There were no materialamounts drawn down pursuant to these lines of credit as of December 31, 2020.
Litigation
The Company assesses contingencies related to litigation and/or other matters to determine the degree ofprobability and range of possible loss. A loss contingency is accrued in the Company’s consolidated financialstatements if it is probable that a liability has been incurred and the amount of the loss can be reasonablyestimated. Because litigation is inherently unpredictable and unfavorable resolutions could occur, assessingcontingencies is highly sensitive and requires judgments about future events. On at least a quarterly basis, theCompany reviews contingencies related to litigation to determine the adequacy of accruals. The amount ofultimate loss may differ from these estimates and further events may require the Company to increase or decreasethe amounts it has accrued on any matter.
Periodically, the Company assesses its insurance coverage for all known claims, where applicable, takinginto account aggregate coverage by occurrence, limits of coverage, self-insured retentions and deductibles,historical claims experience and claims experience with its insurance carriers. The liabilities are recorded atmanagement’s best estimate of the probable outcome of the lawsuits and claims, taking into consideration thefacts and circumstances of the individual matters as well as past experience on similar matters. At each balancesheet date, the key issues that management assesses are whether it is probable that a loss as to asserted orunasserted claims has been incurred and if so, whether the amount of loss can be reasonably estimated. TheCompany records the expected liability with respect to claims in Other liabilities and expected recoveries from itsinsurance carriers in Other assets. The Company recognizes a receivable when it believes that realization of theinsurance receivable is probable under the terms of the insurance policies and its payment experience to date.
121
Litigation Matters
On August 12, 2019, Marc Jansen filed a putative securities class action against IFF, its Chairman and CEO,and its then-CFO, in the United States District Court for the Southern District of New York. The lawsuit wasfiled after IFF disclosed that preliminary results of investigations indicated that Frutarom businesses operatingprincipally in Russia and Ukraine had made improper payments to representatives of customers. OnDecember 26, 2019, the Court appointed a group of six investment funds as lead plaintiff and Pomerantz LLP aslead counsel. On March 16, 2020, lead plaintiff filed an amended complaint, which added Frutarom and certainformer officers of Frutarom as defendants. The amended complaint alleges, among other things, that defendantsmade materially false and misleading statements or omissions concerning IFF’s acquisition of Frutarom, theintegration of the two companies, and the companies’ financial reporting and results. The amended complaintasserts claims under Section 10(b) of the Securities Exchange Act of 1934 and SEC Rule 10b-5, and under theIsraeli Securities Act-1968, against all defendants, and under Section 20(a) of the Securities Exchange Act of1934 against the individual defendants, on behalf of a putative class of persons and entities who purchased orotherwise acquired IFF securities on the New York Stock Exchange between May 7, 2018 and August 12, 2019and persons and entities who purchased or otherwise acquired IFF securities on the Tel Aviv Stock Exchangebetween October 9, 2018 and August 12, 2019. The amended complaint seeks an award of unspecifiedcompensatory damages, costs, and expenses. IFF, its officers, and Frutarom filed a motion to dismiss the case onJune 26, 2020.
Two motions to approve securities class actions were filed in the Tel Aviv District Court, Israel, in August2019, similarly alleging, among other things, false and misleading statements largely in connection with IFF’sacquisition of Frutarom and the above-mentioned improper payments. One motion (“Borg”) asserts claims underthe U.S. federal securities laws against IFF, its Chairman and CEO, and its former CFO. On November 8, 2020IFF and its officers filed their response to the Borg motion. The other motion (“Oman”) (following an initialamendment) asserted claims under the Israeli Securities Act-1968 against IFF, its Chairman and CEO, and itsformer CFO, and against Frutarom and certain former Frutarom officers and directors, as well as claims underthe Israeli Companies Act-1999 against certain former Frutarom officers and directors. On October 4, 2020, theOman plaintiff filed a motion to remove IFF and its officers from the motion and to add factual allegations fromthe U.S. amended complaint. Responses to the motion to amend the Oman motion were filed during November2020. The court granted the motion to amend the Oman motion on February 17, 2021.
On October 29, 2019, IFF and Frutarom filed a claim in the Tel Aviv District Court, Israel, against OriYehudai, the former President and CEO of Frutarom, and against certain former directors of Frutarom,challenging the bonus of US $20 million granted to Yehudai in 2018. IFF and Frutarom allege, among otherthings, that Yehudai was not entitled to receive the bonus because he breached his fiduciary duty by, among otherthings, knowing of the above-mentioned improper payments and failing to prevent them from being made. Theparties agreed, pursuant to the court’s recommendation, to attempt to resolve the dispute through mediation,which is still ongoing, during which the proceedings relating to this claim are stayed.
On March 11, 2020, an IFF shareholder filed a motion to approve a class action in Israel against, amongothers, Frutarom, Yehudai, and Frutarom’s former board of directors, alleging that former minority shareholdersof Frutarom were harmed as a result of the US $20 million bonus paid to Yehudai. The parties to this motionagreed to attempt to resolve the dispute through mediation to take place regarding the aforesaid claim againstYehudai, which as noted is still ongoing, during which the proceedings relating to this motion are stayed.
Investigation
On June 3, 2020, the Israel Police’s National Fraud Investigation Unit and the Israeli Securities Authoritycommenced an investigation into Frutarom and certain of its former executives, based on suspected bribery offoreign officials, money laundering, and violations of the Israeli Securities Act-1968. The National FraudInvestigation Unit and the Israeli Securities Authority have provided IFF and Frutarom with various orders. IFFis working to ensure compliance with such orders, all in accordance with, and subject to, Israeli law.
122

China Facilities
Hangzhou Ingredients plant
As previously disclosed, in 2014 the Company agreed to relocate an ingredients facility in Hangzhou, Chinato Jiande, China. In connection with such relocation, the Company entered into a land swap and relocationagreement with the local authority pursuant to which the Company agreed to transfer ownership of the landunderlying the facility in exchange for various elements of compensation, including cash and land use rights forthe new facility. The Company initially determined that the gain, if any, would be recognized upon final transferof ownership. During the fourth quarter of 2019, the Company completed the final environmental cleanupactivities and transferred ownership of the land to the local authority. The amount of the gain ultimatelyrecognized in the fourth quarter of 2019 was $4.4 million. The amount has been recorded as a component ofOther income, net.
The net book value of the plant in Jiande, China was approximately $68 million as of December 31, 2020.
Guangzhou Taste plant
During the fourth quarter of 2016, the Company was notified that certain governmental authorities havebegun to evaluate a change in the zoning of the Guangzhou Taste plant. The zoning, if changed, would preventthe Company from continuing to manufacture product at the existing plant. The ultimate outcome of any changethat the governmental authorities may propose, the timing of such a change, and the nature of any compensationarrangements that might be provided to the Company are uncertain. To address the governmental authorities’requirements, the Company has begun to transfer certain production capabilities from the Guangzhou Taste plantto a newly built facility in Zhangjiagang.
The net book value of the plant in Guangzhou was approximately $62 million as of December 31, 2020.
Guangzhou Scent plant
During the second quarter of 2019, the Company was notified that certain governmental authorities hadchanged the zoning where the Guangzhou Scent plant is located. The zoning change did not affect the currentoperations but prevents expansions or other increases in the operating capacity of the plant. The Companybelieves that it is possible that the zoning may be enforced in the future such that it would not be able to continuemanufacturing at the existing site. The ultimate outcome of any change that the governmental authorities maypropose, the timing of such a change, and the nature of any compensation arrangements that might be provided tothe Company are uncertain.
The net book value of the existing plant was approximately $9 million as of December 31, 2020.
Zhejiang Ingredients plant
In the fourth quarter of 2017, the Company concluded discussions with the government regarding therelocation of its Fragrance Ingredients plant in Zhejiang and, based on the agreements reached, expects to receivetotal compensation payments up to approximately $50 million. The relocation compensation will be paid to theCompany over the period of the relocation which is expected to be through the end of 2022. The Companyreceived payments totaling $30 million through the end of 2019. In the third quarter of 2020, the Companyreceived a payment of approximately $13 million. A final payment is expected to be received upon completion ofthe final environmental inspection.
Production at the facility ceased during 2019. In the second quarter of 2020, the Company transferredownership of the site to the government. The land remediation activities are in progress and are expected to becompleted in the second half of 2022. During the second quarter of 2020, the remaining net book value of theplant was written off. Products previously manufactured at the Zhejiang Ingredients plant are now beingproduced at the Company’s Ingredients plant in Jiande.
123
Total China Operations
The total net book value of all seven plants in China was approximately $212 million as of December 31,2020.
If the Company is required to close a plant, or operate one at significantly reduced production levels on apermanent basis, the Company may be required to record charges that could have a material impact on itsconsolidated financial results of operations, financial position and cash flows in future periods.
Other Contingencies
The Company has contingencies involving third parties (such as labor, contract, technology or product-related claims or litigation) as well as government-related items in various jurisdictions in which it operatespertaining to such items as value-added taxes, other indirect taxes, customs and duties and sales and use taxes. Itis possible that cash flows or results of operations, in any period, could be materially affected by the unfavorableresolution of one or more of these contingencies.
The most significant government-related contingencies exist in Brazil. With regard to the Brazilian matters,the Company believes it has valid defenses for the underlying positions under dispute; however, in order topursue these defenses, the Company is required to, and has provided, bank guarantees and pledged assets in theaggregate amount of $22.4 million. The Brazilian matters take an extended period of time to proceed through thejudicial process and there are a limited number of rulings to date.
FDA-Mandated Product Recall
The Company periodically incurs product liability claims based on product that is sold to customers thatmay be defective or otherwise not in accordance with the customer’s requirements. In the first quarter of 2017,the Company was made aware of a claim for product that was subject to an FDA-mandated product recall. InDecember 31, 2019, the Company had recorded total charges of approximately $17.5 million with respect to thisclaim, of which $5.0 million was recorded in the three months ended March 31, 2018. The Company settled theclaim with the customer in the first quarter of 2018 for a total of $16.0 million, of which $3.0 million was paid inthe fourth quarter of 2017 and $13.0 million was paid during the three months ended March 31, 2018.
For the year ended 2018, the Company received $13.1 million for the full and final settlement of its claimfrom the supplier and insurer for the affected product, which has been recorded as a reduction of cost of sales onthe Consolidated Statement of Income and Comprehensive Income.
Brazil Tax Credits
In 2017 the Brazilian Supreme Court (“BSC”) ruled that Brazilian tax authorities should not include a valueadded tax known as “ICMS” in the calculation of certain indirect taxes (“PIS/COFINS”). By removing the ICMSfrom the calculation of the indirect tax base, the Court effectively eliminated a “tax on tax”. The Brazilian taxauthorities filed an appeal seeking clarification of certain matters, including the amount of ICMS to whichtaxpayers would be entitled in order to reduce their indirect tax base (i.e. the gross rate or the net rate.)
In light of the BSC’s decision, in November 2017, the Company filed suit consistent with the BSC decisionto require that ICMS be excluded from the PIS/COFINS calculation and received a favorable preliminarydecision that was confirmed by the BSC in September 2018. This preliminary ruling granted the Company theright to prospectively exclude ICMS amounts from the PIS/COFINS calculation, but left open the issue ofwhether the Company could recover the gross or net amount of ICMS amounts paid on PIS/COFINS for theperiod from November 2011 to December 2018.
In January 2020, the Company was informed of a favorable ruling from the Brazilian tax authoritiesconfirming that the Company was entitled to recover the overpayments of certain indirect taxes (known as PIS/
124

COFINS) for the period from November 2011 to December 2018, plus interest on the amount of theoverpayments. The overpayments arose from the inclusion of a value added tax known as ICMS in thecalculation of the PIS/COFINS tax. The ruling did not, however, settle the question of whether the Company iseligible to recover overpayments based on the gross or the net amount of ICMS amounts paid on PIS/COFINS.The Company calculated the amount of overpayments using the gross method which yields a higher amount thanthe application of the net method. A final ruling on the gross versus net amount issued is still pending.
In addition to the $8.0 million recognized in the fourth quarter of 2019, during the first quarter of 2020 theCompany recognized $3.5 million as an additional recovery on the existing claim. During 2020, the Companyalso recognized $2.7 million related to a claim from another of its subsidiaries in Brazil. The income isrecognized as a reduction in Selling and Administrative expenses.
Other
The Company determines estimates of reasonably possible losses or ranges of reasonably possible losses inexcess of related accrued liabilities, if any, when it has determined that either a loss is reasonably possible or aloss in excess of accrued amounts is reasonably possible and the amount of losses or range of losses isdeterminable. For all third party contingencies (including labor, contract, technology, tax, product-related claimsand business litigation), the Company currently estimates that the aggregate range of reasonably possible lossesin excess of any accrued liabilities is $0 to approximately $28.3 million. The estimates included in this amountare based on the Company’s analysis of currently available information and, as new information is obtained,these estimates may change. Due to the inherent subjectivity of the assessments and the unpredictability ofoutcomes of legal proceedings, any amounts accrued or included in this aggregate amount may not represent theultimate loss to the Company from the matters in question. Thus, the Company’s exposure and ultimate lossesmay be higher or lower, and possibly significantly so, than the amounts accrued or the range disclosed above.
NOTE 21. REDEEMABLE NONCONTROLLING INTERESTS
Through certain subsidiaries of the Company’s Frutarom acquisition, there are certain noncontrollinginterests that carry redemption features. The noncontrolling interest holders have the right, over a stipulatedperiod of time, to sell their respective interests to Frutarom, and Frutarom has the option to purchase theseinterests (subject to the same timing). These options carry, in most cases, identical price and conditions ofexercise, and will be settled based on a pre-agreed formula based, in most cases, on a multiple of the averageEBITDA of consecutive quarters to be achieved during the period ending prior to the exercise date.
125
The following table sets forth the details of the Company’s redeemable noncontrolling interests:
(DOLLARS IN THOUSANDS)Redeemable
Noncontrolling Interests
Balance at December 31, 2018 . . . . . . . . . . . . . . . . . . . . . . . . . . . . . . . . . . . . . . . . . . . . . . . $ 81,806Acquired through acquisitions during 2019 . . . . . . . . . . . . . . . . . . . . . . . . . . . . . . . . . 23,594Impact of foreign exchange translation . . . . . . . . . . . . . . . . . . . . . . . . . . . . . . . . . . . . . (126)Share of profit or loss attributable to redeemable noncontrolling interests . . . . . . . . . 666Redemption value adjustment for the current period . . . . . . . . . . . . . . . . . . . . . . . . . . 2,097Measurement period adjustments . . . . . . . . . . . . . . . . . . . . . . . . . . . . . . . . . . . . . . . . . 5,391Dividends paid . . . . . . . . . . . . . . . . . . . . . . . . . . . . . . . . . . . . . . . . . . . . . . . . . . . . . . . (753)Exercises of redeemable noncontrolling interests . . . . . . . . . . . . . . . . . . . . . . . . . . . . . (13,632)
Balance at December 31, 2019 . . . . . . . . . . . . . . . . . . . . . . . . . . . . . . . . . . . . . . . . . . . . . . . $ 99,043Impact of foreign exchange translation . . . . . . . . . . . . . . . . . . . . . . . . . . . . . . . . . . . . . 12,864Share of profit or loss attributable to redeemable noncontrolling interests . . . . . . . . . 2,814Redemption value adjustment for the current period . . . . . . . . . . . . . . . . . . . . . . . . . . (1,803)Measurement period adjustments . . . . . . . . . . . . . . . . . . . . . . . . . . . . . . . . . . . . . . . . . (1,426)Dividends paid . . . . . . . . . . . . . . . . . . . . . . . . . . . . . . . . . . . . . . . . . . . . . . . . . . . . . . . (2,017)Exercises of redeemable noncontrolling interests . . . . . . . . . . . . . . . . . . . . . . . . . . . . . (11,923)
Balance at December 31, 2020 . . . . . . . . . . . . . . . . . . . . . . . . . . . . . . . . . . . . . . . . . . . . . . . $ 97,552
For 2019, the increase in redeemable noncontrolling interests was primarily due to the interests acquiredthrough acquisitions during the first quarter of 2019, as discussed in Note 3.
During 2020, the Company paid $13.9 million related to the purchase of certain noncontrolling interestswhere the option related to the purchase had been exercised in the fourth quarter of 2019.
(a)(3) EXHIBITS
ExhibitNumber Description
2.1 Agreement and Plan of Merger, dated May 7, 2018, by and among the Registrant, FrutaromIndustries Ltd. and Icon Newco Ltd., incorporated by reference to Exhibit 2.1 to the Registrant’sCurrent Report on Form 8-K filed on May 9, 2018.
2.2 Amendment No. 1 to Agreement and Plan of Merger, dated August 25, 2018, by and amongInternational Flavors & Fragrances, Inc., Frutarom Industries Ltd. and Icon Newco Ltd.incorporated by reference to Exhibit 2.1 to the Registrant’s Current Report on Form 8-K filed onAugust 27, 2018.
2.3 Agreement and Plan of Merger, dated December 15, 2019, by and among DuPont de NemoursInc., Nutrition & Biosciences, Inc., International Flavors & Fragrances Inc. and Neptune MergerSub I Inc., incorporated by reference to Exhibit 2.1 to the Registrant’s Current Report on Form8-K filed on December 18, 2019.
2.4 Separation and Distribution Agreement, dated as of December 15, 2019, by and among DuPontde Nemours Inc., Nutrition & Biosciences, Inc. and International Flavors & Fragrances Inc.,incorporated by reference to Exhibit 2.2 to the Registrant’s Current Report on Form 8-K filed onDecember 18, 2019.
3.1 Restated Certificate of Incorporation of the Registrant, incorporated by reference toExhibit 10(g) to the Registrant’s Quarterly Report on Form 10-Q filed on August 12, 2002.
126

ExhibitNumber Description
3.2 Bylaws of International Flavors & Fragrances Inc., effective as of October 29, 2019,incorporated by reference to Exhibit 3(ii) to the Registrant’s Current Report on Form 8-K filedon October 30, 2019.
4.1 Indenture, dated as of April 4, 2013, between the Registrant and U.S. Bank NationalAssociation, as Trustee (including the form of Notes), incorporated by reference to Exhibit 4.1to the Registrant’s Current Report on Form 8-K filed on April 4, 2013.
4.2 Indenture, dated as of March 2, 2016, between the Registrant and U.S. Bank NationalAssociation, as Trustee (including the form of Debt Security), incorporated by reference toExhibit 4.1 to the Registrant’s Registration Statement on Form S-3 (RegistrationNo. 333-209889) filed on March 2, 2016.
4.3 First Supplemental Indenture, dated as of March 14, 2016, between the Registrant and U.S.Bank National Association, as Trustee (including the form of Notes), incorporated by referenceto Exhibit 4.7 to the Registrant’s Current Report on Form 8-K filed on March 14, 2016.
4.4 Second Supplemental Indenture, dated as of May 18, 2017, between the Registrant and U.S.Bank National Association, as Trustee (including the form of Notes), incorporated by referenceto Exhibit 4.7 to the Registrant’s Current Report on Form 8-K filed on May 18, 2017.
4.5 Third Supplemental Indenture, dated as of September 17, 2018, between International Flavors &Fragrances Inc. and U.S. Bank National Association, as trustee, incorporated by reference toExhibit 4.5 to the Registrant’s Current Report on Form 8-K filed on September 17, 2018.
4.6 Form of Amortizing Note, incorporated by reference to Exhibit 4.5 to the Registrant’s CurrentReport on Form 8-K filed on September 17, 2018.
4.7 Purchase Contract Agreement, dated September 17, 2018, between International Flavors &Fragrances Inc. and U.S. Bank National Association, as purchase contract agent, asattorney-in-fact for holders of the purchase contracts referred to therein and as trustee under theindenture referred to therein, incorporated by reference to Exhibit 4.1 to the Registrant’s CurrentReport on Form 8-K filed on September 17, 2018.
4.8 Form of Unit, incorporated by reference to Exhibit 4.1 to the Registrant’s Current Report onForm 8-K filed on September 17, 2018.
4.9 Form of Purchase Contract, incorporated by reference to Exhibit 4.1 to the Registrant’s CurrentReport on Form 8-K filed on September 17, 2018.
4.10 Fourth Supplemental Indenture, dated as of September 25, 2018, between InternationalFlavors & Fragrances Inc. and U.S. Bank National Association, as trustee, incorporated byreference to Exhibit 4.2 to the Registrant’s Current Report on Form 8-K filed on September 25,2018.
4.11 Form of Global Note for the 2021 Notes, incorporated by reference to Exhibit 4.2 to theRegistrant’s Current Report on Form 8-K filed on September 25, 2018.
4.12 Form of Global Note for the 2026 Notes, incorporated by reference to Exhibit 4.2 to theRegistrant’s Current Report on Form 8-K filed on September 25, 2018.
4.13 Fifth Supplemental Indenture, dated as of September 26, 2018, between International Flavors &Fragrances Inc. and U.S. Bank National Association, as trustee, incorporated by reference toExhibit 4.2 to the Registrant’s Current Report on Form 8-K filed on September 26, 2018.
4.14 Form of Global Note for the 2020 Notes, incorporated by reference to Exhibit 4.2 to theRegistrant’s Current Report on Form 8-K filed on September 26, 2018.
127
ExhibitNumber Description
4.15 Form of Global Note for the 2028 Notes, incorporated by reference to Exhibit 4.2 to theRegistrant’s Current Report on Form 8-K filed on September 26, 2018.
4.16 Form of Global Notes for the 2048 Notes, incorporated by reference to Exhibit 4.2 to theRegistrant’s Current Report on Form 8-K filed on September 26, 2018.
4.17 Indenture, dated as of September 16, 2020, between the N&B and U.S. Bank NationalAssociation, as Trustee (including the form of Notes), incorporated by reference to Exhibit99.16 to the Registrant’s Registration Statement on Form S-4 (Registration No. 333-238072)filed on October 5, 2020.
4.18 First Supplemental Indenture, dated as of February 1, 2021, among Nutrition & Biosciences,Inc., International Flavors & Fragrances Inc. and U.S. Bank National Association, as Trustee.Incorporated by reference to Exhibit 4.2 to the Registrant’s Current Report on Form 8-K filed onFebruary 4, 2021.
4.19 Description of Securities, incorporated by reference to Exhibit 4.17 to the Registrant’s AnnualReport on Form 10-K filed on March 3, 2020.
*10.1 Letter Agreement, dated as of May 26, 2014, between the Registrant and Andreas Fibig,incorporated by reference to Exhibit 10.1 to the Registrant’s Current Report on Form 8-K filedon May 28, 2014.
*10.2 Supplemental Retirement Plan, incorporated by reference to Exhibit 10.5 to the Registrant’sAnnual Report on Form 10-K filed on February 27, 2008.
*10.3 2010 Stock Award and Incentive Plan, as amended and restated as of May 6, 2015, incorporatedby reference to Exhibit 10.8 to the Registrant’s Quarterly Report on Form 10-Q filed on May 12,2015.
*10.4 Form of U.S. Stock Settled Appreciation Rights Agreement under the 2010 Stock Award andIncentive Plan, incorporated by reference to Exhibit 10.29 to the Registrant’s Annual Report onForm 10-K filed on February 28, 2012.
*10.5 Form of Restricted Stock Units Agreement — Non-Employee Director under the 2010 StockAward and Incentive Plan, incorporated by reference to Exhibit 10.32 to the Registrant’s AnnualReport on Form 10-K filed on February 28, 2012.
*10.6 Form of Long-Term Incentive Plan Award Agreement under the 2010 Stock Award andIncentive Plan, incorporated by reference to Exhibit 10.30 to the Registrant’s Annual Report onForm 10-K filed on February 25, 2014.
*10.7 Form of Restricted Stock Units Award Agreement under the 2010 Stock Award and IncentivePlan, incorporated by reference to Exhibit 10.1 to the Registrant’s Quarterly Report on Form10-Q filed on May 6, 2014.
*10.8 Form of Equity Choice Program Award Agreement under the 2010 Stock Award and IncentivePlan, incorporated by reference to Exhibit 10.2 to the Registrant’s Quarterly Report on Form10-Q filed on May 6, 2014.
*10.9 2015 Stock Award and Incentive Plan, as amended and restated February 7, 2017, incorporatedby reference to Exhibit 10.13 to the Registrant’s Annual Report on Form 10-K filed onFebruary 28, 2017.
*10.10 Form of Annual Incentive Plan Award Agreement under the 2015 Stock Award and IncentivePlan, incorporated by reference to Exhibit 10.3 to the Registrant’s Quarterly Report on Form10-Q filed on May 12, 2015.
128

ExhibitNumber Description
*10.11 Form of Long-Term Incentive Plan Award Agreement under the 2015 Stock Award andIncentive Plan, incorporated by reference to Exhibit 10.4 to the Registrant’s Quarterly Report onForm 10-Q filed on May 12, 2015.
*10.12 Form of Equity Choice Program Award Agreement under the 2015 Stock Award and IncentivePlan, incorporated by reference to Exhibit 10.5 to the Registrant’s Quarterly Report on Form10-Q filed on May 12, 2015.
*10.13 Form of Restricted Stock Units Award Agreement under the 2015 Stock Award and IncentivePlan, incorporated by reference to Exhibit 10.6 to the Registrant’s Quarterly Report on Form10-Q filed on May 12, 2015.
*10.14 Form of Non-Employee Director Restricted Stock Units Award Agreement under the 2015Stock Award and Incentive Plan, incorporated by reference to Exhibit 10.7 to the Registrant’sQuarterly Report on Form 10-Q filed on May 12, 2015.
*10.15 Form of Equity Choice Program Award Agreement under the 2015 Stock Award and IncentivePlan, incorporated by reference to Exhibit 10.1 to the Registrant’s Quarterly Report on Form10-Q filed on November 9, 2015.
*10.16 Form of Long-Term Incentive Plan Award Agreement under the 2015 Stock Award andIncentive Plan, incorporated by reference to Exhibit 10.25 to the Registrant’s Annual Report onForm 10-K filed on March 1, 2016.
*10.17 Amended and Restated Executive Severance Policy, as amended through and includingNovember 1, 2017, incorporated by reference to Exhibit 10.17 to the Registrant’s Annual Reporton Form 10-K filed on February 27, 2018 (the “Executive Severance Policy”).
*10.18 Amendment to the Executive Severance Policy dated November 3, 2020.
*10.19 Form of Director/Officer Indemnification Agreement, incorporated by reference to Exhibit 10.1to the Registrant’s Current Report on Form 8-K filed on July 28, 2008.
*10.20 Form of Executive Death Benefit Program - Plan Agreement, incorporated by reference toExhibit 10.27 to the Registrant’s Annual Report on Form 10-K filed on February 28, 2012.
*10.21 Deferred Compensation Plan, as amended and restated December 12, 2011, incorporated byreference to Exhibit 10.28 to the Registrant’s Annual Report on Form 10-K filed onFebruary 28, 2012 (the “Deferred Compensation Plan”).
*10.22 First Amendment to the Deferred Compensation Plan dated as of December 31, 2020.
10.23(i) Credit Agreement, dated as of November 9, 2011, amended and restated as of December 2,2016, among the Registrant, International Flavors & Fragrances (Luxembourg) S.à.r.l.,International Flavors & Fragrances (Nederland) Holding B.V., International Flavors &Fragrances I.F.F. (Nederland) B.V. and International Flavors & Fragrances (Greater Asia) PTE.Ltd., as borrowers, the banks, financial institutions and other institutional lenders party thereto,and Citibank, N.A. as administrative agent, incorporated by reference to Exhibit 10.28 to theRegistrant’s Current Report on Form 8-K filed on December 5, 2016.
10.23(ii) Amendment No. 1 to Credit Agreement, dated as of May 21, 2018, among the Registrant,International Flavors & Fragrances (Nederland) Holding B.V., International Flavors &Fragrances I.F.F. (Nederland) B.V. and International Flavors & Fragrances (Greater Asia) PTE.Ltd., as borrowers, the lenders signatory thereto and Citibank, N.A. as administrative agent,incorporated by reference to Exhibit 10.1 to the Registrant’s Current Report on Form 8-K filedon May 24, 2018.
129
ExhibitNumber Description
10.23(iii) Amendment No. 2 to Credit Agreement, dated as of June 6, 2018, among the Registrant,International Flavors & Fragrances (Nederland) Holding B.V., International Flavors &Fragrances I.F.F. (Nederland) B.V. and International Flavors & Fragrances (Greater Asia) PTE.Ltd., as borrowers, the lenders signatory thereto and Citibank, N.A. as administrative agent,incorporated by reference to Exhibit 10.2 to the Registrant’s Current Report on Form 8-K filedon June 8, 2018.
10.23(iv) Amendment No. 3 to Credit Agreement, dated as of July 13, 2018, among the Registrant,International Flavors & Fragrances (Nederland) Holding B.V., International Flavors &Fragrances I.F.F. (Nederland) B.V. and International Flavors & Fragrances (Greater Asia) PTE.Ltd., as borrowers, the lenders signatory thereto and Citibank, N.A. as administrative agent,incorporated by reference to Exhibit 10.4 to the Registrant’s Quarterly Report on Form 10-Qfiled on August 7, 2018.
10.23(v) Amendment No. 4 to Credit Agreement, dated as of January 17, 2020 among InternationalFlavors & Fragrances Inc., International Flavors & Fragrances (Nederland) Holding B.V.,International Flavors & Fragrances I.F.F. (Nederland) B.V. and International Flavors &Fragrances (Greater Asia) PTE. Ltd., as borrowers, the lenders signatory thereto and Citibank,N.A. as administrative agent, incorporated by reference to Exhibit 10.1 to the Registrant’sCurrent Report on Form 8-K filed on January 22, 2020.
10.23(vi) Second Amended and Restated Credit Agreement, dated as of August 25, 2020 amongInternational Flavors & Fragrances Inc., International Flavors & Fragrances (Nederland)Holding B.V. and International Flavors & Fragrances I.F.F. (Nederland) B.V., as borrowers, thelenders signatory thereto and Citibank, N.A. as administrative agent, incorporated by referenceto Exhibit 10.1 to the Registrant’s Current Report on Form 8-K filed on August 28, 2020.
10.24(i) Term Loan Credit Agreement, dated as of June 6, 2018, among the Registrant, as borrower, thelenders signatory thereto and Morgan Stanley Senior Funding, Inc. as administrative agent,incorporated by reference to Exhibit 10.1 to the Registrant’s Current Report on Form 8-K filedon June 8, 2018.
10.24(ii) Amendment No 1 to Term Loan Credit Agreement, dated as of July 13, 2018, among theRegistrant, as borrower, the lenders signatory thereto and Morgan Stanley Senior Funding, Inc.as administrative agent, incorporated by reference to Exhibit 10.6 to the Registrant’s QuarterlyReport on Form 10-Q filed on August 7, 2018.
10.24(iii) Amendment No. 2 to Term Loan Credit Agreement, dated as of January 17, 2020 amongInternational Flavors & Fragrances Inc., as borrower, the lenders signatory thereto and MorganStanley Senior Funding, Inc. as administrative agent, incorporated by reference to Exhibit 10.2to the Registrant’s Current Report filed on Form 8-K filed on January 22, 2020.
10.24(iv) Amendment No. 3 to Credit Agreement, dated as of August 25, 2020 among InternationalFlavors & Fragrances Inc., as borrower, the lenders signatory thereto and Morgan Stanley SeniorFunding, Inc. as administrative agent, incorporated by reference to Exhibit 10.2 to theRegistrant’s Current Report on Form 8-K filed on August 28, 2020.
10.25 Employee Matters Agreement, dated as of December 15, 2019, by and among DuPont deNemours Inc., Nutrition & Biosciences, Inc. and International Flavors & Fragrances Inc,incorporated by reference to the Registrant’s Current Report on Form 8-K filed onDecember 18, 2019.
130

ExhibitNumber Description
10.26(i) Term Loan Credit Agreement, dated as of May 15, 2020 among International Flavors &Fragrances Inc., as borrower, the lenders signatory thereto and China Construction BankCorporation, New York Branch, as administrative agent, incorporated by reference to Exhibit10.1 to the Registrant’s Current Report on Form 8-K filed on May 21, 2020.
10.26(ii) Amendment No. 1 to Credit Agreement, dated as of August 25, 2020, among the Company, asborrower, the lenders signatory thereto and China Construction Bank Corporation, New YorkBranch as administrative agent, incorporated by reference to Exhibit 10.3 to the Registrant’sCurrent Report on Form 8-K filed on August 28, 2020.
21 List of Principal Subsidiaries.
23 Consent of PricewaterhouseCoopers LLP.
31.1 Certification of Andreas Fibig pursuant to Section 302 of the Sarbanes-Oxley Act of 2002.
31.2 Certification of Rustom Jilla pursuant to Section 302 of the Sarbanes-Oxley Act of 2002.
32 Certification of Andreas Fibig and Rustom Jilla pursuant to 18 U.S.C. Section 1350 as adoptedpursuant to the Sarbanes-Oxley Act of 2002.
101.INS XBRL Instance Document
101.SCH XBRL Taxonomy Extensions Schema
101.CAL XBRL Taxonomy Extension Calculation Linkbase
101.DEF XBRL Taxonomy Extension Definition Linkbase
101.LAB XBRL Taxonomy Extension Label Linkbase
101.PRE XBRL Taxonomy Extension Presentation Linkbase
* Management contract or compensatory plan or arrangement
ITEM 16. FORM 10-K SUMMARY.
None.
131
SIGNATURES
Pursuant to the requirements of Section 13 or 15(d) of the Securities Exchange Act of 1934, the Registranthas duly caused this report to be signed on its behalf by the undersigned, thereunto duly authorized.
INTERNATIONAL FLAVORS & FRAGRANCESINC.
By: /s/ Rustom Jilla
Name: Rustom Jilla
Title: Executive Vice President andChief Financial Officer
Dated: February 22, 2021
Pursuant to the requirements of the Securities Exchange Act of 1934, this report has been signed below bythe following persons on behalf of the registrant and in the capacities and on the dates indicated:
Signature Title Date
/s/ Andreas FibigAndreas Fibig
Chairman of the Board, ChiefExecutive Officer and Director(Principal Executive Officer)
February 22, 2021
/s/ Rustom JillaRustom Jilla
Executive Vice President and ChiefFinancial Officer (Principal
Financial Officer)
February 22, 2021
/s/ Robert AndersonRobert Anderson
Senior Vice President, CorporateController and Chief AccountingOfficer (Principal Accounting
Officer)
February 22, 2021
/s/ Kathryn J. BoorKathryn J. Boor
Director February 22, 2021
/s/ Edward D. BreenEdward D. Breen
Director February 22, 2021
/s/ Carol Anthony (John) DavidsonCarol Anthony (John) Davidson
Director February 22, 2021
/s/ Michael DuckerMichael Ducker
Director February 22, 2021
/s/ Roger W. Ferguson, Jr.Roger W. Ferguson, Jr.
Director February 22, 2021
/s/ John F. FerraroJohn F. Ferraro
Director February 22, 2021
/s/ Christina GoldChristina Gold
Director February 22, 2021
132

Signature Title Date
/s/ Ilene GordonIlene Gordon
Director February 22, 2021
/s/ Matthias HeinzelMatthias Heinzel
Director February 22, 2021
/s/ Dale F. MorrisonDale F. Morrison
Director February 22, 2021
/s/ Kåre SchultzKåre Schultz
Director February 22, 2021
/s/ Stephen WilliamsonStephen Williamson
Director February 22, 2021
133
INTERNATIONAL FLAVORS & FRAGRANCES INC. AND SUBSIDIARIES
SCHEDULE II — VALUATION AND QUALIFYING ACCOUNTS AND RESERVES
(IN THOUSANDS)
For the Year Ended December 31, 2020
Balance atbeginningof period
Additionscharged tocosts andexpenses Acquisitions
Accountswrittenoff
Translationadjustments Other(2)
Balance atend ofperiod
Allowance for doubtfulaccounts . . . . . . . . . . . . . . $ 16,428 $ 5,918 $ — $ (825) $ (513) $ — $ 21,008
Valuation allowance oncredit and operating losscarryforwards and othernet deferred tax assets . . . . 203,765 35,555 — — 17,851 — 257,171
For the Year Ended December 31, 2019
Balance atbeginningof period
Additions(deductions)charged tocosts andexpenses Acquisitions
Accountswrittenoff
Translationadjustments Other(2)
Balance atend ofperiod
Allowance for doubtfulaccounts . . . . . . . . . . . . . . $ 9,173 $ 1,262 $ — $(2,024) $ (180) $8,197 $ 16,428
Valuation allowance oncredit and operating losscarryforwards and othernet deferred tax assets . . . . 200,280 5,659 — — (2,174) — 203,765
For the Year Ended December 31, 2018
Balance atbeginningof period
Additionscharged tocosts andexpenses Acquisitions
Accountswrittenoff
Translationadjustments Other(2)
Balance atend ofperiod
Allowance for doubtfulaccounts . . . . . . . . . . . . . . $ 13,392 $ 1,286 $ — $(4,642) $ (863) $ — $ 9,173
Valuation allowance oncredit and operating losscarryforwards and othernet deferred tax assets . . . . 207,483 (1,821)(1) 3,887 — (9,269) — 200,280
(1) The 2018 amount includes an adjustment to the 2017 foreign net operating loss carryforwards in the amountof $5.9 million.
(2) The amount relates to an adjustment to reflect the correct classification of amounts between the allowancefor bad debts and Trade Receivables.
S-1

Exhibit AInternational Flavors & Fragrances
EXHIBIT AINTERNATIONAL FLAVORS AND FRAGRANCES INC.NON-GAAP RECONCILIATIONS
RECONCILIATION OF OPERATING PROFIT(DOLLARS IN THOUSANDS) 2020
TOTAL COMPANY
As Reported Operating Profit 566,484
Frutarom Integration Related Costs 9,849
Restructuring and Other Charges, net 17,295
Losses on Sale of Assets 3,784
Employee Separation Costs 2,813
Frutarom Acquisition Related Costs 1,465
Compliance Review & Legal Defense Costs 3,278
N&B Transaction Related Costs 28,100
N&B Integration Related Costs 96,618
Adjusted Operating Profit $729,686
RECONCILIATION OF ADJUSTED (NON-GAAP) OPERATING PROFIT MARGIN EX. AMORTIZATION(DOLLARS IN THOUSANDS) 2020
Numerator
Adjusted (Non-GAAP) Operating Profit 729,686
Amortization of Acquisition related Intangible Assets 192,607
Adjusted (Non-GAAP) Operating Profit ex. Amortization 922,293
Denominator
Sales 5,084,239
Adjusted (Non-GAAP) Operating Profit Margin ex. Amortization 18.1%
RECONCILATION OF NET INCOME AND EARNINGS PER SHARE (EPS) (DOLLARS IN THOUSANDS EXCEPT PER SHARE AMOUNTS) 2020
TOTAL COMPANYAs Reported Net income Attributable to IFF stockholders 363,228 3.21
Frutarom Integration Related Costs 8,390 0.07
Restructuring and Other Charges, net 13,304 0.12
Losses on Sale of Assets 3,014 0.03
Employee Separation Costs 2,511 0.02
Pension Settlement 3,597 0.03
Frutarom Acquisition Related Costs 1,017 0.01
Compliance Review & Legal Defense Costs 2,542 0.02
N&B Transaction Related Costs 26,521 0.23
N&B Integration Related Costs 73,923 0.65
Redemption value adjustment to EPS - (0.02)
Adjusted Net Income 498,047 4.38** Sum does not foot due to rounding
RECONCILIATION OF EARNINGS PER SHARE (EPS) EX AMORTIZATIONNumerator 2020
Adjusted Net Income 498,047
Amortization of Acquisition related Intangible Assets 192,607
Tax impact on Amortization of Acquisition related Intangible Assets 41,519
Amortization of Acquisition related Intangible Assets, net of tax 151,088
Adjusted Net Income ex. Amortization 649,135
Denominator
Weighted average shares assuming dilution (diluted) 113,630
Adjusted EPS ex. Amortization $5.70
The Company uses non-GAAP financial measures such as Adjusted Operating Profit, Adjusted Operating Profit ex amortization, Adjusted Net Income, Adjusted EPS and Adjusted EPS ex amortization (which excludes Frutarom integration related costs, restructing and other charges, losses on sale of assets, employee separation costs, pension settlement, Frutarom acquistion related costs, compliance review & legal defense costs, N&B transaction related costs, N&B integration related costs and redemption value adjustment related to EPS) as the Company believes that these non-GAAP financial measures provide investors with an overall perspective of the period-to-period performance of our core business. Such information is supplemental to information presented in accordance with GAAP and is not intended to represent a presentation in accordance with GAAP. These non-GAAP measures may not be comparable to similarly titled measures used by other companies.

[ T H I S PAG E I N T E N T I O N A L LY L E F T B L A N K ]
Design by Liquid Creative, Inc. www.lqcreative.com © 2021 International Flavors & Fragrances Inc. All rights reserved.
BOARD OF DIRECTORS
Edward D. Breen 3, +
Executive Chairman and Chief Executive OfficerDuPont de Nemours, Inc.
Dr. Kathryn Boor 4
Dean of the Graduate School and Vice Provost for Graduate EducationCornell University
Carol Anthony (John) Davidson 1
Former Senior Vice President and Chief Accounting OfficerTyco International Ltd.
Michael L. Ducker 2, 4
Former President and Chief Executive OfficerFedEx Freight
Roger W. Ferguson, Jr. 2 *, 3
President and Chief Executive OfficerTIAA-CREF
John F. Ferraro 1*
Former Global Chief Operating OfficerErnst & Young
Andreas Fibig 4
Chair of the Board and Chief Executive OfficerInternational Flavors & Fragrances Inc.
Christina Gold 2, 3 *
Former Chief Executive Officer The Western Union Company
Ilene Gordon 2
Former Chair, President and Chief Executive OfficerIngredion Incorporated
Dr. Matthias Heinzel 4
Chief Executive OfficerMerck KGaA, Darmstadt, Germany – Life Science**
Dale F. Morrison 1, 2, 3, + Founding PartnerTwin Ridge Capital Management
Kare Schultz 3
President, Chief Executive Officer and DirectorTeva Pharmaceuticals Industries Ltd.
Stephen Williamson 1
Senior Vice President and Chief Financial OfficerThermo Fisher Scientific
1 Audit Committee
2 Compensation Committee
3 Nominating and Governance Committee
4 Innovation and Sustainability Committee
* Indicates Chairperson
+ Mr. Morrison is our current Lead Director. Mr. Breen will assume the role on May 5, 2021.
** Effective April 1, 2021
Information as of Feb 17, 2021
LEADERSHIP TEAM
Andreas FibigChair of the Board and Chief Executive Officer
Michael DeVeauSenior Vice President, Chief Investor Relations & Communications Officer
Francisco FortanetExecutive Vice President, Global Operations Officer
Kathy FortmannPresident, Nourish
Simon HerriottPresident, Health & Biosciences
Rustom JillaExecutive Vice President, Chief Financial Officer
Jennifer JohnsonExecutive Vice President, General Counsel
Etienne LaurentSenior Vice President, Corporate Strategy and Cost Synergies
Nicolas MirzayantzPresident, Scent
Greg SoutendijkSenior Vice President, Commercial Excellence
Angela StrzeleckiPresident, Pharma Solutions
Susana Suarez-GonzalezExecutive Vice President, Chief Human Resources and Diversity & Inclusion Officer
Gregory YepExecutive Vice President, Chief Research & Development, Global Integrated Solutions & Sustainability Officer
Vic VermaExecutive Vice President, Chief Information Officer

GLOBAL HEADQUARTERS
521 West 57th Street | New York, NY 10019 | 212.765.5500www.iff.com
INTERNATIONAL FLAVORS & FRAGRANCES INC.
This report is printed on paper containing post consumer fiber. The paper used in this report is also certified under the Forest Stewardship Council™ guidelines.