what you don’t know can hurt you · pokemon silver 2. pokemon gold 3. the sims 4. roller coaster...
TRANSCRIPT
What you don’t know can hurt you
Using your data in games more effectively
James Gwertzman (@gwertz) – playfab.comMarch 24, 2017

Top 10 lists – then and now
3/26/2017 PlayFab Confidential 2
Then
Now
2000 2001
2016 2017
1. Pokemon Silver2. Pokemon Gold3. The Sims4. Roller Coaster Tycoon5. Final Fantasy 96. Tony Hawk Pro Skater 27. Diablo 28. Super Marios Bros. Deluxe9. The Sims Livin’ Large10. Who Wants to be a Millionaire?
1. Harry Potter and the Sorcerer’s Stone2. Metal Gear Solid 23. The Sims: Hot Date4. The Sims5. Pokemon: Crystal6. Backyard Basketball7. Grand Theft Auto 38. Myst 3: Exile9. Civilization 310. Gran Turismo 3
10%carryover
1. Clash of Clans2. Game of War – Fire Age3. Candy Crush Saga4. Madden NFL Football5. Mobile Strike6. Star Wars: Galaxy of Heroes7. Candy Crush Soda Saga8. Marvel Contest of Champions9. Boom Beach10. Candy Crush Jelly Saga
1. Mobile Strike2. Clash Royale3. Game of War – Fire Age4. Candy Crush Saga5. Clash of Clans6. Doubledown Slots & Casino7. Marvel Contest of Champions8. Candy Crush Soda Saga9. 8 ball pool10. Pokemon Go
60%carryover

What do those titles have in common?
LiveOps

“In three years our games have generated over $80m revenue. Depending on how you account for it, Live Ops initiatives generated between one and two-thirds of that revenue…. Live Ops underpins everything we do.”
-- Simon Hade, COO, SpaceApe
“The single greatest predictor of success and of sustainable competitive advantage in this business is live game operations.”
-- Owen Mahoney, CEO Nexon

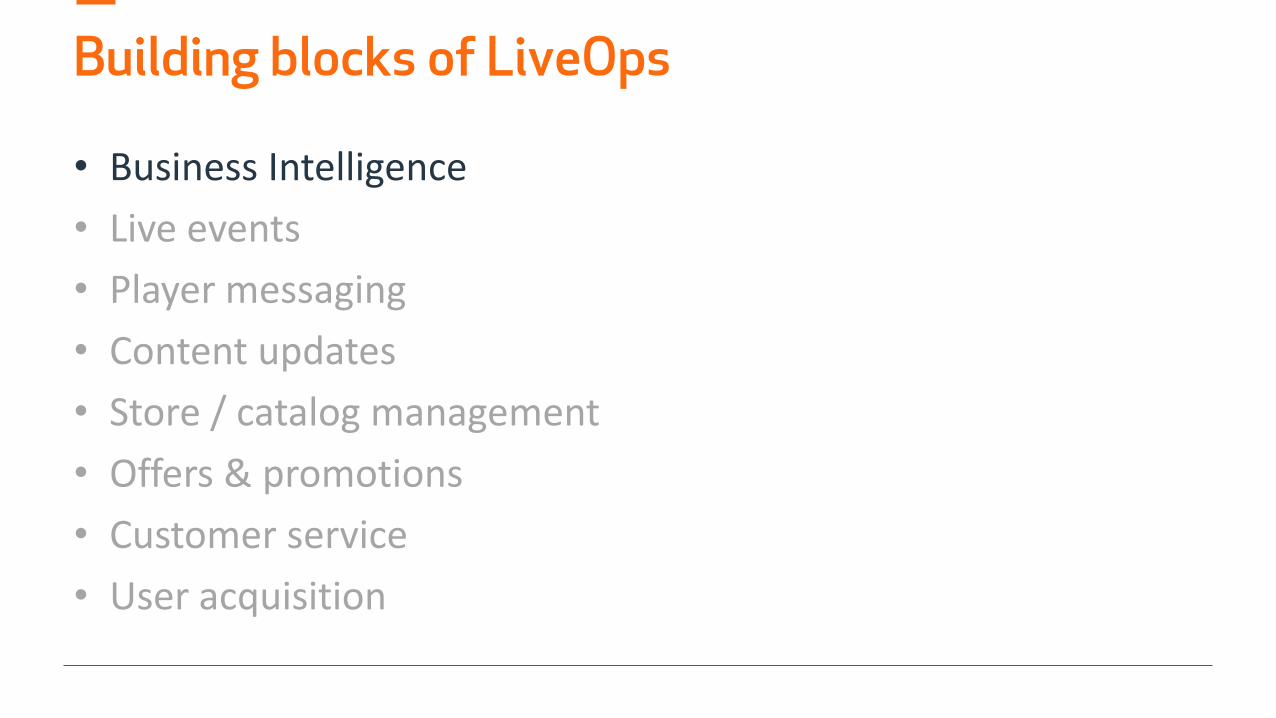
Building blocks of LiveOps
• Business Intelligence
• Live events
• Player messaging
• Content updates
• Store / catalog management
• Offers & promotions
• Customer service
• User acquisition
Building blocks of LiveOps
• Business Intelligence
• Live events
• Player messaging
• Content updates
• Store / catalog management
• Offers & promotions
• Customer service
• User acquisition
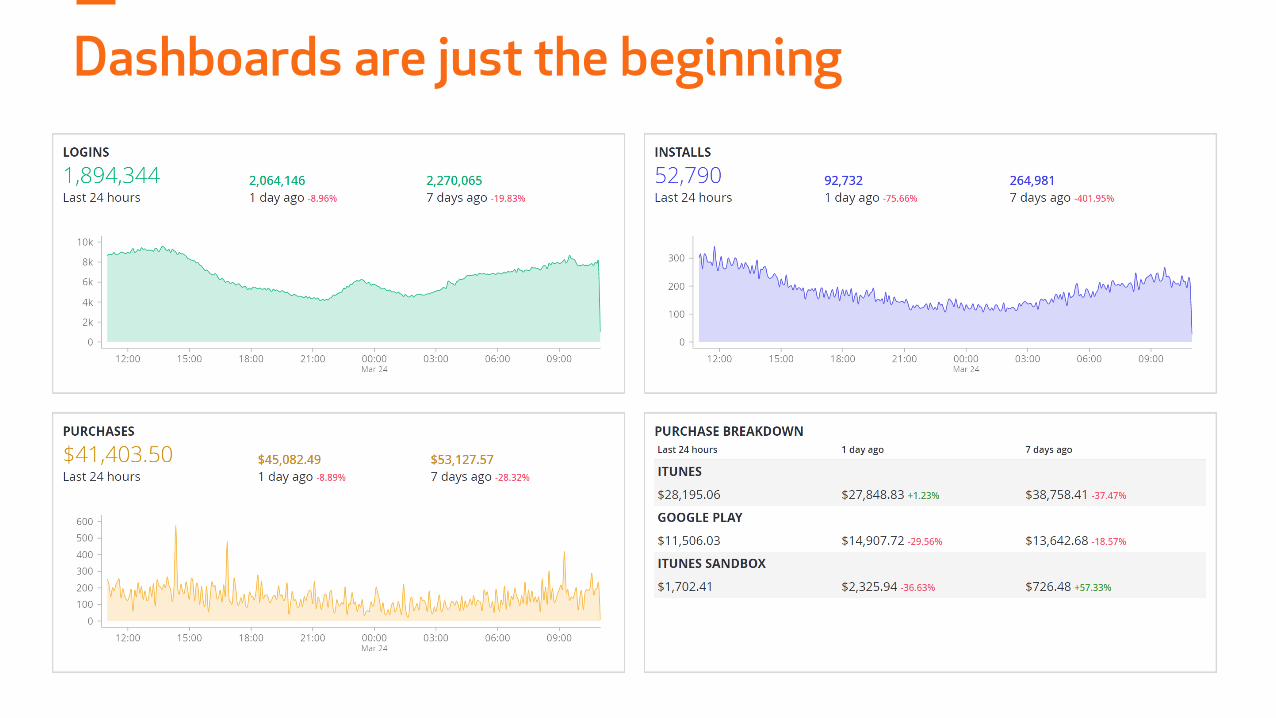
Dashboards are just the beginning

“Vanity metrics” are not actionable
Game Events Metrics
?
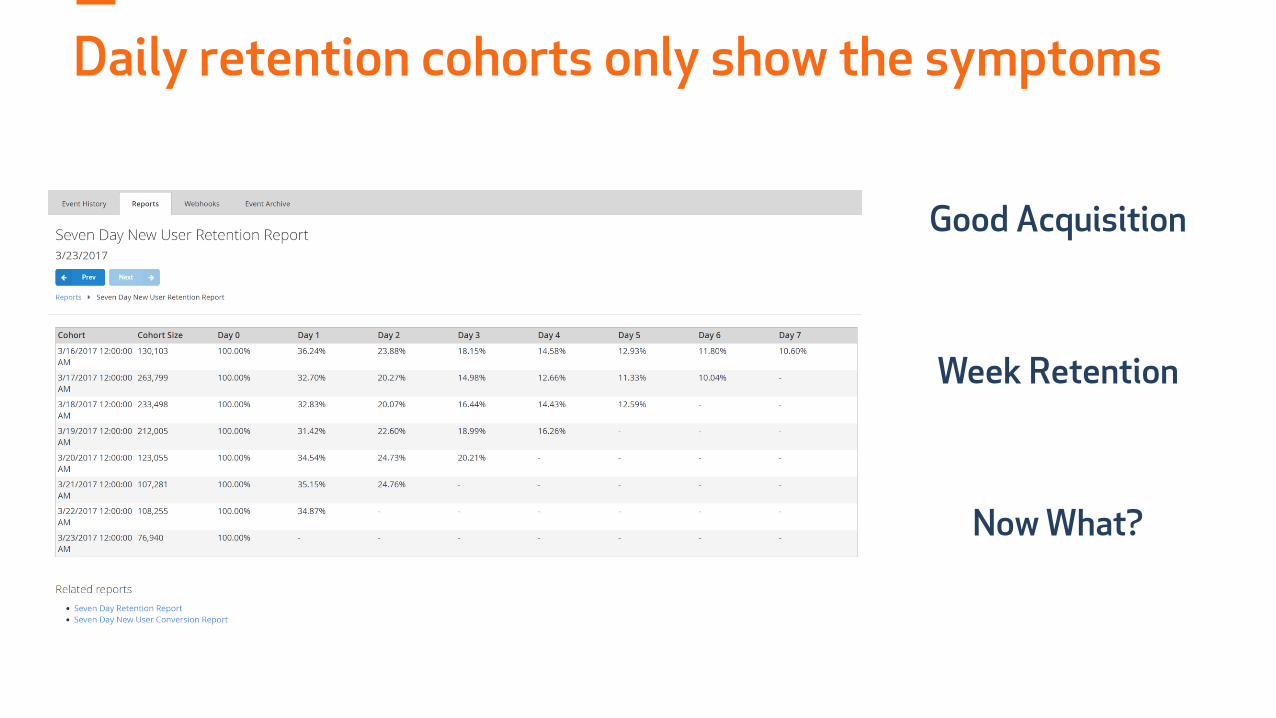
Good Acquisition
Week Retention
Daily retention cohorts only show the symptoms
Now What?
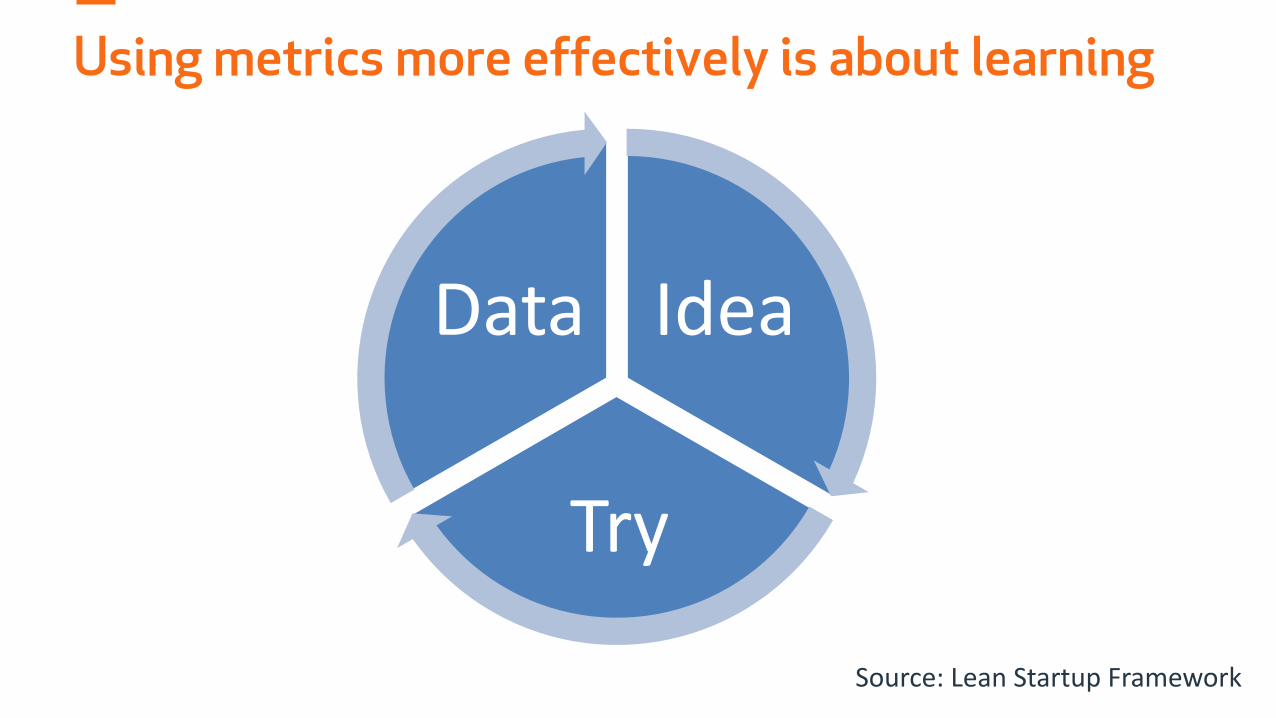
Using metrics more effectively is about learning
Source: Lean Startup Framework
Idea
Try
Data

21,340
46,953
982 1,273 484 1,162 4,881 5,495 3,846 3,728 3,651
14,200
-44,257
-91,368
-12,092 -11,355-3,308
-7,042
-19,343
-9,996-2,423 -891 -543 -852
Acquired Level 1 Level 2 Level 3 Level 4 Level 5 Level 6+ Level 10+ Level 20+ Level 30+ Level 40+ Level 50+
Population Churned
“Ideas” takes work – explore the data
Where are users pooling and dropping out?
What is different between users who progress and those who don’t?
Idea
Try
Data

21,340
46,953
982 1,273 484 1,162 4,881 5,495 3,846 3,728 3,651
14,200
-44,257
-91,368
-12,092 -11,355-3,308
-7,042
-19,343
-9,996-2,423 -891 -543 -852
Acquired Level 1 Level 2 Level 3 Level 4 Level 5 Level 6+ Level 10+ Level 20+ Level 30+ Level 40+ Level 50+
Population Churned
Come up with a hypothesisIdea
Try
Data
“Users who progress are earning achievements early”

Test your idea with experiments Idea
Try
Data
Targeted push notification campaign
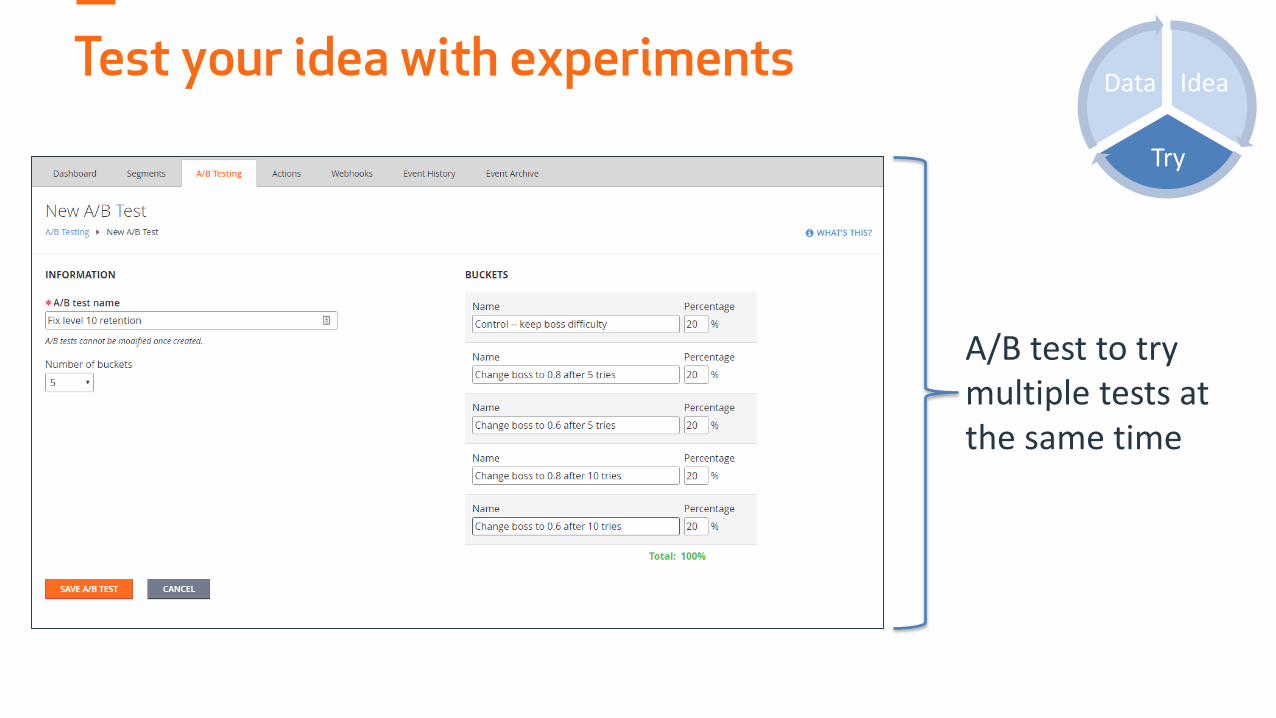
Test your idea with experiments Idea
Try
Data
A/B test to try multiple tests at the same time

21,340
46,953
1,212 1,354 578 1,239 5,388 6,323 4,231 3,923 4,123
15,300
-44,257
-76,368
-12,092 -10,447-3,043
-6,479
-17,796-9,196
-2,229 -820 -500 -784
Acquired Level 1 Level 2 Level 3 Level 4 Level 5 Level 6+ Level 10+ Level 20+ Level 30+ Level 40+ Level 50+
Population Churned
Measure the results of your changeIdea
Try
Data
Did the change reduce the churn?

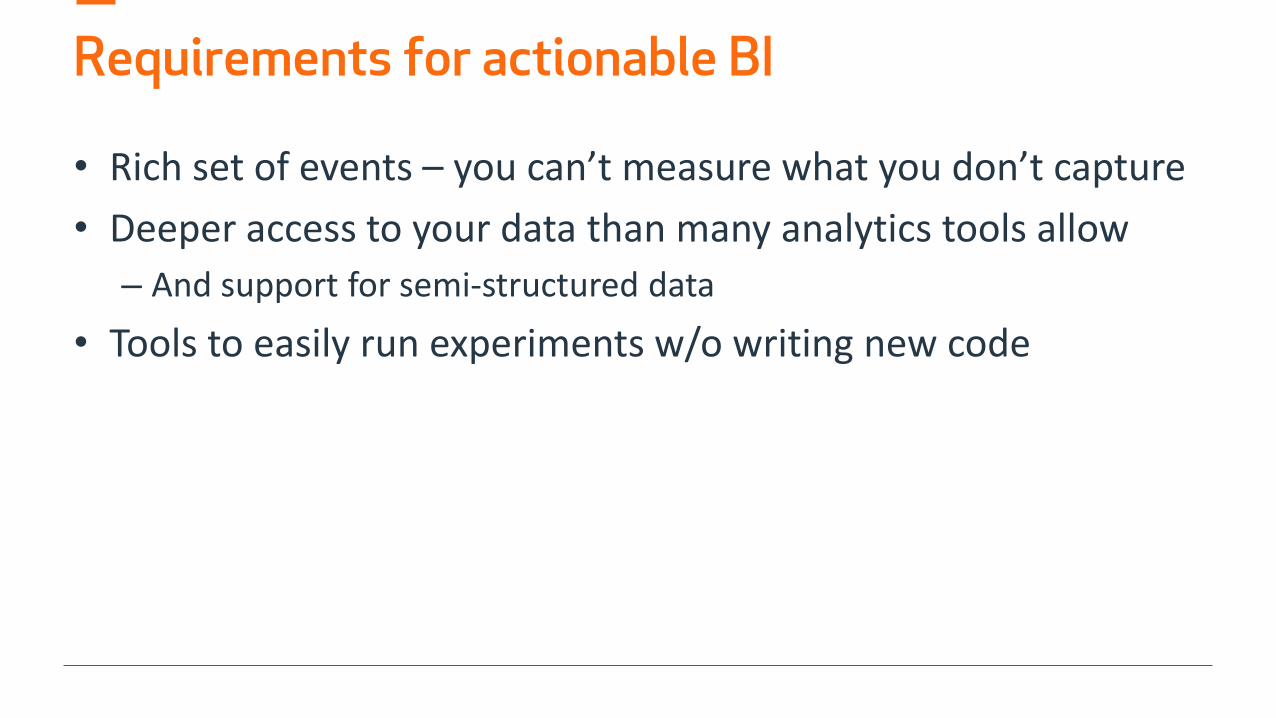
Requirements for actionable BI
• Rich set of events – you can’t measure what you don’t capture
• Deeper access to your data than many analytics tools allow
– And support for semi-structured data
• Tools to easily run experiments w/o writing new code

Capturing events

PlayFab + Watson Data Platform
Data
Insights
AnalyticsMachine Learning
AI
LiveOpsGameplay
Player Behavior

Demo time…
