what will keep insurance ceos awake at night in 2001? an update & outlook for the us &...
TRANSCRIPT

What Will Keep Insurance CEOs Awake at Night in 2001?
An Update & Outlook for the US & Pennsylvania Property/Casualty Insurance
Industry for 2001 and Beyond
Pennsylvania Association of Mutual Insurance CompaniesUnderwriting & Loss Prevention Seminar
Harrisburg Hilton & Towers HotelHarrisburg, PA
November 15, 2000
Robert P. Hartwig, Ph.D. Vice President & Chief EconomistInsurance Information Institute 110 William Street New York, NY 10038
Tel: (212) 669-9214 Fax: (212) 732-1916 [email protected] www.iii.org

Highlights: First Half 2000($ Millions)
2000 1999 Change
Net Written Prem. 149,301 143,335 +4.2%
Loss & LAE 115,154 106,065 +8.6%
Net UW Gain (Loss) (14,730) (7,788) +89.1%
Net Inv. Income 19,405 19,114 +1.5%
Net Income (a.t.) 10,031 14,865 -32.5%
Surplus 326,708 334,348 -2.3%
Combined Ratio 109.2 104.8 +4.4 pts.

Presentation Outline
Insomnia: Major Problem Among
Insurance CEOs
• Top 10 Reasons for Losing Sleep
• Q&A

#1PROFITS

Return on Equity (Profitability)
-2.1%
8.3%
10.5%
7.7%
9.0%
13.0%
-5% 0% 5% 10% 15%
Fortune 500
US All P/C Lines
PA Workers Comp
PA PP Auto
PA All P/C Lines
PA Homeowners
*Insurers: 1989-1998; and Fortune 500: 1990-1999.Source: NAIC, Insurance Information Institute
10-Year Average*

P/C Net Income After Taxes1993-2000* ($ Billions)
$19,316
$10,870
$20,598
$24,404
$36,819
$30,773
$22,170$20,062
$0
$5,000
$10,000
$15,000
$20,000
$25,000
$30,000
$35,000
$40,000
1993 1994 1995 1996 1997 1998 1999 2000**Estimate based on First Half 2000 data.Sources: A.M. Best, ISO.

0%
5%
10%
15%
20%
25%
US P/C Insurers All US Industries LifeDiversified Finl. Comm. Banks
ROE: Financial Services Industry Segments, 1987–2000*
* 2000 figures are estimates.Source: Insurance Information Institute

Return on Net Worth,Selected Lines in Pennsylvania
Source: NAIC, Insurance Information Institute
-70%
-60%
-50%
-40%
-30%
-20%
-10%
0%
10%
20%
Auto Homeowners Workers' Comp
10-Year Averages
Auto +10.5%
Home -2.1%
WC +7.7

Sagging Profits are the Symptom, not the Cause
•Capital/Capacity•Pricing•Fundamentals•Investments•Competition•Consolidation•Distribution•Class Action•Wall Street

#2CAPITAL/CAPACITY

$0
$50
$100
$150
$200
$250
$300
$350
1975
1976
1977
1978
1979
1980
1981
1982
1983
1984
1985
1986
1987
1988
1989
1990
1991
1992
1993
1994
1995
1996
1997
1998
1999
2000
*
Policyholder Surplus: 1975-2000* (Capital, Total P/C)
Source: A.M. Best, Insurance Information Institute
Bil
lion
s
(US
$)
•1999 Surplus = $336.3 Billion Is it a Peak?
•Increase of 0.9% over 1998, smallest gain since 1984
•Surplus decreased 2.3% in First Half 2000 to $326.7 Billion
* First Half 2000

0.5
1.3
2.0
2.8
US
Net Premiums Written to Policyholder Surplus
Source: A.M. Best, ISO, Insurance Information Institute
1998: 0.84
1999: 0.85
2000 (Forecast): 0.94

Berkshire Hathaway
12.3%
Other67.2%
USAA1.8%
Farmers1.3%
Nationwide3.1%
State Farm12.2%
Liberty2.1%
Distribution of Industry Surplus
Source: PaineWebber

Excess Capital: What to Do?
• CEOs: Buy It, Build It--They Will Come
• Policyholders: Lower my rates! Pay my dividend!
• Shareholders: Show me the money!
• Regulators: Keep your hands off of it!
• Rating Agencies: Keep your hands off of it and give it
back!

#3PRICING

Average Price Change of Commercial Insurance Renewals
1.4%
0.8%
-1.6%
-1.2%
-0.4%
-5.0%
-4.4%
-7.0%
-6.0%
-11.0%
-6.0%
-10.0%
-7.0%
-3.0%
3.5%
3.2%
3.2%
2.8%
4.1%
-2.1%
-2.8%
-1.8%
0.2%
-3.5%
-4.3%
-6.6%
-4.1%
-2.0%
-16% -14% -12% -10% -8% -6% -4% -2% 0% 2%
E&S
Umbrella
Workers' Comp
Commercial Property
CMP
General Liability
Commercial Auto
Spring 2000 Fall 99 Spring 99 Fall 98Source: Conning

Policy Renewal Premiums in Standard Commercial Lines
0.2%
0.2%
3.9%
53.5%
28.2%
12.8%
0.9%
0.2%
0.2%
0.0%
1.8%
19.6%
62.3%
14.8%
1.3%
0.3%
0.0%
0.0%
0% 10% 20% 30% 40% 50% 60% 70%
Up Over 30%
Up 21-30%
Up 11-20%
Up 1-10%
No Change
Down 1-10%
Down 11-20%
Down 21-30%
Down Over 30%
Jan-00 Jul-00
Source: Goldman Sachs

Policy Renewal Premiums in Workers’ Compensation
0.7%
1.5%
8.8%
38.0%
34.3%
13.1%
2.9%
0.0%
0.7%
2.4%
4.7%
29.9%
37.8%
22.0%
3.1%
0.0%
0.0%
0.0%
0% 5% 10% 15% 20% 25% 30% 35% 40%
Up Over 30%
Up 21-30%
Up 11-20%
Up 1-10%
No Change
Down 1-10%
Down 11-20%
Down 21-30%
Down Over 30%
Jan-00 Jul-00
Source: Goldman Sachs

-6.0%
-8.8%
-14.0%
-20.6%
-24.8%-26.6%
-30%
-20%
-10%
0%
Cumulative Workers Comp Rate/Loss Cost Changes*
Source: NCCI*Advisory Loss Costs

Average Expenditures on Auto Insurance: US vs. PA
572
596
618
637 65
166
869
170
770
4
697 70
272
272
0
687
667
657
645
642
610
634
$500
$550
$600
$650
$700
$750
1990
1991
1992
1993
1994
1995
1996
1997
1998
1999
*
2000
*
* III estimates; Sources: NAIC, Insurance Information Institute
Countrywide rates fell by 2.8% in 1998, 3.2% in
1999 (est.)

Nearby States’ Auto Insurance Expenditures & Rank, 19981138
960
769722
581
704
$0
$300
$600
$900
$1,200
Expenditures/Rank
New Jersey New York Maryland Pennsylvania Ohio US
Source: NAIC (March 2000 release), Insurance Information Institute
1 2 14 19 37

Nearby States’ Average Homeowners Insurance Premium, 1997
513469
379355
289
455
$0
$300
$600
Expenditures/Rank
New York New Jersey Pennsylvania Maryland Ohio US
Source: NAIC (March 2000 release), Insurance Information Institute
11 18 34 38 50

#4FUNDAMENTALS

95
100
105
110
115
120
Combined Ratio
P/C Industry Combined Ratio
1999 = 107.9
2000 (Est)* = 109.6
2001 Forecast* = 108.7
Combined Ratios
1970s: 100.3
1980s: 109.2
1990s: 107.7
* Based on III Earlybird Forecast
2001*

Direct Loss Ratio Trends, Selected Lines, Pennsylvania
Source: NAIC, Insurance Information Institute
40%
60%
80%
100%
120%
140%
Auto Homeowners Workers Comp

($40)
($30)
($20)
($10)
$0
$10
Underwriting Gain (Loss)1975-2000*
*I.I.I. estimate based on First Half 2000 data.Source: A.M. Best, Insurance Information Institute
Bil
lion
s
(US
$)
In 2000, P-C insurers will pay out nearly $30 billion more in claims and
expenses than they collected in premiums

U.S. InsuredCatastrophe Losses
$7.5
$2.7$4.7
$22.9
$5.5
$16.9
$8.3 $7.3
$2.6
$10.1$8.3
$3.2
0
5
10
15
20
25
89 90 91 92 93 94 95 96 97 98 99 00*
* First Half 2000.Source: Property Claims Service, Insurance Information Institute
CATs in 1990s caused
$90B in insured losses
$ Billions CATs cost insurers $750 million per month during the 1990s

3% 3%
-4%-3%
-2%
0%
-6% -6%
-4%
-1%
-10%
-5%
0%
5%
Lost-Time Claim Frequency Per Worker: On the Rise?
Source: NCCI
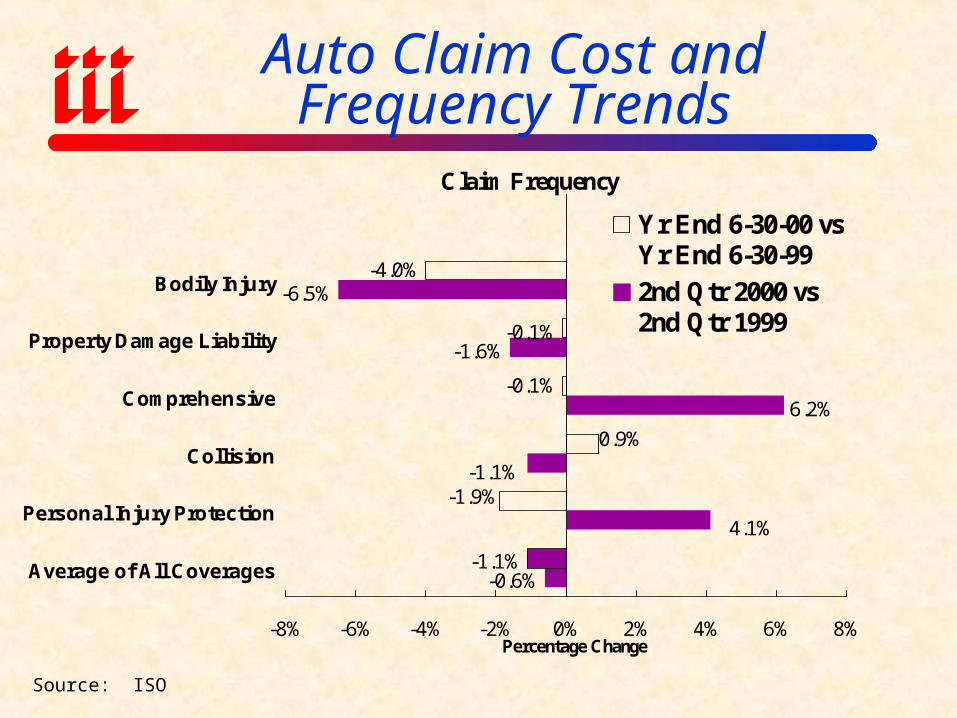
Auto Claim Cost andFrequency Trends
Claim Frequency
-0.6%
6.2%
-1.6%
-6.5%
-0.1%
4.1%
-1.1%
-1.1%
-1.9%
0.9%
-0.1%
-4.0%
-8% -6% -4% -2% 0% 2% 4% 6% 8%
Average of All Coverages
Personal Injury Protection
Collision
Comprehensive
Property Damage Liability
Bodily Injury
Percentage Change
Yr End 6-30-00 vsYr End 6-30-99
2nd Qtr 2000 vs2nd Qtr 1999
Source: ISO

Auto Claim Cost andFrequency Trends
Average Loss
10.6%
15.0%
6.0%
4.2%
5.9%
15.4%
7.8%
5.9%
13.5%
6.2%
5.5%
2.1%
0% 2% 4% 6% 8% 10% 12% 14% 16% 18%
Average of All Coverages
Personal Injury Protection
Collision
Comprehensive
Property Damage Liability
Bodily Injury
Percentage Change
Yr End 6-30-00 vs YrEnd 6-30-99
2nd Qtr 2000 vs 2ndQtr 1999
Source: ISO

Auto Claim Cost andFrequency Trends
Combined Frequency and Severity
10.0%
22.1%
4.3%
-2.6%
5.8%
20.1%
6.6%
4.8%
11.3%
7.2%
5.4%
-2.0%
-5% 0% 5% 10% 15% 20% 25%
Average of All Coverages
Personal Injury Protection
Collision
Comprehensive
Property Damage Liability
Bodily Injury
Percentage Change
Yr End 6-30-00 vs YrEnd 6-30-99
2nd Qtr 2000 vs 2ndQtr 1999
Source: ISO

#5INVESTMENTS

$0
$9
$18
$27
$36
$45
Net Investment Income
Facts
1997 Peak = $41.5B
1998 = $39.9B
1999 = $38.6B
2000 (Forecast)* = $39.2B
Source: A.M. Best, Insurance Information Institute
Bil
lion
s
(US
$)
Pricing & underwriting problems were exacerbated by declining investment income
* Estimate based on First Half 2000 results.

Interest Rates: Up, Up,But Not Away
2%
4%
6%
8%
10%
12%
14%
16%
75
76
77
78
79
80
81
82
83
84
85
86
87
88
89
90
91
92
93
94
95
96
97
98
99
00**
3-Month T-Bills 10 Year Notes
**Forecast
Source: Federal Reserve Board of Governors.
Rising interest rates reduced the market value of the
industry’s bond portfolio by $55 billion in 1999
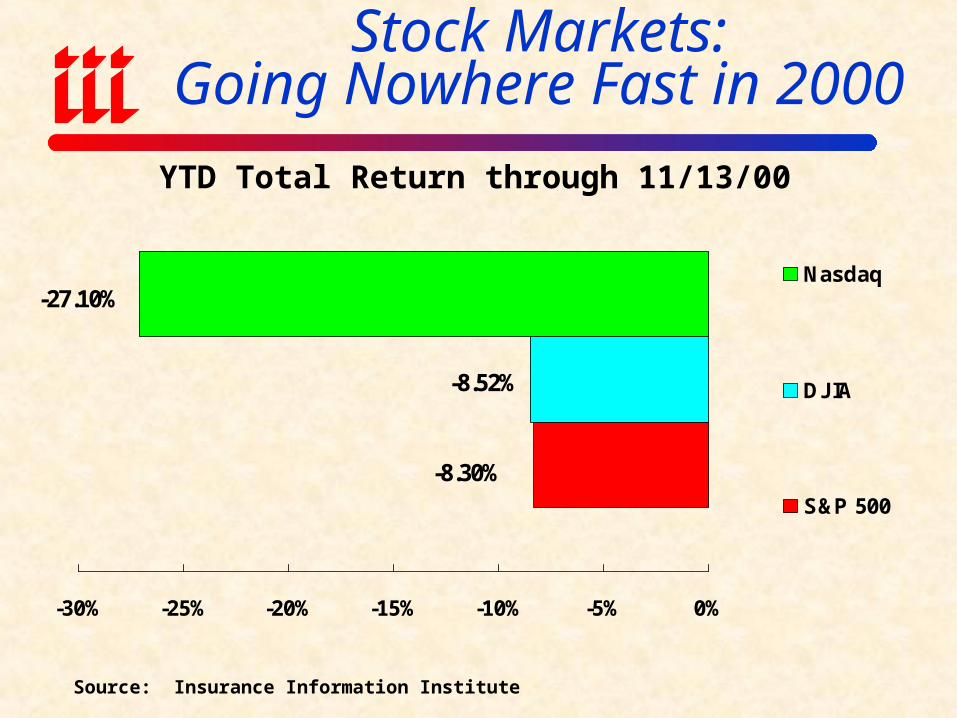
Stock Markets:Going Nowhere Fast in 2000
-8.52%
-8.30%
-27.10%
-30% -25% -20% -15% -10% -5% 0%
Nasdaq
DJIA
S&P 500
Source: Insurance Information Institute
YTD Total Return through 11/13/00

#6COMPETITION

Competition—Still on the Rise: Number of Insurers: 1970-1998
1095 1059
15751702
2406 2430 2485 2480
1802 17461958
2261 2195
17151563
0
500
1,000
1,500
2,000
2,500
3,000
1970 1975 1980 1985 1990 1995 1998 1999
Property/Casualty
Life/Health
Sources: P/C: A.M. Best; L/H: NAIC.

Market Share of Top 5 P/C Insurers
30.2%
29.7%
29.3%
28.5%
1995 1997 1998 1999
Source: Insurance Information Institute Fact Book (annual issues)

Market Share of Top 5 Life/Health Insurers
14.0%
17.0%18.0%
1997 1998 1999
Source: Insurance Information Institute Fact Book (annual issues)

0%
5%
10%
15%
20%
25%
U.S.
Source: A.M. Best, ISO, Insurance Information Institute
Growth in Net Premiums Written (All P/C Lines)
2000 est.; 2001 forecast from III Earlybird Survey
1999: 1.9%
2000 Est: 5.2%
2001 Forecast: 7.0%
The underwriting cycle went AWOL in the 1990s.
Is it Back?
2001*

#7CONSOLIDATION

Insurance Mergers and Acquisitions
7.1 6.9 8.6 5 8.5 12.527
40.856.2
41.6
11.3
243 246
171 188149
221
349382
433
161
472
$0
$20
$40
$60
$80
$100
$120
$140
$160
$180
89 90 91 92 93 94 95 96 97 98 99 00*
Val
ue
of M
& A
s ($
bill
ion
s)
0
100
200
300
400
500
600
Nu
mb
er o
f M
& A
s
Value of Deals Number of Deals
*First Half 2000Source: Compiled from Conning & Company reports.
1998: 565 deals valued at $165.4 B

Number of Deals: First Half 2000 vs. First Half 1999
3034
18 2016
2824
57
73
105
P/C Life Health/MC Service Distribution
Source: Conning
19992000
Total = 161 Total = 244
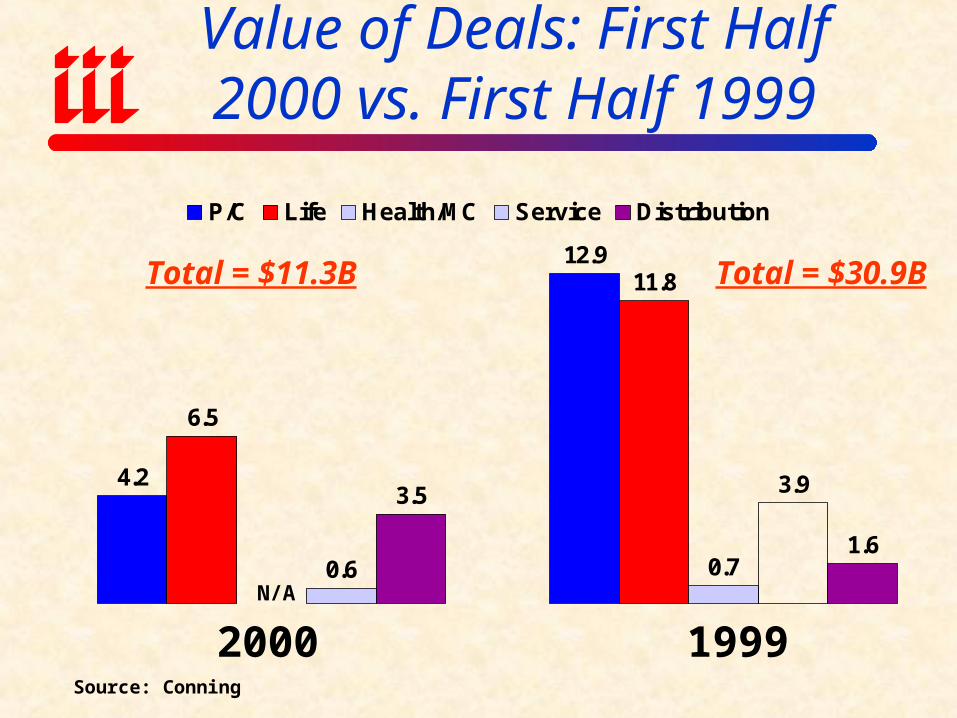
Value of Deals: First Half 2000 vs. First Half 1999
4.2
12.9
6.5
11.8
0.70.6
3.5
1.6
3.9
P/C Life Health/MC Service Distribution
Source: Conning
19992000
Total = $11.3B Total = $30.9B
N/A

#8DISTRIBUTION

Small Insurance Firms Lag in Web Access and Exposure
Source: The Industry Standard, Summer 2000
Percentage of Small Firms with Internet Access
82%
70%
56%
0%10%20%30%40%50%60%70%80%90%
Real EstateAgencies
Law Firms InsuranceFirms andAgencies
Percentage of Small Firms with Their Own Web Site
30%
41%
23%
0%5%
10%15%20%25%30%35%40%45%
Real EstateAgencies
Law Firms InsuranceFirms andAgencies

Web Presence of the Nation's 250 Largest P/C Companies
Source: John P. Franzis, PricewaterhouseCoopers Management
No Web Site Whatsoever
27.5%
Transaction Sites: Real Time Quotes
but No Sales7.2%
Rudimentary E-Mail Quote
Forms4.0%
Processor Sites: Quotes, Sales, and
Claims Online0.4%
Billboard Sites: No Quotes or
Transactions60.9%

Shifting Distribution Channels: Property/Casualty Insurers
Source: Datamonitor
20031998
Direct Response
10.0%Banks8.1%
Internet7.3%
Other2.5%
Independent Agents23.3%
Captive Agents48.8%
Direct Response
9.8%Banks2.8%
Internet0.9%
Other3.0%
Independent Agents27.0%
Captive Agents56.5%

Projected Online Sales of Auto, Home & Term Life Insurance
0
500
1000
1500
2000
2500
3000
3500
Auto Home Term Life
1998
1999
2000
2001
2002
2003
Source: Forrester Research
$ Millions

Life = $1.3B27%
Home = $0.3B6%
Auto = $3.2B67%
Internet Insurance Sales Forecast, 2003
Source: Conning & Co. (Life), Forrester Group (Auto & Home)
(Online-closed sales=Total $4.8 Billion)

Small-Commercial Market’s Internet Potential
Source: Connings MarketStance
Extremely Interested
($.8 B)1.5%
Very Interested
($2.3 B)4.6%
Not at All Interested($23.0 B)
45.9%
Somewhat Interested
($7.5 B)14.9%
Not Very Interested($ 16.7 B)
33.2%Total Written Premium
($50.2 Billion)

Internet Ready Small-Commercial Market Written Premium Potential
Source: Connings MarketStance
Retail Trade($1,252 Mil)
14.9%
TCPU($700 Mil)
8.3%
Mfg($767 Mil)
9.1%Construction($1,622 Mil)
19.3%
Agriculture($96 Mil)
1.1%
Services($1,665 Mil)
19.8%
FIRE($433 Mil)
5.2%
Wholesale Trade
($1,858 Mil)22.1%
Total Written Premium($8.4 Billion)

Distribution Channels Continue to Proliferate
Customer InsurerAgent Broker
Mail Telephone
Bank
Internet Dealerships Payroll Plans
Stock Exchanges
Online Auctions (e.g. Priceline.com)
????

Insurers: Tangled in the Web?

#9CLASS ACTION
ABUSE

TORT-ure
• Aftermarket Parts• Medical Claims Review• Totaled Cars (CCC/ADP)• Guns• Genetically Modified Foods (Corn)• Y2K Sue & Labor• HMOs• Nursing Homes/Med Mal• Tobacco• Technology (Toshiba/Microsoft)• Redlining• Toxic Mold

Median Jury Award for Personal Injury Cases
50,000
45,000
48,096
39,054
45,000
50,000 50,000
$30,000
$35,000
$40,000
$45,000
$50,000
$55,000
93 94 95 96 97 98 99
Source: Jury Verdict Research

Average Jury Awards1993 vs.1999
520759
175 324 249
1,9531,444
1,004
1,727
316 457
2,9593,495
7,361
$0
$1,000
$2,000
$3,000
$4,000
$5,000
$6,000
$7,000
Overall BusinessNegligence
VehicularLiability*
PremisesLiability
PersonalNegligence
MedicalMalpractice
ProductsLiability
($00
0)
1993 1999
*Comparison is between 1994 and 1999.Source: Jury Verdict Research; Insurance Information Institute.

Median Jury Award for Product Liability Cases
500,300 434,247 497,000
702,500550,000
1,257,000
1,806,000
$200,000
$500,000
$800,000
$1,100,000
$1,400,000
$1,700,000
$2,000,000
93 94 95 96 97 98 99
Source: Jury Verdict Research

Median Punitive Damage Award by Case Type
1,229,080
956,470
652,000
277,875194,180
94,700
250,000
$0
$200,000
$400,000
$600,000
$800,000
$1,000,000
$1,200,000
$1,400,000
Securities OtherCommercial
Insurance OtherContracts
Employment Real Property Overall
(1985-1994, $1992)
Source: Jury Verdict Research

#10WALL STREET

Insurer 1999 Stock Performance
-25.65%
-9.62%
-6.54%
-3.08%
20.95%
-30% -20% -10% 0% 10% 20% 30%
S&P 500
Banks
All Insurers
L/H
P/C
Source: SNL Securities, Insurance Information Institute
Total Return

IPO Champs
458%
474%
482%
483%
525%
606%
698%VA Linux
Theglobe.com
Foundry Networks
FreeMarkets
Cobalt Networks
Marketwatch.com
Akamai Technologies
Source: Hoover’s
Biggest First-Day Jumps from Offer Price to Close
$145 31610/29/99
$97 ½1/15/99
$128 1811/5/99
$28012/10/99
$156 ¼9/28/99
$63 ½11/13/99
$239 ¼12/9/99
1st Day CloseDate

Insurance Stock Performance:What a Difference a Year Makes
26.95%
28.52%
32.32%
39.25%
10.89%
-7.03%
-7.78%
-25.57%
-30% -20% -10% 0% 10% 20% 30% 40% 50%
Nasdaq
DJIA
S&P 500
Banks
Multiline
All Insurers
Life/Health
P/C
Source: SNL Securities, Insurance Information Institute
YTD Total Return through November 10, 2000

Insurance Stock Performance:Since Tech Crash Began
57.6%
-2.1%
74.0%
67.2%
69.6%
57.6%
24.5%
-40.0%
-50% -40% -30% -20% -10% 0% 10% 20% 30% 40% 50% 60% 70% 80%
Nasdaq
S&P 500
Banks
P/C
Brokers
Life/Health
All Insurers
Multiline
* NASDAQ peaked on March 10, 2000 at 5048.62Source: Insurance Information Institute, SNL Securities
Total Return: March 10 through November 10, 2000*

Insurance Stock Performance:Since Tech Crash Began
-4.0%
48.6%
44.3%
41.0%
36.2%
35.7%
13.3%
-27.4%
-40% -20% 0% 20% 40% 60%
Nasdaq
S&P 500
Banks
Life/Health
P/C
All Insurers
Brokers
Multiline
* NASDAQ peaked on March 10, 2000 at 5048.62Source: Insurance Information Institute, SNL Securities
Total Return: March 10 through July 28, 2000*

Dot-Com to Dot-Gone?
Source: Stockpoint.com, Insurance Information Institute.
Price: June 8 52-Week High Low
QUOT: $2.91 $13.63 $2.91
INSW: $3.00 $44.00 $2.09

Insurance Information Institute On-Line
Download this presentation at: http://www.iii.org/media/pennsylvania/index.htm