west indian journal of engineering - uwi st....
TRANSCRIPT

WEST INDIAN
JOURNAL
OF ENGINEERING
Editorial……………………………………………………………………………….…………….……. . 2
Cyclic Capacity of Shear Walls with Caribbean Timber ………......……….......………........………........ 4
Marine Current Power Generation in Trinidad: A Case Study ……………………………………………. 15
Optimisation of Water Absorption Properties of Orange Peel Particulate-based Epoxy Composite Using Grey Relational Analysis …………………………………………………………………....….. .. 25
Experimental Investigation on Tribological Behaviour of Carbon Steels………………………………… 36
Seismic Fragility Functions for Light URM Single-Story Residential Structures in Trinidad and Tobago ………………………………………………………..………………………………………….... 40
Survey and Modeling of Protected Agriculture Environment Systems in Trinidad and Tobago …………. 46
Wear Characteristics of Aluminide Blend for Thermal Barrier Coatings Bond Coat …….…….…….….. 58
Mechanical, Abrasion and Water Absorption Characteristics of Coconut Shell Ash and Charcoal Based
Polyester Composites ……………………………………………………..…………………………….. 65
Exploring Contemporary Perspectives for Managing Projects in Organisations: A Review …….………. 72
Effects of Water Content and Compaction on Ball Movement on Major Cricket Pitch Soils in
Trinidad ………………………….……….……….……….……… ……………………… …………… 83
Call for Papers Special Issue: “Capstone Projects of Engineering and Associated Disciplines in the Caribbean ….…… 90
Published by: Faculty of Engineering, The University of the West Indies
St Augustine, Trinidad and Tobago, West Indies
Volume 39 • Number 2 (ISSN 0511 5728) • January 2017 .

WEST INDIAN JOURNAL OF ENGINEERING
The WIJE Editorial Office Faculty of Engineering, The University of the West Indies, St Augustine
The Republic of Trinidad and Tobago, West Indies Tel: (868) 662-2002, ext. 83459; Fax: (868) 662-4414;
E-mail: [email protected] Website: http://sta.uwi.edu/eng/wije/
The West Indian Journal of Engineering, WIJE (ISSN 0511-5728) is an international journal which has a focus on the Caribbean region. Since its inception in September 1967, it is published twice yearly by the Faculty of Engineering at The University of the West Indies (UWI) and the Council of Caribbean Engineering Organisations (CCEO) in Trinidad and Tobago. WIJE aims at contributing to the development of viable engineering skills, techniques, management practices and strategies relating to improving the performance of enterprises, community, and the quality of life of human beings at large. Apart from its international focus and insights, WIJE also addresses itself specifically to the Caribbean dimension with regard to identifying and supporting the emerging research areas and promoting various engineering disciplines and their applications in the region.
The Publications and Editorial Board Professor Stephan J.G. Gift, Chairman (Dean, Faculty of Engineering), UWI; E-mail: [email protected]
Professor Edwin I. Ekwue, Vice-Chairman (Deputy Dean, R & PG Students Affairs), UWI; E-mail: [email protected]
Professor Brian Copeland, Member (Immediate Past Chairman), UWI; E-mail: [email protected]
Professor Kit Fai Pun, Member (Editor-in-Chief), UWI; E-mail: [email protected]
Professor Winston A. Mellowes, Member (Immediate Past Editor), UWI; E-mail: [email protected]
Professor Boppana V.Chowdary, Member (Mechanical & Manufacturing Engineering), UWI; [email protected]
Dr. Bheshem Ramlal, Member (Geomatics Engineering and Land Management), UWI; E-mail: [email protected] Dr. Fasil Muddeen, Member (Electrical & Computer Engineering), UWI; E-mail: [email protected]
Dr. Gail S.H. Baccus-Taylor, Member (Chemical Engineering), UWI; E-mail: [email protected] Mr. Francis R. Charles, Member (Civil & Environmental Engineering), UWI; E-mail: [email protected]
International Editorial Advisory Committee Professor Andrew K.S. Jardine, University of Toronto, Toronto, Canada; E-mail: [email protected]
Professor Andrew Wojtanowicz, Louisiana State University, Louisiana, USA; E-mail: [email protected]
Professor Clive E. Davies, Massey University, Palmerston North, New Zealand; E-mail: [email protected]
Professor David Brown, McGill University, Montréal (Québec) Canada; E-mail: [email protected]
Professor John Yilin Wang, The Pennsylvania State University, Pennsylvania PA, USA; E-mail: [email protected] Professor Joseph K. Ssegawa, University of Botswana, Gaborone, Africa; E-mail: [email protected] Professor Marehalli G. Prasad, Stevens Institute of Technology, Hoboken, New Jersey, USA, E-mail: [email protected] Professor Nageswara Rao Posinasetti, University of Northern Iowa, Cedar Falls IA, USA, E-mail: [email protected] Professor Richard Hobbs, University of Durham, Durham, U.K.; E-mail: [email protected]
Professor Prasanta Kumar Dey, Aston University, Birmingham, UK; E-mail: [email protected]
Professor Sreekala G. Bajwa, North Dakota State University, Fargo ND, USA; E-mail: [email protected]
Professor V.M. Rao Tummala, Eastern Michigan University, Ypsilanti MI, USA; E-mail: [email protected] Dr. Albert H.C. Tsang, The Hong Kong Polytechnic University, Kowloon, Hong Kong, China; E-mail: [email protected] Dr. Henry Lau, University of Western Sydney, Parramatta Campus, Sydney, Australia; E-mail: [email protected]
Dr. Jeffery A. Jones, University of Warwick, Coventry, UK; E-mail: [email protected] Dr. Kiran Tota-Maharaj, University of Greenwich, Chatham Maritime, Kent, U.K.; E-mail: [email protected]
Dr. Kwai-Sang Chin, City University of Hong Kong, Kowloon, Hong Kong, China; E-mail: [email protected]
Editorial Sub-Committee Professor Kit Fai Pun, Chairman and Editor (Office of Industrial Engineering), UWI; E-mail: [email protected]
Dr. Chris Maharaj, Vice Chair (Mechanical & Manufacturing Engineering), UWI; E-mail: [email protected]
Ms. Crista Mohammed, Member (Electrical & Computer Engineering), UWI; E-mail: [email protected]
Mrs. Marlene Fletcher-Cockburn, Member (Outreach Office), UWI; E-mail: [email protected]
Mrs. Paula Wellington-John, Member (Systems Laboratory), UWI; E-mail: [email protected]
Mr. Kevon Andrews, Technical Support (Website Project), UWI; E-mail: [email protected]
To order subscriptions or report change of address, simply fill in the required information on the Subscription Order Form provided at the back of the Journal or downloaded from the WIJE website, and/or write to: The Editor-in-Chief, The Editorial Office, West Indian Journal of Engineering, c/o Block #1, Faculty of Engineering, The University of the West Indies, St Augustine, Trinidad and Tobago, West Indies. Fax: (868) 662 4414; Emails: [email protected]; [email protected]

WIJE; Vol. 39, No.2, January 2017
1
WEST INDIAN JOURNAL
OF ENGINEERING
2 Editorial
4 Cyclic Capacity of Shear Walls with Caribbean Timber by William A. Wilson, Rupert G. Williams, Surchee Babwah and Vinisha
Ramsingh
15 Marine Current Power Generation in Trinidad: A Case Study by Kashawn Hall and Gyan Shrivastava
25 Optimisation of Water Absorption Properties of Orange Peel
Particulate-based Epoxy Composite Using Grey Relational
Analysis by Oluwaseyi A. Ajibade, Johnson O. Agunsoye, and Sunday A. Oke
36 Experimental Investigation on Tribological Behaviour of Carbon
Steels by Steven Odi-Owei and Amandi S. Onuba
40 Seismic Fragility Functions for Light URM Single-Story
Residential Structures in Trinidad and Tobago by Richard P. Clarke
46 Survey and Modeling of Protected Agriculture Environment
Systems in Trinidad and Tobago by Shreedevi Sahadeo, Edwin I. Ekwue, and Robert A. Birch
58 Wear Characteristics of Aluminide Blend for Thermal Barrier
Coatings Bond Coat by Muhammed O.H. Amuda, Modupe A. Onitiri, and Victor M. Hopo
65 Mechanical, Abrasion and Water Absorption Characteristics of
Coconut Shell Ash and Charcoal Based Polyester Composites by Oladele I. Oluwole and Kupolusi L. Oluwaseun
72 Exploring Contemporary Perspectives for Managing Projects in
Organisations: A Review by Neisha Hyatali and Kit Fai Pun
83 Effects of Water Content and Compaction on Ball Movement on
Major Cricket Pitch Soils in Trinidad by Edwin I. Ekwue, Amar Ramsumair, and Robert A. Birch
90 WIJE Vol.40, No.2 January 2018: Call for Papers Special Issue: “Capstone Projects of Engineering and Associated
Disciplines in the Caribbean”
Volume 39 • Number 2
(ISSN 0511-5728) • January 2017
The Editorial Office West Indian Journal of Engineering
Faculty of Engineering The University of the West Indies
St Augustine The Republic of
Trinidad and Tobago West Indies
Tel: (868) 662-2002, ext. 83459 Fax: (868) 662-4414
E-mails: [email protected]; [email protected]
Website: http://sta.uwi.edu/eng/wije/
Editor-in-Chief:
Professor Kit Fai Pun
The Publication and Editorial Board of the West Indian Journal of Engineering, WIJE (ISSN 0511-5728) shall have exclusive publishing rights of any technical papers and materials submitted, but is not responsible for any statements made or any opinions expressed by the authors. All papers and materials published in this Journal are protected by Copyright. One volume (with 1-2 issues) is published annually in July and/or January in the following year. Annual subscription to the forthcoming Volume (2 Issues): US$15.00 (Local subscription); and US$25.00 (By airmail) or equivalent in Trinidad and Tobago Dollars. Orders must be accompanied by payment and sent to The Editorial Office, The West Indian Journal of Engineering, Block 1, Faculty of Engineering, UWI, Trinidad and Tobago. Copyright and Reprint Permissions: Extract from it may be reproduced, with due acknowledgement of their sources, unless otherwise stated. For other copying, reprint, or reproduction permission, write to The Editorial Office, WIJE. All rights reserved. Copyright© 2017 by the Faculty of Engineering, UWI. Printed in Trinidad and Tobago. Postmaster: Send address changes to The Editorial Office, The West Indian Journal of Engineering, Faculty of Engineering, UWI, Trinidad and Tobago, West Indies; Printed in Trinidad and Tobago.

WIJE; Vol. 39, No.2, January 2017
2
Editorial
During the year of 2016, the Journal had received a total of 35 research and technical papers seeking for possible publication. After the peer review process, a total of 20 papers were accepted for publications in two previous issues (Volume 38 Number 2, January 2016 and Volume 39 Number 1, July 2016), yielding a successful acceptance rate of 57.1%. On behalf of the WIJE Sub-committee, we gratefully acknowledge the voluntary contributions and unfailing support that both authors and our reviewers gave to the Journal. We take this opportunity to wish all authors and reviewers a very successful year of 2017.
This Volume 39 Number 2 includes ten (10) research articles. The relevance and usefulness of respective articles are summarised below.
W.A. Wilson, et al., “Cyclic Capacity of Shear Walls with Caribbean Timber”, report the findings of an experimental programme that utilised shear walls, constructed with Caribbean Pitch Pine framing and Brazilian plywood sheathing under cyclic reversed loading protocol. The programme was conducted in accordance with the American Standard for Testing Materials, ASTM E-2126-11. Various performance characteristics were investigated including peak load, peak displacement; failure load and failure displacement; maximum shear strength, stiffness and ductility. The unit shear capacity obtained from the study compared favourably within 10% of the tabulated values in the 2008 Special Design Provisions for Wind and Seismic (SDPWS-2008) for shear walls with similar materials and construction.
In their article, “Marine Current Power Generation in Trinidad: A Case Study”, K. Hall. and G. Shrivastava examine the feasibility of marine power generation at the 14 km wide Serpent’s Mouth in Trinidad. It is part of the narrow Columbus Channel which lies between Trinidad and Venezuela. At this location, depth varies between 30 - 48 m and a marine current of approximately 1.5 m/s suggests the possibility of generating power through submerged turbines. The conditions are similar to those at Strangford Lough in the Irish Sea, where the world’s first marine current turbine was installed in 2008 for generating 2 MW of power. After taking into account the technical, environmental, and economic factors, this paper concludes it is feasible to use The Serpent’s Mouth location for Power Generation.
O.A. Ajibade, at al., “Optimisation of Water Absorption Properties of Orange Peel Particulate-based Epoxy Composite Using Grey Relational Analysis”, examine the water absorption capabilities of the Orange peel particulate (OPP) epoxy composite optimisation. The weight gain (WG-type) and water absorption (WA-type) were chosen as the target output variables for the water absorption process optimisation of the pure epoxy and 5 % OPPs composite. The level of influence each of the controllable factors exercises on the water absorption
properties of the materials was investigated by evaluating the strength of the correlation between their sequences using the grade matrix of the grey relational tool. The sequential order of importance for the epoxy and its composite were found to be different for the two output variables considered. Overall, the final mass was found to be the most significant factor.
S. Odi-Owei and A.S. Onuba, “Experimental Investigation on Tribological Behaviour of Carbon Steels”, investigate into the friction coefficient and wear rate of carbon steel specimens, in contact with Titanium Nitride of PVD coating on a steel substrate. The experiment was carried out with the specimens in the form of a pin sliding against a TiN disc under unlubricated conditions on a pin-on-disc tribometer. Results obtained show that friction coefficient and wear rate vary with normal load, sliding speed and duration of rubbing. Friction coefficient decreased with increasing rubbing duration and decreasing sliding speed, while wear rate increased with increasing rubbing duration. It was also found that in comparison, the specimen with higher carbon content had a better tribological behaviour.
In the third article, “Seismic Fragility Functions for Light URM Single-Story Residential Structures in Trinidad and Tobago”, R.P. Clarke discusses the need for addressing the issue of single-story light unreinforced masonry (URM) residential structures that would be prone to sliding and out-of-plane tilting instability. Trinidad and Tobago locates in the southern Caribbean which is a seismic region, and hence losses due to failure of this type of construction will be catastrophic. The author presents the fragility functions and the determination using incremental dynamic analysis implemented with the Zeus-NL computer program.
S. Sahadeo, et al., “Survey and Modeling of Protected Agriculture Environment Systems in Trinidad and Tobago”, report the findings of a recent survey conducted to investigate the problems faced by farmers who operated these systems (greenhouses) in the country. It was found that the overall design of the structures was not suited to the local climate and the structures were costly. Alterations to the existing typical greenhouse design were suggested based on the options available for improving greenhouse structures. The suggested modifications of system/greenhouse designs were simulated using average climatic conditions (temperature, relative humidity and wind speed and flow trajectory). Promising results were recorded with changing both the materials used and the structure and orientation of the typical greenhouse in Trinidad and Tobago.
M.O.H. Amuda, et al., “Wear Characteristics of Aluminide Blend for Thermal Barrier Coatings Bond Coat”, explore the modification of the structural properties of conventional bond coat to improve adhesion for thermal barrier coating. Wear investigation and

WIJE; Vol. 39, No.2, January 2017
3
microstructural analysis conducted on the surface modified substrates revealed different levels of interfacial diffusion resulting in differential wear co-efficient in the modified substrates. Among the substrates coated, mild steel exhibited the greatest resistance to wear followed by compacted graphite iron (CGI) whilst cast iron provided the least resistance. This suggests that the generated aluminide blend can be used to enhance the surface of mild steel preparatory to the application of thermal barrier coating.
In their article, “Mechanical, Abrasion and Water Absorption Characteristics of Coconut Shell Ash and Charcoal Based Polyester Composites”, O.I. Oluwole
and K.L. Oluwaseun investigate the mechanical, abrasion and water absorption properties of composites made from coconut shell particulates and unsaturated polyester resin. Experimental results showed that tensile and flexural properties of the composites increased as the coconut shell ash (CSA) particle content increases from 1-5 wt.% used while these mechanical properties decreases as the content of coconut shell charcoal (CSC) increases. The abrasion resistance of the composites decreases as the reinforcement contents increase for both CSA and CSC composites. CSA samples showed least resistance to abrasion compared to CSC while the control sample displayed the highest wear rate. Similar trend was observed for water absorption response where initial sharp water uptake was followed by gradual increase until saturation of water content was achieved. SEM and EDX revealed the dispersal of the particulates within the matrix and elemental constituents of the fabricated composites, respectively.
N. Hyatali and K.F. Pun, “Exploring Contemporary Perspectives for Managing Projects in Organisations: A Review”, discuss some current challenges faced in organisations, and identify the changing nature of projects and the project management (PM) environment that support a rethinking of PM, particularly for business/organisational projects. Two contemporary PM perspectives, namely, ‘Projects as Temporary Organisations’ (PTO) and ‘Management of Projects’ (MoP), are advocated. The paper then discusses the need to integrate strategic alignment, project dynamics and value creation, into a generic model for managing projects in organisations. Future work would focus on evaluating the efficacy of the model with empirical evidence.
In the article, “Effects of Water Content and Compaction on Ball Movement on Major Cricket Pitch Soils in Trinidad”, E.I. Ekwue, et al., follow an earlier study to measure the physical and engineering properties of major soils used in cricket pitches in Trinidad. It examines whether the predictions could be confirmed when the actual ball movements are measured. Results obtained in this study coupled with those from the previous study mentioned above were used to rank the soils used in cricket pitches in Trinidad in terms of their playability. There may be an optimal clay content (about 60%) of soil for maximum bounce and pace of the cricket
ball. On behalf of the Editorial Office, we gratefully
acknowledge all authors who have made this special issue possible with their research work. We greatly appreciate the voluntary contributions and unfailing support that our reviewers give to the Journal.
Our reviewer panel is composed of academia, scientists, and practising engineers and professionals from industry and other organisations as listed below:
• Dr. Abrahams Mwasha, University of the West Indies (UWI), Trinidad & Tobago (T&T)
• Dr. Chris Maharaj; UWI, T&T
• Dr. Debbie Mohammed; UWI, T&T
• Professor Edwin I. Ekwue; UWI, T&T
• Dr. Isiaka O. Oladele; Federal University of Technology, Akure. Nigeria
• Dr. Jacqueline Bridge; UWI, T&T
• Dr. Jeffery A. Jones; University of Warwick, UK
• Professor Kit Fai Pun; UWI, T&T
• Ms. Legena Henry; UWI, T&T
• Ms. Marcia Nathai-Balkissoon; UWI, T&T
• Professor Marehalli G. Prasad; Stevens Institute of Technology, New Jersey, USA
• Dr. Mark Wuddivira; UWI, T&T
• Professor Nageswara Rao Posinasetti; University of Northern Iowa, Cedar Falls, USA
• Professor Peter Hogarth; Bournemouth University, UK
• Dr. Phulip O. Oladijo; Botswana International University of Science and Technology, Gaborone, Botswana
• Dr. Pieter W van Deventer; North West University, South Africa
• Professor Prakash Persad; University of Trinidad and Tobago, T&T
• Professor R. Lal Kushwaha; University of Saskatchewan, Canada
• Ms. Rebecca M. Y. Yiu; UWI, T&T
• Dr. Reynold Stone; UWI, T&T
• Professor Sreekala G. Bajwa; North Dakota State University, Fargo, USA
• Professor Yuh-Shan Ho; Taipei Medical University, Taipei, Taiwan
The views expressed in articles are those of the authors to whom they are credited. This does not necessarily reflect the opinions or policy of the Journal.
KIT FAI PUN, Editor-in-Chief
Faculty of Engineering, The University of the West Indies,
St Augustine, Trinidad and Tobago West Indies
January 2017

W.A. Wilson et al.: Cyclic Capacity of Shear Walls with Caribbean Timber 4
Cyclic Capacity of Shear Walls with Caribbean Timber
William A. Wilson a,Ψ, Rupert G. Williamsb, Surchee Babwahc and Vinisha Ramsinghd
Department of Civil and Environmental Engineering, Faculty of Engineering, The University of the West Indies, St. Augustine Campus, Trinidad and Tobago, West Indies;
aE-mail: [email protected] bE-mail: [email protected]
cE-mail: [email protected] dE-mail: [email protected]
Ψ Corresponding Author
(Received 23 February 2016; Revised 8 June 2016; Accepted 18 August 2016)
Abstract: Timber buildings in the Caribbean are generally non-engineered structures and therefore do not have structural
systems that resist seismic forces, making the buildings highly vulnerable to earthquake damage. Shear walls are the primary
structural sub-component of the seismic force-resisting systems (SFRS) responsible for providing resistance through in-plane
shear and dissipation of energy via the sheathing-to-frame connections, and transfer of the lateral forces to the foundations.
Robust design of these elements requires reliable shear capacity data and engineering design properties for the appropriate
timber species. The unavailability of the relevant design data for Caribbean timber species has negatively impacted their use
in engineered buildings. An experimental programme utilising shear walls, constructed with Caribbean Pitch Pine framing
and Brazilian plywood sheathing under cyclic reversed loading protocol was conducted in accordance with the American
Standard for Testing Materials, ASTM E-2126-11. Various performance characteristics were investigated including peak
load, peak displacement; failure load and failure displacement; maximum shear strength, stiffness and ductility. The unit
shear capacity obtained from the study compared favourably within 10% of the tabulated values in the 2008 Special Design
Provisions for Wind and Seismic (SDPWS-2008) for shear walls with similar materials and construction.
Keywords: Timber, Buildings, Shear walls, Cyclic loading, Seismic forces, Lateral loads
1. Introduction
The vulnerability of timber buildings to earthquake damage could be mitigated by engineered structures to provide adequate resistance to the destructive effects of seismic forces. The Caribbean is an earthquake-prone region and residential timber structures proliferate and less so non-residential timber buildings. Consequently, engineered timber structures with enhanced earthquake-resistance performance in the Caribbean should be promoted. The design of these buildings should be informed by sound engineering principles and construction technology. Further, the availability of appropriate building codes and reliable design data for shear walls constructed with Caribbean timber species must be developed.
Earthquake-resistant design facilitates the complex load transfer mechanisms in building structures subjected to seismic loads by incorporating an effective lateral force-resisting system to safely transmit the induced forces to the foundations. The Seismic Force Resisting System (SFRS) comprises the horizontal diaphragms (roof and floors), shear walls, inter-component connections and foundation anchorage. The seismic forces are cyclic in nature and are induced as lateral forces to the diaphragms then transmitted through the inter-element connections to the shear walls, which
then transfer the resulting shear and uplift forces to the building foundations. Thus, the shear walls are the primary structural sub-components providing seismic-resistance capacity in timber buildings through in-plane shear and dissipation of energy via the sheathing-to-frame connection. Effective design of these elements is based on the availability of reliable shear wall capacity data and engineering design properties of the identical constituent materials for applicable loading conditions. Hence, for seismic shear wall design the relevant data is usually derived from cyclic testing of prototype walls simulating the action of seismic forces.
Current engineering trends in the Caribbean region facilitates adaptation of North American codes for design of structures and thus, timber buildings design may be based on the 2012 National Design Specification for Wood Construction, NDS-2012 (ANSI/AWC, 2012) and the 2008 Special Design Provisions for Wind and Seismic SDPWS-2008 (ANSI/AWC, 2008). The latter code includes provisions and shear capacity data for the design of shear wall panels with North American species. However, adaptation of these codes for engineering designs utilising Caribbean timber species necessitate the development of a database of design data for shear walls of similar materials and construction,
This paper presents the results of an experimental investigation of the cyclic capacity of shear walls framed
ISSN 0511-5728 The West Indian Journal of Engineering
Vol.39, No.2, January 2017, pp.4-14

W.A. Wilson et al.: Cyclic Capacity of Shear Walls with Caribbean Timber 5
with Caribbean Pitch Pine (Pinus Caribbea) species; and supplements ongoing research aimed at developing engineering design data for the design of hurricane and earthquake resistant timber buildings (Wilson, et al, 2014). The study provides relevant nominal shear capacities for designs in accordance with the SDPWS-2008 (ANSI/AWC, 2008). 2. Literature Review
Research on timber shear walls has been ongoing for over sixty years with much of the work being conducted in North America and Asia where timber is utilised extensively in low-rise residential buildings (Emerson, 2002). The capacity of timber shear walls to resist wind and seismic forces is determined by conducting racking tests on wall specimens. Shear wall capacity is influenced by several variables including: shear strength, stiffness, sheathing type, frame material, sheathing-to-framing connections, aspect ratios, openings and loading protocol. Experimental investigations of the various parameters that affect the shear capacity of timber shear walls have been conducted by various researchers including, inter alia, Tuomi and McCutcheon (1978 ), Itani et al. (1982), Patton-Mallory and Wolfe (1985), Cheung et al. (1988), Dolan and Madsen (1992), and Ellingwood et al (2004).
Van de Lindt (2004) presented an extensive bibliographic review of shear wall research for the period 1982 to 2004. His review examined both theoretical and experimental studies and a wide range of parameters that affect racking behavior including shear wall dimensions, sheathing types, connections, and considered both monotonic and cyclic loading conditions. More recently, studies based on monotonic testing investigated the influence of various sheathing types, wood species, construction techniques and other parameters that impact on the shear capacity. Design data for shear walls for native timber species have been developed by various researchers e.g. Kermani and Hairstans(2006); Li and Lam (2009); He et al. (1999); Yasumura (2010); Caprolu et al.(2012); Du et al. (2012); Liu et al.( 2012); He et al.( 2010); Sulistyono et al (2012); and Sartori et al.( 2012).
Cyclic testing has long been recognised as providing the best simulation of seismic load effects on shear walls. Skaggs and Rose (1996) conducted cyclic reversed testing of plywood sheathed shear walls, investigating the effects of various parameters such as strength and stiffness and the influence of the sheathing nails on the failure mechanism. The observed failure mode included nail heads pulling into the face of the plywood and separating from the framing member. Similar sheathing connection failure mechanisms were also reported by Dinehart and Shenton III (1998). Dolan and Madsen (1992) studied the behaviour of shear walls sheathed with plywood and wafer board under monotonic and slow cyclic loading, and found no
significant difference in the strength and stiffness between the two types of sheathing materials.
Comparative studies of shear wall performance under monotonic and cyclic testing have also been conducted by several researchers (e.g. Dinehart and Shenton III, 1998; He, et al, 1998; Folz and Filiatrault, 2001, Kobayashi et al, 2012) and these studies confirmed that wood shear walls performed similarly under monotonic and cyclic load testing. Further, they established that cyclic testing simulated racking behavior more precisely based on observed damage to the sheathing fasteners as observed in earthquakes. The effects of different loading protocols were also confirmed in studies by He et al. (1998) and Gatto and Uang (2003). Timber shear walls exhibit highly nonlinear load-deformation response which is influenced by the nonlinear behavior of the sheathing connectors which exhibit a degrading pinched hysteric behavior under cyclic reversed loading (Ayoub, 2007). Ellingwood et al. (2004) conducted cyclic reversed experimental studies to predict the response of the shear walls and develop seismic fragility parameters for the wood shear walls.
3. Shear Wall Tests
The experimental investigation on a full-scale plywood sheathed shear wall was conducted in the Structures Laboratory at The University of the West Indies. For this study, twelve (12) shear wall specimens of dimensions 2,400 mm x 2,400 mm constructed with local timber species and Brazilian Pine plywood were tested. A typical shear wall specimen comprised Caribbean pitch pine framing and 12 mm thick plywood vertically oriented and nailed to the frame as shown in Figure 1.
The frame comprised 50mm x 100 mm studs spaced at 600mm centers with double (2 x 50mm x 100 mm) end studs and top plate and single sole plate. Frame joints were formed using 10d common nails to connect the studs to the top and bottom plates. The fastener schedule for the sheathing comprised 8d nails spaced at 150mm on the perimeter and 305mm in the field. Fabricated steel tension ties were connected to the inner face at the joints between the end studs and base plate using 8d nails and a 16mm anchor bolt. Two series of test panels (6 each series) were fabricated with different connections at the bottom internal stud-to-sole plate joint. Series A wall panels utilised galvanised iron angle brackets to reinforce the bottom internal stud-to-plate joints, whereas, Series B wall panels utilised toe-nailed stud-to-plate joints.
The test setup is shown in Figure 2. The foundation consisted of a 305 mm x 305 mm reinforced concrete beam which was anchored to the concrete test floor using 38mm diameter anchor bolts.

W.A. Wilson et al.: Cyclic Capacity of Shear Walls with Caribbean Timber 6
Figure 1. Shear Wall Test Setup
To ensure that the lateral load was uniformly
distributed as a shear force along the top of the wall panel, a steel channel 127mm wide was attached to the full length of the top plate using 12mm (1/2”) diameter bolts at 600mm centers. Out-of-plane deflection of the test panel was prevented by a lateral bracing frame with horizontal rollers at the top of the wall panel so as to ensure pure racking displacement of the wall specimen occurred during loading. The lateral loading was applied using a computerised testing system comprising an MTS 250 kN hydraulic actuator with integral displacement Linear Variable Differential Transducers (LVDT) attached to the laboratory reaction wall.
Figure. 2. Typical Test Wall Panel
The system recorded the lateral deflection at the top of the wall panel. Additionally, dial gauges were installed to measure the diagonal distortion of the wall panel and the uplift of both end studs. 4. Loading Protocol
The cyclic reversed shear wall tests were conducted in accordance with ASTM E 2126-11 (ASTM, 2011) using the Sequential-Phased Displacement Procedure (Method A). The standard recommends testing rate based on either, (i) constant cyclic frequency ranging from 0.2 to 0.5 Hz or (ii) constant rate of displacement between 1.0 to 63.5 mm/sec. The loading protocol adopted in this study was based on a constant actuator displacement rate of 4 mm/sec and involved load cycles at incremental displacement levels. This is illustrated in Figure 3.
Figure 3. Loading Protocol (ASTM E2126-11)

W.A. Wilson et al.: Cyclic Capacity of Shear Walls with Caribbean Timber 7
The first displacement level comprised three phases, each with three fully-reversed cycles of equal amplitude, at displacements representing 25%, 50% and 75% of the anticipated First Major Event (FME) as shown in Table 1. The FME is defined as the first significant limit state to occur and is obtained by testing identical panels under monotonic loading. For this study it was taken as the yield displacement of 19.9 mm. The test was terminated
at a cycle corresponding to 400% of the FME. Failure was observed when the wall panel racking distortion became excessive with significant structural damage to the sheathing connections and uplift of the studs. The load-displacement results were continuously recorded by the computerised testing system throughout the test and an Excel plot of the load displacement curve was generated.
Table 1. Loading Protocol Applied to the Wall
5. Results
The results of the cyclic reversed tests are presented in Figures 4 and 5 for Series A and Series B test specimens, respectively. These show the hysteresis curves which demonstrate the nonlinear cyclic racking behavior of the wall panels throughout the loading history. As specified in E 2126-11, the initial envelope curve represent the peak loads from the first cycle of each phase of the load cycles, whereas, the stabilised response is defined as a decrease in load between two successive cycles of not more than 5%. Four (4) equations are used as follows:
Maximum Shear Strength,
Shear Modulus,
Ductility Factor,
Elastic Stiffness
Where,
H and L are the wall panel height and length, respectively, in (m)
P and Ppeak are the lateral load and maximum absolute load, respectively, measured at the top of the wall (kN)
Pavg-peak is the average maximum load resisted in the negative and positive directions (kN)
Pyield is the yield load - the horizontal line to the plastic portion of the envelope curve (kN). Pu is the failure load taken as 0.8 Ppeak (kN) ∆u is the failure displacement at top of the wall corresponding to Pu
∆peak and ∆yield are the absolute maximum and yield horizontal displacements, respectively, at the top of the wall (m)
∆e is the displacement at top of the wall corresponding to 0.4 Ppeak (m)
Tables 2 and 3 show the results for the shear wall cyclic response characteristics for the initial and stabilised states as specified in ASTM E2126-11, respectively. Considering the results for the initial and stabilised states presented in Tables 2 and 3, firstly, for Series A wall panels; the shear strength (Vpeak) varied from 8.96 kN/m to 7.65 kN/m and 7.82 kN/m to 6.28 kN/m for the initial and stabilised phases, respectively. For the initial phase the average to shear strength was 8.28 kN/m and for the stabilised phase the average was 6.91 kN/m. The peak shear modulus (G'peak) for the initial phase ranged from 400.98 kN/m to 295.64 kN/m with an average of 330.24 kN/m.
avg-peak
peak
P v N / m
L
P H G '
L
=
=∆
u
yield
N / mm
D =
∆∆
peak
e
0.4P k
e
=∆

W.A. Wilson et al.: Cyclic Capacity of Shear Walls with Caribbean Timber 8
Figure 4. Load Deflection Hysteresis Curves – Series A: Wall Panels

W.A. Wilson et al.: Cyclic Capacity of Shear Walls with Caribbean Timber 9
Figure 5. Load Deflection Hysteresis Curves – Series B: Wall Panels

W.A. Wilson et al.: Cyclic Capacity of Shear Walls with Caribbean Timber 10
Table 2 - Test Results from initial absolute graphs
Table 3 - Test Results from stabilised absolute graphs
Whereas for the stabilised phase, the range was 381.69 kN/m to 306.52 kN/m with an average of 330.67 kN/m. For initial phase the average peak load (Ppeak) was 20.2 kN and the average failure load (0.8Ppeak) was 16.16 kN. The average peak displacement (∆peak) was 61 mm and the average failure displacement (∆u) was 73 mm. The average initial stiffness ke for Series A wall panels was 1,242.51 kN/m.
For Series B wall panels in Tables 2 and 3; the shear strength (Vpeak) varied from 7.91 kN/m to 7.66 kN/m and
7.25 kN/m to 6.25 kN/m for the initial and stabilised cycles, respectively. For the initial phase the average to shear strength was 7.82 kN/m and for the stabilised phase the average was 6.75 kN/m. For the initial phase the peak shear modulus (G'peak) ranged from 336.84 kN/m to 285.65 kN/m with an average of 309.21 kN/m, whereas, for the stabilised phase the range was 274.34 kN/m to 252.86 kN/m with an average of 261.4 kN/m. For the initial phase the average peak load (Ppeak) was 18.8 kN and the average failure load (0.8Ppeak) was 15.35
Test Series
Wall
Specimen
#
Ppeak ∆peak G'peak Vpeak 0.8Ppeak
(PFailure) ∆u Pyield ∆yield ke
Initial
Envelope
Ductility
Factor
(kN) (m) (kN/m) (kN/m) (kN) (m) (kN) (m) (kN/m)
A
Metal bracket
stud-sole plate
joint
A1 21.88 0.074 295.64 8.97 17.50 0.074 18.66 0.052 833.43 1.42
A2 20.78 0.060 346.31 8.52 16.62 0.075 19.71 0.057 1385.39 1.32
A3 19.54 0.060 325.66 8.01 15.63 0.080 17.27 0.050 1302.76 1.61
A4 20.29 0.060 338.24 8.32 16.24 0.068 17.83 0.056 1353.06 1.21
A5 18.66 0.060 310.95 7.65 14.93 0.068 16.14 0.045 1243.90 1.51
A6 20.05 0.050 400.81 8.22 16.04 0.073 17.19 0.051 1336.49 1.43
AVG 20.20 0.061 330.24 8.28 16.16 0.073 17.80 0.052 1242.51 1.42
STDEV 1.095 0.008 36.54 0.45 0.87 0.004 1.25 0.004 206.13 0.14
B
Toe-nailed
stud-sole plate
joint
B1 18.4 0.0582 321.31 7.66 14.96 0.073 19.56 0.053 1068.57 1.37
B2 19.3 0.0580 332.76 7.91 15.44 0.075 17.95 0.041 1102.85 1.83
B3 18.9 0.0655 288.55 7.75 15.12 0.088 18.75 0.047 945 1.87
B4 19.2 0.0570 336.84 7.87 15.36 0.065 18.90 0.051 960 1.28
B5 19.1 0.060 290.15 7.88 15.28 0.072 18.65 0.050 1030.28 1.44
B6 17.9 0.062 285.65 7.82 15.92 0.070 17.25 0.045 1012.52 1.55
AVG. 18.8 0.060 309.21 7.82 15.35 0.074 18.51 0.048 1019.87 1.56
STDEV 0.54 0.003 23.70 0.094 0.33 0.008 0.80 0.004 61.01 0.24
Test Series
Wall
Specimen
#
Ppeak
(kN)
∆peak
(m)
G'peak
(kN/m)
Vpeak
(kN/m)
0.8Ppeak
(PFailure)
(kN)
∆u
(m)
Pyield
(kN)
∆yield
(m)
ke
(kN/m)
Stabilised
Envelope
Ductility
Factor
A
Metal bracket
stud-sole plate
joint
A1 17.98 0.060 381.69 7.82 15.27 0.074 17.49 0.040 763.45 1.85
A2 17.09 0.060 341.87 7.01 13.68 0.069 14.92 0.036 1526.93 1.92
A3 16.58 0.060 318.79 6.53 12.75 0.074 14.71 0.0301 1417.02 2.39
A4 17.07 0.060 341.30 6.99 13.65 0.074 15.56 0.0371 1517.03 1.96
A5 16.09 0.050 306.53 6.28 12.26 0.074 15.44 0.041 1277.29 1.80
A6 16.69 0.050 333.83 6.84 13.35 0.064 15.41 0.036 1284.10 1.78
AVG 16.87 0.057 330.67 6.91 13.49 0.072 15.59 0.037 1297.63 1.95
STDEV 0.64 0.005 25.72 0.53 1.03 0.004 0.99 0.004 283.17 0.23
B
Toe-nailed
stud-sole plate
joint
B1 15.5 0.056 274.34 6.35 12.4 0.065 15.1 0.035 1050.85 1.86
B2 17.7 0.070 252.86 7.25 14.16 0.074 17.4 0.045 1180 1.64
B3 17.2 0.068 252.94 7.05 13.76 0.076 15.52 0.031 1250.9 2.45
B4 15.5 0.057 271.93 6.35 12.4 0.064 15.49 0.046 1033.33 1.39
B5 16.4 0.064 262.74 6.25 13.12 0.070 15.2 0.401 1140.50 1.75
B6 17.6 0.072 253.56 7.20 14.08 0.072 16.85 0.042 1195.6 1.71
AVG. 16.65 0.075 261.4 6.75 13.32 .070 15.93 0.04 1141.86 1.8
STDEV 1.00 0.007 9.86 0.47 0.80 0.005 0.96 0.148 85.20 0.36

W.A. Wilson et al.: Cyclic Capacity of Shear Walls with Caribbean Timber 11
kN, whereas, the average peak displacement (∆peak) was 60 mm and the average failure displacement (∆u) was 74 mm. The average initial stiffness (ke) for Series B wall panels was 1,019.87 kN/m.
6. Analysis and Discussion
Based on the initial phases, the critical cyclic performance characteristics for Series A and Series B shear wall specimens were analysed and compared as presented in Figures 6 and 7.
Generally, the performance of Series A wall panels (with metal bracket internal stud-to-plate joints) exceeded that of Series B (with toe-nailed internal stud-to-plate joints) for all measured parameters. As indicated in Figures 6(a) and 6(b), respectively, the average failure load for Series A wall panels were greater than that of Series B wall panels by 6.5% (16.16 kN/m compared to 15.35 kN/m) whereas, the average failure displacement was almost the same (73 mm to 74 mm). The average maximum shear strength (shear capacity) of Series A walls exceeded Series B by 13% (8.28 to 7.82 kN/m) whereas, the average failure displacement was marginally greater (1.6%) as indicated in Figures 6(c) and 6(d), respectively. Figure 6 (e) indicates that the average peak shear modulus for Series A was marginally greater (6.4%), however, as indicated in Figure 6(f), the average elastic stiffness of series A specimens was 17.8% greater than Series B specimens. Finally, Figure 7 indicates that the average ductility factor was 9% greater for Series B wall panels.
The results obtained in the present study compare favourably with several studies cited in the literature considering the variations in wall construction, materials and cyclic testing protocols. Dolan and Madsen (1992) tested 2.4m x 2.4m shear walls with Spruce Pine Fir (SPF) framing and 9mm Canadian Softwood Plywood connected with 8d common nails at 100mm perimeter and 150mm field spacings and obtained ultimate load Pu of 18.2 kN (shear strength Vpeak = 7.6 kN/m). Folz and Filiatrault (2001) presented results for wall panels 2.4 m x 2.4 m using 9.5 mm oriented strand board (OSB) sheathing with 150 mm perimeter and 300mm field 8d common sheathing-to-framing nails and reported ultimate load Pu of 20.4 kN (shear strength Vpeak = 8.5 kN/m) and ultimate displacement ∆u of 66mm. Ayoub (2007) tested 2.4m x 2.4m in a two-storey shear wall construction that utilised 9.5mm Canadian Softwood Plywood connected to framing with 8d nails at 150 mm perimeter and 305 mm field spacing for the top shear walls and reported initial stiffness Ke =2.1 kN/mm, yield displacement ∆yield of 14 mm and ultimate displacement ∆u of 69.7 mm. Ayoub’s (2007) test method subjected his shear walls to both vertical and lateral loading, however, no results for shear strength were reported. Gatto and Uang (2003) tested 2.4 m x 2.4 m shear walls with Douglas Fir framing and 12 mm plywood sheathing
connected with 8d nails with perimeter spacing at 102 mm and field spacing at 305mm and reported ultimate load Pu of 31.1 kN (shear strength Vpeak =13kN/m), ultimate displacement, ∆u of 74 mm and initial stiffness Ke = 1.35 kN/mm). All of the shear walls tested in the studies cited utilised studs spaced at 406mm centres compared to 600mm adopted in the current study for which the results were Pu = 20.2 kN, shear strength Vpeak =8.3 kN/m, ∆u = 73mm and Ke = 1.24 kN/mm (initial) and Pu = 16.9 kN, Vpeak = 6.9 kN/m, ∆u = 72mm and Ke = 1.3 kN/mm (stabilised). 7. Applicability of the Study
The study revealed that wall panels with internal metal bracket stud-to-plate joints (Series A) perform better than similar walls with toe-nailed joints (Series B) when subjected to cyclic loading. The latter wall panels exhibited greater ductility than the Series A. However, this is to be expected since the effect of toe-nailing would be greater rotation of the joints with increased joint separation and uplift, as observed in the tests. This demonstrates the capacity of such walls to yield and deform inelastically, without significant loss of shear resistance, as evidenced by the similarity of maximum and failure displacements for both series of wall panels. As observed by Terentiuk and Memari (2014), high ductility does not necessarily indicate that the wall would perform adequately under seismic loading. Indeed, SDPWS-2008 does not permit the use of shear walls with toe-nail joints to transfer shear forces exceeding 3 kN/m. The primary purpose of this investigation was to obtain design values for the seismic shear capacity of walls constructed with Caribbean Pitch Pine timber framing and plywood sheathing. This would inform the design of timber shear walls for seismic loading using the SDPWS-2008. Consequently, the applicability of this study should be assessed on the basis of the results for the wall panels constructed with metal bracket studs-to-sole plate joints. The SDPWS-2008 includes provisions and nominal unit shear capacities for wood-frame Plywood shear walls constructed with Douglas Fir-Larch and Southern Pine framing based on a specific gravity of 0.5.
Furthermore, for applications using other species, the code recommends that the tabulated nominal shear capacities should be adjusted by a Species Adjustment Factor given by Csp= [1 – (0.5 – G)]< 1, where G is the specific gravity of the framing lumber. The specific gravity for Caribbean Pitch Pine obtained from testing was 0.66. Hence, the ajustment factor is [1-(0.5-G)] = [1-(0.5-0.66)] = 1.16. A value of Csp = 1.0 should be applied for Caribbean Pitch Pine framed walls with similar construction for shear wall design in accordance with the SDPWS-2008 code.

W.A. Wilson et al.: Cyclic Capacity of Shear Walls with Caribbean Timber 12
Figure 6. Comparison of Shear Wall Performance Characteristics

W.A. Wilson et al.: Cyclic Capacity of Shear Walls with Caribbean Timber 13
Figure 7. Comparison of Ductility Factors
The present study provides data on two critical parameters--seismic unit shear capacity vs (vpeak) and the apparent shear stiffness Ga (ke): These were previously unavailable for designing shear walls utilising Caribbean Pitch Pine framing and plywood sheathing These results are applicable for shear wall constructed with 12mm thick plywood with panel edge fasteners of 8d common nails spaced at 150 mm centres. The values obtained from the present study were compared with the tabulated values of the SDPWS-2008 by applying the Species Adjustment Factor as shown in Table 5. The average value for unit shear (vpeak) from the present study was 10% greater than the code’s nominal unit shear (vs), whereas the stiffness was 35% lower that the code value. The may be attributed to the initial stiffness response influenced by the relative restraint of the tension ties utilised in the present study as opposed to the code.
Table 5. Comparison of Nominal Unit Shear Capacities and stiffness
Wall Type Parameter SDPWS-
2008 * kN/m
Present Study **
kN/m
Difference kN/m
Plywood Sheathed Wall - 8d common nails - 6 in panel edge fasteners
vs
7.4 8.3 10%
Ga
1926 1242.5 35%
Notes: * - Douglas Fir-Larch or Southern Pine Frame ** - Caribbean Pitch Pine Frame
8. Conclusion
The research was conducted to investigate the behaviour of timber shear walls constructed with plywood sheathing and Caribbean Pitch Pine framing subjected to cyclic loading; and to compile seismic design data. This is needed for the design of timber buildings with improved earthquake performance in the Caribbean,
considering that a high percentage of residential buildings in the region are constructed with timber. There is a paucity of design data on Caribbean species. The shear walls are the most critical structural element of the lateral force resisting system for timber buildings. Two sets of shear walls with different internal stud-to-sole plate joints were tested. The wall panels with metal bracket joints demonstrated better performance compared to walls with toe-nailed joints. The hysteresis curves for the wall panels tested confirmed the nonlinear racking response under cyclic loading and served as the basis for determining the relevant cyclic design parameters
The critical design parameters of unit shear capacity and wall stiffness obtained in this study were compared to corresponding values from the SDPWS-2008 (ANSI/AWC, 2008) applying the recommended Species Adjustment Factor for timber-framed shear walls of similar construction with Douglas Fir-Larch and Southern Pine. The comparison was based on the results for wall panels with metal bracket frame joints since the code does not permit use of toe-nail joints for shear walls transferring shear loads greater than 3 kN/m. The average unit shear capacity obtained for the walls with metal bracket joints was 8.2 kN/m compared to 7.4 kN/m given in the SDPWS-2008, however, the apparent stiffness was 35% lower than the corresponding code value. This indicates that the test results may be applicable for design and construction of timber structures with similar species in the Caribbean.
Further research on shear walls to confirm the earthquake-resistance buildings constructed with Caribbean timber species is ongoing. These include testing of shear walls constructed with other popular local wood species for framing and sheathing materials. Variation of construction features, such as shear wall size (aspect ratios), stud spacing and sheathing-to-framing nailing schedules (perimeter spacing varying from 75mm to 150mm) are being investigated. Additionally, tests on shear walls with openings (doors and windows) have already been conducted as part of this ongoing research programme aimed at establishing a database of design data and which would inform a design code for Caribbean timber species.
References:
ANSI/AWC (2008), ASD/LRFD Wind and Seismic: Special
Design Provisions for Wind and Seismic with Commentary, SDPWS 2008 Edition, American Forest and Paper Association, American Wood Council, Washington, DC.
ANSI/AWC (2012), ASD/LRFD National Design Specification for
Wood Construction, NDS-2012 Edition, American Wood Council, Washington, DC.
ASTM (2011), E2126-11: Standard Test Methods for Cyclic
(Reversed) Load Test for Shear Resistance of Vertical Elements
of the Lateral Force Resisting Systems for Buildings, American Society for Testing and Materials, West Conshohocken, PA.

W.A. Wilson et al.: Cyclic Capacity of Shear Walls with Caribbean Timber 14
Ayoub, Ashraf (2007), “Seismic analysis of wood building structures”, Engineering Structures, Vol.29, pp.213-223
Caprolu, G., Girhammar, U.A., Kallsner, B. and Johnsson, H. (2012), “Tests on the splitting failure capacity of the bottom rail due to uplift in partially anchored shear walls”, World
Conference on Timber Engineering, Vol. 3, pp.189-194. Cheung, C.K., Itani, R.Y. and Polensek, A. (1988),
“Characteristics of wood diaphragms: Experimental and parametric studies”, Wood and Fiber Science, Vol.20, No.4, pp.438-456.
Dinehart, D.W., and Shenton III, H.W., (1998), "Comparison of static and dynamic response of timber shear walls", Journal of
Structural Engineering, Vol.124, No.6, pp.686-695. Dolan, J.D. and Madsen, B., (1992), “Monotonic and cyclic tests
of timber shear walls”, Canadian Journal of Civil Engineering, Vol.19, No.3, pp.415-422.
Du, M., Fei, B., Wang, X. and Liu, Y. (2012), “Shear performance of wood-frame shear walls with rabbet stud connect”, Journal of
Building Structures (Jianzhu Jiegou Xuebao), Vol.33, No.6, pp.144-150.
Ellingwood, B.R., Rosowsky, D.V., Li, Y., and Kim, J.H., (2004), “Fragility assessment of light frame wood construction subjected to wind and earthquake hazards”, Journal of Structural
Engineering, Vol.130, No.12, pp. 1921-1930. Emerson, R.N. (2002), “Wood frame shear walls with metal plate
connected framework”, in: Anson, M., Ko, J.M. and Lam, E. S. S. (Eds.), Advances in Building Technology, Vol.1, pp.97-104, Elsevier Science.
Folz, B., and Filiatrault, A. (2001), “Cyclic analysis of wood shear walls”, Journal of Structural Engineering, Vol.127, No.4, pp.433-441.
Gatto, K. and Uang, C. (2003), “Effects of loading protocol on the cyclic response of woodframe shearwalls”, Journal of Structural
Engineering, Vol. 129, No.10, pp.1384-1393. He, M., Lam F. and Prion H. G. L. (1998), “Influence of cyclic test
protocols on performance of wood-based shear walls”, Canadian
Journal of Civil Engineering, Vol.25, pp.539-550. He, M., Magnusson, H., Lam, F. and Prion, H. G. L. (1999),
“Cyclic performance of perforated wood shear walls with oversized OSB panels”, Journal of Structural Engineering, Vol.125, No.1, pp.10-18.
He, M., Huang, H., and Zhou, N. (2010), “Racking performance of wood shear walls fabricated using Chinese wood-based panels”, World Conference on Timber Engineering, Vol.4, pp.2941-2947.
Itani, R. Y., Tuomi, R.L. and McCutcheon, W.J. (1982), “Methodology to evaluate racking resistance of nailed walls”, Forest Products Journal, Vol.32, No.1, pp.30-36.
Kermani, A. and Hairstans, R. (2006), “Racking performance of structural insulated panels”, Journal of Structural Engineering, Vol.132, No.11, pp.1806-1812.
Kobayashi, K., Yasumura, M. and Tsuchimoto, T. (2012), “Influence of loading protocol on shear resistance of plywood sheathed shear walls with screwed joints”, World Conference on
Timber Engineering, Vol.2, pp.97-104. Liu, Y., She, C., and Zou, X. (2012), “Test study on the
performance of wood frame shear walls under lateral load”, World Conference on Timber Engineering, Vol.5, pp.86-90.
Li, M. and Lam, F. (2009), “Lateral performance of nonsymmetric diagonal-braced wood shear walls”, Journal of Structural
Engineering, Vol.135, No.2, pp.178-186. Patton-Mallory, M., and Wolfe, R. W. (1985), “Light frame shear
wall length and opening effects”, Journal of Structural
Engineering, Vol.111, No.10, pp. 2227-2239.
Sartori, T., Piazza, M., Tomasi, R. and Grossi, P. (2012), “Characterisation of the mechanical behavior of light-frame timber shear walls through full-scale tests”, World Conference on
Timber Engineering, Vol.3, pp.180-188. Skaggs, T. D. and Rose, J. D. (1996), "Cyclic load testing of wood
structural panel shear walls”, Proceedings of the International
Wood Engineering Conference, Vol.2, pp. 195-200. Sulistyono, Nugroho, N., Surjokusumo, S., and Rahman, O.
(2012), “Monotonic test of shear wall panel made from mangium wood”, World Conference on Timber Engineering, Vol.5, pp.369-370.
Terentiuk, S., and Memari, A. (2014), “Seismic evaluation of structural insulated panels in comparison with wood-frame panels”, Buildings, Vol. 4, pp.394-417.
Tuomi, R. L., and McCutcheon, W. J. (1978), “Racking strength of light-frame nailed walls”, Journal of Structural Engineering, Vol.104, No.7, pp.1131-1140.
Yasumura, M. (2010), “Racking resistance of panel-sheathed shear walls with opening”, World Conference on Timber Engineering, Vol.2, pp.1169-1176.
van de Lindt, John W. (2004), “Evolution of shear wall testing, modelling and reliability analysis: Bibliography”, ASCE
Practical Periodical on Structural Design and Construction, Vol.9, No.1, pp. 44-53.
Wilson, W.A., Williams, R.G. and Gaston, D. (2014), “Capacity of Shear Walls with Caribbean Timber Species”, The West Indian
Journal of Engineering, Vo.37, No.1, July/August 2014, pp.4-9.
Authors’ Biographical Notes:
William Wilson is Lecturer in Structures in the Department of
Civil and Environmental Engineering at The University of the
West Indies. He earned his MSc, DIC and PhD from the Imperial
College, University of London. He is the Industry Specialist in
Timber Engineering and has considerable experience as a
structural engineering consultant. Dr. Wilson is a Fellow of the
Guyana Association of Professional Engineers and a Member of
the American Society of Civil Engineers.
Rupert Williams is Lecturer in Structures in the Department of
Civil and Environmental Engineering at The University of the
West Indies. He earned his PhD from The University of Miami. His
areas of interest are aerodynamics and wind forces on structures.
Dr. Williams is a Member of the Association of Professional
Engineers of Trinidad and Tobago, a member of the American
Society of Civil Engineers and has his P.E. License for the States
of New York and Texas in the United States and is also a
Registered Engineer in Trinidad and Tobago.
Surchee Babwah is Civil Engineer employed with Caribbean
Housing Ltd in the position Projects Engineer. She is a graduate
of The University of the West Indies with a BSc in Civil
Engineering.
Vinisha Ramsingh is Civil Engineer employed with the firm
KS&P Ltd. She is a graduate of The University of the West Indies
with a BSc in Civil Engineering.
■

K. Hall and G. Shrivastava.: Marine Current Power Generation in Trinidad: A Case Study 15
Marine Current Power Generation in Trinidad: A Case Study
Kashawn Hall a,Ψ, and Gyan Shrivastavab
Department of Civil and Environmental Engineering, Faculty of Engineering, The University of the West Indies, St. Augustine Campus, Trinidad and Tobago, West Indies;
aE-mail: [email protected] bE-mail: [email protected]
Ψ Corresponding Author
(Received 19 April 2016; Revised 22 August 2016; Accepted 6 December 2016)
Abstract: Development of alternative energy sources has attracted worldwide interest given the adverse effects of fossil
fuels on the global climate as well as its unsustainability. It is in this context that this report examines the feasibility of
marine power generation at the 14 km wide Serpent’s Mouth in Trinidad. It is part of the narrow Columbus Channel which
lies between Trinidad and Venezuela. At this location, depth varies between 30 - 48 m and a marine current of approximately
1.5 m/s suggests the possibility of generating power through submerged turbines.The conditions are similar to those at
Strangford Lough in the Irish Sea, where the world’s first marine current turbine was installed in 2008 for generating 2 MW
of power. After taking into account the technical, environmental, and economic factors, this paper concludes it is feasible to
use The Serpent’s Mouth location for Power Generation.
Keywords: Columbus Channel, Marine Current Turbines (MCTs), Power Generation, Marine Renewable Energy (MRE)
1. Introduction
A mere 14 km separates Trinidad (10.4606° N, 61.2486° W) and Venezuela (10.5000° N, 66.9667° W) at the Serpent’s Mouth. Such a constriction, at the Columbus Channel, creates a Venturi effect as the Guiana Current flows into the Gulf of Paria. The resulting current velocities in the range 2 – 3 knots (1-1.5 ms-1) provide an opportunity for renewable power generation, through the use of Marine Current Turbines
(MCTs). Against this background, this paper investigates the feasibility of power generation from marine currents off the southern coast of Trinidad. It may be noted that the feasibility of power generation by MCTs has been considered in different parts of the world. Indeed, one MCT is currently producing 2 MW of power in the Irish Sea (Fraenkel 2007). Figure 1 depicts the location of Trinidad and its Serpent’s Mouth.
Figure 1. Location of Trinidad and its Serpent’s Mouth
ISSN 0511-5728 The West Indian Journal of Engineering
Vol.39, No.2, January 2017, pp.15-24

K. Hall and G. Shrivastava.: Marine Current Power Generation in Trinidad: A Case Study 16
2. Location Selection
Within the island region of Trinidad exists two locations that can be considered for Marine Renewable Energy (MRE) generation. On the northwest of the island exists The Dragon’s Mouth and to the southwest of the island, The Serpent’s Mouth.
The Government of the Republic of Trinidad and Tobago and the Government of the Republic of Venezuela, hereinafter referred to as the Contracting Parties, resolving in a true spirit of cooperation and friendship to settle permanently as good neighbors the limits of the marine and submarine areas within which the respective Governments exercise sovereignty, sovereign rights and jurisdiction through the establishment of a precise and equitable maritime boundary between the two countries (United Nations 2002). All operations are to be kept within the delimitation line (see Figure 2).
Figure 2. Delimitation Line of Trinidad and Tobago
2.1 The Serpent’s Mouth
Flow Rate:
As aforementioned, current velocities range from 2-3 knots (1-1.5 ms-1) from the Guiana Current and the Orinoco River Discharge. Obstructions and landmasses:
Soldado Rock is a small land mass located in the Gulf of Paria east of Icacos Point in Trinidad and north of the Venezuelan mainland (see Figure 3). It is under the ownership of the Republic of Trinidad and Tobago. Bathymetry:
As stated before, the depths of Serpent’s mouth ranges 30-48 meters. All depths above thirty (30) meters will not be considered for power generation (see Figure 4).
2.2 The Dragon’s Mouth
Current velocities within The Dragon’s Mouth range from 2-2.5 knots (1-1.3 ms-1) from the Gulf of Paria outflow (NGIA, 2014).
Figure 3. Soldado Rock
Figure 4. Bathymetric Chart - The Serpent’s Mouth
Obstructions and landmasses:
The Bocas Islands lie between Trinidad and Venezuela, in The Dragons' Mouth. The islet masses are Chacachacare, Monos, Huevos and Gaspar Grande and Little Gasparee, all under the ownership of the Republic of Trinidad and Tobago (see Figure 5).
Bathymetry: The depths of The Dragon’s mouth range from 30-50 meters. Between the islands, the seafloor depths plunge from 50m to around 400m, as a result of the mountain building processes of the Northern Range, which caused downward buckling in the Bocas area. The area also suffers continued scouring from the outflow of the Gulf of Paria (Kenny, 2000). Figure 6 shows a Bathymetric Chart of The Dragon’s Mouth.

K. Hall and G. Shrivastava.: Marine Current Power Generation in Trinidad: A Case Study 17
Figure 5. Bocas Del Dragon Islands
Figure 6. Bathymetric Chart - The Dragon’s Mouth
2.3 Site Selection
Considering the characteristics of both The Dragon’s Mouth and The Serpent’s Mouth locations as described above, The Serpent’s Mouth location was chosen for MRE generation. The Serpent’s Mouth location possess more desirable conditions, having a greater average flow velocity and less obstructions within the location, giving more operating area for the MCTs. Also, the Dragon’s Mouth area contains deeper scour holes within its vicinity, which challenge the construction of convention pile foundations.
3. Physical Setting
3.1 Prevailing currents
The location of Trinidad and Tobago on the continental shelf of South America and immediately adjacent to the outflow of the Orinoco River determines the nature and form of its coastal and marine environment (EMA 1996)., the outflow from the Orinoco River is a key determining factor in the proposed location, as it adds to current flows into the Gulf of Paria.
Adding to the current flow velocities passing through the Serpent’s Mouth is the, the South Equatorial Current, the main current around and into the region. The South Equatorial Current flows toward the west where it divides into two branches, but one continues to the Northern Hemisphere with the Guiana (Guyana) Current into the Caribbean. This northwest flowing branch flows into Columbus Channel, passing the Serpent’s Mouth into the Gulf of Paria (see Figure 1).
The multiple rivers are identified as the major contributors to current velocities pass the Serpent’s Mouth. They outflow along the northern continent of South America from the Orinoco River and the Guiana Current coming from the Atlantic through the Columbus Channel.
3.2 Tides
The tides around Trinidad and Tobago are semi-diurnal. High and low tides alternate every 12 hours varying around the coasts, with high tides peaking at 1.2 meters. The predominant wave direction along the shores of both Trinidad and Tobago is from the east, although seasonal variations occur under the effects of trade winds. The west coast of Trinidad facing into the Gulf of Paria is largely sheltered from swell-waves; however it can be exposed to significant swell during the wet season, when waves generated in the Atlantic pass through the Dragon’s Mouth (James, 1996). 3.3 Waves
Trinidad and Tobago is subject to wind driven waves, generally from the east, only changing with seasonal variations associated with changes in the trade winds.This wave regime is typical for this latitude. On the east coasts of both Trinidad and Tobago, sea conditions are turbulent at all times, and from January to May conditions become difficult along the north coast of Trinidad. The Gulf of Paria is sheltered with generally very low wave energy levels, which only experiences high swells during the winter storm activity in the Atlantic when some northerly swells make their way through the Dragon's Mouth. Also large swells are reported in the Gulf (EMA 1996). 3.4 Soil type
Within the Columbus channel and surrounding areas exists varied bottom types ranging from mud to

K. Hall and G. Shrivastava.: Marine Current Power Generation in Trinidad: A Case Study 18
mudstone (EMA 1996). The depth to bedrock or soil layer thickness is unknown as there is no data for this area. 3.5 Seasonality of Flow Velocities
The climate of the Orinoco basin is tropical, with the wet and dry seasons marked by differences in rainfall rather than in temperature,. This seasonality is determined by the annual north to south migrations of the inter-tropical convergence zone (ITCZ). This seasonality of rainfall determines the flow velocities coming from the Orinoco basin through the Columbus Channel (EMA, 1996). 4. Technical Feasibility
4.1 Assumptions and Approximations
Several assumptions and approximations were made. These include:
1) The useable area was idealised as a large rectangular open channel,
2) An average depth of 37 meters within the useable area was used for MCT rotor sizing,
3) The width of the rectangular channel is approximately 5.6 kilometers,
4) The length of the channel is approximately 20 kilometers, and
5) The flow velocity used was 1.25 m/s. 4.2 Turbine Array Placement
In order to assure maximum yield from the project, multiple MCTs were placed in an array to generate as much energy as space permits. The feasibility of ten (10) MCTs was tested and placed at 200 meters center to center spanwise over 2 kilometers within the designated area. The total turbine spacing makes provision for boat passing and fishing within approximately 3 kilometers of the channel. Figure 7 shows the turbine array within The Serpent’s Mouth.
Figure 7. Turbine Array within The Serpent’s Mouth
4.3 Rotor Sizing
Lower Boundary
Depth to the seabed is a direct factor to potential energy generation; therefore, the channel was idealised as an open channel to find the Critical Depth of the channel. To do so the Specific Energy versus Depth graph was plotted for the location. The Specific Energy of water is the total depth, or head, of the channel in relation to a specific location. The Critical Depth is the depth within the channel at which the Specific Energy is lowest. Figure 8 shows the allowable depth region
Figure 8. Allowable Depth Region
Under this depth lies the supercritical flow of the channel where the specific energy increases exponentially as it tends to the seafloor. Although supercritical flow increases exponentially when approaching zero (0) depth, the presence of sedimentation and scour, along with the boundary layers experienced on the ocean floor, cause uncertainty in yield and potential risk of the turbine. Therefore, the critical depth was found to use the subcritical flow for energy generation over that point. Figure 9 is a graph showing specific energy versus depth.
Figure 9. Specific energy versus depth

K. Hall and G. Shrivastava.: Marine Current Power Generation in Trinidad: A Case Study 19
Upper Boundary
Also considered was the possibility of damage due to wave forces. As a preventative measure, the wave base where wind wave energy will dissipate at was calculated as clearance.
Having these two limiting factors along with optimum power generation, depths of at least thirty (30) meters must be used to have an adequate rotor diameter. Critical Depth
hc = (�2 �� )1/3
hc = (46.2529.81� )1/3
hc = 6.02 meters
where, q = Flow Rate g = Acceleration due to Gravity
4.4 Wave Clearance
Deep Water Approximation:
d = ��2
2��
Wave number: ko = 2� ��
Celerity: �� � (��ℎ) = 2.62
Wavelength: λ = CoT = 9.64 m
Wave base = � 2� = 4.82 m
Therefore, the Rotor Blade will be 25 m. 4.5 Turbine Power Output
The hydrokinetic turbine is like taking a wind turbine, turning it upside down and sticking it into the water. (Fraenkel, 2013). The design of the turbine is a double rotor horizontal axis hydrokinetic marine current turbine. Horizontal axis hydrokinetic turbines are one amongst the various machines which can be used to extract the kinetic energy of water streams. They are meant to be placed in water streams of rivers or oceans and generate electricity in the order of 15 to 1,000 kW without making significant changes to the environment. The key factor in the design of the turbine is the density of the water. This would potentially cause the marine current turbine to provide a greater power output than that of its renewable counterpart. Figure 6 shows a Marine Current Turbine. Power Output
The power relations for tidal current resources are similar to those used in wind applications. The power, P, available in a tidal current, is given by:
P= 12���3
where, P = power output σ = density of seawater A= Rotor swept area V = current velocity
Figure 6. Marine Current Turbine
However, the actual power that an MCT can capture
is:
P= 12���3�
Where, ϑ = Betz’s Limit
Therefore, using a rotor diameter of 25 meters
P= 12 (1029)(1.253)(
�2524 ) (0.6)
P = 295.96 Kilowatts per Rotor
Since the design is a double rotor turbine, the total power output of the turbine is:
Total power = 295.96 kilowatts x 2 rotors Total power = 591.92 kilowatts per MCT
Turbine Array Power Output
Total Power Output = 10 turbines x 591.92 kilowatts Total Power Output = 5.919 Megawatts ~ 6 Megawatts
Scour
The passing of the Guiana Current/Orinoco River discharge through the Columbus Channel has a powerful erosional effect. Therefore, a scour depth analysis is required to ensure the design of the MCT structure (Julien, 2002). This is determined by: ��ℎ = 2.0 K1K2 ��ℎ�0.65 ��0.43
Where, Δz = Scour depth a = Monopile Diameter h = Upstream Water Depth K1 = Correction for Shape (see Table 1) K2 = Correction for Flow Angle (see Table 2)
Fr = Upstream Froude Number

K. Hall and G. Shrivastava.: Marine Current Power Generation in Trinidad: A Case Study 20
∴ ��37
= 2.0 (1)(1) �3.5
37�0.65
(1.25√(9.81 × 37)
)0.43 ∴ ����� ����� ,�� = �.�� ~ � ������
Table 1.Correction for Shape
Table 2. Correction for Flow Angle
5. Environmental Feasibility
5.1 Environmental Impact Assessment
Marine life is expected to be impacted, as foreign objects were placed within their ecosystem. The more prominent activities, being fishing and shipping, are also expected to be adversely impacted. Within the Serpent’s Mouth area, Gillnetting and Trawling are most common (see Figures 7 and 8) (Mangal, 2008). As such, fishing and boating operations will need to be restricted to a 3 kilometer area within the Serpent’s Mouth to make provisions for the active MCTs.
Figure 7. Trawling areas around Trinidad
Figure 8. Gillnetting areas around Trinidad and Tobago
Fishing depends on marine life. As the marine life
thrives, fishing will thrive. The two options for marine life protection are Fish Caging (Aquaculture) and Turbine Screening. Table 3 shows a summary of the Environmental Impact Analysis, whereas Table 4 shows a selection criteria matrix
The limited available information about the effects of acoustics on marine animals from marine energy devices suggests that animals are unlikely to be killed or seriously injured by the operational or pin-piled installations sounds generated by the turbines (PNNL, 2013). 5.2 Turbine Screen Considerations
The boundary layers around the netting material will minutely reduce flow velocities because of space sizing requirements, ensuring that the smallest of commercial fish cannot pass through the screen. Furthermore, it must protect both the front and back of the turbine because of current direction changes. The reduced flow velocity from the netting along with the wake velocities can further reduce the flow rate experienced by the turbine, ultimately reducing power generation by the array. The screen must not be flat, as ocean currents can pin fish unto the screen, and there is the likelihood of marine animals being trapped within the netting material. 5.3 Aquaculture Considerations
Fish farms using cages, in which the fish live and breed, ensure that the population of the fish is maintained because they are in no harm of turbine passage. Breeding standards can be imposed to increase the quality of fish for trading. It also increases the probability of the catch to 100%. Farms can be set up inland or offshore, or both to supply a higher demand. This is a control measure to help maintain the
Pier Type K1
Square nose 1.1
Round Nose 1
Circular cylinder 1
Sharp nose 0.9
Groups of Cylinders 1
p
Lp/a=4 Lp/a=8 Lp/a=12
0 1 1 1
15 1.5 2 2.5
30 2 2.5 3.5
45 2.3 3.3 4.3
90 2.5 3.9 5
Correction Factor, K2
g
Attack
Angle θp

K. Hall and G. Shrivastava.: Marine Current Power Generation in Trinidad: A Case Study 21
Table 3. Environmental Impact Analysis
Hazard Impact Mitigation
Greenhouse Gas Emissions Without the emission of pollutants and greenhouse gases into the atmosphere, MRE does not contribute to climate change or acid rain. Thus, it is considered environmentally sustainable.
None Needed.
Death/Injury by MCT interaction
Marine mammals and fish can suffer from mechanical strike when passing the turbine. Smaller fish can suffer from shear and pressure cavitation severely injuring or killing them.
Adoption of Aquaculture or turbine screens.
Marine Pollution Some lubricants, paints and coating applied to the MCTs can be extremely toxic to the surrounding ecosystem.
Lubricants and Paints would need to be carefully selected with the implications of their use fully considered.
Disruption of Fishing and Shipping activities
The presence of operating MCTs will interrupt fishing activities and shipping activities if there is not sufficient clearance between the MCT rotor tip and the water surface.
Restricted fishing and shipping area within Marked turbine operation area.
Seabed Deformation The flow around the base of the MCT will cause scour, changing the seabed surface.
Riprap will be place around the monopile base.
Change in Flow patterns The presence of obstructions within flow path will cause a change in flow patterns and flow rates throughout the channel.
-
Operation Acoustics The sound from the operating MCTs may mask marine animals’ hearing and thus their ability to engage in social interaction, locate prey, avoid predators, and navigate hazards.
-
Table 4. Selection Criteria Matrix
fisheries industry, but outside of the cage, where the wildlife still exists around the MCTs, there is no protection. Thus, aquaculture is fit for economic sustainability, not the protection of the marine wildlife. Marine life activity in the presence of MCTs
From the SeaGen project at Strandford Lough, they have reported that no major impacts were encountered with marine life. The resident seal and porpoises swim freely in and out of the Lough while the turbine was operating. Also, post mortem evaluation of marine mammals did not reveal any evidence of fatal strike by the SeaGen device. From observations at the Europeans Marine Energy Center, no marine mammals have been observed interacting with the turbines, but seals and porpoises were observed transiting through the region around the
turbine. No fish have been observed swimming through the turbine while the turbine is rotating.
Verdant Power in New York also produced results showing resident and migratory fish avoided their turbines, preferring the stay closer inshore in slower waters (PNNL, 2013). Other than the SeaGen turbine, which has a manually operated shutdown function when marine mammals enter 30 m of the turbine. No others have any protective measure to accommodate the marine life, but have all reported little to no marine life interaction with the MCTs.
In light of this, the Aquaculture measure was chosen as the control measure to maintain maximum turbine efficiency and safeguard to the fisheries industry. Bio-fouling
HazardPopulation
at Risk
Typical
ImpactProbability
Control
Measures
Typical
ImpactProbability Hazard
Population
at Risk
Typical
ImpactProbability
Control
Measures
Typical
ImpactProbability
Mechanical
Strike
All Marine
Life5 3
Fish
Caging5 3
Mechanical
Strike
All Marine
Life5 3
Turbine
Screens5 1
ShearSmaller
Marine Life5 3
Fish
Caging5 3 Shear
Smaller
Marine Life5 3
Turbine
Screens5 1
Cavitation/
Pressure
Smaller
Marine Life5 3
Fish
Caging5 3
Cavitation/
Pressure
Smaller
Marine Life5 3
Turbine
Screens5 1
Catch Fisheries 5 3Fish
Caging5 5 Catch Fisheries 5 3
Turbine
Screens5 3
Turbine
Efficiency
Power
Generation5 5
Fish
Caging5 5
Turbine
Efficiency
Power
Generation5 5
Turbine
Screens5 3
Fisheries Industry
Turbine Interaction
Turbine Screen Measure
Rating Residual Rating
Fatal Risks
Rating
Aquacluture Measure
Residual Rating

K. Hall and G. Shrivastava.: Marine Current Power Generation in Trinidad: A Case Study
22
Most of the tidal energy structures to be submerged in saltwater are expected to experience bio-fouling. The main problem as it relates to MCTs is the drag forces induced upon the rotor blades as a result of the increased weight. The blades rotate slower, reducing power generation, because of its increased weight. To protect the MCT against fouling, antifouling coatings are used. The turbines need regular maintenance is needed (Delauney, 2010).
As expected, any coating will have an impact on the surrounding environs. Since this a problem with antifouling technologies, some contain copper or tributyltin (TBT) which have undesired effects on marine organisms. More environmentally friendly antifouling paints are to be explored to reduce environmental impacts. 6. Economic Feasibility
6.1 Considerations and Assumptions
Several considerations and assumptions were made. These include:
1) All power generated was sold to the Electrical power grid.
2) Annual energy consumption was estimated at 7.59 billion kWh (2014) (IndexMundi 2015).
3) Residential power usage is 27% of total energy consumption (Newsday 2007).
4) The residential population was used as 342200 homes (Newsday 2007).
5) MCT capital cost increases linearly with increase rotor diameter.
6) The exchange rate between TTD and the USD is used as $1.00 to $6.49.
7) The service life of MCT was taken as 20 years. Array Viability
Producing an average 6MWh, the array generates 4261858.82 kWh monthly. Per month, the average residence consumes 500 kWh; this allows the MCT array to generate power for 8523 residential homes monthly. Table 5 shows the MCT viability.
Table 5. Turbine Viability
Energy Supply kWh Turbine Supply kWh
Annual Consumption
7590000000 Array power output (kW)
5919.25
Residential Consumption
2049300000 Array Energy production
5919.25
Residential (1 hr)
0.68 Monthly Production
4261858.82
Monthly Consumption
492.213958 Average Residential Consumption
500
Number of homes supplied by MCT Array 8523.717646
MCT Costing
The capital costing for the MCTs were estimated as a linear increase from the capital costs of the 16m rotor SeaGen turbine and the 18m Pilot turbine located within the Bay of Fundy. With the capital cost for the 16m turbine being $5.15 million USD and the 18m turbine being $5.81 million USD gives the difference of $662720 USD. Linearly, this would give $331360 per 1m rotor diameter, giving our 25m MCT a capital cost of $ 8.1 million USD. Array Costing
Mass production and installation have reduced the capital costs for arrays per kWh. Using $4598/kWh USD, the capital cost for the 10 MCT array is estimated $47 million USD. Annual Life Cycle Unit Cost
At a rate of $0.19 USD/kWh, the life cycle cost of the array approximates to $10 million USD. 6.2 Economic Feasibility and Considerations
For viability to be achieved, power generated would have to be sold at a rate of $0.30 USD/kWh. Table 6 shows a summary of benefits (revenue) and costs (expenditures), and Table 7.shows the computation of Net Present Value, of the project.
Table 6. Benefits (Revenue) and Costs (Expenditures)
With the project becoming feasible at the rate of $0.30 USD/kWh, this is quite costly. However, increased awareness about climate change may prove a fillip to investment in renewable energy. Small Island Developing States are particularly vulnerable to sea level rise and ecological changes. Therefore, exploitation of our renewable energy potential is critical for the preservation of our fragile ecosystems. 6.3 Economic and data Shortcomings
It should be stressed that the soil layer depths and the depth of bedrock are unknown. This information is needed to determine construction methods and actual construction costs. Depth to bedrock and seafloor characteristics can influence the type of foundation —
Rate ($) 0.30$
Array kWh 5919.25
Annual kWh 51852615.68
Annual Revenue (USD) 15,555,784.70$
Cost
Capital 47,032,095.63$
Annual Life Cycle Unit
Cost 9,989,510.65$
Service Life (yrs) 20
Total Expenditure 246,822,308.72$
Benefit

K. Hall and G. Shrivastava.: Marine Current Power Generation in Trinidad: A Case Study
23
Table 7. Calculations of Net Present Value
whether skin friction piles or end-bearing piles can be used. These varying types of foundation can have different costs, with friction piles being controlled by the length of pile, and end-bearing; depending on the type of foundation, whether tripod, gravity or monopole with guy wires.
The monetary funding would go toward foundation and stability operations of the MCTs. In this instance, judicial scaling was deployed by using the Unit Life Cycle cost for the pre-existing SeaGen MCT and linearly scaling it up to our MCT rotor diameter as a means of conpensation. As foundation costs are expected to be included within the Unit Life Cycle cost, this was used as the approximate cost of our MCT. With the nature of this pricing, it is understood that the varying seafloor characteristics between The Serpent’s Mouth and Strangford Lough can serve to decrease the creditability of the approximated figure. This raises an unknown factor, which can substantiall impact costing. With the Cost-Benefit Ratio being 1.16; with the project only becoming acceptable at a Cost-Benefit ratio of 1, this would be too low to be considered a cushion range for the unknown cost associated with the foundation and stability issues.
Therefore, with the lack of data aforementioned, the economic path for MRE generation within The Serpent’s Mouth is still unclear. 7. Conclusions
Regarding technical feasibility, MCTs can be sized up to 25 meters in rotor diameter. As the physical characteristics of the site location permits, it is possible
to generate on average, 6 MW of power, peaking at 10 MW (Flow velocity of 1.5 m/s) of power from the MCT array. Each MCT will experience a scour depth of approximately 5 meters around their monopoles. Given the physical limitations of the site, it is technically feasible to place MCTs within the Serpent’s Mouth.
Regarding environmental feasibility, the installation of the MCT array would have minimal environmental impacts, with compensative measures being deployed for the most common impacts of the MCTs. Therefore, the MCT array is deemed environmentally feasible.
For economic feasibility, considering the capital cost for the MCT array, the operations and maintenance costs and revenue generated at $0.30 USD/kWh, the project produces a Net Present Value of $7,618,403.50 and a Benefit-Cost ratio of 1.16, deeming this project, economically acceptable, but not feasible. With the limitations of site specific knowledge, unknown costing factors will be too large for a Cost-Benefit Ratio of 1.16 to be able to provide adequate room for uncertainty because of the unknown quantity of money.
Overall, the Marine Current Power Generation project within Trinidad can be seen as feasible, but only over time, where technological advancements are made within the field to increase the efficiency of MCTs, causes a higher optimum power generation to yield the maximum benefits of the Marine Renewable energy technology.
Acknowledgements
The authors are deeply grateful to Dr. Deborah Villarroel-Lamb for her advice and words of encouragement.
References:
Delauney, L., Compere, C., and Lehaitre, M. (2010), "Biofouling protection for marine environmental sensors", Ocean Science, Vol.6, pp.503-511.
Fraenkel, D.P. (2013), “Hydro power - Converting tidal power into electricity”, YouTube. Retrieved March 28, 2013 from https://www.youtube.com/watch?v=OCpBNQfpKDA&index=1&list=PL48xjuZHy4LsQIewI-cCobHbn0fFgAxn1
IndexMundi (2015), “Trinidad and Tobago Electricity - Consumption. June 30”. Accessed February 12, 2016 from http://www.indexmundi.com/trinidad_and_tobago/electricity_consumption.html.
James, C., Kenny, J., Rudder, W., Salvador-Arthur, M. and Sookdeo, D. (1996), “State of the Environment 1996 Report”, Health Physics, Vol.71, No.6, pp.1–98. Accessed from http://www.ncbi.nlm.nih.gov/pubmed/10165032.
Julien, P. (2002), River Mechanics, The Press Syndicate of The University of Cambridge, United Kingdom.
Kenny, J.S. (2000), Views from the Ridge: Exploring the Natural
History of Trinidad and Tobago, Prospect Press/MEP, Port of Spain, Trinidad and Tobago.
Mangal, E. (2008), Report on Commercial Fisheries within the
Gulf of Paria and the Impacts of Proposed Port Development
Activities on Fisheries in the Claxton Bay Area, Rapid Environmental Assessments Ltd, No.50 (December)
Newsday (2007), “The Big Surge”, Newsday Trinidad and Tobago. September 27. Accessed February 12, 2016 from http://www.newsday.co.tt/businessday/0,64962.html.
Year Cash flow Present value Payback Discount Rate
0 -47,032,095.63 $ -47,032,095.63 $ -47,032,095.63 $
1 5,566,274.05$ 5,153,957.45$ -41,878,138.18 $
2 5,566,274.05$ 4,772,182.83$ -37,105,955.35 $
3 5,566,274.05$ 4,418,687.80$ -32,687,267.55 $
4 5,566,274.05$ 4,091,377.60$ -28,595,889.95 $
5 5,566,274.05$ 3,788,312.59$ -24,807,577.37 $
6 5,566,274.05$ 3,507,696.84$ -21,299,880.53 $
7 5,566,274.05$ 3,247,867.45$ -18,052,013.08 $
8 5,566,274.05$ 3,007,284.67$ -15,044,728.41 $
9 5,566,274.05$ 2,784,522.84$ -12,260,205.56 $
10 5,566,274.05$ 2,578,261.89$ -9,681,943.67 $
11 5,566,274.05$ 2,387,279.53$ -7,294,664.14 $
12 5,566,274.05$ 2,210,444.01$ -5,084,220.13 $
13 5,566,274.05$ 2,046,707.42$ -3,037,512.72 $
14 5,566,274.05$ 1,895,099.46$ -1,142,413.26 $
15 5,566,274.05$ 1,754,721.72$ 612,308.47$
16 5,566,274.05$ 1,624,742.33$
17 5,566,274.05$ 1,504,391.05$
18 5,566,274.05$ 1,392,954.68$
19 5,566,274.05$ 1,289,772.85$
20 5,566,274.05$ 1,194,234.12$
7,618,403.50$
10%
1.161983075
15 years
8%
Net Present Value
Internal Rate of Return
Benefit/Cost Ratio
Payback Period

K. Hall and G. Shrivastava.: Marine Current Power Generation in Trinidad: A Case Study
24
NGIA (2014), "Caribbean Sea", Sailing Directions (Enroute), National Geospatial-Intelligence Agency, Vol. 2
PNNL (2013), Environmental Effects of Marine Energy
Development around the World, Pacific Northwest National Laboratory, Annex 4, Final Report No.97
Authors’ Biographical Notes:
Kashawn Hall graduated from the Department of Civil and
Environmental Engineering, Faculty of Engineering, The
University of the West Indies, St. Augustine Campus in 2015. His
research interests are in areas of Renewable Energy Management.
Gyan Shrivastava studied Civil Engineering at Indian Institute of
Technology at Delhi, Imperial College in London and at The
University of the West Indies (UWI), St. Augustine. Professor
Shrivastava is a Chartered Civil Engineer, a Member of the
Institution of Civil Engineers in London, and a recipient of IADB
and BPTT research fellowships in Engineering Hydrology. In
2006, he received a Gold Award from the Caribbean Water and
Wastewater Association for his teaching, research and public
service. In 2015, he retired from the Department of Civil and
Environmental Engineering at The UWI.
■

O.A. Ajibade.et.al.: Optimisation of Water Absorption Properties of Orange Peel Particulate-based Epoxy Composite Using Grey Relational Analysis 25
Optimisation of Water Absorption Properties of Orange Peel Particulate-based
Epoxy Composite Using Grey Relational Analysis
Oluwaseyi A. Ajibade a, Johnson O. Agunsoye b, and Sunday A. Oke c,Ψ
a,b Department of Metallurgical and Materials Engineering, University of Lagos, Lagos, Nigeria; a,bE-mail: [email protected]; [email protected]
c Department of Mechanical Engineering, University of Lagos, Lagos, Nigeria; cE-mail: [email protected]
Ψ Corresponding Author
(Received 8 May 2016; Revised 18 September 2016; Accepted 28 September 2016)
Abstract: Orange peel particulate (OPP) epoxy composite optimisation is studied for its water absorption capabilities.
Weight of samples before and after dipping in water were examined and analysed. The weight gain (WG-type) and water
absorption (WA-type) were chosen as the target output variables for the water absorption process optimisation of the pure
epoxy and 5 % OPPs composite. The optimal factor levels for the pure epoxy gave an initial mass, final mass and weight
gain of 15.12, 15.62 and 0.88 g, respectively, and for OPP composite 16.88, 17.96 and 1.17 g, respectively. The level of
influence each of the controllable factors exercises on the water absorption properties of the materials was investigated by
evaluating the strength of the correlation between their sequences using the grade matrix of the grey relational tool. For the
composite, the WA-type was further affected by the power of the controllable factors compared with the WG-type. However,
the final volume was found to be the most significant factor to the water absorption of the composite. The sequential order of
importance for the epoxy and its composite were found to be different for the two output variables considered. Overall, the
final mass was found to be the most significant factor.
Keywords: Water absorption, grey relational analysis, epoxy, sequences, controllable factors
1. Introduction
The elimination of the harmful effects of indiscriminately-disposed wastes, including agricultural wastes, is a top-agenda in environmental programmes of developing countries (Yakowitz, 1993; Panda et al., 2010). These wastes potentially cause epidemics with associated huge health costs if not properly managed (Sabiiti, 2011; Annepu, 2012). Waste conversion into wealth is of paramount interest to governments, researchers and scientists across developing countries. A primary use of orange peel wastes, which is hugely generated in developing countries, is the extraction of the oily substance from it, providing useful elements for some chemical preparations. A second major use of orange peel wastes is its usage in composites. This is the commencement of a new way of guaranteeing reduced composite life-cycle costs through low material cost and reduced maintenance costs.
The development of orange peel particle (OPP) fillers for composites in the composite science and engineering area is a principal milestone in the historical evolution of composite fillers. The developed composite from OPPs is expected to exhibit attractive characteristics of refined grain patterns, substantial strengths, enhanced resistance characteristics, minimum metallurgical defects, outstanding dimensional stability and enhanced composite reliability. At present, a major
portion of these properties of the OPPs is unknown. Consequently, it is necessary to develop composites based on OPPs as the filler and subject them to various tests. Only then will the data-bank of properties on OPP-based composites be created for an improved understanding of the composite by the scientific community.
In this paper, an attempt is made on the experimentation and determination of the water absorption properties of OPP-based composite. Specimens were evaluated for the effects of water absorption on them, using epoxy as the matrix. The specimens were immersed in a beaker containing water and the experiments were performed for a period of 38 days with measurement taken at random. The random choice of measurements is at variance with the practice in the composite literature and meant to reveal the swelling behaviour of the composite over the two month period of investigation. Samples were for pure epoxy and 5% OPP-based epoxy composite. The water adsorption is known to influence thickness swelling and trigger changes in dimensions of the composite.
Much of the investigations that have been carried out on water absorption has been in the context of fibres (Chow et al., 2007; Hu et al., 2010; Pan and Zhong, 2015; Haameem et al., 2016). This paper adds to existing literature knowledge by contributing ideas that optimises the process parameters in water absorption systems for a
ISSN 0511-5728 The West Indian Journal of Engineering
Vol.39, No.2, January 2017, pp.25-35

O.A. Ajibade.et.al.: Optimisation of Water Absorption Properties of Orange Peel Particulate-based Epoxy Composite Using Grey Relational Analysis 26
composite investigation. Specifically, the attention of the reader is called to the application of grey relational analysis, which has the merit of uniquely optimising parameters in a process even with limited information. What follows is a brief account of water absorption process literature wherein gaps are reflected. Li et al. (2015) assessed the effects of adding boron nitride in hexagonal form to the characteristics of B4C-oriented composites of ceramic origin, from tribological tests, and subjecting the test samples to lubrication by water. Similarly, Umeda et al. (1993), Saito and Honda (2000) as well as Chen et al. (2009) experimented with specimens in water environments.
Associated experiments could be found in Cu et al. (2008). Hu et al. (2016) studied the influence of extensive-term of water immersion age-wisely on the heat as well as mechanical properties of polydicyclopentadiene polymer composites which were catalysed by ruthenium. It was concluded that aging resulted in a downgrade of the interface strength, which consequently reduced fatigue strength. It is clear from these reviews that scholars have promoted the use of water absorption tests as an avenue to obtain improved properties of composites through the development of water-resistant or improved water-resistant composites. Now, a review of literature relating to orange peels/particles in composite development is given subsequently.
Through a rigorous literature search on orange peels/particulate orange-based composite studies, it was discovered that there were sparse scientific reports on the employment of orange waste in any form (particulate, short fibre or long fibre) as reinforcements in the fabrication and development of polymer composite. Despite the appealing mechanical properties developed by scholars (Kumar, 2012, Aigbodion et al. 2013), and in spite of the enviable properties of water absorption documented by an increasing number of studies (Ajibade et al. 2015b), the novelty of orange waste-based polymer composites, in terms of optimisation criteria, has not been well explored even till now. This gives the current authors a very serious concern, which urgently requires attention. The requirement for practical approaches to the effective utilisation of orange wastes into their various forms of particulates, short-fibres and long-fibres or whiskers was announced by early research workers on composite such as Acharya and workers (Ojha et al., 2012) as well as Aigbodion and co-workers (Aigbodion et al., 2013). This has motivated intensive efforts to understand the properties of orange peels (in particulates) as reinforcement to composites. Consequently, a growing literature on orange peels (in particulates), which sought to reveal understanding of the physical properties mainly was contributed by Ajibade et al. (2015 a, b) on different aspects as free swell behaviour, moisture characteristics and tapped density measurements.
Furthermore, Abass (2015) studied the behaviour of orange composites from mechanical property perspective. It is interesting to note that the mechanical properties of orange peels were both pursued by Kumar (2012) and Abass (2015). The outstanding differences of the two studies were that while Kumar (2012) utilised epoxy as the matrix in the composite, Abass (2015) employed polyester resin as the matrix. Notably a higher percentage (20% reinforced orange peel epoxy composite) was obtained by Kumar (2012) as against 10% reinforcement reported by Abass (2015) as the maximum hardness and tensile attainment points of the reinforcement in the composite. Despite the increasing interest of researchers on the many aspects of orange peels as reinforcing fillers for composites, the existence of approaches to aid in the optimisation of the filler content with the selection of appropriate scientific tool is still missing on literature. From this perspective, this investigation targets developing a practicality-oriented optimisation treatment of grey relational analysis through the optimal determination of water absorption properties of orange peel particulate composite. The use of 0.600 mm particulate size and 5% by volume of orange peel particle (OPP) in epoxy composite is made. Hence, investigations have been implemented to evaluate the water absorption behaviour of OPP-based epoxy composite in a controlled condition of laboratory. A total picture of water absorption has been presented through the conduct of laboratory tests using beakers and tap water to understand the mechanism of the water absorption and then carried out optimisation on the obtained results. 2. Grey Relational Analysis (GRA) Optimisation
Approach
Optimisation is an event in which a gradual transformation to the calculation of the best solution from a problem is made through an adequate definition of the following components of an optimisation model: objective function, the process design variables as well as the system constraints. The computation of the best values would be in terms of minimum or maximum outcomes, depending on the optimising criterion. The objective function, usually the first to be stated, reflects the criterion upon which the experimental design function would be optimised. In this work, a typical example of the objective function is to minimise the water absorption of the OPP-based epoxy composite in water. This same objective could be formulated otherwise as the maximisation of water resistance of the OPP-based epoxy composite. These two objectives are equivalent as the water resistance index is the reciprocal of the water absorption factor.
From literature, the solution to optimisation problem has been variously reported by using methods of mathematical programming, usually utilising well-known tools of dynamic programming, integer

O.A. Ajibade.et.al.: Optimisation of Water Absorption Properties of Orange Peel Particulate-based Epoxy Composite Using Grey Relational Analysis 27
programming, or the simplest of the three, linear programming. An alternative to mathematical programming of ten employed in scientific engineering experimentation is the approximate methods. In as much as mathematical programming models could achieve optimal results, the complexity of applying this in several real-life situations is over-whelming, prompting the alternative usage of near-optimal solutions.
These solutions, although not as equally good as the optimal solutions produced by mathematical programming models, still provide useful and reliable close solutions to the optimal ones while saving huge computation times. So the trade-off, resulting in the choice of near-optimal solutions of non-traditional techniques, being the term used for the alternatives to mathematical programming. In other words, the pursuit of searching for exact solutions to practical materials engineering problems has been overcome with alternative non-traditional techniques, which give out near-optimal outputs. So, in this work, the grey relational analysis has been exploited and introduced in solving the water absorption problem. It is interesting to note that equations concerning the grey relational analysis, as applied in this work and presented in the next section, were drawn from the classic works of Deng (1985, 1990, 1996), Fang and Liu (2003), and Tzeng et al. (2009).
2.1. Normalisation
Normalisation of data is done when the scale and unit of one data sequence may be at variance from another data sequence. It is important to normalise when the range of a sequence is wide and the orientations of the sequences are different. With the use of normalisation, the primary sequence is changed into a comparison sequence. Depending on the desired quality characteristic and data sequence, grey relational analysis uses various methods of normalisation.
When the target value of primary sequence is minimal, then “the-lower-the-better” quality characteristic is used to normalise the primary sequence as follows (Tzeng et al., 2009):
)(min)(max
)()(max)(
)(
)()(
*
qyky
qyqyqy
j
O
j
O
j
O
j
j−
−= (1)
If the target value of the primary sequence is immeasurable, then “the-higher-the-better” quality characteristic is preferred. The primary sequence is normalised using equation 2 (Tzeng et al., 2009):
)(min)(max
)(min)()(
)()(
)()(
*
kyqy
qyqyqy
O
j
O
j
O
j
O
j
j−
−= (2)
Whenever a particular target is to be realised, the primary sequence can then be normalised using the equation 3 (Tzeng et al., 2009):
)}(min,)(max{max
|)(|1)(
)()(
)(
*
qyOBOBqy
OBqyqy
O
j
O
i
O
j
j−−
−−= (3)
The primary sequence can also be normalised using the most basic methodology, i.e. dividing the quantity of the primary sequence with the quantity of the first sequence.
)1(
)()(
)(
)(
*
O
j
O
j
jy
qyqy = (4)
where )()(
qyO
jis the primary sequence, )(*
qy j is the
sequence after normalisation, )(max)(
qyO
i is the highest
value of )()(
qyO
j, )(min
)(qy
O
jis the lowest value of
)()(
qyO
j.
2.2 Grey Relational Coefficient (GRC) and Grey
Relational Grade (GRG)
Following the completion of normalisation of data, the GRC can be obtained from the normalised data sequences using the form Deng (1985, 1990, 1996):
max)(
maxmin))(),((
0
)(*
0 ∆+∆∆+∆
=xxa
kqyqy
j
O
j (5)
where the divergence sequence of the specific sequence
)(*
0 qy and comparison sequence is given as )(0 qj∆ i.e.
|,)()(|)(**
0 qyqyq ioj −=∆ (6)
|,)()(|maxmaxmax **
0 qyqy jkij
−=∆∀∈∀
(7)
|)()(|minminmin **
0 qyqy jkij
−=∆∀∈∀
(8)
x is the distinguishing coefficient, ]1,0[∈x .
The grey relational grade (Deng, 1985, 1990, 1996; Fung, 2003) is obtained as average of the weighting sum of the grey relational coefficients. It is expressed mathematically as follows:
∑ ∑= =
==n
q
n
q
qjqj qykyyy1 1
**
0
**
0 1)),(),((),( ββaβ (9)
From the above expression, the grey relational grade
),( **
0 jyyβ is used to denote the degree of relationship
between the specific sequence and the comparison sequence. The quantity of grey relational grade (GRG) is obtained as 1, when the two sequences are identical. The GRG signifies the level of effect the comparison sequence could exercise over the specific sequence. Grey relational analysis (GRA) is used to know the degree of deviation of data between sequences and it may be employed to understand the extent of correlation in between sequences. Consequently, when the grey relational grade of a comparison sequence and specific sequence is more elevated than other GRGs, the particular comparison sequence is regarded as more valuable.

O.A. Ajibade.et.al.: Optimisation of Water Absorption Properties of Orange Peel Particulate-based Epoxy Composite Using Grey Relational Analysis 28
3. Materials and Methods
The main components of the composite utilised for the epoxy-based orange peel particulates are the orange peel particulates, the epoxy as the matrix and hardener, which quickens the rate of reaction of the filler in epoxy matrix. Epoxy resin (Diglycidyl Bisphenol A) was sourced locally from CIBA chemical products in Germany through Tony Nigeria Enterprises. It was mixed with hardener in the ratio 1:0.7 to obtain improved harness and consistency throughout the composite. The principal purposes of utilising matrices in composite fabrications are on the intent of maintenance in position, stress transfer, barrier making and shield creating.
Spelt out clearly, matrices continue to be used in composites in order to: (a) Hold the particulate agricultural wastes in fixed positions; (b) Reposition stresses from one particle to another (i.e. stress transfer); (c) Develop barriers that militate against unfavourable circumstances in terms of moisture as well as chemical attacks, among others; (d) Serve as a cover, shielding particulate surfaces against degradation due to abrasion in mechanical surface attacks; and (e) Play a load bearing/carrying capacity role in the composite structures. In choosing matrices, pre-knowledge of what the compressive strength, in-plane shearing properties as well as inter-laminar shearing properties of the composite to be fabricated should be known in advance.
This would guide the proper choice of matrices and the cost of fabrication. From a lateral perspective, support is given by the matrix to work against particulate buckling effects via compressive load actions. Viewing from the perspective of torsion loads, the strength of the in-plane type is significant in structural design considerations with bending loads in perspective. For the orange peel particulate waste intended to be used for composite fabrications in agricultural silo structures, the interactive characteristics which exists between the epoxy matrix, for instance, and the particulate is necessary in the design of damage-tolerant agricultural silo structures. In working with the epoxy matrix, the processing characteristics such as the time for curing, viscosity as well as the curing temperature are essential parameters that must be controlled in line with the desired goals. The epoxy is a generally applied matrix material; more commonly used compared with other competing matrices of polyesters as well as vinyl polyesters, due to its easiness in processing since they have low viscosity.
Orange peel wastes were sun dried to remove moisture before grinding for 12 passes in local grinding mills to produce orange peel particulates (OPPs). The 5 % OPPs composite was prepared by using 5 % volume of one part mixture of epoxy and hardener as the volume of the OPPs. The combination was mixed thoroughly to obtain homogeneity before pouring into a prepared mould under room conditions. The mould was fastened
with four G-clamps to ensure pressure and speed up the curing process. The clamps were released from the mould after the 24 hrs curing period and the resulting composite was carefully removed from the mould.
The prime motivation for the choice of epoxy as the matrix lies in its superior dimensional stability. It has also been reported to have attractive thermal stability as well as an appealing corrosive resistance (Agunsoye et
al., 2014). Hence, epoxy would be highly suitable for the applications in food storage (agricultural silos) and sporting equipment, among others. Orange peel particles are used as the filler material in view of its bio-degradability, bio-waste, low density, low cost, abundance in availability at source, non-toxicity, it non-hazards nature to users and abrasive nature in usage by processing equipment (Ajibade et al., 2016). The orange peel was obtained from the Akoka environment in Lagos, Nigeria.
The initial form of collection of the orange peels was fresh from usage but it was later dried in open-air under the influence of sun until the moisture content was totally removed. After this, it was ground and served into various sizes, ranging from 0.075 to 2.12 mm. Characteristically known as a thermosetting polymer, epoxy exhibits a curing behaviour in association with hardener. This means that the epoxy polymerises and forms cross-link (Girisha, 2012a, b).
The hand lay-up method of composite fabrication has been utilised in the current study. In this method, the liquid-state approach of creating composite material was embarked upon in which orange peel particles, referred to a dispersed phase, get mixed up with the epoxy matrix using mechanical stirring method. The liquid orange particle-based material is then smartly cast. The quality of the orange peel-based epoxy composite obtained, which will eventually influence the water absorption behaviour of the tested specimens will be strongly influenced by a number of factors as currently experienced in the composite literature, generally. These include the pouring temperature, which plays a significant determining role in the solidification mode of the composite materials. It also depends on the specific nature of the sporting equipment desired to be made or the other applications such as the agricultural silos as well as the household facilities such as interior design to be fabricated.
The speed of pouring the liquid substance in the mould is a second factor determining the output quality of the composite being fabricated. The guiding principle at pouring is the urgent need to complete the composite casting to avoid the sluggishness of the poured liquid. However, the pouring speed should not be too high in order to avoid disorder and the final rejection of the cast product. But a slow pouring with calculated attempts at completing the casting process on time is the secret of high quality cast orange peel particulate based epoxy composite.
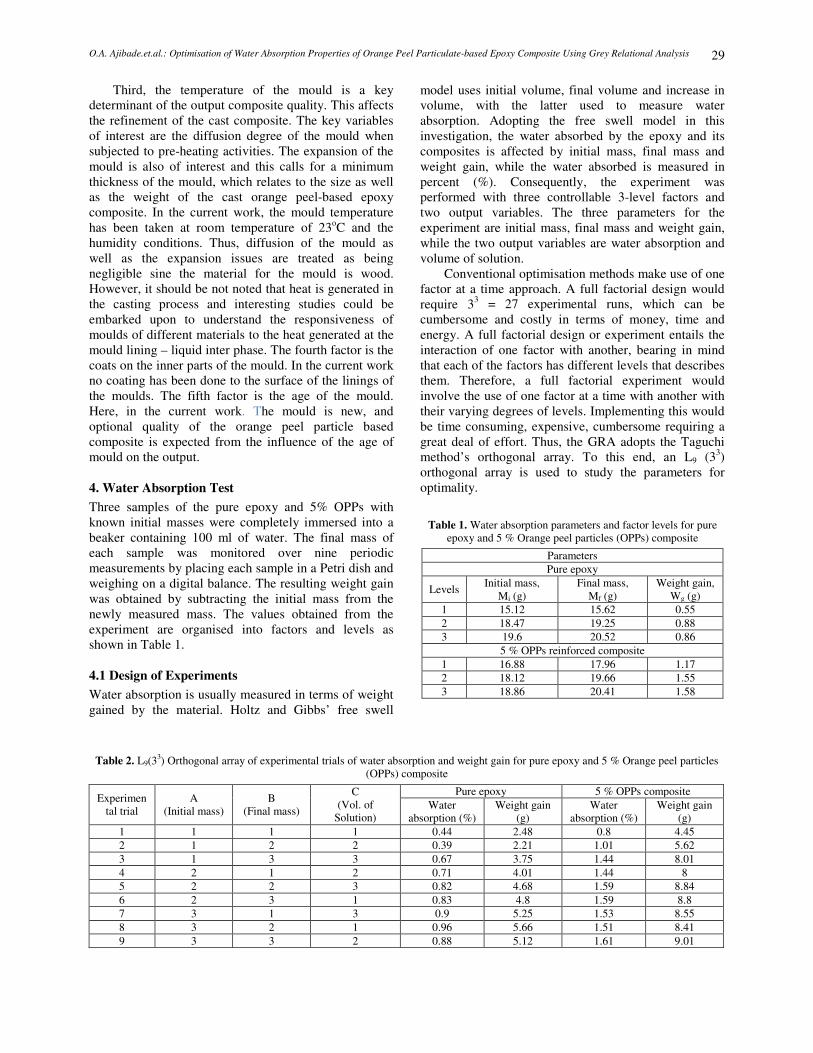
O.A. Ajibade.et.al.: Optimisation of Water Absorption Properties of Orange Peel Particulate-based Epoxy Composite Using Grey Relational Analysis 29
Third, the temperature of the mould is a key determinant of the output composite quality. This affects the refinement of the cast composite. The key variables of interest are the diffusion degree of the mould when subjected to pre-heating activities. The expansion of the mould is also of interest and this calls for a minimum thickness of the mould, which relates to the size as well as the weight of the cast orange peel-based epoxy composite. In the current work, the mould temperature has been taken at room temperature of 23oC and the humidity conditions. Thus, diffusion of the mould as well as the expansion issues are treated as being negligible sine the material for the mould is wood. However, it should be not noted that heat is generated in the casting process and interesting studies could be embarked upon to understand the responsiveness of moulds of different materials to the heat generated at the mould lining – liquid inter phase. The fourth factor is the coats on the inner parts of the mould. In the current work no coating has been done to the surface of the linings of the moulds. The fifth factor is the age of the mould. Here, in the current work. The mould is new, and optional quality of the orange peel particle based composite is expected from the influence of the age of mould on the output. 4. Water Absorption Test
Three samples of the pure epoxy and 5% OPPs with known initial masses were completely immersed into a beaker containing 100 ml of water. The final mass of each sample was monitored over nine periodic measurements by placing each sample in a Petri dish and weighing on a digital balance. The resulting weight gain was obtained by subtracting the initial mass from the newly measured mass. The values obtained from the experiment are organised into factors and levels as shown in Table 1. 4.1 Design of Experiments
Water absorption is usually measured in terms of weight gained by the material. Holtz and Gibbs’ free swell
model uses initial volume, final volume and increase in volume, with the latter used to measure water absorption. Adopting the free swell model in this investigation, the water absorbed by the epoxy and its composites is affected by initial mass, final mass and weight gain, while the water absorbed is measured in percent (%). Consequently, the experiment was performed with three controllable 3-level factors and two output variables. The three parameters for the experiment are initial mass, final mass and weight gain, while the two output variables are water absorption and volume of solution.
Conventional optimisation methods make use of one factor at a time approach. A full factorial design would require 33 = 27 experimental runs, which can be cumbersome and costly in terms of money, time and energy. A full factorial design or experiment entails the interaction of one factor with another, bearing in mind that each of the factors has different levels that describes them. Therefore, a full factorial experiment would involve the use of one factor at a time with another with their varying degrees of levels. Implementing this would be time consuming, expensive, cumbersome requiring a great deal of effort. Thus, the GRA adopts the Taguchi method’s orthogonal array. To this end, an L9 (33) orthogonal array is used to study the parameters for optimality.
Table 1. Water absorption parameters and factor levels for pure epoxy and 5 % Orange peel particles (OPPs) composite
Parameters
Pure epoxy
Levels Initial mass,
Mi (g) Final mass,
Mf (g) Weight gain,
Wg (g)
1 15.12 15.62 0.55
2 18.47 19.25 0.88
3 19.6 20.52 0.86
5 % OPPs reinforced composite
1 16.88 17.96 1.17
2 18.12 19.66 1.55
3 18.86 20.41 1.58
Table 2. L9(33) Orthogonal array of experimental trials of water absorption and weight gain for pure epoxy and 5 % Orange peel particles
(OPPs) composite
Experimental trial
A (Initial mass)
B (Final mass)
C (Vol. of
Solution)
Pure epoxy 5 % OPPs composite
Water absorption (%)
Weight gain (g)
Water absorption (%)
Weight gain (g)
1 1 1 1 0.44 2.48 0.8 4.45
2 1 2 2 0.39 2.21 1.01 5.62
3 1 3 3 0.67 3.75 1.44 8.01
4 2 1 2 0.71 4.01 1.44 8
5 2 2 3 0.82 4.68 1.59 8.84
6 2 3 1 0.83 4.8 1.59 8.8
7 3 1 3 0.9 5.25 1.53 8.55
8 3 2 1 0.96 5.66 1.51 8.41
9 3 3 2 0.88 5.12 1.61 9.01

O.A. Ajibade.et.al.: Optimisation of Water Absorption Properties of Orange Peel Particulate-based Epoxy Composite Using Grey Relational Analysis 30
5. Results and Discussion
5.1 The Optimal Experimental Run
In this investigation, the water absorption and weight gain have been adopted as target responses in Table 2 for the pure epoxy and 5 % OPPs composite. As the time of immersion of the materials in water increased, the amount of water absorbed in terms of weight gain also increases. Reduced water absorption is required of composites which may be employed in water-based applications in order to retain its dimensional and structural integrity. Thus, the data sequences of water absorption and weight gain are expected to have “the lower-the-better” quality characteristics. This means “the lower-the-better” methodology (Equation. 1) will be employed in normalising the data. The two output
variables are set to be the specific sequence )()(
0 qyO , q =
1-2, while the results of the nine experiments are set to
be the comparison sequence )()(
qyO
j, j = 1-9, q = 1-2.
The sequences of the normalised data using Eqtn 1 are listed in Table 3 and are referred to as )(*
0 qy and
)(*qy j
for the specific and comparison sequences,
respectively. The divergence sequence for the pure epoxy is
given as follows:
|)()1(|)1(*
1
*
001 qyy −=∆ = | 1.00 – 0.9122| = 0.0878
|)()2(|)2(*
1
*
001 qyy −=∆ = | 1.00 – 0.9217| = 0.0783
Therefore, =∆01 (0.0878, 0.0783)
The same mathematical operation was carried out for j = 1 – 9 for the pure epoxy and 5 % OPPs composite and
the results obtained for 01∆ (j= 1- 9) is shown by Table
4. A careful look at the divergence sequences
presented in Table 4 shows that the max∆ (q) and
min∆ (q) for the pure epoxy can be obtained as follows:
max∆ = 00.1)2()1( 0808 =∆=∆
min∆ = 00.0)2()1( 0202 =∆=∆
while for the 5 % OPPs composite, we have
max∆ = 00.1)2()1( 0909 =∆=∆
min∆ = 00.0)2()1( 0101 =∆=∆
Table 3. Normalised data sequences for pure epoxy and 5 % OPPs composite
Pure epoxy 5 % OPPs composite
Specific/Comparison Sequence Water absorption (%) Weight gain (g) Water absorption (%) Weight gain (g)
Specific sequence 1.0000 1.0000 1.0000 1.0000
Comparison sequence
Experimental trial 1 0.9122 0.9217 1 1
Experimental trial 2 1 1 0.7407 0.7434
Experimental trial 3 0.5087 0.5536 0.2098 0.2192
Experimental trial 4 0.4385 0.4782 0.2098 0.2214
Experimental trial 5 0.2456 0.284 0.0246 0.0372
Experimental trial 6 0.228 0.2492 0.0246 0.046
Experimental trial 7 0.1052 0.1188 0.0987 0.1008
Experimental trial 8 0 0 0.1234 0.1315
Experimental trial 9 0.1403 0.1565 0 0
Table 4. Divergence sequences of normalised data
Pure epoxy 5 % OPPs composite
Divergence sequences )1(0 j∆ )2(0 j∆ )1(0 j∆ )2(0 j∆
Experimental trial 1, j = 1 0.0878 0.0783 0 0
Experimental trial 2, j =2 0 0 0.2593 0.2566
Experimental trial 3, j = 3 0.4913 0.4464 0.7902 0.7808
Experimental trial 4, j = 4 0.5615 0.5218 0.7902 0.7786
Experimental trial 5, j = 5 0.7544 0.716 0.9754 0.9628
Experimental trial 6, j = 6 0.772 0.7508 0.9754 0.954
Experimental trial 7, j = 7 0.8948 0.8812 0.9013 0.8992
Experimental trial 8, j = 8 1 1 0.8766 0.8685
Experimental trial 9, j = 9 0.8597 0.8435 1 1
The distinguishing effect is taken into account in Equation (5) to obtain the grey relational coefficient. When the parameters are of equal weighting as in the
current investigation, the x is designated as 0.5 (Fung,
2003). The obtained grey relational coefficient and grey
relational grades for all the nine comparison sequences are described by Table 5. In addition to the use of the orthogonal array, GRA makes use of Taguchi’s response table to obtain the optimal grey grades from each parameter. This is done by arranging the grey grades

O.A. Ajibade.et.al.: Optimisation of Water Absorption Properties of Orange Peel Particulate-based Epoxy Composite Using Grey Relational Analysis 31
according to each factor level in the orthogonal array and finding their average. In column 1 of the orthogonal array, trials 1, 2, and 3 are the experimental trials at which parameter A is fixed at level 1. The grey grade for parameter A at level 1 is obtained by finding the average of the afore-mentioned grey grades. Therefore, the grey relational grade for A1 is given as:
A1 = 1/3 (0.92325 + 1 + 0.6809) = 0.8681, A2 = 0.5976 and A3 = 0.5232
The same mathematical operation was carried out for all other factor levels and the response table described by Table 6 was generated. Fung (2003) observed that a higher grey relational grade indicates a better correlation to the specific sequence. The specific sequence used in this investigation had “the-lower-better” quality characteristics. As a result, the comparison sequence with the higher grey grade implies smaller water absorption and weight gain by the neat epoxy and its composites. On this basis, the highest grey grade is selected as the optimal grey grade (see Table 6).
Table 5. Grey relational coefficient and grey grades for nine comparison sequences
Experimental Trial
Orthogonal array L9(33) Pure epoxy 5 % OPPs composite
A B C Grey relational
coefficient Grey grade
Grey relational coefficient
Grey grade
1 1 1 1 0.9192 0.9273 0.92325 1 1 1
2 1 2 2 1 1 1 0.794 0.7957 0.79485
3 1 3 3 0.6705 0.6913 0.6809 0.5585 0.5615 0.56
4 2 1 2 0.6404 0.6571 0.64875 0.5585 0.5622 0.56035
5 2 2 3 0.5699 0.5827 0.5763 0.5062 0.5094 0.5078
6 2 3 1 0.5643 0.5711 0.5677 0.5062 0.5117 0.50895
7 3 1 3 0.5277 0.5315 0.5296 0.5259 0.5265 0.5262
8 3 2 1 0.5 0.5 0.5 0.5329 0.5351 0.534
9 3 3 2 0.5377 0.5424 0.54005 0.5 0.5 0.5
Table 6. Response table for pure epoxy and 5 % OPPs epoxy composite grey relational grades
Pure epoxy 5 % OPPs epoxy composite
Levels Factors Factors
A B C A B C
1 0.8681* 0.7005* 0.66365 0.7850* 0.6955* 0.6810*
2 0.5976 0.6921 0.7296* 0.5257 0.6122 0.6184
3 0.5232 0.5962 0.5956 0.5201 0.5230 0.5313
5.2 The Most Significant Factor
The Taguchi method makes use of ANOVA to find the significant contribution of each parameter and their percentage contribution to the process under investigation. In this investigation, the parameter which exerts the greatest influence on the water absorption of the pure epoxy and its composite can be investigated directly using the grey relational analysis. By making the weight gain and water absorption of the nine experimental trials the primary sequences
)()(qy
O
WGand )()(
qyO
WA, q= 1-2, while the values of factor
level in the experimental trials are fixed as comparison
sequences )()(qy
O
A, )()(
qyO
Band )()(
qyO
C, k=1-2 for the
three parameters. The new set of data sequences are described by Table 7.
Normalisation of the data was carried out using the initial value methodology (Equation 4), which produced new set of results described by Table 8. The divergence sequences were calculated using the same process in the preceding section. This was followed by substituting the divergence sequences and distinguishing coefficient into Equation (5) to compute the GRC. The GRG was
obtained by finding the average GRC in equal weighting. Table 8 displays the GRC and grades for the
specific sequences )()(qy
O
WGand )()(
qyO
WAas well as the
comparison sequences )()(qy
O
A, )()(
qyO
Band )()(
qyO
Cfor
the pure epoxy, while Table 8 shows the GRC and
grades for the specific sequences )()(qy
O
WGand )()(
qyO
WAas
well as the comparison sequences )()(qy
O
A,
)()(qy
O
Band )()(
qyO
Cfor the epoxy composite.
The optimisation was done through two main computer packages, namely the statistical software, Minitab 16, and the Microsoft Excel spreadsheet. First, Table 8 describes the factors and levels showing that it is a 3-factor, 3-level optimisation problem. The factors are the parameters involved in the experiment, while the levels describe the conditions of the parameters in the experimental process. Adopting Taguchi’s combination of factors and levels requires the use of an orthogonal array. The development of an orthogonal array was aided by the use of Minitab 16, which show options of various orthogonal array configurations. Thus, an L9 orthogonal array was generated for this purpose.

O.A. Ajibade.et.al.: Optimisation of Water Absorption Properties of Orange Peel Particulate-based Epoxy Composite Using Grey Relational Analysis 32
Table 7. Normalised data sequences for pure epoxy and 5 % OPPs
Experimental Trial
Pure epoxy
Comparison sequences Reference sequences
A B C Weight gain Water absorption
1 1.0000 1.0000 1.0000 1.0000 1.0000
2 1.0000 1.2324 1.0372 0.8864 0.8911
3 1.0000 1.3137 1.0483 1.5227 1.5121
4 1.2216 1.0000 1.0372 1.6136 1.6169
5 1.2216 1.2324 1.0483 1.8636 1.8871
6 1.2216 1.3137 1.0000 1.8864 1.9355
7 1.2963 1.0000 1.0483 2.0455 2.1169
8 1.2963 1.2324 1.0000 2.1818 2.2823
9 1.2963 1.3137 1.0372 2.0000 2.0645
5 % OPPs composite
1 1.0000 1.0000 1.0000 1.0000 1.0000
2 1.0000 1.0947 1.0487 1.2625 1.2629
3 1.0000 1.1364 1.0867 1.8000 1.8000
4 1.0735 1.0000 1.0487 1.8000 1.7978
5 1.0735 1.0947 1.0867 1.9875 1.9865
6 1.0735 1.1364 1.0000 1.9875 1.9775
7 1.1173 1.0000 1.0867 1.9125 1.9213
8 1.1173 1.0947 1.0000 1.8875 1.8899
9 1.1173 1.1364 1.0487 2.0125 2.0247
Table 8. Obtained grey relational coefficients and grey relational grades for pure epoxy and 5 % OPPs epoxy composite
Pure epoxy
Weight gain Water absorption
Grey relational coefficient
A
(initial mass) B
(final mass) C
(vol. of solution) A
(initial mass) B
(final mass) C
(vol. of solution)
1.0000 1.0000 1.0000 1.0000 1.0000 1.0000
0.7958 0.6017 0.7967 0.8190 0.5909 0.8144
0.4586 0.7144 0.5546 0.4904 0.7130 0.5802
0.5303 0.4600 0.5062 0.5549 0.4441 0.5251
0.4081 0.4530 0.4201 0.4256 0.4295 0.4332
0.3998 0.4772 0.3999 0.4085 0.4422 0.4067
0.3714 0.3333 0.3721 0.3753 0.3062 0.3749
0.3333 0.3550 0.3333 0.3333 0.3195 0.3333
0.3861 0.4323 0.3803 0.3908 0.3963 0.3843
Grey relational grade 0.5204 0.5363 0.5292 0.5331 0.5157 0.5391
5 % OPPs epoxy composite
1.0000 1.0000 1.0000 1.0000 1.0000 1.0000
0.6352 0.7311 0.6809 0.6345 0.7324 0.6952
0.3636 0.4074 0.3901 0.3633 0.4097 0.4066
0.3861 0.3632 0.3778 0.3866 0.3660 0.3948
0.3333 0.3382 0.3362 0.3333 0.3405 0.3519
0.3333 0.3490 0.3160 0.3325 0.3538 0.3333
0.3649 0.3333 0.3559 0.3621 0.3333 0.3693
0.3724 0.3652 0.3395 0.3714 0.3668 0.3545
0.3380 0.3424 0.3213 0.3374 0.3415 0.3336
Grey relational grade 0.4585 0.4700 0.4575 0.4579 0.4716 0.4710
The normalisation of the data between the values of 0 and 1, as required in the grey relational methodology were calculated by simple formula inputs using Equations 1, 6, 7, 8 and 9 with the Microsoft Excel spreadsheet package.
In order to find the most significant factor for the water absorption of pure epoxy, the grey relational grades in Tables 9 are organised into matrix form in the following manner:
( ) ( ) ( )( ) ( ) ( )
=
CWA,BWA,AWA,
CWG,BWG,AWG,
ββββββ
β
=
5391.05157.05331.0
5292.05363.05204.0
This gives
Row 1 = ( ) ( ) ( )( )CWG,,BWG,,AWG, ββ
= ( )5292.0,5363.0,5204.0
Row 2 = ( ) ( ) ( )( )CWA,,BWA,,AWA, ββ
= ( )5391.0,5157.0,5331.0

O.A. Ajibade.et.al.: Optimisation of Water Absorption Properties of Orange Peel Particulate-based Epoxy Composite Using Grey Relational Analysis 33
Col 1 = ( )( )A(WA,A),WG,β = (0.5204, 0.5331)
Col 2 = ( )( )B(WA,B),WG,β = (0.5363, 0.5157)
Col 3 = ( )( )C(WA,C),WG,β = (0.5292, 0.5391)
From the grey relational matrix for pure epoxy, Row 1 as well as Row 2 indicate the quantities of the GRG for the controllable factors for water absorption of WA-type and WG-type, respectively. As a result, the level of influence which each of the controllable factors exercises on the output variables could be determined. Therefore, the maximum of Row 1 and Row 2 is picked as the response variable most easily influenced. Thus, we have max (Row 1, Row 2) = Row 2 =
( ) ( ) ( )( )CWA,,BWA,,AWA, ββ = (0.5331, 0.5157,
0.5391). This indicates that the specific sequence of
water absorption properties WA-type )()(qy
O
WA has a
better specific sequence which also signifies that the output variable of WA-type has a better correlation to the controllable factors of the water absorption process than that of the WG-type. As a result, the water absorption parameter of WA-type was more easily influenced by the effect of the controllable factors than the WG-type.
Another perspective to the GRG for the controllable factors A, B and C to the water absorption properties of WA-type and WG-type is described by Cols. 1, 2 and 3, respectively. In this way, the level of influence each parameter wields over the output variables can be determined. The maximum value of Cols. 1 to 3 becomes the most influential controllable factor. Thus we have, max cols. (1, 2, 3) = Col 3 =
( )( )C(WA,C),WG,β = (0.5292, 0.5391). This means the
volume of solution )()(qy
O
Chas the strongest comparison
sequence among the water absorption parameters. In other words, the volume of solution has the highest correlation to the water absorption output variables of WG-type and WA-type. Therefore, the volume of solution is the most significant factor to the water absorption properties of the pure epoxy. The comparison of Rows 1 and 2 revealed Row 2 as the most easily affected output variable. By checking every item in Row 2, we can estimate the level of influence each of the controllable factors has over the water absorption parameter of WA-type with respect to their grey relational grade. From Row 2, we have
( )CWA,β > ( )AWA,β > ( )BWA,β . This translates to
an order of importance for the properties of weight gain type C, A and B. For Row 1, we have
( )BWG,β > ( )CWG,β > ( )AWG,β . The entire
sequence of B, C and A was found to change. The most important factor to the water absorption parameters of pure epoxy WA-type is factor C, while the most important to the water absorption parameters of pure epoxy WA-type is factor B. The level of influence each of these factors exercises on the output variables can be viewed from Cols. 1, 2 and 3. It can be observed that the
level of influence factor C exerts on the output variable WA-type is greater than the influence factor B exerts on the output variable WG-type.
For the most significant factor in the water absorption of 5 % OPPs composite, the grey relational grades in Table 8 are grouped in the matrix form as follows:
( ) ( ) ( )( ) ( ) ( )
=
CWA,BWA,AWA,
CWG,BWG,AWG,
ββββββ
β
=
4710.04719.04579.0
4575.04700.04585.0
We have
Row 1 = ( ) ( ) ( )( )CWG,,BWG,,AWG, ββ
= ( )4575.0,4700.0,4585.0
Row 2 = ( ) ( ) ( )( )CWA,,BWA,,AWA, ββ
= ( )4710.0,4719.0,4579.0
Col 1 = ( )( )A(WA,A),WG,β = (0.4585, 0.4579)
Col 2 = ( )( )B(WA,B),WG,β = (0.4700, 0.4719)
Col 3 = ( )( )C(WA,C),WG,β = (0.4575, 0.4710)
In the grey relational matrix for the 5 % OPPs epoxy composite, Row 1 and Row 2 show the values of the grey relational grade for the controllable factors of WG-type and WA-type, respectively. Therefore, the degree of influence on each of the controllable factor exerts could be found. The most easily affected output variable is the maximum of Row 1 and Row 2. This gives, max Rows(1, 2) = Row 2 =
( ) ( ) ( )( )CWA,,BWA,,AWA, ββ = (0.4579, 0.4719,
0.4710). Again, the specific sequence of water
absorption properties of WA-type )()(qy
O
WAis considered
as the preferred specific sequence which means the output variable of WA-type has a superior correlation to the controllable factors of the water absorption process of the 5 % epoxy composite than the WG-type. This implies that the WA-type was more affected by the influence of the controllable factors than the WG-type.
The values of the grey relational grade for the controllable factors A,B and C to the water absorption parameters of WA-type and WG-type is considered as shown in Cols. 1, 2 and 3, respectively. This makes it possible to determine the level of influence each particular controllable factor exercises on the output variables. The most significant controllable factor is the maximum value of Cols. 1, 2 and 3. This gives, max Cols.(1, 2, 3) = Col 2 = ( )( )B(WA,B),WG,β = (0.4700,
0.4719). This indicates the final volume )()(qy
O
Bhas the
highest comparison sequence among the controllable factors, which means the final volume has the highest correlation to the water absorption output variables of WA-type WG-type. Therefore, the final mass is the most significant factor to the water absorption of the 5 % OPPs epoxy composite.

O.A. Ajibade.et.al.: Optimisation of Water Absorption Properties of Orange Peel Particulate-based Epoxy Composite Using Grey Relational Analysis 34
The comparison of rows 1 and 2 showed that WA-type as the output variable is most affected by the controllable factors. By going through row 2, the level of influence each of the controllable factors brings to bear on the water absorption properties can be determined through their respective grey relational grade. From Row
2, we have ( )BWA,β > ( )CWA,β > ( )AWA,β . The
sequential order of importance of the controllable factors to water absorption properties of WA-type is given as B,
C and A. In Row 1, it is > ( )AWG,β > ( )CWG,β . The
sequential order of importance of the controllable factors to water absorption properties of WG-type becomes B, A and C. The position of factor B remained constant, while the sequence of factors A and C changed. The level of influence which factor B exercises as the most significant factor on water absorption properties of WG-type and WA-type can be viewed from Col 2. In other
words, ( )BWA,β > ( )BWG,β shows that the water
absorption properties of WA-type (output variable WA) was affected more by the final mass (factor B) compared to the water absorption properties of WG-type (output variable WG). 6. Conclusions
The optimisation of water absorption properties of pure epoxy and 5 % OPPs composite has been carried out in order to find the recommended levels the pure epoxy and 5 % OPPs composite can perform optimally. The grey relational analysis was used to find the best experimental run and most significant factor for the pure epoxy and 5 % OPPs epoxy composite by finding the strongest correlation among their sequences. Based on the foregoing, the following can be deduced. 1) The optimal experimental run
• The highest grey relational grade from each parameter was used to pick the optimal levels for the pure epoxy as A1B1 and C2. This can be interpreted as 15.12 g initial mass, 15.62 g final mass and 0.88 g weight gain.
• The highest grey relational grade from each parameter was used to identify the optimal levels for the 5 % OPPs epoxy composite as A1B1 and C1. This can be translated as 16.88 g initial mass, 17.96 g final mass and 1.17 g weight gain.
2) The most significant factor (pure epoxy)
• The WA-type has a higher correlation to the controllable factors of the water absorption process than the WG-type. This means the WA-type was more influenced by the effect of the controllable factors than the WG-type.
• The volume of solution has the highest correlation to the water absorption output variables of WG-type and WA-type and is termed the most significant
factor to the water absorption properties of the pure epoxy.
• For the WA-type output variable, the sequential order of importance for the parameters is given as C, A and B, which is being interpreted as volume of solution, initial mass and final mass.
• For the WG-type output variable, the sequential order of importance of the parameters was found to be B, C and A, which can be translated as final mass, volume of solution and initial mass.
The most significant factor (5 % OPPs composite)
• The output variable of the WA-type has a superior correlation to the controllable factors of the water absorption process of the 5 % OPPs composite than the WG-type. This implies that the WA-type was more affected by the influence of the controllable factors than the WG-type.
• The final volume has the highest correlation to the water absorption output variables of WA-type and WG-type and is the most significant factor to the water absorption of the 5 % OPPs composite.
• For the WA-type output variable, the sequential order of importance of the parameters is given as B, C and A which is interpreted as final mass, volume of solution and initial mass.
• For the WG-type output variable, the sequential order of importance of the parameters is given as B, A and C, which can be read as final mass, initial mass and volume of solution. The implication of the test results is that the optimal
parametric setting for the water absorption of pure epoxy and its OPP-epoxy composite revealed the best combination of factors that can attain the desired minimal water absorption in composites. This can be used to predict the water absorption behaviour of OPP-epoxy composite on a large scale.
References:
Abass, R.U. (2015), “Mechanical behavior of natural material (orange peel) reinforced polyester composite”, International
Journal of Engineering Sciences and Research Technology, Vol. 4, No. 3, pp. 166-172.
Agunsoye, J.O., Talabi, S.I., Hassan, S.B., Awe, I.O., Bello, S. A. and Aziakpono, E. (2014), “The development and characterisation of aluminium dross-epoxy resin composite materials”, Journal of Materials Science Research, Vol. 3, No. 2, pp. 23-37.
Aigbodion, S. V., Athianya, C. V, Igogori, E.A. and Ihon, P. (2013), “Development of high-density polyethylene/orange peels particulate bio-composite”, Gaza University Journal of Science, Vol. 26, No 1, pp. 107-117.
Ajibade, O.A. (2015a), “Experimentation and prediction of moisture characteristics and density of sweet orange peels used for epoxy-based composite fabrication”, The Journal of the
Association of Professional Engineers of Trinidad and Tobago, Vol.43, No. 2, pp. 44-52.
Ajibade, O. A., Agunsoye, J.O. and Oke, S.A. (2015b), “Analysis of the free- smell behavior of orange peel particulates”, Acta
Periodica Technologica, Vol. 46, pp. 131-147.

O.A. Ajibade.et.al.: Optimisation of Water Absorption Properties of Orange Peel Particulate-based Epoxy Composite Using Grey Relational Analysis 35
Ajibade, O. A., Agunsoye, J.O. and Oke, S.A. (2016), “A grey relational analytical approach to orange peel filler particulates for tapped density experiments of green composite reinforcements”, KKU Engineering Journal, Vol. 43, No. 3, pp. 108-119.
Annepu, R. (2012), “Observations from India’s Crisis”, 1st
International Brainstorming Workshop, Waste-to-Energy Research and Technology Council (WTERT) - India, 89-B, NEERI Mumbai Zonal Lab, Worli, Mumbai, MH 400018, India, August 23-24.
Chen, W., Gao, Y., Ju, F. and Wang, Y. (2009), “Tribological behavior of Si3 N4 – hBN ceramic materials with water lubrication”, Tribological Letters, Vol.37, pp. 229-238.
Chow, C.P., Xing, X.S. and Li, R.K. (2007), “Moisture absorption studies of sisal fiber reinforced polypropylene composites”, Composite Science and Technology, Vol. 67, pp. 306-313.
Cu, Y.H., Lee, S. and Tao, J. (2008), “Effects of alkaline and silane treatments on the water-resistance properties of wood-fiber-reinforced recycled plastic composites”, Journal of Vinyl
Addition Technology, Vol. 14, No. 4, pp. 211-220. Deng, J.L. (1985), Grey Control Systems, Press of Huazhong
University of Science and Technology, Wuhan (in Chinese). Deng, J.L. (1990), A Course in Grey Systems Theory, Press of
Huazhong University of Science and Technology, Wuhan (in Chinese).
Deng, J.L. (1996), “Several problems on the research and development of grey systems”, in: Liu, S.F. and Xu, Z.X. (Eds), New Developments in Grey Systems Research, Press of Huangzhong University of Science and Technology, Wuhan, pp. 1-12.
Fang, Z.G. and Liu, S.F. (2003), “Study on linear programming model based on grey matrixgame”, Journal of Automobile
Management Institute, Vol. 1 No. 1, pp. 61-67 (in Chinese) Fung, C.-P. (2003), “Manufacturing process optimisation for wear
property of fiber-reinforced polybutylene terephthalate composites with grey relational analysis”, Wear, Vol. 254, pp. 298-306.
Girisha, C., Sanjeevamurthy, R. and Srinivas, G.R. (2012a), “Sisal/coconut coir natural fibers-epoxy composites: Water absorption and mechanical properties”, International Journal of
Engineering and Innovation Technology, Vol. 2, No. 3, pp. 166-170.
Girisha, C., Sanjeevamurthy, R. and Manu, S. (2012b), “Mechanical performance of natural fiber-reinforced epoxy hybrid composites”, International Journal of Engineering
Research and Applications, Vol. 2, No. 5, pp. 615-619. Haameem, J.A., Mayid, M.S.A., Afendi, M., Marzuki, H.F.A.,
Hilmi, E.A., Fahmi, L. and Gibson, A.G. (2016), “Effects of water absorption on napier grass fiber/polyester composites”, Composites Structures, Vol. 144, pp. 138-146.
Hu, R.H., Sun, M.Y. and Lim, J.K. (2010), “Moisture absorption, tensile strength and microstructure evolution of short jute fiber/polylactide composite in hydrothermal environment”, Materials and Design, Vol. 31, pp. 3167-3173.
Hu Y., Li X., Lang A.W., Zhang Y., Nutt S.R. (2016), “Water immersion aging of polydicyclopentadiene resin and glass fiber composites”, Polymer Degradation and Stability, Vol. 124, pp. 35-42.
Kumar, P. (2012), Mechanical Behavior of Orange Peel
Reinforced Epoxy Composite, B.Sc. Thesis, Department of Mechanical Engineering, National Institute of Technology, Rourkela, India.
Li, X., Gao, Y., Yang, Q., Pan, Q., Pan, W., Li, Y., Zhong, Z. and Song, L. (2015), “Evaluation of tribological behaviour of B4 C-hBN ceramic composites under water-lubricated condition”, Ceramics International, Vol. 41, pp.7387-7393.
Ojha, S., Raghavendra, G., Acharya, S.K. and Kumar, P. (2012), “Fabrication and study of mechanical properties of orange peel reinforced polymer composite”, Caspian Journal of Applied
Sciences Research, vol. 1 No. 13, pp. 190 – 194. Pan, Y. and Zhong, Z. (2015), “The effect of hybridization on
water absorption and mechanical degradation of natural fiber composites: An analytical approach”, Composite Science and
Technology, Vol. 110, pp.132-137. Panda, A.K., Singh, R.K. and Mishra, D.K. (2010), “Thermolysis
of waste plastics to liquid fuel: A suitable method for plastic waste management and manufacture of value added products: A world prospective”, Renewable and Sustainable Energy Reviews, Vol. 14, No. 1, pp. 233-248.
Sabiiti, E.N. (2011), “Utilising agricultural waste to enhance food security and conserve the environment”, African Journal for
Food, Agriculture, Nutrition and Development, Vol. 11, No. 6, pp. 1-9.
Saito, T. and Honda, F. (2000), “Chemical contribution to friction behaviour of sintered hexagonal boron nitride in water”, Wear, Vol. 237, pp. 253-260.
Tzeng, C.-J., Lin, Y.-H., Yang, Y.-K. and Jeng, M.-C. (2009), “Optimisation of turning operations with multiple performance characteristics using the Taguchi method and grey relational analysis”, Journal of Materials Processing Technology, Vol. 209, No. 6, pp. 2753-2759.
Umeda, K., Enomoto, Y., Mitsui, A. and Mannami, K. (1993), “Friction and wear of boride ceramics in air and water”, Wear, Vol. 169, pp.63-68.
Yakowitz, H. (1993), “Waste management: What now? What next? An overview of policies and practices in the OECD area”, Resources, Conservation and Recycling, Vol. 8, Nos.1-2, pp. 131-178.
Authors’ Biographical Notes:
Oluwaseyi Ayodele Ajibade is a Ph.D. student at The University
of Lagos, being supervised by Drs. Agunsoye and Oke in the
Department of Metallurgical and Materials Engineering,
University of Lagos, Lagos, Nigeria. His research interests include
wear and composites.
Johnson Olumuyiwa Agunsoye received Ph.D. from The
University of Lagos and is currently the Deputy Dean (II), Student
Affairs, University of Lagos. He lectures in the Department of
Metallurgical and Materials Engineering, University of Lagos,
Lagos, Nigeria. His research interests include wear and
composites.
Sunday Ayoola Oke received Ph.D. from The University of
Ibadan in 2008. He lectures in the Department of Mechanical
Engineering, University of Lagos, Lagos, Nigeria. His research
interests include maintenance, production, composites and
optimisation.
■

S. Odi-Owei and A.S. Onuba: Experimental Investigation on Tribological Behaviour of Carbon Steels 36
Experimental Investigation on Tribological Behaviour of Carbon Steels
Steven Odi-Owei a,Ψ, and Amandi S. Onubab
aDepartment of Mechanical Engineering, Rivers State University of Science & Technology, Port Harcourt, Nigeria; E-mail: [email protected]
bDepartment of Mechanical Engineering, University of Port-Harcourt, Rivers State, Nigeria; E-mail: [email protected]
Ψ Corresponding Author
(Received 10 April 2016; Revised 29 August 2016; Accepted 30 September 2016)
Abstract: An investigation on the friction coefficient and wear rate of carbon steel specimens with 0.05%C, 0.14%C,
0.20%C, 0.346%C and 0.41%C, in contact with Titanium Nitride of PVD coating on a steel substrate was carried out under
unlubricated conditions on a pin-on-disc tribometer. Experiments were conducted with the specimens in the form of a pin
sliding against a TiN disc. Normal loads of 2, 5, 7 and 10 N, and sliding speeds of 15.33 and 7.67 cm/s were deployed as the
operating variables. Variations of friction coefficient, wear rate and time to reach steady state friction were investigated at
different sliding speeds and normal loads. Results obtained show that friction coefficient and wear rate vary with normal
load, sliding speed and duration of rubbing. Friction coefficient decreased with increasing rubbing duration and decreasing
sliding speed, while wear rate increased with increasing rubbing duration. In general, friction coefficient increased for a
certain rubbing duration and after that it remained constant till the end of the experimental time. Results also show that in
comparison, the specimen with higher carbon content had a better tribological behaviour.
Keywords: Friction, wear rate, steady state friction time, carbon steels, Tribology, load
1. Introduction
Friction and wear together with lubrication form the scientific discipline known as tribology. A major area of tribology is the design of materials and surfaces sliding and rolling against each other in such a way that friction and wear are minimized. By reducing friction and wear, many benefits, both economical and environmental, can be achieved in several technological fields of application.
Owing to their relatively low material cost and good qualities such as good soft-magnetic properties, high strength, good corrosion and wear resistance, steels continue to gain wide use as prospective functional and structural materials (Tokaji, Kohyama and Akita, 2004). Carbon steels consisting of about four-fifths of the total tonnage of steel production are economical compared to alloy steels. These are extensively used as structural components and other engineering applications.
Wear mechanisms are affected by many variables such as normal load applied on the material, sliding speed, sliding distance, surface geometry, surface hardness, roughness of operating surface, etc. Tribological behaviour of metals which are in sliding contact depends on these variables and thus results in change of wear rate (Devaraju and Elayaperumal, 2010). As a result of so many variables involved and for the fact that these variables are inter-dependable, controversies over the understanding of wear mechanism still exist.
In most cases, wear rate is proportional to the normal load applied (Dhushyant et al., 2011). Kapil et
al. (2013), in their study, showed that wear rate of steel 304 increased with increasing load from 20N to 50N, carried out at different speeds. However, in Odi-Owei’s (1989) work, it was seen that there was greater wear activity under 319N for a carbon steel sample of 0.14 - 0.20 %C when compared with its response under 636N.
Podgornik et al. (1999) found that as the test load was increased, the coefficient of friction also increased, and increasing the sliding speed led to a considerable reduction in the coefficient of friction. On the contrary, Jia et al (2008) found that increasing the normal load caused a decrease in the coefficient of friction and wear rate of AISI 304 steel. Also, Autay et al. (2011) in their study concluded that increasing the normal load decreased the coefficient of friction. Friction may increase or decrease as a result of increased sliding velocity for different material combinations (Chowdhury et al., 2013). Zhu and Kelly (2004), in their work, reported that sliding speed strongly affected both the coefficient of friction and wear depth. These values increased with increase in sliding speed. 2. Experimental Detail
2.1 Materials and Specimens
The carbon steel pin specimens used were machined out to a spherical base cylindrical dimension of 4.5mm in diameter and 8mm in length, using a lathe machine. They were further ground and polished with an emery cloth of WS FLEX 18, P-800, 789C 201 grading. The composition of the pins marked K, P, A, G and D are provided in Table 1.
ISSN 0511-5728 The West Indian Journal of Engineering
Vol.39, No.2, January 2017, pp.36-39

S. Odi-Owei and A.S. Onuba: Experimental Investigation on Tribological Behaviour of Carbon Steels 37
Table 1. Composition of selected steels
MARK Fe% C% Si% Mn% S%
K 97.66 0.05 0.215 0.755 0.019
P 97.66 0.14 0.215 0.755 0.019
A 97.66 0.20 0.215 0.755 0.019
G 98.45 0.346 0.302 0.538 0.042
D 97.71 0.41 0.318 0.856 0.065
The disc used in this study is a Titanium Nitride (TiN) of PVD coating (TiN thickness of 3 – 5 μm) on a steel substrate with diameter of 25mm and thickness of 5 mm, as supplied with the pin-on-disc tribometer.
2.2 Test Equipment and Procedure
The pin-on-disc tribometer used for the study was designed for high precision measurement of friction, wear and lubrication. In the dry test of a solid-to-solid contact, sliding occurs between a static partner (sphere, pin or flat geometry) that is loaded onto a rotating disc with a precise known force. Alteration of the normal load, wear track diameter, test duration and rotating speed is possible, to suit test conditions. The general view and schematic diagram of the pin-on-disc tribometer are shown in Figure 1.
Figure 1: General instrument view (A); and Schematic diagram of
Pin-on-disc tribometer (B)
The test parameters and ranges are given in Table 2.
To perform the test, the pin specimen was cleaned with methylated spirit (isopropyl) and inserted into the pin holder which was mounted on a stiff cantilever arm of the tribometer designed as a frictionless force transducer. The disc was also secured in place with the disc holder. A linear speed of 15.33cm/s and the pin distance from the disc center were fixed. The number of laps to be covered during the experiment was also fixed. An initial load of 2N was used to start up the experiment which ran approximately up to 700 laps. The loads were later increased to 5N, 7N and 10N. As the disc was rotated, the resulting frictional forces acting between the pin and the disc were measured by very small deflections of the lever using an RVDT sensor.
Table 2. Technical Specifications of the Pin-on-disc Tribometer
SPECIFICATIONS RANGES
Normal load (dead weight/s) Up to 60 N
Friction force Up to 10 N, optional 20 N
Rotational speed (pin on disc) 0.3 – 500 rev/min, optional 1500 rev/min
Linear speed 100mm/s
Linear stroke 60mm
Disc diameter Up to Ø 60 mm
Torque 450 N-mm
With the combined computer control and tribometer software which was based on an Instrum X interface, an on-screen real time monitoring of the frictional curve was displayed during the measurement process. A calibrated video camera was used to measure the worn diameter of the pin and wear rate of the pin specimen was calculated by the tribometer software. The rotating speed of the disc was later varied at a normal load of 10N and at a constant distance of the pin from the center.
3. Results and Discussion
To know the effect of the load on the friction coefficient, each of the sample specimens was tested with normal loads from 2N to 10N at a linear speed of 15.33cm/s and the pin distance from the disc center was fixed. Typical friction data are presented in Figure 2.
Figure 2: Sample D Coefficient of friction at 2N normal load
Figure 3: Comparative friction coefficient of the pin samples
(A) (B)

S. Odi-Owei and A.S. Onuba: Experimental Investigation on Tribological Behaviour of Carbon Steels 38
It was observed that values of the friction coefficient curves of the various pin samples were low at the initial stage of the rubbing, and increased as the rubbing continued to fairly stable values till the end of the test. However, friction tests over a wider range of sliding speed would be desirable to establish the response of friction to change in speed. The pin sample D had a more consistent least value of steady state friction coefficient from 0.40 to 0.45 under normal loads from 2N to 10N (see Figure 3). Also, sample D mostly attained steady state friction at a shorter period compared to other samples under the normal load applied. From Figure 4 below, as the carbon content increases, a possible trend of lesser time to approach steady state friction could be seen. Inconsistency in the trend from pin sample G and slightly from K was also observed. Lower values of steady state friction coefficient were observed over increased rubbing time and decreased sliding speed. Figure 4: Time to reach steady state friction value under different
normal loads
From the comparative wear rate curves of the
samples in Figure 5, inconsistency in the wear rate of the pin samples was observed as the normal load increased. The wear rates for pin samples, K and P, increased as the load increased from 2N to 7N, and declined when 10N load was applied. Samples A and G revealed a decline in the wear rate for normal loads from 5N to 10N. In the case of pin sample D, wear rate was observed to increase as the load increased from 5N to 10N; it was also characterized by a lower wear rate, compared to other pin samples under 5N and 7N load.
In comparing the wear rates of the samples at reduced speed of 7.65cm/s to its wear rate under same normal load of 10N at 15.3cm/s sliding speed, pin sample D was observed to have the least increase in wear rate, particularly below the 10N load. Sample A exhibited the worst wear rate within this range of load. When the tribometer speed was reduced from 15.3cm/s to 7.65cm/s sliding speed, more rubbing time was observed to complete the designated lap for the test.
Also, an increase in the distance between the pin and the disc center leads to increased sliding distance. A wide range of sliding speeds would determine a more accurate wear behaviour with respect to speed.
Figure 5: Comparative wear rates of the pin samples
The SEM micrographs of the pin specimens A, D and K (before and after test) are shown in Figure 6. Initial examination of the surface after test indicates material transfer and ploughing. Further determination of the surfaces, using additional analytical equipment is planned, to reveal the mechanism and extent of deformation. It is evident, however, that samples A, D and K (in ascending order of attrition) exhibit greater wear.
Figure 6: The SEM micrographs of pin specimens A, D and K
before and after test
In comparing the behaviour of the different selected pin samples, it was needful to look at the one that exhibited lesser wearing ability, lower coefficient of
(A)
(A) (D) (K)
(D) (K)
Before Test:
After Test:

S. Odi-Owei and A.S. Onuba: Experimental Investigation on Tribological Behaviour of Carbon Steels 39
friction and short time to achieve steady state friction as the one that has preferable tribological behaviour in a sliding or rubbing contact. This is very relevant to engineering as selecting materials with preferable tribological behaviour in mating parts (like in machine design) would improve the performance of the machine.
The influence of interfacial oxides, the transfer of chemically composed films, and related contact mechanisms (such as ploughing, adhesion, abrasion, fatigue), and corrosion may have played a possible role in the complex friction and wear process within the contact. Besides, surface-generated wear debris, their size and morphology and hardness presumably had an effect on the state of contact friction and wear, particularly as the tribo-pair run repeatedly over the same wear track during each condition of test. This would affect the period of running-in and steady state recovery of friction. Specific inferences cannot therefore be drawn from the data here, but the interrelationship between the complex elements of friction and wear phenomena (physico-chemical, mechanical, etc.) calls for a fundamental study of the contributive effect of these individual elements on friction and wear behaviour. 4. Conclusion
The operating variables such as normal applied load, sliding speed and sliding distance or rubbing time indeed considerably affect the friction coefficient and wear rates of carbon steels of 0.05%C, 0.14%C, 0.20%C, 0.346%C and 0.41%C.
The time to reach steady state friction coefficient was incoherent as the normal load and carbon percentage increased. Friction coefficient varied with the sliding distance and became steady after certain duration of rubbing. It decreased with increasing sliding distance and decreasing sliding speed, while wear rate increased with increasing sliding distance.
Specimen D with higher carbon content of 0.41%C maintained the least wear rate, attained steady state friction coefficient at the shortest period, and least friction coefficient under varying loads. Thus, it exhibits the most preferable tribological behaviour.
References:
Autay, R., Kchaou, M., Elleuch, K. and Dammak, F. (2011), “Tribological behaviour of carbon and low alloy steels: Effects of mechanical properties and test conditions”, Tribology –
Materials, Surfaces and Interfaces, Vol.5, pp.133-140.
Chowdhury, M.A., Nuruzzaman, D.M., Roy, B.K., Dey, P.K., Mostafa, M.G., Islam, M.S. and Mia, Md. R. (2013), “Experimental investigation on friction and wear of stainless steel 304 sliding against different pin materials”, World Applied
Science Journal, Vol.22, No.12, pp.1702-1710. Devaraju, A. and Elayaperumal, A. (2010), “Tribological
behaviours of plasma Nitrided AISI 316 stainless steel in air and high vacuum atmosphere at room temperature”, International
Journal of Engineering Science and Technology, Vol.2, No.9, pp.4137- 4146.
Dhushyant, S., Saha, K.P. and Mondal, D.P. (2011), “Development of mathematical model for prediction of wear behaviour in agriculture grade medium carbon steel”, Indian
Journal of Engineering and Material Science, Vol.18, pp.125-136.
Jia, J., Ma, Q., Lu, J. and Wang, B. (2008), “Reciprocating sliding friction and wear property of Fe3Si based alloys containing Cu in water lubrication”, Tribology Letters, Vol.30, pp.113-121.
Kapil, C., Naveen, S. and Rajeev, D. (2013), “Investigation of tribological behaviour of stainless steel 304 and grey cast iron rotating against EN32 steel using pin on disc apparatus”, IOSR
Journal of Mechanical and Civil Engineering (IOSR-JMCE), Vol.9, pp.18-22.
Odi-Owei, S. (1989), “Some tribological characteristics of plain carbon steels”, Discovery and Innovation, Vol.1, pp. 67-72.
Podgornik, B., Vizintin, J. and Leskovsek, V. (1999), “Wear properties of induction hardened, conventional plasma nitrided and pulse plasma nitrided AISI4140 steel in dry sliding conditions”, Wear, Vol.232. pp.231-242.
Tokaji, K., Kohyama, K. and Akita, M. (2004), “Fatigue behaviour and fracture mechanism of a 316 stainless steel hardened by carburising”, International Journal of Fatigue, Vol.26, pp.543.
Zhu, B. and Kelly, G.L. (2004), “Frictional behaviour and wear performance of a nitrocarburised coating sliding against AISI 1019 steel”, Materials Forum, Vol. 27, pp.54-61
Authors’ Biographical Notes:
Steven Odi-Owei is an Emeritus Professor of Mechanical
Engineering at The Rivers State University of Science and
Technology, Port Harcourt, Nigeria. He is a Fellow of the African
Academy of Sciences; Fellow, Nigerian Academy of Engineering;
Fellow, Nigerian Society of Engineers; Fellow, Nigerian
Institution of Mechanical Engineers; and Fellow, Institution of
Diagnostic Engineers. Professor Odi-Owei is a former Vice-
Chancellor of The Rivers State University of Science and
Technology, Port Harcourt, Nigeria.
Amandi S. Onuba is a Master’s Degree student in Department of
Mechanical Engineering, University of Port-Harcourt, River State,
Nigeria. He was a graduate of Material and Metallurgical
Engineering, Federal University of Technology, Owerri, Imo State,
Nigeria.
■

R. P. Clarke: Seismic Fragility Functions for Light Unreinforced Masonry Single-Story Residential Structures in Trinidad and Tobago 40
Seismic Fragility Functions for Light Unreinforced Masonry Single-Story
Residential Structures in Trinidad and Tobago
Richard P. Clarke
Department of Civil and Environmental Engineering, Faculty of Engineering, The University of the West Indies, Trinidad and Tobago, West Indies; E-mail: [email protected]
(Received 19 April 2016; Revised 28 September 2016; Accepted 14 October 2016)
Abstract: In the developing twin-island republic of Trinidad and Tobago, located in the southern Caribbean which is a
seismic region, at least two-thirds of the existing building stock comprises of single-story light unreinforced masonry (URM)
residential structures prone to sliding and out-of-plane tilting instability. Trinidad and Tobago is the economic hub of the
Caribbean hence losses due to failure of this type of construction will be catastrophic. Fragility functions of the structure for
the various limit states describing damage are required to enable probabilistic seismic assessment of the country. This paper
presents the fragility functions and their determination using incremental dynamic analysis implemented with the Zeus-NL
computer program.
Keywords: Fragility functions; unreinforced masonry; incremental dynamic analysis
1. Introduction
Trinidad and Tobago is a developing twin-island republic in the southern Caribbean. Preliminary seismic hazard analysis for the area indicates 0.2 second spectral acceleration values on the order of 0.5g to 1.1g for significant parts of Trinidad, and up to 1.4g for south-west Tobago. At least two-thirds of the existing building stock comprises of single-story unreinforced masonry (URM) residential structures where the type of URM is 100mm thick clay tile, a relatively light unit, and the roof load is 0.3 to 0.5 kN/m2. Therefore this situation inheres significant risk to the future development of Trinidad and Tobago. As a mitigation effort, a rehabilitation design for individual structures was developed based on the use of overlays. Recent technological developments, largely due to the performance-based design paradigm, enable probabilistic assessment of the structure before and after rehabilitation, or loss estimates of entire towns given certain scenarios, and hence can enhance the decision-making process of the various stakeholders in ways unavailable before.
Such seismic probabilistic assessment requires fragility functions of the structure. Studies have been conducted in the past for URM structures and included in fragility function libraries, such as for the ATC-58 loss estimation methodology (ATC, 2013). In this case, the fragility functions are incorporated into an overall loss estimation methodology conceptually given by Equation (1),
v(DV) =
∫∫∫ G <DV | DM> dG <DM | EDP> dG <EDP | IM> dλ (IM) [1]
This equation expresses the total probability theorem as conditional probabilities, each represented by an integral, which is a probability distribution function.
The DV, DM, EDP and IM refer to a decision variable, damage measure, engineering demand parameter, and intensity measure, respectively. The vulnerability, sometimes called the fragility as in this paper, is the integral with respect to the EDP|IM.
One of the more recent probabilistic and performance-based studies of URM buildings is by Wen et al (Wen et al, 2004). Prior to the current probabilistic and performance-based paradigm, deterministic methodologies for the seismic evaluation of existing URM structures were developed for the collapse and life safety limit states. Bruneau (Bruneau, 1993, 1994) presented a comprehensive review of these methodologies that are all substantially influenced by the ABK methodology (Kariotis, 1984), including the ASCE 31 (Hom, 2003), which is one of the most recent.
These probabilistic and deterministic methods are valuable, but the form of URM construction used in Trinidad and Tobago is quite different from other typical URM structures used worldwide. It is based on more slender and light load-bearing walls without stiffening in the out-of-plane direction by cross-walls because of inadequate wall-to-wall connections. The low weight of the walls and the low bearing stresses precludes the favorable rocking response. Therefore the walls' behavior is vastly dominated by in-plane sliding and out-of-plane deflection at the top herein referred to as tilting dynamic instability. These factors suggest that the structure may be more vulnerable than other more typical forms of URM construction used worldwide.
This paper presents the results of fragility analyses of the typical single-storey residential structure of Trinidad and Tobago and the resulting fragility functions. The fragility functions can then be used in probabilistic frameworks that are expected to be adopted for developing risk analysis tools for Caribbean
ISSN 0511-5728 The West Indian Journal of Engineering
Vol.39, No.2, January 2017, pp.40-45

R. P. Clarke: Seismic Fragility Functions for Light Unreinforced Masonry Single-Story Residential Structures in Trinidad and Tobago 41
application. The type of fragility analysis undertaken is the Incremental Dynamic Analysis (IDA) method (Vamvatsikos, 2002), also known as dynamic pushover analysis. 2. Seismic Fragility Analysis
In the context of earthquake structural engineering, fragility is the probability of exceeding a damage state as a function of an intensity measure (IM) of the ground shaking. This implies the need to obtain the statistics of the damage of the structure in recognition of the fact that no two earthquake ground motion records have the same effect on the structure even if the peak ground accelerations are the same. Moreover, no two structures have exactly the same material properties and this is due to differences in dimensions and manufacturing. The former is the record-to-record variation or aleatory uncertainty, and the latter is the epistemic uncertainty. In this study, only aleatory uncertainty was considered.
There are various methods for obtaining the damage statistics ranging from methods based on engineering judgment, to analytical methods. The most popular analytical methods of fragility analysis are IDA, the Latin Hypercube method, and the Response Surface method. In this study, the IDA method was used because it is well-supported by the building code developers of the U.S.A, which is the basis of modern Caribbean building codes; and because of the existence of software that readily facilitates IDA. The overall procedure for implementing IDA and the specific selections for this study are: 1. Select at least 7 accelerograms. Each accelerogram
must be independent of the earthquake’s M and R, and not have directionality effects. In this study ten ground motion far-field records from the PEER Strong Motion Database (PEER, 2009) were arbitrarily selected and their characteristics are shown in Table 1. Each of these was used to derive an artificial accelerogram that is compatible with the IBC 2009 design acceleration response spectrum for Site Class D, and using the Ss and S1 2%/50-year
maps of the Seismic Research Center of The University of the West Indies, for a site located in the capital city of Port-of-Spain. The artificial accelerograms were calculated using the Kumar algorithm and Spec3 software (Kumar, 2006).
2. Select an intensity measure (IM). The spectral acceleration for the first mode shape at 5% critical damping (i.e. Sa(T1,5%)), is commonly used and was used for this study as it is thought to require a minimum of ground motion records for the same confidence level (Shome, 1998).
3. Select a range of values for Sa to cover the range of damage under investigation. For this study, an eigenvalue analysis of the structure indicated a first mode period of 0.785 sec. From the design spectrum, this implies a Sa of 4.479 m/s2. Since the ground motion records are spectrum-compatible, this corresponds to a scale factor (SF) of unity. The accelerograms were then scaled from an SF of 0.3, to an SF of 7.2, in increments of 0.3. Therefore the Sa range from 0.138g to 3.287g and there are 24 points per pushover curve.
4. Select the damage states (DS) of interest and a corresponding engineering demand parameter (EDP). In this study, the DS are: slight damage (SD), moderate damage (MD), extensive damage (ED), and complete damage (CD), and tilting or out-of-plane dynamic instability (DI). The EDP used in this study is the drift of the structure and the values corresponding to the DS are 0.3%, 0.5%, 1.5%, and 3.5%, respectively. These values are those defined by HAZUS-MH MR4 (DHS, 2003) for the “low-code” case. The displacement capacity, xc, at the onset of DI was derived by Priestley (Priestley, 1985) using an energy approach,
xc = b(P + W)/ [ 2P + W] (2)
where b is the wall thickness, and P and W are the bearing load and self-weight on the wall element, respectively.
Table 1. Earthquakes for Ground Record
Earthquake File Event Name Magnitude PGA(g) Distance(km)
CPE147 Imperial Valley 79 6.9 0.169 26.5
CPE237 Imperial Valley 79 6.9 0.157 26.5
DSP000 Landers 92 4.4 0.171 23.2
DSP090 Landers 92 7.4 0.154 23.2
JOS000 Landers 92 7.4 0.274 11.6
JOS090 Landers 92 7.4 0.284 11.6
MV000 Landers 92 7.4 0.188 19.3
MV090 Landers 92 6.5 0.140 19.3
NPS000 Landers 92 7.3 0.136 24.2
PT315 Imperial Valley 79 7.4 0.204 14.2

R. P. Clarke: Seismic Fragility Functions for Light Unreinforced Masonry Single-Story Residential Structures in Trinidad and Tobago 42
1. Model the structure for nonlinear dynamic analysis and perform the analysis and note the peak drift from each analysis. This is done for each of the 10 accelerograms, for each value of Sa in the range from 0.138g to 3.287g, and in each principal direction of the structure. Hence in this study, there was a total of 480 analyses (i.e. 24 Sa points per pushover curve x 10 accelerograms x 2 directions). The structural model is presented in greater detail in the next section. For each run, a wall element was selected in each orthogonal direction to monitor the lateral displacement, hence this represents the structure’s in-plane performance. This was also done for the out-of-plane response. The lower of the two Sa values for each run is then used for each of the four lognormal functions of the four in-plane limit states, and likewise for the limit state of dynamic instability in the out-of-plane direction. This approach is deemed adequate as the intended application of the fragility functions is for regional loss estimation and not building-specific evaluation.
2. From the results, plot the pushover curves for each accelerogram. Hence there are a total of 20 curves in this case (i.e. 10 accelerograms x 2 directions).
3. Determine, by interpolation, the Sa value corresponding to the drift associated with each DS. Hence there are 20 data points per DS. These 20 data points per DS are the distribution of Sa values giving the same level of damage and being a distribution, the fragility can be determined.
4. For each DS, model the distribution as lognormal and calculate the parameters. The fragility function can be represented by the 2-parameter lognormal CDF, Φ (Cornell et al, 2002), where Φ is the usual cumulative distribution function of the standard normal distribution. Therefore, the 2 parameters are the mean of the ln (IM), λ, and the standard deviation, ξ, of the ln (IM). Hence, Fragility ≡ Probability of exceeding DS = P (≤ DS) = Φ [(ln (IM) – λ) / ξ]. To obtain the data points required for the statistical
analysis, the Z-Beer utility of Zeus-NL computer (Elnashi, 2009) was used.
3. Structural Model
The typical form of construction of the single-story residential structures is of walls comprised of clay tile masonry units for both the load-bearing and the internal partition walls. These units are manufactured in accordance with ASTM C34-10 (ASTM, 2010) and used with the cells in the horizontal orientation. The clay tile unit is 200 mm high by 300 mm long by 100 mm thick, with web and shell thicknesses of approximately 8 mm. The unit weighs 5.5 kg, and has a compressive strength (average of 5 units), of approximately 3.5 MPa.
Figure 1 shows the layout of the typical residential
structure. It has a rectangular plan, 9.0 m wide by 11.0 m long and the story height from ground level to the top of the walls is 2.4 m. The roof is gable shaped(though sometimes hipped) of slope 22 to 30 degrees from the horizontal. It is comprised of galvanized steel corrugated sheeting supported by 50 mm by 100 mm timber secondary beams, or 100 mm cold-steel Z-purlins. In either case the spacing of these beams is approximately 1.0 m.
Figure 1. Structure Layout
These secondary beams are supported by 150 mm
deep by 50 mm timber main beams (rafters) at a spacing of 0.6 m to 1.2 m, or rolled I-section structural beams of 100 mm or 150 mm depth at a spacing dependant on the beam used. The main beams are supported by the wall by directly bearing on it (i.e. hangers are not used). If the main beam is of timber, at the top of the wall is a 100 mm by 100 mm timber element to which the beam is attached via one of a number of methods including bent-over steel rebar, or hurricane straps. If the main beam is structural steel, various methods are used for connection to the wall including short steel columns. In the former case, the 100 mm by 100 mm timber element is bolted to a reinforced concrete (RC) beam that is cast over the masonry wall below. “Blocking” between the main beams, thus forming a continuous chord on the edge of the roof along the load-bearing walls, is not used.
In the case of the steel beam and short column, the latter is bolted to or anchored in the RC beam. The RC beam is 300 mm deep by 125 mm wide and contains 2 no. 12 mm mild steel rebar at top and bottom, and 6 mm mild steel 2-leg closed stirrups at 250 mm spacing. The RC beam is called a “ring beam” or a “belt beam” since it connects the perimeter walls. The perimeter walls in the long-direction are gravity load-bearing, but in the other direction above the ring beam the space is enclosed using the same clay tile masonry units, thus making a

R. P. Clarke: Seismic Fragility Functions for Light Unreinforced Masonry Single-Story Residential Structures in Trinidad and Tobago 43
triangular shape in the gable-end, without anchorage to the ring beam. The total roof weight is typically in the range 0.3 to 0.5 kN/m2 and the wall weighs approximately 3.9 kN/m.
In firm soils, the foundation for the perimeter walls consists of RC wall footings 0.6 m wide by 0.25 m deep with 150 mm thick reinforced masonry forming a short stem. In soft soils, 4.0 m long and 300 mm diameter bored RC piles are used at a 3.0 m spacing. The internal flooring is a RC slab-on-grade 100 mm thick and reinforced with fabric reinforcement, typically142 mm2/m. The slab areas below internal partition walls are often thickened. For all concrete work the concrete is typically of a 28-day compressive strength of 21 MPa. The internal partition walls are connected to the load-bearing external walls by the practice of “toothing” the former into the latter, and not by laying-up the walls simultaneously. At the corners of the perimeter walls, sometimes the walls are tied using 6 mm mild steel rods in the mortar joints, at various vertical spacings.
The lateral load resisting structural system of the structure as described above can therefore be classified as a box system of unreinforced masonry (URM) shear walls. URM shear wall structures are acknowledged to have four fundamental possible modes of response in the in-plane direction – flexural leading to toe compression failure, shear leading to diagonal tension failure, rocking, and sliding. The actual response is frequently a combination of these modes and the level of bearing stress on the wall is a very significant factor determining which mode will dominate the response. In the out-of-plane direction, after formation of a horizontal through-wall crack at the base, depending on the level of bearing stress, a stable rocking response is possible. However, there is a level of lateral displacement beyond which failure by dynamic instability will likely occur.
Given the description of the structure, and considering experimental observations of the in-plane response of a prototype of the wall (Clarke, 1998), the following presumptions regarding its behavior hence structural modeling is made: 1. Under significant lateral load the “toothed”
connection of the internal to external walls will cause a vertical line of weakness in the external walls and separate them into a set of vertical elements, from ground level to the top of the wall, interconnected at the top by the ring beam. Pier regions at the sides of openings in the walls are also modeled in this manner since it is typically the case that one vertical edge of a pier coincides with an internal partition.
2. The bearing stress on any wall element and its self-weight are sufficiently low that any element loaded in-plane will respond in the sliding mode only.
3. The in-plane load-displacement response is nonlinear and assumed to be of elastic-perfectly plastic form with sliding occurring after the elastic phase.
4. A wall element deforms linearly and elastically before and during sliding.
5. A wall element also displaces in the out-of-plane direction with the maximum displacement over the height occurring at the top of the element. For maximum efficiency using a 3-dimsional
analysis, a “fiber model” form of the finite element method (FEM) can be used for the structural modeling of the house for dynamic analysis. In such a model, specific element types are considered (e.g. beams, columns, etc), the constituents of a section of an element are defined, and the mechanical properties determined by integrating over the section. The Zeus-NL computer program for the inelastic dynamic analysis of structures by Elnashi et al of the Mid-America Earthquake Center (Elnashi, 2009), was used. In Zeus-NL, material nonlinearity is implemented by using the nonlinear stress-strain relations of possible constituents, and joint elements are available which further enable simulation of nonlinear behavior at interfaces.
Therefore, in this study, each wall element was modeled in Zeus-NL as an elastic column, and at each wall-to-support interface, a joint element was used to simulate the nonlinear sliding, given point 3 above. The clay unit wall modulus was taken as 3400 MPa based on the recommendations of ASCE 41-06 (ASCE, 2007). A solid wall section was assumed rather than determining an equivalent but smaller section to account for the voids. For the joint element, the stress to initiate sliding was taken as 0.13 MPa, with an initial stiffness of 10.7 kN/mm reducing to an arbitrarily small amount thereafter (Clarke, 1998). These values correspond to those for a 2.4 m long wall and are therefore conservatively used for all the walls, in any translational direction. With respect to rotational degrees of freedom at a joint element, these are given arbitrarily large stiffness values.
Although the roof is flexible, as its connection to a wall lacks a continuous chord to which the main beams are well anchored, it cannot act like a diaphragm. Its effect on the supporting wall is therefore merely to provide a bearing load without pushing under the earthquake load by flexural action in the out-of-plane direction. To account for the distribution of the inertial forces on the structure in the dynamic analysis under ground motion, a mass was lumped at the top of each element, coinciding with its top node, and of value determined by considering the tributary roof weight, the wall element’s weight, and the tributary lengths of the of RC ring beam at both sides of the element. Since a typical wall element is connected to a joint element, in turn connected to the support node, the latter is modeled as fixed with respect to translation and rotation about the 3 axes. Figure 2 shows the essential elements of the physical model of the structure.

R. P. Clarke: Seismic Fragility Functions for Light Unreinforced Masonry Single-Story Residential Structures in Trinidad and Tobago 44
Figure 2. Main Structural Elements
Note that the corner column in the porch area is
omitted as it is structurally insignificant under an earthquake. Figs. 3 and 4 are of the structural model in Zeus-NL, and the modeling of a typical wall element, respectively.
Figure 3. Zeus Model of Structure
Figure 4. Structural Model of Wall Element
4. Results and Discussion
Table 2 shows the parameter values of each fragility curve. Figure 5 shows the five fragility curves for the single-story URM structure. Though not presented in this paper, in general the shorter direction of the house is more susceptible to damage, which is typical. However, as is observed for a given Sa, the exceedence probability is higher for the DI limit state than for the ED and CD limit states indicating that the structure will likely collapse in this mode before the walls experience substantial damage in the in-plane direction. The physical reason for this occurrence is that as the walls that fail in the out-of-plane direction are very slender and flexible, and have no cross-walls to stiffen the response, they more easily reach the limit of dynamic stability before the in-plane walls, to which they transfer shear via the “ring beam”, can respond significantly.
Table 2. Parameters of Lognornal Fragility Curves
Limit State µ In Sa Σ In Sa
Minor Damage -2.14215 0.954529
Moderate Damage -1.56825 0.829976
Extensive Damage -0.11028 0.50836
Complete Damage 1.147436 0.303178
Dynamic Instability -1.34405 0.826642
Figure 5. Fragility Curves
When this occurs, it is likely that the wall elements in the out-of-plane direction will physically disengage from the structure and fall out. That is, on-going from near the middle of the long direction of the structure towards the ends of walls, the inner elements displace more and will fall out first. However, all the elements on those sides also support the roof and the “ring beam” so the roof, hence entire structure, will likely physically collapse subsequent to the progressive fallout of the out-of-plane walls due to dynamic instability.
This occurrence is unlikely for other more

R. P. Clarke: Seismic Fragility Functions for Light Unreinforced Masonry Single-Story Residential Structures in Trinidad and Tobago 45
commonplace forms of URM construction used outside of Trinidad and Tobago because, assuming sufficient cross-walls to limit the pushing of the flexible diaphragm, these cross-walls also remain sufficiently effective in stiffening the out-of-plane response, that significant damage to the structure, and risk of collapse, is more likely for the walls in the transverse direction of the structure. The out-of-plane response of the walls is then only susceptible to the lateral vibration of its distributed mass as a two-way spanning panel, depending on the edge conditions. This mode of response is simply not possible with the Trinidad and Tobago construction resulting in the fragility curves (see Figure 5).
The DI limit state dominates the fragility of the structure to such an extent, that the CD in-plane response limit state remains unlikely. Interestingly, the Sa values for the ED and CD limit states (if the DI limit could be prevented from occurring) are relatively high. This is due to the principal response mechanism of sliding for the in-plane walls, which is a form of base isolation.
The results indicate that this URM structural system is a special case particularly in need of rehabilitation. Given its prevalence in Trinidad and Tobago, this indicates a significant threat of large scale economic loss to a developing country which also plays a major role in the economics of the Caribbean as a whole. 6. Conclusions
From this study on the fragility of typical single-story URM residential structures in Trinidad and Tobago, the analytically derived lognormal fragility curves and their parameters are as presented in Figure 5 and Table 2, respectively. The curves indicate a particular susceptibility to failure by dynamic instability in the out-of-plane direction due to the high flexibility and slenderness of the walls, and the low bearing stress imparted by the roof structure and wall self-weight.
Given its prevalence in Trinidad and Tobago, this represents a significant threat of large scale economic loss to this developing country, with possible fall-out for the Caribbean as Trinidad and Tobago plays a major role in the economics of the Caribbean. Moreover, the fragility curves presented herein can be used as part of seismic risk assessment of the Caribbean to provide justification for rehabilitation proposals.
References:
ATC (2013), ATC-58 - Guidelines for Seismic Performance
Assessment of Buildings, Applied Technology Council, Redwood City, California.
ASCE (2007), ASCE 41-06 Seismic Rehabilitation of Existing
Buildings, American Society of Civil Engineers, Reston, Virginia.
ASTM (2010), C34-10 Standard Specification for Structural Clay
Load-Bearing Wall Tile, ASTM International, West Conshohocken, Pennsylvania.
Bruneau, M. (1994), "State-of-the-art report on seismic performance of unreinforced masonry buildings", Journal
Structural Engineering, Vol. 120, No. 1, pp. 230-251. Bruneau, M. (1993) "Seismic evaluation of unreinforced masonry
buildings: A state-of-the-art report", Canadian Journal of Civil
Engineering, Vol. 21, pp. 512-539. Clarke, R.P. (1998), The Hysteretic Behavior of Ferrocement-
Retrofitted Clay Block Masonry Walls Under In-Plane Reversed
Cyclic Lateral Loads: Experimental Investigations and
Graphical Computer Models, (Unpublished) Ph.D. Thesis, Department of Civil and Environmental Engineering, The University of the West Indies, St. Augustine Campus, Trinidad.
Cornell, A.C., Jalayer, F., Hamburger, R.O., and Foutch, D.A. (2002), "Probabilistic basis for 2000 SAC Federal Emergency Management Agency steel moment frame guidelines", Journal
Structural Engineering, Vol. 128, No. 4, pp. 526-533. DHS (2003), HAZUS MR4 Technical Manual: Multi-Hazard Loss
Estimation Methodology, Department of Homeland Security, Washington DC.
Elnashi, A.S., Papanikolaou, V.K., and Lee, D.H. (2009), Zeus-NL
- A System for Inelastic Analysis of Structures Version 1.8.7, Mid-America Earthquake Center, University of Illinois at Urbana-Champaign.
Hom, D.B, and Poland, C.D. (2003), ASCE 31-03 Seismic
Evaluation of Existing Buildings, American Society of Civil Engineers, Reston, Virginia.
Kariotis, J.C. (1984), "Survey of unreinforced masonry buildings", in: Reconnaissance Report of the Coalinga, California
Earthquake of May 2, 1983, Earthquake Engineering Research Institute, El Cerrito, California, pp.145-156.
Kumar, A. (2006), "Software for generation of spectrum compatible time history having same phase as of a given time history", Proceedings of the 8th U.S. National Conference on
Earthquake Engineering, San Francisco, California, April 18-22, Paper 172.
PEER (2015), PEER Strong Motion Database, Accessed 1 January 2015, from http://peer.berkeley.edu/smcat/.
Priestley, M.J.N. (1985), "Seismic behaviour of unreinforced masonry walls", Bulletin of New Zealand Society for Earthquake
Engineering, Vol. 18, No. 2, pp. 191-205. Shome, N., Cornell, A.C., Bazzurro, P., and Carballo, J.E. (1998),
"Earthquake, records, and nonlinear responses", Earthquake
Spectra, Vol. 14, No. 3, pp. 469-500. Vamvatsikos, D., and Cornell, A.C. (2002), "Incremental dynamic
analysis", Journal of Earthquake Engineering and Structural
Dynamics, Vol. 31, pp. 491-514. Wen, Y.K., Ellingwood, B.R., and Bracci, J. (2004), Vulnerability
Function Framework for Consequence-Based Engineering, MAE Center Project DS-4 Report, Mid-America Earthquake Center, University of Illinois at Urbana-Champaign.
Author’s Biographical Notes:
Richard P. Clarke is a Senior Lecturer at the Department of Civil
and Environmental Engineering of The University of the West
Indies and a professional structural engineer with extensive
industrial experience. He has authored 85 publications including
papers in leading international journals and symposia in the areas
of performance-based seismic evaluation and retrofitting,
structural dynamics, and cementitious composite materials. He
was the Chair of the joint Structures Codes Committee of the
Trinidad and Tobago Bureau of Standards, Board of Engineering,
and the Association of Professional Engineers and is currently the
chair of a number of masonry standards committees of the
Trinidad and Tobago Bureau of Standards.
■

S. Sahadeo et al.: Survey and Modeling of Protected Agriculture Environment Systems in Trinidad and Tobago
46
Survey and Modeling of Protected Agriculture Environment Systems in
Trinidad and Tobago
Shreedevi Sahadeoa, Edwin I. Ekwue,b,Ψ, and Robert A. Birchc
Department of Mechanical and Manufacturing Engineering, The University of the West Indies, St. Augustine, Trinidad and Tobago, West Indies;
aE-mail: [email protected] bE-mail: [email protected] cE-mail: [email protected]
Ψ Corresponding Author
(Received 03 August 2016; Revised 12 October 2016; Accepted 10 December 2016)
Abstract: In 2007, some Trinidad and Tobago (T&T) farmers were provided financial support to purchase some protected
environment agriculture structures (greenhouses) but some of them were later abandoned while some are still in operation. A
survey was conducted to investigate the problems faced by farmers who operated some of these greenhouses. The major problems
discovered from this survey were that temperatures were high and ventilation was poor, the overall design of the structures
was not suited to the local climate and the structures were costly. While pests and diseases were not found in all structures,
where existent, they led to other issues. Alterations to the existing typical greenhouse design in T&T in terms of changing the
structural design and materials were suggested based on the options available for improving greenhouse structures
described in previous studies. The typical greenhouse design as well as the suggested modifications were modeled and
evaluated. These designs were simulated using average climatic conditions. The elements of climatic conditions were
temperature, relative humidity and wind speed and flow trajectory. It was found that by changing both the materials used
and the structure and orientation of the typical greenhouse in T&T, all of the problems listed above, except cost, could be
minimised.
Keywords: Greenhouse, structure, survey, materials, Trinidad and Tobago
1. Introduction
Trinidad and Tobago’s food import bill is approximately US$ 0.6 billion per annum (Flemming et al., 2015).
There is an urgent need to find ways to improve local agricultural practices, to increase food production to reduce this expenditure. There is need to search for methods that not only include ways to improve crop yield and extend growing seasons, but also protect local agricultural practices from harsh weather conditions, pests and diseases. Protected agriculture environment systems will ensure food security, if it is implemented and followed through intelligently. Protected Agriculture (PA) is defined as “the modification of the natural environment to achieve optimum plant growth” (Jensen and Malter, 1995).
In general, greenhouses are environments which can be controlled to a much higher degree than outdoor fields. Temperature, light, air humidity, water supply and carbon dioxide in the air can be regulated by the grower. In some modern greenhouses, even the access of pests and pathogens can be restricted or prevented (EGTOP, 2013). Modifications, such as controlling light and temperature, can be done to the aerial environment; whereas, plant nutrition can be controlled by alteration to the root environment. Through the improvements to PA, it has become possible to produce food in more barren regions of the world and to yield crops when they
are not typically in their growing season (Jensen and Malter, 1995).
Moreover, PA improves the quality of plants and reduces the amount of chemicals needed (pesticides, insecticides) making them, overall, healthier. The system is a modern way of farming that is more likely to be attractive to young people and thus stimulate growth in the agricultural sector.
Protected agriculture environment systems have to be designed differently for dissimilar areas based on the climatic conditions or their locations (Pack and Mehta, 2012). This is to ensure that structures are fitted to their local environments. Changing the design of the structure, the materials used to build them, and even the practices used in them, can improve our current PA systems.
In 2007, a collaborative approach between National Agro-Chemicals Limited (NACL), the Agricultural Development Bank (ADB), National Agricultural Marketing and Development Company (NAMDEVCO) and the Business Development Corporation (BDC) produced a financial, marketing, and technical support package for Trinidad and Tobago nationals interested in greenhouse production (Martin et al., 2008). Many of these greenhouses failed and the reasons for this failure need to be investigated. Many of these failed structures
ISSN 0511-5728 The West Indian Journal of Engineering
Vol.39, No.2, January 2017, pp.46-57

S. Sahadeo et al.: Survey and Modeling of Protected Agriculture Environment Systems in Trinidad and Tobago
47
still stand but are not maintained. There is the need to examine the possibility of rejuvenating them.
This paper reports the survey of 24 of the existing
greenhouses in T&T aimed at finding the problems faced
by the farmers who operated these structures. A
literature review of innovative features and practices for
PA structures was undertaken and findings from this
review were utilised in suggesting changes to the
original design of the greenhouses. The original design
and the suggested changes were modelled and simulated
under climatic conditions specific to T&T to decide if
these designs are applicable locally in the hopes of
avoiding past mistakes and predicting the future use of
PA structures locally.
2. Major Structures of Greenhouses Worldwide
There are several major types of greenhouses used worldwide. These include the Quonset, Gothic arch, Tunnel shade houses and Gable roof. Table 1 shows that the greenhouses that are common in countries that make extensive use of greenhouses- Israel, Spain and Cuba. House and Lynch (2016) described the Quonset as dome-shaped (see Figure 1). The greenhouse provides optimal sun entrance especially on hillsides. It maximises heating from the sun and is cheaper to build than other types of greenhouses. Its covering, however, rips easily and needs to be replaced more often than most other structures. These greenhouses are similar to the tunnel houses (see Figure 2) when some of the walls are removed.
Table 1. Characteristics of some country's greenhouse design models
Characteristics Israel – Orgil Greenhouses (2016) Spain – Huete (2015) Cuba – GBM Inc. (2016)
Regulations followed Not specified. UNE-EN ISO 9001:2000 ISO 9001:2008
Types of greenhouses constructed
Shade houses, Tunnels, Quonsets. Gothic Arch, Tunnel, Shade houses, Glass houses.
Tunnel and Shade houses, Quonsets, Gable roof.
Dimensions of largest structures (m)
12 x 4 12.8 x 9.7 Not specified.
Cover Materials Shade nets, poly film, insect nets. Plastic film, semi rigid materials, Glass, Galvanized-Steel.
Polyethylene, anti-insect side walls.
Structural Materials Galvanized steel frames. Aluminium, Steel-Aluminium, Steel. Galvanized steel structures, Steel pipes and cables.
General Advantages Protection from insects, hail, excessive sun exposure, inexpensive.
Resistance to strong winds, easy installation.
Easy assembly, economical, protection from high amounts of solar radiation.
Roof design Split roof ventilation, Rack and Pinion openings.
Flat roofs, Mobile cover system, split roof (vents), butterfly vents.
Butterfly vents, Split roofs.
External entities Not specified. Polytechnic University of Cartagena, Technological Centre of the Metal.
Azrom Agricultural International.
Wind resistance capabilities (km/hr)
120-150 Not specified. 120-180
Figure 1. A Quonset Greenhouse (left: note side walls) Source: CFAHR (2011)
Figure 2. Tunnel house (right: note no side walls) Source: Gardener (2013)

S. Sahadeo et al.: Survey and Modeling of Protected Agriculture Environment Systems in Trinidad and Tobago
48
According to Clovis Lande Associates (1985), Gothic arch greenhouses have a cathedral arch-forward style that eliminates truss supports, requiring less material for construction (see Figure 3). These greenhouses have a peak or apex that taper down to curved walls, enabling condensation, runoff and heat conservation due to limited exposure to the sun. They are stronger than Quonset and tunnel houses, and have the ability to resist crosswinds by interrupting airflow over the structure and reducing uplift. This type of greenhouse is, however, more difficult to construct. Better Greenhouses (2016) described the gabled roof greenhouses or rigid frame greenhouses as having vertical walls on all four sides, together with a gabled roof (see Figure 4). This greenhouse design utilises glass or rigid plastic panels for the transparent material and is a more permanent structure, as it is generally built to last. It offers the most spacious volumes which is especially good for tall plants like sweet peppers and tomatoes. It is, however, very costly and very difficult to construct.
Figure 3. A Gothic Arch Greenhouse. Source: Sunshine (2013)
Figure 4. A Gable Roof Greenhouse Source: Better Greenhouses (2016)
A type of greenhouse which is commonly used locally is the Quonset one with split-roof (see Figure 5). This design was tested and recommended for local use by the Caribbean Agricultural Research and Development Institute, CARDI. de Gannes et al. (2014), working for CARDI, wrote a tropical greenhouse growers manual for the Caribbean. The manual describes the Split-gable and Split-arch designs, characterised by a vent on the top, emphasising that they are constructed in longer lengths. Split roof designs force a pressure differential in order to extract the hot air at the top of the structure. However, the angle of the ventilated roof design should be greater than 15° or the structure will have no advantage in creating the hot air extraction ventilation effect at the top of the roof (de Gannes et al., 2014).
Figure 5: A Split Roof Quonset Greenhouse Source: de Gannes et al. (2014)
3. Major Materials of Greenhouses Worldwide
There are two parts of a greenhouse: the framework and the glazing (plastic covering). Typically, the glazing covering the greenhouse is replaced many times before the framework fails due to corrosion and mechanical loading (Tzouramani et al., 1995).
The advantages and disadvantages of major materials utilised in building the frame of greenhouses are shown in Table 2. The materials include aluminium, plastics, wood, polyvinylchloride, and galvanized steel. Table 3 shows the advantages and disadvantages of materials utilised for glazing of the greenhouses. Apart from glass and fiberglass, other materials like polycarbonate and polyethylene are also utilised for glazing. Table 3 shows the advantages and disadvantages of different materials used for glazing greenhouses.

S. Sahadeo et al.: Survey and Modeling of Protected Agriculture Environment Systems in Trinidad and Tobago
49
Table 2. Advantages and disadvantages of using different materials for the frame of greenhouses
Material used for frame Advantages Disadvantages
Aluminium
• Light weight yet durable.
• Will not rust or erode.
• Resistant to excessive sun.
• Low maintenance.
• Easy to use.
• Inability to insulate.
• Does not maintain heat efficiently.
• Not resistant to harsh winds.
• Expensive option.
• Not very strong.
Plastic • Durable and strong.
• Very weather resistant.
• Good insulation.
• Inexpensive.
• Can warp over time.
• Brittle when exposed to hot and cold cycles.
Wood • Strong and durable.
• Average weather resistance.
• Good insulator.
• Easy to work with
• Requires regular maintenance.
• Can deteriorate easily.
• Subject to rotting, mold & mildew.
• Can warp over time.
• Treated wood can be toxic to plants.
Polyvinylchloride • Flexible so easy to work with.
• Usually a good insulator.
• Cheaper than other materials.
• Lightweight.
• Not very strong.
• Not weather resistant (affected by extended sun exposure).
• Not very rigid.
Galvanized steel • Durable and strong.
• Low cost.
• Prone to wear and rust.
• High maintenance and difficult to work with.
Solexx composite • Very strong yet flexible.
• Good insulators.
• Weather resistant.
• Impact and shatter resistant.
• Provides shading.
• Difficult to install and costly.
Table 3. Advantages and disadvantages of different materials used for glazing greenhouses
Materials used for glazing
Advantages Disadvantages
Glass • Long lasting.
• Transmits light well.
• Strong.
• Recyclable.
• Expensive.
• Does not diffuse light well (leads to shadowing or plant burn).
• Difficult to work with
Polycarbonate • Easy to use, flexible.
• High degree of light transmittance.
• Less expensive and long lasting.
• Strong and long lasting.
• Not east to work with.
• Condensation build ups (causes yellowing and algae)
Polyethylene • Inexpensive.
• Easy to work with.
• Light is transmitted and diffused well.
• Not long lasting.
Acrylic • Very strong.
• Easy to work with.
• Long lasting.
• Flammable.
• Expensive.
• Brittle.
Fiberglass • Easy to work with.
• Moderately expensive.
• Good lifespan, strong.
• Light diffused well.
• Rigid and durable.
• Very combustible.
• Irritable.
• Long term UV exposure can cause swelling and reduce light transmission
4. Experimental Investigation
Greenhouses in 24 locations: 23 in Trinidad and one in Tobago were surveyed (see Figure 6). These greenhouses were evenly distributed throughout the country and thus, it is expected that all possible problems were represented by the diversity in geography. A list of past registered greenhouse owners was collected from the T&T Tropical Greenhouse Operators Association. The approach to data acquisition
involved conducting telephone interviews with these 24 past or present greenhouse owners.
Personal interviews were conducted with three farmers who currently own and use a greenhouse, to discuss what needs they have or had. These latter interviews were carried out at the University of the West Indies Field Station Greenhouse (Kenia Campo - UWI) Mama’s Green Garden (Karim Baksh – Barackpore, Central Trinidad) and PCS Model Farm and Agricultural Resources (Karl Burgess - PCS Nitrogen Farm, Couva

S. Sahadeo et al.: Survey and Modeling of Protected Agriculture Environment Systems in Trinidad and Tobago
50
Figure 6. Locations of the surveyed greenhouses in T&T
Central Trinidad). Secondary data were collected from institutions, such as the Ministry of Agriculture and the T&T Meteorological Office, to support and add to the primary information collected, as well as to be used in the design part as boundary conditions.
The analytical approach used to model the design alternatives, included the modeling of four designs. The first was based on a popularly used greenhouse in Trinidad located at the University of West Indies, St. Augustine Field Station, which was utilised as a baseline (its materials and design). In the second model, the materials for the glazing and structure were changed from polyvinylchloride to aluminized polyester, galvanized steel to polypropylene respectively. The third design, involved a change to the structure itself (increased length and height, decreased width, changed orientation from East-West to North-South, and changed the vent structure from split-roof to butterfly vents). The final model combined the second and third models.
Numerical techniques have given researchers the ability to simulate transfer phenomena which occur in agricultural buildings, considering building structural details and its ambient environment (Abraheem, et al, 2001). Computational fluid dynamic (CFD) models have been used successfully in greenhouse ventilation studies (Bartzanas et al., 2004). The software program utilised to perform the virtual analysis was SolidWorks Flow Simulation, where the airflow through the structure was observed to determine if its improvements would prove useful in real environmental conditions. CFD permit ventilation development (through flow trajectories) in order to monitor air flow in the system. Contour graphs were also plotted to show the spread of temperature and relative humidity throughout the systems. The experimental set up used the Flow Simulation Add-in. The temperature was set to 300K, wind speed at 2.75 ms-1, and relative humidity to 80%, as per the averages received from the T&T Meteorological Office, Piarco
5. Results
5.1 Summary of Survey Findings
From a survey of 24 greenhouses by Sahadeo (2016), it was revealed that 16 of the 24 greenhouses were constructed within the last ten years and are still in use. The average lifespan of the greenhouses surveyed was found to be 6.67 years. Some of the houses had been abandoned or destroyed; the description of the type of greenhouse was solely based on the farmers’ memory and ability to depict it. Many of them did not know the correct names of the systems so categorising the greenhouses was based on their descriptions. The most common type of greenhouse was the split-roof Quonset (see Figure 5).
From the survey conducted, it was found that 58% of the farmers had never been trained or taught by any organisation, company or school, about protective agriculture systems. However, the remaining farmers had been to workshops or received advice from Caribbean Agricultural Research and Development Institute, CARDI; National Agricultural Marketing and Development Corporation, NAMDEVCO; The University of the West Indies, St. Augustine, UWI; Repsol; National Agro-Chemical Limited, NACL; Agricultural Development Bank, ADB; or their suppliers and contracted consultants. This was because these farmers were either a part of these organisations, or had signed contracts with them in order to construct the greenhouses.
Not all crops grown are suited for greenhouses. The most appropriate ones have been found to be sweet peppers and tomatoes. Some farmers (28%) sold these crops to either local farmers’ markets or (25%) directly to either family and friends, or the public. Others sold to grocery stores (16%), wholesalers (9%) and retailers (12%), while the rest sold to hotels and restaurants. UWI on the other hand, uses its produce for research purposes. 67% of the farmers stated that using the systems had improved the quality of their plants. This included the taste, shelf life and life expectancy of the plants.
Only 42% of the interviewees believe that the sale of their crops had repaid the cost of the greenhouse. This means that more than half of the farmers did not at least break even, and considered this project a loss. Many of them, however, insisted that this venture would have been profitable if the correct procedures were taken. Moreover, many of the greenhouse systems did not last long enough for the farmers to reap their benefits and for some, the cost of repairs and maintenance made the viability of their greenhouses even worse.
Most farmers (54%) questioned do not also do open air farming. Of those who do, they agreed that protected agriculture practices differ from those of open air farming. 42% chose to hire extra labour, many (38%) did not require more than their family members’ assistance. Each farmer stated that less than 5 persons

S. Sahadeo et al.: Survey and Modeling of Protected Agriculture Environment Systems in Trinidad and Tobago
51
were ever needed. This shows that less manpower was required as opposed to open air farming. On the other hand, 20% of the farmers hired persons who had had previous training in agriculture and these farms are amongst those which are still in use, linking labour to high profitability.
Figure 7 summarises the problems encountered by the farmers while using the greenhouses. For the purposes of this paper, the five (5) most recurring problems, namely pests and diseases, high temperatures, poor structural designs, poor ventilation and high costs, were examined.
Figure 7. Problems encountered by growers while using the greenhouse as discovered from the survey
Pest and diseases not only consume and contaminate the food, but few, like the white flies, laid eggs on the plastic sheeting and blocked ventilation. Thus, this issue is considered severe because it leads to further problems. Costs that may occur throughout the life of the greenhouse include the cost to replace the plastic (which is necessary approximately once every 4-6 years), and to clean it. These costs may be as high as US$2,400 to US$2,700 for a 930 m2 system. It was found that the costs were not proportional to the size of the greenhouses since the farmers may have received subsidies from the sponsoring agencies.
Approximately 63% of the farmers stated that some organisation had previously performed a study on their system. NACL, CARDI, UWI, the Ministry of Agriculture and private consultants have collected data from 15 farmers. Furthermore, of the 16 remaining greenhouses, 8 thought it feasible to perform a current study on their greenhouse. The others did not for reasons such as crops being planted at the time of the survey and the greenhouses being down for cleaning and maintenance.
5.2 Greenhouse Structural Design Models and the
Final Design
Some design models were considered in the investigation of the possible effects of the changes in the greenhouse structures on the internal environmental conditions. Table 4 shows a combination of the conditions required for optimum growth of tomatoes and sweet peppers, (internal conditions) as given by de Gannes et al. (2014), and the average external climatic conditions of T&T from the period of 1981 to 2010, collected from the Piarco Meteorological Station. This information was used as input variables when modeling and simulating.
Table 4. Internal and External Conditions Required for the Greenhouse
Weather parameters
Internal conditions
External conditions
Temperature (°C) 21- 26 26.6
Precipitation (mm) 1.5 x 10⁶ 1.5 x 10²
Sunshine hours (hrs) 8 7.3
Relative Humidity (%) 50-70 81.6
Wind speed (kts) 0.11-0.17 5.3
The base design was a typical local greenhouse which is split roof Quonset design (see Figure 8). Most greenhouses in Trinidad, adopt this split roof design to extract hot air, by creating a forced pressure. The dimensions and materials (see Table 5) used for the modeling were taken from the greenhouse at The University of the West Indies Field Station. It cost approximately US$27,635 to erect, not including automotive enhancements. It has only one opening. This opening is located at the Eastern end of the building. Since its orientation is east-west, air only enters through the front of the building (see Table 5).
Figure 8. The front view of the base design model of greenhouse
with original split-roof

S. Sahadeo et al.: Survey and Modeling of Protected Agriculture Environment Systems in Trinidad and Tobago
52
Table 5. Dimensions and properties of the four design models
The distribution of temperature and relative humidity in the building (see Figure 9), indicate that air enters through the windward side of the building and does not travel very far. Additionally, the air streams move upward, toward where the split vent was placed. From the red and yellow colours of the contour graph, it is evident that, at the entrance, there is a portion of air that is cooler, and from the blue colour (RH graph), less humid, but the rest of the greenhouse is constant or stagnant. There is not enough airflow. Figure 9(c) shows that the airflow in the system is not very diverse and so air was not distributed uniformly in the entire space. This would lead to hot air not being able to travel to the leeward end of the greenhouse, so the plants here would experience higher temperatures and would be more likely to wilt.
Figure 9. Distribution of (a) temperature of the air (b) relative humidity and (c) air trajectory for the base design model
Figure 10 depicts the second model which involved changing the materials for the greenhouse. In an effort to keep the greenhouse cool, the top of the greenhouse was covered with a meshed shading material (aluminized polyester) instead of polyvinylchloride sheets (see Table 5). This is expected to allow more airflow of hot air out the system, as well as reflect infrared rays that could cause additional heating (such as red, orange and yellow wavelengths). The aluminium mesh could withstand heavy rains and will not tear as easily, increasing the longevity of the structure.
Figure 10. The front view of the second design model of greenhouse (change of some materials of the base design)
Structural Parameter Base design model Second design Third design Final design
Length (m) 24 24 35 35
Width (m) 12 12 9 9
Height of sidewalls (m) 2.5 2.5 3 3
Apex (m) 4 4 7 7
Arch radius (m) 10 10 5 5
Arch angle (o) 15 15 - -
Pipe diameter (mm) 38 38 38 38
Orientation East-West East-West North-South North-South
Top cover Polyvinylchloride Aluminized Polyester Polyvinylchloride Aluminized polyester
Mesh material Polyethylene Polyethylene Polyethylene Polyethylene
Grade of mesh (mm) 1.0 0.8 1.0 0.8
Frame material Galvanized Steel Polypropylene Galvanized Steel Polypropylene
Vent type Single split roof Single split roof Butterfly vent Butterfly vent
Number of openings One One One - Air locked One - Air locked
Estimated cost of materials (US$) 27,635 25,725 43,630 38,530
(a)
(b)
(c)

S. Sahadeo et al.: Survey and Modeling of Protected Agriculture Environment Systems in Trinidad and Tobago
53
Although the use of polyethylene mesh coverings for the sidewalls was maintained, the grade of mesh was decreased to 0.8 mm to reduce the entrance of as many pests as possible. The frame material of the greenhouse was changed from galvanized steel pipes to polypropylene pipes (see Table 5). Polypropylene is a heat insulator and will not transfer as much heat into the system as steel (a heat conductor). It is also more affordable, lightweight, durable and recyclable. Having white pipes and painting the glazing materials white (whitewashing) will also reduce temperatures. These changes in the materials will also reduce the overall cost of the system (approximately US$25,725; see Table 5) and will increase its resistance to pests and diseases.
The simulation showed that the temperature dispersion of the air was generally the same as the base design, except that the airflow did not move upwards (see Figure 11). The temperature dispersion (see Figure 11(a)) effects and the relative humidity (see Figure 11(b)) travelled further into the greenhouse. This is advantageous, since this was the major problem with the base design. However, it still did not cover more than half of the greenhouse, meaning that changing the materials of the greenhouse alone will not significantly improve its ventilation satisfactorily. Also from the flow trajectory graph, (see Figure 11(c)), it could be spotted that the change of the roof glazing did allow more flow lines to pass through. More must still be done to improve the airflow through the structure.
(c)
Figure 11. Distribution of (a) temperature of the air (b) relative humidity and (c) air trajectory for the second design model
There was no change to the structure in the second
design. While it did change its materials, the third design model changed the structure. Figure 12 shows the third design which enabled a comparison of a butterfly vent to that of a split roof. Additionally, air lock doors were used at entrances to reduce the number of pests and diseases that can enter the greenhouse. The dimensions and direction of the greenhouse was varied in this design to encourage maximum efficiency.
Figure 13 shows the simulation results at the top of the greenhouse, near the vents, was the coolest area (yellow-green). However, inside the greenhouse, temperatures were steady. The humidity of the greenhouse was more evenly distributed than the base design, and was reduced in more than half of the system’s volume. This led to the increase in airflow; see Figure 13(c), where there are high flow trajectories around the system.
Figure 12. Front View of the third model (greenhouse with butterfly vent)
(a)
(b)

S. Sahadeo et al.: Survey and Modeling of Protected Agriculture Environment Systems in Trinidad and Tobago
54
Figure 13. Distribution of (a) temperature of the air (b) relative humidity and (c) air trajectory for the third design model
The final design combined changes in designs 2 and 3 (see Figure 14). Although both designs acting singly led to an increase in air flow (ventilation) and a decrease in temperature and relative humidity, each by itself was not enough to change the parameters of the system to those desired in the metrics. Figure 15(a) shows excellent diffusion of air temperature as both the butterfly vents and meshed aluminized polyester top glazing were used. This maximised the air current allowed to enter the system and the corresponding blue and yellow colors show that there will be a decrease in temperature through it. However, at the center of the system, the temperature remained high, so other methods must be looked into to mitigate this. The relative humidity of the structure also remained high (see Figure 15(b)) at some points in the system.
Figure 14. Front View of the final design model (combination of design models 1 and 2)
Figure 15. Distribution of (a) temperature of the air and (b) relative humidity for the final design model
However, it is seen to decrease generally throughout, in a much more evenly distributed manner than either designs 2 or 3. This can be explained by Figure 16 which shows the air circulation being more turbulent compared to all the other designs.
Figure 16. Distribution of air trajectory for the final design model
(a)
(b)
(c)
(a)
(b)

S. Sahadeo et al.: Survey and Modeling of Protected Agriculture Environment Systems in Trinidad and Tobago
55
6. Discussion
Data collected from greenhouse operators in T&T were presented. Advice from interviewees helped shape the greenhouse designs which were modelled. After creating the base design model and seeing the lack of circulation of air, the materials were adjusted for design 2 to make the greenhouse more aerated. However, there was no significant change to the airflow. For designs 1 and 2, the airflow remained mostly laminar. One reason the change in materials may not have been very effective is because this simulation did not measure the amount of heat reflected. As such, the difference made by using the aluminized polyester would be minimal. Furthermore, it was noted that the thermal conductivity of aluminium is higher than that of steel and as this would be coating the polyester, it is understood that the heat conducted by this material can increase temperatures.
Shading will aid greenhouse cooling since it restricts the amount of solar radiation and light intensity that reaches the plant, reducing the leaf surface temperature significantly. Besides changing the materials of the structure, the use of shade curtains could have aided in reducing the temperature. This would be helpful in decreasing sunlight penetration during the day but be variable enough to open or move at night to allow more air in. Another method that could reduce the intensity of the sun is to use chemical shade compounds such as “Kool Ray” or “Liquid Shade.” These are expensive though and could lead to complications during cleaning. The surrounding of the greenhouse is important as well. The greenhouse should not be blocked by high standing walls or trees. While these options offer shade which can cool the system, they will inescapably block out sunlight doing more harm than good. They can also encourage pests, bats and birds.
Design 2 was more affordable than the base model, costing less than US $26,000 using these new materials (see Table 5). While this is an advantage of the design, more should still be done to reduce this cost. Opting for more affordable materials can help restore abandoned greenhouses. Not only can the new affordable materials be easily implemented, they can be interchanged with other materials and tested incrementally to see if there is more room for improvement. For example, use of shade curtains and shade compounds might be viable options.
While the third design did realise lower relative humidity results, the temperature contour plot showed improvements only around the top glazing of the structure. This is most likely due to the change in orientation of the greenhouse from east-west to north-south (perpendicular to the wind direction), so the air flow was greater over the top of the system. The flow trajectory also showed more turbulent currents through the house, which could be attributed to the butterfly vents and increased the length of the system. Also the air was cooler at the air locked doors (polycarbonate) than as previously seen. While that method was used to
reduce the pests, the possibility of using the material could be explored in future studies.
Other improvements to structures include use of ridges, cooling towers, chimneys and wind catchers. While ridges are usually an improvement to building roofs, these and soffits usually go hand in hand. This would be a recommended alteration in a new design since for this there is a build-up of heat in the centre of the system. More attention should be placed on improving where the sidewalls meet the roof. Wind catchers, cooling towers chimneys are variations that could be made to the structural design of the building. These are usually used for closed systems though (glass, plastic, acrylic) and these variations will add to cost of construction. The precise design specifications and viability of these structures will also mean the hiring of special and skilled contractors. The placement and size of these features should also be varied to reduce hot spots. While we can see the hotspots theoretically from these models, the use of anemometers or white smoke/fog can show the wind patterns of already built systems to see where adjustments could be made.
The price of this system is estimated to be US$45,000.00 which is exorbitant for any structure. However, this system is around 1.5 times the size of base design model so the increase in price is expected. For those who cannot afford it, or do not have the space for a large system, they can use other passive ways of improving the ventilation of their greenhouses. These include using footbaths and light colours to reduce pests, or whitewashing/painting posts yellow with adhesives to attract insects there, and not using monocrop harvesting techniques to avoid the occurrence of diseases. While these methods do not target ventilation, they would help with other major problems. Unfortunately, for already poorly constructed houses, automation might be necessary to bring temperature down to the level needed for healthy plant growth. Other devices could be used to improve systems functions. For example, weather tracking devices are currently used by the PCS Model Farm.
The final design was a combination of the design models 2 and 3. This model showed improvements to an acceptable degree. Temperature was well distributed and the relative humidity was reduced significantly. This could be because the top glazing was now better ventilated, and the air could freely pass through and push out hot air that previously accumulated. Thus, there was more airflow in the middle of this design than in design 3, although they both had the same orientation characteristics. Another difference between this final design and design 3 is the cost. By changing the materials used alone, this greenhouse costs up to US$5,000.00 less to create (see Table 5). This money could then be invested into an automation system which could again, improve growing conditions in the system. Furthermore, it is expected that at some point, the system should break even and pay itself back. However,

S. Sahadeo et al.: Survey and Modeling of Protected Agriculture Environment Systems in Trinidad and Tobago
56
a feasibility study would have to be conducted to determine exactly when.
It is understandable that theoretical models can rarely mimic actual systems exactly. Thus, for more accurate results, one can create actual structures and monitor them, or make the changes to existing structures and evaluate them to see where there is room for improvement.
7. Conclusion
This research has successfully reviewed the existing greenhouses (locally, regionally and internationally), designed and optimised a new potential system for the local environment. This design was modelled and simulated, to validate its performance. Major problems encountered by local greenhouses are pests and diseases, high temperatures, poor designs and ventilation, and high costs. In order to minimise these problems, the materials used were changed as well as the structural shape, size and orientation. SolidWorks flow simulation indicated that the alterations to the structure and materials acting singly were not enough to improve ventilation in the greenhouse. However, when they were combined, the effects would be more effective. Additional recommendations were given to restrict the occurrence of pests and diseases.
While the change in material can potentially reduce the cost, the increase in size will raise it. The final design solved all problems except for cost, going over the original greenhouse design by more than US$10,000.00. This is a significant disadvantage as it shows that while all other problems are solved, many persons will still be unwilling to invest in protected agriculture because of the length of time to realise profit from the investment.
The next phase of research will be to investigate the use of comprehensive systems of controlled environment agriculture (CEA) in which case all aspects of the natural environment are modified for maximum plant growth and economic return. Control may be imposed on air, temperatures, light, water, humidity, carbon dioxide, plant nutrients alongside with complete climatic protection (Jenson and Malter, 1995). Active methods of ventilation in greenhouses in Trinidad using methods like evaporative coolers, fans, and fog misting systems will be investigated. This research will examine the feasibility of current controlled environment systems in T&T and in the Caribbean.
References:
Abraheem, A.l., Short, T. and Ling, P. (2001), “Validating the CFD model for air movements and heat transfer in ventilated greenhouses”, Proceedings of the ASAE Annual International
Meeting, Sacramento, California, USA July 29-August 1 (p.n. 01‐4056).
Bartzanas, T., Kittas, C. and Boulard, T. (2004), “Effect of vent arrangement on windward ventilation of a tunnel greenhouse”, Biosystems Engineering, Vol.88, No.4, pp.479–490.
Better Greenhouses (2016), Rose II Greenhouse Kit, Accessed July 13, 2016, from https://bettergreenhouses.com/product/rose-ii-greenhouse
CFAHR (2011), Center for Applied Horticultural Research, Accessed July 13, 2016, from http://www.cfahr.org/center/facilities.html
Clovis Lande Associates (1985), Protecting Your Environment, Accessed November 2015, from http://www.clovis.co.uk/horticultural/gothic_hoop_profile.htm
DeGannes, A., Heru, K.R., Mohammed, A., Paul, C., Rowe, J., Sealy, L. and Seepersad, G. (2014), Tropical Greenhouse
Growers Manual for the Caribbean, Trinidad, CARDI. EGTOP (2013), Final Report on Greenhouse Production
(Protected Cropping), Expert Group for Technical Advice on Organic Production, European Commission, Brussels
Flemming, K., Minott, A., Jack, H., Richards, K. and Opal Morris (2015), “Innovative community-based agriculture: A strategy for national food production and security”, The 2nd Biennial
Community Development Partnership Forum and Exhibition, Ministry of Community Development, Trinidad and Tobago, Port of Spain.
Gardener, Alia (2013), How to Make a Home Garden Greenhouse, Accessed July 13, 2016, from http://www.cheapvegetablegardener.com/how-to-make-a-home-garden-greenhouse/
GBM Inc. Cuba (2016), Greenhouses, Accessed July 14, 2016, from http://www.gbm-inc.com/Green-houses.html.
House, A. and Lynch, J. (2016), Greenhouse Project, Accessed July 13, 2016, from http://thehouseofgreen.weebly.com/
Huete, J. (2015), Greenhouse Construction, Accessed November 2015, from https://jhuete.com/english/greenhouse-construction.php?id=20
Jenson, M.H. and Malter, A.J. (1995), “Protected agriculture: A global review”, World Bank Technical Paper, No. 253, Washington D.C., USA.
Martin, C.C.G., Bedasie, S., Ganpat, W.G., Orrigio, S., Isaac, W.A.I., and Brathwaite, R.A.I. (2008), “Greenhouse technology is once again washing the Caribbean. Can we ride the wave this time around?” Proceedings of the International Congress on
Tropical Agriculture, Hyatt Regency Trinidad, Port of Spain. pp. 144-152.
Orgil Greenhouses (2016), Greenhouses, Accessed November 2015, from http://www.orgilgreenhouses.com/index.html
Pack, M. and Mehta, K. (2012), “Design of affordable greenhouses for East Africa”, Proceedings of the IEEE Global Humanitarian
Technology Conference, Seattle, Washington, 104-110, Accessed July 13, 2016 from http://ieeexplore.ieee.org/stamp/stamp.jsp?arnumber=6387030 Sahadeo, S. (2016), Survey, Design and Model Protective
Agriculture Environment Systems in Trinidad and Tobago, Unpublished B.Sc. Project, The University of the West Indies, St. Augustine, Trinidad.
Sunshine (2013), Gothic Arch East Greenhouses, Accessed July 14, 2016, from https://www.gothicarchgreenhouses.com/Gothic-Arch-EastPO-Greenhouse.htm
Tzouramani, I, Mattas, K., and Grafiadellis, M. (1995), “Economics of greenhouse construction decisions for cultivating tomatoes” Acta Horticulturae, Vol.412, pp.245-249
Authors’ Biographical Notes:
Shreedevi Sahadeo graduated with a BSc. in Mechanical
Engineering at The University of the West Indies in 2017. She is
interested in using her knowledge of engineering to sustainably
develop the environment in which she works and resides. She is the
recipient of a National Scholarship and has excelled at the Global
Engineering Debate mounted by the Institution of Mechanical
Engineers and the ‘Present Around the World Competition’ by the

S. Sahadeo et al.: Survey and Modeling of Protected Agriculture Environment Systems in Trinidad and Tobago
57
Institution of Engineering and Technology.
Edwin I. Ekwue is currently Professor and Coordinator of the
Bio-systems Engineering programme at The University of the West
Indies, St Augustine, Trinidad and Tobago. He is also Deputy
Dean, Research and Post Graduate Student Affairs in Faculty of
Engineering. He is the immediate past Head of the Department of
Mechanical and Manufacturing Engineering. He is a member of
the Editorial Board of the West Indian Journal of Engineering. His
specialty is in Water Resources, Hydrology, Soil and Water
Conservation and Irrigation. His subsidiary areas of
specialisation are Structures and Environment, Solid and Soil
Mechanics, where he has teaching capabilities. Professor Ekwue
has served as the Deputy Dean for Undergraduate Student Affairs
and Post-graduate Affairs and Outreach, the Chairman of
Continuing Education Committee, and the Manager of the
Engineering Institute in the Faculty of Engineering at The UWI.
Robert A. Birch is an Instructor in the Department of Mechanical
and Manufacturing Engineering at The University of the West
Indies, St Augustine, Trinidad and Tobago. He is a registered
Professional Engineer (R.Eng) and Project Management
Professional (PMP) with over twenty years of industrial and
teaching experience. He has a BSc. (Eng) and MPhil in
Agricultural Engineering from The University of the West Indies
and is pursuing a PhD in Mechanical Engineering. Mr. Birch is a
member of the Institution of Agricultural Engineers (UK). His
interests are in Fluid Power Technology, Bio-systems Engineering
with particular attention to machinery design, testing and
development for earth-working and agro-processing.
■

M.O.H. Amuda et al.: Wear Characteristics of Aluminide Blend for Thermal Barrier Coatings Bond Coat
58
Wear Characteristics of Aluminide Blend for Thermal Barrier Coatings Bond
Coat
Muhammed O.H. Amudaa Ψ, Modupe A. Onitiri b, and Victor M. Hopo c
a Materials Development and Processing Research Group (MADEPREG), Department of Metallurgical and Materials Engineering, University of Lagos, Lagos, 101017, Nigeria; E-mail: [email protected]
bDepartment of Mechanical Engineering, University of Lagos, Lagos, 101017, Nigeria; E-mail: [email protected]
c Materials Development and Processing Research Group (MADEPREG), Department of Metallurgical and Materials Engineering, University of Lagos, Lagos, 101017, Nigeria; E-mail: [email protected]
Ψ Corresponding Author
(Received 23 June 2016; Revised 18 November 2016; Accepted 01 December 2016)
Abstract: The structural properties of conventional bond coat were modified to improve adhesion for thermal barrier
coating. Silicon-carbide blended with aluminum, nickel and chromium powders in an aluminide bond coat was deposited on
various metallic substrates via oxyacetylene flame spray in a neutral flame. Wear investigation and microstructural analysis
conducted on the surface modified substrates revealed different levels of interfacial diffusion resulting in differential wear
co-efficient in the modified substrates. Among the substrates coated, mild steel exhibited the greatest resistance to wear
followed by compacted graphite iron (CGI) whilst cast iron provided the least resistance. This suggests that the generated
aluminide blend can be used to enhance the surface of mild steel preparatory to the application of thermal barrier coating.
Keywords: Aluminide blend coat, oxy-acetylene flame melting, metallic substrates, wear-coefficient
1. Introduction
Thermal barrier coatings (TBC) are widely used in turbines and automobile engines as protective shield against thermal cycling during propulsion and power generation (Ajdelsztajn et al., 2007). They comprise thermally insulating materials having sufficient thickness and durability that can withstand an appreciable temperature difference between the load bearing alloy and the coating surface (Goswani et al., 2004). Though, the primary function of TBCs is as a thermal barrier, the extreme thermomechanical conditions of the service environment impose some other requirements on them. These include excellent resistances to thermal expansion stresses associated with heating and cooling, large strain without failure and phase transformations on cycling between room temperature and high temperatures. Furthermore, they must be able to withstand repeated thermal cycling, resist erosion and withstand long exposure to oxidizing atmosphere particularly in air-breathing engines.
Yet, among the listed performance criteria, any potential TBC must possess suitable transport properties otherwise, that material is unusable. Thus, TBCs are typical examples of multifunctional materials (Clarke and Phillpot, 2005; Vaßen et al., 2010). Their major significance is that they assist in prolonging the life of load bearing alloy from environmental attack, creep rupture and fatigue by ensuring that the temperature of the metal substrate is maintained within a threshold (700-9000C for automobile engines; and 11000C for turbocharged engines) for enhanced performance and
greater delivery of engine power (Pathak et al., 2013; Domakonda et al., 2012; Wahlstrom and Lars, 2010; Cinivizi et al., 2008). Such elevated temperature environment and optimum energy matrix is not obtainable with non-TBC engines (Cinivizi et al, 2012). For instance, automobile engines coated with TBCs provides a greater balance of useful energy, lower exhaust and coolant energies compared with such engines that are not coated with TBC. Ceramic coated engines are credited with about 35% reduction in engine dimensions and 17% reduction in fuel consumption
(Cinivizi et al, 2012). A TBC generally consists of a top coat and a bond
coat layer. The top coat serves as the insulator and the bond coat facilitates contact between the top coat and metal substrate. There are several options that have been exploited as candidate for top coat material among which yittria stabilised zirconia (YSZ) is the preferred top coat material because it possesses features that are essential to coating survival during thermal cycling (Chen, 2006).
Despite the favourable features of YSZ top coat, the difference in thermo-mechanical properties between a YSZ top coat and a metal substrate does not permit direct deposition/cladding of the top coat to the metal substrate. Rather, an intermediate layer, the bond coat (containing NiCrAlY), is introduced to improve the adhesion between the top coat and the substrate (Lima and Guilemany, 2007). It also assists in grading the thermo-mechanical property gradient between the top coat and the substrate (Christensen et al., 2001). A third
ISSN 0511-5728 The West Indian Journal of Engineering
Vol.39, No.2, January 2017, pp.58-64

M.O.H. Amuda et al.: Wear Characteristics of Aluminide Blend for Thermal Barrier Coatings Bond Coat
59
layer present in a TBC system is the Thermally Grown Oxide (TGO) zone which is basically aluminum oxide (Al2O3). The TGO is consequent upon the oxidation of the aluminum in the bond coat either during thermal cycling or even before the prior deposition of the top coat (Christensen et al., 2001).
It is usually not desirable but always presents in the matrix of the TBC; and accelerates the failure of the thermal coating. The failure mechanisms in TBC systems are varied but some of the most prevalent are:
i) Delamination of the spinel due to brittleness. The spinel is formed either between the TGO and the bond coat or between the TGO and the TBC.
ii) Local compression of TBC due to particle impact and foreign object damage resulting in hot spots in the underlying bond coat, and
iii) Crack nucleation, propagation and coalescence in the TGO.
TGO is major problem in conventional bond coat containing aluminium, chromium and nickel resulting in poor adhesion of the bond coat to the substrate material (Lima and Guilemany, 2007). Addressing this challenge requires preventing or eliminating the tendency for aluminum to oxidise; and this may be accomplished by reducing the composition of aluminum in the formulation of the bond coat; and topping up the balance with a hard ceramic material that is difficult to oxidise such as silicon carbide (SiC). Literature is scarce on the formulation of such novel bond coat for addressing the problem of TGO.
Besides, the process of deposition of the bond coat is also significant. Most of the industrially deployed techniques such as electron beam assisted physical vapour deposition (Singh et al., 1999), laser melting techniques (Akdogan et al., 2013; Ouyang, 2011), high velocity oxy-fuel process (Lima and Guilemany, 2007) are capital intensive and require high technical expertise. They are not readily adapted to low technology based societies such as sub-Saharan African countries. Thus, there is imperative to develop appropriate technology for depositing TBC on substrate materials in these countries. Conventional oxy-acetylene flame torch system has process attributes similar to those of HVOF process; and can be explored for such deposition but this has not been reported.
Other than the process adopted for depositing the TBC, the characterization of the behaviour of the as-deposited coating under real time service condition is equally critical in optimising the TBC performance. This may be achieved by investigating the performance of the
coating under some specific service criteria. And in most engines for power or energy, the continuous operation of the engine often induces progressive loss of materials from the engine caused by contact and relative motion with a counter-body. This phenomenon known as wear apart from fatigue/thermal stresses represents critical performance criteria for engine. Thus, it provides a means for rapid characterization of the success of the deposition process by establishing the adherence of the deposit to the substrate.
Panturu et al. (2016) explored wear phenomenon in characterizing the breakdown mechanism in a plasma sprayed coating consisting of Ni20Al/ZrO2-8% Y2O3 on valve steel; and reported that the composite coating was compact and adherent resulting improved wear behaviour in the coated valve steel. Earlier related work by Baiamonte et al. (2014) had established the use of wear phenomenon to characterize the performance of thermal sprayed coatings produced on martensitic steel and nickel based alloy. These works demonstrated that wear characterization offers rapid means for determining the quality of coatings deposited on substrate. Therefore, in the present work, aluminide bond coat was blended with SiC and flame deposited on some metallic substrates using oxy-acetylene flame torch. This is a preliminary investigation to evaluate the adhesion of the newly developed bond coat on the substrate material. The work specifically sought to establish the possibility of forming defect free precursor for the deposition of TBC on substrate material using commonly available oxy-acetylene flame system. 2. Materials and Methods
2.1 Materials and Preliminary Treatment
Three substrate materials - mild steel, CGI and cast iron whose compositions are presented in Table 1 were considered for the deposition of the TBC. These substrates were sectioned into coupon sizes 75 mm x 25 mm x 10 mm and annealed to remove processing history. The coupons were subsequently grit blasted using silicon carbide emery paper grit size 400 to roughen the surface and ensure proper contact between the substrate and the bond coat. Pickling and de-scaling was conducted in an improvised agitated stainless steel cup in a vibrator. The bond coat was formulated by blending Al, Cr, Ni, and SiC powders in a mortar in the proportion indicated in Table 2. The morphology of the bond coat after blending in the mortar is shown in Figure 1.
Table 1. Chemical composition of the substrate materials
Material Elemental composition (at. wt. %)
C Si Mn P S Cr Ni Mo Fe Bal
Mild Steel 0.22 0.21 0.69 0.02 0.02 0.09 0.09 0.01 98.30 Trace
element Cast Iron 3.73 1.88 0.44 0.40 0.19 0.08 0.06 0.01 92.30
CGI 3.38 1.85 0.41 0.44 0.15 0.08 0.06 0.01 92.70

M.O.H. Amuda et al.: Wear Characteristics of Aluminide Blend for Thermal Barrier Coatings Bond Coat
60
Table 2. Blend composition of the aluminide bond coat
The bond coat was then preplaced on the substrates using a solution of polyvinyl alcohol. The preplaced powder and the substrates were then heated to 60oC for 24 hours in a furnace to dry off water.
Figure 1. Morphology of Al-Cr-Ni-SiC aluminide blend
2.2 Experimental Procedure
Oxyacetylene flame was applied directly to the preplaced bond coat. The acetylene/oxygen ratio was manipulated in different ratios to create reducing, oxidizing or neutral environment. Oxidising environment was created at oxygen: acetylene ratio of 2:1; reducing at 1:2 and neutral at 1:1. However, at oxidizing environment, the preplaced bond coat burnt off while at reducing environment, carbon soot was deposited on the substrate without any melting of the preplaced bond coat. But neutral flame condition was adequate for the flame heating of the samples. The flame melting at neutral oxy-acetylene ratio is shown in Figure 2. Neutral flame was subsequently used for other substrates.
Figure 2. Oxy-acetylene flame torch melting of preplaced TBC materials: (a) flame melting (b) just after flame melting and the
final appearance of the flame melted TBC
The flame melted substrates were sectioned transversely to the direction of flame torch for microstructural examination. Representative samples mounted in epoxy resin were subjected to standard metallographic procedures and etched in a solution of 98% ethanol and 3% nitric acid. Microstructural examination was conducted on CETI 0703552 inverted metallurgical microscope.
Wear test was conducted by abrasion on the surface modified and uncoated substrates using emery paper grade P36 with successive increase of loads on the wear rig for a 60 s interval per changing load. Five load levels of 5.95, 9.93, 11.91, 13.91, 15.89 N were considered for the abrasive load. The samples were held in a holder and brought in contact with the rotating emery paper mounted on the grinding/polishing machine at a fixed revolution of 125 rev/min for an abrasion time of 300 s. The differences in the rates of mass loss for all the samples were determined and combined with the density of the material to estimate the volumetric loss. This was inserted into the Achard’s relationship (Yang, 2003) presented in Eq. (1) to calculate the wear co-efficient for each conditions of the load
NS
VHK
3= (1)
where K is the wear co-efficient, V is the volumetric loss, H is the Brinell hardness value, N is the normal load and S is the sliding distance.
3. Results and Discussion
3.1 Microstructural Analysis of Substrate Materials
The microstructure of the three substrate materials before coating and flame spraying is shown in Figure 3 The microstructure of the mild steel (Figure 3a) shows bright network of pro-eutectoid ferrite interlocked by dark grey pearlitic phase. Though, the relative distribution of the phase was not determined, literature (Kumar and Jena, 2009) indicates that annealed low carbon steel contains about 75% ferrite and 25% pearlite. Mild steel with such phase distribution is not expected to experience significant microstructural modification in the bulk material after flame heating. Figure 3b is the microstructure of the CGI which shows bright patches of vermiculite quasi graphite flakes in a ferritic matrix. This microstructure is similar to that in Figure 3c for the cast iron. The only difference being that the bright quasi graphite flakes in Figure 3c are thicker and more than those in Figure 3b. Several authors (Calik, 2009; Krawczyk and Pacyna, 2009) have
Sample Top coat Bond coat (% mass)
Aluminium Chromium Nickel Silicon carbide
Mild Steel Magnesium oxide 40 10 10 40
CGI Magnesium oxide 40 10 10 40
Cast Iron Magnesium oxide 40 10 10 40
(a) (b)
Final appearance

M.O.H. Amuda et al.: Wear Characteristics of Aluminide Blend for Thermal Barrier Coatings Bond Coat
61
reported similar microstructures in these materials after annealing treatment. These microstructures are free from any defect such as porosity and micro cavities that could have affected the flame melting process.
Figure 3. Optical microstructure of substrate materials before flame melting: (a) mild steel, (b) CGI and (c) cast iron
The microstructures of the flame sprayed coated substrates taken within 1 mm position from the interface are shown in Figure 4. The figure revealed the absence of pores in all the three flame sprayed substrates. Hopo (2014) identified the white networks obtained in the flame melting of aluminide blend on mild steel and other substrates as AlSiNiCr intermetallics.
Figure 4. Optical microstructure of surface modified substrate after flame melting: (a) cast iron, (b) CGI and (c) mild steel
However, these intermetallics are not evenly dispersed. This suggests different levels of interfacial diffusion during flame melting in the substrates. For instance, Figure 4a shows the segregation of the intermetallics to the upper right of the cast iron substrate whilst in the CGI modified substrate (Figure 4b) the intermetallics appeared at greater depth and in the centre of the substrate suggesting greater interfacial diffusion. In the mild steel substrate, however, the networks of the intermetallics are even spread throughout the microstructure (Figure4c). The poor distribution of the intermetallics in Figure 4a may be indicative of inadequate adhesion between the aluminide bond coat and the cast iron substrate material.
3.1 Wear Characteristics of Surface Modified
Substrates
The wear characteristics of the surface modified substrates expressed in terms of wear co-efficient are shown in Figures 5-8 over the five loads conditions designated as Lo-L4. Figure 5 illustrates the trend in wear-coefficient in cast iron modified surface at the various load conditions and a test period of 300 s. The figure shows that the wear coefficient decreases with increase in abrasion load with increasing abrasion period; except however for the 9.93 N which exhibited a concave decrease rather than convex decrease exhibited by the other loading conditions. The wear coefficient is highest at about 2.2 under a loading condition of 5.9N and least at about 1.5 under a loading condition of 11.91N for the same abrasion period.
Figure 5. Wear co-efficient in surface modified cast iron substrate against abrasion time at different load conditions (L0:5.95N;
L1:9.93N; L2:11.91N; L3:13.91; L4:15.89N)
There is no specific relationship between wear co-
efficient in the substrate and the loading condition at the early stages (less than 100s) of abrasion. The distinct segments are apparent in the figure; and these are the first 120 s (50-120s), the next 120 s (120-240 s) and the last 60 s (240-300s). The first 120 s experienced very
(a) (b)
Thicker quasi vermiculite graphite flakes
50µm
50µm
(c)
(a) (b)
Even distribution of AlSiNiCr intermetallics
(c)
50µm
50µm 50µm
50µm
AlSiNiCr intermetallics

M.O.H. Amuda et al.: Wear Characteristics of Aluminide Blend for Thermal Barrier Coatings Bond Coat
62
sharp reduction in wear co-efficient; and this gradually steadies out in the next 120 s. At a given load, the second linear segment shows a relatively lower wear coefficient compared to the first linear segment. The decrease in wear co-efficient with increasing loading condition is insignificant in the last 60 s.
Figure 6 shows the wear co-efficient of surface modified CGI substrate. The trend is similar to the characteristics obtained with cast iron but at a lower threshold. The highest wear coefficient in CGI is 1.8 and the least is about 0.9 compared to 2.2 and 1.5, respectively in cast iron. This apparently suggests that surface modified CGI provided a better wear resistance than surface modified cast iron.
Figure 6. Wear co-efficient in surface modified CGI substrate against abrasion time at different load conditions
Figure 7 is the wear co-efficient of surface modified
mild steel at various load conditions. The figure indicates that the wear characteristics in the material exhibit the same trend as obtained in Figures 5 and 6. However, the highest co-efficient in Figure 7 is about 1 and the least is about 0.9. This relatively lower wear co-effieicnet value in Figure 7 is suggestive of possible adhesive characteristic relative to the other substrates.
In order to establish an explicit comparison among the three surface modified substrates, the wear co-efficient of the three materials at abrasion load of 5.93N (L0) is shown in Figure 8. The figure shows that cast iron has the highest wear coefficient at about 2.2 followed by CGI (1.5) and mild steel surface modified substrate has the least at about 1.0. The difference in wear co-efficient between cast iron and CGI is about 32% while that between cast iron and mild steel is about 50%. This suggests that the adhesion of the aluminide blend coat is greatest in mild steel, followed by CGI and least in cast iron. The wear behaviour of these surface modified substrates is better illustrated in terms of their microstructures shown in Figure 5. The even distribution of the AlSiNiCr intermetallics in the mild steel substrate is probably responsible for the very low wear coefficient which is indicative of the existence of good adhesion
between the blend coat and the substrate material. The adhesion is moderate in CGI while it is very poor in cast iron.
Figure 7. Wear co-efficient in surface modified mild steel substrate against abrasion time at different load conditions
Figure 8. Comparison of wear coefficient in CGI, cast iron and mild steel at abrasion load of 5.93N
4. Conclusion
The wear characteristics of the substrates of three materials modified by depositing aluminide bond coat via oxy-acetylene flame melting have been investigated. The following conclusions are drawn from the investigations: 1) Oxy-acetylene flame was successfully used to
deposit defect free aluminide blend coat on the substrate of cast iron, CGI and mild steel.
2) The wear characteristics in the substrates materials are influenced by the presence and distribution of AlSiNiCr intermetallics in the substrate modified surface.
3) Mild steel has the least wear co-efficient, followed by CGI while cast iron has the highest. This is indicative that mild steel modified substrate presented the greatest wear resistance.
4) The even distribution of the AlSiNiCr intermetallics in the mild steel substrate than in the

M.O.H. Amuda et al.: Wear Characteristics of Aluminide Blend for Thermal Barrier Coatings Bond Coat
63
other substrates is probably responsible for low value of wear coefficient obtained in the material.
5) The low value of wear coefficient in mild steel substrate suggests that there is good adhesion between the aluminide blend bond coat and the mild steel.
6) This suggests that the generated aluminide blend can be used to enhance the surface of mild steel preparatory to the application of thermal barrier coating.
References:
Ajdelsztajn, L., Hulbert, D., Mukherjee, A. and Schoenung, J.M. (2007), “Creep deformation mechanism of cryomilled NiCrAlY bond coat material”, Surface and Coatings Technology, Vol. 201, pp.9462-9467.
Akdogan, V. Dokur, M.M., Goller, G. and Keles, O. (2013), “Surface modification of thermal barrier coatings by single-shot defocused laser treatments”, Journal of Materials Engineering
and Performance, Vol. 22, No.9, pp.2501-2509. Baiamonte, L., Pulci, G., Hlede, E., Marra, F. and Bartuli, C.
(2014), “Thermal spray coatings for corrosion and wear protection of naval diesel engines components”, La Metallurgia
Italiana, Vol.6, pp.9-13. Çalik, A. (2009), “Effect of cooling rate on hardness and
microstructure of AISI 1020, AISI 1040 and AISI 1060 steels”, International Journal of Physical Sciences, Vol. 4, No.9, pp.514-518.
Chen, L.B. (2006), “Yttria-stabilised zirconia thermal barrier coatings: A review”, Surface Review and Letters, Vol.13, No.5, 535-544.
Christensen, A., Asche, E.A. and Carter, E.A. , A.A and Emily, A.C (2001), “Characterisation of metal-ceramic interfaces: Atomic-level properties of thermal barrier coatings”, In: Dressler, R.A. (Ed.), Chemical Dynamics in Extreme
Environments, World Scientific Publishing Co, NJ, pp. 490-546. Ciniviz, M., Hasimoglu, C., Ahin, F.S. and Salman, M.S. (2008),
“Impact of thermal barrier coating application on the performance and emissions of a turbocharged diesel engine”, Proceedings of the Institution of Mechanical Engineers, Part D:
Journal of Automobile Engineering, Vol. 222, No.12, pp.2247-2455.
Ciniviz, M., Mustafa, S., Eyub, C., Huseyin, K. and Ozgur, S. (2012), “Ceramic coatings applications and research for internal combustion engines”, Ceramic Coatings Applications in
Engineering, University Technical Education Faculty, Turkey, pp.196-202.
Clarke, D. R. and Phillpot, S. R. (2005), “Thermal barrier coating materials”, Materials Today, Vol. 8, No.6, pp.22-29.
Domakonda, V.K. and Puli, R.K. (2012), “Application of thermal barrier coatings in diesel engines: A review”, Energy and Power, Vol. 2, No.1, pp.9-17.
Goswani, B., Ray, A.K., and Sahay, S.K. (2004), “Thermal barrier coating system for gas turbine application: A review”, High
Temperature Materials and Processes, Vol. 23, No.2, pp.73-92. Hopo, V. M. (2013), Structural Modification of Aluminide Blend
for Thermal Barrier Coatings, Final Year Project Dissertation for B.Sc. Metallurgical and Materials Engineering, University of Lagos, Lagos, Nigeria, 47p.
Krawczyk, J. and Pacyna, J. (2009), “The influence of microstructure of mottled cast iron for mill rolls on its properties”, Metals, Vol. 19-21, No.5, pp.1-8.
Kumar, R. and Jena, D.P. (2009), “Phase determination in low carbon steel metallographic image using wavelet transform”, Asian Journal of Chemistry, Vol. 21, No.10, pp.125-129.
Lima, C.R.C. and Guilemany, J.M. (2007), “Adhesion improvements of thermal barrier coatings with HVOF thermally sprayed bond coats”, Surface Coatings and Technology, Vol. 201, pp.4694-4701
Ouyang, Z. (2011), Deposition of Yttria-stabilized Zirconia
Thermal Barrier Coatings by Laser-assisted Plasma Coating at
Atmospheric Pressure, Master Thesis in Nuclear, Plasma, and Radiological Engineering, University of Illinois at Urbana-Champaign, 1-91.
Panţuru, M., Chicet, D., Paulin, C., Alexandru, A. and Munteanu, C. (2016), “Wear aspects of internal combustion engine valves”, Materials Science and Engineering, Vol.147, No.1, pp.012036-012042 (IOP Conference Series)
Pathak, M. K., Mer, K. K. S., Pant, P.K., and Samant, S.S. (2013), “Applications of thermal barrier coatings on the performance parameters of diesel engines”, International Journal of Research
in Mechanical Engineering and Technology, Vol. 3, No.2, pp.68-72.
Singh, J., Quli, F., Wolfe, D.E., Schriempf, J.T. and Singh, J. (1999), An Overview: Electron Beam-physical Vapor Deposition
Technology: Present and Future Applications, Applied Research Laboratory, Pennsylvania State University, U.S.A.
Vaßen, R., Jarligo, M. O., Steinke, T., Mack, D. E. and Stöver, D. (2010), “Overview on advanced thermal barrier coatings”, Surface and Coatings Technology, Vol. 205, No.4, pp.938-942
Wahlstrom, J. and Eriksson, L. (2010), Modeling of a Diesel
Engine with Intake Throttle, VGT, and EGR: A Report on Vehicle
Systems, Department of Electrical Engineering, Linko¨pings Universite. Report: LiTH-ISY-R-2976.
Yang, L.J. (2003), “Wear coefficient equation for aluminium-based matrix composites against steel disc”, Wear, Vol.255, No.1-6, pp.579–592.
Acknowledgments:
The authors would like to acknowledge Dr. J.O. Agunsoye of the Department of Metallurgical and Materials Engineering, for providing the loading device, and the technical staff of the Oxy-Acetylene Flame Cutting Unit, Owode Metal Market, Kosofe, Lagos, Nigeria.
Authors’ Biographical Notes:
Muhammed Olawale Hakeem Amuda is Faculty member in the
Department of Metallurgical and Materials Engineering,
University of Lagos, Nigeria and the Team Lead, Materials
Development and Processing Research Group (MADEPREG). He
holds an honorary appointment as Senior Research Associate in
the Department of Mechanical Engineering Science, University of
Johannesburg, South Africa. His research interests span materials
development and processing for emerging technologies. Dr.
Amuda currently supervises 3 Ph.D. students. He has received two
research grants from the University of Lagos, and was co-
researcher in five International Islamic University Malaysia’s
funded research. Dr. Amuda has more than 66 publications in
journals, encyclopedia, book chapters, monographs, conference
proceedings and technical reports. He is a Reviewer to several
journals and a Review Editor with Elsevier's Reference Module in
Materials Science and Materials Engineering.
Modupe Ade Onitiri holds a Ph.D. in polymeric composite
materials from the University of Ilorin, Nigeria and teaches in the
Department of Mechanical Engineering, University of Lagos. He is
currently a postdoctoral fellow in the Department of Mechanical
Engineering Science, Faculty of Engineering and The Built
Environment, University of Johannesburg, South Africa. His
current research focus is on the characterization and
computational modelling of mechanical properties of polymeric

M.O.H. Amuda et al.: Wear Characteristics of Aluminide Blend for Thermal Barrier Coatings Bond Coat
64
composites and light weight materials. Dr. Onitiri has published in
some ISI and/or Scopus indexed journals; and participated at both
national and international conferences.
Victor M. Hopo holds a Bachelor of Science, Metallurgical and
Materials Engineering degree of the University of Lagos in the
Second Class Upper Division. His research interests include
materials for renewable energy and energy portfolio management.
He currently works in the private sector as a Field Officer.
■

O.I. Oluwole and KL Oluwaseun: Mechanical, Abrasion and Water Absorption Characteristics of Coconut Shell Ash and Charcoal Based Polyester
Composites 65
Mechanical, Abrasion and Water Absorption Characteristics of Coconut Shell
Ash and Charcoal Based Polyester Composites
Oladele I. Oluwole a,Ψ, and Kupolusi L. Oluwaseun b
Department of Metallurgical and Materials Engineering, Federal University of Technology, PMB, 704, Akure. Ondo State. Nigeria; aE-mail: [email protected]; [email protected]
bE-mail: [email protected]
Ψ Corresponding Author
(Received 24 August 2016; Revised 14 September 2016; Accepted 15 December 2016)
Abstract: This paper presents the findings of a research that investigates the mechanical, abrasion and water absorption
properties of composites made from coconut shell particulates and unsaturated polyester resin. Particulate coconut shell was
processed into ash and charcoal as potential reinforcement materials, respectively. The composites were fabricated by
adding coconut shell particulates in predetermined proportions to the polyester using open mould process. The cured
samples were tested to ascertain the response of the materials to the selected properties. Experimental results showed that
tensile and flexural properties of the composites increased as the coconut shell ash (CSA) particle content increases from 1-5
wt.% used while these mechanical properties decreases as the content of coconut shell charcoal (CSC) increases. The
abrasion resistance of the composites decreases as the reinforcement contents increase for both CSA and CSC composites.
However, CSA samples showed least resistance to abrasion compared to CSC while the control sample displayed the highest
wear rate. Similar trend was observed for water absorption response where initial sharp water uptake was followed by
gradual increase until saturation of water content was achieved. SEM and EDX revealed the dispersal of the particulates
within the matrix and elemental constituents of the fabricated composites, respectively.
Keywords: Coconut shell, particulate, reinforcement, ash, charcoal, polyester, composites
1. Introduction
The development in science and technology required a variety of polymer with good properties and low cost. Therefore, polymer composites are considered to be among the more promising approaches to yield new materials and have been investigated extensively. In recent years, many studies have been dedicated to utilize lignocellulosic fillers such as coconut shell, wood, pineapple leaf, palm kernel shell and many more as fillers in order to replace synthetic fillers through exploitation of natural fillers as reinforcement in thermoplastic and thermosetting polymer composites. This is usually carried out in an attempt to minimize cost, increase productivity and improve mechanical properties of products (Salmah et al., 2013).
Today, the growing environmental awareness throughout the world has triggered a paradigm shift from synthetic fibers and their composites to-wards composites made from natural reinforcing constituents which are more environmentally friendly. In the light of this, researchers have focused their attention on composites composed of natural or synthetic resins, reinforced with mineral particulate fillers or natural fibers in manufacturing of high-performance engineering materials from these renewable resources (Njoku et al., 2011). Many of the plant fibres find application as a resource for industrial materials (Oladele et al., 2013). Madakson et al. (2012) concluded in their study, that coconut shell ash can withstand a temperature of up to
1,500 ˚C with a density of 2.5 g/cm³. The presence of SiO2, Al2O3, MgO and Fe2O3 as major constituents (Ankesh et al., 2016; Madakson et al., 2012; Prakash and Ajit, 2014) encourage the use of coconut shell ash as a reinforcing material in both metal and polymer matrix composites.
Polyester resins are group of general purpose thermoset having average mechanical properties, low resistance to temperature, higher co-efficient of expansion and low cost. Nowadays, the cost is one of the most important factors. The overall cost can be reduced by blending the polymer with low cost filler materials like coconut shell powder (Nidhi et al, 2013).
Coconut shell (CS) is one of the most significant lignocellulosic materials which grow in tropical countries such as Malaysia, Sri Lanka, Thailand, Indonesia and Nigeria. In an attempt to reduce the abundance of these agricultural by-products, new applications are urgently needed for CS to be more useful. Therefore, the use of CS as lignocellulosic fillers in polymer composites becomes more pleasing due to their high strength and modulus properties (Salmah et
al., 2013). Coconut shells are cheap and readily available in
high quantity in Nigeria. It contains about 65-75% volatile matter and moisture which are removed largely during the carbonization process. The carbonization process involves converting the coconut shells to char. The charring process is known as the Pyrolysis, which is
ISSN 0511-5728 The West Indian Journal of Engineering
Vol.39, No.2, January 2017, pp. 65-71

S. Sahadeo et al.: Survey and Modeling of Protected Agriculture Environment Systems in Trinidad and Tobago
66
chemical decomposition of the shell by heating in the absence of oxygen. During the carbonization of coconut shells, volatiles amounting to 70 % of the mass of coconut shells on dry weight basis are released to the atmosphere, yielding 30 % of coconut shell mass of charcoal. The volatile released during the carbonization process is Methane, CO2 and wide range of organic vapors. The carbonization temperature range is usually within 400 - 850 ºC, sometimes reaches 1000 ºC (Rahul, 2012). The product of carbonization is usually referred to as the ash. Research by Imoisili et al., (2012) revealed that coconut shell ash (CSA) is a potential candidate for the development of new composites because of their high strength and modulus properties. Composites made from CSA can be used for a broad range of applications such as furniture, house hold appliances and building constructions.
Many researchers have made efforts to produce carbon black from agricultural by-products such as coconut shell, apricot stones, sugarcane bagasse, nutshells, forest residues and tobacco stems. Coconut shell is suitable for preparing carbon black due to its excellent natural structure and low ash content. Conversion of coconut shells into activated carbons which can be used as adsorbents in water purification or of industrial and municipal effluents would add value to these agricultural commodities, help reduce the cost of waste disposal, and provide a potentially cheap alternative to existing commercial carbons (Rahul, 2012).
In this paper, carbonized coconut shell was referred to as coconut shell ash (CSA) while the non-carbonized was referred to as coconut shell charcoal (CSC). The CSA and CSC particulates selected for this research were chosen so as to investigate their influence on polyester matrix, which is the most widely used among the thermoset plastics. The work was to examine the influence of charcoal and ash of CS since many researchers have established the use of CS particulate in an untreated and ash forms. In this research, the possibility of using CSC as reinforcement in polyester matrix composites fabrication in order to expand the scope of the areas of applications for the material that was the main focus. 2. Materials and Methods
2.1 Materials
The materials utilized for this work includes: Coconut shell, unsaturated polyester resin, Methyl ethyl ketone peroxide (catalyst), Cobalt 2% in solution (accelerator), Ethanol and polyvinyl acetate (mould releasing agent). Table 1 shows the XRF analysis of coconut shell ash.
Table 1. XRF Analysis for the Composition of Coconut Shell Ash
Element SiO MgO Al2O3 Fe2O3 MnO ZnO Na2O K2O
Amount (%) 46 18 16 14 0.5 0.6 0.9 1.2
Source: Ankesh et al.( 2016)
2.2 Methods
2.2.1 Procurement and preparation of coconut shell
particulate
Coconut shells were procured from a coconut chips producer in Ado Ekiti in Ekiti State, South-West, Nigeria. The coconut shell was dried in open air and burnt into charcoal in an enclosure. The charcoal was divided into two and one part was kept as charcoal while the other part was subjected to carbonization at 650 0C in a muffle furnace for 3 hours and furnace cooled. The collected char and the charcoal were grinded into powders with the aid of laboratory ball mill followed by sieving with sieve shaker to obtain 150 µm particle sizes. The production process products are as shown in Figure 1. Carbonization is the production of charred carbon from a source material. The process is generally accomplished by heating the source material usually in the absence or limited amount of air to a temperature sufficiently high to dry and volatilize the substance. Therefore, CSC was produced by burning the coconut shell in the presence of air while CSA was produced by burning the coconut shell in the absence of air.
Coconut shell Coconut shell charcoal Coconut shell particulate
Figure 1. Production process products: coconut shell – coconut shell particulate
2.2.2 Fabrication of composites
The composites were developed using open mould technique after mixing the materials in the proportions presented in Table 2. The coconut shell particulate was varied within 1-5 wt.% because previous work has shown that the properties of the developed composites tend to decrease as the reinforcement fraction increase from 5-25 % (Agunsoye et al., 2012). Unsaturated polyester, accelerator and coconut shell particulate were first blended together before the catalyst is added in order to initiate the polymerization reaction. The mixture was stirred thoroughly until homogeneous mix was achieved through visual observation and was poured into the mould. The average time of mixing was about 10 minutes.
Table 2. Formulations for the polyester/CS composites
Materials Composition of developed samples
Polyester (php) 100 Coconut shell particulate (php) 1, 2, 3, 4, 5. Cobalt 2% solution (g) 4 MEKP (g) 6
php - parts per hundreds of total polymer

S. Sahadeo et al.: Survey and Modeling of Protected Agriculture Environment Systems in Trinidad and Tobago
67
2.3 Property Test
2.3.1 Measurement of Tensile Properties
Tensile test was carried out in accordance with American Standard Testing and Measurement Method D412 (ASTM D412 1983) on Instron Universal testing machine. Composite samples with 3 mm thick and of gauge length 150 mm were used. Three identical samples were tested for each weight fraction from where the average values were used as the representative values. 2.3.2 Measurement of Flexural Properties
Three point bend tests were performed in accordance with ASTM D 790 M to measure flexural properties using Instron Universal testing machine. The samples were of 150 x 50 x 3 mm. Three samples were tested for each weight fraction used and the average values were taken to represent the actual values. 2.3.3 Measurement of Abrasion Property
This involves mounting the specimen to a turntable platform that rotates at a fixed speed. The samples were measured using an analytical weighing balance to take the initial weight of the samples. The weighed samples was mounted on turntable platform and rotated at 1000 r.p.m. for 20 minutes each. Thereafter, the weight was measured as the final value and the difference between the initial and the final value was noted and recorded against each samples. The average values were used like that of the mechanical properties.
2.3.4 Swelling Behavior (Water Absorptivity Test)
The composite samples were dried at room temperature for six weeks and immersed in distilled water at room temperature. The water absorption was determined by weighing the samples at regular intervals. The specimens were daily taken out of the water, wiped with tissue paper to remove surface water and weighed. The percentage of water content (Wt) was determined using equation 1:
(1)
Where Wt is the weight of sample at time t and Wo is the initial weight of the sample.
3. Results and Discussion
Figure 2 shows the stress-strain curve for the response of the materials to tensile behaviour, while Figure 3 depicts the ultimate tensile strength (UTS) of the materials. The UTS represents the maximum load or stress the materials can withstands before fracture and this was seen in Figure 1 as the points where there is drop in the curves for each sample. The materials exhibit brittle failure mode being a thermosetting based, and the reason for the observed sudden drop in tensile strength at the peak value.
Figure 2. Stress-Strain Curve for Coconut Shell Ash and Charcoal as well as the Control Samples
From Figure 3, the UTS of the developed
composites were enhanced by the addition of the CS particulates. The selected particulates were noticed to influence the matrix in an inverse trend which was one of the reasons for this investigation. The UTS was observed to increase as CSA increases while it decreases as CSC increases. The increase obtained in CSA composites was as a result of strong particles–matrix interaction which increases the ability of the particles to restrain gross deformation of the matrix. Conversely, the decrease in ultimate tensile strength observed in CSC composites may be due to increase in discontinuity between the particles surface and the matrix as the reinforcement content increases.
Figure 3. Variation of Ultimate Tensile Strength with the Composites and Control
However, the best ultimate tensile strength potential
was achieved with the addition of 1 wt% CSC which has a value of 21.12 MPa compared to other samples. Virtually all the reinforced samples had higher ultimate tensile strength compared to the control sample that has a value of 7.89 MPa. This implies that, the UTS can be enhanced with about 167 % with the use of CSC. The observed trend of results can be due to the influence of the elemental contents on the weight fractions as well as the interfacial bonding strength. The increase in tensile strength of the composites was due to the ability of the

S. Sahadeo et al.: Survey and Modeling of Protected Agriculture Environment Systems in Trinidad and Tobago
68
particulates of the reinforcement contents used to support stress transfer from the polyester matrix.
As shown in Figure 4, there was almost gradual increase in the tensile strain at maximum load as the ash content increases up to 4 wt% followed by a decrease at 5 wt% for CSA samples while a slight decrease was followed by an increase as the charcoal content increases for the CSC samples. Both composites show increasing strain (ductility) as reinforcement content increases. From the results, CSA sample possesses better tensile strain property than CSC and the control for all the reinforcement content except at 5 wt%. Increase in reinforcement content of CSA above 4 wt % reduces the elasticity of the matrix. This enhances rigidity and causes a decrease in tensile strength and ductility as a result of restriction in the polymer matrix movement. The ductility at break decreased upon filler addition for composites regardless the nature of the filler. At higher filler content, the domination of filler-matrix interaction can be expectable to subside and be substituted by filler-filler interaction (Salmah et al., 2013).
Figure 4. Variation of Tensile strain at maximum load with the Composites and Control
The best performance was obtained at 4 wt% with a
value of 0.024 mm/mm compared to the control with a value of about 0.014 mm/mm which culminated to about 71 % enhancement. This result was in agreement with the UTS results in Figure 3 where 1-4 wt% addition of CSC was seen to possess better strength than the control. The results confirmed the capability of the samples with CSC to withstand higher strain than others within 1-4 wt%.
Figure 5 shows the response of the materials to tensile modulus. Similar trend to UTS in Figure 3 was obtained, though; slight changes in trends were noticed for both CSA and CSC between 2-3 wt% reinforcement. The moduli for both samples at those weight fractions were almost the same. From the results, it was seen that 1 wt% of CSC addition gave the best tensile modulus result with a value of 985.39 MPa. The moduli of the developed composites were higher than the control
sample which has a value of 552.74 MPa. The enhancement in percentage when compared with the developed composites that has the best result being 78 %. Figure 5. Variation of Modulus of elasticity with the Composites
and the Control
The result was in agreement with previous research
findings in which it was stated that the addition of particles from lignocellulosic source increases the tensile modulus of the polymer composites. The incorporation of hard phase in particulate form tends to restrain the motion of the matrix phase in the proximity of each particle which consequently contributes to the enhancement in moduli and stiffness of the composites. The presence of the volatile materials as well as moisture which differentiate the CSC from the CSA may be responsible for the enhanced tensile properties obtained with the use of CSC when compared with the use of CSA and the control samples.
Figure 6 shows the behavior of the materials with respect to bending strength at peak. All the composites with the exception of the sample with 4 wt% CSA have less bending strength at peak value than the control. This observed situation only suggests that there is optimum value of CSA addition that will give better enhancement of the bending strength at peak for the matrix. Though, the responses revealed an irregular trends but it was observed that, the addition of CSA tends to enhance the bending strength at peak as the weight content increases up to 4 wt% followed by a decrease while the addition of CSC tends to reduce the bending strength at peak as the weight content increases. However, it was seen that both reinforcements gave enhancement within the intervals of even numbers while the odd numbers gave reduction. This encourages the use of even numbers at higher weight fraction in the fabrication of composites for bending strength at peak application using CSA. The highest bending strength at peak was achieved at 4% ash particulate with a value of 119.91 MPa compared to the control with a value of 101.30 MPa.
The response of the materials to bending modulus was shown in Figure 7. All the CSA samples with the

S. Sahadeo et al.: Survey and Modeling of Protected Agriculture Environment Systems in Trinidad and Tobago
69
exception of 1 wt% reinforcement gave better bending moduli compared to the control which has a value of 11,517 MPa, while none of the CSC developed composites gave enhancement. Coconut shell ash with the best enhancement was 4 wt% with a value of 17,742 MPa which correlates to about 54 % enhancement.
Figure 6. Variation of Bending Strength at peak with the Composites and Control
Figure 7. Variation of Bending Modulus with the Composites and
the Control
The flexural properties of composites depend
critically on the microstructure of the composite and the interfacial bonding between the reinforcement and the matrix. In Figures 6 and 7, both flexural strength at peak and modulus of the CSA composites were better enhanced at 4 wt %. This was due to the strong interfacial adhesion/bonding between the particles and the matrix which enhances load transfer.
It was observed in all the mechanical properties examined that similar trends were seen for the responses of CSA and CSC reinforced polyester composites. The properties tend to increases as the reinforcement content increases for CSA composites while it tends to decrease as the reinforcement content increases for CSC composites. Since the responses show a consistency in the tendencies of the behavior of the composites, it therefore implies that, both elemental constituents and weight fraction of these particles have influence on the
mechanical properties of the developed polyester based composites.
Previous work by Oladele et al, (2013) confirmed the possibilities of using agro waste as reinforcement in polyester material. The work revealed that different agro waste particles can be used to enhance different mechanical properties for unsaturated polyester.
The variation of the samples with abrasion was shown in Figure 8. From the Figure, similar trends were seen for the two sets of reinforcement used where, it was observed that the wear resistance reduces as the reinforcement content increases. The wear resistances of the developed composites were higher than the control sample for all the composites. However, it was seen that, the wear resistance of the charcoal was higher than that of the ash. This may likely due to the presence volatile materials that aid good interfacial bonding strength. The control sample showed the highest wear rate with a value of 0.0434 g while the sample with the best wear resistance was 1 wt% CSC with a value of 0.0162 g.
Figure 8. Variation of Abrasion property with the Composites and the Control
The relationship between water absorption and
reinforcement content for Polyester/CS composites at different content of CS was shown in Figure 9. The Figure displayed the rate of water absorption on daily basis for 7 days from where it was seen that 2 wt% CSA reinforced sample demonstrated the best water resistance potential. All the composites show a similar pattern of water absorption where initial rapid water uptake was followed by gradual increase until equilibrium water content is achieved. Though the water absorption potentials seem alike for the control as well as the developed composites, however, it was observed that most of the composites absorbed less water than the control. Though CS is from agro-fibers which are strongly hydrophilic with many hydroxyl groups (–OH) in their structures and, this is usually responsible for moisture absorption, the treatment have eliminated this groups and therefore, exhibiting hydrophobicity.

S. Sahadeo et al.: Survey and Modeling of Protected Agriculture Environment Systems in Trinidad and Tobago
70
Figure 9. Variation of % water absorption property with the Composites and Control
Figures 10 and 11 displayed the SEM and EDX of
the fractured surfaces of CSA and CSC reinforced composites from secondary electrons images at 15.0 kv, respectively. The SEM revealed that the CS particles were well dispersed within the polyester matrix and this support the reasons why the composites possess better properties compared to the control samples. The elemental compositions shown by the EDX from the two processed CS particles revealed that the pyrolysis actually removed some elements like Sodium, Phosphorus and Sulphur which were present in the CS charcoal while the ash particles were noticed to contain Molybdenum which was not present in the charcoal. The elements that were present in the two particles were observed to either increase or decrease after the treatment.
Figure 10. SEM and EDX of CSA reinforced composite
Figure 11. SEM and EDX of CSC reinforced composite
While Carbon, Oxygen and Chlorine were reduced
after the treatment, Aluminium, Silicon, Potassium and Calcium increase. Therefore, the presence of these increased elements CSA may be responsible for the enhancement obtained in flexural and water absorption properties of the developed CSA composites compared to others. 4. Conclusion
It was discovered from the results that reinforced polyester composites exhibited better properties than the unreinforced polyester material that serves as the matrix. There were consistent trends on the influence of the CS particles on the composites of mechanical, abrasion and water absorption properties which confirmed that the effect of these particles on these composites properties was real.
The addition of 1 wt% CSC particulate to the polyester matrix composites gave the best results in terms of tensile and abrasion properties while the addition of 4 wt% CSA gave the best results in terms of flexural and water absorption properties. This implies that, reinforcement content with the optimum perform for CSC composites was 1 wt% while 4 wt% gave the optimum performance in CSA composites.
The best enhancement from coconut shell charcoal particulate in tensile and abrasion properties confirmed that this reinforcement source has the potential for polymer composites development, and hence, can be further exploited.

S. Sahadeo et al.: Survey and Modeling of Protected Agriculture Environment Systems in Trinidad and Tobago
71
As part of the material base for automobile industries, both CSC and CSA particulates can be used for the development of polyester composites for both interior and exterior automobile parts which will serve as part of the drive for the inclusion of eco-friendly materials in automobile parts.
References:
Agunsoye, O.J., Talabi, S.I. and Sanni, O.S. (2012), “Study of mechanical behaviour of coconut shell reinforced polymer matrix composite”, Journal of Minerals and Materials Characterisation
and Engineering, Vol.11, pp.774-779 Ankesh, K., Kanhaiya, K., Suman, S. and Siva, S.R.R. (2016),
“Study of physical, mechanical and machinability properties of aluminium metal matrix composite reinforced with coconut shell ash particulates”, Imperial Journal of Interdisciplinary Research, Vol. 2, No.5, pp.151-157
Imoisili, P.E., Ibegbulam, C.M. and Adejugbe, T.I. (2012), “Effect of concentration of coconut shell ash on the tensile properties of epoxy composites”, The Pacific Journal of Science and
Technology, Vol.13, No.1, pp.463-468. Madakson, P.B., Yawas, D.S. and Apasi, A. (2012),
“Characterisation of coconut shell ash for potential utilisation in metal matrix composites for automotive applications”, International Journal of Engineering Science and Technology, Vol.4, No.3, pp.1190-1198
Nidhi, T., Srinivasulu, B. and Subhas, C.S. (2013), “A study on characterisation and comparison of alkali treated and untreated coconut shell powder reinforced polyester composites”, International Journal of Scientific Engineering and Technology, Vol.2, No.6, pp.469-473.
Njoku, R.E., Okon, A.E. and Ikpaki, T.C. (2011), “Effect of variation of particle size and weight fraction on the tensile strength and modulus of periwinkle shell reinforced polyester composites”, Nigerian Journal of Technology, Vol.30, No.2, pp. 87-93.
Oladele, I.O., Omotoyinbo, J.A. and Borisade, M.P. (2013), “Mechanical properties of mahogany (swietenia macrophylla) and araba (ceiba pentandra) dusts reinforced polyester composites”, Leonardo Electronic Journal of Practices and
Technologies, No.23, pp.1-18.
Prakash, K.D. and Ajit, S. (2014), “Experimental investigation and analysis of process parameter in machining of aluminum based metal matrix composite”, International Journal of Engineering
Sciences and Research Technology, Vol.3, No.1, pp.94-102. Rahul, C. (2012), Study of Mechanical and Flexural Properties of
Coconut Shell Ash Reinforced Epoxy Composites, (unpublished B.Tech Thesis), Department of Mechanical Engineering, National Institute of Technology Rourkela, pp. 14-16.
Sarojini, S. (2013), “Synthesis and characterisation of graphene based unsaturated polyester resin composites (Department of Advanced Material Process Technology Center, Crompton Greaves Ltd., Kanjur Marg, Mumbai 400042, India)”, Transactions on Electrical and Electronics Materials, Vol.14, No.2, pp.53-58.
Salmah, H., Marliza, M. and Teh, P.L. (2013), “Treated coconut shell polyester composites”, International Journal of
Engineering and Technology, Vol.13, No.2, pp.94-103. Subita, B. and Pardeep, K.V. (2013), “Effect of graphite filler on
mechanical behaviour of epoxy composites”, International
Journal of Engineering Technology and Advanced
Engineering, Vol.3, No.2, pp.427- 430.
Authors’ Biographical Notes:
Isiaka Oluwole Oladele holds a Master’s degree and PhD in the
area of natural-fibre reinforced polymer composites from the
Department of Metallurgical and Materials Engineering, Federal
University of Technology, Akure, Ondo State, Nigeria. Dr. Oladele
is a Senior Lecturer in the department and currently, the Sub-
Dean, School of Engineering and Engineering Technology. He has
supervised many undergraduate and postgraduate projects and
has published in local and international journals and conference
proceedings.
Kupolusi Leah Oluwaseun holds her First and Second degrees
in the area of natural fibre reinforced polymer composites from the
Department of Metallurgical and Materials Engineering, Federal
University of Technology, Akure, Ondo State, Nigeria. She is into
advanced materials research and development using eco-friendly
materials.

N. Hyatali and K.F.Pun: Exploring Contemporary Perspectives for Managing Projects in Organisations: A Review 72
Exploring Contemporary Perspectives for Managing Projects in
Organisations: A Review
Neisha Hyatali a,Ψ, and Kit Fai Pun b
a The Campus Libraries, The University of the West Indies, St Augustine Campus, Trinidad and Tobago, West Indies; E-mail: [email protected]
b Department of Mechanical and Manufacturing Engineering, Faculty of Engineering, The University of the West Indies, St Augustine, Trinidad and Tobago, West Indies; E-mail: [email protected]
Ψ Corresponding Author
(Received 5 September 2016; Revised 15 November 2016; Accepted 19 December 2016)
Abstract: Project management (PM) has always been a discipline dominated by the guidelines espoused in the various
professional bodies of knowledge and the literature dominated by those who generated the practices. The result has been the
establishment of paradigms that were suited to the engineering and construction industries. However, there has been rapid
growth in the utilisation of projects and the accompanying project management applications in organisations outside of
these industries. The challenges faced by various organisations reveal that the traditional approach of the discipline which
was originally designed to manage engineering and construction projects might not accommodate the growth of PM
practices in other industries. This has led to a rethinking of PM and also demands for new paradigms to meet the PM needs
in varied business/organisational settings. This paper discusses some current challenges faced in organisations, and
identifies the changing nature of projects and the PM environment that support a rethinking of PM, particularly for
business/organisational projects. Two contemporary PM perspectives, namely, ‘Projects as Temporary Organisations’
(PTO) and ‘Management of Projects’ (MoP), are advocated. The paper then discusses the need to integrate strategic
alignment, project dynamics and value creation, into a generic model for managing projects in organisations. Future work
would focus on evaluating the efficacy of the model with empirical evidence.
Keywords: Contemporary perspectives, project management practices, generic model, strategic alignment
1. Introduction
“Nowadays, it is hard to imagine an organisation that is not engaged in some kind of project activity” (Maylor et al. 2006, 663) as it could be found almost everywhere (Gustavsson and Hallin 2015, 368-371). This increasing popularity of the concept of projects over the years is in response to the changing management environment, so much so that projects have emerged as the common approach to organising work within the organisation.
Traditionally, recent studies on project management were focused on construction and engineering projects and on project efficiency including planning, structure, order and control (Hyatali and Pun, 91-82). However, many researchers have not only noted the surge of interest in project organising and PM over the years but expanded interest outside of the traditional sectors of construction and engineering (Maylor et al. 2006, 664).
Despite its widespread use since the turn of the 21st century, PM has, however, become difficult to integrate into traditional management disciplines (Garel 2013, 663) as the current approaches appear ill-equipped to address contemporary challenges. This has given rise to some real challenges for practitioners and academics alike. The purpose of this paper is to identify from the prevailing theories/perspectives, those concepts that seem best suited to address the particular challenges of
today’s organisations. This paper begins by highlighting from the literature some of these challenges faced by organisations in managing projects, it then looks at two theories being espoused to address the shortcomings of the discipline, as well as the changing nature of projects and the PM environment that support a rethinking of PM particularly for business/organisational projects. A generic model that integrates the concepts of strategic alignment, project dynamics and value creation is advocated as a guide for managing projects. 2. Traditional Approach to Project Management
According to Ackermann and Alexander (2016, 891), despite the wealth of information and research in PM, including the availability of various PM handbooks and guides, there are still gaps in our knowledge of projects. Authors continue to stress the need for new approaches to research in PM to fill these gaps since conventional approaches to researching projects are “insufficient to provide a comprehensive understanding of project phenomena.” Challenges in managing projects, within the organisational setting, have been intensifying . The traditional model of PM is struggling to adapt and this has resulted in the need for a rethinking of the PM perspective.
ISSN 0511-5728 The West Indian Journal of Engineering
Vol.39, No.2, January 2017, pp.72-82
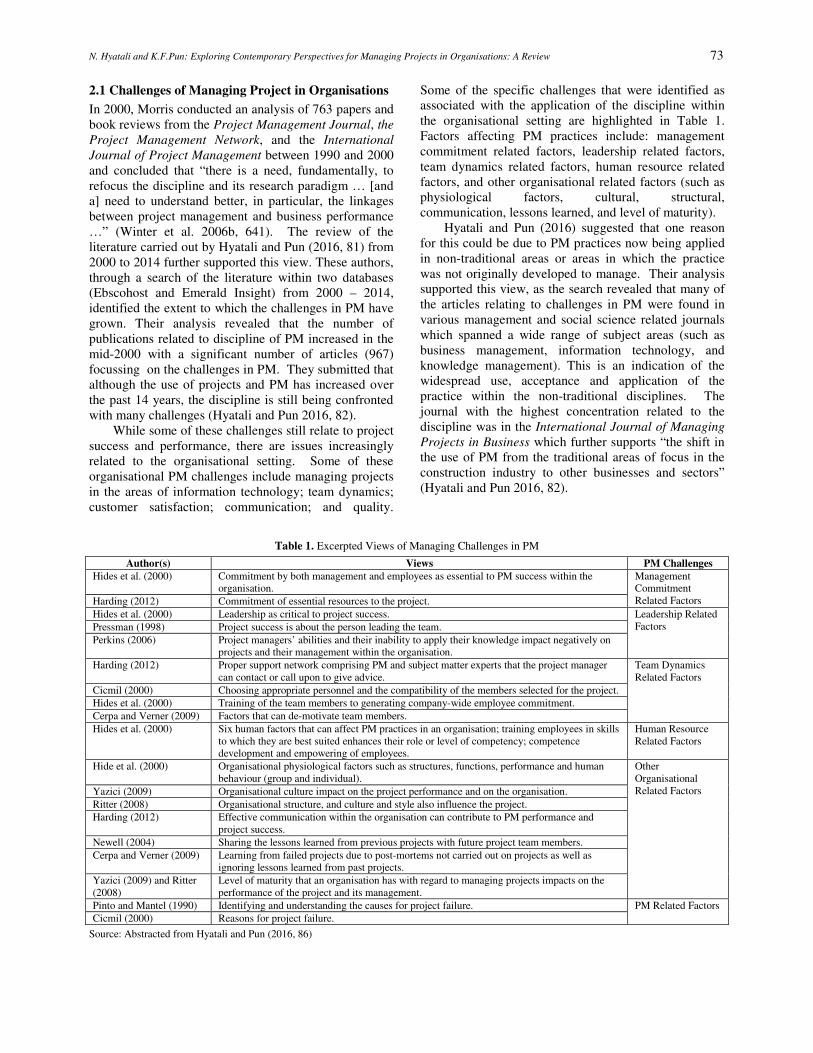
N. Hyatali and K.F.Pun: Exploring Contemporary Perspectives for Managing Projects in Organisations: A Review 73
2.1 Challenges of Managing Project in Organisations
In 2000, Morris conducted an analysis of 763 papers and book reviews from the Project Management Journal, the
Project Management Network, and the International
Journal of Project Management between 1990 and 2000 and concluded that “there is a need, fundamentally, to refocus the discipline and its research paradigm … [and a] need to understand better, in particular, the linkages between project management and business performance …” (Winter et al. 2006b, 641). The review of the literature carried out by Hyatali and Pun (2016, 81) from 2000 to 2014 further supported this view. These authors, through a search of the literature within two databases (Ebscohost and Emerald Insight) from 2000 – 2014, identified the extent to which the challenges in PM have grown. Their analysis revealed that the number of publications related to discipline of PM increased in the mid-2000 with a significant number of articles (967) focussing on the challenges in PM. They submitted that although the use of projects and PM has increased over the past 14 years, the discipline is still being confronted with many challenges (Hyatali and Pun 2016, 82).
While some of these challenges still relate to project success and performance, there are issues increasingly related to the organisational setting. Some of these organisational PM challenges include managing projects in the areas of information technology; team dynamics; customer satisfaction; communication; and quality.
Some of the specific challenges that were identified as associated with the application of the discipline within the organisational setting are highlighted in Table 1. Factors affecting PM practices include: management commitment related factors, leadership related factors, team dynamics related factors, human resource related factors, and other organisational related factors (such as physiological factors, cultural, structural, communication, lessons learned, and level of maturity).
Hyatali and Pun (2016) suggested that one reason for this could be due to PM practices now being applied in non-traditional areas or areas in which the practice was not originally developed to manage. Their analysis supported this view, as the search revealed that many of the articles relating to challenges in PM were found in various management and social science related journals which spanned a wide range of subject areas (such as business management, information technology, and knowledge management). This is an indication of the widespread use, acceptance and application of the practice within the non-traditional disciplines. The journal with the highest concentration related to the discipline was in the International Journal of Managing
Projects in Business which further supports “the shift in the use of PM from the traditional areas of focus in the construction industry to other businesses and sectors” (Hyatali and Pun 2016, 82).
Table 1. Excerpted Views of Managing Challenges in PM
Author(s) Views PM Challenges
Hides et al. (2000) Commitment by both management and employees as essential to PM success within the organisation.
Management Commitment Related Factors Harding (2012) Commitment of essential resources to the project.
Hides et al. (2000) Leadership as critical to project success. Leadership Related Factors Pressman (1998) Project success is about the person leading the team.
Perkins (2006) Project managers’ abilities and their inability to apply their knowledge impact negatively on projects and their management within the organisation.
Harding (2012) Proper support network comprising PM and subject matter experts that the project manager can contact or call upon to give advice.
Team Dynamics Related Factors
Cicmil (2000) Choosing appropriate personnel and the compatibility of the members selected for the project.
Hides et al. (2000) Training of the team members to generating company-wide employee commitment.
Cerpa and Verner (2009) Factors that can de-motivate team members.
Hides et al. (2000) Six human factors that can affect PM practices in an organisation; training employees in skills to which they are best suited enhances their role or level of competency; competence development and empowering of employees.
Human Resource Related Factors
Hide et al. (2000) Organisational physiological factors such as structures, functions, performance and human behaviour (group and individual).
Other Organisational Related Factors Yazici (2009) Organisational culture impact on the project performance and on the organisation.
Ritter (2008) Organisational structure, and culture and style also influence the project.
Harding (2012) Effective communication within the organisation can contribute to PM performance and project success.
Newell (2004) Sharing the lessons learned from previous projects with future project team members.
Cerpa and Verner (2009) Learning from failed projects due to post-mortems not carried out on projects as well as ignoring lessons learned from past projects.
Yazici (2009) and Ritter (2008)
Level of maturity that an organisation has with regard to managing projects impacts on the performance of the project and its management.
Pinto and Mantel (1990) Identifying and understanding the causes for project failure. PM Related Factors
Cicmil (2000) Reasons for project failure.
Source: Abstracted from Hyatali and Pun (2016, 86)

N. Hyatali and K.F.Pun: Exploring Contemporary Perspectives for Managing Projects in Organisations: A Review 74
2.2 Changing Concept of Projects and PM
The increased use of the concept of projects within the business setting over the years has been in response to the changing management environment. These changes have been brought about by rapid development in technology and communication. In an effort to function effectively in such a complex environment, organisations have had to embrace unique strategies. Strategies such as adopting flexible structures to respond to their dynamic environment and remaining in a constant state of flux to improve their business processes could help organisations gain competitive advantage (Turner 2009, 1). The appeal of the project approach is attributable to the fact that projects are able to deliver change in a fast and flexible way that cannot be achieved in the routine organisations (Turner 2009, 3). As such, organisations have increasingly applied project and PM tools, techniques and procedures to implement their strategies and as a means of delivering change within the organisation (Turner and Muller 2003, 3).
Even Mishra et al. (2011, 356) observed that organisations were increasingly depending on projects and PM to achieve operational excellence and business growth and that project success “has become vital in the context of competition and decreasing margins.” Despite this increased application of PM in the traditional management disciplines, however, it was not until the early 1990s, that the organisational perspective to PM research was introduced (Gustavsson and Hallin 2015, 368-370). It was at this time that researchers began to question this perspective because “the empirical context of what is called ‘a project’ has changed … and many projects do not fit into the traditional project characteristics” (Gustavsson and Hallin 2015, 371). This can be attributed to the fact that “projects are becoming larger, more complex and widespread [where] increasingly projects extend beyond the individual firm or organisation” (Maylor et al. 2006, 664)
Traditionally, the concept of projects was with reference to some physical structure, product or system, etc. that needed to be engineered based on specification, cost and time. Table 2 includes some of the traditional concepts/definitions of projects. However, according to Winter et al. (2006a, 699), a broader class of projects and programmes have emerged in areas such as organisational change and IT, integrated business solutions, and long-term public service delivery. The authors suggested that these projects, which are often referred to as ‘business projects’ are a new class of projects (and programmes) which reflect “a growing conceptual shift away from the traditional engineering view of projects, towards a more business-oriented view.” These business projects are therefore viewed as much broader in purpose and scope with their primary emphasis being on value creation as opposed to product creation (Winter et al. 2006a, 700). It is a “shift away
from the traditional engineering view towards a more value-centric view” where the primary concern is “increasingly the challenge of creating value and benefit for different stakeholder groups” (Winter et al. 2006a, 700).
The traditional approach has been condemned by many as being an ‘inward-looking’ perspective of the PM discipline, as its primary concern is with the project life cycle and project success which is measured by the triple constraints of cost, time and scope. This approach was initially developed for the traditional engineering and construction type projects and it has now been highly criticised within the literature as it continually neglects relevant theoretical developments in other disciplines. It has been suggested in the literature that there is a need for the development of a more ‘outward-looking’ perspective in relation to business projects through other disciplines (such as change management, and knowledge management).
Table 2. The traditional concept of projects
A project involves a group of people working to complete a particular end product, or to achieve a specific result, by a specified date, within a specified budget and to meet a specified standard of performance (quality)
[A project] achieves a clear objective against a time scale [A project is] an endeavour in which human, material and financial
resources are organised in a novel way, to undertake a unique scope of work, of given specification, within constraints of cost and time, so as to achieve beneficial change defined by quantitative and qualitative objectives.
A project is an endeavour, to accomplish a specific objective through a unique set of interrelated tasks … A project has a well-defined objective – an expected result or product. The objective of a project is usually defined in terms of scope, schedule, and cost
[A project is] a unique process, consisting of a set of coordinated and controlled activities with start and finish dated, undertaken to achieve an objective conforming to specific requirements, including the constraints of time, cost and resources.
Source: Extracted from Winter et al. (2006a, 700)
3. The Emerging Perspectives in PM
A major concern for the PM discipline is that there is no real established theory on which to base the discipline. As Winter et al. (2006b, 640) explained, there are several theoretical approaches and some of them overlap. There are three dominant approaches: the traditional view which emphasises the planning and control dimensions of PM; the view of projects as temporary organisations; and the ‘management of projects’ view which emphasises the front-end approach to managing projects. The first approach is the most dominant strand of thinking found in the literature and within the established methodologies. Since the main highlights of this approach were already discussed, the other two approaches would be discussed briefly in the following sections.

N. Hyatali and K.F.Pun: Exploring Contemporary Perspectives for Managing Projects in Organisations: A Review 75
4.1 Projects as Temporary Organisations (PTO)
In the literature, research within the disciple has led to the emergence of new concepts regarding projects and PM. One such concept is the development of a more ‘realistic’ definition of a project. The Project Management Institute (PMI 2014, 4), for instance, defines a project “as a temporary endeavour undertaken to create a unique product or service.” Similar variations of this definition have been used by practitioners and researchers alike for many years. However, there is now an ongoing debate which suggests that this definition does not quite reflect the true nature of a project.
Turner (2009, 2) defined a project as “an endeavour in which human, financial, and material resources are organised in a novel way to undertake a unique scope of work, of given specification, within constraints of cost and time, so as to achieve beneficial change defined by quantitative and qualitative objectives.” In this definition the focus was on the features shared by projects – unique (no project exists exactly like it); novel (no project would use exactly the same approach); and transient (it has a start and an end). Many classical definitions of projects are based on a similar concept, on the triple constraints of cost, time and scope or quality as criteria for project success (Turner and Muller 2003, 1 and Mishra et al., 2011, 357).
Lundin and Soderholm (1995) came up with a theory of the temporary organisation which essentially provides “a theoretical discussion of short-term organisations” and “provide a complement to the normative models in traditional project management literature.” The authors envisaged projects as temporary organisations rather than tools for achieving unique, one time tasks (Gustavsson and Hallin 2015, 368-370). They saw temporary organisations as action-oriented instead of decision-oriented and a progression towards a more ‘organising’ way of thinking about the organisation opposed to the more common ‘entity’ way of thinking (Jacobsson et al. 2013, 576).
This theory presented four key basic concepts – time, task, team and transition – characteristics of projects that could be used to distinguished temporary organisations from permanent organisations, that is, they separate the temporary organisation from the other settings within the organisation (Jacobsson et al. 2013, 578). This concept is illustrated in Figure 1. This theory has become a popular way of defining a project based on these four ‘Ts’ which characterise a project in terms of “being limited in time and having a fixed deadline; aimed at a unique, specified, measurable, accepted and realistic task; achieved through the work of a selected team; and involving a transition from a ‘before’-state which is different from an ‘end’-state” (Gustavsson and Hallin 2015, 371).
Based on this theory and also along a similar vein to that of Cleland and Kerzner’s (1985) definition of a project as “a combination of human and non-human
resources pulled together into a temporary organisation to achieve a specified purpose” (Turner and Muller 2003, 2), Turner (2009, 2) altered his definition and adopted a less prescriptive definition of a project as “a temporary organisation to which resources are assigned to do work to deliver beneficial change.” In this definition, the nature of projects is considered as: a production function; a temporary organisation; an agency for change; an agency for resource utilisation; and an agency for uncertainty management. According to Turner (2009, 2), the concept of the project as a temporary organisation suggests that a new organisation is created with the required resources to achieve some vision of a future state and once this state is achieved, the organisation would be disbanded.
Figure 1. Recasting of the temporary organisation model Source: Extracted from Jacobsson et al. (2013, 582)
In the classic definitions of a project, the project’s
role was one of a production function where projects are viewed as a collection of plans, with managerial oversight, purchasing and selling the inputs and output of the project on the open market, and maximising benefits or value for the owner. As a temporary organisation, the project is however established by the principal or parent organisation as an agency to achieve specific objectives. As a temporary organisation, projects could overcome the resistance to change, could respond better to the uncertainties within the change process because of their flexibility and were better suited to managing the change, unlike functional organisations (Turner and Muller 2003, 2-4). Projects were also seen as more effective at assigning and managing resources to facilitate change within the organisation (Turner and Muller 2003, 4). The temporary organisation was also better suited to addressing the three pressures in projects – uncertainty (in terms of delivering the desired outcome/change), the need for integration (between the parts of the project and with the business) and urgency (due to prescribed timescale).
In a later research note, Lundin and Soderholm (2013, 591-592), believed that the debate over the true nature or definition of a project is still raging. They argued that when the current use of the word ‘project’ was analysed they found that it had several meanings.

N. Hyatali and K.F.Pun: Exploring Contemporary Perspectives for Managing Projects in Organisations: A Review 76
They found that it could be used to signify an emphasis on activities rather than an emphasis as a plan and that it can vary based on context. They also found that the meaning does not always share the characteristics of task, time, team and transition but can be based on other aspects (such as, expectations, goals, control and choices) which may affect how the project is perceived. It is based on these types of projects that the ‘end state’ is now considered an important characteristic.
It is believed that this concept of end state within a project changes based on how the operation develops (Lundin and Soderholm 2013, 590). That is, the notion of end state in projects gets “reconsidered and revised several times over the life span of the project” (unlike projects performed in project-based businesses which are fairly stable with regard to their end state) as it highlights “how the idea of a project travels with time” (Gustavsson and Hallin 2015, 374). In addition, Lundin and Soderholm (2013, 593) believed that the notion of end state theoretically opens up the project process as a process within the organisation.
Gustavsson and Hallin (2015, 369-371) challenged this theory of projects as a temporary organization, arguing that as organisations are restructured to keep abreast with their changing environment, projects today have become more of a mainstay as opposed to being temporary. That is, the projects are more permanent than the parent organisation because they live on while the parent organisation does not survive. In these types of projects, “detailed goals are developed, negotiated and renegotiated during the progress of the project, rather than at an initial stage of the project, as normative project management models proposes.”
Winch (2014, 721) similarly challenges this view of projects as being temporary, claiming that the view of ‘project organising as temporary’ has limited the development of research. Arguing that matrix organisations (an unstable form where the temporary organisation was superimposing on the functional organisation), project ecology (a pool of expertise within the organisation which could be mobilised for projects) and projectification (changing the organisation towards management by projects) are all based on the interaction between the temporary project organisation and the permanent organisations that resource it (Winch 2014, 723).
Moreover, Winch (2014) developed a conceptual framework based on three (3) domains of project organising (see Figure 2). The first domain is the owners (those who invest in the projects) and operators (those who perform the project related activities). These owners/ operators operate as permanent organisations and in these organisations projects are not the core business but are used to extend the core business. The second domain is the project suppliers (those hired to perform project related services and supply the human and material resources) also referred to as project-based firms. Here, projects are used to work on complex,
innovative tasks for clients. For these project-based firms, their core business is projects and these project organisations are permanent organisations. The third domain refers to project and programmes as temporary organisations created to perform the projects. Their model illustrates the interface between each of these three domains – governance (which includes portfolio management), commercial (which includes business models) and resourcing (which refers to resource allocation) (Winch 2014, 723-725).
Figure 2. Three domains of project organising Source: Abstracted from Winch (2014, 725)
Similarly, the research note by Jacobsson et al.
(2013, 577), while supporting the 1995 theory by Lundin and Soderholm, argued that research had shifted from the development of the theory of the temporary organisation being focused on “an organising inspired way of thinking” towards a focus on contextual issues. The authors sought to remedy this by placing their research emphasis on “the temporary organisation as a transitory unit within the permanent organisation – hence taking on an intra-organisational perspective.” They considered that from an intra-organisational perspective, it would seem very unlikely that the temporary organisation exists detached from the permanent organisation; the reason being that “temporary organisations tend to exist in, or [are] closely linked to, permanent organisations … thus, the temporary organisation can conceptually be seen as a form of transitory unit in the permanent organisation [as such] the theories of temporary and permanent organisations should potentially converge or be interlinked” (Jacobsson et al. 2013, 579).
Jacobsson et al. (2013, 584) recommended that within the field, the focus of future theory development should be on ‘temporary organising’ rather than the temporary organisation as only a unit—a position supported by Gustavsson and Hallin (2015, 369) who

N. Hyatali and K.F.Pun: Exploring Contemporary Perspectives for Managing Projects in Organisations: A Review 77
claimed that this view is one of a process philosophical perspective and as such is focused not on the ‘goings-on’ of the temporary organisation but on the changes in the temporary organisation. That is, the project is seen as a process which is continuously changing and constantly in motion as opposed to stable. This they claim makes the concept of ‘end state’ expressed by Lundin and Soderholm “insufficient to truly capture the processual nature of temporary organising, regardless of their claim that ‘the notion of end state …opens up the project process as a process’.” Gustavsson and Hallin (2015, 374) added that the concept of ‘trajectory’ (instead of ‘transitions’) could be used. Trajectory for temporary organisations is defined as “the path that the temporary organisation follows across time and space; a path that is dependent on time and space.” Here the concept of trajectory implies a shift in focus to ‘temporary organising’ where the reasons for the changes that take place during the actions undertaken in the name of the project are explored.
On the other hand, Artto (2013, 597), challenged Jacobsson et al. (2013)’s views regarding the converging of the temporary and permanent organisation. He argued that if the permanent organisation participates in organising the action of the temporary organisation then it becomes part of it and “the boundaries between these two organisations become diffuse and these two organisations ‘become one’ where the permanent and temporary cannot be distinguished as separate parts.” In this case, the temporary organisation is viewed as a resource for performing the activities and works that are pre-planned by the permanent organisation. 4.2 Management of Projects (MoP)
Morris (1994) proposed a significant reconceptualisation in the field of PM both in its theory and practice with the introduction of his ‘Management of Projects’ (MoP) perspective (Pinto and Winch 2016, 237). This approach was a rethinking of the way in which organisations structure and manage their projects by identifying “a broader, more comprehensive understanding of the principal project management activities and interfaces required for project success.” Morris’s (1994) approach moved away from the focus on PM tools and techniques towards the strategic issues which he argues are the organisational requirements of achieving success for the organisation(s). Figure 3 outlines this framework.
The traditional approach to PM which is the PMI’s Project Management Body of Knowledge (PMBoK) model is referred to by Pinto and Winch (2016, 238) as the “settled science.” This execution-oriented approach focuses mostly on the delivery of the project (initiate, plan, execute, monitor and control, and close) and ignores other key areas such as the critical front-end activities and “the larger context within which the project is idealised, validated, and shaped by multiple stakeholder forces.” It views PM as a delivery system or
technique-laden toolbox. This approach has also been criticised by scholars as an approach that may have held true at one time and for specific classes of project, such as construction, but with the emerging modern PM, the demands placed on project managers have increased and have shown the traditional model to be a “myopic and far-too-limiting way of viewing the real role of the project manager” (Pinto and Winch 2016, 240).
Figure 3. Management of Projects Framework Source: Extracted from Pinto and Winch (2016, 238)
According to Morris (1994), current research does
not focus on the integrative level of PM but rather focuses on particular aspects of the management of projects (Pinto and Winch 2016, 241) and he believed that in developing projects they need to be fully defined and linked to the critical elements of the organisation. He conceptualised PM as partnering with other managerial disciplines towards developing the internal and external critical actions and interfaces essential to project success. The critical interface of his approach therefore occurs at the institutional level where the interaction is between the project and the larger business and general environment within which the project is operating.
Morris’s (1994) view has been widely accepted, resulting in a body of research “known as the ‘shaping’ of project front ends.” His MoP perspective focusses on the front-end development of the project where the project definition and targets are established and where, Morris believed, management needed to concentrate (Pinto and Winch 2016, 239). It is during this phase that the strategic alignment issues are considered and the key organisational elements (such as structure and people) are decided. Morris even identified a ‘meta’ lifecycle which has several stages, namely concept, feasibility, definition, execution and close-out. However, managing the front-end is only one feature of the definition stage: it is linked to a variety of other functions such as commercial assessment (securing supply chain partners), technology management (conducting adequate requirements analysis), strategy and financing (aligning corporate strategic goals with project goals) and

N. Hyatali and K.F.Pun: Exploring Contemporary Perspectives for Managing Projects in Organisations: A Review 78
organisational accommodations for the project (human resource requirements).
Another significant part of the MoP framework is stakeholder management “both to the critical front-end of project definition as well as linking to important institutional level and environmental actors that can influence project development” (Pinto and Winch 2016, 242). This has implications on the remit of the project manager and their competencies as the MoP perspective identifies more clearly the broader nature of the challenges for modern project managers in today’s complex and rapidly changing business environment. For instance, project managers now need to include tasks such as supply chain development, requirements management or contracting as well as the competencies to plan, organise, and deliver projects aimed at maximising value for stakeholders (Pinto and Winch
2016, 240). Pinto and Winch (2016, 243) contend that the theory of temporary organisation is “inadequate from the MoP perspective” whereas two recent perspectives, organisational PM and three domain, may lend support to the MoP perspective. The first looks internally at PM as a function within the organisation and “emphasises issues such as the relationship between the overall strategy of the organisation and its projects, levels of maturity in project capabilities, the importance of portfolio management, governance and the role of project sponsors” (Pinto and Winch 2016, 243). The three domain perspective (the highlights of which were previously discussed) looks at the relationship of the agencies in coalition projects to determine the contribution of each to the overall management of the project. Table 3 summarises research findings on the MoP perspective.
Table 3. A summary of research findings on the MoP perspective
Author(s) Brief Highlight of the Abstracts
Pinto and Winch (2016)
This paper looks at how the MoP perspective “unsettled” the traditional approach which focuses on tools and techniques and which the authors refer to as “settled science” of PM. It looks at some of the research that has been influenced by this perspective and the key areas for future research needed to reassess PM thinking.
Fellows and Liu (2016)
This paper builds on Morris’s contribution on “the importance of the early stages of a (possible) project”, that is, the front-end project stages which the authors argue are where “risks, uncertainty, ambiguity and unknown are greatest.” They see projects as cross-cultural and complex and the differences in participants’ perception and understanding based on how they make sense of problems/issues as important contributions to projects.
Arrto et al. (2016)
This paper looks at Morris’s view regarding “value creation for project stakeholders using project outcome” which the authors see as “an attempt to link the front-end of the system lifecycle – the project phase – to the back end i.e. the operations phase.” They use the system view to analyse value creation mechanisms within the system lifecycle. They carry out empirical research to identify value-enhancing integration mechanisms and propose new PM approaches that create value.
Winch and Leiringer (2016)
This paper addresses Morris’s theme regarding research on the management of major projects. The authors focus on transportation infrastructure projects and the contribution of the ‘strong owner’ to project performance. They develop a framework which provides “the basis for a research agenda on the role of the owner of the infrastructure assets in achieving high performance on transportation infrastructure projects.”
Klakegg et al. (2016)
This paper focuses on the work of Morris regarding the behavior of complex public and public-private projects. It concentrates on the front-end stage as purported by Morris since the authors consider this stage to be most important in establishing the success of major projects. The authors examine the development of the governance of major public projects in three European countries (UK, Norway and the Netherlands) and examine “to what extent it can be argued that the challenges of major public projects have been resolved.
Samset and Volden (2016)
This paper also applies Morris’s views that recognises the importance of front-end decision making in facilitating long-term success of projects. The author focuses on the importance on the choice of concept to successful projects. They present some of the findings that have emerged from “the Concept research programme on front-end management and governance of major public investment projects in Norway.
Davies and Brady (2016)
This paper is based on the contributions by Morris underlining the role of people, knowledge and experience in the successful management of projects. It “provides the foundation to guide future research on project capabilities based on three main contributions.” The authors suggest that “project capabilities are developed and mobilised to deal with the variety of contingent conditions facing an organisation …distinguish between project capabilities at the operational and dynamic capabilities at the strategic levels of an organisation … [and] suggest that the relationship between dynamic and project capabilities is reciprocal, recursive and mutually reinforcing.”
Bresen (2016) This paper was “inspired by Peter Morris’s major contribution to the field of project management,” particularly his early work regarding the complex relationship between project tasks and existing “institutional arrangements established for the governance of construction projects.” The paper “highlights the diversity and complexity … of project management practice, theory and research and harnesses these ideas to highlight the opportunities and tensions this diversity creates.”
Whyte et al. (2016)
This paper utilises Morris’s views on the up-front planning in the management of large complex projects to analyse the practices for managing change in “organisations [that] deliver complex projects, rely on digital technologies to manage large data-sets; and use configuration management … to establish and maintain integrity.”
Hodgson and Paton (2016)
This paper builds on Morris’s work “to develop project management as a profession, with particular concern to bridge the rift between abstract theory and practice.” It explores “how project managers rely in part on the authority and expertise of the profession and in part upon technical expertise and industry/organisational experience to perform their role, and how the two are reconciled.”
Morris (2016) This paper, by Morris himself, reflects on the other papers published in the Festschrift for Peter Morris and on his personal perspective on the discipline.

N. Hyatali and K.F.Pun: Exploring Contemporary Perspectives for Managing Projects in Organisations: A Review 79
Samset and Volden (2016, 297-299), for instance,
supported Morris’s focus on the critical front-end and institutional elements. Their research looked at project governance (the processes, systems and regulations that must be present to ensure project success) rather than PM (the processes traditionally used to organise and manage the resources required in a project within the constraints of time, cost, scope and quality). They utilised the findings from their ‘Concept Research Programme’ which was designed to focus on the front-end management of various public projects. From the findings they identified ten paradoxes which have implications for both project governance and the theory of PM. The common thread throughout these paradoxes was that they stressed the importance of establishing the project concept at the initial stage of the project.
Artto et al. (2016, 258), on the other hand, supported Morris’s call for value creation for project stakeholders through the use of project outcomes;that is, creating value by achieving the desired outcomes of the project sponsor and stakeholders. They sought to do this by linking the front-end or the project phase of the system lifecycle to the back-end or operations phase. Similarly, Laursen and Svejvig (2016, 736) in their investigation of the literature looked at the project value creation perspective to determine what already exists “to provide a comprehensive overview of the most salient concepts within project value creation, to present direction for future research”. 3. A Rethinking of Project Management
The increasing criticisms of the PM discipline with regard to “its lack of relevance to practice and, consequently, to improved performance of projects across different industrial sectors” (Winter et al. 2006b, 638-9) resulted in the development of a research network entitled Rethinking of Project Management: Developing
a New Research Agenda between 2004 and 2006. The Network, as it was referred to, responded to some of these criticisms and the need for new perspectives on the PM concept to “enrich and extend the field beyond its current intellectual foundations, and connect it more closely to the challenges of contemporary project management practice” (Winter et al. 2006b, 639).
The Network developed a framework based on the comprehensive analysis of all the research material collected and produced over a 2-year period. The findings indicated five directions for future research in PM and identified that new concepts and approaches were needed in the areas of: project complexity, social process, value creation, project conceptualisation and practitioner development. The directions for future research were to be undertaken through: theory about practice (theory which helps understand the practice); theory for practice (theory with practical application) and theory in practice (theory on how practitioners learn
and practice the craft). Figure 4 outlines these directions in greater detail. Each area was also examined in terms of their impact on seven (7) identified themes: projectification, programmes, the actuality of projects, uncertainty, business projects, professionalisation, and practitioner development (Maylor et al. 2006, 636).
Figure 4. Directions for Future Research Source: Extracted from Winter et al. (2006a, 642)
The most common pattern to emerge from the
inputs of the practitioner was the utter complexity of projects and programmes across various sectors and levels comprising a wide range of aspects including “the multiplicity of stakeholders, and the different agenda, theories, practices and discourses operating at different levels within different interested groups in the ever-changing flux of events.” Given this increasing complexity of projects, the classical lifecycle model, it was argued, “cannot be perceived as an all-encompassing representation of actual practice.” It was suggested that a new way of thinking was needed that would extend the understanding of the actual reality of projects and PM practice that would assist practitioners with actually dealing with complexity in the practice (Winter et al. 2006b, 643).
Another strong pattern that was identified was that ‘real’ projects and programmes were much more

N. Hyatali and K.F.Pun: Exploring Contemporary Perspectives for Managing Projects in Organisations: A Review 80
complex, unpredictable and multidimensional than the rational, deterministic model identified in the literature. It was suggested that a new way of thinking which related to the actual complexity of projects at all levels was required. One that focused on aspects such as: “the ever-changing flux of events, the complexity of social interaction and human action, and the framing and reframing of projects and programmes within an evolving array of social agenda, practices, stakeholder relations, politics and power” (Winter et al. 2006b, 644).
The third most common theme identified was “the increasing emphasis within organisations on value creation, rather than product creation, as the overall focus in the management of projects”. It was identified that the main concern for many organisations is now no longer the capital asset, system or facility, etc. but rather the challenge of linking business strategy to projects, managing the delivery of benefits in relation to different stakeholder groups, and maximising revenue generation (Winter et al. 2006b, 644). It was argued that research was needed to identify the different forms of value and develop new models of value creation that go beyond the traditional ‘value chain’ approach used in production and manufacturing.
Yet, another direction that emerged from the findings was in relation to the actual process of conceptualising projects and programmes from different perspectives and “focusing action in the midst of complex practice” particularly at the front-end of projects. This was unlike the previous directions (the social process and value creation) which were concerned with content. It was suggested that new concepts and approaches be developed to address “the broader conceptualisation of projects and programmes as being multidisciplinary, with multiple purposes that are permeable, contestable and open to renegotiation throughout” (Winter et al. 2006b, 645).
The final theme that emerged from the practitioners was that “mainstream methods and techniques can be a useful source of guidance for certain aspects, but they provide no guidance on ‘how’ to navigate the complexity of projects in the ever-changing flux of events.” The practitioners identified “experience, intuition and the pragmatic application of theory” as some of the distinctive capabilities for the successful management of projects. They see people as being essential to delivering successful projects, not methods and tools, because it is the ability of people “to engage intelligently with the complexity of projects, and that is central to the successful management of projects” (Winter et al. 2006b, 646). 4. A Generic Model for Managing Projects
In an attempt to incorporate the contemporary perspectives and associated concepts into managing projects, a generic model integrating strategic alignment, project dynamics, and value creation is advocated. A
diagrammatic representation of the model is shown in Figure 5.
Figure 5. A System View of the Proposed Generic Model for Managing Projects
The circle represents the organisation and the
environment in which it operates, while outside the circle are those external factors (such as political, economic, socio-cultural, technological, legal and environmental) that impact the organisation. Inside of the circle, there are also internal factors (such as organisational culture, organisational structure, and organisational resources) that impact the organisation. The smaller circle to the right represents the other disciples (such as strategic management, and change management) that impact on the process. The areas within the organisation that need to be developed, from a PM perspective, are: 1) strategic alignment, 2) project dynamics and 3) value creation. The approach within each area can vary based on the concepts used from any of the three perspectives. The cyclical nature of these three development areas indicates that this is a continuous process so the lessons learnt at the end of each development area are used to develop the areas in the future. This information would be used to determine if the strategic objectives for which the project was conceptualised were met.
In the case of the temporary organisation approach, the project dynamic development area could represent the temporary organisation, with the other areas representing the parent organisation. In the case of the traditional approach, the value creation area would be the measures of project success with respect to time, cost, scope and quality. In the case of the MoP, value creation would include the benefits to stakeholders.
The first development area is the organisation strategic alignment, and this process begins with a decision regarding the strategy or the strategic direction which the organisation intends to take, this is followed by the development of a strategic plan. From this plan,

N. Hyatali and K.F.Pun: Exploring Contemporary Perspectives for Managing Projects in Organisations: A Review 81
projects can be identified or conceptualised and once this is done the relevant resources (including financial, human, and physical) can then be allocated for each project. This would seek to ensure that the projects are aligned to the strategic direction and objectives of the organisation. It is here, that the project is linked to the critical elements of the organisation and when conceptualising the project, partnering can take place with other managerial disciplines. As suggested in the MoP approach, the project manager can be included at this stage to ensure adequate and effective project conception and design at the front-end stage. It is in this area that the challenges relating to management commitment, resource allocation, and other organisational issues (such as culture, communication, and structure) could also be addressed.
The second development area is the project dynamic that represents those activities relating to the project, such as: the project complexity, the type of projects, the project life cycle, project governance including project team dynamics, and project manager dynamics. It is here that these concepts from the temporary organisation can be applied. Besides, the PM-related challenges can be addressed. These include such issues as team dynamics, leadership, project quality, and measures of project success and failure.
The third development area is value creation in the practices/procedures that organisations use to measure project success. For instance, in the traditional model, time, cost, scope and quality are used as the measures of project success. While in the MoP approach, both the value for the organisation (for example, the competitive advantage gained by the organisation from the project) and the value for the stakeholders (for example, the benefits that the stakeholder would derive from the project) are used as measures of project success. Moreover, various areas can be developed, utilising the relevant concepts in an effort to minimise some of the human or people related challenges associated with managing projects in the organisation. 6. Conclusion
The objective of this paper was to explore the contemporary perspectives for managing projects in today’s business/organisation setting. It discusses the growing challenges faced by organisations due to the limitations of the traditional paradigm in PM, and explores two contemporary perspectives – projects as temporary organisations (PTO) and management of projects (MoP) – that have emerged.
The MoP approach developed by Morris (1994, 2000) focuses on integrating PM with the critical elements of the organisation. Since the critical interface is at the institutional level, this makes it ideal for addressing issues between the project and the organisation. For instance, this approach focuses on the front-end development of projects, where at this
definition phase the organisational elements, such as the issues relating to people aspects, are decided. It is also where there is a link to a variety of functions, such as those related to resource allocation for project success. It is at the front-end phase that strategic alignment of the project to the organisation is considered. Another integral aspect of this approach is that it considers value creation for the stakeholder.
The theory of projects as temporary organisations can be a valuable tool for organisations particularly in the current changing environment. For instance, in incidences where the project is plagued with uncertainties, planning beforehand may be impossible, the theory can be utilised because it allows for the adapting of the project plan over time based on how the operation develops. This notion could be seen as incorporating the project process into the organisational process. Hence, understanding the complexity of project would assist project managers in 1) identifying alternate forms of value for the organisation other than product creation, and 2) promoting the importance of project conceptualisation where the initial choice of project concept are of critical importance.
There is the need to consider how projects are being used within the business environment (Maylor et al. 2006, 672; Hyatali and Pun, 91-82). Developing the business projects concept would help advance the PM discipline towards a more business-oriented approach. The proposed generic model integrates the concepts of strategic alignment, project dynamics and value creation in guiding organisations with PM practices. There are possible implications for developing or establishing PM as a functional area within the organisation. Besides, it is important that the discipline evolves in light of the changing environment in which projects and PM must now operate.
This paper provides conceptual discussions on integrating the contemporary PM perspectives into potential adoption of the generic model as a guide for managing business/organisational projects. Future research is needed to identify the requirements for new types of business projects and to determine how they fit into the business/organisational environment both at the strategic level and the operational level. The advocate of the generic approach could facilitate integration of PM practices with other relevant disciplines such as strategic management, operations management, and change management in organisations. Future work would focus on examining the relative importance among key parameters (such as strategic alignment, project dynamics and value creation), and evaluating the efficacy of the model adoption/implementation with empirical evidence and verification in organisations.
References:
Ackermann, F., and Alexander, J. (2016), “Researching complex projects: using causal mapping to take a systems perspective”

N. Hyatali and K.F.Pun: Exploring Contemporary Perspectives for Managing Projects in Organisations: A Review 82
International Journal of Project Management, Vol.34, pp.891-901
Artto, K. (2013), “A chunk view of research into temporary organisations”, International Journal of Managing Projects in
Business, Vol.6, No.3, pp.595-603 Artto, K., Ahola, T., and Vartiainen, V. (2016), “From the front-
end of projects to the back end of operations: managing projects for value creation throughout the system lifecycle”, International
Journal of Project Management, Vol.34, pp.258-270 Bresnen, M. (2016), “Institutional development, divergence and
change in the discipline of project management”, International
Journal of Project Management, Vol.34, pp.328-338 Cleland, D. I. and Kerzner, H. (1985) A Project Management
Dictionary of Terms, Van Nostrand Davies, A. and Brady, T. (2016), “Explicating the dynamics of
project capabilities”, International Journal of Project
Management, Vol.34, pp.314-327 Fellows, R. and Liu, A. (2016), “Sensemaking in the cross-cultural
contexts of projects”, International Journal of Project
Management, Vol.34, pp.246-257 Garel, G. (2013), “A history of project management models: from
pre-models to the standard models”, International Journal of
Project Management, Vol.31, pp.663-669 Gustavsson, T. K., and Hallin, A. (2015), “Research Note: Goal
seeking and goal oriented projects – trajectories of the temporary organisation”, International Journal of Managing Projects in
Business, Vol.8, No.2, pp.368-378 Hodgson, D. and Paton, S. (2016), “Understanding the
professional project manager: Cosmopolitans, locals and identity work”, International Journal of Project Management, 34: 352-364
Hyatali, N., and Pun, K.F. (2016), “Aligning project quality and risk into business processes: a review of challenges and strategies”, The West Indian Journal of Engineering, Vol.38, No.2, pp.81-92
Jacobsson, M., Burstrom, T. and Wilson, T. L. (2013), “The role of transition in temporary organisations: Linking the temporary to the permanent”, International Journal of Managing Projects in
Business, Vol.6, No.3, pp.576-578 Klakegg, O.J., Williams, T. and Shiferaw, A.T. (2016), “Taming
the ‘trolls’: Major public projects in the making”, International
Journal of Project Management, Vol.34, pp.282-296 Laursen, M. and Svejvig, P. (2016) “Taking stock of project value
creation: A structured literature review with future directions for research and practice”, International Journal of Project
Management, 34: 736-747 Lundin, R.A. and Soderholm, A (1995), “A theory of the
temporary organisation”, Scandinavian Journal of Management, Vol.11, No.4, pp.437-455
Lundin, R.A. and Soderholm, A. (2013) “Temporary organisations and end states: a theory is a child of its time and in need of reconsideration and reconstruction”, International Journal of
Managing Projects in Business, Vol.6, No.3, pp.587-594 Maylor, H., Brady, T., Cooke-Davis, T., and Hodgson, D. (2006),
“From projectification to programmification”, International
Journal of Project Management, Vol.24, pp.663-674 Mishra, P., Dangayach, G.S., and Mittal, M.L. (2011), “An
empirical study on identification of critical success factors in project-based organisations”, Global Business and Management
Research, Vol.3, No.3/4, pp.356-368 Morris, P.W.G. (1994), The Management of Projects, Thomas
Telford, London Morris. P.W.G. (2000), “Researching the unanswered questions of
project management”, In: Conference Proceedings of the PMI Research Conference, Paris
Morris, P.W.G. (2016), “Reflections” International Journal of
Project Management, Vol.34, pp.365-370 Pinto, J.K., and Winch, G. (2016), “The unsettling of “settled
science”: the past and future of the management of projects”, International Journal of Project Management, Vol.34, pp.258-270
PMI (2013), A Guide to the Project Management Body of
Knowledge, Project Management Institute, Newtown Square, PA Samset, K., and Volden, G.H. (2016), “Front-end definition of
projects: ten paradoxes and some reflections regarding project management and project governance”, International Journal of
Project Management, Vol.34, pp.297-313 Turner, J.R. (2009), The Handbook ofProject-based Management:
Leading Strategic Change in Organisations, McGraw Hill, New York
Turner, R., and Muller, R. (2003), “On the nature of the project as a temporary organisation”, International Journal of Project
Management, Vol.21, pp.1-8 Whyte, J., Stasis, A. and Lindkvist, C. (2016), “Managing change
in the delivery of complex projects: Configuration management, asset information and ‘big data’” International Journal of Project
Management, Vol.34, pp.339-351 Winch, G.M. (2014), “Three domains of project organising”
International Journal of Project Management, Vol.32, pp.721-731
Winch, G. and Leiringer, R. (2016), “Owner project capabilities for infrastructure development: A review and development of the “strong owner” concept”, International Journal of Project
Management, Vol.34, pp.271-281 Winter, M., Smith, C., Morris, P., and Cicmil, S. (2006a),
“Directions for future research in project management: the main findings of a UK government-funded research network”, International Journal of Project Management, Vol.24, pp.638-649.
Winter, M., Andersen, E. S., Elvin, R., and Levene, R. (2006b) ,“Focusing on business projects as an area for future research: an exploratory discussion of four different perspectives”, International Journal of Project Management, Vol.24, pp.699-709
Authors’ Biographical Notes:
Neisha Hyatali is a MSc. graduate in Project Management and is
currently pursuing an MPhil/PhD in the same discipline at The
University of the West Indies. Her research interests extend not
only to project management and related areas such as quality
management, risk management and value management but also to
its the application within the business/organisational setting
including its influence on other disciplines such as strategic
management, resource management, operations management, and
process management.
Kit Fai Pun is Professor of Industrial Engineering of the Faculty
of Engineering at The University of the West Indies. He is a
member of Caribbean Academy of Science and a Fellow/member
of several professional bodies and learned societies. His research
interests and activities include industrial engineering, engineering
management, quality systems, performance measurement,
innovation, and information systems.
■

E.I. Ekwue, A. Ramsumair, and R. Birch: Effects of Water Content and Compaction on Ball Movement on Major Cricket Pitch Soils in Trinidad 83
Effects of Water Content and Compaction on Ball Movement on Major
Cricket Pitch Soils in Trinidad
Edwin I. Ekwue a,Ψ, Amar Ramsumairb, and Robert A. Birch c
Department of Mechanical and Manufacturing Engineering, Faculty of Engineering, The University of the West Indies, St Augustine, Trinidad and Tobago, West Indies;
aE-mail: [email protected] bE-mail: [email protected]
cE-mail: [email protected]
Ψ Corresponding Author
(Received 28 August 2016; Revised 19 December 2016; Accepted 5 January 2017)
Abstract: The effect of compacting five soils (with clay content ranging from 46% to 80%) to three levels (5, 15 and 25
Proctor compaction blows) at three water content levels (-5% plastic limit, plastic limit and +5% plastic limit) on cricket
ball bounce, pace (speed) and turn was investigated in a simulated cricket pitch. This study follows an earlier one, by the
lead author and others, which measured the physical and engineering properties of major soils used in cricket pitches in
Trinidad and makes predictions on the nature of ball movement on them. The present study examines whether these
predictions could be confirmed when the actual ball movements are measured. Mean values of ball bounce increased from
57.2 cm in soil with the lowest clay content (45.8%) up to 80.8 cm in soil with 62.3% clay content and then declined to 68.9
cm in the soil with 80% clay content. Mean values of ball pace followed the same trend and increased from 74.8 km/hr to
79.9 km/hr and then declined to 73.6 km/hr in the same soils. Mean ball bounce and pace of the ball increased with
increasing compaction effort from 64.6 cm, 73.0 km/hr for the 5 Proctor blows to 74.5 cm and 79.2 km/hr for the 25 Proctor
blows. The highest values of mean ball bounce (76.8 cm), pace (78.4 km/hr) and turn of the ball (70.0 cm) occurred at the
plastic limit of the soils. Results obtained in this study coupled with those from the previous study mentioned above were
used to rank the soils used in cricket pitches in Trinidad in terms of their playability. There may be an optimal clay content
(about 60%) of soil for maximum bounce and pace of the cricket ball.
Keywords: Cricket, pitch, compaction, clay, Trinidad
1. Introduction
It is well known that good Cricket can only be played on good pitches. A cricket pitch is a prepared strip of compacted soil and closely mown turf onto which the bowler propels the ball. Cricket pitches should be prepared hard and flat to produce a good playing surface (Shannon, 2015). The surface is of fundamental importance to the game, and ground staff seeks to ensure that the ball’s rebound is of sufficient pace, bounce and consistency to promote skill in both the batsman and bowler (James et al., 2005). Cricket pitches should have a good pace, consistent bounce, good ball carry and conducive for stroke play (Singh, 2014). Cricket pitches are usually made of clay soils that swell when wet and shrink when dry. When the pitch begins to dry out after rolling, the density increases and it becomes harder and denser and provides a good cricket pitch (Shipton and James, 2009). This natural turf pitch is of large importance to the play of the game and the quality of the surface is a major concern of players, officials, commentators and spectators alike. It is accepted that several factors are involved in the construction of cricket pitches.
Preparation of cricket pitches is an art form solely dependent on the experience of the ground curators.
Scientific measurements of water content, compaction, infiltration rates and other parameters are now being encouraged worldwide in the preparation of cricket pitches. Currently, the game demands a fair, precise, durable and sometimes predictable pitch in order to achieve a successful match for both batsmen and bowlers. A detailed study of soil properties used in cricket pitches is very important to help in advising curators in their preparation and maintenance of pitches. Previous studies in this field made progress in identifying factors that affect pitch character. Stewart and Adams (1968) conducted a series of tests on cricket pitches immediately after first- class matches. The authors were unable to obtain objective data on the performance of pitches (that is pace, bounce and consistency) and relied on the subjective accounts of players and match officials.
The work by Tainton et al. (1998) in South Africa provided useful guidelines on the preparation of cricket pitches and particularly on how soil engineering properties affect the performance of cricket pitches. They reported that an ideal cricket pitch should have 50 to 60% clay, less than 10% coarse sand, less than 5% calcium carbonate, and sodium levels, a linear shrinkage of 0.08 to 0.15 and less than 5% organic matter content.
ISSN 0511-5728 The West Indian Journal of Engineering
Vol.39, No.2, January 2017, pp.83-89

S. Sahadeo et al.: Survey and Modeling of Protected Agriculture Environment Systems in Trinidad and Tobago
84
Shipton and James (2009) studied soil behavior of clay used in cricket pitches in England and Wales and provided guidelines for the rolling of cricket pitches. Ekwue et al. (2006) reported the results of physical and engineering properties of soils commonly used in cricket pitches in Trinidad and used the paper by Tainton et al. (1998) and others to make inferences on the suitability of these soils for use in cricket pitches as well as offer advice on the management of cricket pitches.
These inferences are appropriate to our local conditions since in the West Indies, Cricket is mostly played during the dry season which corresponds to the summer period in South Africa investigated by Tainton et al. (1998). The present study continues the earlier study by Ekwue et al. (2006) by placing five of the six soils on simulated cricket pitches, wetting and compacting them and measuring the bounce, speed and turn of the cricket ball using cricket bowling machines and bounce meters. This reveals how the various preparation methods of cricket pitches affect ball movement and possibly confirm the inferences made earlier on ball movement by the authors.
2. Materials and Methods
Samples from five soils used in an earlier study by Ekwue et al. (2006) were collected. The soils, clay mineralogy and classification are presented in Table 1. Four of the soils (Frederick clay, Sevilla clay, Princes Town clay and Integrade clay) are the most commonly used in cricket pitches in Trinidad. The fifth soil (i.e, Talparo clay) was chosen to assess cricket pitch suitability and ball movement seeing that it is one of the most extensive soils in Trinidad but not used in cricket pitches. The soils were collected after removing the top
5 to 10 cm depth, since the top layers contain organic materials which could affect soil behavior and ball movement. The soils were air-dried and ground to pass a 5-mm sieve. Particle-size distribution (Table 2) was performed using the hydrometer method (Lambe, 1951). Also included in Table 2 are the Atterberg limits of the soils determined by Ekwue et al. (2006) for the same soils using standard soil test methods.
To determine the maximum bulk density and soil strength after compaction for each soil, the standard Proctor compaction test (Lambe, 1951) was adopted and the results are shown in Table 3. The simulated cricket pitch was constructed with 19 mm thick plywood 0.6 m in width by 0.6 m in length and 10 cm deep. The soil was filled to a depth of 8.3 cm. Based on research carried out, it was found that the impact force from a ball hitting the pitch goes down to a maximum depth of 7 cm. For the tests, all soils were tested at three water contents (-5% plastic limit; plastic limit and +5% plastic limit (see Table 2) and compacted in three layers using 5, 15 and 25 Proctor blows. The plastic limits were close to the optimum water contents for maximum soil compaction of the five test soils (see Tables 2 and 3). A bowling machine was used to perform the tests in the simulated cricket pitch (see Figure 1). A special ball was used for the bowling machine which was the same size and weight of a regulation cricket ball. The bowling machine was first calibrated so that it would hit the area where the simulated pitch was placed. The speed was set at 97 km hr
-1 so that there was no spin bias and to ensure that the ball travelled straight. As the ball was fired, it hit the pitch and the point of impact was recorded using a thumb-tack
Table 1. Mineralogy and classification of the cricket pitch soils
Soil Name Sample Location Clay Mineralogya Soil Classificationb
Frederick clay Felicite Section, Felicity, Chaguanas Mixed Aquentic Chromuderts
Sevilla clay Buen Itento Cane Field, Princes Town Montmorillonite Aquentic Chromuderts
Talparo clay Cedar Hill, Princes Town Mixed Aquentic Chromuderts
Princess Town clay Usine Ste. Madeline Cane Land Montmorillonite Aquentic Chromuderts
Integrade clay Harmony Hall Mixed Mixed aClay minerology identified by Smith (1983). bClassification according to Soil Survey Staff (1999). cMixture of Princess Town and Sevilla Clay.
Table 2. Some properties of the cricket pitch soils
Soil Name Sand Silt Clay Shrinkage Plastic Liquid Plasticity Swell
(2 - 0.05) (0.05 - 0.002) (< 0.002) Limit Limit Limit Index
mm mm mm (%) (%) (%) (%) (%) (%) (%) (%)
Frederick clay 5.0 15.0 80.0 19.7 34.0 82.2 48.2 35.0
Sevilla clay 6.8 25.5 67.7 33.5 29.4 70.8 41.4 20.5
Talparo clay 14.3 23.4 62.3 33.3 26.6 57.8 31.2 21.0
Princess Town clay 3.4 39.5 57.1 26.9 27.8 91.2 63.4 39.0
Integrade clay 5.6 48.6 45.8 28.3 33.7 70.4 36.7 36.0
Source: Ekwue et al. (2006)

S. Sahadeo et al.: Survey and Modeling of Protected Agriculture Environment Systems in Trinidad and Tobago
85
Table 3. Values of maximum bulk density, and optimum water contents
Sample Name Compaction level Maximum bulk density, ρmax Optimum water content
(Proctor blows) (Mg m-3) for maximum compaction (%)
5 1.39 32.5
Frederick clay 15 1.41 31.0
25 1.44 30.0
5 1.32 29.5
Sevilla clay 15 1.39 27.0
25 1.43 23.5
5 1.48 28.0
Talparo clay 15 1.52 26.5
25 1.55 23.5
5 1.27 34.5
Princess Town clay 15 1.33 31.0
25 1.37 28.5
5 1.36 30.0
Integrade clay 15 1.42 29.0 25 1.44 28.0
Source: Ekwue et al. (2006)
Figure 1. Front view of the bowling machine (left) and the control module located at the back of the machine (right)
The point of impact of the ball on a tarp (tarpolin-
made surface) further down the track was simultaneously recorded. The horizontal distance from the point of impact on the pitch to the tarp as well as the vertical height of the impact of the ball to the ground was measured using a measuring tape. Calculations were made to obtain the height the ball bounced in 300 cm. A radar gun was set up and aimed just after the simulated pitch. This was used to obtain the speed of the ball, after the ball was released and hit the pitch. To test the ball turn, the setting of the bowling machine was adjusted to deliver the ball with turn. The amount of turn on the machine was set to a rating of 7 out of a maximum of 9. The line from the middle stump, which was projected straight through the pitch, was used as the reference point. The horizontal distance moved in a fixed vertical plane was measured as the turn of the ball. Each of these tests on the cricket pitches was performed twice and the average values are reported. 3. Results and discussion
The values of bounce, speed and turn of the cricket ball for the five soils at different compaction efforts and water contents are presented in Table 4. Table 5 shows the mean values of these parameters for the different experimental factors. The trend in the results in Tables 4 sand 5 show that the bounce and speed of the ball increased with increasing clay content up to the Talparo soil (with 62% clay content) and declined as the clay content increased to 68% for Sevilla Clay and 80% for Frederick clay. The Talparo clay had the highest mean speed after impact of 79.9 km hr-1, from the original launch speed of 97 km/hr, showing that this soil was able to retain 83% of the original speed. Tainton et al. (1998) and Shipton and James (2009) reported that the bounce of the cricket ball increases with increasing clay content of the soil.
This is because clay soils could be compacted to very high bulk densities. Table 3 shows that Talparo was compacted to 1.55 Mg m-3 and this is the highest for all the five soils tested. Shipton and James (2009) postulated that the best cricket pitches for bounce and speed would be cricket pitches with 50% and 75% clay contents in Melbourne and Perth, Australia respectively. They stated that unlike in the UK where cricket pitches seldom have up to 30% clay contents, clay contents in cricket pitches in countries like Australia could be much higher possible because after rolling the pitches, there is enough temperature to dry the pitches before matches. The same argument holds for the Caribbean countries with high temperatures. The present study, however, shows that there may be optimal clay content (about 60%) of soil for maximum bounce and pace of the cricket ball. Tainton et al. (1998) reported that an ideal cricket pitch should have 50% to 60% clay content.
Conversely, the mean turn decreased with increasing clay content of the soil. Tainton et al. (1998) obtained a similar result and concluded that the greater the clay content of the pitch, the greater the tendency of

S. Sahadeo et al.: Survey and Modeling of Protected Agriculture Environment Systems in Trinidad and Tobago
86
Table 4. Bounce, speed and turn recorded for the five soils at varying water contents and compaction levels
Soil Name
Water content Bounce (cm) Pace (Speed, km h-1) Turn (cm)
(%)
Compaction Effort (Proctor blows) Compaction Effort (Proctor blows) Compaction Effort (Proctor blows)
5 15 25 5 15 25 5 15 25
Frederick 29.0 41.7 43.3 46.3 68.0 69.7 70.2 51.1 56.8 53.9
clay 34.0 73.8 83.2 85.9 74.0 76.1 79.2 72.9 76.7 72.5
39.0 73.2 84.7 88.1 73.5 74.5 77.2 70.7 72.7 72.8
Sevilla 24.4 54.3 58.0 64.4 71.3 71.3 73.5 64.3 70.2 71.7
clay 29.4 65.6 71.4 76.0 77.7 78.8 81.5 63.9 64.8 64.1
34.4 69.8 66.3 74.6 73.5 76.7 79.3 63.2 74.7 70.2
Talparo clay
21.6 60.8 63.3 70.8 75.1 77.2 79.3 75.8 82.1 77.4
26.6 87.5 86.8 93.7 79.3 82.6 88.4 64.9 68.7 64.9
31.6 84.8 85.9 93.2 77.7 78.8 81.0 65.6 58.6 53.1
Princes Town clay
22.8 55.2 58.5 65.4 72.9 74.0 75.1 70.5 76.1 72.5
27.8 72.5 80.1 85.5 70.8 79.3 83.6 62.2 73.6 69.8
32.8 72.9 83.2 86.9 71.3 76.1 79.9 65.7 69.8 76.4
Integrade 28.7 28.2 45.6 48.5 71.9 74.5 79.4 62.1 65.3 45.4
clay 33.7 58.7 63.7 67.7 68.6 76.1 80.4 71.9 83.8 76.1
38.7 56.9 62.2 70.9 68.6 74.0 79.3 71.8 72.6 65.6
Table 5. Mean values of bounce, speed and turn for the different experimental factors
Factor level Mean bounce (cm) Mean speed (km/h) Mean Turn (cm)
Soil Name Frederick clay 68.9a 73.6 66.7
Sevilla clay
Talparo clay
Princes Town clay
Integrade clay
66.7
80.8
73.4
57.2
76.0
79.9
75.9
74.8
67.5
67.9
70.7
70.8
Water Level 5% below Plastic Limit 54.5 73.6 67.8
Plastic Limit 76.8 78.4 70.0
5% above Plastic Limit 76.9 76.1 68.2
Compaction Proctor blows 5 64.6 73.0 66.4
15 69.1 76.0 71.1 25 74.5 79.2 68.6
a Mean values for each factor were obtained by averaging the measured values over the levels of the other two experimental factors.
the pitch to powder and crumble as it dries. This increases the tendency of the pitch to encourage spin.
Higher bounce of the ball was obtained at the plastic limit of the soil and 5% above the plastic limit, while a significantly lower bounce was obtained for the 5% below plastic limit. This could have occurred because at 5% water content below the plastic limit, the water was not enough to fully bind the clay particles together, hence making some of the particles fairly loose. The loose particles would have cushioned the impact of the ball, making it bounce lower. It was observed that the highest speed and spin of the ball was obtained at the plastic limit of the soil. This is plausible, as at the plastic limit, the soil behaves as one solid mass. Below the plastic limit, the soil may still powder and crumble, which can cause the ball to be cushioned on impact. This would slow the speed of the ball.
However, at the 5% above the plastic limit, the soils begin to approach their liquid limits. Hence, the soil itself begins to act as a liquid, causing the soil again to cushion the impact of the blow, or even cause the clay particles to briefly stick to the ball and provide a resistive force. Shipton and James (2009) and Singh (2014) advised groundsmen not to roll the soil when it is too dry, since the soil will be too dry to be compacted or too wet (greater than the optimum water content for maximum compaction) since the soil cannot be compacted because there is no air to be compacted. This confirms that the plastic limit or the optimum water content for maximum compaction is the best water content to roll the soil.
Bounce and speed of the cricket ball increased with increasing level of compaction effort applied to the soils and this has been found in previous studies by Tainton et al. (1998) and Shipton and James (2009). As the soil is

S. Sahadeo et al.: Survey and Modeling of Protected Agriculture Environment Systems in Trinidad and Tobago
87
compacted further, the more the individual particles act as one single entity. That is, there are less individual particles to cushion, or absorb impact energy from the ball. Instead, the soil in the pitch acted as one smooth, hard surface where the ball was allowed to freely bounce, with minimal resistance. With lower resistance, the ball was able to maintain most of its initial kinetic energy and hence bounced higher, and at a faster speed. With respect to turn, however, the maximum turn was obtained at the middle level of compaction that at 15 Proctor blows compaction.
At the lower level of compaction (5 blows), the soil may have been too loose and could have absorbed most of the impact. The ball would have partially sunk into the pitch when it bounced, which would have then applied a large resistive force to a greater area of the ball, making the speed and rotation of the ball to reduce. This would have caused the ball to turn significantly less. For the higher level compaction (25 blows), it is possible that the pitch may have become too hard and smooth for turn. It is well known that cricket pitches that favour turn tend to be not as hard as those that favour pace. If the pitch was too smooth, it is possible that the spinning ball did not achieve a good enough grip with the surface. This would cause the ball to skid and not achieve its maximum turning potential. At the middle level of compaction (15 blows), it is possible that there was just enough compaction to prevent the ball from being cushioned and losing too much energy, while proving the optimum environment for the ball to get a proper grip while spinning and turn effectively.
The analysis of variance showed (see Table 6) that the main effect of soil, water content level and compaction effort were all significant at 1% level for bounce, speed and turn as depicted by the ‘F’ values. However, the level of importance of each factor was different for the three parameters. Water content level was the most important factor for bounce while compaction effort was the most important factor for speed and turn. In addition, the most important interaction for the three parameters was the one between soil and water content level and this is examined further below.
The interaction between soil water level and soil type on bounce of the ball (see Figure 2) shows clearly that for most of the soils, the maximum bounce of the ball was obtained at the plastic limit making this water
content the ideal one for cricket pitch preparation. Evans (1991) reported that cricket pitches are usually prepared at levels just above their plastic limits. This is normally close to the optimum water content of the soil which is also recommended for cricket pitch preparation (Shipton et. al., 2006; Shipton and James, 2009). The graph shows that Talparo clay is clearly the best soil for bounce out of all the five soils, while the Integrade soil was the worst. Frederick clay had the highest rate of increase of bounce as the water content increased from 5% below plastic limit to the plastic limit. Similar results obtained for bounce were also reported for speed and turn.
Results of the study showed that the properties of the soils used as cricket pitches in Trinidad vary a lot in terms of bounce, speed and turn of the cricket ball. Ekwue et al. (2006) found similar varied results in the physical and engineering properties of these soils. These authors found that the best soil for cricket in terms of the soil properties studied was the Sevilla clay but the results of the present study showed that Talparo clay would be the best soil in terms of bounce and speed of the ball while the Sevilla clay is the second best in terms of speed. Integrade soil was the best in terms of turn of the ball.
Figure 2. The effect of interaction between water content level and
soil name on the bounce of cricket ball
Table 6. ‘F’ values in the analysis of variance for bounce, speed and turn
Sources of variation Degrees of freedom Bounce Speed Turn
Soil 4
401.8 118.7 10.0 Water content level 2
1490.4 207.2 6.3
Compaction 2
221.6 334.5 24.7 Soil x Water content level 8
55.5 22.1 59.2
Soil x compaction 8
4.2 13.6 3.7 Water content level x compaction 4 1.9a 17.6 2.4a

S. Sahadeo et al.: Survey and Modeling of Protected Agriculture Environment Systems in Trinidad and Tobago
88
Talparo clay is not popular for use in cricket pitches in Trinidad. It is widely an agricultural soil. Ekwue et al. (2006) reported that the percentage clay (62%, Table 2) and silt (23%) seem right for cricket pitches but its high sand content (14.3%) could introduce soil looseness. It responds well to compaction (1.55 Mg m-3, Table 3) and this has made it to have the highest bounce and speed of the cricket pitch. It could someday be commonly used in cricket pitches.
Ekwue et al. (2006) reported that the Sevilla clay has good clay content (68%) and yet little swelling characteristics. The liquid limit and the plasticity index of the soil are high, indicating good soil binding strength (see Table 2). However, it could not be compacted because of its high density (1.43 Mg m-3) leading to relatively lower bounce but enabling a good pace or speed of the ball. Apart from the Integrade soil, the clay content of the Princess Town clay (57%) is the lowest, but is well within the 50 to 60% clay limits desirable for cricket pitches. The high silt content (39.5%) could lead to surface deterioration of the pitch. The high plasticity index (63%) indicates a strong binding strength and although its surface may crumble and become dusty, the soil mass could still maintain its smooth surface. As stated by Ekwue et al. (2006), this is presently the most popular type of soil used in cricket pitches in Trinidad, and was found to be the second best soil based on its measured physical and engineering properties. It has been shown in the present study to have the second highest bounce and turn of the ball.
The Frederick clay has highest clay content (80%). The compactibility of this soil (1.44 Mg m-3) is acceptable and the high plasticity index (48%) indicates good binding strength. The swelling property is also acceptable (35%, Table 2), but because of the high clay content, and its low shrinkage limit (19.7%), cracking could occur easily, but this may not cause serious pitch deterioration. The soil will make for a durable, fast paced pitch as well as provide even bounce and possess good binding strength. Ekwue et al. (2006) rated this soil the third best based on the soil properties studied and this study has also shown that it had the third highest bounce of the ball.
Ekwue et al. (2006) reported that the Integrade clay was the worst of the five soils in terms of soil physical and engineering properties of the soil. It has the lowest clay content (46%). This has been confirmed in this study as the soil had the lowest value of bounce and the second lowest value of speed out of the five soils studied. This soil is a mixture of Princess Town and Sevilla clay. Based on the percentage of clay and silt, this soil does not seem durable for a cricket pitch; it could not be compacted to a high density, may not hold much water because of little clay and the present tests have confirmed that it will have a low bounce and speed if used in cricket pitches.
4. Conclusion
Ball movement, in terms of bounce and pace, was highest for the Talparo soil with 62.3% clay content and this seems to be the optimal clay content for laying cricket pitches in Trinidad. This was closely followed by Princes Town clay which is the most common soil used in cricket pitches in Trinidad. The worst is Integrade clay. Ball movement was best when soils were compacted at the plastic limit and at the highest compaction effort.
References:
Ekwue, E.I., Lall, D.Z. and Stone, R.J. (2006), “Engineering properties of major soils used in cricket pitches in Trinidad.” West Indian Journal of Engineering, Vol.28, No.2, pp.27- 40.
Evans, R.D.C. (1991), Cricket Grounds: The Evolution,
Maintenance and Construction of Natural Turf Cricket Tables
and Outfields. Assessed August 7, 2016, from https://www.amazon.com/Cricket-Grounds-Evolution-Maintenance-Construction/dp/1873431007
James, D.M., Carre, M.J. and Haake, S. (2005), “Predicting the playing characteristics of cricket pitches”, Sports Engineering, Vol.8, No.4, pp.193- 207.
Lambe, T.W. (1951), Soil Testing for Engineers, Wiley, New York
Shannon, J. (2015), Basic Guide to Turf Cricket Pitch Preparation, Accessed December 19, 2016, from http://www.slideshare.net/debbieanhall/basic-guide-to-turf-cricket-preparation
Shipton, P., James, I. and Vickers, A. (2006), “The mechanical behavior of cricket soils during rolling”, In: Moritz, E.F. and Haake, S. (eds), The Engineering of Sport: 6 Development of
Sports, Vol.1, Springer, UK, p.229- 234, Shipton, P. and James, I. (2009), Guidelines for Rolling in Cricket,
Version 1.0, Centre for Sports Surface Technology, Cranfield University, Assessed August 7, 2016, from,
https://www.google.tt/?gfe_rd=cr&ei=2L2nV-SjJsKw8weZq7jgCA&gws_rd=ssl#q=guidelines+for+rolling+in+cricket
Singh, S.B. (2014), “A comparative analysis of physical, chemical, mineralogical and engineering properties cricket pitches laid on traditional or conventional methods vs the desired scientific methods based on recent research and developments”, International Journal of Science and Research, Vol.3, No.7, pp.1830-1835.
Smith, G.D. (1983), Soil and Land Use Surveys No. 27:
Correlation of the Soils of the Commonwealth Caribbean, , Puerto Rico, The Virgin Islands and Guyana, August Publications, Farnham, England, p.42- 43.
Soil Survey Staff (1999), “Soil taxonomy: A basic system for making and interpreting soil surveys”, In: Agriculture Handbook, 2nd Edition, US Govt. Printing Office, USDA, Washington-DC, pp.128-129.
Stewart, V.I. and Adams, W.A. (1968), “County cricket wickets”, Journal of Sports Turf Research Institute, Vol.44, pp.49-60
Tainton, N.M., Klug, J.R., Edmondson, D., Campbell, R.K., van Devener, P.W. and de Beer, M.J (1998), Principles and Practice
of Pitch Preparation, Accessed December 19, 2016, from, http://static.espncricinfo.com/db/ABOUT_CRICKET/PITCHES/PREP_OF_PITCHES.html.
Authors’ Biographical Notes:
Edwin I. Ekwue is currently Professor and Coordinator of the
Bio-systems Engineering programme at The University of the West
Indies (UWI), St Augustine, Trinidad and Tobago. He is also
Deputy Dean, Research and Post Graduate Student Affairs in

S. Sahadeo et al.: Survey and Modeling of Protected Agriculture Environment Systems in Trinidad and Tobago
89
Faculty of Engineering. He is the immediate past Head of the
Department of Mechanical and Manufacturing Engineering. He is
a member of the Editorial Board of the West Indian Journal of
Engineering. His specialties are in Water Resources, Hydrology,
Soil and Water Conservation and Irrigation and Drainage. His
subsidiary areas of specialisation are Structures and Environment,
Solid and Soil Mechanics, where he has teaching capabilities.
Professor Ekwue has served as the Deputy Dean for
Undergraduate Student Affairs and Post-graduate Affairs and
Outreach, the Chairman of Continuing Education Committee, and
the Manager of the Engineering Institute in the Faculty of
Engineering at The UWI.
Amar Ramsumair has graduated with a BSc. in Mechanical
Engineering from The UWI, St Augustine, Trinidad and Tobago.
He is desirous of furthering his engineering studies.
Robert A. Birch is an Instructor in the Department of Mechanical
and Manufacturing Engineering at The UWI, St Augustine,
Trinidad and Tobago. He is a registered Professional Engineer
(R.Eng) and Project Management Professional (PMP) with over
twenty years of industrial and teaching experience. He has a BSc.
(Eng) and MPhil in Agricultural Engineering from The University
of the West Indies and is pursuing a PhD in Mechanical
Engineering. Mr. Birch is a member of the Institution of
Agricultural Engineers (UK). His interests are in Fluid Power
Technology, Bio-systems Engineering with particular attention to
Machinery design, testing and development for Earth-working and
Agro-processing.
■

Call for Papers: Special Issue on Capstone Projects of Engineering and Associated Disciplines in the Caribbean 90
WEST INDIAN JO URNAL O F ENGINEERING Volume 40 Number 2, January 2018; ISSN 0511 5728
CALL FOR PAPERS Special Issue on “Capstone Projects of Engineering and Associated Disciplines in the Caribbean”
The capstone project is a significant component in Engineering/Technology programme curricula, and provides opportunities to both undergraduate and postgraduate students at universities to develop professional skills like problem solving, analysis, synthesis and evaluation. Though the administration and management of capstone projects vary widely across the globe, the underlying spirit remains the same; that is to allow the student to work on a specific topic with little or no teaching; but under direct supervision of the academic staff.
Capstone projects provide a unique opportunity for students to work on own or with in groups on a chosen topic and to investigate, find, contribute to the engineering society. Even engineering professional accreditation bodies (like, the Instititution of Chemical Engineers (IChemE), the Joint Board of Moderators (JBM), the Institution of Engineering and Technology (IET), the Institution of Mechanical Engineers (IMechE), of the UK, the Accreditation Board for Engineering and Technology (ABET) in the USA, and the European Network for Accreditation of Engineering Education (ENAEE) in the Europe, etc) scrutinize the student capstone projects with great emphasis on the development or demonstration of professional maturity; mastery of engineering knowledge/tools; and effective presentation and communication skills.
The prime objective of this special issue is to publish original research, works and empirical results arising from student capstone projects and experiences from the extended areas of Agricultural and Biosystem Engineering, Chemical and Process Engineering, Civil Engineering, Coastal Engineering, Computer and Electrical Engineering, Environmental Engineering, Geomatics Engineering, Industrial Engineering, Mechanical Engineering, Manufacturing Engineering, Petroleum Engineering, Production Engineering, and associated disciplines (like Construction Management, Engineering Management, Engineering Asset Management, Food Science & Technology, Land Management, Petroleum Geoscience, Project Management, Surveying, Urban & Regional Planning, Water & Wastewater Services Management). Contributed papers may deal with but are not limited to:
Submission Guidelines
Original Papers, relevant to the theme, are invited. Submitted papers should not have been previously published nor be currently under consideration for publication in any other journal. Manuscripts should be in English and should not normally exceed 6,000 words in length. All contributions will be subject to a double blind review process, thus there should be a separate title page giving the names and addresses of the authors. Manuscripts must be submitted electronically via email, in both Word document and pdf formats, to the Editor no later than 30th June 2017. The submission should follow the "Notes and Guidance for Authors" which can be found on the Journal home page: http://sta.uwi.edu/eng/wije/. Authors are invited to access and build upon the insights and wisdom of authors who have published in the WIJE.
Important Dates:
• Submission of full papers: 30th June 2017
• Begin review and revision process: July/August 2017
• Submission of revised papers: September/October 2017 • Final decision notification: October/November 2017
• Publication of the Special Issue: January 2018 For submission and enquiries, send to:
Professor Kit Fai Pun, Editor, The West Indian Journal of Engineering, c/o Faculty of Engineering, University of the West Indies, St Augustine Campus, Trinidad & Tobago West Indies
Fax: (868) 662 4414; E-mails: [email protected]; [email protected]
• Building prototypes with standard designs and technologies
• Case studies in engineering work and projects • Design analysis of engineering products • Design and build working prototypes, products or
processes • Development of add-on components, toolboxes
for computational or development platforms, like MATLAB
• The use of International standards • Engineering technology projects focusing on
prototype development • Management experiences of administering capstone
projects. • Prototype development with full or partial product
functionality • Capstone projects involving industry interaction,
collaborations and/or partnership

Subscription Order Form Please enter my Annual subscription to the forthcoming Volume (2 Issues).
• US$15.00 or equivalent in Trinidad and Tobago Dollars (Local subscription)
• US$25.00 (By airmail)
• Payment enclosed. Amount equivalent TT$/US$ (Cheque, Bank draft)
• Send pro-forma invoice for despatch Please make cheque payable to The West Indian Journal of Engineering. Name: ______________________________________________________________________ Profession: ___________________________________________________________________ Areas of Specialisation: _________________________________________________________ Address:______________________________________________________________________
Telephone: _______________ Fax: __________________ E-mail: ______________________ ---------------------------------------------------------------------------------------------------------------------
(Cut along this line)
Change of Address
Please note that my new postal address is:- __________________________________________
instead of:- ___________________________________________________________________ ---------------------------------------------------------------------------------------------------------------------
(Cut along this line)
Send orders and/or change of address forms to: The Editorial Office, The West Indian Journal of Engineering, Block #1, Faculty of Engineering, The University of the West Indies, St. Augustine, Trinidad and Tobago, West Indies. Orders must be accompanied by payment which should be in Trinidad and Tobago (TT) Dollars or its equivalent at the time of order in US Dollars. Despatch of issues will commence only after receipt of payment.
For further information, contact:
Professor Kit Fai Pun, The Editor-in-Chief, The Editorial Office, West Indian Journal of Engineering, c/o Faculty of Engineering,
The University of the West Indies, St Augustine, Trinidad and Tobago, W.I.
Tel: (868) 662-2002 Exts-83459/82069 • Fax: (868) 662-4414 E-mails: [email protected]; [email protected]

Notes and Guidance to Authors
The West Indian Journal of Engineering, WIJE (ISSN 0511-5728)
Copyright:
Articles submitted to The West Indian Journal of Engineering, WIJE (ISSN
0511-5728) should be original contributions and should not be under
consideration for any other publication at the same time. Authors
submitting articles for publication warrant that the work is not an
infringement of any existing copyright and will indemnify the publisher
against any breach of such warranty. For ease of dissemination and to
ensure proper policing of use, papers and contributions become the legal
copyright of the publisher unless otherwise agreed. Submissions should be
sent to:
The Editor-in-Chief:
Professor Kit Fai Pun, c/o WIJE, Faculty of Engineering, The University of the
West Indies, St Augustine, Trinidad and Tobago, West Indies. Tel: 1-868-662-
2002 exts-82069/83459; Fax: 1-868-662-4414; E-mails: [email protected];
Editorial Aim and Policy:
The WIJE is an international journal which has a focus on the Caribbean
region. Since its inception in 1967, it is published twice yearly by the Faculty
of Engineering at The University of the West Indies and the Council of
Caribbean Engineering Organisations in Trinidad and Tobago.
WIJE aims at contributing to the development of viable engineering
skills, techniques, management practices and strategies relating to
improving the performance of enterprises, community, and the quality of
life of human beings at large.
Apart from its international focus, WIJE also addresses itself specifically
to the Caribbean development by identifying and supporting emerging
research areas and promoting various engineering disciplines and their
applications in the region.
WIJE welcomes the submission of papers in various engineering
disciplines and related areas. Emphasis is placed on the publication of
articles which seek to link theory with application or critically analyse real
situations with the objective of identifying good practice cross different
engineering and related disciplines.
Articles may be of a theoretical nature, be based on practical
experience, report a case study situation or report experimental results. The
prime requirement for acceptance of an article will not be its form but
rather that it:
(1) makes a significant original contribution to the field of engineering
and the advancement of engineering practices;
(2) is directly relevant to engineering, engineering management and
technology, and related areas;
(3) contains elements which have general application;
(4) is within the scope of the journal; and
(5) has generally not been published previously except in very limited
circulation.
The reviewing process: Each paper is to be reviewed by the Editor-in-Chief and, if it is judged
suitable for this publication, it is then sent to two referees for double-blind
peer-review. Based on their recommendations, the Editor-in-Chief then
decides whether the paper should be accepted as is, revised or rejected.
Manuscript requirements: Full manuscript should be submitted in double line spacing with wide
margins. The names of author(s) and their details-- brief autobiographical
note, affiliation, e-mail address and full international contact details must
appear on a sheet separate from the article. The author(s) should not be
identified anywhere else in the article. To facilitate the reviewing processes,
submissions via e-mail are advisable.
As a guide, technical/research papers should be between 3,000 and
6,000 words in length. Shorter articles (Communications, Discussions, Book
Reviews, etc.) should be between 500 and 2,000 words. Please provide the
word count on the first page of your paper. A title of not more than eight
words should be provided.
Authors must supply a structured abstract. Maximum is 250 words in
total. In addition provide up to six keywords which encapsulate the
principal topics of the paper and categorise your paper. Headings must be
short, clearly defined and not numbered. Notes or Endnotes should be
used only if absolutely necessary and must be identified in the text by
consecutive numbers, enclosed in square brackets and listed at the end of
the article.
All Figures (charts, diagrams and line drawings) and Plates
(photographic images) should be submitted in both electronic form and
hard-copy originals. Figures should be of clear quality, in black and white
and numbered consecutively with Arabic numerals.
Figures created in MS Word, MS PowerPoint, MS Excel, Illustrator and
Freehand should be saved in their native formats.
Electronic figures created in other applications should be copied from
the origination software and pasted into a blank MS Word document or
saved and imported into an MS Word document by choosing "Insert" from
the menu bar, "Picture" from the drop-down menu and selecting "From
File..." to select the graphic to be imported.
For figures which cannot be supplied in MS Word, acceptable
standard image formats are: pdf, ai, wmf and eps. If you are unable to
supply graphics in these formats then please ensure they are tif, jpeg, or
bmp at a resolution of at least 300dpi and at least 10cm wide.
To prepare screen shots, simultaneously press the "Alt" and "Print
screen" keys on the keyboard, open a blank Microsoft Word document
and simultaneously press "Ctrl" and "V" to paste the image. (Capture all the
contents/windows on the computer screen to paste into MS Word, by
simultaneously pressing "Ctrl" and "Print screen".)
For photographic images (plates) good quality original photographs
should be submitted. If supplied electronically they should be saved as tif
or jpeg riles at a resolution of at least 3oodpi and at least 10cm wide.
Digital camera settings should be set at the highest resolution/quality
possible.
In the text of the paper the preferred position of all tables, figures and
plates should be indicated by typing on a separate line the words "Take in
Figure (No.)" or "Take in Plate (No.)". Tables should be typed and included
as part of the manuscript. They should not be submitted as graphic
elements. Supply succinct and clear captions for all tables, figures and
plates. Ensure that tables and figures are complete with necessary
superscripts shown, both next to the relevant items and with the
corresponding explanations or levels of significance shown as footnotes in
the tables and figures.
References to other publications must be in Harvard style and
carefully checked for completeness, accuracy and consistency. This is very
important in an electronic environment because it enables your readers to
exploit the Reference Linking facility on the database and link back to the
works you have cited through CrossRef. You should include all author
names and initials and give any journal title in full.
You should cite publications in the text: (Adams, 2008) using the first
named author's name or (Adams and Brown, 2008) citing both names of
two, or (Adams et al., 2008), when there are three or more authors. At the
end of the paper, a reference list in alphabetical order should be supplied:
• For books: Surname, initials, (year), title of book, publisher, place of
publication, e.g., Walesh, S. G. (2012), Engineering Your Future: The
Professional Practice of Engineering, 3rd Edition, ASCE Press/John Wiley
& Sons, New Jersey, NJ.
• For book chapters: Surname, initials, (year), "chapter title", editor's
surname, initials, title of book, publisher, place of publication, pages,
e.g., Liebowitz, J. (2005), "Conceptualising and implementing
knowledge management", in Love, P. E. D., Fong, P. S. W. and Irani, Z.,
(ed.), Management of Knowledge in Project Environments, Elsevier,
New York, NY, pp. 1-18
• For journals: Surname, initials, (year), "title of article", journal name,
volume, number, pages, e.g. Tsang, A. H. C. (2012), “A review on trend
tests for failure data analysis", West Indian Journal of Engineering, Vol.
35, No.1, July, pp.4-9.
• For electronic sources: Surname, initials, or institution, (year), name of
website, website address, date updated (if any) or date visited, e.g.,
EFQM (2012), European Foundation for Quality Management, available
at: http://www.EFQM.org/ (Dated: 1 January 2012)
Final submission of the article: Once accepted for publication, the Editor may request the final version as
an attached file to an e-mail or to be supplied on a diskette or a CD-ROM
labelled with author name(s); title of article; journal title; file name.
The manuscript will be considered to be the definitive version of the
article. The author must ensure that it is complete, grammatically correct
and without spelling or typographical errors.
The preferred file format is Word. Another acceptable format for
technical/mathematics content is Rich text format.