well technologies for co2 geological storage: co2 ... · résumé — technologies de puits pour le...
TRANSCRIPT

Oil & Gas Science and Technology – Rev. IFP, Vol. 62 (2007), No. 3, pp. 325-334Copyright © 2007, Institut français du pétroleDOI: 10.2516/ogst:2007027
Well Technologies for CO2 Geological Storage:CO2-Resistant Cement
V. Barlet-Gouédard1, G. Rimmelé1, B. Goffé2 and O. Porcherie1
1 Schlumberger Riboud Product Centre (SRPC), 1 rue Becquerel, BP 202, 92142 Clamart Cedex - France2 Centre National de la Recherche Scientifique, 3 rue Michel-Ange, B.P. 287, 75766 Paris Cedex 16 - France
e-mail: [email protected] - [email protected]@clamart.oilfield.slb.com - [email protected]
Résumé — Technologies de puits pour le stockage géologique du CO2 : ciment résistant au CO2 —Le stockage souterrain du CO2 est actuellement considéré comme la voie la plus efficace pour uneséquestration sure et à faible coût. Cette nouvelle application exige une étanchéité du puits à très longterme. La rupture de la gaine de ciment dans l’intervalle entre le cuvelage et la formation géologique peutcréer des chemins préférentiels favorisant la fuite du CO2 vers la surface avec des vitesses probablementsupérieures à celles pouvant être provoquées par les fuites au travers des formations géologiques. Il enrésultera une perte économique, une réduction de l’efficacité du stockage de CO2 et la remise en cause duchamp pour le stockage de CO2. Ce risque potentiel de fuites soulève des questions quant à la bonne iso-lation du puits à long terme et à la durabilité du ciment hydraté utilisé pour isoler l’annulaire entre lesintervalles de production et d’injection dans les puits de CO2. Nous proposons une nouvelle procédureexpérimentale et une méthodologie pour étudier la réactivité des systèmes CO2-Eau-Ciment en simulantles interactions du ciment pris avec le CO2 injecté à l’état supercritique dans des conditions de fond depuits. Les conditions utilisées pour ces expériences sont de 90ºC et 280 bars. L’évolution des propriétésmécaniques et physico-chimiques du ciment Portland est mesurée dans le temps sur une période maxi-male de six mois. Les résultats sont comparés à ceux obtenus par une étude similaire sur un nouveauciment résistant au CO2, la comparaison étant prometteuse pour ce nouveau matériau.
Abstract — Well Technologies for CO2 Geological Storage: CO2-Resistant Cement — Storing carbondioxide (CO2) underground is considered the most effective way for long-term safe and low-cost CO2sequestration. This recent application requires long-term wellbore integrity. A CO2 leakage through theannulus may occur much more rapidly than geologic leakage through the formation rock, leading to eco-nomic loss, reduction of CO2 storage efficiency, and potential compromise of the field for storage. Thepossibility of such leaks raises considerable concern about the long-term wellbore isolation and thedurability of hydrated cement that is used to isolate the annulus across the producing/injection intervalsin CO2-storage wells.
We propose a new experimental procedure and methodology to study reactivity of CO2-Water-Cementsystems in simulating the interaction of the set cement with injected supercritical CO2 under downholeconditions. The conditions of experiments are 90ºC under 280 bars. The evolution of mechanical, physi-cal and chemical properties of Portland cement with time is studied up to 6 months. The results are compared to equivalent studies on a new CO2-resistant material; the comparison shows significantpromise for this new material.
Closure and Abandonment of Oil and Gas WellsFermeture et abandon des puits de pétrole et de gaz
D o s s i e r
Oil & Gas Science and Technology – Rev. IFP, Vol. 62 (2007), No. 3
INTRODUCTION
Storing carbon dioxide underground is considered as themost effective way for long-term safe and low cost CO2sequestration (Sarmiento and Gruber, 2002; Gielen, 2003).There are three main types of geological reservoirs with suf-ficient capacity to store captured CO2: depleted oil and gasreservoirs, deep saline aquifer reservoirs and unminable coalbeds (Bachu, 2000). The reservoirs need to be at a depth typi-cally greater than 800 m so that the CO2 is in a supercriticalstate i.e. at a temperature and a pressure above its criticalpoint (31.6°C, 7.3 MPa). Piping CO2 for underground injec-tion is not a novel concept and is already often used for thepurposes of enhanced oil and gas recovery (Power et al.,1989; Mizenko, 1992; McDaniel Branting and Whitman,1992). However, this application of CO2 injection is notintended for long-term storage, which is a more recent con-cept requiring a long-term wellbore integrity strategy to bedeveloped.
The construction of CO2 injection wells starts with drillingfollowed by well completion before starting CO2 injectionoperations. In the framework of well completion, the cemen-tation phase guarantees well isolation from the reservoir tothe surface and isolation between geological formations. Acrucial technical problem in CO2 sequestration is the chemi-cal resistance of cement to CO2 over time. Conventionalmaterials used for well isolation for oil or gas production arePortland-based cement systems. These systems present theadvantage of being low cost and efficient for conventionalwell construction. However, cement is known to be thermo-dynamically unstable in CO2-rich environments. It tends todegrade rapidly, once exposed to such acid gases by reactingwith calcium hydroxide formed from hydrated calcium sili-cate phases (Bruckdorfer, 1986). As carbonates are dissolvedin low pH environment, the cement-carbonation process willnot become a self-plugging effect in the cement sheath. Somedata have been already published under this type of environ-ment (Onan, 1984). Moreover, recent analysis on one cementsample collected in CO2 enhanced oil recovery well(SACROC) have been done. Although a similar carbonationprocess is mentioned, the cement sample demonstrates that atleast in one location, Portland cement has retained its struc-tural integrity after 30 years in near-CO2-reservoir environ-ment (Carey et al., 2006). Furthermore, recent experimentalstudies on the interfaces cement/formation and cement/casingwere led and showed that similar chemical reactions areinvolved (Jacquemet et al., 2005; Duguid et al., 2006).
Long-term isolation and integrity of CO2 injection wellsclearly must be improved to ensure long-term environmentalsafety. In processes involving the injection of CO2 forenhanced oil recovery, a number of failures have beenreported due to poor cement properties. Failure of thecement, in the injection interval and above it, may createpreferential channels for carbon dioxide to migrate back to
the surface. This may occur on a much faster timescale thangeological leakage.
Optimization of advanced systems allowing long-termwell isolation is critical to allow safe and efficient under-ground storage for carbon dioxide and thus keep the green-house gas out of the atmosphere for long duration.
This article presents the results of a comprehensive studyon the degradation of cement in simulating the interaction ofthe set cement with injected supercritical CO2 under down-hole conditions. The methodology and the equipment aredescribed for testing conventional Portland cement and measuring the evolution of its alteration process with timeunder CO2 conditions. The results are compared to equivalentstudies on a new CO2-resistant material.
1 EXPERIMENTAL PROCEDURE
1.1 Sample Preparation
The effects of carbonic acid on hydraulic Portland cementsare studied using cylindrical samples of 1.27 cm diameter × 2.54 cm length and 1.27 cm diameter × 5.08 cm length.
All cement slurries are prepared according to APISpecification 10, Section 5 (Recommended Practice forTesting Well cements, 1997) and using fresh water. Beforemixing the slurry, an antifoam agent, a dispersant and aretarder are added to the mix water to optimize the mainslurry properties. The cement samples are cast by slowlypouring the degassed slurry down the cubic mold beforelaunching the curing chamber. The samples are cured for 72 hours at 207 bars and 90°C. The cubic samples areremoved from the moulds and placed in water. Then thecubic samples are cored to obtain 1.27 cm diameter cylindri-cal samples. Finally, the core samples are cut to 2.54 cm or5.08 cm length.
1.2 Experimental Reactor
Cement carbonation is performed under static conditionsusing the following experimental set-up and procedure. Thestatic conditions are considered as realistic simulation of theCO2-exposure conditions at the formation/cement sheathinterface, except around the perforations where the exposureis under a dynamic state during CO2 injection. So static con-ditions have been selected as representing downhole condi-tions. Water with a pH of about 8 is used rather than salinesolution to provide more severe conditions as CO2 is highlysoluble in pure water (Spycher and Pruess, 2005).
The experimental set-up accommodates temperaturesfrom 30°C to 300°C and pressure from 1 to 500 bars to coverthe targeted application ranges. Experiments with wet super-critical CO2 and with water saturated by dissolved CO2 are
326
V Barlet-Gouédard et al. / Well Technologies for CO2 Geological Storage: CO2-Resistant Cement
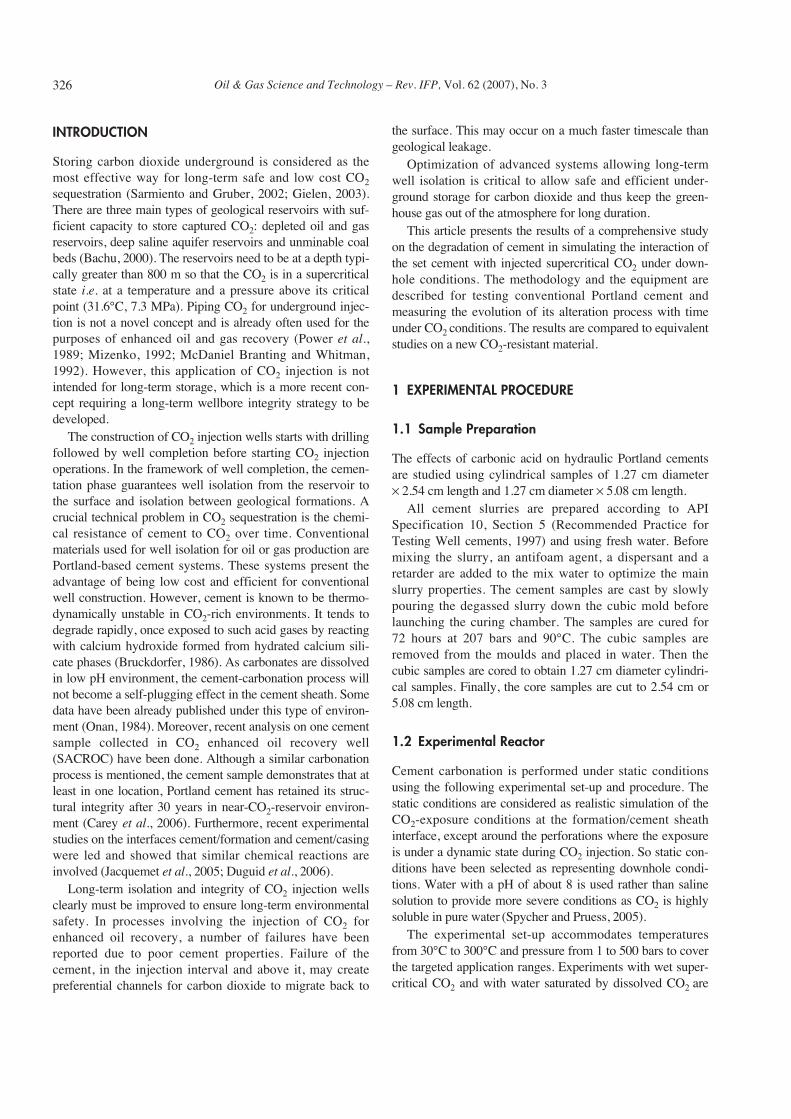
performed in a titanium vessel (Fig. 1). The cell volume is126 ml, the ratio of sample volume/water volume is 1.2, andthe one of sample volume/CO2 volume is 0.7. The samplesare collected all together at the end of each experiment.Therefore, these ratios are constant during each CO2 test ateach duration. The CO2 pressure is monitored and main-tained constant during the whole test duration by CO2 injec-tions if pressure drops of a few bars. More technical featuresof this CO2-equipment are described in details in Barlet-Gouédard et al. (2006). The test conditions are fixed for allexperiments to 90°C and 280 bars. The tests are performed atdifferent durations: half-day (13 hrs), 2 days (44 hrs), 4 days(88 hrs), one week (188 hrs), 3 weeks (523 hrs), 6 weeks(1006 hrs) and 3 months (2033 hrs). For each experiment, thevolume content of water is about half of the volume ofinjected CO2 at atmospheric pressure and room temperature.There is no fluid mixing in the vessel. At 90°C and 280 bars,water is liquid while CO2 is supercritical (Hollister, 1981;Blencoe et al., 2001; Blencoe, 2004). At these conditions, thewater mole fraction in the supercritical CO2 phase is about1.8‰ and the CO2 mole fraction in water is 2.25% (Spycheret al., 2003). Furthermore, some experimental data availablein the literature show that pH of water saturated with CO2 iscomprised between 2.8 and 3 under such severe conditions(Toews et al., 1995)
Figure 1
View of the three levels of the 1.27 cm diameter cylindricalcore samples for CO2 experiments in the titanium simple cylin-der vessel. Note that the three cores at the middle are not cut inorder to study the interface between wet supercritical CO2 andCO2-saturated water fluids.
1.3 Test Procedure
The experimental set-up is designed to get a quick overviewof the behavior of cements with supercritical CO2. The set-upsimultaneously obtains data for the three situations: CO2dissolved in water (lower part of the reactor), water dissolvedin CO2 (upper part of the reactor), and interface between thetwo media. For this experiment, core samples are disposed inthree crowns (Fig. 1). The samples located in the lower partof the reactor (six samples of 1.27 cm diameter × 2.54 cmlength) are submerged in water while the upper crown (sixsamples of 1.27 cm diameter × 2.54 cm length) is completelyexposed to CO2. The intermediate crown simulates the condi-tions at the water-CO2 interface. This crown is made of threesamples of 1.27 cm diameter × 5.08 cm length, allowingstudying the interface between both CO2-fluids (Fig. 1). The pressurization and depressurization phases of the CO2experiments follow a well-defined procedure described byBarlet-Gouédard et al. (2006).
1.4 Alteration Measurements
Carbonic-acid corrosion on the core samples is indirectlymeasured: the pH of water in equilibrium with the cementsample (i.e. the pH of the pore solution) measured at atmos-pheric pressure and ambient temperature, the weight and vol-ume change of the cores, the change in density and porosity,the evolution of compressive strength, the thickness of thecarbonation front, and microscopic measurements.
The alteration front is determined in cutting each coresample to prepare a thin section in the axial plane. The frontis measured both directly and with a scanning electron micro-scope averaging several zooms.
The microscopic evolution is determined by scanningelectron microscopy (SEM) and back-scattered electron(BSE) analysis through the entire core section. AdditionalSEM-EDS (Energy Dispersion Spectroscopy) analyses andX-ray imaging are performed in the same material with aquantitative EDS device (Quantex on Hitachi 2500).
Compressive strengths are determined with an ADAMELpress. As length-to-diameter ratio of the cylindrical sampleswas always equal to two, the resulting strengths are directlyused. The compressive strength of each core sample is measured before and after CO2 attack without additionaltreatment.
The porosity variation is measured with a mercury-porosimetry instrument. Mercury intrusion porosimetry(MIP) estimates the pore size over a wide range (theoreticallyfrom 0.003 μm to 360 μm). MIP measurements were car-ried out by two different laboratories on 1.27 cm diameter by2.54 cm length cylindrical samples, dried at 100°C at stan-dard atmosphere during 60 hours. It is noteworthy that thesemeasurements are performed on whole sample core and notonly in the altered zone. Two intrusion-extrusion cycles were
1 2 3
4 5 6
10 11 12
13 14 15
7 8 9
CO2 pressure line
Wet supercriticalCO2 phase
Furnace
Teflon slice
1.27 x 5.08 cmcement core
1.27 x 2.54 cmcement core
Interface between bothCO2-fluids
CO2 saturatedwater phase
327

Oil & Gas Science and Technology – Rev. IFP, Vol. 62 (2007), No. 3
performed to determine irreversible and reversible intrusionvolumes. After an additional extrusion-intrusion cycle, theinitial volume was always reached to within a small error,indicating that no significant damage occurred to the sampleduring the first intrusion. The maximum intrusion pressure is2 kbar (corresponding to a minimum pore entrance size of6.2 nm), and the equilibrium time is 20 seconds.
2 RESULTS
We present in this chapter the results of our kinetic study onconventional Portland cement (class G, density equal to 1.9 g/cm3) and a first generation of CO2-resistant cement(density range between 1.5 and 2.0 g/cm3) tested under CO2exposure up to 3 months. Preliminary results on samplestested during 6 months are also shown.
2.1 Alteration Process
Alteration of Portland cement during CO2 attack is a veryeffective process. A sharp alteration front is clearly observedat the rim of the samples already after half-day of CO2 attack.The thickness of this alteration front increases with time fromabout 1-2 mm after 44 hrs (Fig. 2) to 5-6 mm after 3 weeksof attack. After 6 weeks, the front reaches the central part ofthe samples (~7 mm deep). After 3 months, the significantlycarbonated samples exhibit a strong degradation as attestedby cracking occurrences (Fig. 2). After 6 months, a highdeterioration is observed in both CO2 fluids: a spalling effectis observed on the sample core (Fig. 3).
Figure 3
Portland cement samples before experiment and after 6 monthsat 90ºC and 280 bars in carbon dioxide fluids (sample located atthe interface between both CO2 fluids). Note the spalling effectobserved on the sample core after 6 months of test.
Portlandite [Ca(OH)2] and Calcium Silicate Hydrates(CSH) of set cement are progressively consumed to producecalcium carbonates (aragonite, vaterite and/or calcite), silicaamorphous gel and water. Back-scattered electron imagesallow distinguishing different zones in the attacked Portlandcement (Fig. 4). This geometry in different concentric zonesis systematically observed at all test durations. From the rimtowards the core of the sample, the cement sample consists ofa carbonated zone, a carbonation front, a dissolution frontand a non-carbonated zone. Such geometry has also beendeciphered with SEM images (Kutchko et al., 2006).
The carbonated zone contains calcium carbonate, silicagel and calcium-depleted calcium silicate phases. Then, thecarbonation front is a thin front (50 to 100 μm-large) of very
Before attack After 6 months in CO2-fluid
Cement
Calcite
328
Before attack
After 2 days After 3 months
Calcium carbonateoccurence
CO
2 di
ssol
ved
in w
ater
Wet
sup
ercr
itica
l CO
2 Sample section
Alteration front
Figure 2
Core integrity and alteration front observed with Portland cement at 1.9 g/cm3 after two days and three months at 90°C and 280 bars in carbondioxide fluids.

V Barlet-Gouédard et al. / Well Technologies for CO2 Geological Storage: CO2-Resistant Cement
Figure 5
Section of a Portland cement sample tested during 3 weeks at280 bars and 90ºC in wet supercritical CO2 fluid. The occur-rence of carbonation front and dissolution front relicts (the so-called “paleofronts”) is highlighted.
low porosity, and mainly made of calcium carbonates. It contrasts with the dissolution front that is a zone of highporosity where calcium silicate phases progressively dis-solve. Finally, the uncarbonated zone is the internal part ofthe cement. It is noteworthy that the dissolution front and thecarbonation front are chemical reaction fronts. The dissolu-tion front is the zone in which Portland cement phases (port-landite and calcium silicate phases) react with CO2 to formcalcium carbonates forwards in the carbonation front. Atlonger test duration, this particular geometry of reactionfronts is translated towards the central part of the samples,and relicts of these fronts are commonly observed backwardsin the carbonated zone. This complex series of “paleofronts”(Fig. 5) marks several physical discontinuities in the sampleand participate to the weakening of Portland cement in termsof mechanical properties.
A first generation of CO2-resistant material tested undersimilar conditions contains a reduced amount of Portlandcement and CO2 - inert particles. Samples of different density(between 1.5 and 2.0 g/cm3) have been tested in both CO2-fluids. In contrast with Portland cement, a low amount of calcium carbonate precipitates in the samples of 2 g/cm3,
Portlandcement "Paleofronts"
Carbonated zone
1 cm
After 3 weeks of attack in wet supercritical CO2
329
a)
d)
c)b) Carbonationfront
Dissolution
front
Carbonatedzone
Non-carbonated
cement
Pores
10 mm Pores
CSH phase
Calciumcarbonate
300 μm
750 μm750 μm
Figure 4.
a) Section of a Portland cement core tested during two days at 280 bars and 90ºC in CO2-saturated water. Note the occurrence of the concentriccarbonated zone.b), c) Back-scattered electron image showing the different zones in a Portland cement sample after CO2 attack. See text for explanations. d) Zoom on the low-porosity carbonate front and the high-porosity front that are chemical reaction fronts.
Oil & Gas Science and Technology – Rev. IFP, Vol. 62 (2007), No. 3
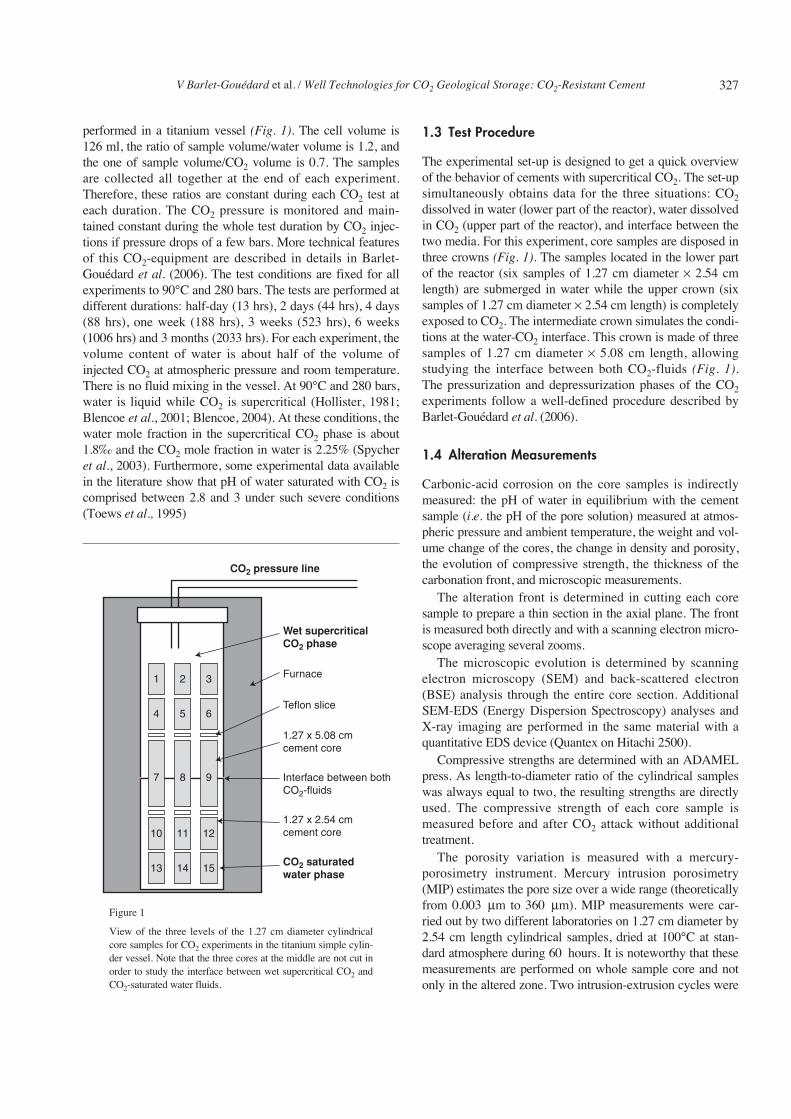
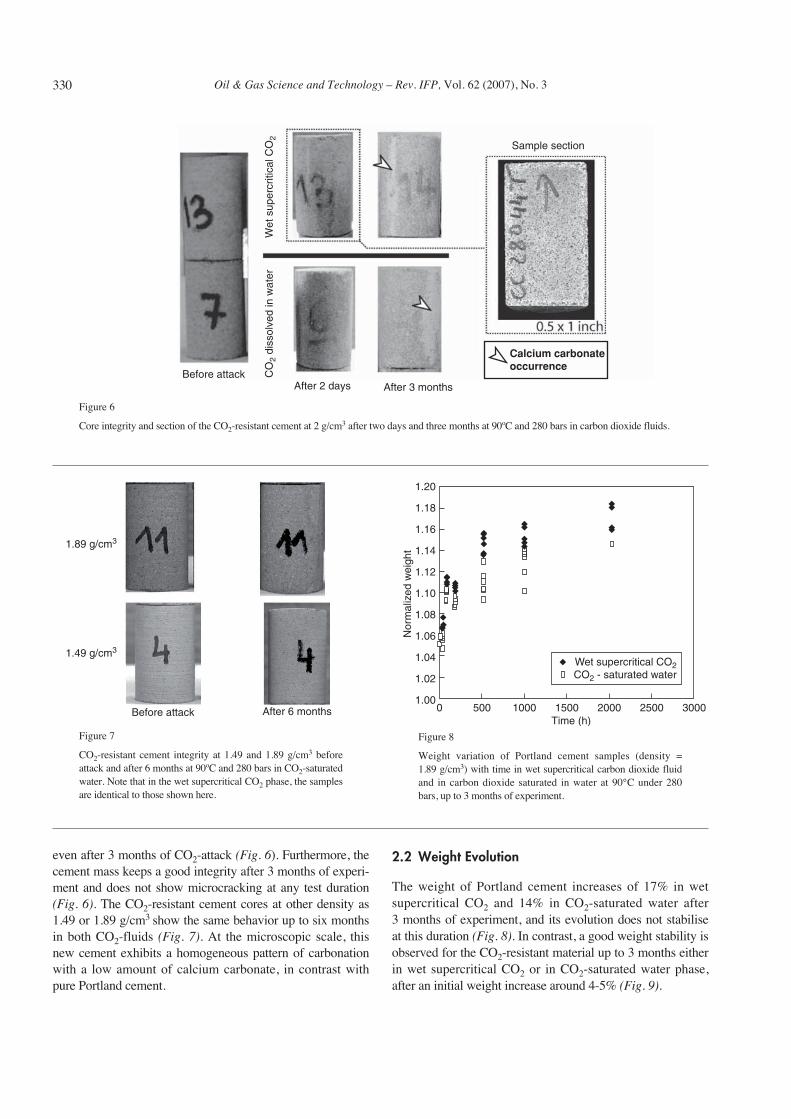
even after 3 months of CO2-attack (Fig. 6). Furthermore, thecement mass keeps a good integrity after 3 months of experi-ment and does not show microcracking at any test duration(Fig. 6). The CO2-resistant cement cores at other density as1.49 or 1.89 g/cm3 show the same behavior up to six monthsin both CO2-fluids (Fig. 7). At the microscopic scale, thisnew cement exhibits a homogeneous pattern of carbonationwith a low amount of calcium carbonate, in contrast withpure Portland cement.
2.2 Weight Evolution
The weight of Portland cement increases of 17% in wetsupercritical CO2 and 14% in CO2-saturated water after 3 months of experiment, and its evolution does not stabiliseat this duration (Fig. 8). In contrast, a good weight stability isobserved for the CO2-resistant material up to 3 months eitherin wet supercritical CO2 or in CO2-saturated water phase,after an initial weight increase around 4-5% (Fig. 9).
330
Before attackAfter 2 days After 3 months
Calcium carbonateoccurrence
CO
2 di
ssol
ved
in w
ater
Wet
sup
ercr
itica
l CO
2
Sample section
Figure 6
Core integrity and section of the CO2-resistant cement at 2 g/cm3 after two days and three months at 90ºC and 280 bars in carbon dioxide fluids.
Before attack After 6 months
1.89 g/cm3
1.49 g/cm3
1.20
1.18
1.16
1.14
1.12
1.10
1.08
1.06
1.04
1.02
1.000 500 1000 1500
Time (h)
Nor
mal
ized
wei
ght
2000 2500 3000
Wet supercritical CO2CO2 - saturated water
Figure 7
CO2-resistant cement integrity at 1.49 and 1.89 g/cm3 beforeattack and after 6 months at 90ºC and 280 bars in CO2-saturatedwater. Note that in the wet supercritical CO2 phase, the samplesare identical to those shown here.
Figure 8
Weight variation of Portland cement samples (density = 1.89 g/cm3) with time in wet supercritical carbon dioxide fluidand in carbon dioxide saturated in water at 90°C under 280bars, up to 3 months of experiment.

V Barlet-Gouédard et al. / Well Technologies for CO2 Geological Storage: CO2-Resistant Cement
Figure 9
Weight variation of CO2-resistant cement samples (density = 2 g/cm3) with time in wet supercritical carbon dioxide fluid andin carbon dioxide saturated in water at 90°C under 280 bars, upto 3 months of experiment.
2.3 pH Evolution
The pH of water in equilibrium with Portland cement coresinitially equals to 13. After CO2 attack, core samples arestored in water and the pH is measured at equilibrium. Aftereach duration of CO2 attack, the new equilibrium pH isaround 7 up to 3 weeks and decreases again up to 6 after sixweeks and 3 months of experiment (Fig. 10). Such CO2attack-related decrease of pH has already been reported in theliterature (Van Gerven et al., 2004a; 2004b). This decreaseresults from the reaction between CO2 and calcium from thecalcium silicate phases or portlandite coming from Portlandcement hydration. As for Portland cement, the pH dataobtained with CO2-resistant cement also decrease from11-12 initially to 6-7 after CO2 attack (Fig. 10).
2.4 Mechanical Properties
Figure 11 shows the compressive-strength results of Portlandcement samples tested at several durations in CO2 fluids,under similar pressure-temperature conditions. After six
1.20
1.18
1.16
1.14
1.12
1.10
1.08
1.06
1.04
1.02
1.000 500 1000 1500
Time (h)
Nor
mal
ized
wei
ght
2000 2500 3000
Wet supercritical CO2CO2 - saturated water
331
0
2
4
6
8
10
12
14
pH o
f wat
er in
equ
ilibr
ium
with
cem
ent c
ores
Portland cement pH(i) Portland cement pH(f) CO2-resistant material pH(i) CO2-resistant material pH(f)
Time (h) 13448818852310062033
Figure 10.
Evolution of pH of water in equilibrium with cement samples, at each test duration (up to 3 months), for Portland cement and the CO2-resistantcement. pH(i) = pH before CO2 attack, pH(f) = pH after attack.

Oil & Gas Science and Technology – Rev. IFP, Vol. 62 (2007), No. 3
weeks in wet supercritical CO2 fluid, a strength loss of about30% is measured. In CO2-saturated water fluid, the compres-sive strength loses 65% (Fig. 11). However, compressivestrength measurements are very dispersed in both fluids. Itmay come from the heterogeneity of the samples due to thecarbonation process (Figs 2 to 5). During the compressivestrength measurements, the carbonation layer cracks. Theseresults cannot be used as absolute compressive strength valuesbut indicate clearly the weakness of the carbonate layer or theinterface at this front. After 6 months, the compressive strengthof Portland cement is not measurable for the samples locatedin the CO2-saturated water phase due to their high deteriora-tion. Some data have been generated for few samples tested inthe wet supercritical CO2 phase, showing also a high decreaseof their mechanical properties under these conditions (Fig. 11).
The compressive strength of the CO2-resistant cement at2.0 g/cm3 before and after carbon dioxide attack shows an initial decrease in the first few days, then it stabilizes up to 3 months in both CO2 phases with a very good repeatability(Fig.12), in contrast to the Portland cement behavior.
Parallel to this kinetic study, compressive strength testswere performed on samples with densities of 1.5 and 1.9 g/cm3.The results confirm the stable behaviour of CO2-resistantmaterial over a large density range. For the 1.9 g/cm3 and the1.5 g/cm3 systems, the compressive strength decreases from50 MPa to 28 MPa and from 38 MPa to about 20 MPa in bothfluids after one month respectively. After six months of CO2attack, the compressive strength is also comprised between 20 and 30 MPa, whatever the system density.
2.5 Mercury Porosimetry
Water-permeability measurements have been performed onthe Portland cement samples and the CO2-resistant cementsamples at different durations. No discrimination has beenpossible with this method before and after the CO2 attackbecause the permeability always remained below the detec-tion limit of 8 microdarcy. The measurement method did notpermit to detect any change due to the CO2 attack.
However, the evolution of the porosity can be well followed with the mercury intrusion porosimetry measure-ments. The initial Hg-porosity for Portland cement is 33%and is reproducible and repeatable. After CO2-attack, theporosity evolves during the test period with different behav-ior in each fluid (Fig. 13).
In wet supercritical CO2, the porosity continuouslydecreases, from initially 33% to 15% after 6 weeks. Itrapidly decreases from 33% to 27% in the first hours of CO2-exposure, before the decrease slows down over the next 6weeks. Then the porosity increases from 15% to 27%between 6 weeks and 3 months of experiment.
In CO2-saturated water, the porosity also changes in twodistinct phases. During the first phase of approximately threeweeks, the porosity rapidly decreases from 33% to 9%. Atthis stage, the carbonation front has quite completely enteredthe samples. During the second phase after three weeks, theporosity increases from 9% to 28% up to 3 months (Fig. 13).It is here emphasized that this second stage is related to a dis-solution process of the neoformed calcium carbonate. After a
332
60
50
40
30
20
10
00 500 1000 1500
Time (h)
Com
pres
sive
str
engh
t (M
Pa)
2000 2500 3000 3500 4000 4500
Wet supercritical CO2CO2 - saturated water
60
50
40
30
20
10
00 500 1000 1500
Time (h)
Com
pres
sive
str
engh
t (M
Pa)
2000 2500 3000
Wet supercritical CO2CO2 - saturated water
Figure 11
Compressive strength evolution of Portland cement sampleswith time in wet supercritical carbon dioxide fluid and in CO2
saturated in water at 90°C under 280 bars. After 6 months inCO2-saturated water, the compressive strength of Portlandcement is not measurable, as most of the samples are highlydeteriorated.
Figure 12
Compressive strength evolution of the CO2-resistant cementsamples (density = 2.0 g/cm3) with time in wet supercritical carbon dioxide fluid and in CO2 saturated in water at 90°Cunder 280 bars, up to three months.

V Barlet-Gouédard et al. / Well Technologies for CO2 Geological Storage: CO2-Resistant Cement
complete carbonation of the sample, as CO2 is in excess inour setup, pH of the fluid within the reactor (pressure andtemperature) decreases to 2.8 and 3 (Toews et al., 1995)allowing the dissolution process.
In contrast with Portland cement, the initial Hg-porosity ofthe CO2-resistant cement is low and equals to about 15% (Fig. 14). In wet supercritical CO2 and in CO2-saturatedwater, after a slight porosity increase from 15 to 20% in thefirst two days, the maximal porosity remains stable up to 3 months (Fig. 14).
These porosity results confirm the trend observed withother physical parameters (weight, density, compressivestrength, microstructural characterizations), that CO2-resis-tant material remains stable after the first two days of expo-sure. Its behavior is comparable in both wet supercritical CO2and CO2-saturated water.
The CO2 resistant material exhibits a behavior drasticallydifferent from the one observed with Portland cement.Indeed, carbonation occurs very rapidly in the first days ofCO2 attack and is then limited.
CONCLUSION
The conclusions of this study on cement degradation in theframework of CO2 storage application are the following:• Portland cement is not resistant enough to wet supercritical
CO2 or to CO2-saturated water. Its alteration is characterizedby a complex series of concentric fronts after CO2 attack inboth fluids. This chemical alteration is a very effectiveprocess with a significant pH decrease of interstitial fluidtriggering possibly casing corrosion. After six months, thedegradation is very high and shows a spalling effect.
• An initial sealing by carbonation is followed by a dissolu-tion stage, which starts earlier in CO2-saturated water thanin wet supercritical CO2. Indeed, carbonation does notcontinuously plug Portland cement.
• In contrast, an homogeneous pattern with a limited car-bonation threshold is observed with the new CO2-resistantcement which has a good mechanical behaviour over awide density range (1.5 and 2.0 g/cm3). This materialremains comparably inert in both wet supercritical CO2and CO2-saturated water phases. Weight, density, com-pressive strength, microstructural characterizations andHg-porosity measurements confirm the good stability ofthe CO2-resistant cement.
ACKNOWLEDGMENTS
The authors would like to thank the management ofSchlumberger for permission to publish this paper. The labo-ratory staff of Schlumberger Riboud Product Center and ofCNRS/ENS for the experimental work is also gratefullyacknowledged.
REFERENCES
Recommended Practice for Testing Well cements, (1997) APIRecommended Practice 10B, Twenty- Second Edition, December,American Petroleum Institute.Bachu, S. (2000) Sequestration of CO2 in geological media: criteriaand approach for site selection in response to climate change.Energ. Convers. Manag., 41, 953-970.
Barlet-Gouédard, V., Rimmelé, G., Goffé, B. and Porcherie, O.(2006) Mitigation strategies for the risk of CO2 migration throughwellbores, IADC/SPE 98924, Miami, USA, February.
333
35
25
15
5
30
20
10
00 500 1000 1500
Time (h)
Por
osity
(%
)
2000 2500 3000
Wet supercritical CO2CO2 - saturated water
25
15
5
30
20
10
00 500 1000 1500
Time (h)
Por
osity
(%
)
2000 2500 3000
Wet supercritical CO2CO2 - saturated water
Figure 13
Porosity obtained during the first mercury intrusion in Portlandcement core samples at several durations, in wet supercriticalCO2 fluids and in CO2-saturated water fluid at 90°C under 280 bars, up to three months.
Figure 14
Porosity obtained during the first mercury intrusion in CO2-resistant cement core samples at several durations, in wet super-critical CO2 fluids and in CO2-saturated water fluid at 90°Cunder 280 bars, up to three months.

Oil & Gas Science and Technology – Rev. IFP, Vol. 62 (2007), No. 3
Blencoe, J.G. (2004) The CO2-H2O system: IV. Empirical, isother-mal equations for representing vapor-liquid equilibria at 110-350°C,P£150 Mpa. Am. Mineral., 89, 1447-1455.
Blencoe, J.G., Naney, M.T. and Anovitz, L.M.(2001) The CO2-H2Osystem: III. A new experimental method for determining liquid-vapor equilibria at high subcritical temperatures. Am. Mineral., 86,1000-1111.
Bruckdorfer, R.A. (1986) Carbon Dioxide Corrosion in OilwellCements, SPE 15176 Billings, MT, May 19-21.
Carey, J.W., Wigand, M., Chipera, S. et al. (2006) Analysis andperformance of oil well cement with 30 years of CO2 exposure fromthe SACROC unit, West Texas, USA, 8th International conferenceon Greenhouse Gas Control Technologies, Trondheim, Norway,June 19-22.
Duguid, A., Radonjic, M. and Scherer, G. (2006) The effect of car-bonated brine on the interface between well cement and geologicformations under diffusion-controlled conditions, 8th Internationalconference on Greenhouse Gas Control Technologies, Trondheim,Norway, June 19-22.
Gielen, D. (2003) The future role of CO2 capture and storage.Results of the IEA-ETP model, Report Number EET/2003/04, Paris,November.
Hollister, L.S. (1981) Information intrinsically available from fluidinclusions, in Fluid inclusions: applications to petrology, Hollisterand Crawford (ed.), Mineral association of Canada, Short coursehandbook, 6, 1-12.
Jacquemet, N., Pironon, J. and Caroli, E. (2005) A new experimentalprocedure for simulation of H2S + CO2 geological storage -Application to well cement aging. Oil Gas Sci. Technol., 60, 93-206.
Kutchko, B., Strazisar, B., Dzombak, D. and Lowry, G. (2006)Degradation of well cements under geologic sequestration conditions,Wellbore Integrity network Meeting, Princeton , N.J., March 29.
McDaniel Branting, J.K. and Whitman, D.L. (1992) The feasibilityof using CO2 EOR Techniques in the powder river basin ofWyoming, Paper SPE 24337, Casper, Wyoming, 1992.
Mizenko, G.J. (1992) North Cross (Devonian) Unit CO2 Flood:Status Report, Paper SPE/DOE 24210.
Onan, D.D. (1984) Effects of Supercritical Carbon Dioxide on WellCements, paper SPE 12593, Permian Basin Oil & Gas RecoveryConference, Midland, TX, March 8-9.
Power, M.T., Leicht, M.A. and Barnett, K.L. (1989) ConvertingWells in a Mature West Texas Field for CO2 Injection, Paper SPE20099.
Sarmiento, J.L. and Gruber, N. (2002) Sinks for anthropogenic car-bon. Phys. Today, 30-36.
Spycher, N. and Pruess, K. (2005) CO2-H2O mixtures in the geologi-cal sequestration of CO2. II. Partitioning in chloride brines at 12-100°Cand up to 600 bar. Geochem. Cosmochem. Acta, 69, 3309-3320.
Spycher, N., Pruess, K. and Ennis-King, J. (2003) CO2-H2O mix-tures in the geological sequestration of CO2. I. Assessment and cal-culation of mutual solubilities from 12 to 100°C and up to 600 bar.Geochem. Cosmochem. Acta, 67, 3015-3031.
Toews, K.L., Shroll, R.M., and Wai, C.M. (1995). pH-definingequilibrium between water and supercritical CO2. Influence on SFEof organics and metal chelates. Anal. Chem., 67, 4040-4043.
Van Gerven,T., Van Baelen, D., Dutré, V. and Vandecasteele, C.(2004a) Influence of carbonation and carbonation methods on leach-ing of metals from mortars. Cement Concrete Res., 34, 149-156.
VanGerven, T., Moors, J., Dutré, V. and Vandecasteele, C. (2004b)Effect of CO2 on leaching from a cement-stabilized MSWI fly ash.Cement Concrete Res., 34, 1103-1109.
Final manuscript received in February 2007
334
Copyright © 2007 Institut français du pétrolePermission to make digital or hard copies of part or all of this work for personal or classroom use is granted without fee provided that copies are not madeor distributed for profit or commercial advantage and that copies bear this notice and the full citation on the first page. Copyrights for components of thiswork owned by others than IFP must be honored. Abstracting with credit is permitted. To copy otherwise, to republish, to post on servers, or to redistributeto lists, requires prior specific permission and/or a fee: Request permission from Documentation, Institut français du pétrole, fax. +33 1 47 52 70 78, or [email protected].