welch 12-mol biol evol-adna hawaiian petrel
TRANSCRIPT
Research
articleAncient DNA Reveals Genetic Stability Despite DemographicDecline: 3,000 Years of Population History in the EndemicHawaiian PetrelAndreanna J. Welch,*,y,1,2 Anne E. Wiley,3,4 Helen F. James,4,2 Peggy H. Ostrom,3
Thomas W. Stafford Jr,5,6 and Robert C. Fleischer1,2
1Smithsonian Conservation Biology Institute, Center for Conservation and Evolutionary Genetics, National Zoological Park,
Washington, DC2Behavior, Ecology, Evolution and Systematics Program, University of Maryland3Department of Zoology, Michigan State University4Department of Vertebrate Zoology, National Museum of Natural History, Smithsonian Institution, Washington, DC5Stafford Research, Inc., Lafayette, CO6Centre for GeoGenetics, University of Copenhagen, Copenhagen, DenmarkyPresent address: Department of Biological Sciences, 109 Cooke Hall, University at Buffalo, Buffalo, NY 14260, USA
*Corresponding author: E-mail: [email protected].
Associate editor: Beth Shapiro
Abstract
In the Hawaiian Islands, human colonization, which began approximately 1,200 to 800 years ago, marks the beginning of a periodin which nearly 75% of the endemic avifauna became extinct and the population size and range of many additional speciesdeclined. It remains unclear why some species persisted whereas others did not. The endemic Hawaiian petrel (Pterodromasandwichensis) has escaped extinction, but colonies on two islands have been extirpated and populations on remaining islandshave contracted. We obtained mitochondrial DNA sequences from 100 subfossil bones, 28 museum specimens, and 289 modernsamples to investigate patterns of gene flow and temporal changes in the genetic diversity of this endangered species over the last3,000 years, as Polynesians and then Europeans colonized the Hawaiian Islands. Genetic differentiation was found to be highbetween both modern and ancient petrel populations. However, gene flow was substantial between the extirpated colonies onOahu and Molokai and modern birds from the island of Lanai. No significant reductions in genetic diversity occurred over thisperiod, despite fears in the mid-1900s that this species may have been extinct. Simulations show that even a decline to a stableeffective population size of 100 individuals would result in the loss of only 5% of the expected heterozygosity. Simulations alsoshow that high levels of genetic diversity may be retained due to the long generation time of this species. Such decouplingbetween population size and genetic diversity in long-lived species can have important conservation implications. It appears thata pattern of dispersal from declining colonies, in addition to long generation time, may have allowed the Hawaiian petrel toescape a severe genetic bottleneck, and the associated extinction vortex, and persist despite a large population decline afterhuman colonization.
Key words: ancient DNA, population bottleneck, gene flow, generation time, Hawaiian petrel, Pterodroma.
IntroductionThere is no doubt that humans have had a great impact onglobal biodiversity, and this impact is particularly well docu-mented for the islands of the Pacific Ocean (Steadman 2006).The Hawaiian Islands were one of the last habitable areas ofthe Pacific to be colonized by humans, with Polynesian peoplefirst arriving between 1200 and 800 years ago (Kirch 2000;Wilmshurst et al. 2011). Immediately prior to the firstEuropean contact in 1778 AD human population sizes inHawaii likely exceeded 200,000 individuals (Kirch 1985). Thefossil record indicates that the prehuman background extinc-tion rate of birds in Hawaii was very low, but that it increasedprecipitously after the arrival of humans, due to factors suchas direct exploitation, introduction of exotic mammalian
predators, and habitat destruction (Olson and James 1982a;James 1987; Athens et al. 1991; Blackburn et al. 2004). Speciesranging from raptors to giant flightless geese became extinct,including one seabird species, Pterodroma jugabilis (James andOlson 1991; Olson and James 1991). Many of the endemicHawaiian species that were able to persist have experiencedrange contractions and declines in population size (James andOlson 1991; Olson and James 1991) and remain threatened byextinction.
Severe population declines can have large impacts on thegenetic diversity of a species (Frankham et al. 2002). Declinesin population size can lead to inbreeding, decreased survival,reduced reproductive success, and can limit evolutionary po-tential. All of these factors may, in turn, increase the risk of
Published by Oxford University Press on behalf of the Society for Molecular Biology and Evolution 2012.
Mol. Biol. Evol. 29(12):3729–3740 doi:10.1093/molbev/mss185 Advance Access publication July 25, 2012 3729
at Smithsonian Institution L
ibraries on February 4, 2015http://m
be.oxfordjournals.org/D
ownloaded from
extinction (Frankham 2005). Changes in past population sizecan be especially difficult to detect but ancient DNA tech-niques, which enable utilization of temporally spaced samples,increase power and can help elucidate the evolutionary his-tory of a species (Ramakrishnan et al. 2005). Ancient DNA hasbeen used, for example, to investigate whether temporal pop-ulation dynamics of large mammals have been associatedwith the presence of humans or global climatic fluctuations(Shapiro et al. 2004; Campos et al. 2010). Ancient DNA hasalso revealed temporal changes in genetic diversity ofHawaiian species. The endangered Hawaiian goose, or nene,was found to have undergone a severe prehistoric geneticbottleneck about 500–800 years ago, after the arrival ofhumans in the islands (Paxinos et al. 2002). It remains unclearhow genetic diversity has changed over time for other avianspecies that have survived through this period, and why somespecies have been able to persist despite population declineswhile others became extinct.
The endemic Hawaiian petrel (Pterodroma sandwichensis)is a long-lived pelagic seabird. Its lifespan, perhaps reachingnearly 40 years, is among the longest for endemic Hawaiianspecies, and is primarily rivaled only by that of other seabirdsand perhaps the larger extinct flightless birds that formerlyinhabited the Islands (Simons 1984; Kaufman 2011). Subfossilbones of the Hawaiian petrel have been found on all of thehigh islands (Hawaii, Maui, Lanai, Molokai, Oahu, and Kauai)but the petrel’s range is considerably smaller today than it hasbeen in the past (fig. 2). The lowlands of Oahu were previouslythe home of a large petrel colony, but historical records for itare lacking, indicating that petrels may have been extirpatedfrom this island prior to the arrival of Europeans. Historicalaccounts indicate the presence of a large colony on Molokaiwith birds so plentiful that they “darkened the sky” (Munro1955), however recent survey trips have failed to locate asubstantial colony on this island (Simons and Hodges 1998).In the early and mid-1900s ornithologists feared that the spe-cies was extinct (Baldwin and Hubbard 1948; Banko 1980) dueto an apparent lack of sightings combined with large-scalehabitat destruction, the introduction of exotic mammalianpredators, as well as archeological evidence and historical ac-counts of direct human exploitation in the past (Athens et al.1991). Since that time the Hawaiian petrel has been rediscov-ered on four islands, (Hawaii, Maui, Lanai and Kauai; fig. 2),but colonies remain only in high elevation sites with ruggedterrain, whereas they were formerly more widely distributedfrom the coast up to the volcanic peaks (Olson and James1982b). Recent census population estimates range from atotal of 11,000 to 34,000 individuals with potentially 3,750to 4,500 breeding pairs (Spear et al. 1995). Census populationsizes on each island are not precisely known, but it is likelythat currently there are several thousand birds each on Maui,Lanai, and Kauai. On Hawaii, populations appear to bestrongly declining and there may be fewer than 500 birdsremaining (BirdLife International 2011).
Here we investigate the temporal population dynamics ofthe endangered Hawaiian petrel. We obtained mitochondrialCytochrome b sequences from 100 ancient, 28 historic, and289 modern Hawaiian petrel samples collected from all
islands where this bird has been known to breed, includingthe prehistorically extirpated colony on Oahu and a presum-ably historically extirpated colony on Molokai. We examinedpatterns of gene flow and divergence, as well as changes ineffective population size and genetic diversity over the last3,000 years beginning before, and extending through, thehuman era in the Hawaiian Islands.
Materials and Methods
Samples and Dating
A total of 512 Hawaiian petrel samples were obtained forpopulation genetic analyses (supplementary tables 1 and 2,Supplementary Material online). Of these, 289 samples wereobtained opportunistically from modern petrels on Hawaii,Maui, Lanai, and Kauai. Bone, feather, and tissue samples werecollected from carcasses of birds that had been depredated inbreeding colonies or that died as a result of grounding (e.g.,due to attraction of fledglings to artificial light sources). Bloodsamples collected from chicks in Haleakala National Park,Maui, were also obtained (Browne et al. 1997). Consideringthat nonbreeders appear to depart early in the season(Simons and Hodges 1998), we assume that birds found ona given island represent breeders or their offspring. We alsoobtained samples from 28 museum specimens that were col-lected from the potentially extirpated population on Molokai,in 1907 and 1914 and subsequently deposited at the BerniceP. Bishop Museum and at the Natural History Museum of LosAngeles County. Finally, 195 ancient Hawaiian petrel bonesamples from Hawaii, Maui, Lanai, Molokai, and Oahu, wereacquired from the Smithsonian’s National Museum onNatural History, the Bernice P. Bishop Museum, or collectedin the field at archeological and paleontological sites. No an-cient bones from Kauai were available for destructive analyses.In sites where skeletal remains were disarticulated, the sameskeletal element was sampled throughout (e.g., only righthumeri were sampled from that site) to prevent duplicatesampling of the same individual.
Radiocarbon dates of bones were obtained throughaccelerator mass spectrometry using a protocol modifiedfrom Stafford et al. (1991). Briefly, XAD-treated hydrolyzatesof gelatinized bone collagen were combusted to CO2, graph-itized, and dated at the W. M. Keck Carbon Cycle AcceleratorMass Spectrometry Lab, at University of California, Irvine.Since Hawaiian petrels forage at sea, they obtain all of theircarbon from the ocean. Due to a delay in mixing of carbonbetween the ocean and the atmosphere, as well as to mixingof ocean layers at upwelling zones (where some water hastraveled thousands of kilometers over a period of severalhundred years), carbon from the ocean is older and depletedin 14C relative to carbon in the atmosphere. Therefore radio-carbon dates from marine organisms can be biased by 200–800 years or more. We applied the global marine reservoircorrection (Hughen et al. 2004) plus a regional correction of54 years developed specifically for the Hawaiian petrel (datanot shown). Radiocarbon dates were calibrated using theprogram Calib v. 6.0 (Stuvier and Reimer 1993). The reportedages represent the median of the probability distribution and
3730
Welch et al. . doi:10.1093/molbev/mss185 MBE at Sm
ithsonian Institution Libraries on February 4, 2015
http://mbe.oxfordjournals.org/
Dow
nloaded from
are presented as calendar years before 1950 AD (supplemen-tary table 3, Supplementary Material online). Radiocarbondates were obtained for all bones found in paleontologicalcontexts. For bones found in archeological sites, we estimatedthe period of accumulation using a series of radiocarbondates. Since these bones were deposited over a short periodof time (�100 years), the remaining samples were either as-signed to the same time bin or given the average of themedian ages of the dated bones from the site, dependingon the analysis.
DNA Extraction, Amplification, and Sequencing
Genomic DNA was extracted from blood and tissue samplesusing the DNEasy tissue kit (Qiagen) and from bone, feather,and museum samples via phenol/chloroform extraction andcentrifugal dialysis (Fleischer et al. 2000). Stringent protocolswere maintained to prevent contamination of ancient sam-ples. All extractions for ancient and historical samples wereperformed in a dedicated ancient DNA laboratory that wasphysically isolated from all polymerase chain reaction (PCR)products. Multiple extraction and negative reagent controlswere also used to detect contamination. Additionally, fornearly 50% of the ancient and 100% of the historical samples,a sample from various different species was extracted inbetween Hawaiian petrel samples. These nonpetrel sampleswere amplified with petrel-specific primers to detectcross-contamination. For the remaining ancient samplesHawaiian petrel bones from different islands were alternatedwhenever possible. Initial mitochondrial DNA sequencing often ancient DNA extracts indicated the presence of cytosinedeamination artifacts in three samples. Therefore, sampleswere treated with uracil-DNA glycosylase to eliminate thesemiscoding lesions (Hofreiter et al. 2001). For all ancient DNAsamples from bone, 50�l aliquots were incubated with 1Xuracil-DNA glycosylase buffer and 1 unit uracil-DNA glycosy-lase at 37�C for 10 min, followed by incubation with 1 unituracil glycosylase inhibitor (New England Biolabs) at 37�C for10 min, and a final incubation at 95�C for 10 min.
Since there is a duplication of the mitochondrial controlregion in procellariiform seabirds (Abbott et al. 2005), weamplified a 524 bp portion of the 50 variable region of themitochondrial Cytochrome b gene, which has been widelyused for seabird studies and has high levels of variation inthe Hawaiian petrel (Nunn and Stanley 1998; Welch et al.2012). For ancient, historical, and degraded modern sampleswe amplified seven short (<150 bp) overlapping fragments(supplementary table 4, Supplementary Material online), andfor ancient and historical samples each of these was amplifiedat least twice. PCR and sequencing were carried out as inWelch et al. (2012). Briefly, PCR was conducted with 15�ltotal reaction volumes, 1 unit AmpliTaq Gold DNA polymer-ase (Applied Biosystems), 1–2�l DNA template, with 35cycles for modern samples, and 25�l total reaction volumes,1 unit Amplitaq Gold DNA polymerase, 2–4�l DNA tem-plate, and 45 cycles for ancient and historical samples. Allfragments were electrophoresed in an ABI 3130 xL GeneticAnalyzer (Applied Biosystems) and sequences were aligned
and visually inspected in Sequencher v 4.9 (GeneCodes).Sequences were deposited in the GenBank database underaccession numbers JN015536-JN015862 and HQ420351-HQ420378. We also attempted to amplify nuclear intronand microsatellite loci in ancient and historical samples, butsuccess was low. Consequently, these data were not utilized infurther analyses.
Data Analysis
Sequences were characterized in MacClade v. 4.08 (Maddisonand Maddison 2008) and translated in Dambe v. 1.5.2 (Xiaand Xie 2001) to examine the potential presence of nuclearcopies in the mitochondrial data set (Sorenson and Fleischer1996). Of the 51 variable sites found, 21% occurred in the firstcodon position, 4% occurred in the second, and 75% occurredin the third. Ninety-one percent exhibited transitions. Therewere no gaps in the alignment and after translation zerononsense or stop codons were found. This evidence indicatesthat a mitochondrial, and not nuclear, origin of the sequencesis likely. The program jModelTest v. 0.1 (Posada 2008) and theBayesian information criterion (BIC) were utilized to select thebest fitting substitution model: the Hasegawa–Kishino–Yano(HKY) model with rate heterogeneity among sites modeledby a gamma distribution. To depict the relationship betweenhaplotypes a statistical parsimony network was created inTCS v. 1.21 with a 95% connection limit.
Levels of differentiation were investigated between birdssampled on each island, including between modern samplesand those from the extirpated colonies on Oahu and Molokai.We estimated pairwise FST values in Arlequin v. 3.1 (Excoffieret al. 2005) from a Kimura two-parameter distance matrix.Depaulis et al. (2009) demonstrated that there could be biasin summary statistics, such as FST, calculated from heterochro-nous (i.e., ancient DNA) data sets. However, bias should besmall if sampling occurs over a relatively short time as com-pared with evolutionary time. Here, corrected and uncor-rected estimates of FST differed by at most 0.002, and souncorrected estimates are shown. Significance of P-valueswas determined after sequential Bonferroni correction formultiple tests (Rice 1989).
Several methods were used to investigate temporalchanges in effective population size and genetic diversity.First, Bayesian skyride analyses were conducted for samplescollected on Hawaii and Maui utilizing BEAST v.1.6.1(Bayesian Evolutionary Analysis by Sampling Trees;Drummond and Rambaut 2007; Ho and Shapiro 2011). Theanalyses were performed using a starting tree generated inGarli v. 0.96b (Zwickl 2006) and the HKY + G substitutionmodel. We used a log-normal distribution representing the95% confidence interval of the radiocarbon date as a prior onthe sampling time for ancient samples and an uninformativeprior on effective population size (i.e., bounded between 0and infinity). Analyses were also performed with and withouta model of DNA damage (Rambaut et al. 2009) as well asunder the coalescent constant population size model, forcomparison. Analyses were performed for 1.5� 108 genera-tions sampling every 2,000 generations. Convergence was
3731
Genetic Stability Despite Decline in Petrels . doi:10.1093/molbev/mss185 MBE at Sm
ithsonian Institution Libraries on February 4, 2015
http://mbe.oxfordjournals.org/
Dow
nloaded from
assessed through multiple independent runs, and effectivesample sizes were examined in Tracer v. 1.5 (Drummondand Rambaut 2007). Support for various models was com-pared using Bayes factors, as estimated in Tracer (Kass andRaftery 1995; Suchard et al. 2001).
In addition to coalescent-based estimation of changes ineffective population size, we utilized the “temporal alleles”approach to estimate the variance effective population size.This method estimates the harmonic mean of Ne in the timeperiod between the sampling points by assuming thatchanges in allele frequencies are due to genetic drift(Luikart et al. 2010). Samples were binned by age (e.g., sup-plementary tables 9–11, Supplementary Material online) andany sequences with greater than 15% missing data were ex-cluded from the analysis. We also excluded samples olderthan 1,000 years because of the comparatively low samplesize. Estimates were obtained using the program TM3.1(Berthier et al. 2002) assuming a maximum Ne of 100,000with 20,000 iterations. The maximum Ne value of 100,000was selected because reviews of the literature (Frankham1995) have suggested that, on average, the ratio of effectiveto census size for wildlife populations may be approximately0.10, and because subfossil evidence indicates that prior tohuman colonization of the Hawaiian Islands the Hawaiianpetrel was likely very abundant. This species may have beenthe most abundant seabird in the main islands, quite possiblyreaching population levels of one million or more individuals.Similar levels are seen in some modern seabird species, like theLaysan albatross (Phoebastria immutabilis), which breeds pri-marily in the Northwestern Hawaiian Islands (Naughton et al.2007). For comparison with temporal estimates of changes inNe, nucleotide diversity and gene diversity were calculated forthe same samples using Arlequin.
To further examine Hawaiian petrel population dynamicsover the past century, when it was feared that this species wasextinct but then later rediscovered, we modeled the censuspopulation growth rate under various scenarios. This allowedus to investigate whether it is biologically possible for petrelsto have been near extinction in the recent past and then haveundergone a demographic recovery to their current censuspopulation sizes. The last major record of the Hawaiian petrelfrom the early 20th century is from W. A. Bryan in 1914, whowas collecting on Molokai and noted that population sizeswere decreasing, likely due to predation (Bryan 1908; Banko1980). After this, to our knowledge, there were no documen-ted Hawaiian petrel sightings and no known breeding colo-nies until 1964 when between 150 and 300 birds werediscovered in Haleakala National Park, Maui (Banko 1980).By 1995, Spear et al. estimated that there were 11,000–34,000 individuals, based on at-sea sightings. Since Hawaiianpetrels have a long lifespan, delayed sexual maturity, and lowannual fecundity, they have a very low population growthrate. We used the exponential growth equation Nt = N0e
rt tomodel census population growth rates and test the hypoth-esis that petrels were near extinction around 1915. Here Nrepresents census population size, r represents growth rate,and t represents time (in years). We tested various values foreach parameter of the model (supplementary table 5,
Supplementary Material online). For example, we held time(t) constant at 80 years (the difference between 1915 and1995), held current census population size (Nt) constant at11,000 (the lower 95% confidence interval of census popula-tion size in 1995) then varied the initial census population size(N0) and estimated the necessary growth rate. This shouldresult in an estimate of the absolute minimum requiredgrowth rate since it allows the longest period of recovery,the smallest amount of growth necessary, and assumes thatresources are unlimited and that there is no predation.Logically, if growth rates estimated for Hawaiian petrelsbased on field observations are much lower than the absoluteminimum required, then it would be unlikely that petrels hadever reached very small census population sizes (e.g., 250 in-dividuals) in the past.
Finally, we conducted simulations to investigate the effectof generation time on the retention of genetic diversity. Allsimulations were conducted using the program BottleSim(Kuo and Janzen 2003) and assumed the absence of geneflow and selection. Initial genetic diversity for all species wasset to match the haplotype frequencies observed in the an-cient Hawaiian petrels from the island of Hawaii (supplemen-tary table 6, Supplementary Material online). This data setwas selected because it represented the most extensive sam-pling. We simulated a decline in effective population size 150years ago to a stable Ne of 250 individuals and examined theeffect of generation time on expected heterozygosity andallelic richness. In this way we could test how genetic diversitywould change for multiple species with differing life historystrategies if they had started with the exact same levels ofgenetic diversity and undergone the exact same populationdecline. We also performed simulations using a set of arbi-trarily chosen allele frequencies (supplementary table 6,Supplementary Material online). We tested life history strat-egies that included that of the Hawaiian petrel as well ofother endemic species that live in Hawaii or for which ancientDNA has been used to investigate changes in genetic diversityover time (supplementary table 7, Supplementary Materialonline). Life history information was obtained from the liter-ature (Laursen and Bekoff 1978; Meagher 1986; Lent 1988;Banko et al. 1999; Banko et al. 2002; Debruyne et al. 2008).We also used simulations to investigate the severity of adecline needed to result in a decrease in genetic diversityof the Hawaiian petrel, given its life history characteristics.We simulated a decline 150 years ago to various effectivepopulation sizes ranging from 10 to 1000, while holding gen-eration time constant. One hundred iterations were per-formed for each simulation.
Results and DiscussionMitochondrial DNA sequences were obtained from a totalof 417 Hawaiian petrel samples, representing a period ofapproximately 3500 years (supplementary tables 1–3,Supplementary Material online). Success rates for ancientDNA recovery ranged from 18% to 76% per island for ancientbone samples and 100% for historical museum specimenscollected on Molokai in 1907 and 1914 (supplementaryfig. 1, Supplementary Material online). The sequence length
3732
Welch et al. . doi:10.1093/molbev/mss185 MBE at Sm
ithsonian Institution Libraries on February 4, 2015
http://mbe.oxfordjournals.org/
Dow
nloaded from
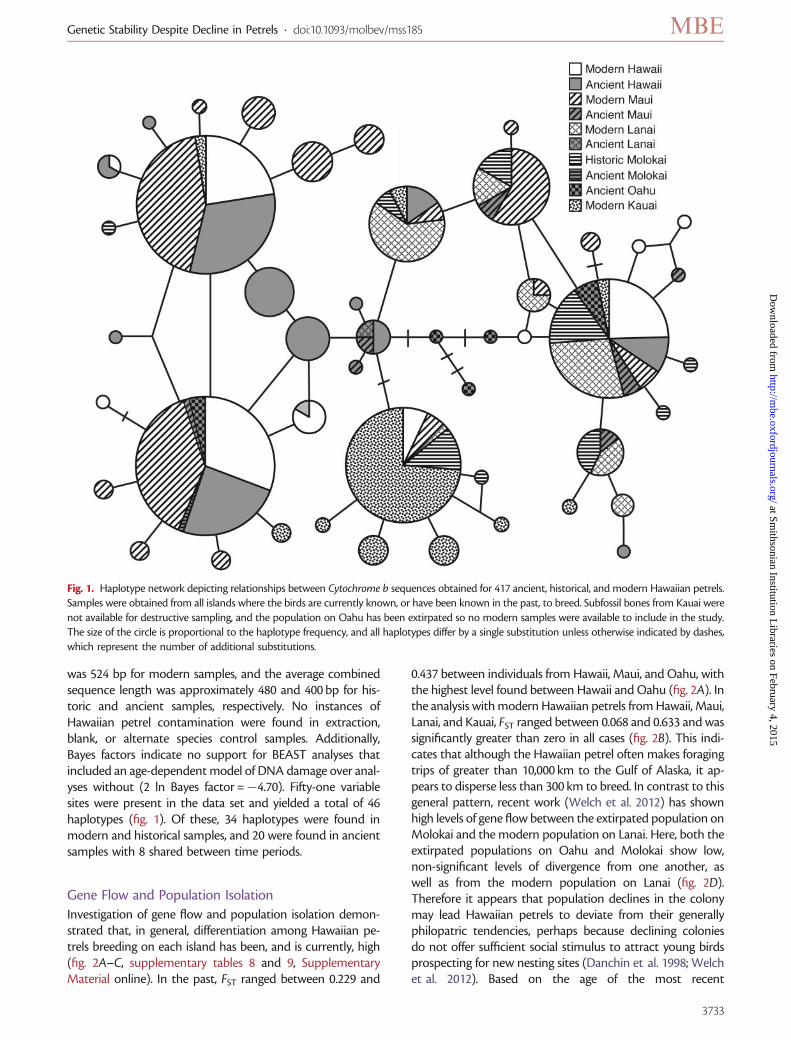
was 524 bp for modern samples, and the average combinedsequence length was approximately 480 and 400 bp for his-toric and ancient samples, respectively. No instances ofHawaiian petrel contamination were found in extraction,blank, or alternate species control samples. Additionally,Bayes factors indicate no support for BEAST analyses thatincluded an age-dependent model of DNA damage over anal-yses without (2 ln Bayes factor =�4.70). Fifty-one variablesites were present in the data set and yielded a total of 46haplotypes (fig. 1). Of these, 34 haplotypes were found inmodern and historical samples, and 20 were found in ancientsamples with 8 shared between time periods.
Gene Flow and Population Isolation
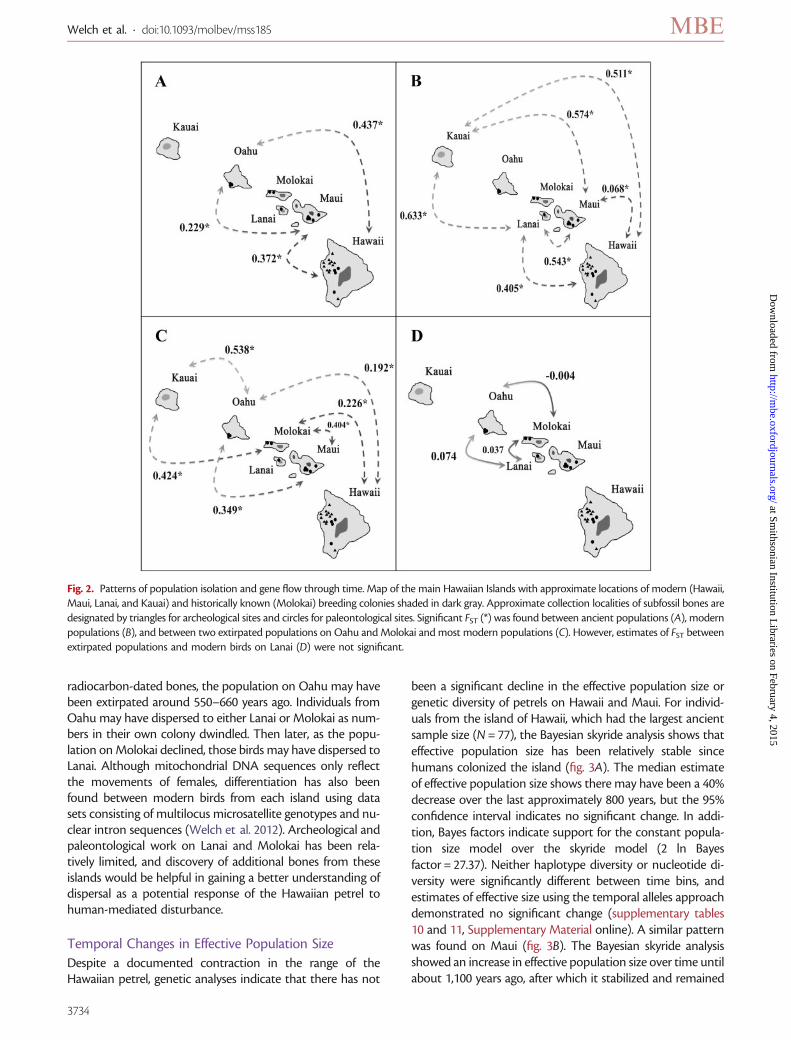
Investigation of gene flow and population isolation demon-strated that, in general, differentiation among Hawaiian pe-trels breeding on each island has been, and is currently, high(fig. 2A–C, supplementary tables 8 and 9, SupplementaryMaterial online). In the past, FST ranged between 0.229 and
0.437 between individuals from Hawaii, Maui, and Oahu, withthe highest level found between Hawaii and Oahu (fig. 2A). Inthe analysis with modern Hawaiian petrels from Hawaii, Maui,Lanai, and Kauai, FST ranged between 0.068 and 0.633 and wassignificantly greater than zero in all cases (fig. 2B). This indi-cates that although the Hawaiian petrel often makes foragingtrips of greater than 10,000 km to the Gulf of Alaska, it ap-pears to disperse less than 300 km to breed. In contrast to thisgeneral pattern, recent work (Welch et al. 2012) has shownhigh levels of gene flow between the extirpated population onMolokai and the modern population on Lanai. Here, both theextirpated populations on Oahu and Molokai show low,non-significant levels of divergence from one another, aswell as from the modern population on Lanai (fig. 2D).Therefore it appears that population declines in the colonymay lead Hawaiian petrels to deviate from their generallyphilopatric tendencies, perhaps because declining coloniesdo not offer sufficient social stimulus to attract young birdsprospecting for new nesting sites (Danchin et al. 1998; Welchet al. 2012). Based on the age of the most recent
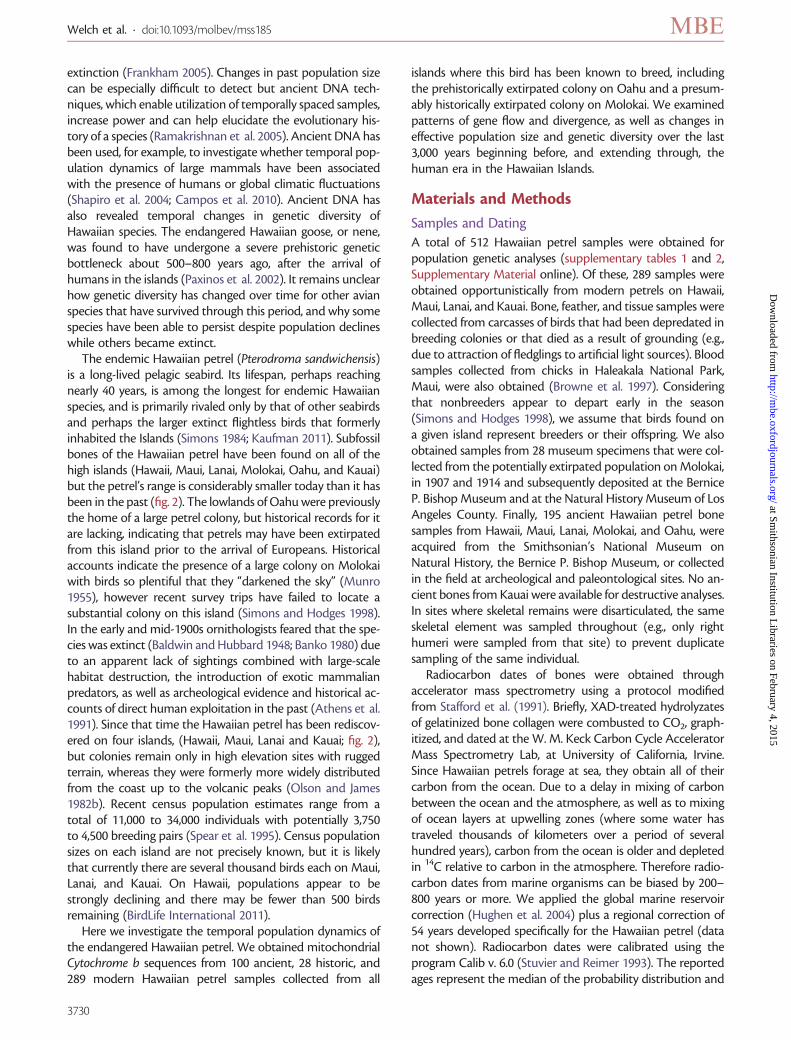
Fig. 1. Haplotype network depicting relationships between Cytochrome b sequences obtained for 417 ancient, historical, and modern Hawaiian petrels.Samples were obtained from all islands where the birds are currently known, or have been known in the past, to breed. Subfossil bones from Kauai werenot available for destructive sampling, and the population on Oahu has been extirpated so no modern samples were available to include in the study.The size of the circle is proportional to the haplotype frequency, and all haplotypes differ by a single substitution unless otherwise indicated by dashes,which represent the number of additional substitutions.
3733
Genetic Stability Despite Decline in Petrels . doi:10.1093/molbev/mss185 MBE at Sm
ithsonian Institution Libraries on February 4, 2015
http://mbe.oxfordjournals.org/
Dow
nloaded from
radiocarbon-dated bones, the population on Oahu may havebeen extirpated around 550–660 years ago. Individuals fromOahu may have dispersed to either Lanai or Molokai as num-bers in their own colony dwindled. Then later, as the popu-lation on Molokai declined, those birds may have dispersed toLanai. Although mitochondrial DNA sequences only reflectthe movements of females, differentiation has also beenfound between modern birds from each island using datasets consisting of multilocus microsatellite genotypes and nu-clear intron sequences (Welch et al. 2012). Archeological andpaleontological work on Lanai and Molokai has been rela-tively limited, and discovery of additional bones from theseislands would be helpful in gaining a better understanding ofdispersal as a potential response of the Hawaiian petrel tohuman-mediated disturbance.
Temporal Changes in Effective Population Size
Despite a documented contraction in the range of theHawaiian petrel, genetic analyses indicate that there has not
been a significant decline in the effective population size orgenetic diversity of petrels on Hawaii and Maui. For individ-uals from the island of Hawaii, which had the largest ancientsample size (N = 77), the Bayesian skyride analysis shows thateffective population size has been relatively stable sincehumans colonized the island (fig. 3A). The median estimateof effective population size shows there may have been a 40%decrease over the last approximately 800 years, but the 95%confidence interval indicates no significant change. In addi-tion, Bayes factors indicate support for the constant popula-tion size model over the skyride model (2 ln Bayesfactor = 27.37). Neither haplotype diversity or nucleotide di-versity were significantly different between time bins, andestimates of effective size using the temporal alleles approachdemonstrated no significant change (supplementary tables10 and 11, Supplementary Material online). A similar patternwas found on Maui (fig. 3B). The Bayesian skyride analysisshowed an increase in effective population size over time untilabout 1,100 years ago, after which it stabilized and remained
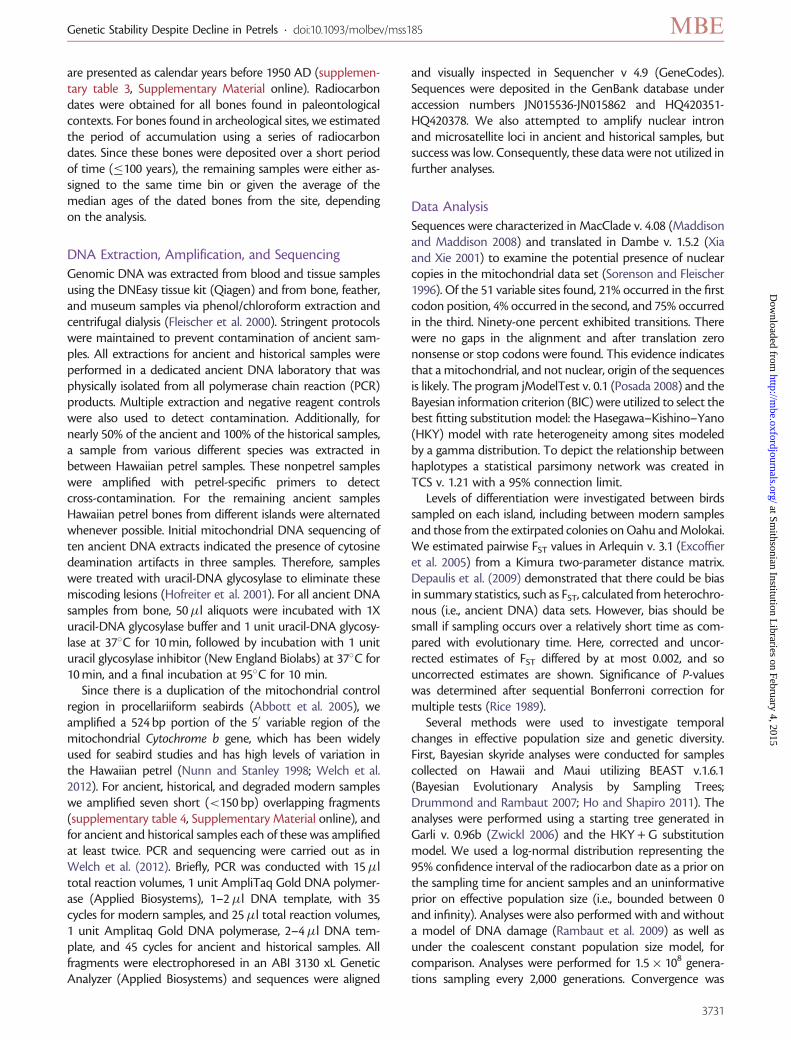
Fig. 2. Patterns of population isolation and gene flow through time. Map of the main Hawaiian Islands with approximate locations of modern (Hawaii,Maui, Lanai, and Kauai) and historically known (Molokai) breeding colonies shaded in dark gray. Approximate collection localities of subfossil bones aredesignated by triangles for archeological sites and circles for paleontological sites. Significant FST (*) was found between ancient populations (A), modernpopulations (B), and between two extirpated populations on Oahu and Molokai and most modern populations (C). However, estimates of FST betweenextirpated populations and modern birds on Lanai (D) were not significant.
3734
Welch et al. . doi:10.1093/molbev/mss185 MBE at Sm
ithsonian Institution Libraries on February 4, 2015
http://mbe.oxfordjournals.org/
Dow
nloaded from
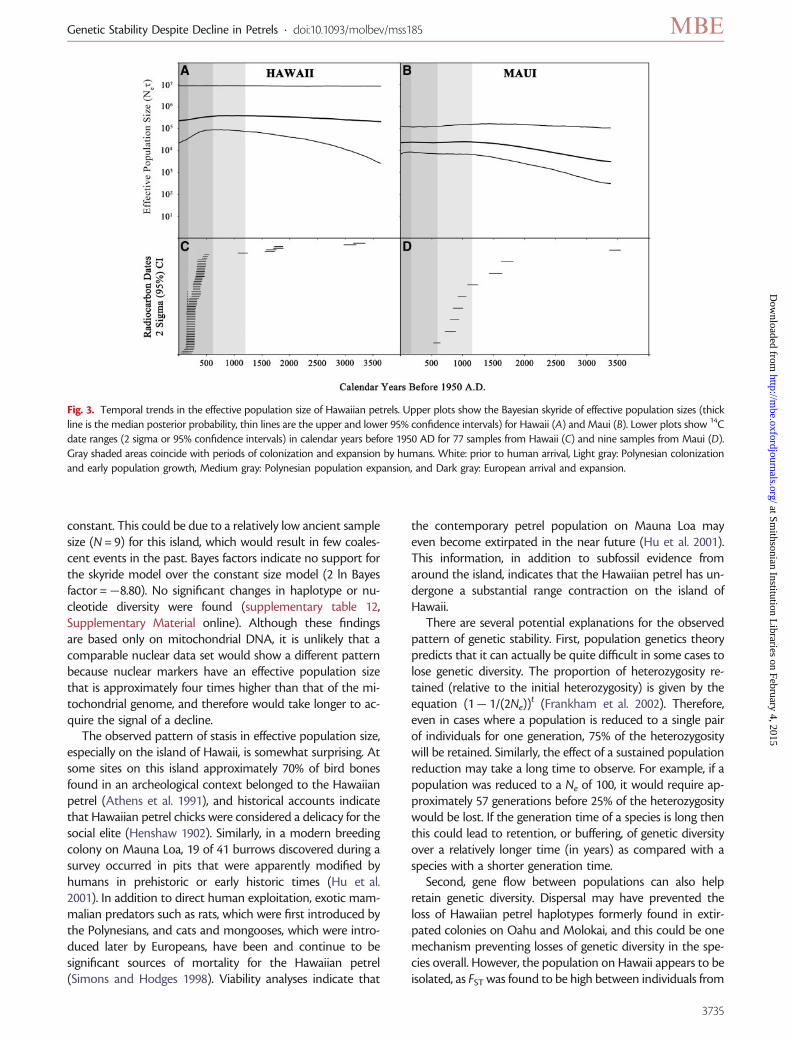
constant. This could be due to a relatively low ancient samplesize (N = 9) for this island, which would result in few coales-cent events in the past. Bayes factors indicate no support forthe skyride model over the constant size model (2 ln Bayesfactor =�8.80). No significant changes in haplotype or nu-cleotide diversity were found (supplementary table 12,Supplementary Material online). Although these findingsare based only on mitochondrial DNA, it is unlikely that acomparable nuclear data set would show a different patternbecause nuclear markers have an effective population sizethat is approximately four times higher than that of the mi-tochondrial genome, and therefore would take longer to ac-quire the signal of a decline.
The observed pattern of stasis in effective population size,especially on the island of Hawaii, is somewhat surprising. Atsome sites on this island approximately 70% of bird bonesfound in an archeological context belonged to the Hawaiianpetrel (Athens et al. 1991), and historical accounts indicatethat Hawaiian petrel chicks were considered a delicacy for thesocial elite (Henshaw 1902). Similarly, in a modern breedingcolony on Mauna Loa, 19 of 41 burrows discovered during asurvey occurred in pits that were apparently modified byhumans in prehistoric or early historic times (Hu et al.2001). In addition to direct human exploitation, exotic mam-malian predators such as rats, which were first introduced bythe Polynesians, and cats and mongooses, which were intro-duced later by Europeans, have been and continue to besignificant sources of mortality for the Hawaiian petrel(Simons and Hodges 1998). Viability analyses indicate that
the contemporary petrel population on Mauna Loa mayeven become extirpated in the near future (Hu et al. 2001).This information, in addition to subfossil evidence fromaround the island, indicates that the Hawaiian petrel has un-dergone a substantial range contraction on the island ofHawaii.
There are several potential explanations for the observedpattern of genetic stability. First, population genetics theorypredicts that it can actually be quite difficult in some cases tolose genetic diversity. The proportion of heterozygosity re-tained (relative to the initial heterozygosity) is given by theequation (1� 1/(2Ne))
t (Frankham et al. 2002). Therefore,even in cases where a population is reduced to a single pairof individuals for one generation, 75% of the heterozygositywill be retained. Similarly, the effect of a sustained populationreduction may take a long time to observe. For example, if apopulation was reduced to a Ne of 100, it would require ap-proximately 57 generations before 25% of the heterozygositywould be lost. If the generation time of a species is long thenthis could lead to retention, or buffering, of genetic diversityover a relatively longer time (in years) as compared with aspecies with a shorter generation time.
Second, gene flow between populations can also helpretain genetic diversity. Dispersal may have prevented theloss of Hawaiian petrel haplotypes formerly found in extir-pated colonies on Oahu and Molokai, and this could be onemechanism preventing losses of genetic diversity in the spe-cies overall. However, the population on Hawaii appears to beisolated, as FST was found to be high between individuals from
Fig. 3. Temporal trends in the effective population size of Hawaiian petrels. Upper plots show the Bayesian skyride of effective population sizes (thickline is the median posterior probability, thin lines are the upper and lower 95% confidence intervals) for Hawaii (A) and Maui (B). Lower plots show 14Cdate ranges (2 sigma or 95% confidence intervals) in calendar years before 1950 AD for 77 samples from Hawaii (C) and nine samples from Maui (D).Gray shaded areas coincide with periods of colonization and expansion by humans. White: prior to human arrival, Light gray: Polynesian colonizationand early population growth, Medium gray: Polynesian population expansion, and Dark gray: European arrival and expansion.
3735
Genetic Stability Despite Decline in Petrels . doi:10.1093/molbev/mss185 MBE at Sm
ithsonian Institution Libraries on February 4, 2015
http://mbe.oxfordjournals.org/
Dow
nloaded from
Hawaii, Maui, and Oahu in the past and between modernindividuals from all islands where this species is currentlyknown to breed.
Third, high levels of genetic diversity would be maintainedif perhaps the decline in census population size of theHawaiian petrel was not as severe as previously thought.Burrow nesting seabirds can be difficult to study. Many spe-cies are morphologically similar, making taxonomic identifi-cation at sea, and hence estimation of population sizes,challenging (Spear et al. 1995). Additionally, colonies can bedifficult to locate, particularly for nocturnal species.Identification of colony locations has only recently becomemore successful through implementation of several techno-logical advances, such as radiotelemetry and marine surveil-lance radar surveys (Lawrence et al. 2008). Indeed, it isunderstandable that the Hawaiian petrel may have been over-looked. This species spends the majority of its life at sea, onlycoming to land for short periods to incubate or feed theirchicks. Even then it returns to breeding colonies nocturnally,nesting in burrows that can be greater than 2 m long. Inaddition, extant colonies occur in rugged terrain and can beextremely challenging to access (Simons and Hodges 1998).
Finally, this pattern of stability could be caused by lowpower in the data set. Here, mitochondrial DNA sequencescontained 51 variable sites, from which 46 haplotypes werediscovered, suggesting relatively high levels of variability. Also,on Hawaii, ancient samples (N = 77) outnumbered themodern samples (N = 71). Additionally, other studies havebeen able to detect changes in effective population sizeover time using mitochondrial sequences of similar length(Shapiro et al. 2004; Campos et al. 2010). Although this indi-cates that this approach should have sufficient power todetect changes, at least in some circumstances, it can beparticularly difficult to detect bottlenecks that do notreduce the population size by less than approximately 50%.Large nuclear data sets, perhaps consisting of data from tensor hundreds of thousands of SNPs, would likely give sufficientpower to detect such fine scale changes in genetic diversity(Mourier et al. forthcoming). Next-generation sequencing
approaches have the ability to generate these types of datasets, and genomic scale studies are becoming increasinglyfeasible in non-model organisms (Ekblom and Galindo2011), but obtaining genome sequences from ancient samplesis still challenging (Orlando et al. 2011). Future work mayprovide these resources for the Hawaiian petrel.
Therefore two explanations remain for the observed pat-tern of genetic stability: (1) the decline in census populationsize of the Hawaiian petrel was not as severe as previouslythought, and/or (2) perhaps the long generation time of thisspecies is buffering it against loss of genetic diversity over theshort term.
Demographic Modeling
We used demographic models to investigate if the Hawaiianpetrel, as a species, could have been on the brink of extinctionin the mid-1900s, as previously feared, given their life historyand recent estimates of census population size. We utilizedthe exponential growth model, since this model should givethe absolute minimum growth rate required for recoveryduring this period, and then we compared these minimumnecessary growth rates with rates obtained from observationsin the field. If the Hawaiian petrel could not achieve even theminimum modeled growth rate, then it is highly unlikely theycould have achieved rates necessary for demographic recov-ery to current census population size estimates, especiallywhen taking into account predation from introducedmammals.
Assuming that the Hawaiian petrel was near extinction(i.e., 200 birds) in 1915, the year after the last majormuseum collection, a breeding frequency of 89%, annualadult survival of 93%, juvenile survival of 80%, and the max-imum reproductive success of 72% observed during athree-year field study of this species (Simons 1984), agrowth rate of 0.050 would be required to reach a censussize of 11,000 individuals, the lower 95% confidence limit ofthe estimated census population size in 1995 (supplementarytable 5, Supplementary Material online; Spear et al. 1995).
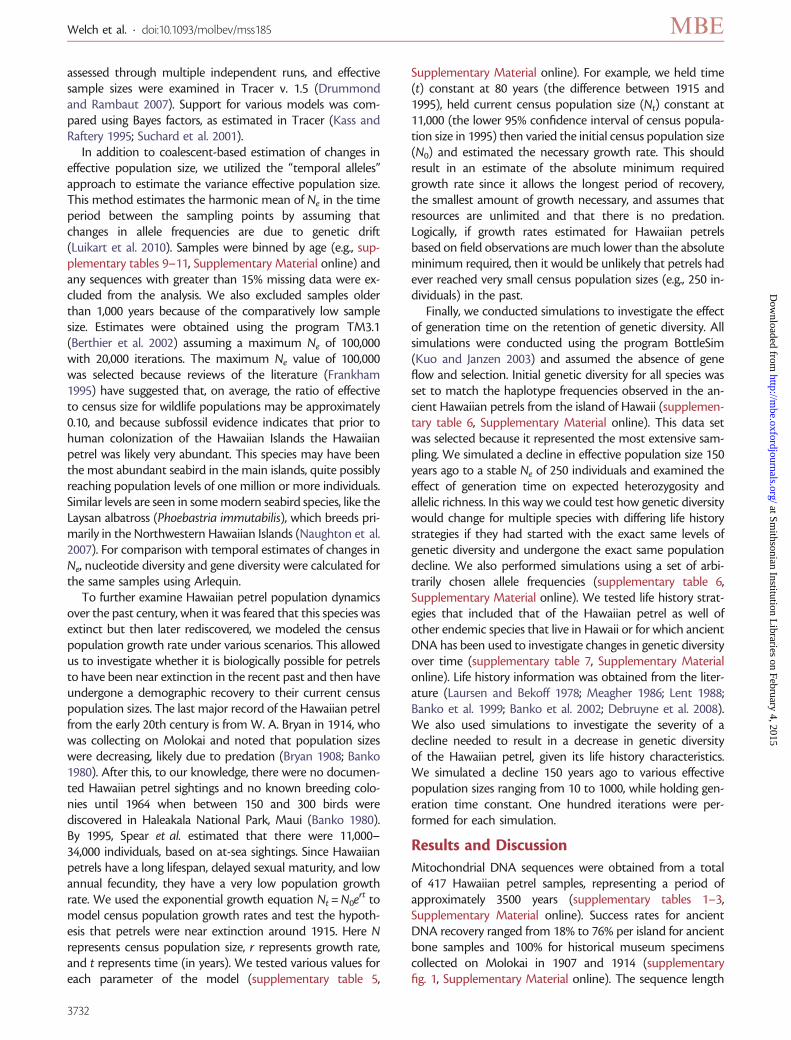
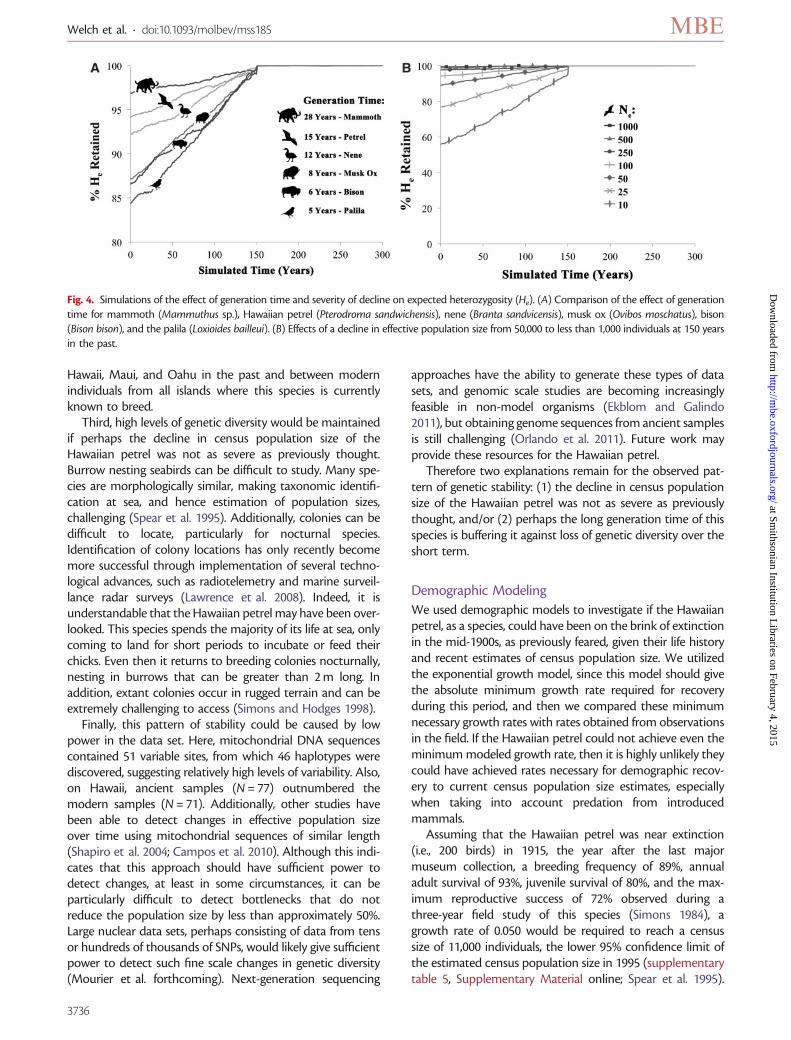
Fig. 4. Simulations of the effect of generation time and severity of decline on expected heterozygosity (He). (A) Comparison of the effect of generationtime for mammoth (Mammuthus sp.), Hawaiian petrel (Pterodroma sandwichensis), nene (Branta sandvicensis), musk ox (Ovibos moschatus), bison(Bison bison), and the palila (Loxioides bailleui). (B) Effects of a decline in effective population size from 50,000 to less than 1,000 individuals at 150 yearsin the past.
3736
Welch et al. . doi:10.1093/molbev/mss185 MBE at Sm
ithsonian Institution Libraries on February 4, 2015
http://mbe.oxfordjournals.org/
Dow
nloaded from
This is an order of magnitude larger than highest growth rateof 0.005 observed for a population of petrels studied on theisland of Maui, where predator control programs were alreadyin effect. This is also almost an order of magnitude larger thanthe growth rate of 0.008 resulting from the best possibleprojected scenario of 75% reproductive success proposedby Simons (1984). Therefore, it appears unlikely that theHawaiian petrel was near extinction in the beginning of thelast century. Probably more, and perhaps many more, indi-viduals remained during the mid-1900s.
Simulated Declines in Effective Population Size
Although Hawaiian petrel populations may not have declinedto the brink of extinction, the distribution of subfossil bonessuggest that they were much more abundant in the past andthat colonies were more widely distributed than they aretoday (Olson and James 1982b; Athens et al. 1991).Therefore it is possible that the long generation time of theHawaiian petrel is buffering it against an immediate, substan-tial loss of genetic diversity (Amos and Balmford 2001). TheHawaiian petrel is thought to have an average lifespan of 36years, and begins breeding in its fifth or sixth year, producingjust a single offspring per year after that (Simons 1984). Weperformed simulations to explore the effect of generationtime (i.e., the midpoint, or half the difference, between lon-gevity and age at first reproduction) on the retention of ge-netic diversity when Ne was held at 100 for 150 years.
We compared the life history characteristics of theHawaiian petrel with those of other species for which changesin genetic diversity have been investigated using ancient DNA(Paxinos et al. 2002; Shapiro et al. 2004; Debruyne et al. 2008;Campos et al. 2010), or which have also survived human ar-rival in Hawaii. These included continental species such aswoolly mammoths, musk ox, and bison, and endemicHawaiian species, such as the nene (the Hawaiian goose),and the endangered Hawaiian honeycreeper, the palila. Lifehistory characteristics for the mammoth were inferred frommodern proboscideans (elephants). Similar to other reportsand consistent with population genetics theory (Amos andBalmford 2001; Hailer et al. 2006), we found that longer gen-eration times resulted in the retention of higher levels ofexpected heterozygosity as well as allelic richness (fig. 4A,supplementary fig. 2A, Supplementary Material online). Thisis because a period of 150 years represents fewer generationsduring which genetic diversity can be lost for long-lived com-pared with short-lived organisms. Overall, species with gen-eration times greater than 15 years lost only 5% or less of theirexpected heterozygosity, whereas when generation timeswere less than 10 years losses were nearly double. Thepalila, one example of an endangered endemic Hawaiian hon-eycreeper that has survived human colonization of theHawaiian Islands, has the shortest generation time (5 years)of the species modeled here and demonstrates the strongestdecline (16%). Mammoths and Hawaiian petrels, on the otherhand, have the longest generation times (28 and 15 years,respectively), and show the lowest losses of genetic diversity,just 3–6%. Bison and musk ox, with generation times of 6 and
8 years, respectively, show intermediate losses (about 13%).Simulations using arbitrarily chosen allele frequenciesdemonstrated the same patterns (supplementary fig. 3,Supplementary Material online).
If all else were equal it might be expected that studies oflong-lived species like Hawaiian petrels and mammothswould show fewer or less substantial changes in effectivepopulation size over time than either bison or musk ox.This is consistent with empirical findings (Shapiro et al.2004; Debruyne et al. 2008; Campos et al. 2010). Neneshould be intermediate between these groups, and changesin genetic diversity have been found (Paxinos et al. 2002). Ofcourse, in reality, many assumptions of these simulations maybe violated. For example, even if generation time is very short,gene flow may prevent significant losses of genetic diversity.Also, life history is more complex than that modeled here,including biased sex ratios, nonrandom mating, and, for somespecies, multiple offspring per reproductive event.Additionally, levels of initial genetic diversity and severity ofpopulation declines were not the same in each of the casesmentioned above. However, despite these violations, simula-tions suggest that the generation time of an organism maytemporarily mask temporal changes in genetic diversity, forexample, in response to climate change or anthropogenicimpacts, and therefore careful interpretation of observed pat-terns is required.
Finally, we conducted simulations in order to determinethe severity of a population decline that would be required toreduce genetic diversity in the Hawaiian petrel. Simulationswere conducted of a decline in effective population size from50,000 to 1,000 individuals or fewer. Results indicate that avery severe decline would be required to lose substantial levelsof genetic diversity, even over long periods of time. Effectivepopulation size could decrease to 50 individuals and remainthere for 150 years and only 10% of the expected heterozy-gosity would be lost (fig. 4B, supplementary fig. 2B,Supplementary Material online). More severe declines, to aNe of 25 or 10, resulted in a loss of 23% and 44% of theexpected heterozygosity, respectively.
Extinction versus Persistence
There has been increasing interest in determining which char-acteristics of species may be related to extinction versus per-sistence. Lorenzen et al. (2011) investigated extinctions ofcontinental mammalian megafauna during the LateQuaternary period. For both the woolly mammoth and thewoolly rhinoceros genetic diversity appears to have beenstable over time, similar to the trend observed in theHawaiian petrel. The buffering effect of long generationtime on genetic diversity could, in the short term, preventthe marked effects of inbreeding and may enable species toavoid the extinction vortex (Gilpin and Soule 1986; Saccheriet al. 1998). However, long-lived species, such as the Hawaiianpetrel, may still be vulnerable to stochastic events when pop-ulations decline to very small sizes.
Lorenzen et al. (2011) also found evidence of populationisolation in the mammoth, rhinoceros, and Eurasian musk ox
3737
Genetic Stability Despite Decline in Petrels . doi:10.1093/molbev/mss185 MBE at Sm
ithsonian Institution Libraries on February 4, 2015
http://mbe.oxfordjournals.org/
Dow
nloaded from
prior to their extinction. Populations of the Hawaiian petreldemonstrated a general pattern of isolation as well; however,there was substantial gene flow between extirpated coloniesand the contemporary colony on Lanai. Gene flow can helpincrease and/or maintain genetic diversity, prevent inbreed-ing, and aid in demographic recovery (Johnson et al. 2010),and therefore such dispersal may be one mechanism contrib-uting toward the persistence of this species.
Lorenzen et al. (2011) also investigated the role of humanencroachment on the extinction of the woolly rhinoceros andthe mammoth. Humans did not appear to be associated withextinction of the rhinoceros, but may have played a role in theextinction of the mammoth due to direct exploitation.Humans certainly have had direct impacts on Hawaiianpetrel abundance, as indicated by archeological evidenceand historical accounts (Henshaw 1902; Athens et al. 1991).However, the introduction of exotic mammals has also hadlarge impacts on the Hawaiian petrel, through greatly in-creased predation rates and severe habitat degradation(Athens et al. 2002; Carlile et al. 2003). Although directhuman exploitation of this species has substantially decreasedin recent times, the legacy of indirect human impacts, such asthe introduction of exotic mammalian species, may alwayshaunt the Hawaiian petrel.
Overall, it appears that a combination of long generationtime and the ability to disperse may have allowed geneticdiversity to remain relatively stable in the Hawaiian petreldespite a demographic decline. Given that many seabird spe-cies demonstrate similar life history strategies, this could alsoaccount for the observation that although populations ofmany seabirds have been extirpated, relatively few specieshave gone extinct (Steadman 1995). However, these life his-tory strategies may represent a double-edged sword. If a cer-tain level of social stimulus is required for dispersal to occur,then Hawaiian petrels may be unlikely to colonize new sites.Consequently, this species may become increasingly vulnera-ble to extinction in the future, especially if the remainingcontemporary breeding colonies become extirpated or de-cline substantially. Additionally, the buffering effect of gener-ation time on levels of genetic diversity in the Hawaiian petrelis likely to only be temporary, particularly if census populationsizes continue to decline or if they become very small formany generations. Unfortunately, the long generation timeof the Hawaiian petrel will also prevent quick populationgrowth. Following a severe decline, slow demographic recov-ery could result in increased extinction risk due to stochasticevents, an extended population bottleneck, and a longerperiod of time during which genetic diversity would be vul-nerable to loss (Allendorf and Luikart 2007). Therefore, it maybe best for conservation management actions to focus onincreasing the population growth rate on each island beforeit is too late.
Even in the absence of extinction or decreases in geneticdiversity, the documented decrease in the census populationsize of the Hawaiian petrel may have broad impacts. Seabirdsare important marine predators and may influence food websover large areas because they forage thousands of kilometersfrom their nesting sites (Hobson et al. 1994). Seabirds can also
transfer marine nutrients to terrestrial ecosystems in the formof guano, food remnants, and both chick and adult mortalityin the nest (Polis and Hurd 1996). Declines in the number ofbreeding seabirds due to predation by alien mammals hasbeen shown to alter the productivity and composition ofplant communities on islands (Croll et al. 2005; Fukamiet al. 2006). Therefore, even though the genetic diversity ofthe Hawaiian petrel has been stable over the past 3,000 years,there could still be ecosystem-wide consequences from itspopulation decline.
Supplementary MaterialSupplementary figures 1–3 and Supplementary tables 1–12are available at Molecular Biology and Evolution online (http://www.mbe.oxfordjournals.org/).
Acknowledgments
We would like to thank Josh Adams, David Anderson, DavidDuffy, Fern Duvall, Nick Holmes, Darcy Hu, Seth Judge, JayPenniman, and Keith Swindle for samples and helpful discus-sions of petrel biology. We also thank Hawaii VolcanoesNational Park, the Hawaii Experimental Tropical Forest, andthe Hawaii Department of Land and Natural Resources foraccess to samples. For permission and assistance samplingmuseum specimens we thank: James Dean, Megan Spitzer,and Christina Gebhard at the Smithsonian Institution’sNational Museum of Natural History; Carla Kishinami andLydia Garetano at the Bernice P. Bishop Museum; andKimball Garrett at the Natural History Museum of LosAngeles County. Art Medeiros provided invaluable supportfor fieldwork. We are especially grateful to John Southon forassistance in obtaining radiocarbon dates. We also wish tothank Frank Hailer, Amy Wilson, Heather Lerner, NancyRotzel, Jon Beadell, and the members of the Center forConservation and Evolutionary Genetics, for discussions ondata analysis or technical support. Greg McDonald and threeanonymous reviewers provided helpful comments on an ear-lier version of this article. This work was supported by theBehavior, Ecology, and Evolution Program at the University ofMaryland, the Smithsonian Office of Fellowships, theSmithsonian’s Walcott Fund, the Center for Conservationand Evolutionary Genetics, and the National ScienceFoundation (grant # DEB-0745604 to P.H.O., R.C.F., and H.F.J.).
ReferencesAbbott CL, Double MC, Trueman JW, Robinson A, Cockburn A. 2005.
An unusual source of apparent mitochondrial heteroplasmy: dupli-
cate mitochondrial control regions in Thalassarche albatrosses. Mol
Ecol. 14:3605–3613.
Allendorf FW, Luikart G. 2007. Conservation and the genetics of popula-
tions. Malden (MA): Blackwell Publishing.
Amos W, Balmford A. 2001. When does conservation genetics matter?
Heredity 87:257–265.
Athens JS, Kaschko M, James H. 1991. Prehistoric bird hunters: high
altitude resource exploitation on Hawai’i Island. Bishop Museum
Occasional Papers 31:63–84.
3738
Welch et al. . doi:10.1093/molbev/mss185 MBE at Sm
ithsonian Institution Libraries on February 4, 2015
http://mbe.oxfordjournals.org/
Dow
nloaded from
Athens JS, Tuggle DH, Ward JV, Welch DJ. 2002. Avifaunal extinctions,
vegetation change, and Polynesian impacts in prehistoric Hawaii.
Archaeol Oceania. 37:57–78.
Baldwin PH, Hubbard DH. 1948. The Hawaiian dark-rumped petrel
reappears on Hawaii. Condor 51:231–232.
Banko PC, Black JM, Banko WE. 1999. Hawaiian goose (Branta sandvi-
censis). In: Poole A, editor. The birds of North America online. Ithaca
(NY): Cornell Lab of Ornithology.
Banko PC, Johnson L, Lindsey GD, Fancy SG, Pratt TK, Jacobi JD, Banko
WE. 2002. Palila (Loxioides bailleui). In: Poole V, editor. The birds of
North America online. Ithaca (NY): Cornell Lab of Ornithology.
Banko WE. 1980. Part I. Population histories—species accounts. Sea
birds: Hawaiian dark-rumped petrel (‘Ua’u). Honolulu (HI):
Cooperative National Park Resources Studies Unit, University of
Hawaii at Manoa, Department of Botany.
Berthier P, Beaumont MA, Cornuet J-M, Luikart G. 2002.
Likelihood-based estimation of the effective population size using
temporal changes in allele frequenceis: a genealogical approach.
Genetics 160:741–751.
BirdLife International. 2011. Species factsheet: Pterodroma sandwichen-
sis. Available from: http://www.birdlife.org, last accessed December
8, 2011.
Blackburn TM, Cassey P, Duncan RP, Evans KL, Gaston KJ. 2004. Avian
extinction and mammalian introductions on oceanic islands. Science
305:1955–1958.
Browne RA, Anderson DJ, Houser JN, Cruz F, Glasgow KJ, Hodges CN,
Massey G. 1997. Genetic diversity and divergence of endangered
Galapagos and Hawaiian petrel populations. Condor 99:812–815.
Bryan WA. 1908. Some birds of Moloka’i. Bernice P Bishop Museum
Occasional Papers 4:43–86.
Campos PF, Willerslev E, Sher A, et al. (20 co-authors). 2010. Ancient
DNA analyses exclude humans as the driving force behind late
Pleistocene musk ox (Ovibos moschatus) population dynamics.
Proc Natl Acad Sci U S A. 107:5675–5680.
Carlile N, Priddle D, Zino F, Natividad C, Wingate DB. 2003. A review of
four successful recovery programmes for threatened sub-tropical
petrels. Marine Ornithol. 31:185–192.
Croll DA, Maron JL, Estes JA, Danner EM, Byrd GV. 2005. Introduced
predators transform subarctic islands from grassland to tundra.
Science 307:1959–1961.
Danchin E, Boulinier T, Massot M. 1998. Conspecific reproductive suc-
cess and breeding habitat selection: implications for the study of
coloniality. Ecology 79:2415–2428.
Debruyne R, Chu G, King CE, et al. (21 co-authors). 2008. Out of
America: ancient DNA evidence for a new world origin of late
quaternary woolly mammoths. Curr Biol. 18:1320–1326.
Depaulis F, Orlando L, Hanni C. 2009. Using classical population ge-
netics tools with heterochronous data: time matters! PLoS One 4:
e5541.
Drummond AJ, Rambaut A. 2007. BEAST: Bayesian evolutionary analysis
by sampling trees. BMC Evol Biol. 7:214.
Ekblom R, Galindo J. 2011. Applications of next-generation sequencing
in molecular ecology of non-model organisms. Heredity 107:1–15.
Excoffier L, Laval G, Schneider S. 2005. Arlequin (version 3.0): An inte-
grated software package for population genetics data analysis. Evol
Bioinformatics Online. 1:47–50.
Fleischer RC, Olson SL, James HF, Cooper AC. 2000. Identification of the
extinct Hawaiian eagle (Haliaeetus) by mtDNA sequence analysis.
Auk 117:1051–1056.
Frankham R. 1995. Effective population size/adult population size ratios
in wildlife: a review. Genet Res. 66:95–107.
Frankham R. 2005. Genetics and extinction. Biological Conservation 126:
131–140.
Frankham R, Ballou JD, Briscoe DA. 2002. Introduction to conservation
genetics. Cambridge, UK: Cambridge University Press.
Fukami T, Wardle DA, Bellingham PJ, Mulder CPH, Towns DR, Yeates
GW, Bonner KI, Durrett MS, Grant-Hoffman MN, Williamson WM.
2006. Above- and below-ground impacts of introduced predators in
seabird-dominated island ecosystems. Ecol Lett. 9:1299–1307.
Gilpin ME, Soule ME. 1986. Minimum viable populations: processes of
extinction. In: Soule ME, editor. Conservation biology: the science of
scarcity and diversity. Sunderland (MA): Sinauer Associates. p. 19–34.
Hailer F, Helander B, Folkestad AO, et al. (11 co-authors). 2006.
Bottlenecked but long-lived: high genetic diversity retained in
white-tailed eagles upon recovery from a population decline. Biol
Lett. 2:316–319.
Henshaw HW. 1902. Birds of the Hawaiian Islands: a complete list of the
birds of the Hawaiian possessions. Honolulu (HI): Thos. G. Thrum.
Ho SYW, Shapiro B. 2011. Skyline-plot methods for estimating demo-
graphic history from nucleotide sequences. Mol Ecol Resour. 11:
423–434.
Hobson KA, Piatt JF, Pitocchelli J. 1994. Using stable isotopes to deter-
mine seabird trophic relationships. J Anim Ecol. 63:786–798.
Hofreiter M, Jaenicke V, Serre D, von Haeseler A, Paabo S. 2001. DNA
sequences from multiple amplifications reveal artifacts induced by
cytosine deamination in ancient DNA. Nucleic Acids Res. 29:
4793–4799.
Hu D, Glidden C, Lippert JS, Schnell L, MacIvor JS, Meisler J. 2001.
Habitat use and limiting factors in a population of Hawaiian
dark-rumped petrels on Mauna Loa, Hawaii. In: Scott JM, Conant
S, Van Riper CI, editors. Evolution, ecology, conservation and
management of Hawaiian birds: a vanishing avifauna. Studies in
avian biology. Camarillo (CA): Cooper Ornithological Society.
p. 234–242.
Hughen KA, Maillie MGL, Bard E, et al. (27 co-authors). 2004. Marine04
marine radiocarbon age calibration, 0-26 cal kyr BP. Radiocarbon 46:
1059–1086.
James HF. 1987. A late Pleistocene avifauna from the island of Oahu,
Hawaiian Islands. In: Mourer-Chauvire C, editor. L’Evolution des
oiseaux d’apres le temoignage des fossiles; Table Ronde
Internationale de CNRS; 1985, Sept. 18–21. Lyon-Villeurbanne:
Documents des Laboratoires de Geologie de Lyon. p. 121–128.
James HF, Olson SL. 1991. Descriptions of thirty-two new species of birds
from the Hawaiian Islands: Part 2. Passeriformes. Ornithol Monogr.
46:1–88.
Johnson WE, Onorato DP, Roelke ME, et al. (16 co-authors). 2010.
Genetic restoration of the Florida panther. Science 329:1641–1645.
Kass RE, Raftery AE. 1995. Bayes factors. J Am Stat Assoc. 90:773–795.
Kaufman L. 2011. Albatross is a mother at 60. New York: New York
Times; Available from: http://green.blogs.nytimes.com/2011/03/08/
albatross-is-a-mother-at-60.html, last accessed March 8, 2011.
Kirch PV. 1985. Feathered gods and fishhooks. Honolulu (HI): University
of Hawaii Press.
Kirch PV. 2000. On the road of the winds. Los Angeles (CA): University
of California.
Kuo C-H, Janzen J. 2003. BOTTLESIM: a bottleneck simulation program
for long-lived species with overlapping generations. Mol Ecol Notes.
3:669–673.
3739
Genetic Stability Despite Decline in Petrels . doi:10.1093/molbev/mss185 MBE at Sm
ithsonian Institution Libraries on February 4, 2015
http://mbe.oxfordjournals.org/
Dow
nloaded from
Laursen L, Bekoff M. 1978. Loxodonta africana. In: Anderson S, editor.Mammalian species. Lawrence (KS): American Society ofMammalogists. p. 1–8.
Lawrence HA, Taylor GA, Crockett DE, Millar CD, Lambert DM. 2008.New genetic approach to detecting individuals of rare and endan-gered species. Conserv Biol. 22:1267–1276.
Lent PC. 1988. Ovibos moschatus. In: Verts BJ, Anderson S, Phillips CJ,editors. Mammalian species. Lawrence (KS): American Society ofMammalogists. p. 1–9.
Lorenzen ED, Nogues-Bravo D, Orlando L, et al. (55 co-authors). 2011.Species-specific responses of Late Quaternary megafauna to climateand humans. Nature 479:359–364.
Luikart G, Ryman N, Tallmon DA, Schwartz MK, Allendorf FW. 2010.Estimation of census and effective population sizes: the increas-ing usefulness of DNA-based approaches. Conserv Genet. 11:355–373.
Maddison DR, Maddison WP. 2008. MacClade v 4.08. Sunderland (MA):Sinauer Associates.
Meagher M. 1986. Bison bison. In: Verts BJ, Anderson S, Lawlor TE,editors. Mammalian species. Lawrence (KS): American Society ofMammalogists. p. 1–8.
Minin VN, Bloomquist EW, Suchard MA. 2008. Smooth skyride througha rough skyline: Bayesian coalescent-based inference of populationdynamics. Mol Biol Evol. 25:1459–1471.
Mourier T, Ho SYW, Gilbert MTP, Willerslev E, Orlando L. Forthcoming2012. Statistical guidelines for detecting past population shifts usingancient DNA. Mol Biol Evol. doi: 10.1093/molbev/mss094.
Munro GC. 1955. Hawaii’s birds and their homes: how to save them fromextinction. Part XI—Seabirds of the main group. Elepaio 16:46–47.
Naughton MB, Romano MD, Zimmerman TS. 2007. A conservationaction plan for black-footed albatross (Phoebastria nigripes) andlaysan albatross (Phoebastria immutabilis). Version 1.0. Portland(OR): US Fish and Wildlife Service, p. 1–37.
Nunn GB, Stanley SE. 1998. Body size effects and rates of cytochrome bevolution in tube-nosed seabirds. Mol Biol Evol. 15:1360–1371.
Olson S, James H. 1982a. Fossil birds from the Hawaiian Islands: evidencefor wholesale extinction by man before western contact. Science 217:633–635.
Olson SL, James H. 1982b. Prodromus of the fossil avifauna of theHawaiian Islands. Smithson Contrib Zool. 365:1–59.
Olson SL, James HF. 1991. Descriptions of thirty-two new species of birdsfrom the Hawaiian Islands: Part 1. Non-Passeriformes. OrnitholMonogr. 45:1–88.
Orlando L, Ginolhac A, Raghavan M, et al. (17 co-authors). 2011. Truesingle-molecule DNA sequencing of a Pleistocene horse bone.Genome Res. 21:1705–1719.
Paxinos EE, James HF, Olson SL, Ballou JD, Leonard JA, Fleischer RC. 2002.Prehistoric decline of genetic diversity in the nene. Science 296:1827–1827.
Polis GA, Hurd SD. 1996. Linking marine and terrestrial food webs:allochthonous input from the ocean supports high secondary
productivity on small islands and coastal land communities. Am
Nat. 147:396–423.
Posada D. 2008. jModelTest: phylogenetic model averaging. Mol Biol
Evol. 25:1253–1256.
Ramakrishnan U, Hadly EA, Mountain JL. 2005. Detecting past popula-
tion bottlenecks using temporal genetic data. Molecular Ecol. 14:
2915–2922.
Rambaut A, Ho SYW, Drummond AJ, Shapiro B. 2009. Accommodating
the effect of ancient DNA damage on inferences of demographic
histories. Mol Biol Evol. 26:245–248.
Rice WR. 1989. Analyzing tables of statistical tests. Evolution 43:223–225.
Saccheri I, Kuussaari M, Kankare M, Vikman P, Fortelius W, Hanski I.
1998. Inbreeding and extinction in a butterfly metapopulation.
Nature 392:491–494.
Shapiro B, Drummond AJ, Rambaut A, et al. (27 co-authors). 2004. Rise
and fall of the Beringian steppe bison. Science 306:1561–1565.
Simons TR. 1984. A population model of the endangered Hawaiian
dark-rumped petrel. J Wildl Manage. 48:1065–1076.
Simons T, Hodges C. 1998. Dark-rumped petrel (Pterodroma phaeopy-
gia). In: Poole A, Gill F, editors. The birds of North America.
Philadelphia: Birds of North America, Inc.
Sorenson MD, Fleischer RC. 1996. Multiple independent transpositions
of mitochondrial DNA control region sequences to the nucleus. Proc
Natl Acad Sci U S A. 93:15239–15243.
Spear LB, Ainley DG, Nur N, Howell SNG. 1995. Population size and
factors affecting at-sea distribution of four endangered Procellariids.
Codor 97:613–638.
Stafford TWJ, Hare PE, Curie LA, Jull AJT, Donahue D. 1991. Accelerator
radiocarbon dating at the molecular level. J Archaeol Sci. 18:35–72.
Steadman DW. 1995. Island birds: biodiversity meets zooarchaeology.
Science 267:1123–1131.
Steadman DW. 2006. Extinction and biogeography of tropical Pacific
birds. Chicago: University of Chicago Press.
Stuvier M, Reimer PJ. 1993. Extended 14C data base and revised CALIB
3.0 14C age calibration program. Radiocarbon 35:215–230.
Suchard MA, Weiss RE, Sinsheimer JS. 2001. Bayesian selection of
continuous-time Markov chain evolutionary models. Mol Biol Evol.
18:1001–1013.
Welch AJ, Fleischer RC, James HF, et al. (11 co-authors). 2012. Population
divergence and gene flow in an endangered and highly mobile sea-
bird. Heredity 109:19–28.
Wilmshurst JM, Hunt TL, Lipo CP, Anderson AJ. 2011. High-precision
radiocarbon dating shows recent and rapid initial human
colonization of East Polynesia. Proc Natl Acad Sci U S A. 108:
1815–1820.
Xia X, Xie Z. 2001. DAMBE: software package for data analysis in mo-
lecular biology and evolution. J Hered. 92:371–373.
Zwickl DJ. 2006. Genetic algorithm approaches for the phylogenetic
analysis of large biological sequence datasets under the maximum
likelihood criterion. [dissertation]. [Austin (TX)]: University of Texas.
3740
Welch et al. . doi:10.1093/molbev/mss185 MBE at Sm
ithsonian Institution Libraries on February 4, 2015
http://mbe.oxfordjournals.org/
Dow
nloaded from