weigh-in-motion sensors’ installation and calibration...
TRANSCRIPT

Weigh-In-Motion Sensors’ Installation and Calibration Efforts on Highway
401 Perpetual Pavements, Woodstock
Shahram H. Vaziri (principal author)
PhD Candidate
Department of Civil and Environmental Engineering
University of Waterloo, Canada
E-mail: [email protected]
Carl Haas
Professor, Canada Research Chair
Department of Civil and Environmental Engineering
University of Waterloo, Canada
E-mail: [email protected]
Leo Rothenburg
Associate Vice-President International
University of Waterloo, Canada
E-mail: [email protected]
Joseph Ponniah Adjunct Professor, University of Waterloo and Senior Research Engineer MTO
Pavement and Foundation Section
The Ministry of Transportation of Ontario (MTO)
Ralph Haas
The Norman W. McLeod Engineering Professor
Department of Civil and Environmental Engineering
University of Waterloo, Canada
E-mail: [email protected]
Paper prepared for presentation
at the Pavements, Session: Innovative Developments in Sustainable Pavements
of the 2011 Annual Conference of the
Transportation Association of Canada
Edmonton, Alberta

2
ABSTRACT
The University of Waterloo’s Centre for Pavement and Transportation Technology
(CPATT), the Ontario Ministry of Transportation (MTO), the Natural Sciences and Engineering
Research Council of Canada (NSERC), the Ontario Hot Mix Producers Association (OHMPA),
Stantec Inc. and McAsphalt Industries Ltd. are collaborating to evaluate the performances of
three flexible pavement designs, including two perpetual/long-life (with and without the rich
bottom mix (RBM) layer) and one conventional pavement designs. The three flexible pavement
designs are being monitored by strain, pressure, temperature and moisture sensors, which are
installed in the asphalt, granular and sub-base layers. Two types of piezoelectric weigh-in-motion
(WIM) sensors were installed in the surface course of the perpetual pavement (with the RBM
layer) in order to capture the axle loads distribution. Thus, load, strain, vertical pressure and
environmental parameters affecting the pavements’ performance can all be monitored and used
to evaluate the pavement mixes under Ontario’s climate and traffic conditions.
This paper reports on the WIM installation and calibration efforts and investigates the
preliminary results of data analysis of two types of piezoelectric WIM sensors in the period after
sensors’ calibration. An auto-calibration algorithm for the most effective piezoelectric WIM
sensors will be provided in the future to supply calibration factors for Ontario’s climate and for
high speed, high volume roads, while collection of WIM data will provide an opportunity for
investigating the load spectra impacts on the pavement designs.
INTRODUCTION
WIM technology has been widely applied in pavement design, traffic management,
infrastructure protection, tolling, weight enforcement, truck safety advisory systems, and data
collection for research and environmental purposes. For improving static weight estimation of
WIM systems, different types of sensors, such as piezoelectric, bending plates, fiber optic, strain
gauge and load cell have been developed. Among them, devices such as piezoelectric sensors,
bending plate and load cell are more popular. Properly installed and calibrated piezoelectric
sensors provide acceptable accuracy with low installation and maintenance costs, which make
piezoelectric WIM devices one of the most frequent installed sensors in various applications.
Accuracy, pavement and sensor installation conditions, data quality assurance, calibration
[1] and climate are the most important aspects that WIM users are dealing with in their day-to-
day business. Since these conditions vary from site to site, each specific installation has its own
characteristics so that sensors with known quality of performance will not show the same
performance in every installation. For instance, the study of survivability, reliability and
accuracy of Kistler Lineas® sensors under highway traffic conditions in Connecticut showed
failure in application of this type (four sensors failed) in States [2]. One possible reason observed
was that water penetrated to the sensors. During three years of the Connecticut study one total
replacement of 32 sensors (Lineas®, 1m) with the improved design of sensor took place in the
second year (1998) by the manufacturer at no cost to the customer and two malfunctioning
sensors found in the third year (2000). Regardless of the last two malfunctioned sensors, other
sensors performed very well during the evaluation time.

3
In the early 2000s, the manufacturer of the Lineas® sensor improved it to a better
durability. The accuracy and durability of this sensor was evaluated in a Portland Cement
Concrete pavement (PCC) by White et al [3]. The results of this study illustrated that the sensors
produced accurate weight data, which met the accuracy specified by the ASTM specification for
WIM sensor Type I. The consistency of data was acceptable over time and no sensor failure was
observed during the research period.
Improving the vehicle’s static weight estimation in WIM technology is a critical topic in
recent years. Dahlin C. [4] offered a practical method to calibrate a WIM system based on GVW
and front axle weight of class 9 vehicles (five-axle tractor semitrailer). The GVW and front axle
weight data produced by the sensors were used to control any drifts from an expected norm
caused by a malfunctioning sensor or major parameters such as temperature road and traffic
conditions.
Several studies have also been executed on ceramic and polymer types of piezoelectric
WIM sensors focused on laboratory and field evaluation of performance. Papagiannakis A.T. et
al, [5] investigated fatigue under wet and dry conditions and two pressure categories: 850 kPa
and 200 kPa. The fatigue tests show in higher pressures, under both dry and wet conditions,
sensors illustrate changes in output voltage as number of loading cycle increases. The researchers
have not found any voltage changes under the 200 kPa contact pressure.
The field evaluations of performance in both Asphalt Concrete (AC) and PCC pavements
show that durability and repeatability of both types of sensors are acceptable with high signal to
noise (S/N) ratio and clear signals. None of the sensors failed during the experiment. Moreover,
the effect of pavement temperature on the voltage amplitude of the raw signal has been
investigated. In polymer piezoelectric sensors the amplitude increased with increased
temperature and in ceramic piezoelectric sensors the amplitude decreased with increased
pavement temperature [6], [7].
Ott W.C. [8], Nichols A.P. [9] and Monsere C. [10] performed several studies for WIM
data quality control and quality assurance. Burnos P. [11] worked on compensation factors
affecting the WIM system accuracy using two methods of compensation including auto-
calibration and temperature compensation. In his paper, the WIM sensor type is not clearly
identified; however, it seems the research is based on ceramic piezoelectric sensors (ECM®
) data.
There is a lack of a study, which incorporates weight, temperature and speed to edit the WIM
data at the time of occurrence especially focusing on the less expensive piezoelectric WIM
sensors.
Piezo-ceramic, piezo-polymer and quartz sensors are three widely used piezoelectric
sensors. These sensors are different in structure, installation procedure, cost and sensitivity to
environmental conditions. In the last week of September 2010, piezo-polymer and quartz sensors
were installed at one of the CPATT’s experimental site, on Highway 401 Eastbound (close to
Woodstock), to evaluate sensors’ performance and update load spectra over Ontario’s highways.
These sensors are described as follow:

4
1. Piezo-polymer sensor: Roadtrax® Brass Linguini® polarized polyvinylidene fluoride
WIM sensor made by Measurement Specialties, Inc. (MSI®);
2. Quartz sensor: Lineas® WIM sensor made by Kistler Instrumente AG (Kistler).
At the site, the WIM sensors produce axle numbers, axle spacing, axle weight, gross
vehicle weight (GVW), speed, etc. (Figure 1).
To evaluate performance of the installed sensors, load spectrum, and to transfer
knowledge for an auto-compensation algorithm specifically for the least expensive sensors, the
following steps were planned:
1. WIM system Installation and calibration using the CPATT Dodge Sprinter van (3 tons);
2. Preliminary data analysis for performance evaluation;
3. Data gathering and analysis for the following objectives:
a. Load Spectrum over the site
b. Transfer knowledge for an auto-compensation algorithm
Charge Amplifier (Converts the Electrical Charges to Proportional Voltages)
Signal Processor
Sensor Produces
Electrical Charges
Vehicle Travels
over the WIM Sensor
Presence
Raw
Data
Speed Class LenghtAxle
Weight.
Figure 1- The WIM Process of Data Production
The research team has progressed to the step two and partly three. This paper reports on
preliminary results of data analysis after the sensors’ calibration.
RATIONALE FOR SELECTION OF WIM SENSOR FOR LLP SITE
The main part of any WIM piezoelectric sensor is its sensing element, which affects
significantly performance, accuracy, maintenance and lifespan of sensor. For instance, the
consequence of selecting a WIM sensor comprised of a man-made piezo-material is an
immediate need for a complex algorithm to compensate for errors generated by material’s
susceptibility to temperature, speed, pavement profile, time (intrinsic degradation) etc. However,

5
such an algorithm will not be able to compensate for all climate, traffic and pavement conditions.
Two categories of piezoelectric material are predominantly used in manufacturing WIM
sensors including natural crystal cuts and polarizable manmade ceramic or polymer piezoelectric
material. Kistler Lineas®
is an example for the first category, which has 15 to 20 synthetic quartz
crystals as sensing elements in its aluminum rigid structure [12]. The examples from the second
category are two sensors called ECM®
Piezolor®
and MSI®
Roadtrax®
Brass Linguini®
(BL), in
which the first case is a ceramic tape or cable embedded within a long block of elastometric
material and in the second case the sensing element is a polarizable polymer called
polyvinylidene fluoride (PVDF) covered by visible bare brass sheet. Each kind of piezoelectric
WIM sensors have their own advantages and disadvantages. Quartz WIM sensors can benefit
from the following advantages [13]:
1. Quartz is widely known for its ability to perform accurate measurement tasks. This
crystal is able to be heavily involved in everyday applications for time and frequency;
2. Quartz crystal is naturally piezoelectric, which has no tendency to relax to an alternative
state and shows the most stable state among of all piezoelectric materials, which provides
quartz WIM sensors with long-term stability and repeatability;
3. Quartz has not an output due to temperature change (pyroelectricity effect), which
provides stability in thermally active environments;
4. Compared with most ceramic materials, voltage sensitivity of quartz is relatively high,
because of its low capacitance value. This property makes it ideal for use in voltage-
amplified systems.
On the other hand, piezoelectric WIM sensor using the manmade ceramic or polymer
sensing elements have the following benefits:
1. The sensor costs are much lower than quartz sensors, specifically for polymer sensors;
2. The installation of sensor is easier and cheaper;
However, ceramic and polymer piezoelectric sensors have the following disadvantages:
1. The sensors are more prone to physical damage under heavy loads or extrinsic
degradation such as environmental effects than quartz sensors;
2. The sensors are sensitive to temperature fluctuations (pyroelectricity). For instance,
PVDF material (MSI® sensors) expands in thermally active environments [14]. This will
result in decreasing the average polarization of the piezoelectric film and consequently
generating a charge on the surface of the film, which is proportional to rate of
temperature change and cannot be easily separated from other charges;
3. The material subject to intrinsic degradation since sensor’s polarity can change over time
4. These sensors require more calibration efforts partly because the manmade piezoelectric
material have less stability and repeatability
Kistler and MSI sensors, which are the most and least expensive WIM piezoelectric
sensors were selected for installing in the CPATT’s highway 401 for the following objectives:

6
1. Compare the performances, longevity, recalibration and maintenance of different WIM
sensors, while climate, pavement and traffic conditions are the same in sensors’ lifetime;
2. Since quartz has a stable atomic structure with no pyroelectric effect, intrinsic
degradation during sensor’s lifetime and significant change in the sensor’s performance
in different temperatures are not expected. However, the Kistler and MSI sensors’
susceptibility to climate, speed and load conditions will be monitored and statistically
analyzed by the research team during the sensors’ lifetime.
3. Prepare recommendations for installation, calibration and maintenance for the
piezoelectric WIM sensors, which are different in structural design and material,
dimension, sensing element and installation procedure and material;
4. Collect seasonal data from both sensors to transfer knowledge for developing an
algorithm for compensating the least expensive sensor’s weight estimation;
5. Take advantage of possibility of using two different piezoelectric WIM sensors for the
purpose of updating the axle load spectra
PAVEMENT SECTIONS AND INSTALLATION LOCATION
CPATT selected and instrumented three different pavement designs on highway 401 in
which the construction and instrumentation procedures applied in the period of 2008 to 2010
construction season and all three sites have the same instrumentation installed in this period. The
station 12+230 (Figure 2) was used to monitor the performance of the perpetual pavement (PP)
including a rich bottom mix layer (RBM). Sensors installed in the station 12+350 are used to
collect data from the perpetual pavement (PP) without the RBM layer (Figure 3). The station
13+067 is the monitoring station for conventional flexible pavement (Figure 4). The sensor
installations were designed to provide the research team with the most accurate data. The sensor
locations in the pavement layers play vital roles in the data value and accuracy. Figure 5 shows
schematic drawing for the monitoring stations.
The CPATT researchers installed two types of piezoelectric WIM sensors in the section
12+230, which is a perpetual pavement with RBM. This installation provides a unique
opportunity to compare the sensors’ performances, and gather data from the sensors that are
different in structure, dimension and sensing material, while traffic, climate, pavement structure
and material characteristics, and even the lane of installation are the same for both sensor sets.
WIM SENSOR INSTALLATION LAYOUT AT CPATT TEST SITE
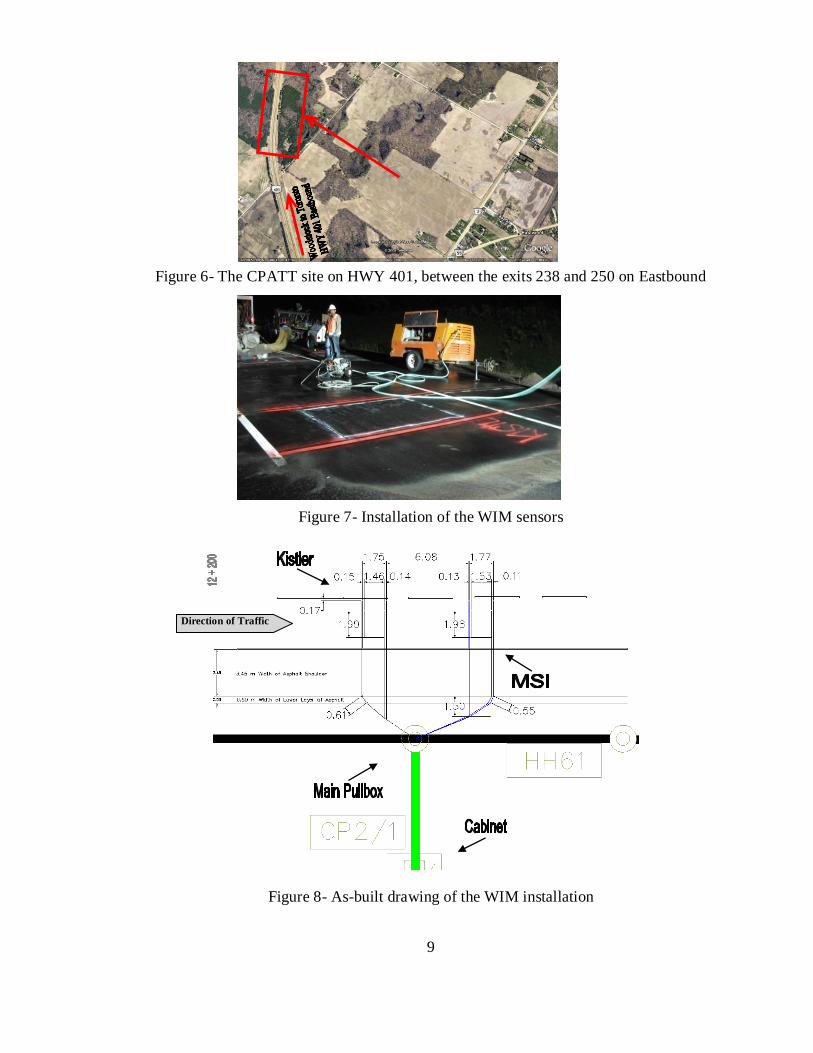
The site is located between exits 238 and 250 on eastbound (Figure 6) located between
Waterloo and Woodstock, Ontario. Figure 7 illustrates the site and equipment at the time of
installation. The WIM system, which is consisted of Kistler and MSI sensors and two inductive
loops with configuration of sensor-loop-sensor, were installed flush with the surface of the
roadway on highway 401. Figure 8 illustrates the as-built drawing of this installation. The
research team used the CPATT van (3 tons) for any tests or manual calibration of the sensors
(Figure 9). The calibration efforts were performed by traveling at 100 km/hr speed over the main
wheel path. Details of tests and calibrations are described as follows.
7
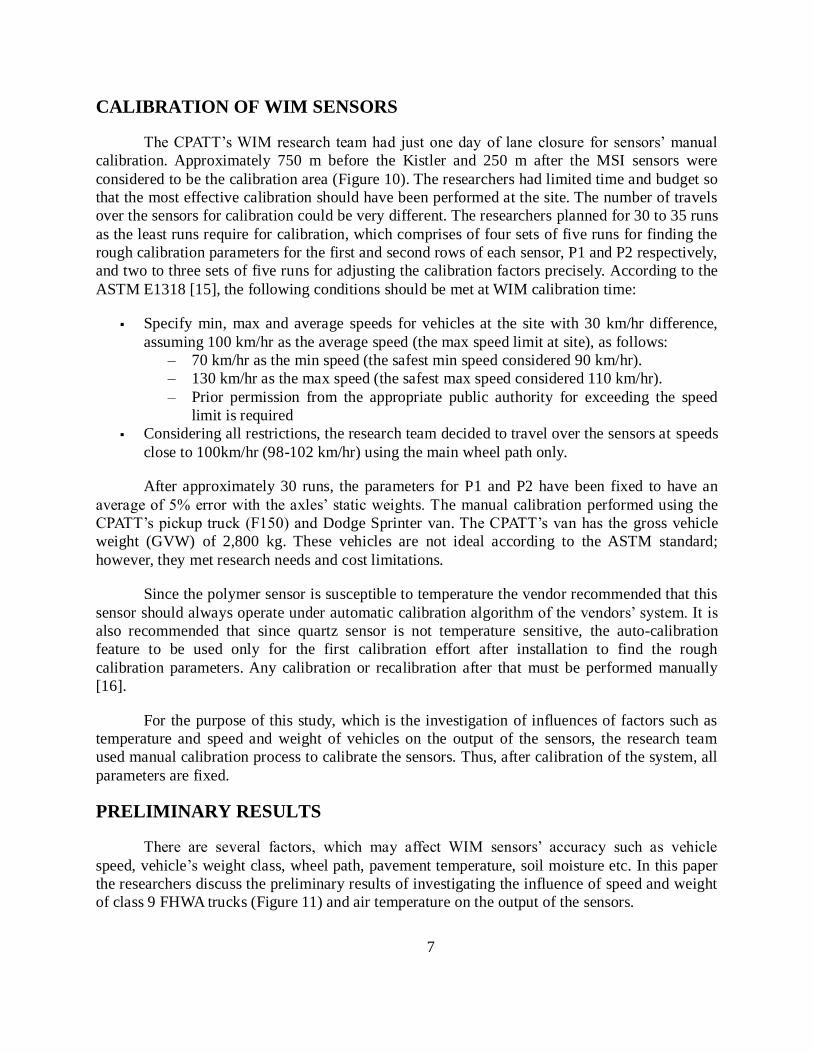
CALIBRATION OF WIM SENSORS
The CPATT’s WIM research team had just one day of lane closure for sensors’ manual
calibration. Approximately 750 m before the Kistler and 250 m after the MSI sensors were
considered to be the calibration area (Figure 10). The researchers had limited time and budget so
that the most effective calibration should have been performed at the site. The number of travels
over the sensors for calibration could be very different. The researchers planned for 30 to 35 runs
as the least runs require for calibration, which comprises of four sets of five runs for finding the
rough calibration parameters for the first and second rows of each sensor, P1 and P2 respectively,
and two to three sets of five runs for adjusting the calibration factors precisely. According to the
ASTM E1318 [15], the following conditions should be met at WIM calibration time:
Specify min, max and average speeds for vehicles at the site with 30 km/hr difference,
assuming 100 km/hr as the average speed (the max speed limit at site), as follows:
– 70 km/hr as the min speed (the safest min speed considered 90 km/hr).
– 130 km/hr as the max speed (the safest max speed considered 110 km/hr).
– Prior permission from the appropriate public authority for exceeding the speed
limit is required
Considering all restrictions, the research team decided to travel over the sensors at speeds
close to 100km/hr (98-102 km/hr) using the main wheel path only.
After approximately 30 runs, the parameters for P1 and P2 have been fixed to have an
average of 5% error with the axles’ static weights. The manual calibration performed using the
CPATT’s pickup truck (F150) and Dodge Sprinter van. The CPATT’s van has the gross vehicle
weight (GVW) of 2,800 kg. These vehicles are not ideal according to the ASTM standard;
however, they met research needs and cost limitations.
Since the polymer sensor is susceptible to temperature the vendor recommended that this
sensor should always operate under automatic calibration algorithm of the vendors’ system. It is
also recommended that since quartz sensor is not temperature sensitive, the auto-calibration
feature to be used only for the first calibration effort after installation to find the rough
calibration parameters. Any calibration or recalibration after that must be performed manually
[16].
For the purpose of this study, which is the investigation of influences of factors such as
temperature and speed and weight of vehicles on the output of the sensors, the research team
used manual calibration process to calibrate the sensors. Thus, after calibration of the system, all
parameters are fixed.
PRELIMINARY RESULTS
There are several factors, which may affect WIM sensors’ accuracy such as vehicle
speed, vehicle’s weight class, wheel path, pavement temperature, soil moisture etc. In this paper
the researchers discuss the preliminary results of investigating the influence of speed and weight
of class 9 FHWA trucks (Figure 11) and air temperature on the output of the sensors.

8
Figure 2– Section 12+230, PP with RBM Figure 3- Section 12+350, PP, No RBM
Figure 4- Section 13+067, conventional pavement
Figure 5- Schematic drawing of the three monitoring stations
9
Direction of Traffic
Figure 6- The CPATT site on HWY 401, between the exits 238 and 250 on Eastbound
Figure 7- Installation of the WIM sensors
Figure 8- As-built drawing of the WIM installation
Project
Location

10
Figure 9- The CPATT Dodge Sprinter van selected for calibration
Figure 10- Sensors’ configuration for manual calibration using the main wheel paths
Over 7,000 trucks’ data for class 9, 5-axle trucks (Figure 11) traveled over the sensor sets
at highway 401 site from 5 to 11 November 2010 and have been analyzed for this study. This
class of vehicles counts for approximately 40% of the all vehicles traveled over the WIM system
at that period (Figure 12). The data in November 2010 have collected right after calibration,
which has performed four weeks after installation of the WIM system.
DATA PREPARETION
The conditions for data preparation are as follow:
The research team used only MSI data since the Kistler sensor’s board at the cabinet still
need to be fixed for producing speed and correct estimations
Five axle Trucks 3S2 (three axle tractor-2 axle semitrailer), Class 9 FHWA, sub-classes:
37 and 38, selected for data analyses
The differences between the WIM sensor on first row (P1) and on second row (P2) for
each axle, considered to be 40% or less
2.0
0 m
0
.80
m
Main Wheel Path
Main Wheel Path
Moving Direction

11
The differences between P1 and P2 for GVW, considered to be 20% or less
Class 9 trucks have two tandem axles, the drive and rear’s (semitrailer) tandem axles. The
rear’s tandem axle can be changed to two single axles by changing the distance between
them. In each tandem axle the difference considered to be 25% or less.
Regression lines of driving axle (front or steer axle) weights versus averages of axles in
drive and rear’s tandem axles have been constructed. The normal probability plot (NPP)
for each relationship illustrated no severe deviation from normality. Data with 99%
confidence interval (CI) have been selected as final for data analysis.
A front axle weight of more than 4.6 T is recommended to be eliminated since there is
less data in this range. For temperature analysis, a steering axle weight of less than 2.8 T
can also be eliminated.
Less than 2% of data were eliminated by the data preparation procedure and 7238 data
for the days 5 to 11 November 2010 are ready for analysis.
SENSOR PERORMANCE IN DIFFERENT WEIGHT CATEGORIES
The MSI sensors data in November 2010 and according to the conditions mentioned
above have selected and averages of axles in each tandem axle have been calculated. Figures 13
and 14 illustrate the regression between steering axle and average weights in drive and
semitrailer’s tandem axles respectively, for both unloaded and loaded trucks. The regressions in
both graphs are approximately the same. Changes in estimation can be inferred from the dashed
lines, which show that the variance of estimations, changes almost the same in both graphs by
increasing the steering axle weight.
SENSOR PERORMANCE IN DIFFERENT TEMPERATURES
The MSI sensors data in November 2010 and according to the conditions mentioned
above have selected and the regression between steering axle and air temperature has been
constructed. Figure 15 illustrates that with changes in air temperature the output of MSI will
change. Changes in estimations can be observed to increase more rapidly specifically in air
temperature higher than the calibration’s air temperature, which was 6oC (Figure 16).
This is mainly because the pavement temperature may change not as rapid as the air
temperature change in November 2010. Therefore, in temperatures higher than 6oC, the
pavement temperature increased constantly as air temperature changed. This may be inferred that
in the middle of fall season in southwestern Ontario, data connected to air temperatures 5oC to
15oC are much proper for temperature analysis.
SENSOR PERORMANCE IN DIFFERENT SPEEDS
The MSI sensors data in November 2010 and according to the conditions mentioned
above have selected and the regression between steering axle and speed has been constructed
(Figure 17). More analysis should be done to track the true relationship between speed and
weight estimation of the MSI sensors. However, it does not seem that the MSI sensors are
significantly sensitive at the speeds close to calibration speeds such as 90 to 110 km/hr, which is

12
the most frequent speed range for trucks on the lane of WIM installation. The calibration of the
sensors was performed in the range of 98 to 102 km/hr.
Figure 11- The FHWA’s class 9 truck
Figure 12- The percentage of class 9 trucks travel over the site in November 2010
THE WIM SITE LOAD SPECTRA
Figure 18 illustrates the GVW’s load spectra at the WIM site. The peak for unloaded
trucks (17 to 18 tons) is reasonable. However, the peak for loaded trucks (29 to 30 T) sounds to
have been underestimated by -20%, since the loaded trucks should be close to the max permitted
GVW on Canada and the US highways, which is 36.30 tons (80,000 lb). The possible reason for
0%
5%
10%
15%
20%
25%
30%
35%
40%
0 1 2 3 4 5 6 7 8 9 10 11 12 13 14 15
The FHWA Class

13
this is that the sensors were calibrated using a light truck with axle weights less than 2 tons.
Figure 13- Performance of the MSI sensor between steer and drive tandem axles
Figure 14- Performance of the MSI sensor between steer and rear tandem axles
CONCLUSIONS AND SUGGESTIONS
The preliminary analysis of piezoelectric WIM sensors data shows the following results:

14
1. Kistler hardware requires more adjustments for producing speed and accurate estimations
2. The MSI sensor illustrate susceptibility to the following factors:
Figure 15- Performance of the MSI sensor in different temperatures
Figure 16- Performance of the MSI sensor in temperatures higher than 6oC

15
Figure 17- Performance of the MSI sensor in different speeds
Figure 18- GVW load spectra, November 2010
a. Increasing the steering axle load will result in increasing variance of drive and
semitrailer’s axle load estimations and may be interpreted as sensitivity of sensors
to weight factor
b. Most of data are in the range of speeds from 90 to 110 km/hr. At the current time,
it is impossible for the research team to report the effect of speed on the weight
estimation of the MSI sensors. Since the research team has calibrated the sensor in
GVW (100 kg)

16
the speed range of 98 to 102 km/hr, it may be inferred that the speed range of 95
to 105 km/hr has the most reliable data for analysis.
c. Changes in weight estimations can be observed with changes in air temperature
specifically at temperatures higher than the calibration temperature, which was
6oC. This is mainly because the pavement temperature may react more to
temperatures more than 6oC in the middle of fall time in southwestern Ontario.
This may also be inferred that the November data connected to air temperatures
5oC to 15
oC are more proper for temperature analysis.
3. The GVW load spectra illustrate the proper placement of unloaded trucks. Recalibration
of MSI using the auto-calibration feature of the WIM system and more data collection in
the future are recommended in order to precisely update GVW and axle load spectra over
the pavement.
4. Collection and analysis of data will be performed in the future to transfer knowledge for
an auto-compensation algorithm, specifically for the low cost polymer sensor technology.
This algorithm will ultimately compensate the sensor’s output according to the changes in
climate and traffic conditions.
ACKNOWLEDGEMENTS
The authors would like to thank all colleagues including Dr. Susan Tighe from University of
Waterloo, Becca Lane, Fiona Leung, John Moffatt, Kerry Nadalin, Riyaz Sheikh, Anil Virani,
Warren Lee, Winston Oostenbrug and Doug Schoneveld from Morrison Hershfield, Sami
Abunaaj and Mohammed Razzaq from Aecon who contributed to this study specifically at
the installation time of the WIM sensors.
REFERENCES
1. McCall, B. & Vodrazka, W.C. 1997, States’ Successful Practices Weigh-in-Motion Handbook, Federal Highway Administration (FHWA), U.S.A.
2. Larsen, D.A. & McDonnell, A., H. May 1998, Installation and Evaluation of Weigh-In-Motion Utilizing Quartz-Piezo Sensor Technology, Connecticut Department of Transportation,
3. White, R., Song, J., Haas, C. & Middleton, D. 2006, "Evaluation of Quartz Piezoelectric Weigh-in-Motion Sensors", National Research Council, pp. 109.
4. Dahlin, C. 1992;, "A Proposed Method for Calibrating Weigh-In-Motion (WIM) Systems and for Monitoring that Calibration Over Time", Transportation Research Record, , no. 1364
5. Papagiannakis, A.T., Johnston, E.C. & Alavi, S. 2001a, "Fatigue Performance of Piezoelectric Weigh-in-Motion Sensors", Transportation Research Record, no. 1769, pp. 87-94.
6. Papagiannakis, A.T., Johnston, E.C. & Alavi, S. 2001b, "Laboratory and Field Evaluation of Piezoelectric Weigh-in-Motion Sensors", Journal of Testing and Evaluation, vol. 29, no. 6,
7. Alavi, S.H., Mactutis, J.A., Gibson, S.D., Papagiannakis, A.T. & Reynaud, D. 2001, "Performance evaluation of piezoelectric weigh-in-motion sensors under controlled field-loading
conditions", Transportation Research Record, , no. 1769, pp. 95 -102-102. 8. Ott, W.C. & Papagiannakis, A. 1996, "Weigh-in-Motion Data Quality Assurance Based on 3-S2
Steering Axle Load Analysis", Transportation Research Record, vol. 1536, pp. 12-18.ASTM E 1318 2002, "Standard Specification for Highway Weigh in Motion (WIM) Systems with User
17
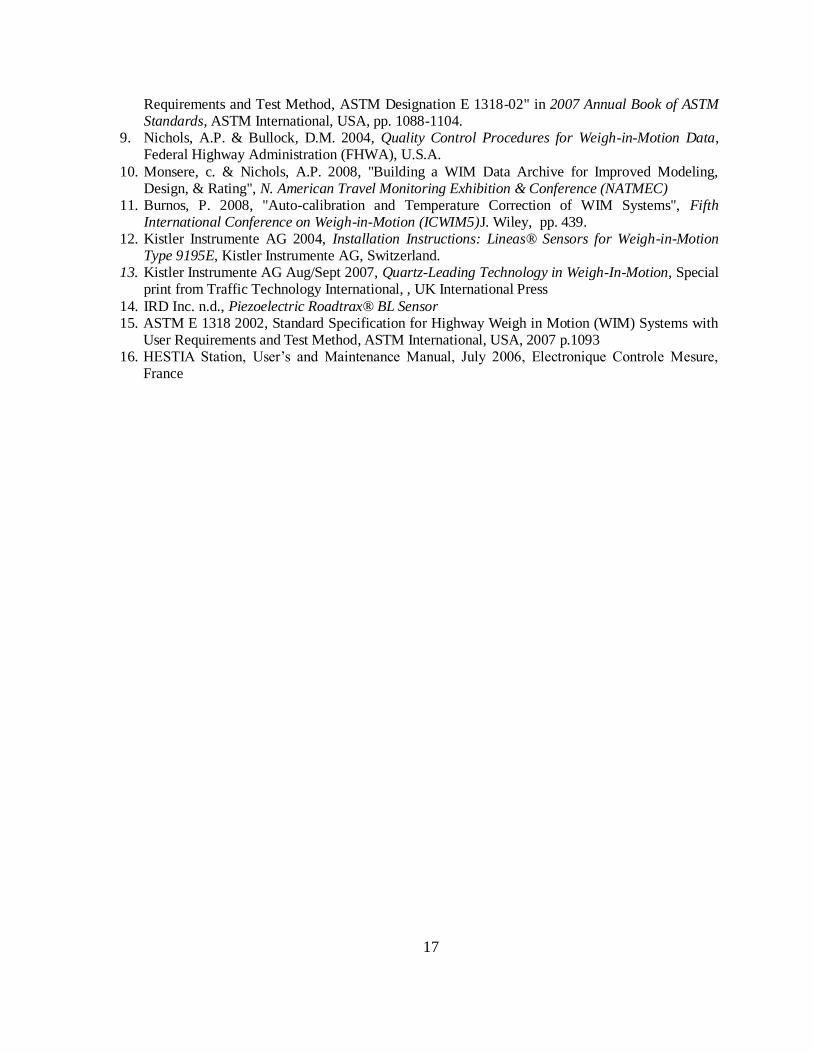
Requirements and Test Method, ASTM Designation E 1318-02" in 2007 Annual Book of ASTM Standards, ASTM International, USA, pp. 1088-1104.
9. Nichols, A.P. & Bullock, D.M. 2004, Quality Control Procedures for Weigh-in-Motion Data, Federal Highway Administration (FHWA), U.S.A.
10. Monsere, c. & Nichols, A.P. 2008, "Building a WIM Data Archive for Improved Modeling, Design, & Rating", N. American Travel Monitoring Exhibition & Conference (NATMEC)
11. Burnos, P. 2008, "Auto-calibration and Temperature Correction of WIM Systems", Fifth International Conference on Weigh-in-Motion (ICWIM5)J. Wiley, pp. 439.
12. Kistler Instrumente AG 2004, Installation Instructions: Lineas® Sensors for Weigh-in-Motion Type 9195E, Kistler Instrumente AG, Switzerland.
13. Kistler Instrumente AG Aug/Sept 2007, Quartz-Leading Technology in Weigh-In-Motion, Special print from Traffic Technology International, , UK International Press
14. IRD Inc. n.d., Piezoelectric Roadtrax® BL Sensor 15. ASTM E 1318 2002, Standard Specification for Highway Weigh in Motion (WIM) Systems with
User Requirements and Test Method, ASTM International, USA, 2007 p.1093 16. HESTIA Station, User’s and Maintenance Manual, July 2006, Electronique Controle Mesure,
France