calibration of earth-viewing satellite sensors
TRANSCRIPT

Calibration of Earth-Viewing Satellite Sensors
Steve Brown, Leonard Hanssen, Carol Johnson, Keith Lykke, Steve Maxwell, Joe Rice, Ping-Shine Shaw,
John Woodward, and Yuqin Zong
Presented by Joe Rice

Outline
• Overview of Earth-viewing satellite sensors
• Overview of NIST sensor calibration capabilities
• Examples, with results and impacts
• Future directions
2

Overview of Satellite Programs & SensorsExample Operational Satellites and Sensors (ongoing)• Geostationary Operational Satellite System (GOES-R)
– Advanced Baseline Imager (ABI)
– Space weather sensors
• Joint Polar Satellite System (JPSS)– Advanced Technology Microwave Sounder (ATMS)
– Cross-Track Infrared Sounder (CrIS)
– Visible Infrared Imaging Radiometer Suite (VIIRS)
– Ozone Mapping and Profiler Suite (OMPS)
– Cloud and Earth Radiant Energy System (CERES)
• Landsat Data Continuity Mission (LCDM) – Operational Land Imager (OLI)
3
Example Current NASA Scientific Satellites (sensors exist)• Earth Observing System (all flying and near end of life – some similar sensors on JPSS)• Orbiting Carbon Observatory-2 (OCO-2) (Launched in July 2, 2014)• Stratospheric Aerosol and Gas Experiment (SAGE-III) (Planned launch 2015)• NIST Advanced Radiometer (NISTAR) and EPIC (On DSCOVR Planned launch in 2015 to L-1 orbit)
Example Future NASA Satellite Missions (still in formation stage)• Ocean Radiometer for Carbon Assessment (ORCA) for PACE and/or ACE missions• Climate Absolute Radiance and Refractory Observatory (CLARREO) • Hyperspectral and InfraRed Imager (HyspIRI)
Suomi National Polar-orbiting Partnership (NPP)

Example: VIIRS Sensor(Visible Infrared Imaging Radiometer Suite)
– Ocean color (Carbon/Biomass-related)
– Sea surface temperature
– Aerosol characteristics
– Vegetation index (Carbon/Biomass-related)
– Land and Ice temperature
– Fire detection and monitoring
Imagery Weather Ocean Color Clouds Low light Imaging4

VIIRS has Detector Arrays with Filters
5
BandWavelength
[nm]
M1 412
M2 445
M4 555
M3 488
I1 640
I2 865
M7 865
M5 672
M6 746
• 16 detectors in a column along satellite track direction• Each column at a different wavelength band• Calibration: Determine the responsivity of each detector

Traveling Spectral Irradiance and Radiance Responsivity with Uniform Sources (T-SIRCUS)
Tunable Laser
Wavemeter
IntegratingSphere
Exit Port
Computer
IntensityStabilizer
Monitor Detector
Shutter
Optical fiber
Clean Room
High Bay (not clean)
VIIRS Sensor
Laser Enclosure
Electrical Connection
Optical Fiber
Feedthru (Hole in the Wall)

T-SIRCUS used for Suomi NPP VIIRS
SpIS in front of VIIRS Earth Port Collimator illuminating VIIRS solar port
7
Can achieve ~0.1 % uncertainties in the sphere radiance
Collimator irradiance uncertainty depends on beam uniformity
Radiance responsivity illuminating VIIRS Earth Port with an integrating sphereIrradiance responsivity illuminating VIIRS solar port with a collimator
Nadir doors are open

• T-SIRCUS provides full-aperture system-level calibration
• Traditional monochromator (called the SpMA here) is not full-aperture
8
VIIRS Focal Plane

Example Result: VIIRS Band M7, Detector 8Optical Cross-talk
9
*resolved questions about the magnitude of the optical cross-talkand showed that it was small relative to the IB signal
David Moyer, Aerospace Corp.

T-SIRCUS value added to the calibration of NPP VIIRS• T-SIRCUS provides a significant improvement in the radiance responsivity and the spectral
registration calibration (smile) compared to what was done for EOS-MODIS. Both improvements were by "more than a factor of 10".
– Wavelength uncertainty lower (< 0.1 nm v. 0.5 nm)
• Validated optical cross-talk coefficients
– Established the magnitude of the optical cross-talk (small)
– Relieved community concerns about the validity of the ocean color data products
10
T-SIRCUS measurements took about half the time as the SpMA measurements.*cost and schedule savings with T-SIRCUS
• As a result of the successful NPP VIIRS testing, JPSS-1 VIIRS calibration using T-SIRCUS is scheduled for Fall 2014
• Refinements to the T-SIRCUS systemImproved lasersImproved Sources
A 1-m Spectralon sphere replaces the 30 inch diameter barium sulfate sphereFiber-optic-based source called the FPI
Greater dynamic range Operates in-vacuum; may be used to provide a calibration of the VIIRS SWIR bands during Thermal Vacuum (TVAC) testing

-0.2
-0.15
-0.1
-0.05
0
0.05
0.1
0.15
0.2
200 250 300 350
BCS2014Rad1fP4d1 TempT2-Tc (K)
Tem
pera
ture
Diffe
ren
ce
(K
)
Temperature (K)
Verification of JPSS VIIRS Blackbody Calibration Source (BCS) Radiance Temperature
Using the NIST Thermal-infrared Transfer Radiometer (TXR)
• The difference between TXR Radiance Temperature at 10 um and BCS Effective Temperature
• Error bars are current k=1 uncertainty estimates for TXR-measured Radiance Temperature
• Work is in progress to reduce these uncertainties
• Verifies that standard used for VIIRS Thermal-Emissive Bands calibration agrees with NIST
• Impacts VIIRS sea-surface and land-surface temperature calibration
BCS TXR
VIIRS Space-simulating Calibration Vacuum Chamber(At Raytheon, El Segundo, CA)
Currently upgrading TXR to use for JPSS CrIS blackbody check in FY2015

GOES-R Advanced Baseline Imager (ABI)
12
• Validated the radiance from the large lamp-illuminatedintegrating sphere used for ABI calibration at Exelis
Used the NIST transfer standards below
• Validated the radiance from the large vacuum-chamberblackbody used for ABI calibration at Exelis (the ABI vendor)
Use the NIST TXR
• Measured the ABI filter transmittance functions from witness filters, which served to validate the spectral responsivity functions used for all of the ABI bands
NIST Transfer Standard Sub-systems Spectral coverage [nm] Bandpass (sampling) [nm]
Spectral radiance standard (NPR) 4 lamps, 2 internal filtered photodiodes 250 to 2500 10
Filter radiometer (VXR) 6 channels 412 to 870 10
SR-3500 spectroradiometer VNIRSWIR1SWIR2
342 to 1000980 to 1894
1860 to 2505
3.5 (0.8 – 1.5)10 @ 1500 (3.3 – 4)7 @ 2100 (2.1 – 2.9)
FieldSpec 3 spectroradiometer VNIRSWIR1SWIR2
350 to 10001001 to 18001801 to 2500
3 @ 700 (1.3)10 @ 1400 (2)10 @ 2100 (2)
What NIST Did:
ABI is a multi-spectral filter radiometer in Geostationary Orbit
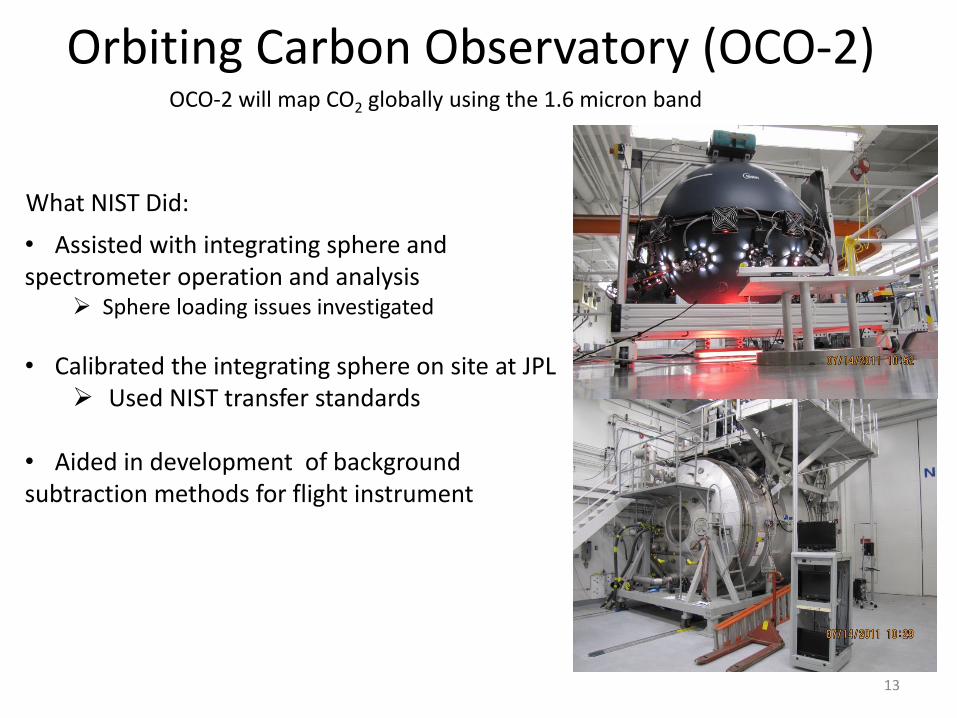
Orbiting Carbon Observatory (OCO-2)
13
• Assisted with integrating sphere andspectrometer operation and analysis
Sphere loading issues investigated
• Calibrated the integrating sphere on site at JPL Used NIST transfer standards
• Aided in development of backgroundsubtraction methods for flight instrument
OCO-2 will map CO2 globally using the 1.6 micron band
What NIST Did:
14
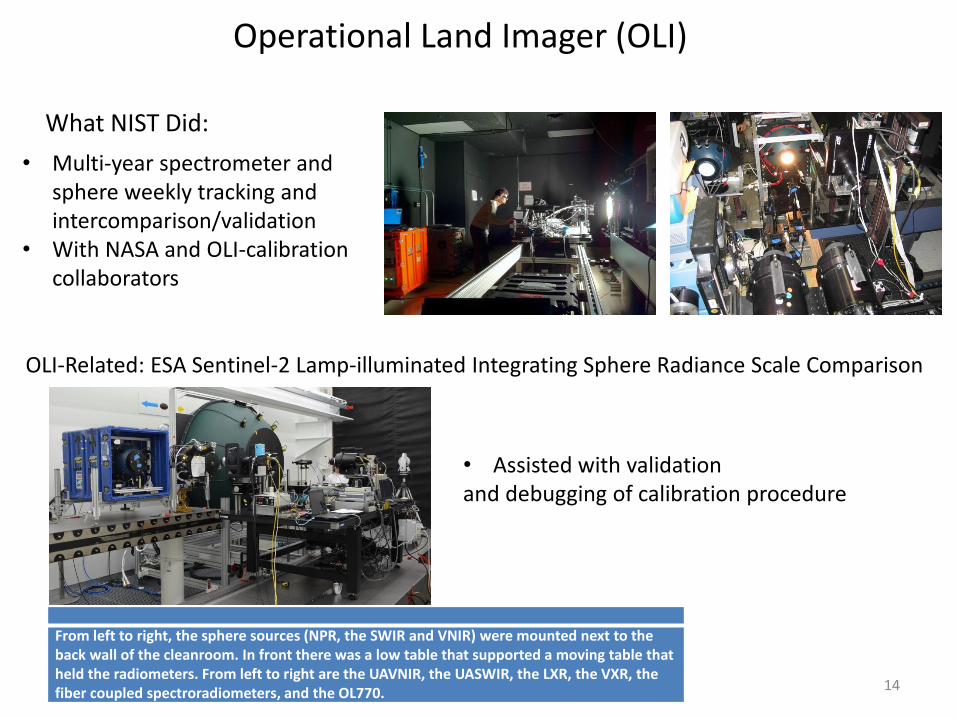
OLI-Related: ESA Sentinel-2 Lamp-illuminated Integrating Sphere Radiance Scale Comparison
From left to right, the sphere sources (NPR, the SWIR and VNIR) were mounted next to the back wall of the cleanroom. In front there was a low table that supported a moving table that held the radiometers. From left to right are the UAVNIR, the UASWIR, the LXR, the VXR, the fiber coupled spectroradiometers, and the OL770.
• Assisted with validationand debugging of calibration procedure
Operational Land Imager (OLI)
• Multi-year spectrometer and sphere weekly tracking and intercomparison/validation
• With NASA and OLI-calibration collaborators
What NIST Did:

0
100
200
300
400
500
600
400 500 600 700 800 900 1000 1100
OLI Matching Absolute
Sp
ectr
al R
adia
nce
(W
/m2sr
um
)
Wavelength (nm)
TOA Solar
Bare Desert Soil
Vegetation
HIP VNIR Limits
Measured from HIP Prototype VNIR Spectral Engine 11/3/10
Modeled Spatial Engine: XGA DMD f/3 with 20% Transmittance
Future: Hyperspectral Image Projector (HIP)
• The HIP is a NIST scene projector providing high resolution spectra at each spatial pixel.
• Using this for sensor testing prior to flight could validate designs and avoid future problems.
• Red data below right shows actual HIP output spectra matched to some typical Earth-reflected
spectra, shown in other colors, including Top-of-Atmosphere (TOA).
• This demonstrates that the HIP can simulate the scene from a bright sunny day outside.
0
20
40
60
80
100
120
140
160
0 500 1000 1500 2000 2500
Spec
tral
Rad
iance
uW
/cm
2/s
r/nm
Wavelength [nm]
NPR Radiance June 2009Lamp-spectrum (for comparison to HIP) HIP Spectra
Wavelength (nm)

NIST Hyperspectral Image Projector (HIP)
• Spectral and spatial image control using Digital Micromirror Devices (DMD)
• DMD1 controls spectrum, while DMD2 generates the spatial information
• Instrument Under Test is customer’s multispectral or hyperspectral imager
DMD
Spectral Engine
SpatialEngine

HIP Projection of Satellite Imagery Into ORCA Prototype in the Lab
Original Image HIP Image Measured by ORCA Difference Image (at 645 nm)
• NASA ORCA is a proposed future satellite(Ocean Radiometer for Carbon Assessment). • Clouds provide stray light that interfereswith the ability to measure ocean color andbio-chemistry to quantify carbon processes.• HIP difference images (below) enable measurement of stray light effects with realistic scenes before ORCA flies.
Typical Cloud Pixel Typical Ocean Pixel

Future: SIRCUS-type calibration of sensors using 1kHz OPO
1 kHz OPO
Standard detector
Monitor detector
Laser shutter
Integrating sphere
Baffle
Fiber optic
Spectroradiometer
Pulse traini(t)
16
Use energy mode (dose) instead of power mode Use charge amplifiers instead of trans-impedance amplifiers This method more easily enables tuning automation
Radiometer

Future: Stray-light correction for spectrometers & imagers
Imager’s Point Spread Function (PSF)
19
Correction matrix
1n meas,nn1n true, Y CY
Raw signalsTrue signals
1.0E-7
1.0E-6
1.0E-5
1.0E-4
1.0E-3
1.0E-2
1.0E-1
1.0E+0
1.0E+1
200 300 400 500 600 700 800
LS
F
Wavelength, (nm)
LSF
Spectrometer’s Line Spread Function (LSF)
[1] Yuqin Zong, Steve Brown, Carol Johnson, Keith Lykke, and Yoshi Ohno, “Simple spectral stray light correction method for array spectroradiometers,” Applied Optics, Vol. 45, No. 6, 1111-1119. (2006)[2] Yuqin Zong, Steven W. Brown, Keith R. Lykke, and Yoshihiro Ohno, “Simple matrix method for stray-light correction in imaging instruments,” US 8,554,009, Oct. 8, 2013.
Simply, fast matrix methods; reduced stray-light errors by > 1 order of magnitude. Wide applications in SSL lighting, optical remote-sensing, UV radiometry, display
metrology, and medical imaging.

Blackbody Cavity Reflectance Measurements
for JPSS CrISand for CLARREO
20
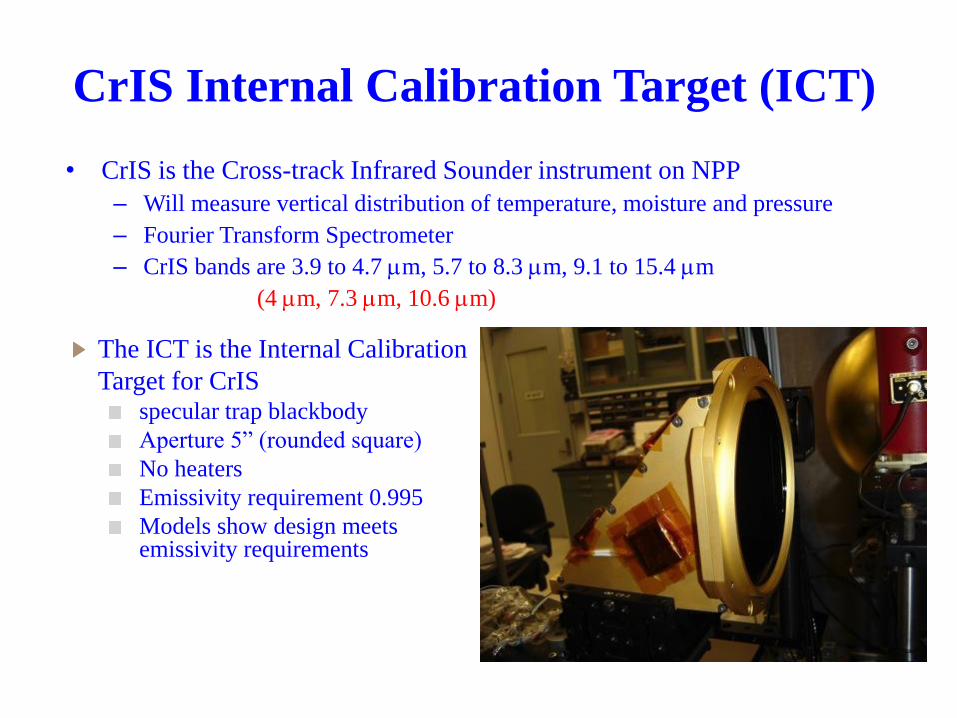
CrIS Internal Calibration Target (ICT)
• CrIS is the Cross-track Infrared Sounder instrument on NPP
– Will measure vertical distribution of temperature, moisture and pressure
– Fourier Transform Spectrometer
– CrIS bands are 3.9 to 4.7 m, 5.7 to 8.3 m, 9.1 to 15.4 m
(4 m, 7.3 m, 10.6 m)
The ICT is the Internal Calibration
Target for CrISspecular trap blackbody
Aperture 5” (rounded square)
No heaters
Emissivity requirement 0.995
Models show design meets emissivity requirements
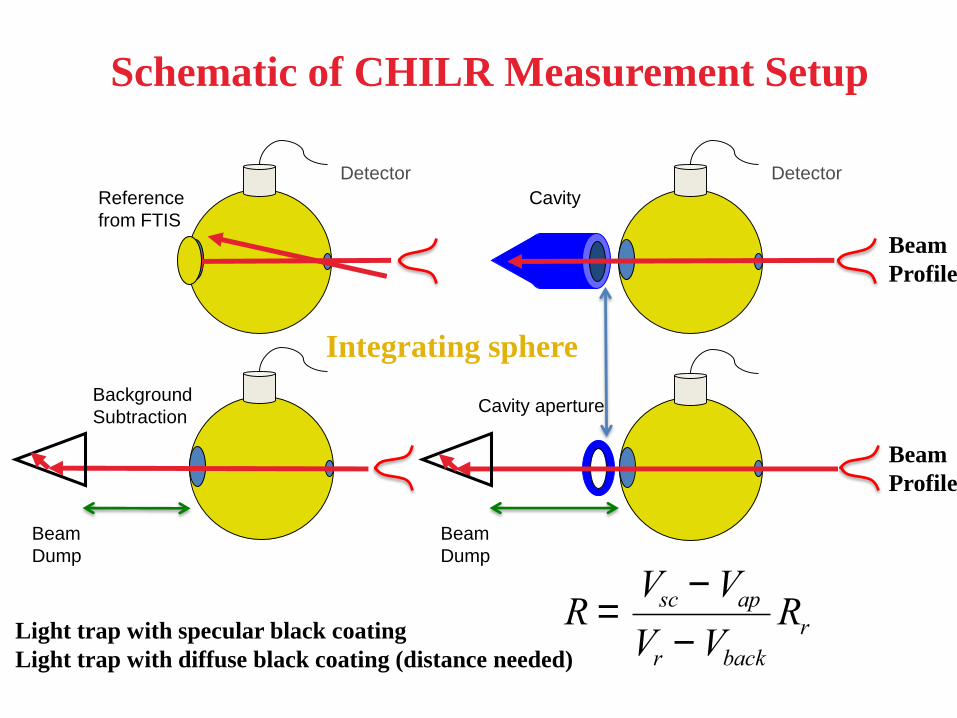
Schematic of CHILR Measurement Setup
Cavity
Detector
Cavity aperture Background
Subtraction
Beam
Dump
Reference
from FTIS
Integrating sphere
Detector
Beam
Dump
R =Vsc - Vap
Vr - VbackRrLight trap with specular black coating
Light trap with diffuse black coating (distance needed)
Beam
Profile
Beam
Profile
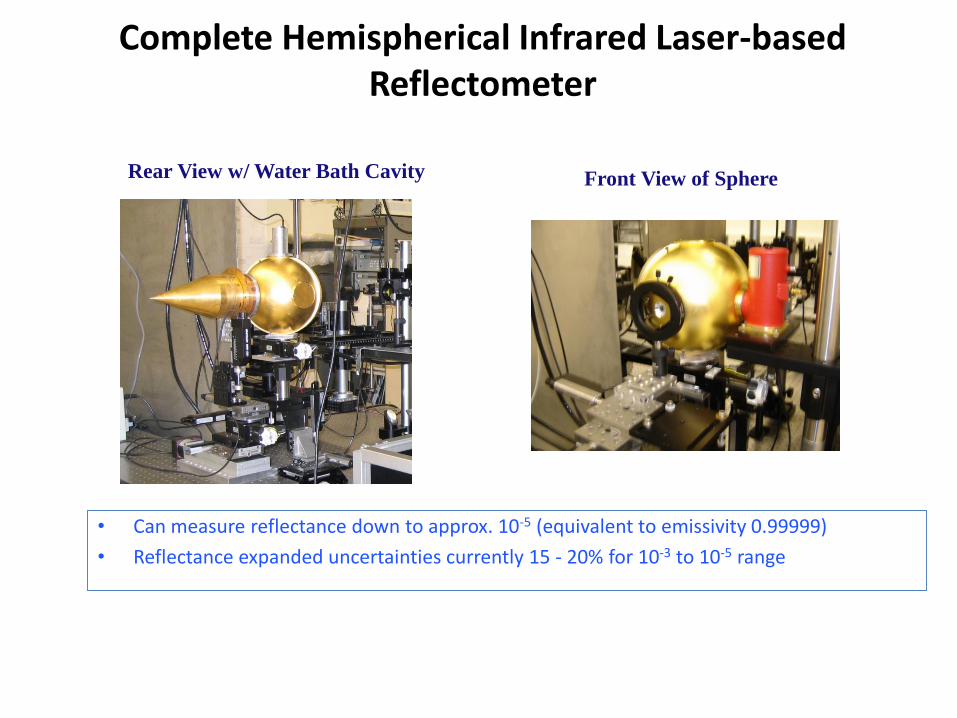
Complete Hemispherical Infrared Laser-based Reflectometer
• Can measure reflectance down to approx. 10-5 (equivalent to emissivity 0.99999)
• Reflectance expanded uncertainties currently 15 - 20% for 10-3 to 10-5 range
Front View of SphereRear View w/ Water Bath Cavity

Results for CrIS ICT @ 4 μm and 10.6 μm
Vertical Polarization 45° Polarization Horizontal Polarization
Vertical Polarization Circular Polarization Horizontal Polarization

NIST support of NASA CLARREO Calibration
Demonstration Systems (CDS)
• For solar-reflected band, long-term loaned NASA Goddard a T-SIRCUS and trained on use• For infrared emissive bands, performed research on blackbodies as shown below

Questions?
26Wikimedia Commons
The Earth at Night as seen by VIIRS

Backup Slides
27
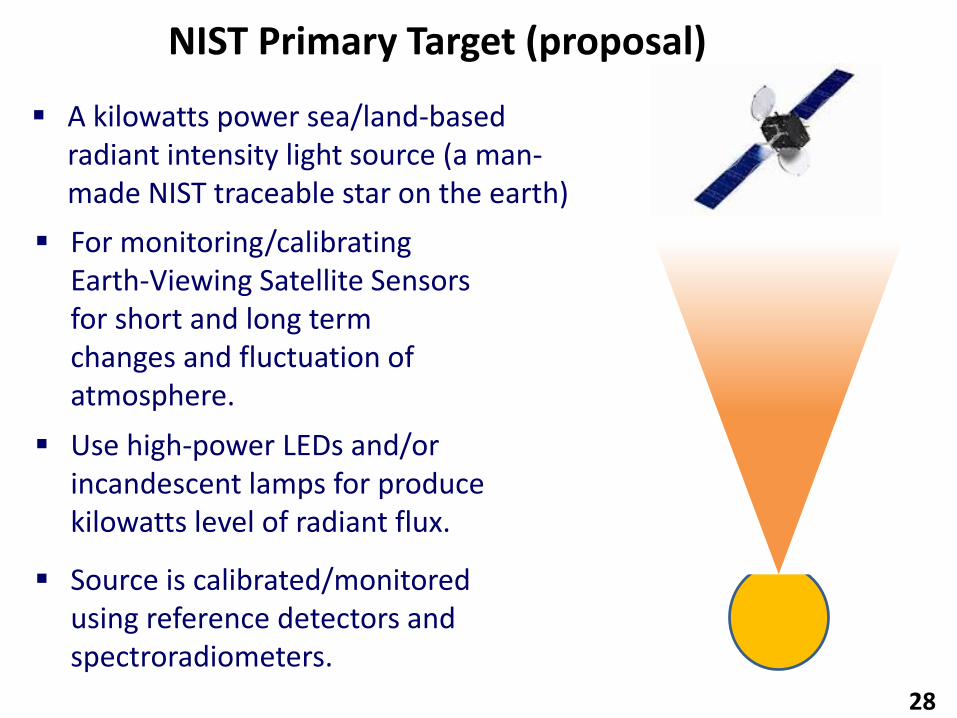
NIST Primary Target (proposal)
For monitoring/calibrating Earth-Viewing Satellite Sensors for short and long term changes and fluctuation of atmosphere.
A kilowatts power sea/land-based radiant intensity light source (a man-made NIST traceable star on the earth)
28
Use high-power LEDs and/or incandescent lamps for produce kilowatts level of radiant flux.
Source is calibrated/monitored using reference detectors and spectroradiometers.

NIST Advanced Radiometer (NISTAR) during fit check to DSCOVR spacecraft at NASA Goddard Space Flight Center

•During the 2010 calibration of NISTAR
using a portable SIRCUS facility, the
instrument was in a thermal-vacuum
chamber to simulate the space
environment.
•It viewed the output of a laser-
illuminated integrating sphere
coupled to an off-axis parabolic mirror
collimator, simulating the geometry of the
view of Earth from L1.
•The integrating sphere and collimator
were on a translation stage, and the laser
was fiber-optically fed.
•This enabled the source to be moved
relative to the large, fixed vacuum
chamber that contained NISTAR
•A silicon photodiode trap detector served
as the irradiance responsivity standard
Trap Detector
Optical Layout for 2010 NISTAR Calibration at NIST using Portable SIRCUS

NISTAR at SIRCUS: Summary of Absolute Calibration at 532 nm
•Ideally responsivity would be 1, in units of a fully-developed native scale, but it is not necessary to be 1 since we calibrated it against the SIRCUS (NIST detector-based) scale•Value > 1 means that NISTAR responsivity as measured at SIRCUS is greater than that determined by (crude) NISTAR native scale•Difference from 1 here believed to be drift of NISTAR native electrical power scale,but it could include effects from stray light, Joule heating, diffraction, nonequivalence The result of this work is that the irradiance responsivity of NISTAR is now known to
within an uncertainty of <0.2% (k=1) because we calibrated against SIRCUS
Error bars: k=1 combined uncertainty, <0.2%
0.9900
0.9950
1.000
1.005
1.010
1.015
1.020
1 1 2 2 3 3
Table 5 Summary 2010 for plot from NISTAR Calibration draft3
Irra
dia
nce
Re
sp
on
siv
ity,
RN
Receiver Cavity Number

Community Letter to NASA and NOAA regarding concerns over NPOESS Preparatory Project VIIRS Sensor
“Recent summaries of VIIRS performance from the IPO and NASA, presented at the NPP Science Team Meeting in August 2007, clearly show that the present configuration of the VIIRS sensor will not come close to meeting the VIIRS design specifications and required spectral radiometric accuracies -…The so-called "cherry-picked" configuration of the VIIRS's filter array will just meet these standards but only if the rest of pre-flight testing is completely error free (which is unrealistic as VIIRS just entered its testing phase). Hence, we have little confidence that VIIRS on NPP will ever provide well- calibrated ocean color imagery. “
Posted on SpaceRef, October 2, 2007
Signed by over 50 prominent U.S. ocean researchers
32
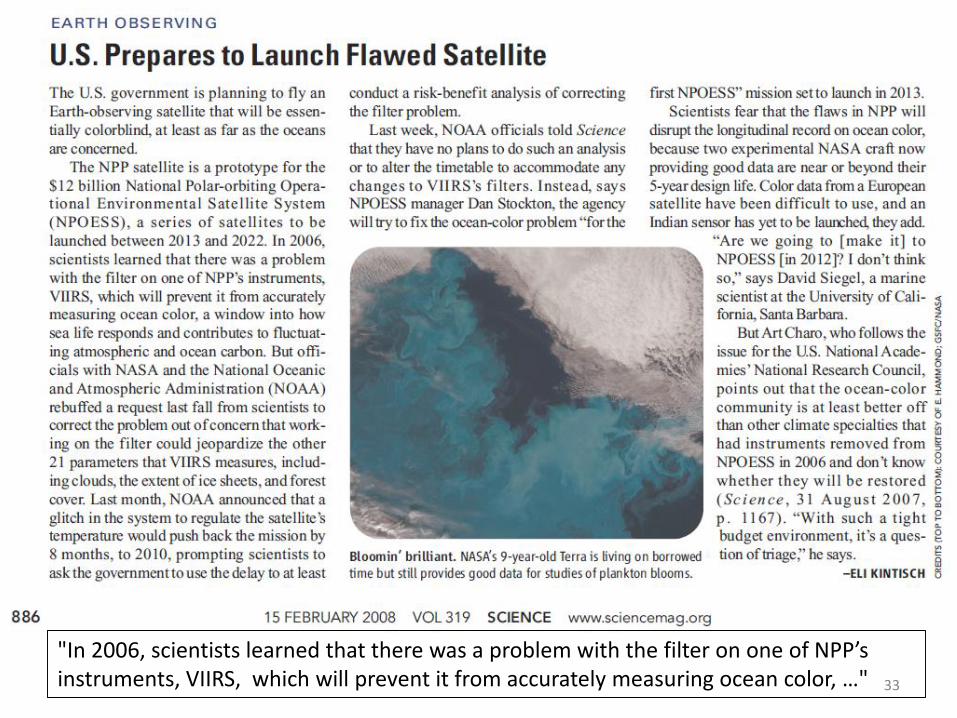
"In 2006, scientists learned that there was a problem with the filter on one of NPP’s instruments, VIIRS, which will prevent it from accurately measuring ocean color, …" 33
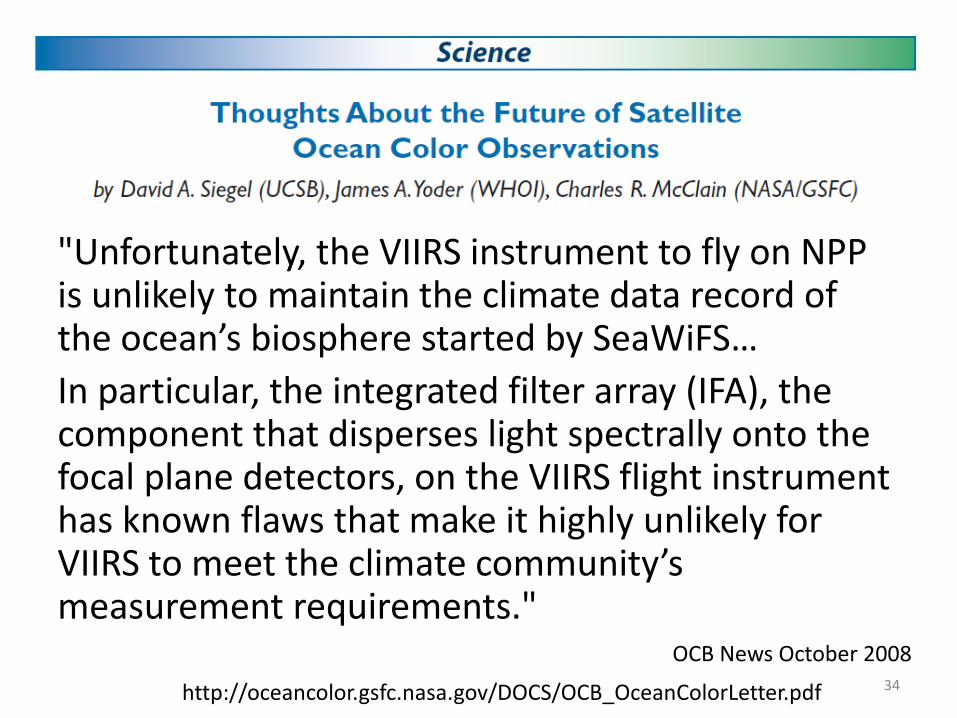
"Unfortunately, the VIIRS instrument to fly on NPP is unlikely to maintain the climate data record of the ocean’s biosphere started by SeaWiFS…
In particular, the integrated filter array (IFA), the component that disperses light spectrally onto the focal plane detectors, on the VIIRS flight instrument has known flaws that make it highly unlikely for VIIRS to meet the climate community’s measurement requirements."
OCB News October 2008
http://oceancolor.gsfc.nasa.gov/DOCS/OCB_OceanColorLetter.pdf 34

NPP Launched from Vandenberg Air Force Base, CA, United Launch Alliance Delta II rocket, 28 October 2011
35

T-SIRCUS Laser Setup at BATC for NPP VIIRSSchematic Diagram
36
Kentek laser containment
curtains
Laser Containment Curtains
Window to Clean Room

T-SIRCUS Laser Setup for Calibration of Suomi NPP VIIRS Vis/NIR Bands
(MIRA plus doubling plus doubled OPO)
37

VIIRS Optical DesignRotating Telescope Assembly (RTA)•Collects scene energy•Rotates at a constant
Half-angle Mirror (HAM)•Side A and Side B work alternatively•Rotates at half rate of RTA•“De-rotates” input beam•Directs photons into the fixed AOA (Aft Optics Assembly
SWIR/MWIR& LWIR Dewar
Vis/NIRFocal Plane Array
Aft Optics Assembly
38

Potential Problem with VIIRS Filters
• Filters placed on top of the detectors for spectral selection.– The properties of the filters were measured and it was
discovered that they scattered a great deal of light –much more than expected.
• Great concern in the community about – Optical Crosstalk
• Scattering from one band to another• Means that the bands to not measure the radiation at the
focal plane accurately.
– and whether or not VIIRS could provide Climate Quality Ocean Color Data Records
39
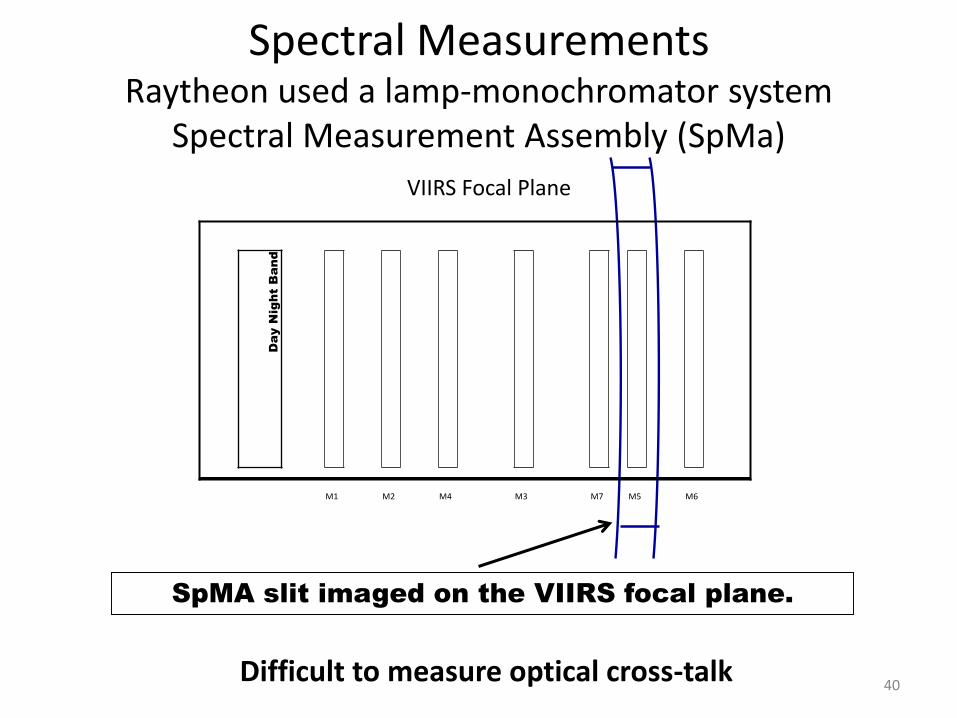
Da
y N
ig
ht B
an
d
M1 M2 M4 M3 M7 M5 M6
SpMA slit imaged on the VIIRS focal plane.
Spectral MeasurementsRaytheon used a lamp-monochromator system
Spectral Measurement Assembly (SpMa)
40
VIIRS Focal Plane
Difficult to measure optical cross-talk