file · web viewriver . patterns & processes. section c is on large scale processes....
TRANSCRIPT

Geography GCSERevision booklet
Remember to also use the notes in your Geography book.
If you have any questions,please ask your teacher.
The ExamThe exam is one hour 15 minutes long & takes place on Tuesday 19th May 2015It is worth 25% of the final mark.Section A answer ALL questions they will be on:1. Restless Earth2. Climate & Change3. Battle for the Biosphere4. Water WorldSection B is on small scale processesThere will be two questionsAnswer ONLY the question on topic 6. River patterns & processesSection C is on large scale processesThere will be two questionsAnswer ONLY the question on topic 7. Oceans on the edgeGeneral hints & tips
1
Read the front of the paper (the rubric) while waiting for the exam to start. It will usually ask you to identify on the front the questions you have chosen to answer in sections B & C.
Take in black pens, calculator, pencil, ruler, rubber Do not write in the margins – ask for extra paper if you need it Always look at the number of marks allocated to a question. This will
indicate how long to spend on the question and how much to write. Do not waste 5 minutes on a 2 mark question.
Command WordsCommand words tell you what to do. Read questions carefully and pick out the command words. There may be more than one.
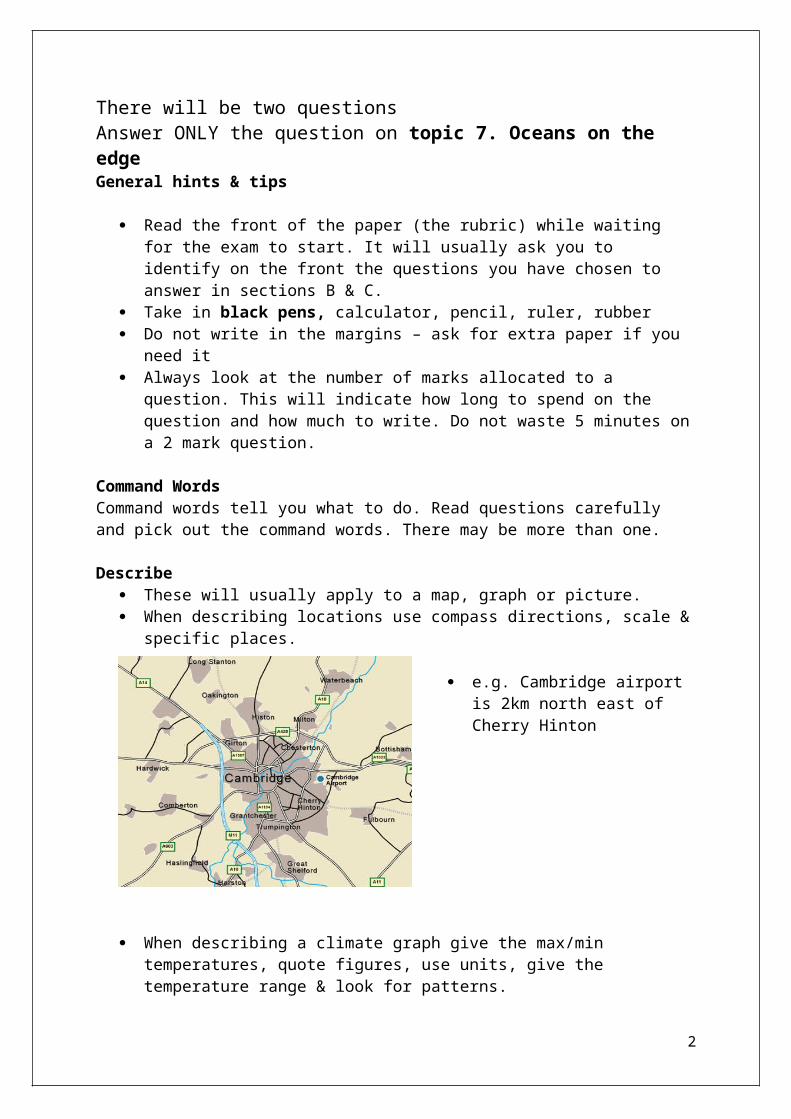
Describe These will usually apply to a map, graph or picture. When describing locations use compass directions, scale & specific
places.
e.g. Cambridge airport is 2km north east of Cherry Hinton
When describing a climate graph give the max/min temperatures, quote figures, use units, give the temperature range & look for patterns.
The graph at station A has a maximum temperature of 15C in July and a minimum temperature of -15C in January. The temperature range is 30C and temperatures are below freezing from September to May.
There is rain throughout the year with a maximum of 100mm in July and a minimum of 22mm in January.
2

“BECAUSE” does not describe. If you use the word because in an answer you are not writing a description, you are writing an explanation.
Explain – ‘So What?’ Develop sentences - ‘This means that…’
When a question asks you to explain you will need to extend your answers. Always think to yourself ‘so what?’
“Unemployment will rise so there will be less money spent in shops so they may go out of business.”
Look carefully at the command words in the question – What do they want you to do? Don’t waste time explaining if you only need to describe.
Other command words Means write about…Compare The similarities & the differencesContrast The differences
Distinguish The differencesAssess The advantages & the disadvantages OR
the arguments for and againstEvaluateDiscuss
Examine Describe AND explainOutline Describe and explainDefine Give the meaning of the word
For all questions it is a good idea to re-read the question and answer when you’ve finished.
Remember to use the proper geographical terms for things e.g. say ‘tributary’ rather than ‘smaller river’ and ‘migration’ rather than ‘movement of people’.
Restless Earth
3
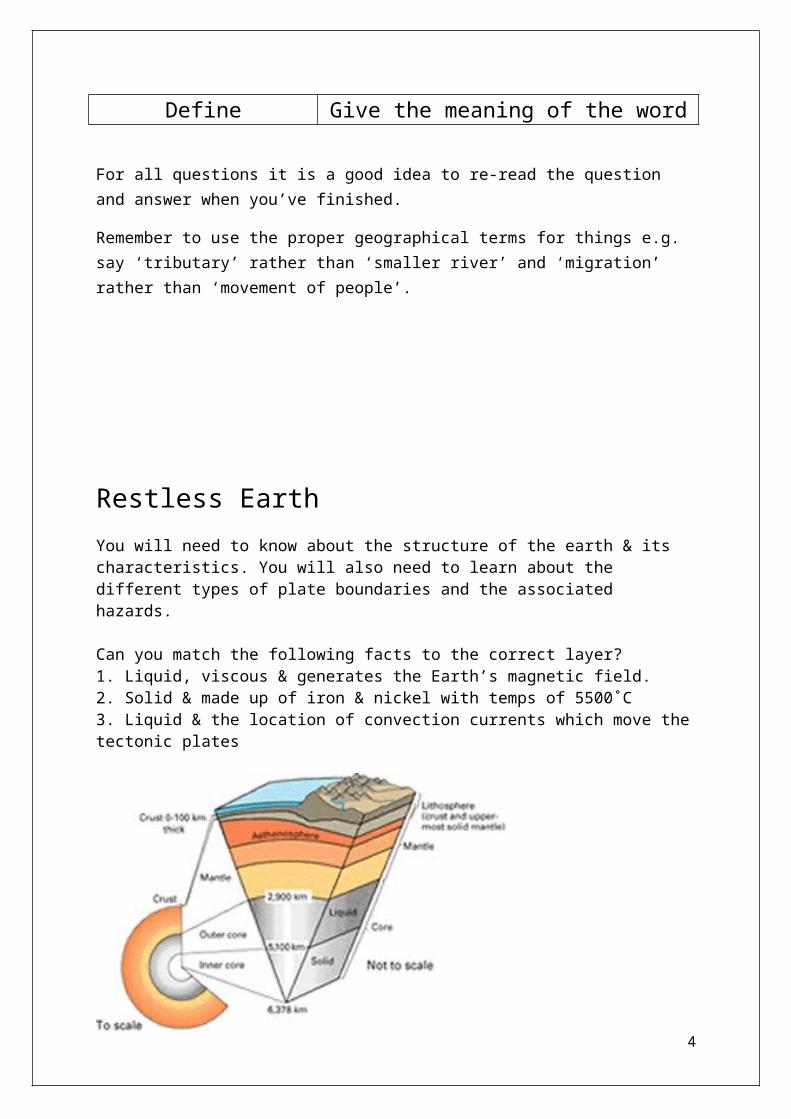
You will need to know about the structure of the earth & its characteristics. You will also need to learn about the different types of plate boundaries and the associated hazards.
Can you match the following facts to the correct layer?1. Liquid, viscous & generates the Earth’s magnetic field.2. Solid & made up of iron & nickel with temps of 5500˚C3. Liquid & the location of convection currents which move the tectonic plates
The core is the thickest section of
the earth. It is also the densest section.The asthenosphere is the uppermost part of the mantle. It is important as it acts as a lubricating layer for the lithosphere. The movement in the asthenosphere moves the tectonic plates above.
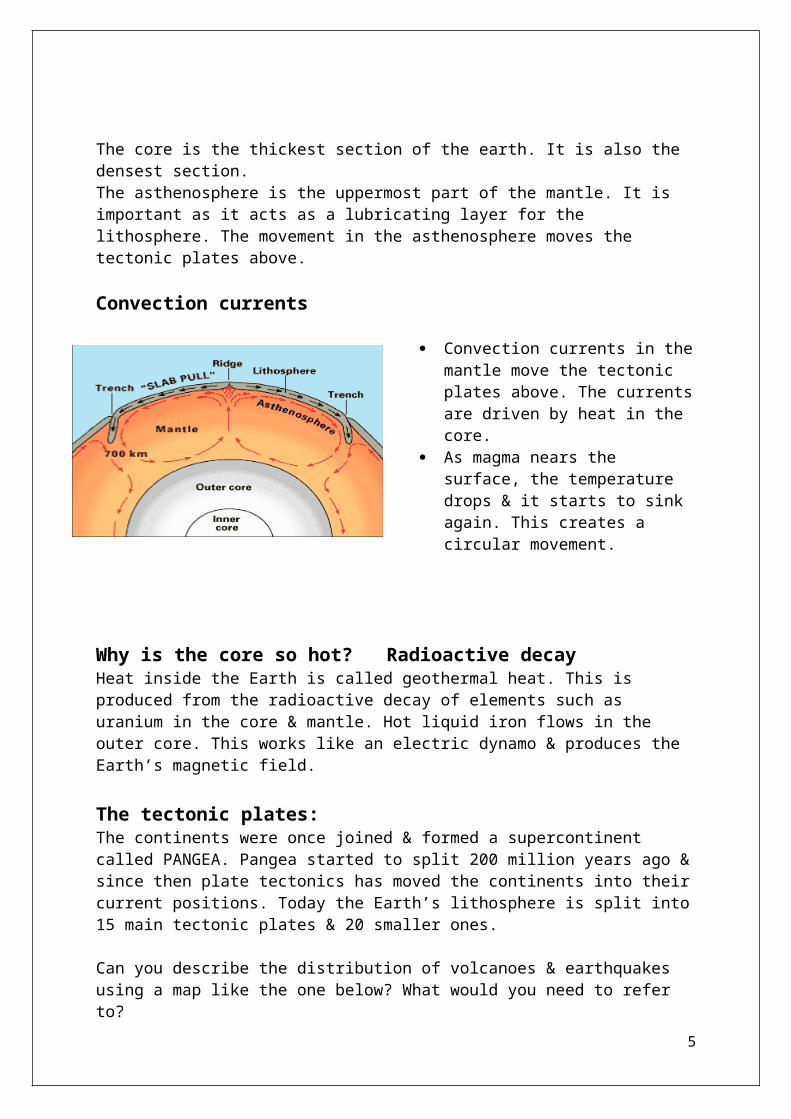
Convection currents
Convection currents in the mantle move the tectonic plates above. The currents are driven by heat in the core.
As magma nears the surface, the temperature drops & it starts to sink again. This creates a circular movement.
Why is the core so hot? Radioactive decayHeat inside the Earth is called geothermal heat. This is produced from the radioactive decay of elements such as uranium in the core & mantle. Hot liquid iron flows in the outer core. This works like an electric dynamo & produces the Earth’s magnetic field.
4
The tectonic plates:The continents were once joined & formed a supercontinent called PANGEA. Pangea started to split 200 million years ago & since then plate tectonics has moved the continents into their current positions. Today the Earth’s lithosphere is split into 15 main tectonic plates & 20 smaller ones.
Can you describe the distribution of volcanoes & earthquakes using a map like the one below? What would you need to refer to?
NB – Distribution just means you need to tell the examiner WHERE the volcanoes & earthquakes are. For example most are located in belts along the edges of the plate boundaries.
Crust
Most continental crust is 3-4 billion years old, whereas oceanic crust is only 180 million years old. Remember the difference between continental & oceanic crust. Look at the table & try to explain why there are differences in the age of the crust.
Continental OceanicThicker ThinnerLess dense Denser (heavier)Granite BasaltUp to 100km thick 7km thick
Oceanic crust is always forced below continental crust
Plate boundariesYou need to be able to DESCRIBE & EXPLAIN what happens at each type of boundary.
5

Remember…DESTRUCTIVE, Plates move towards each other & the oceanic one subducts because it is denser (Volcanoes – Composite cones & Earthquakes are found here)CONSTRUCTIVE, plates move apart (Volcanoes – Shield)COLLISION, plates move towards each other & push upwards (Fold mountains & Earthquakes)CONSERVATIVE, plates rub past each other, friction occurs between the plates (Earthquakes). The plates can either go in different directions or may be moving in the same direction at different speeds.
Destructive Constructive
Collision Conservative
Tsunamis:They occur because of earthquakes below the sea bed usually at destructive plate boundaries.The plates slide past each other & the seabed jolts upwards. Water is also forced upwards. The waves spread out in all directions from the epicentre on the ocean’s surface. As they approach the coast they slow down & gain height (up to 30m).
Three things affect their strength:1) Magnitude of the earthquake2) Depth of the focus (if it’s nearer the surface the tsunami will be
stronger)3) Distance from land (warning systems are only useful if the epicentre
is away from the coast)
6

Volcanoes:You need to be able to compare shield & composite volcanoes.
Shield Composite1.
Gentle sides Steep sidesBasic lava (runny so spreads out) Andesitic lava (thick)Less explosive eruptions with flowing lava that spreads out over a vast area
Violent eruptions with pyroclastic flows & volcanic bombs
Mauna Loa, Hawaii, Eyjafjallajoekull, Iceland
Mount Vesuvius, Italy, Mount Pinatubo, Phillipines
Try closing the booklet & completing labelled sketches of the two types of volcanoes.
Comparing magma
The characteristics of volcanoes are closely linked to the types of magma in them:
Basalitic AndesiticHighest temperatures High temperaturesLow in silica & gas Some silica & lots of dissolved
gasesFound at constructive plate Found at destructive plate
7

boundaries boundariesFluid lava which flows easily Due to dissolved gases it is likely to
explode
Measuring volcanoesThe VEI (Volcanic Explosivity Index)The scale from 0-8 measures the amount of erupted material.
Volcanic hazards:Hazards come in the form of lava, volcanic bombs, ash & pyroclastic flows.The volcano itself is not the hazard!
8
There are fixed spots in the mantle (called HOTSPOTS) where magma rises to the surface. In the past
these spots have been very active &
destructive. The best known example is the
Yellowstone Supervolcano.

EarthquakesMeasuring earthquakes:There are two scales used to measure earthquakes: Richter scale – Measures the earthquake’s energy using the numbers 1-10. Each number up the scale is TEN times more powerful than the one below.Mercalli scale - This scale uses roman numerals to measure the intensity of the earthquake. Often this scale is used to create maps showing the effects of an earthquake.
Case StudiesCase studies are specific examples of tectonic events, such as volcanic eruptions and earthquakes. If a question asks you to give a ‘named example’ you will need to use one that you have studied.
Montserrat, Caribbean IcelandVolcano Chances Peak EyjafjallajoekullDate of eruption
July 1995 (there have been intermittent eruptions since & another large eruption in 1997 – The last eruption was Jan 2010)
April 2010
Impacts on people
Population had to relocate to the north, 2/3 (6’000) population migrated, many
UK & European airspace closed, significant economic loss, rising
9
A super hot lump of lava ejected from a volcano AKA volcanic bomb
A superheated high speed flow of ash & volcanic material AKA pyroclastic flow

to the UK, airport destroyed, tourist industry destroyed leaving few job opportunities
insurance claims, tourist industry affected
Impacts on environment
Farmland lost, mudflows destroyed villages, Plymouth (capital) destroyed,½ island designated as a ‘no go zone’
Farmland lost, glacial melting causing flooding, red sunsets
Other points Violent eruption due to viscous andesitic lava blocking the vents.The volcano was thought to be ‘dormant’
The eruption was in a remote area
San Francisco HaitiExact location
Loma Prieta Port au Prince
Date 17, Oct, 1989 12, Jan, 2010Richter scale 6.9 7.0Duration 10-15 seconds 60 secondsDepth 18km 13kmCause Conservative boundary -
Slip on the San Andreas Fault (Pacific & North American plates.)
Conservative boundary - Caribbean & North American plate. 52 aftershocks above 4.5 on the richter scale added to damage
Immediate impacts
63 deaths3’757 injured12’000 homeless$10bn damageCracked Candlestick park baseball stadium, Nimitz freeway collapsed in places crushing cars on the lower deck, massive property damage in the bay area due to liquefaction of the clay soils
230’000 deaths (not including those who have since died)300’000 injured1 million homelessPort destroyed (aid was difficult to get in)Morgues couldn’t cope so bodies were buried in mass graves
Other points Since 1985 all buildings have to be ‘earthquake proof’
There had not been an earthquake here for 200 years so people were not prepared or expecting it.The high density of largely self-built homes contributed to the high death toll
10

1million refugees were still living in tents in Oct 2010Cholera outbreaks in Oct - Dec 2010 due to unsanitary water
Hazard Vulnerability A number of factors make people more vulnerable & therefore increases risk:
Type of hazardSize & type of event is crucial. The eruption of a shield volcano such as Mauna Loa is often not life threatening whereas the explosive eruption of a composite cone can be devastating
Location’s vulnerability to a hazardIf you live near a plate boundary your risk increases
Capacity of the community to cope. Usually people in more developed countries will be better able to cope as they have access to money & technology. Prediction is also likely to be better.
Hazard ManagementHazard management is expensive, but in most areas prone to tectonic hazards people develop strategies to cope.
Preparation (being ready to respond rapidly) Emergency plans Warning/monitoring systems Evacuation plans / drills Search & rescue training Emergency kits
Mitigation (reducing the impact) Hazard resistant buildings Relocation of people from hazard prone
areas
Volcanic hazards can be predicted and in developed countries protection methods are used, such as lava bomb shelters.
Can you think of examples of prediction & preparation?
Did you get any of these?
Prediction = Tiltmeters measure the volcano swelling up as it fills with magma, boreholes
11

measure water temperature as it heats up, hot springs are monitored & aircraft measure the amount of gas given off by the volcano.
Protection = Volcanic bomb shelters are built, concrete lahar channels are dug to divert mudflows, people have regular evacuation drills & evacuation routes are clearly signposted.
Hazard resistant buildings vary in developed & developing countries. Some strategies are shown below:
Developed(more expensive techniques)
Developing(cheaper techniques)
Use shear walls (concrete with steel rods inside) to stop the walls rocking
Install a ring beam (concrete ring) to stop walls moving outwards
Use steel beams to cross brace & strengthen the frame
Use timber cross bracing to strengthen the frame
Add base isolators between the building & foundation to absorb the sideways motion
Removal of mud overlay on roofs to make them lighter
Aid is often given in the immediate aftermath of a tectonic event. Immediate aid is needed to keep people alive & long term aid is used to re-establish the community so they can become independent. Can you sort the following list into short & long term aid?
Tents Blankets Seeds Building materials Antibiotics Mobile field kitchens Blankets Pipes, concrete, tarmac Bottled water
Responses to hazardsResponses are what people do after the hazard. There can be short term or long term responses to hazards. Short term responses deal with the aftermath of the hazard while long term ones plan for the future.
Short term Long termEvacuation RebuildingRe-housing survivors Creating new planning lawsAsking for aid (food, water, money)
Educating people (practising emergency drills)
12

Climate ChangeClimate change is NOT NEW. There has been change in the past. What is new is the speed of current climate change.
Causes of climate change can be natural or human.
Natural causes include:Milankovitch cycles – The earth’s orbit changes to an elliptical (oval) shape. The cycles last 100’000 years. When the Earth’s orbit is more elliptical temperatures can be 5-6˚C cooler & this usually coincides with an ice age. Sunspots – Often occur in 11yr cycles. If the sun has lots of sun spots it has to work harder and so the Earth gets hotter. During the Little Ice age there were very few sunspots.Volcanic ash – Ash & gas can be circulated by atmospheric currents. Large eruptions temporarily block sunlight (the ash particles reflect the light back into space) causing temperatures to fall.
Human causes include:The enhanced greenhouse effect
CASE STUDIESThe Little Ice Age is an example of a short term climate change. Key facts:
Lasted from approximately 1600-1800 The growing season in Europe was much shorter than today The River Thames frequently froze and Londoner’s enjoyed Ice Fairs The cold affected ecosystems e.g. seal populations fell as fish
supplies fell HUMANS adapted well to these harsher conditions
Historical documents, paintings and even tree rings provide evidence about past change (tree growth is much slower in colder years). Even roof timbers in houses built during this time prove that it was much cooler.
ADDITIONAL EXAMPLE The 8 month eruption of the Laki volcano in Iceland in 1783 also
caused short term climate change. It released 120 million tonnes of sulphur dioxide into the
atmosphere. The haze of dust & ash got carried over northern Europe. The sun was blocked out & there was a harsh winter. 1784 was a year of extreme heat & crops failed.
13

For four years after the eruption Europe experienced extreme weather patterns.
The food poverty in France was a major factor in the French Revolution in 1789.
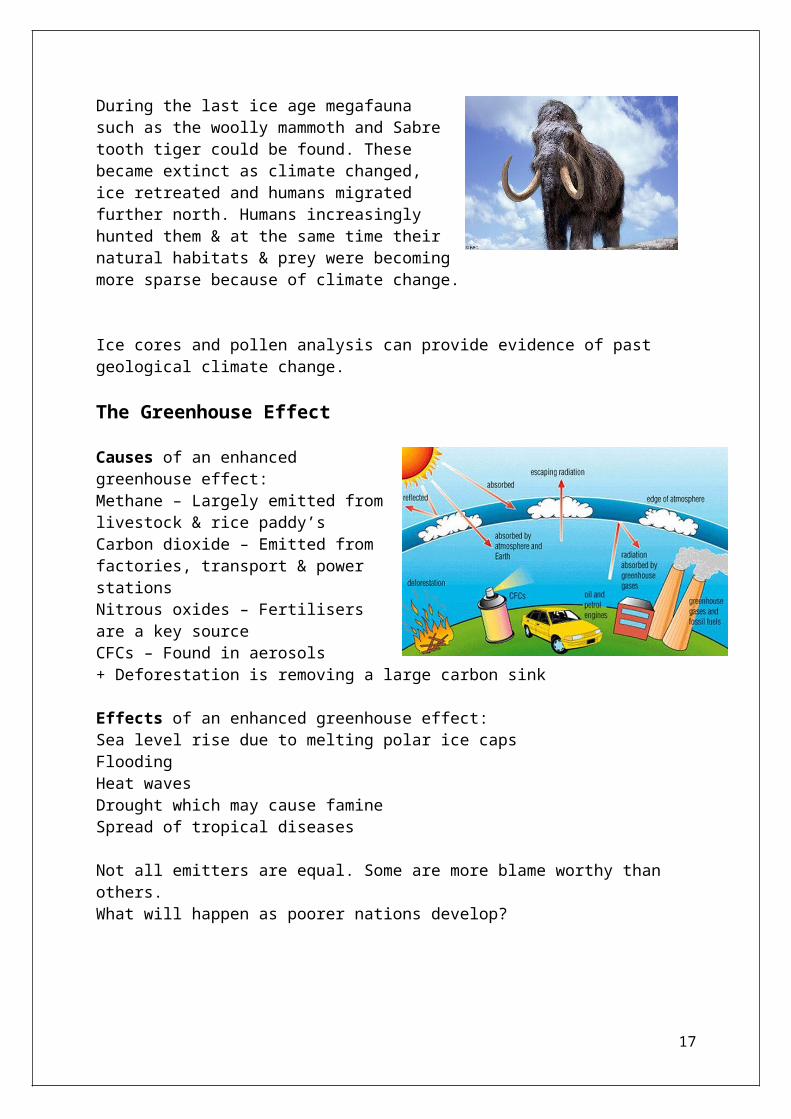
A geological climate event takes place over millions of years. The last ice age started 100’000 years ago and ended 12’000 years ago. It is referred to as the Pleistocene. The last 10’000 warm years are known as the holoscene.During the last ice age megafauna such as the woolly mammoth and Sabre tooth tiger could be found. These became extinct as climate changed, ice retreated and humans migrated further north. Humans increasingly hunted them & at the same time their natural habitats & prey were becoming more sparse because of climate change.
Ice cores and pollen analysis can provide evidence of past geological climate change.
The Greenhouse Effect
Causes of an enhanced greenhouse effect:Methane – Largely emitted from livestock & rice paddy’sCarbon dioxide – Emitted from factories, transport & power stationsNitrous oxides – Fertilisers are a key sourceCFCs – Found in aerosols+ Deforestation is removing a large carbon sink
Effects of an enhanced greenhouse effect: Sea level rise due to melting polar ice capsFloodingHeat wavesDrought which may cause famineSpread of tropical diseases
Not all emitters are equal. Some are more blame worthy than others.What will happen as poorer nations develop?
14

KYOTO PROTOCOL
• World carbon concentrations are measured in ppm (parts per million)
• In 1800 it was 280ppm, in 2008 it was 380ppm• The figure is rising by 2ppm every year.• 550ppm is seen as the tipping point. This is the point at which the
Earth won’t be able to recover.• If greenhouse gas emissions are above this events will spiral out of
control
What do each of the following countries think about the protocol? Have they signed & ratified it? Why/Why not?
UK, France, China, USA, Bangladesh, Russia
People are often reluctant to pay to reduce global warming. Even energy saving light bulbs cost more than regular ones. The STERN review was a report on global warming produced in 2005. It concluded that we need to act now to reduce global warming or we would pay later. He said that the effects of global warming would reduce our GDP by 20% in the future.
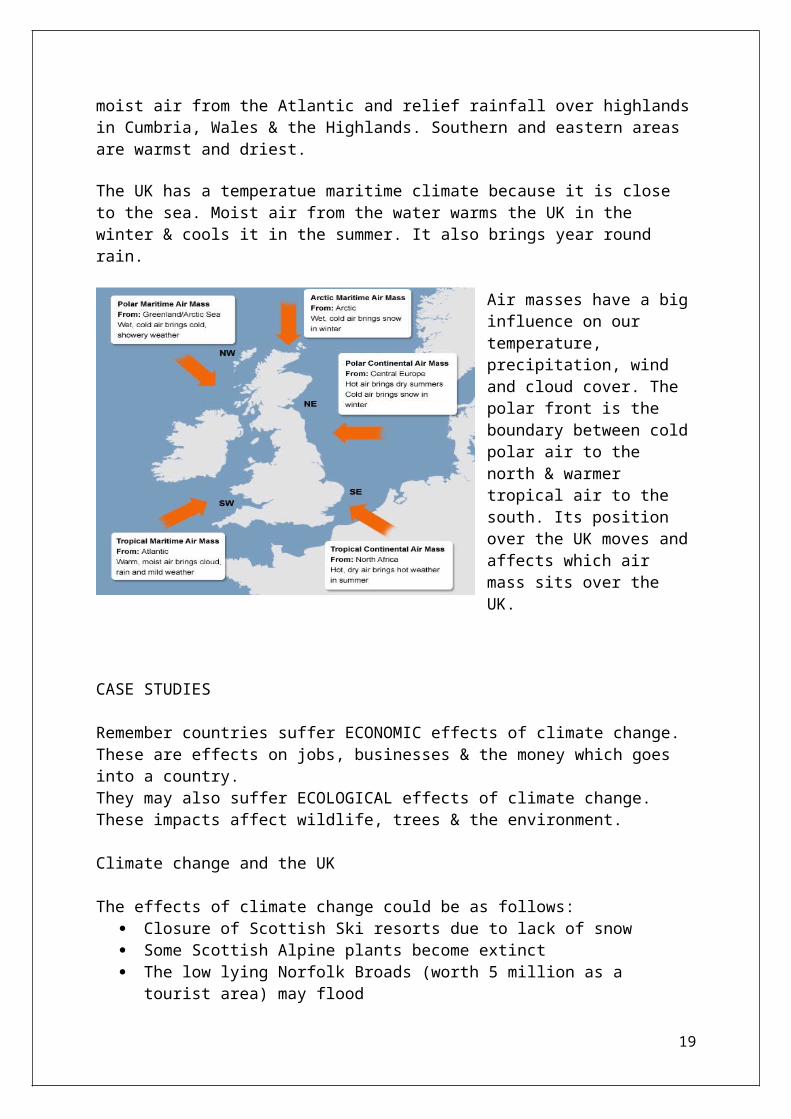
THE UK CLIMATEThe UK has a mild climate with no extremes of temperature & rainfall throughout the year. Generally temperatures range from 3c to 18c. The western side of the UK is wettest due to moist air from the Atlantic and relief rainfall over highlands in Cumbria, Wales & the Highlands. Southern and eastern areas are warmst and driest. The UK has a temperatue maritime climate because it is close to the sea. Moist air from the water warms the UK in the winter & cools it in the summer. It also brings year round rain.
15

Air masses have a big influence on our temperature, precipitation, wind and cloud cover. The polar front is the boundary between cold polar air to the north & warmer tropical air to the south. Its position over the UK moves and affects which air mass sits over the UK.
CASE STUDIES
Remember countries suffer ECONOMIC effects of climate change. These are effects on jobs, businesses & the money which goes into a country.They may also suffer ECOLOGICAL effects of climate change. These impacts affect wildlife, trees & the environment.
Climate change and the UK
The effects of climate change could be as follows: Closure of Scottish Ski resorts due to lack of snow Some Scottish Alpine plants become extinct The low lying Norfolk Broads (worth 5 million as a tourist area) may
flood Coastal erosion in Norfolk will increase Droughts & floods will become more likely as extreme weather
events increase. Heat induced deaths will increase, particularly among the elderly. Increased growing season throughout the UK Recently introduced crops will prosper in southern England e.g.
grapes, olives Winter heating costs will decrease
Bangladesh
The Himalayas are to the north of Bangladesh. Global warming is leading to increased and earlier snowmelt.Much of the country is low lying & below sea level.Three of the world’s largest rivers cross Bangladesh.
16
Global warming is likely to lead to more flooding, increased tropical storms.
They are a POORER country so would struggle to find the money to deal with the effects of climate change.
The knock on effects would be increased homelessness, problems growing crops & food shortages, economic loss (money) and increased reliance on world aid. It is also likely that they would experience an increase in tropical diseases. These might lead to increased migration of people in search of new homes & sources of food.
Battle for the BiosphereA biome is a region characterized by a similar climate, plant & animal species. It is a large scale ecosystem.Major world biomes:Tropical rainforestsDesertsTemperate deciduous forestsSavannah Tundra
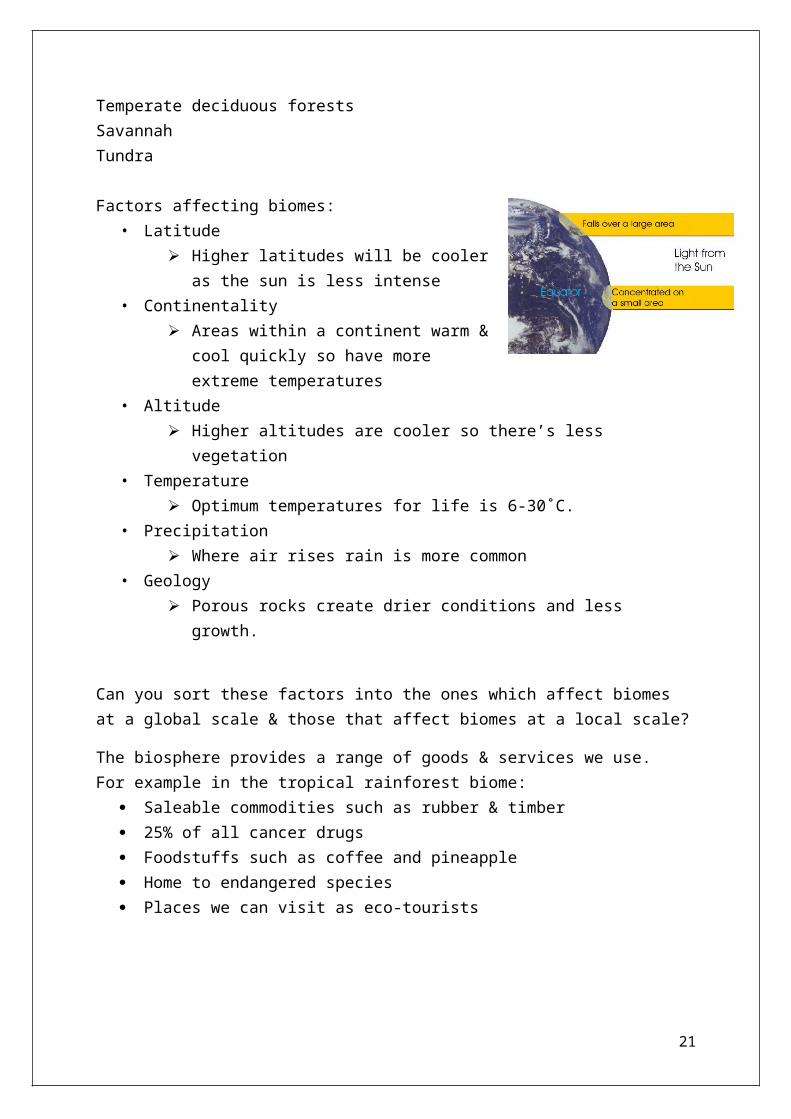
Factors affecting biomes: • Latitude
Higher latitudes will be cooler as the sun is less intense
• Continentality Areas within a continent warm & cool
quickly so have more extreme temperatures
• Altitude Higher altitudes are cooler so there’s less vegetation
• Temperature Optimum temperatures for life is 6-30˚C.
• Precipitation Where air rises rain is more common
• Geology Porous rocks create drier conditions and less growth.
Can you sort these factors into the ones which affect biomes at a global scale & those that affect biomes at a local scale?
The biosphere provides a range of goods & services we use.
17

For example in the tropical rainforest biome: Saleable commodities such as rubber & timber 25% of all cancer drugs Foodstuffs such as coffee and pineapple Home to endangered species Places we can visit as eco-tourists
The biosphere is a life support system for the planet. It contributes to the soil, regulates the atmospheric content & slows down the movement of water.
Biodiversity is the range of plant & animal species. A loss of biodiversity is a problem because we would lose plants and animals and potential medication along with them.
The Tropical Rainforest BiomeThe Amazon, BrazilBackground
Tropical Rainforest is found between 10˚N and 10˚S of the equator Temperatures are usually a constant 28˚C with high rainfall
(convectional rain) These conditions allow optimum growth for a number of species Human action has led to degradation (lowering of the quality) of the
rainforest 100’000km2 is cleared in Brazil each year
Reasons for clearance Mining projects such as The Grande Carajas Project which mine iron
& aluminium. Dams – Dams provide Hydroelectric Power, but flood large areas of
valley floors.
18
New roads – e.g. construction of the Trans-Amazon highway. Agriculture – Forest clearance for commercial agriculture is
common. Cattle ranching & growing soya are the most common form of agriculture.
Farming – Landless farmers migrate to the Amazon & clear land for their own crops. Demand for meat is increasing especially from developed countries that have a meat rich diet.
Population increases – As Brazil’s population increases more land is cleared to make way for settlements. Deforestation often follows the pattern of roads.
Other forms of stress on the Rainforest Biome
Overfishing – As populations grow so does their need for food. The Pacu fish are in decline. These fish disperse the seeds of some rainforest trees.
Climate change – Rainforest frogs are sensitive to environmental change & have decreased in large numbers.
Protecting BiomesTo protect biomes a combination of local & global actions are needed. Often it is difficult to decide what to protect. Do we save the areas most under threat? Do we restore devastated areas? Do we protect keystone species?
Global conservation schemes• RAMSAR convention for wetland conservation
• Protects coastal areas, estuaries, lakes, rivers & marshlands• Wetlands support lots of other animals e.g. reptiles, wild birds
& mammals• Adopted by 147 countries
• CITES convention on international trade in endangered species• Protects species such as elephants & tigers from poachers• Poachers face harsh penalties• Stops illegal trade in goods such as ivory & crocodile skin• Adopted by 166 countries
National conservation schemes• National Parks
• The Peak District, Snowdonia & The Lake District are all examples
19

• Rangers actively manage the park & the visitors• Money from visitors (e.g. parking) is used to improve the park• Facilities are put in to ensure it is sustainable e.g. marked
footpaths, picnic areas with litter bins • Building in the parks is restricted
• National Forests • Provide areas of trees often near major cities• Rangers provide education & actively manage sites
Case Study: A local conservation scheme: Epping Forest (Temperate Deciduous Biome)
Epping Forest ancient deciduous forest north-east of London. Covers 2,500 ha and are 19km long and 4km wide. Largest area of public open space near London. 70% is deciduous woodland (mainly beech), also has grasslands and
marshes. Has wide variety of wildlife, including 3 native species of woodpecker,
stag beetles, and fallow deer still roam. SSSI and other conservation designations – see above.Overall planning responsibility for Epping Forest lies with City of London Corporation produces plans to ensure that forest provides a public open space whilst conserving natural environment. Planning includes:
Managing recreation by providing car parks, toilets, refreshment facilities and maintaining footpaths.
Providing 3 easy access parks for disabled access. Allowing old trees to die and collapse naturally (unless dangerous). Controlling some forms of recreation (riding, mountain biking) which
may damage environment or other forms of recreation. Re-pollarding ancient trees and so preserving them. Encouraging grazing to maintain grassland and associated
ecosystems. Preserving ancient earthworks and buildings. Maintaining ponds to stop them silting up. Preserving herd of fallow deer.
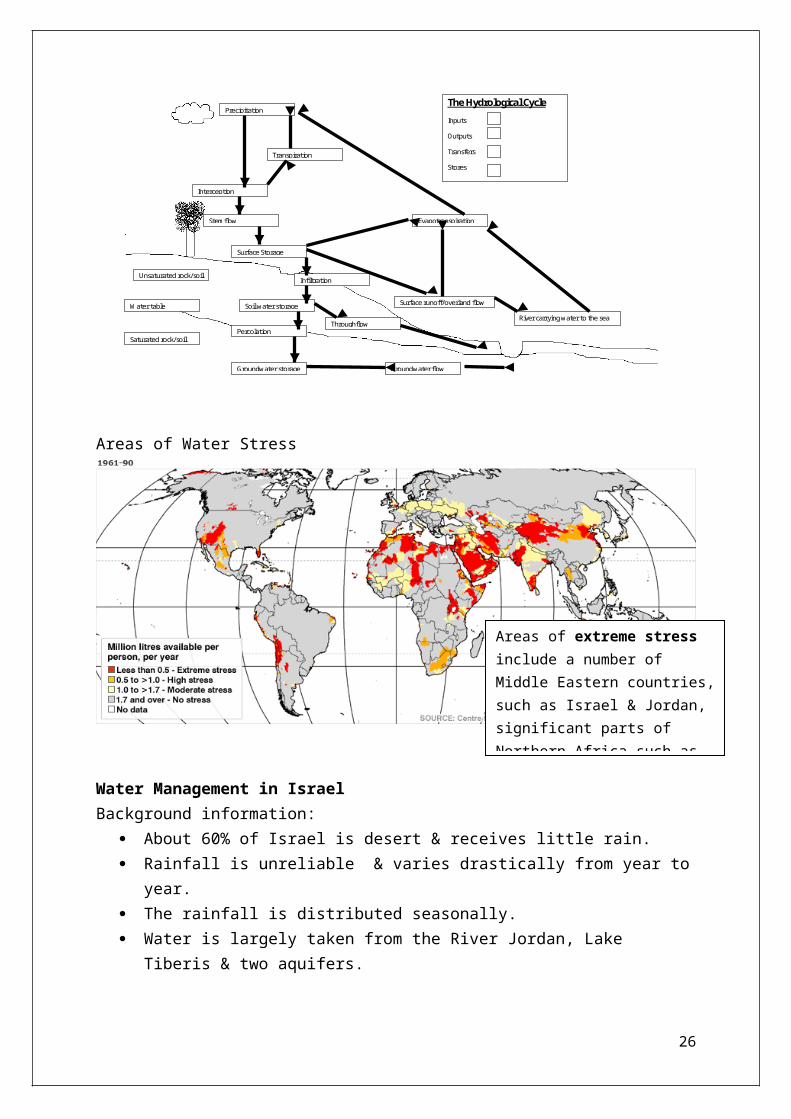
WATER WORLDYou need to know all the processes of the hydrological cycle & should be able to decide which are stores & transfers.
20
Precipitation
Groundwater flow Groundwater storage
Percolation
Soil water storage
Stemflow
Interception
Infiltration
Surface Storage
Transpiration
Throughflow
Surface runoff/overland flow
River carrying water to the sea
Evapotranspiration
Unsaturated rock/soil
Water table
Saturated rock/soil
The Hydrological Cycle
Inputs
Outputs
Transfers
Stores
Areas of Water Stress
Water Management in IsraelBackground information:
About 60% of Israel is desert & receives little rain. Rainfall is unreliable & varies drastically from year to year. The rainfall is distributed seasonally. Water is largely taken from the River Jordan, Lake Tiberis & two
aquifers. The tributaries of the river rise outside Israel’s territory & there are
on going disputes over the control of water resources in this region.
Why is there an increase in demand for water? Large scale immigration
21
Areas of extreme stress include a number of Middle Eastern countries, such as Israel & Jordan, significant parts of Northern Africa such as Egypt & California, Nevada & Arizona in the USA.

Natural population increase Climatic conditions Political conflict Intensive irrigation/poor farming practices
What are the government doing about the problem?
They have adopted a policy of allocative efficiency. The water goes to businesses & areas of the economy who need them first, before the general public & farmers.
Causes of Water Stress
Natural Causes Seasonal variations in climate Long term drought
Human Causes Civil war Population increase Lack of technology Changes in agriculture (intensive farming of cash crops using
fertilisers & large scale sprinkler systems) Climate change due to the enhanced greenhouse effect
Large Scale Water Management
Dams along the River Colorado The water flows through seven states. Many of these areas have large populations and suffer from a lack of rainfall. The cities of LA & Las Vegas in particular use a large amount of water. To manage water a series of dams have been built along the river. The most famous of these is the Hoover dam, which created Lake Mead and stores the equivalent of two years water.
Advantages of using dams Disadvantages of using damsControls flooding Limits the water flow further
downstreamCan be used for Hydro Electric Power (HEP)
Creating a reservoir floods large areas of land
Creates a water supply which can be used for drinking, irrigation etc.
Less flooding means that river silt is no longer deposited on floodplains
Creates a reservoir which can be used for leisure activities
Dams are very expensive
They can affect wildlife, such as
22

salmon who breed upstream
What would the following people think about the dams along the Colorado?
Farmer in the California wine producing region on San Fernando Mexican farmer living near the mouth of the Colorado Native American on whose land the giant dams are built Resident of Las Vegas
Small Scale Water ManagementSmall scale practical solutions are often most appropriate for developing areas. Local people need to be able to apply & maintain the solutions themselves.Examples
Lined wells use concrete to line the wells & a concrete cover this helps keep water uncontaminated
Handpumps raises water from the ground with less chance of contamination
Rain barrels to allow water harvesting
Case StudyIntermediate technology in TanzaniaBackground
Tanzania is in east Africa It is a developing country with a life expectancy of 46 70% of the rural population do not have access to safe drinking
water Diarrhoea accounts for 20% of infant deaths Water is often contaminated with sewage
The solution International agency Water Aid brings intermediate technology to
communities. Water Aid work with Tanzania’s Anglican Church. In Chessa village they have constructed a 24m well with an Afridev
handpump, 15 families can now access safe water. Communities are responsible for the upkeep of the pump & its
repairs. Volunteers are trained for a week & given a toolkit so they can fix
the pump & once a week they take the pump apart. Water Aid supports a local radio station ‘Pilika Pilika’. The show is
used to spread messages about sanitation & water management.
River Processes & Pressures23

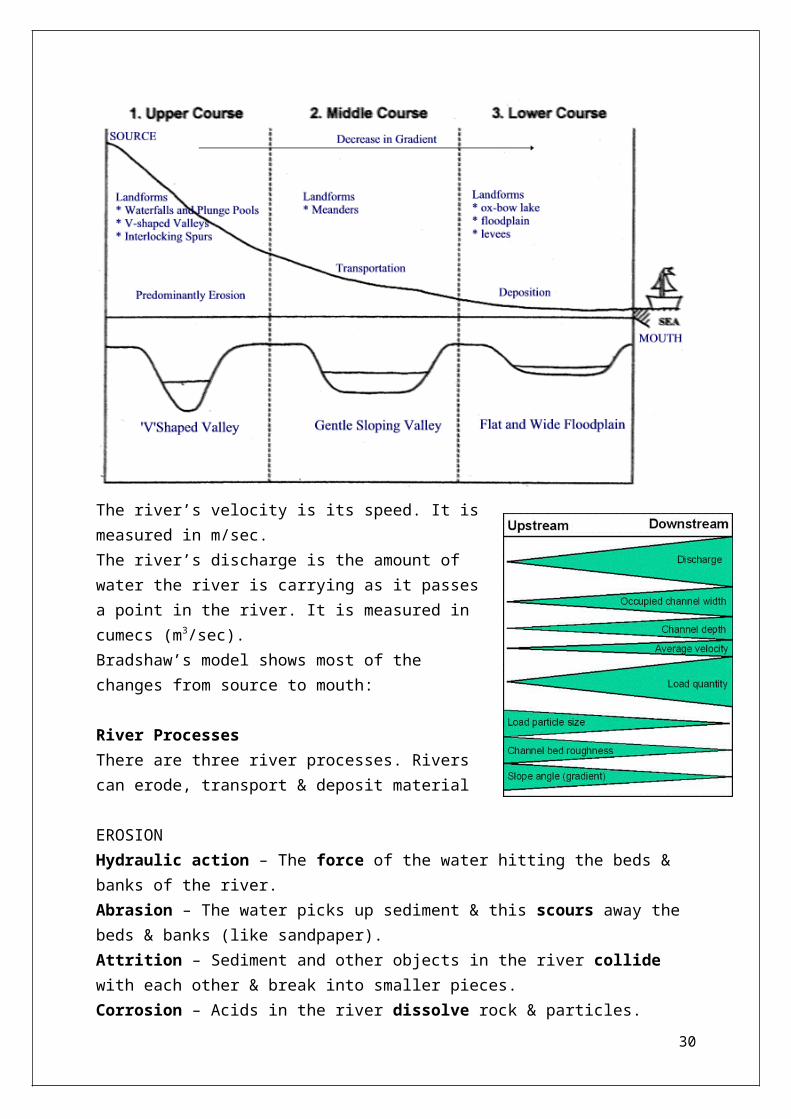
The river long profile shows the river gradient from the source to the mouth.The profile changes from being very steep at the top to almost flat at the bottom. The river’s course is split into three sections. The upper, middle and lower course. Each stage has distinct features.
The river’s velocity is its speed. It is measured in m/sec.The river’s discharge is the amount of water the river is carrying as it passes a point in the river. It is measured in cumecs (m3/sec). Bradshaw’s model shows most of the changes from source to mouth:
River ProcessesThere are three river processes. Rivers can erode, transport & deposit material
EROSIONHydraulic action – The force of the water hitting the beds & banks of the river.Abrasion – The water picks up sediment & this scours away the beds & banks (like sandpaper).
24

Attrition – Sediment and other objects in the river collide with each other & break into smaller pieces.Corrosion – Acids in the river dissolve rock & particles.
TRANSPORTATIONTraction – Heavy boulders are rolled along the river bed.Saltation – Heavy material is bounced along the river bed.Suspension – Particles are picked up and carried suspended in the water.Solution – Particles are dissolved and carried along in the water.
DEPOSITIONDeposition occurs when a river slows down. This can happen:
At the mouth Within a delta As the river floods On the inside of a meander
River Features
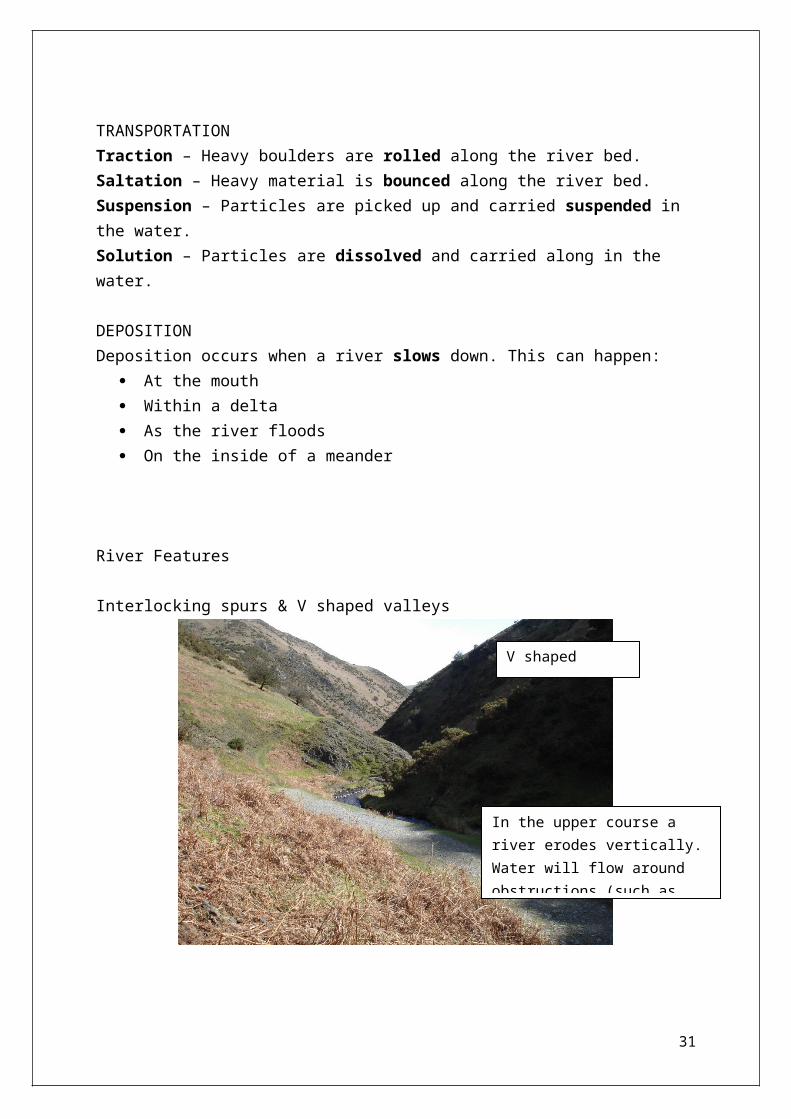
Interlocking spurs & V shaped valleys
25
In the upper course a river erodes vertically. Water will flow around obstructions (such as valley slopes). This creates interlocking spurs.
V shaped valley
Waterfalls
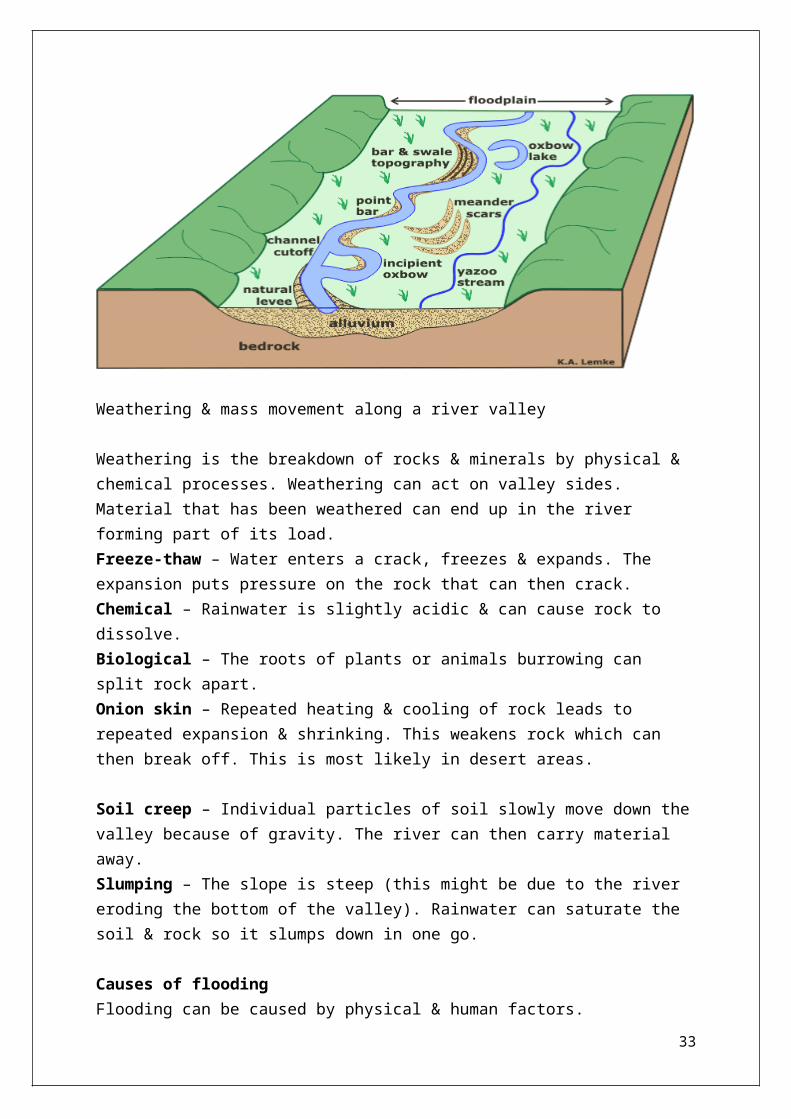
Meanders Over time meanders can develop into ox-bow lakes. The narrow neck of land separating meanders eventually breaks through & the old bend is abandoned, leaving a horseshoe shape.Floodplains & Levees
A floodplain is the wide flat area of land either side of a river in its lower course. Lateral (sideways) erosion makes the valley floor wide and flat. When the river floods it spreads out & deposits sediment it is carrying.
Levees are the natural embankments along the sides of a river. When the river floods it immediately loses velocity and deposits large pieces of sediment nearest the channel. Finer particles of sediment get carried further away from the channel. Repeated floods lead to the levees building up.
26
Waterfalls form when a river flows over bands of hard & soft rock.
Weaker rock is undercut via abrasion & hydraulic action.
The overhanging rock will eventually collapse as it is unsupported.
A large deep plunge pool is created at the base of the waterfall.
Over many years the falls move back as the process is repeated & a gorge forms.
Weathering & mass movement along a river valley
Weathering is the breakdown of rocks & minerals by physical & chemical processes. Weathering can act on valley sides. Material that has been weathered can end up in the river forming part of its load.Freeze-thaw – Water enters a crack, freezes & expands. The expansion puts pressure on the rock that can then crack.Chemical – Rainwater is slightly acidic & can cause rock to dissolve.Biological – The roots of plants or animals burrowing can split rock apart.Onion skin – Repeated heating & cooling of rock leads to repeated expansion & shrinking. This weakens rock which can then break off. This is most likely in desert areas.
Soil creep – Individual particles of soil slowly move down the valley because of gravity. The river can then carry material away.Slumping – The slope is steep (this might be due to the river eroding the bottom of the valley). Rainwater can saturate the soil & rock so it slumps down in one go.
Causes of floodingFlooding can be caused by physical & human factors.From the following list can you identify which are physical (natural) & which are human.
Urbanisation/Impermeable surfaces such as tarmac Intense rainfall Deforestation Snowmelt Impermeable rock (e.g. like granite)
27

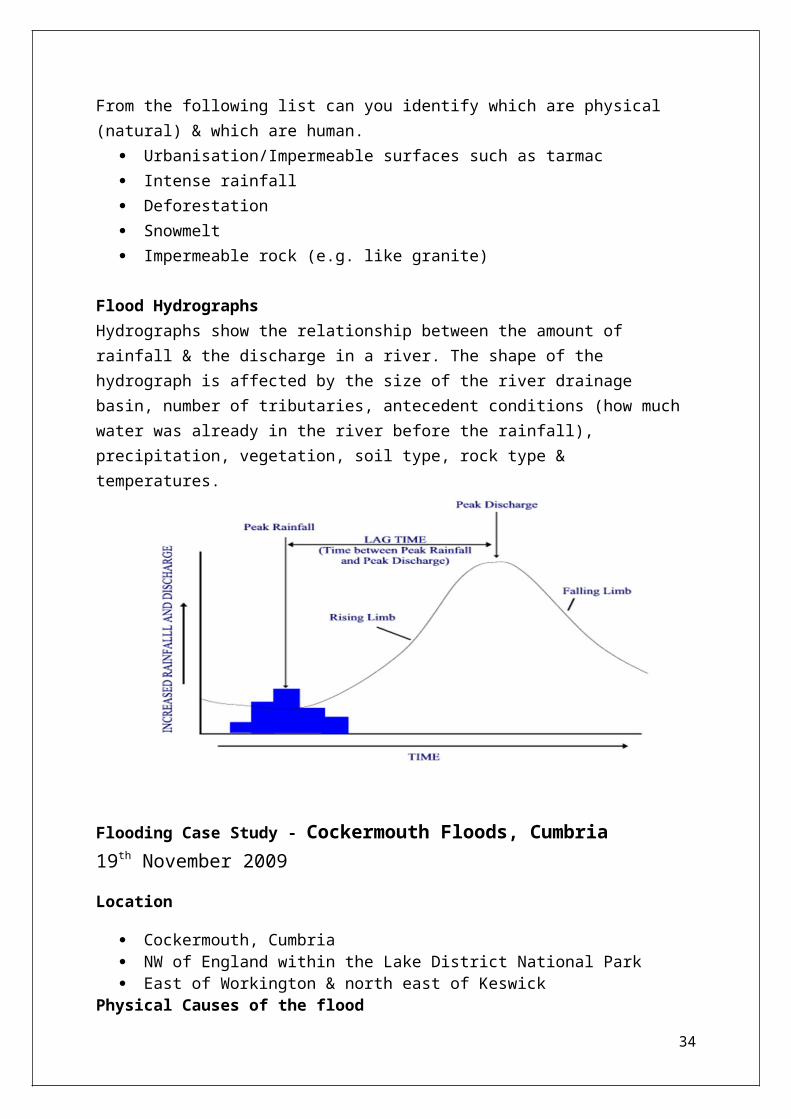
Flood HydrographsHydrographs show the relationship between the amount of rainfall & the discharge in a river. The shape of the hydrograph is affected by the size of the river drainage basin, number of tributaries, antecedent conditions (how much water was already in the river before the rainfall), precipitation, vegetation, soil type, rock type & temperatures.
Flooding Case Study - Cockermouth Floods, Cumbria19th November 2009
Location
Cockermouth, Cumbria NW of England within the Lake District National Park East of Workington & north east of Keswick
Physical Causes of the flood
Confluence of two rivers (R. Derwent & R. Cocker) which are fed by lakes in the Lake District
Prolonged rainfall / Antecedent conditions – Previous weeks rain led to soil saturation & downpours 15 inches of rain fell in the lake district over the previous three days
Intense rainfall - 314.4mm fell in the Lake district in 24hrs Unprecedented volume of rain - 36hrs of rain in Cockermouth (1
months worth of rain) Bassenthwaite Lake is upstream from Cockermouth & the R
Derwent. It’s levels rose & fed the river A weather front brought in warm moist air from the Azores & NW
coast of Africa The relief made the air rise & condense (relief rainfall)
28

Human Causes of the Flood
The majority of houses in the town were built on the floodplain or land adjacent to the river
Flood barriers were not effective Impermeable surfaces did not help as earlier downpours had led to
increased surface run off into the river channel
Effects of the flood
The main street through the town was submerged People were stranded in the upper floors of buildings (some for
24hrs) Extensive damage to property & possessions Businesses stock was ruined Main bridge over the R Derwent collapsed plus a further three
bridges Mountain rescue service & 3 RAF teams used sea king helicopters to
rescue people out of their homes – 50+ people were airlifted Rescue services were mounted using boats Overnight evacuation centres set up PC Bill Barker died while directing traffic away from a bridge that
collapsed Over 100 people stayed in overnight emergency accommodation 1000 homes were evacuated in the region Insurance claims are already at £75’000 (January 2010) & insurance
agents expect it to increase to over £100’000 People may be out of their homes for up to three months while the
plaster dries out
NB - The EAs flood forecasting centre correctly foresaw the flood & the area was put on red alert 24hrs in advance
Flood defences built in 1990s were improved in 2005 to protect a 1 in 100 year event
The EA put this flood as a 1 in 300- 1000 yr event
Flood management
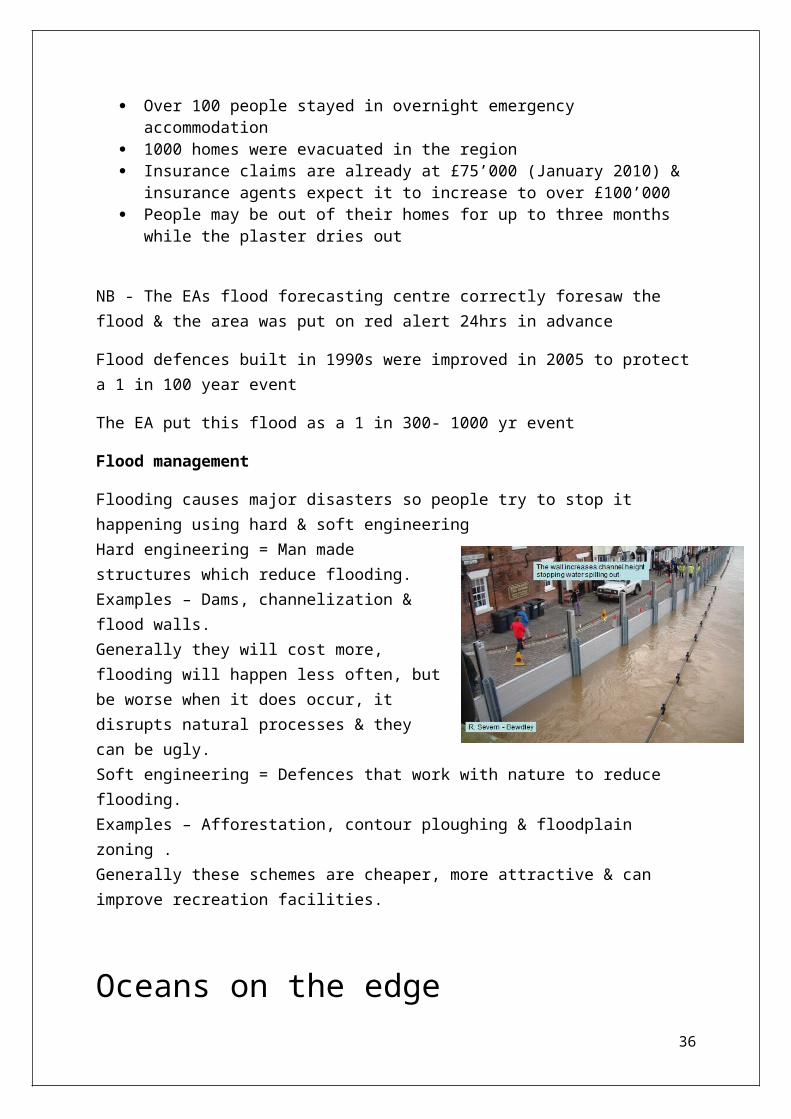
Flooding causes major disasters so people try to stop it happening using hard & soft engineeringHard engineering = Man made structures which reduce flooding.Examples – Dams, channelization & flood walls.
29
Generally they will cost more, flooding will happen less often, but be worse when it does occur, it disrupts natural processes & they can be ugly.Soft engineering = Defences that work with nature to reduce flooding.Examples – Afforestation, contour ploughing & floodplain zoning .Generally these schemes are cheaper, more attractive & can improve recreation facilities.
Oceans on the edgeThe oceans cover 2/3 of the planet & are home to a distinct marine ecosystem. Coral reef ecosystems have a high level of biodiversity (the variety of plant & animal species). Biodiversity is also high within river estuaries & even in deep underwater sites of volcanic activity.
Mangrove swampsMangroves are areas of swampy forests found in estuaries & along marine shorelines. Many are densely populated. Mangrove plants can tolerate high salinity (salt levels) & tidal flooding. Long roots anchor the trees. Roots trap mud providing a habitat for lobsters & prawn. Global demand for prawn has led to mangrove removal. This is due to prawn aquaculture. Previously prawns were fished in a sustainable way.
Issues Mangrove removal can lead to coastal
erosion & loss of nursery grounds for fish, crocodiles, snakes & birds.
Mangroves offer natural protection of coastal areas from high tides, tsunamis & cyclones. The removal of mangroves contributed to the losses in places such as Sri Lanka & Thailand after the 2004 tsunami.
CO2 stored in the mud beneath mangroves is released when trees are removed.
Prawn aquaculture can cause water pollution issues as antibiotics are put into prawn pools & can leak into the neighbouring ecosystem.
Unsustainable uses of marine ecosystemsMarine ecosystems are balanced e.g. The number of top carnivores in a food web (such as a shark) are low compared to the fish they feed on.
30
Nutrients within the ecosystem are cycled. The cycle can be easily disrupted by humans.
Food web disruptionOverfishing interferes with the natural balance (equilibrium).Hunting of specific fish may deprive another species of food within the food chain. This could cause permanent loss of species.Examples:1) Atlantic cod fishing. In North America overfishing in the 1970s in Newfoundland has meant the cod population has never recovered.2) Baiji white dolphin. These were hunted to extinction in the 20th century.
EutrophicationExcessive nutrients are put into the marine ecosystem. Most commonly this will be nitrates from fertilisers which get carried off fields via rainwater. The nitrates lead to excessive plant growth & results in algal blooms. Algae uses up oxygen in the water. Some species suffocate in this water e.g. The North Sea is a nitrate hotspot & lobster populations have declined.SiltationRun-off of rainwater from the land takes soil and washes it into estuaries & coastal waters. This is common in areas which have experienced deforestation. Underwater plant communities can be covered in silt & deprived of light for photosynthesis.
Climate change & the oceansThe world’s oceans have systems of colder & warmer currents.These flows can be disrupted by melting ice leaving seas cooler than before.This is not the only effect:Warmer water – Plankton become stressed & less productive in warmer water. This affects entire food chains.More acidic water – Water absorb some of the extra CO2 (it dissolves to form carbonic acid). This can kill coral & causes coral bleaching.Higher sea levels – Melting ice sheets cause sea level rise leaving some ecosystems (such as the UK’s salt marshes) permanently submerged.
Managing Ecosystems Sustainably
The Firth of Clyde
Pressures
31

Fishing – Fishing is an important source of income in the area, but over-fishing of some species like cod have caused a reduction in fish populations.
Tourism – Falling incomes from fishing have led to local businesses trying to make use of tourism opportunities to boost their incomes.
Sewage disposal – In the past sewage has been flushed straight into the sea damaging sea life. This is less of a problem now.
Military testing – The Royal Navy often test nuclear submarine’s in the area. An accident would devastate the ecosystem.
Lamlash Bay Lamlash bay is an area of the Clyde that has been severely affected
by over-fishing Scallops live on the seafloor & fishermen harvest them using heavy
machinery. The equipment scours the seabed & damages the Maerl (a pink
coloured cousin of coral) are damaged. They are an important habitat for other fish species.
An organisation called COAST was formed (Community of Arran Seabed Trust). The organisation started campaigning for a no take zone.
COAST aims to reverse maerl & fish decline, provide a sustainable livelihood & increase the popularity of the area as a tourist destination
The Future Many outsiders have moved into places bordering the Firth of Clyde
& want the waters kept clean. Local fishermen often see the no-fish zones as a backwards step. It may soon be designated as a coastal marine park (CMP) with the
aim of managing it in a sustainable way. If a CMP was established activities like fishing & drilling for oil would
be monitored closely. The Scottish Marine Bill is a new set of laws written to help manage
Scottish waters.
The Coral TriangleThe coral triangle is a 6million km2 area of the south Pacific that contains ¾ of coral species.120million people gain their food & income from this area.Coral reefs are made of living animals. Each piece contains a polyp whose external skeleton forms the reef. Coral reefs form natural barriers that
32
protect shorelines from erosion. They also attract many tourists. Estimates suggest 70% of the world’s coral reefs will be destroyed by 2050.Threats
Pollution from tourist boats Damage from agricultural run off Acidified sea water
Management plansSix governments (Indonesia, Malaysia, the Phillipines, Papua New Guinea, the Soloman Islands & Timor Leste) of the area are working together to discourage non-sustainable uses.In 2007 they formed a partnership to conserve the reefs. They planned:
Marine protection areas where reef populations were unharvested Sustainable fisheries & quotas Protection for endangered species Climate change adaptation plans
Practice Questions1) Name the features shown at (2)X Y 2) Describe one way a region affected by earthquakes can prepare for this hazard. (2)3) Using an example(s), describe the effects of earthquakes on people and property. (4)4) Explain the possible economic impacts of climate change on a named country (4) .
5) Describe the distribution of tropical rainforests in Brazil. (2) 6) Describe one way of conserving threatened environments. (2)
33
7) Suggest two benefits of large scale water management projects such as theTarbela Dam (2) .8) Describe one impact of water shortages on people (2).9) Using an example(s), explain why small scale solutions to managing water supplies are often sustainable (4).
10) Name the method of flood management shown in the Figure to the left. (1)11) Name and describe one process of river erosion. (2)12) Describe how the shape and characteristics of river channels change from source to mouth. (6)
13) Explain why krill are so important to the Marine ecosystem. (4)14) The krill population is declining rapidly.Suggest a reason for this sudden decline. (1)15) Using examples, explain how global actions are attempting to create sustainable marine ecosystems. (6)16) F – Using examples, describe some of the hazards of living on a destructive plate margin (4).17) H – Using an example, outline the impact of a major earthquake on people and property in the developing world (4).18) F – Describe two human activities which are increasing the amount of greenhouse gases in the atmosphere (4).19) H – Describe two challenges the UK might face in the future due to global warming (4).20) F – Describe some of the goods & services the biosphere provides for humans (4).
34

21) H – Describe two services the biosphere provides & explain why they are important (4).22) F – Describe how deforestation could affect water-cycle processes (3).23) H – Explain how human activity could change the amount of infiltration (3).24) F – Using a named example, describe the impacts of river flooding (6).25) H – Using an example, explain the factors that contributed to a flood event on a named river (8).26) H – Explain the impacts of flooding for a named flood event (8).27) F – Using examples, describe the threats facing marine ecosystems (6).28) H - Using named examples, explain the short & long-term threats facing marine ecosystems (6).29) H – Using named examples explain how global actions can help maintain ocean health (8).30) H - Using examples, explain how marine areas can be managed sustainably (8).
Remember to look back & use your workbook & practice papers completed in class.Check on anything you got wrong & ensure you can now answer it.
Good luckFrom the Geography department
35
Topic 1 Restless Earth Key Words
Convection currents –Circular movements in the mantle.
Asthenosphere – Upper part of the mantle
Radioactive decay - Decay of radioactive minerals in the mantle which provide heat driving the convection currents.
Lithosphere -The Earth’s crust and the uppermost solid part of the mantle.
Core – The centre of the earth.
Mantle – The layer of the earth above the core & below the crust.
Constructive boundary - Plates move apart & new land forms between them.
Conservative boundary - Plates slide past one another, causing friction
Collision boundary - Two continental plates move towards each other.
Destructive boundary -Two plates move together & oceanic plate material is destroyed
Topic 2 Climate & Change Key Words
Pleistocene – The last major cold period (ice age) which began 1.8million years ago and ended 10’000 years ago.
Holocene – The last 10’000 years which have been a warmer period in Earth’s history.
Milankovitch Cycles – Changes in the Earth’s orbit. The earth changes from a circular to elliptical orbit, overall we get less sunlight.
Sunspots – Uneven temperatures develop on the sun’s surface usually occurring in 11 year cycles.
Geological climate event – Changes in climate that take place over millions of years.
Magafauna – Large animals which were made extinct at the end of the last ice age.
Little Ice Age – A notably cooler phase in Europe from the 1600s to 1800s.
Enhanced greenhouse effect – The layer of additional greenhouse gases (produced from humans) which trap heat energy.
Greenhouse gases - Gases which prevent heat from escaping the atmosphere.
Kyoto Protocol - A binding agreement between UN countries to reduce greenhouse gas emissions.
Topic 3 Battle for the Biosphere Key Words
36

Biome – A region characterized by a similar climate, plant & animal species.
Biosphere - The regions of the surface and atmosphere of the Earth where living organisms exist
Biodiversity - The diversity (number and variety of species) of plant and animal life.
Biofuels - Any fuel that is obtained from a renewable biological resource, especially from biomass.
CITES – The Convention on International Trade in Endangered Species protects endangered species by imposing penalties on poachers..
Degradation – The lowering of the quality & diversity of rainforests by human activities.
SSSI – Site of Special Scientific Interest which are protected by government.
RAMSAR convention – A treaty signed by many countries to preserve wetlands.
Conservation - The preservation and careful management of the environment and of natural resources.
Deforestation - The removal of large areas of trees.
Topic 4 Water World Key Words
Aquifer – a store of water within the rock.
Groundwater – Water stored naturally within the ground.
Infiltration – The soaking of water into the soil from the surface.
Intermediate technology – Appropriate small scale solutions that locals within poorer countries can use to help themselves.
Throughflow – The transfer of water through the soil.
Impermeable – A surface which will not let water pass.
Permeable – A surface which will let water pass through it.
Water harvesting – Rain barrels which allow the collection of water.
Over abstraction – Over pumping of water from groundwater stores such as aquifers.
Hydrological cycle – The constant movement of water between land, sea & air.
Topic 6: River Processes Key Words
37

Erosion processes – wearing away the land surface by hydraulic action, abrasion, attrition and solution.
Flood plain – flat land built of silt on the sides of a river, usually in its lower course.
Flooding – water covering the land that is normally dry after a river bursts its banks.
Hard engineering strategies – strong construction methods to hold floodwater back or keep it out.
Levee – raised bank along the sides of a river, made of silt from river floods.
Long profile of a river – a summary of the shape and gradient of a river bed from source to mouth.
Meander – bend in a river, usually along its middle or lower course.
Ox-bow Lake – semi-circular lake on the flood plain of a river, a cut-off.
Soft engineering strategies – more natural ways to reduce the impact of flooding on humans, with less intervention and more preparation.
Transportation processes – movement of sediment by traction, saltation, suspension and solution.
Topic 7 Oceans Key Words
Aquaculture – Commercial farming of fish in ponds e.g. prawns in Vietnam.
Coral bleaching – The process whereby oceans absorb carbon dioxide to form carbonic acid. The acid can kill the polyp & the coral appear bleached, (their vibrant colour is lost).
Coral triangle – A 6 million km2 area in the South Pacific which contains ¾ of all known coral species
Eutrophication – Nitrogen in fertilisers gets carried by surface run off into water. Organisms flourish causing algal blooms. Oxygen is used up & fish species suffocate.
Mangrove swamp – Areas of swampy forest where the plants tolerate high salinity & daily flooding.
North Pacific Gyre – An ocean current whose flow creates giant pools of rubbish.
Overfishing – Excessive hunting of a species which can then lead to knock on effects along the food chain.
Siltation – Run off from the land puts soil into coastal water & sea plants become buried in silt. They may not be able to get light needed for photosynthesis.
38