essayzone.comessayzone.com/essay_store/1531_4f526be6da811.docx · web viewsince the separation...
TRANSCRIPT

Rodriguez
Evaluation Project
Maria Jose Rodriguez
Dr. Ed Morris
FIN 5201032 Financial Policy
October 14, 2011
1

Rodriguez
McDonalds
McDonalds is the largest chain of fast food specially hamburgers restaurants in the
world. Serving around 60 million of people a day with the headquarters in Oak Brook,
Illinois, United States founded in 1955 by Ryan Kroc after the small hamburger business
from Richard and Maurice McDonald.
Its primary sell is hamburgers, cheeseburgers, chicken nuggets, French fries,
different items for breakfast, soft drinks, shakes and desserts, expanding its menu year by
year according to the costumers needs and wants adding the past years salads, wraps,
smoothies and fruit.
The business began in 1940 with a restaurant in California, introducing the
“Speedee Service System” (Travel Through Time With Us). In 1961 the company replaced
the speedee service system for “Drive-In Restaurant Service” (Travel Through Time With
2

Rodriguez
Us), in the same year the M became officially McDonalds property but was officially in use
for the company in 1968.
McDonalds is principally known for serve the favorite food in the world by having
the most famous Fries, Big Mac, Quarter Pounder, Chicken McNuggets and the famous and
original Egg McMuffin every breakfast.
Number of Global Restaurants: More than 33,000
Number of Countries: 18
Employees in the world: 1.7 millions
CEO: Jim Skinner
3

Rodriguez
Begin Final Statements
Income Statement McDonalds
(Yahoo Finance)
4

Rodriguez
Balance Sheet McDonalds
(Yahoo Finance)
5

Rodriguez
Statement of Cash Flows McDonalds
(Yahoo Finance)
6

Rodriguez
Competitor
Yum Brands is the major and principle competitor in every category with
McDonalds. Yum Brands is the largest restaurant company in the world owning more than
38,000 restaurants in more than 110 countries. Yum Brands consist in three different
restaurants such as, KFC, Pizza Hut and Taco Bell.
Since the separation with PepsiCo 12 year ago Yum Brands has been building
leading brands not only in the United States but also in China, creating international
expansion and getting new brands depending on the country. Yum Brands know that people
and customers do not just judge the success of the companies; they create their own
success.
Chine being one of the major competitors country for every fast food restaurant
coming for the United States is not the exception for Yum Brands. They thank their
foresight PepsiCo for invested in the market for over 40 year and built what Yum Brands
can take over in the international market, facing only McDonalds as their only principal
global competitor.
Taco Bell represented the 60% of operating profit; they are the second most
profitable brand behind McDonalds coming strong year by year with its already known
¨Why Pay More¨.
Pizza Hut represents the 30% of the profit coming from behind in their transposing
and reorganization in the business, coming from the worst to one of the first in its category
value rating.
Lastly KFC represents only the 3% of the Yum Brand company profit. This brands
job has been working in the international positioning and improving its menu depending on
where the new stores are going to be.
7

Rodriguez
Income Statement Yum Brands
(Yahoo Finance)
8

Rodriguez
Balance Sheet Yum Brands
(Yahoo Finance)
9

Rodriguez
Statement of Cash Flows Yum Brands
(Yahoo Finance)
10

Rodriguez
Financial Ratios
All the ratios are a very important tool for a company at the time of making a
decision specially when investing something. Many of the new people investing in the
different markets rather make their decisions through destiny and luck instead of spending
time and worrying too much about the ratios. Ratios are not that that hard to approach in the
right way, however this ones can help the companies make decisions with more sense than
just luck.
Liquidity
Yum 2008 2009 2010
Current Ratio 0.94 1.39 1.14 1.49
Quick Ratio 0.87 1.18 0.96 1.22
Liquidity Ratios are basically used to know how quickly a company´s asset can be
transformed into cash. Investors normally use these ratios to know the capability of a
company to raise the cash and purchase extra assets.
The Current Ratio is used extensively to check the liquidity of a company obtained
between the current assets and the current liabilities of the company. A high current ratio is
not always or necessarily good, and a low current ratio is not bad either. The idea is that the
company´s current assets can cover its current liabilities. McDonalds came up with a 1.49
Current Ratio and Yum Brands with a 0.94.
The quick ratio is also part of the liquidity but this one measure the ability of a
company to pay the short-term responsibilities with a big amount of liquid assets and this
comes to the conclusion that the higher the quick ratio the better the position of the
11

Rodriguez
company in the market. According to the ratios solved for both companies McDonalds in
2010 had a quick ratio of 1.22 and its principle competitor Yum Brands had a 0.87 in 2010,
according to this both companies are located in a good position but for the quick ratio
having similar result.
Asset Management
Yum 2008 2009 2010
Inventory Turnover 60.02 210.96 214.17 219.06
DSO 10.20 14.45 17.02 17.88
Fixed assets Turnover 1.89 0.94 0.85 0.87
Total Assets Turnover 1.4 0.83 0.75 0.75
Asset Management Ratios try to measure the company’s success in managing the
assets and generate sales. Whit these ratios the success of the firm and the inventory
management can be determined. Normally with a higher Inventory Turnover Ratio
indicated the better performance of the company showing that the inventory is quickly
being sold, but if this ratio is too high is telling the company that they are loosing sales with
the competitors because of the deficiencies in the inventory. McDonalds inventory turnover
for 2010 was 219.06 compared with Yum´s for 2010 that was 60.02 indicates that the
management of McDonalds and its inventory is much better than Yum´s, this means that
the company´s inventory is growing solid faster than its competitor.
The Days Sales Outstanding indicates on average the number of days that a
company takes to collect all of its receivables after being created. McDonalds waited
approximately 18 days to get the cash back from a company after making the sale while
12

Rodriguez
Yum Brands only wait approximately 10 days to receive the payment. However the DSO
tells us that if a competitor in the same industry in this case Yum Brands is collecting the
cash in less days then the potential for improvement in McDonalds company is more and it
will be often present until the day this number of days change.
The fixed assets turnover measures principally how god or bad the company is
managing its fix assets and this way start generating more sales. And the Total Assets
Turnover measures how efficiently the firm is generating its assets and this way generates
as well as the fix assets turnover more sales. The ratios of McDonalds and Yum in this case
are considerably similar because both companies are using the assets and fix assets at the
same percentage. However McDonalds should take in consideration that both of the ratios
are not going up how they should from 2008 to 2010 because this could put in a high risk
the efficiency in the assets of the company.
Debt Management
Yum 2008 2009 2010
Debt Ratio 0.81 0.53 0.54 0.46
Times Interest Earned 6.3 12.78 14.71 16.53
The debt ratio compares one company total debt and the total of its assets, it give us
a percentage of the funds provided by the liabilities and the long term debt, a lower
percentage than “1” indicate that the company is less dependent on control borrowed from
others, their level of assets compared to the level of debt is more, and higher level than 1
tell us that the company owns more money and is bad for its efficiency. According to
McDonalds and Yum Brands debt ratio both companies are situated in a great position with
13

Rodriguez
similar ratios being 0.46 and 0.81 respectively, which shows us that neither company owns
money or have any risk in this part of loosing its efficiency. The TIE ratio analyzes better
results than the ones given by the debt ratio. McDonalds TIE for the year of 2010 was
16.53% while Yum Brands ratio for the same year was 6.3%, this means that Yum’s level
of managing its interest charged are in a lower safety level than McDonalds and so on
having a higher level will not face problems when borrowing extra funds.
Profitability
Yum 2008 2009 2010
Gross Profit Margin 25.4% 37% 39% 40%
Net Profit Margin 10.21% 18% 20% 21%
Operating Profit Margin 14.05% 28% 31% 31%
ROA 13.92% 14.94% 15% 15.75%
ROE 75.4% 32% 32% 34%
14

Rodriguez
Profitability Ratios are a key piece of information with a very high percentage of
importance at the time of investing in any kind of company. The high revenue does not
transform itself into dividends until the time when the company is capable to pay off all of
the expenses and cost that it have.
Two of the main indicators of efficiency in a financial statement are the Return on
Equity (ROE) and the Return on Assets (ROA), the return on equity shows us the profit that
a company is getting from the owners of it obtained by the calculation between assets and
equity. This is a ratio works perfect to get a better understanding on how is the company
performing compared to its principle competitors. The ROA give results on how effective
the company is in what profitability and company´s assets availability, also let us know
where are the profits coming from and is calculated between the earnings and the total
assets. The main job for this profitability ratios are that they help people know if the
company will be profit and how this profit is going to be related with the industry.
If a company ends up with a really low profit margin, this means the company will
end up in a bad position In the market, but if the company has a really high profit margin
the companies advances will not last longer either, the key is to have a good profit margin
enough to last long and to end up in a good position in the market.
When it comes to the ROE and the ROA of the two companies being evaluated in
the project the results find are that Yum Brands are being more effectively to the ROE with
a 73.5% compared to the 34% of McDonalds, this means that Yum Brands management are
doing a better usage of the investors money, growing the company´s value at a really high
rate compared to the acceptable rate from McDonalds. The ROA gives the company the
amount of profit the company will earn for every dollar that is in its assets, including all the
15

Rodriguez
cash saving in the banks, accounts receivables, equipment property and furniture.
Professionals in the management of the money consider that companies with a ROA of less
than 5% are not profitable in a way they should, and looking at the numbers of Yum Brands
they have 13.92% and McDonalds 15.75% being both of the companies lower than the
ROE and demonstrating that they do not carry a lot of debt and at the same time are giving
investors the right impression about its fortune.
16

Rodriguez
Cash Conversion Cycle
Yum 2008 2009 2010
Inventory Conversion Period 2 2 2 2
Average Collection Period 10 14 17 18
Payables deferral Period (7) (10) (10) (14)
Cash Conversion Cycle 5 6 9 6
The Cash Conversion Cycle occurs when a company purchase or produce inventory, then
hold it for a period of time and finally sell it to get the cash, all of this in order to increase
its customer sales. The calculation of this includes 3 different period, the inventory
Conversion Period (ICP), Average Collection period (ACP), and last the Payables Deferral
Period (PDP), adding the first two and then subtracting the last one helps us find the
number of days for when the cash conversion cycle is going to occur. If the CC is short,
increase the risk for the company but at the same time it bring benefits to the company
because the collection of the money is before the expected, increasing the pre-tax operating
profit margin, creating better annual stock returns and will give the company better
emphasis on working capital management. According to the companies studied McDonalds
has a 6 days CCC during the years, this one went up in 2009 but then came down again in
2010. Compared to Yum Brands which its CC is 5 days being pretty close and similar in
every point of the results for this calculation which makes no big difference when knowing
which company makes the costumers happier than the other.
17

Rodriguez
Du Pont Analysis
ROA
Yum 2008 2009 2010
Profit Margin 10.21 18 20 21
X
Total Assets Turnover 1.4 0.83 0.75 0.75
ROA 13.92 14.94 15 15.75
Equity Multiplier
Yum 2008 2009 2010
Total Assets 8316000 28461500 30224900 31975200
/
Common Equity 1576000 13382600 14033900 14634200
Equity Multiplier 5.28 2.13 2.15 2.18
ROE = (PROFIT MARGIN) (TOTAL ASSETS T/O) (EQUITY MULTIPLIER)
Yum 2008 2009 2010
Profit Margin 10.21 18 20 21
Total Assets Turnover 1.4 0.83 0.75 0.75
Equity Multiplier 5.28 2.13 2.15 2.18
ROE 75.47 31.82 32.25 34.34
18

Rodriguez
Projection
After all the research done for McDonalds, its financial performance, the
competitors, the ratios, balance sheet, income statement and cash flow the
conclusions and suggestion in the projection for the year of 2011 will be.
McDonalds is been for a long time one of the most important companies of Wall
Street, for 30 consecutive quarters the company showed an increase of 6% even with
the 2008 recession. The industry of fast food is been successful for almost everyone,
making changes in its menus, offering new products attracting all kind of costumers
instead of focusing in just one kind.
The expectation for McDonalds Company is that will grow up about $1.15 per
share, about 12% from last year. For the last three years their stocks has been risen
close to 40% and this next upcoming year is not going to be the exception.
When it comes to food prices the projection is going to be around 2% to 3%
taking in consideration the Department of Agriculture comments. This will help the
company keep up with the increment on the prices for beef and ingredients use to
make its products. McDonalds needs to take in consideration all of its competitors
because if the others companies are not going to rise the prices in their products, this
could be risky and probably affect the company´s profit and would make it difficult for
future expansions. The projection for the earning growth is around 10% a little less of
what the projected was for the year before.
The net income has shown an increase during the years from 2008 through
2010, and according to the statements from the first quarters of 2011 the profit is
19

Rodriguez
been going up and the projection is that is going to continue the positive movement on
approximately 16%.
Total revenues compared through the years between 2008 and 2009 had a
decrease but went back up in 2010 and according to the quarter of 2011 the
projection as well is going to positive and keep increasing by the end of 2011 with an
increment of 12%
McDonalds is and it will keep being the top fast food restaurant not only in the
United States but in the world too, the sales according to the first two quarters already
release show an increment of 15% in its gross profit.
20

Rodriguez
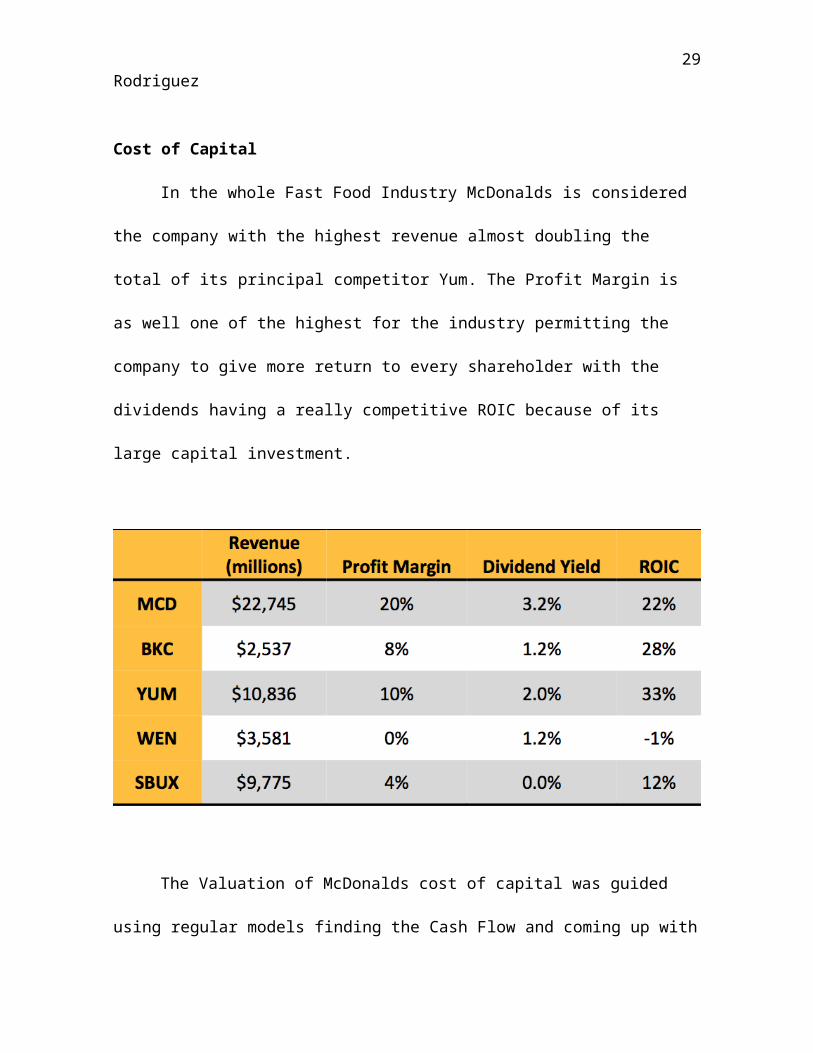
Cost of Capital
In the whole Fast Food Industry McDonalds is considered the company with
the highest revenue almost doubling the total of its principal competitor Yum. The
Profit Margin is as well one of the highest for the industry permitting the company to
give more return to every shareholder with the dividends having a really competitive
ROIC because of its large capital investment.
The Valuation of McDonalds cost of capital was guided using regular models
finding the Cash Flow and coming up with a number of $87.73 per share as the intrinsic
value per share.
21

Rodriguez
NOPAT and Free Cash Flow
Over the years McDonalds has been generating a positive and big Free Cash Flow,
this has been growing annually at a rate of 4.25% and its NOPAT as well but historically
growing at an average rate of 11.33%.
22

Rodriguez
Economic and Market Value Added
The Economic Value Added was $3.24 by 2009 and was projected to decrease and
so it did in 2010 to $2.80, and it will be continue the decreasing due to the conservatism at
the time of adding money from the MacDonald Company. While the Market Value Added
went completely different and went up from $76.84 billions in 2009 to $79.16 billions for
2010 and is projected to continue this growing at a rate for 2011 of 2.8%
23

Rodriguez
After-Tax Cost of Debt, Cost of Preferred Stock and Cost of Equity
24

Rodriguez
After-Tax Cost of Debt: 5.2 %
Cost of Preferred Stock: 23.8 / 10.4 = 2.29 %
Cost of Equity (CAPM): 4.5 + (5)*1.17 = 10.4 %
WACC: 9 %
25

Rodriguez
ROIC
In 2009 MacDonald generated its highest return on capital with a 21.8%, and by the
year went through for 2010 this one went down just the percentage that was projected at the
end of 2009 and created an average of 19.4%
WACC
It was calculate above and MacDonald came up with a WACC of 9%, calculate
through the risk free rate, beta and market risk premium.
26

Rodriguez
Current Stock Price: $89.40
Daily Range $89.14 - $89.98
52 Week Range $72.14 - $91.22
Dividend Trends $2.80 (3.1%)
27

Rodriguez
P/E Ratio 18.08
Beta 0.45
3 Years Beta 0.36
Market Capitalization 92,145.74 Millions
(Price*shares outstanding)
Shares Outstanding 1,031.75 Millions
Due to McDonalds strong dividend, its constant balance sheet, and its consistent
capability to increase the shareholder value, The Company is rated as an appealing buy and
hold stock for the investment fund.
28
Rodriguez
The Long Run Growth
In the figure at the end of this, McDonalds validates expands the frame of 20 years
to the current forecast. 20 years ago the company started with a really low beginning and
according to the great and faster growth end up creating more dividends income and high
total return for all of the shareholders.
29

Rodriguez
In the Long Run, the shareholders return is a big key for the income statement for
the company to generate earnings. Capital Appreciation as well as the Dividend Income
will be determined by the earnings. Companies tend to be extremely consistent with the
payout ratios and McDonalds is not staying behind of all of this using the general rule that
consists on slowing the growing to try to create a higher payout ratio and grow faster.
McDonalds sales momentum continues as the company is focusing more and more
in the menu with the right products offering, renovating all the restaurants giving the
customers new experiences every day, upgrading the customer service offered.
The demand that McDonalds is been creating keeps growing, showing the success
of every worker effort, and give the customers the amazing experience every customer is
waiting for in the stores around the world.
30

Rodriguez
The estimate stock Price according to all the calculation and to the projections made
through the Project is that the EPS is going to grow between 8% and 10% for the next five
years.
31

Rodriguez
Worked Cited
"McDonald's History." About McDonald's. McDonalds. Web. 16 Sept. 2011.
<http://www.aboutmcdonalds.com/mcd/our_company/mcd_history.html?
DCSext.destination=http://www.aboutmcdonalds.com/mcd/our_company/
mcd_history.html>.
"Ford Motor Company Financial Information." Free Stock Prices, Quotes, Stock Charts,
Market News and Streaming Real-time Stock Quotes. Web. 16 Sept. 2011.
<http://www.advfn.com/p.php?pid=financials>.
"McDonald´s Corporation (MCD)." Yahoo. Yahoo. Web. 16 Sep. 2011.
<http://finance.yahoo.com/q/is?s=MCD+Income+Statement&annual>.
"2010 Annual Report." Www.McDonalds.com. McDonalds. Web. 16 Sep. 2011.
<http://www.aboutmcdonalds.com/etc/medialib/aboutMcDonalds/investor_relations
3.Par.56096.File.dat/2010%20Annual%20Report%20(print). pdf>.
"Annual Report 2009." Www.McDonalds.com. McDonalds. Web. 16 Sep. 2011.
<http://www.aboutmcdonalds.com/etc/medialib/aboutMcDonalds/investor_relations
0.Par.6540.File.dat/McD_2009_AR_Final_032910.pdf>.
"2008 Annual Report McDonalds Corporation." Www.McDonalds.com. McDonalds. Web.
16 Sep. 2011.
<http://www.annualreports.com/HostedData/AnnualReports/PDFArchive/
mcd2008.pdf>.
"LexisNexis® Academic & Library Solutions." Business Solutions & Software for Legal,
Education and Government | LexisNexis. Web. 16 Sept. 2011.
<http://www.lexisnexis.com/hottopics/lnacademic/?>.
32

Rodriguez
"Yum! Brands (YUM) Stock Research, Equity Ratings, News & Analysis - WikiWealth."
Stock, ETF and Mutual Fund Ratings | Commodity, Currency Research -
WikiWealth. Web. 14 Oct. 2011. <http://www.wikiwealth.com/research:yum>.
"Yum! Brands, Inc.: NYSE:YUM Quotes & News - Google Finance." Google. Google.
Web. 14 Oct. 2011. <http://www.google.com/finance?q=NYSE:YUM>.
"YUM: Summary for Yum! Brands, Inc.- Yahoo! Finance." Yahoo! Finance - Business
Finance, Stock Market, Quotes, News. Yahoo! Finance. Web. 14 Oct. 2011.
<http://finance.yahoo.com/q?s=YUM>.
"YUM! BRANDS INC (YUM:New York): Financial Ratios - BusinessWeek." Investing &
Stock Research by Company and Industry - BusinessWeek. Business Week. Web. 14
Oct. 2011.
<http://investing.businessweek.com/research/stocks/financials/ratios.asp?
ticker=YUM:US>.
33