wea micro market report - june 2016
DESCRIPTION
Micro Market Report Los Angeles & Miami Issue #16 07/15/16 for 06/15/16 statisticsTRANSCRIPT

1
Micro Market reportLos angeLes & MiaMi
issue #16 07/15/16 for 06/15/16 statistics

2
Table of ConTenTs
zip Code 90210 - Beverly Hills
zip Code 90211 - Beverly Hills
zip Code 90069 - sunset strip
zip Code 90077 - Bel Air
zip Code 90046 - West HollyWood
zip Code 90265 - mAliBu
zip Code 90272 - pACifiC pAlisAdes
zip Code 90024 - WestWood
zip Code 90049 - BrentWood
zip Code 90025 - West lA
zip Code 90402 - sAntA moniCA
zip Code 90005 - HAnCoCk pArk
zip Code 90027 - los feliz
zip Code 90064 - CHeviot Hills
zip Code 90291 - veniCe
zip Code 90292 - mArinA del rey
miAmi mArket overvieW
All zip Codes yeAr to dAte sAles
WeA messAge
ABout WeA
data provided by first American title Co. of los Angeles County records and by sef mls of miami-dade County records for sales exceeding $1 million.
3
4
5
6
7
8
9
10
11
12
13
14
15
16
17
18
19
20
22
23

3© Westside estate Agency
date sales Δ vs previous year Avg. price Δ vs previous year
Jun 2016 25 -7% $7,480,340 +7%
Jun 2015 27 +125% $7,018,352 +31%
Jun 2014 12 0% $5,359,833 +6%
Jun 2010 12 +50% $5,044,841 +14%
Jun 2007 8 baseline $4,427,068 baseline
ytd 2016 141 +4% $5,858,851 -14%
avg. PriCe Per TransaCTion
number of sales
number of sales
number of sales
June 2016
June 2007
H H H H H H H H H H H H H H H H H H H H H H H H H avg. PriCe Per TransaCTion
7,480,340$
H H H H H H H H
avg. PriCe Per TransaCTion
4,427,068$
+213% sales
June 2016 vs 2007
+69% PriCe
Pr
ice
in
mil
lio
ns
90210
2007 2010 2014 2015 2016Jun
Jun 2007 2010 2014 2015 2016
0
1
2
3
4
5
6
7
8

4© Westside estate Agency
avg. PriCe Per TransaCTion
number of sales
number of sales
number of sales
June 2016
June 2007
avg. PriCe Per TransaCTion
June 2016 vs 2007
Pr
ice
in
mil
lio
ns
90211
avg. PriCe Per TransaCTion
not Avail.
+/-0% sales +/-0% PriCe
Jun
Jun
date sales Δ vs previous year Avg. price Δ vs previous year
Jun 2016 3 -40% $2,616,667 +13%
Jun 2015 5 +150% $2,321,600 +74%
Jun 2014 2 -50% $1,337,500 -12%
Jun 2010 4 n/A $1,516,750 n/A
Jun 2007 0 baseline n/A baseline
ytd 2016 13 -24% $2,202,346 -4%
2007 2010 2014 2015 2016
2007 2010 2014 2015 2016
$2,616,667
H H H
0.0
0.5
1.0
1.5
2.0
2.5
3.0

5© Westside estate Agency
avg. PriCe Per TransaCTion
number of sales
number of sales
number of sales
June 2016
June 2007
H H H H H H H H H
avg. PriCe Per TransaCTion
4,022,278$
avg. PriCe Per TransaCTion
2,410,000
+350% sales
June 2016 vs 2007
+67% PriCe
Pr
ice
in
mil
lio
ns
90069
Jun
Jun
date sales Δ vs previous year Avg. price Δ vs previous year
Jun 2016 9 -31% $4,022,278 -25%
Jun 2015 13 0% $5,373,462 48%
Jun 2014 13 225% $3,628,692 164%
Jun 2010 4 100% $1,376,000 -43%
Jun 2007 2 baseline $2,410,000 baseline
ytd 2016 78 +5% $4,071,990 +3%
$
H H
2007 2010 2014 2015 2016
2007 2010 2014 2015 2016
0
1
2
3
4
5
6

6© Westside estate Agency
avg. PriCe Per TransaCTion
number of sales
number of sales
number of sales
June 2016
June 2007
H H H H H H H H H
avg. PriCe Per TransaCTion
7,038,278$
H H H H H
avg. PriCe Per TransaCTion
8,571,620
+80% sales
June 2016 vs 2007
-18% PriCe
Pr
ice
in
mil
lio
ns
90077
Jun
Jun
date sales Δ vs previous year Avg. price Δ vs previous year
Jun 2016 9 -47% $7,038,278 -24%
Jun 2015 17 +113% $9,203,382 -24%
Jun 2014 8 +60% $12,155,000 +782%
Jun 2010 5 0% $1,378,800 -84%
Jun 2007 5 baseline $8,571,620 baseline
ytd 2016 56 -8% $5,393,366 -28%
2007 2010 2014 2015 2016
2007 2010 2014 2015 2016
$
0
3
6
9
12
15

7© Westside estate Agency
avg. PriCe Per TransaCTion
number of sales
number of sales
number of sales
June 2016
June 2007
H H H H H H H H H H H H H H H H H H H
avg. PriCe Per TransaCTion
1,623,947$
H H H H H H H H
avg. PriCe Per TransaCTion
1,812,500$
+138% sales
June 2016 vs 2007
-10% PriCe
Pr
ice
in
mil
lio
ns
90046
Jun
Jun
date sales Δ vs previous year Avg. price Δ vs previous year
Jun 2016 19 -51% $1,623,947 0%
Jun 2015 39 +105% $1,620,555 -11%
Jun 2014 19 +58% $1,810,947 +62%
Jun 2010 12 +50% $1,119,417 -38%
Jun 2007 8 baseline $1,812,500 baseline
ytd 2016 148 +4% $1,747,188 -6%
2007 2010 2014 2015 2016
2007 2010 2014 2015 2016
0.0
0.5
1.0
1.5
2.0

8© Westside estate Agency
avg. PriCe Per TransaCTion
number of sales
number of sales
number of sales
June 2016
June 2007
H H H H H H H H H H H H H H H H H
avg. PriCe Per TransaCTion
4,066,471$
avg. PriCe Per TransaCTion
5,755,583
+183% sales
June 2016 vs 2007
-29% PriCe
Pr
ice
in
mil
lio
ns
90265
Jun
Jun
$
H H H H H H
date sales Δ vs previous year Avg. price Δ vs previous year
Jun 2016 17 -15% $4,066,471 -22%
Jun 2015 20 +33% $5,205,100 +120%
Jun 2014 15 +50% $2,364,833 -41%
Jun 2010 10 +67% $4,038,700 -30%
Jun 2007 6 baseline $5,755,583 baseline
ytd 2016 114 6% $4,573,188 -11%
2007 2010 2014 2015 2016
2007 2010 2014 2015 2016
0
1
2
3
4
5
6

9© Westside estate Agency
avg. PriCe Per TransaCTion
number of sales
number of sales
number of sales
June 2016
June 2007
H H H H H H H H H H H H H H H H H H H H H H H HH H H H H H H H
avg. PriCe Per TransaCTion
3,240,494$
H H H H H H H H H H H H H
avg. PriCe Per TransaCTion
3,651,731$
+146% sales
June 2016 vs 2007
-11% PriCe
Pr
ice
in
mil
lio
ns
90272
Jun
Jun
date sales Δ vs previous year Avg. price Δ vs previous year
Jun 2016 32 +10% $3,240,494 +6%
Jun 2015 29 +26% $3,048,879 +7%
Jun 2014 23 +77% $2,841,087 +74%
Jun 2010 13 0% $1,632,846 -55%
Jun 2007 13 baseline $3,651,731 baseline
ytd 2016 136 +2% $3,312,160 -8%
2007 2010 2014 2015 2016
2007 2010 2014 2015 2016
0.0
0.5
1.0
1.5
2.0
2.5
3.0
3.5
4.0

10© Westside estate Agency
avg. PriCe Per TransaCTion
number of sales
number of sales
number of sales
June 2016
June 2007
H H H H H H H H H H H H
avg. PriCe Per TransaCTion
3,955,974$
avg. PriCe Per TransaCTion
2,474,333
+300% sales
June 2016 vs 2007
+60% PriCe
Pr
ice
in
mil
lio
ns
90024
Jun
Jun
H H H
$
date sales Δ vs previous year Avg. price Δ vs previous year
Jun 2016 12 +300% $3,955,974 +43%
Jun 2015 3 -25% $2,768,333 +77%
Jun 2014 4 0% $1,562,250 -12%
Jun 2010 4 33% $1,766,000 -29%
Jun 2007 3 baseline $2,474,333 baseline
ytd 2016 53 +83% $3,200,589 +13%
2007 2010 2014 2015 2016
2007 2010 2014 2015 2016
0.0
0.5
1.0
1.5
2.0
2.5
3.0
3.5
4.0

11© Westside estate Agency
avg. PriCe Per TransaCTion
number of sales
number of sales
number of sales
June 2016
June 2007
H H H H H H H H H H H HH H H H H H H H H H
avg. PriCe Per TransaCTion
3,740,364$
avg. PriCe Per TransaCTion
3,626,000
+144% sales
June 2016 vs 2007
+3% PriCe
Pr
ice
in
mil
lio
ns
90049
Jun
Jun
date sales Δ vs previous year Avg. price Δ vs previous year
Jun 2016 22 -15% $3,740,364 +6%
Jun 2015 26 -13% $3,544,254 +4%
Jun 2014 30 +67% $3,414,683 +58%
Jun 2010 18 +100% $2,165,833 -40%
Jun 2007 9 baseline $3,626,000 baseline
ytd 2016 135 +3% $3,513,592 -9%
2007 2010 2014 2015 2016
2007 2010 2014 2015 2016
H H H H H H H H H H
$
0.0
0.5
1.0
1.5
2.0
2.5
3.0
3.5
4.0

12© Westside estate Agency
avg. PriCe Per TransaCTion
number of sales
number of sales
number of sales
June 2016
June 2007
H H
avg. PriCe Per TransaCTion
1,124,500$
avg. PriCe Per TransaCTion
1,432,500
+200% sales
June 2016 vs 2007
+27% PriCe
Pr
ice
in
mil
lio
ns
90025
Jun
Jun
date sales Δ vs previous year Avg. price Δ vs previous year
Jun 2016 6 +50% $1,432,500 -30%
Jun 2015 4 100% $2,057,875 +61%
Jun 2014 2 -67% $1,275,000 +23%
Jun 2010 6 +200% $1,040,667 -7%
Jun 2007 2 baseline $1,124,500 baseline
ytd 2016 41 +32% $1,405,500 +2%
2007 2010 2014 2015 2016
2007 2010 2014 2015 2016
H H H H H H
$
0.0
0.5
1.0
1.5
2.0
2.5

13© Westside estate Agency
avg. PriCe Per TransaCTion
number of sales
number of sales
number of sales
June 2016
June 2007
H H H H H H H H
avg. PriCe Per TransaCTion
5,068,750$
avg. PriCe Per TransaCTion
2,657,143
+14% sales
June 2016 vs 2007
+91% PriCe
Pr
ice
in
mil
lio
ns
90402
Jun
Jun
H H H H H H H
date sales Δ vs previous year Avg. price Δ vs previous year
Jun 2016 8 +60% $5,068,750 +69%
Jun 2015 5 -17% $2,991,500 -24%
Jun 2014 6 -14% $3,916,333 +52%
Jun 2010 7 0% $2,576,071 -3%
Jun 2007 7 baseline $2,657,143 baseline
ytd 2016 53 +43% $4,548,698 +13%
2007 2010 2014 2015 2016
2007 2010 2014 2015 2016
$
0
1
2
3
4
5
6

14© Westside estate Agency
avg. PriCe Per TransaCTion
number of sales
number of sales
June 2016
June 2007
H H H
avg. PriCe Per TransaCTion
1,156,667$
June 2016 vs 2007
Pr
ice
in
mil
lio
ns
90005
number of sales
avg. PriCe Per TransaCTion
+/-0% sales +/-0% PriCe
Jun
Jun
not Avail.
date sales Δ vs previous year Avg. price Δ vs previous year
Jun 2016 3 +50% $1,156,667 -72%
Jun 2015 2 -33% $4,150,000 +277%
Jun 2014 3 n/A $1,101,333 n/A
Jun 2010 0 n/A n/A n/A
Jun 2007 0 baseline n/A baseline
ytd 2016 19 -5% $1,708,220 -23%
2007 2010 2014 2015 2016
2007 2010 2014 2015 2016
0
1
2
3
4
5

15© Westside estate Agency
avg. PriCe Per TransaCTion
number of sales
number of sales
number of sales
June 2016
June 2007
H H H H H H H H H H H H
avg. PriCe Per TransaCTion
1,432,625$
H H H H
avg. PriCe Per TransaCTion
1,227,159$
+200% sales
June 2016 vs 2007
+17% PriCe
Pr
ice
in
mil
lio
ns
90027
Jun
Jun
date sales Δ vs previous year Avg. price Δ vs previous year
Jun 2016 12 -14% $1,432,625 -29%
Jun 2015 14 -22% $2,018,821 +27%
Jun 2014 18 +500% $1,593,917 +46%
Jun 2010 3 -25% $1,089,333 -11%
Jun 2007 4 baseline $1,227,159 baseline
ytd 2016 86 +19% $1,634,715 +5%
2007 2010 2014 2015 2016
2007 2010 2014 2015 2016
0.0
0.5
1.0
1.5
2.0
2.5

16© Westside estate Agency
avg. PriCe Per TransaCTion
number of sales
number of sales
number of sales
June 2016
June 2007
H H H H H H H H H H H H H H H H H H H H H H H H H
avg. PriCe Per TransaCTion
1,477,772$
H H H H H H H
avg. PriCe Per TransaCTion
1,521,714$
+229% sales
June 2016 vs 2007
-3% PriCe
Pr
ice
in
mil
lio
ns
90064
Jun
Jun
date sales Δ vs previous year Avg. price Δ vs previous year
Jun 2016 23 +44% $1,477,772 +4%
Jun 2015 16 -38% $1,427,619 -10%
Jun 2014 26 +136% $1,594,346 +69%
Jun 2010 11 +57% $942,182 -38%
Jun 2007 7 baseline $1,521,714 baseline
ytd 2016 107 +47% $1,688,894 +16%
2007 2010 2014 2015 2016
2007 2010 2014 2015 2016
0.0
0.5
1.0
1.5
2.0

17© Westside estate Agency
avg. PriCe Per TransaCTion
number of sales
number of sales
number of sales
June 2016
June 2007
H H H H H H H H H H H H
avg. PriCe Per TransaCTion
2,304,125$
H H H H H H H
avg. PriCe Per TransaCTion
1,025,643$
+71% sales
June 2016 vs 2007
+125% PriCe
Pr
ice
in
mil
lio
ns
90291
Jun
Jun
date sales Δ vs previous year Avg. price Δ vs previous year
Jun 2016 12 -50% $2,304,125 +19%
Jun 2015 24 +14% $1,942,458 -5%
Jun 2014 21 +133% $2,050,253 +149%
Jun 2010 9 +29% $822,056 -20%
Jun 2007 7 baseline $1,025,643 baseline
ytd 2016 89 +2% $1,901,872 +1%
2007 2010 2014 2015 2016
2007 2010 2014 2015 2016
0.0
0.5
1.0
1.5
2.0
2.5

18© Westside estate Agency
avg. PriCe Per TransaCTion
number of sales
number of sales
number of sales
June 2016
June 2007
avg. PriCe Per TransaCTion
avg. PriCe Per TransaCTion
June 2016 vs 2007
Pr
ice
in
mil
lio
ns
90292
+/-0% sales +/-0% PriCe
H H
2,037,500$
not Avail.
Jun
Jun
date sales Δ vs previous year Avg. price Δ vs previous year
Jun 2016 2 n/A $2,037,500 n/A
Jun 2015 0 -100% n/A -100%
Jun 2014 4 33% $2,550,275 54%
Jun 2010 3 n/A $1,658,333 n/A
Jun 2007 0 baseline n/A baseline
ytd 2016 18 +20% $2,140,472 -10%
2007 2010 2014 2015 2016
2007 2010 2014 2015 2016
0.0
0.5
1.0
1.5
2.0
2.5
3.0
3.5
4.0
19
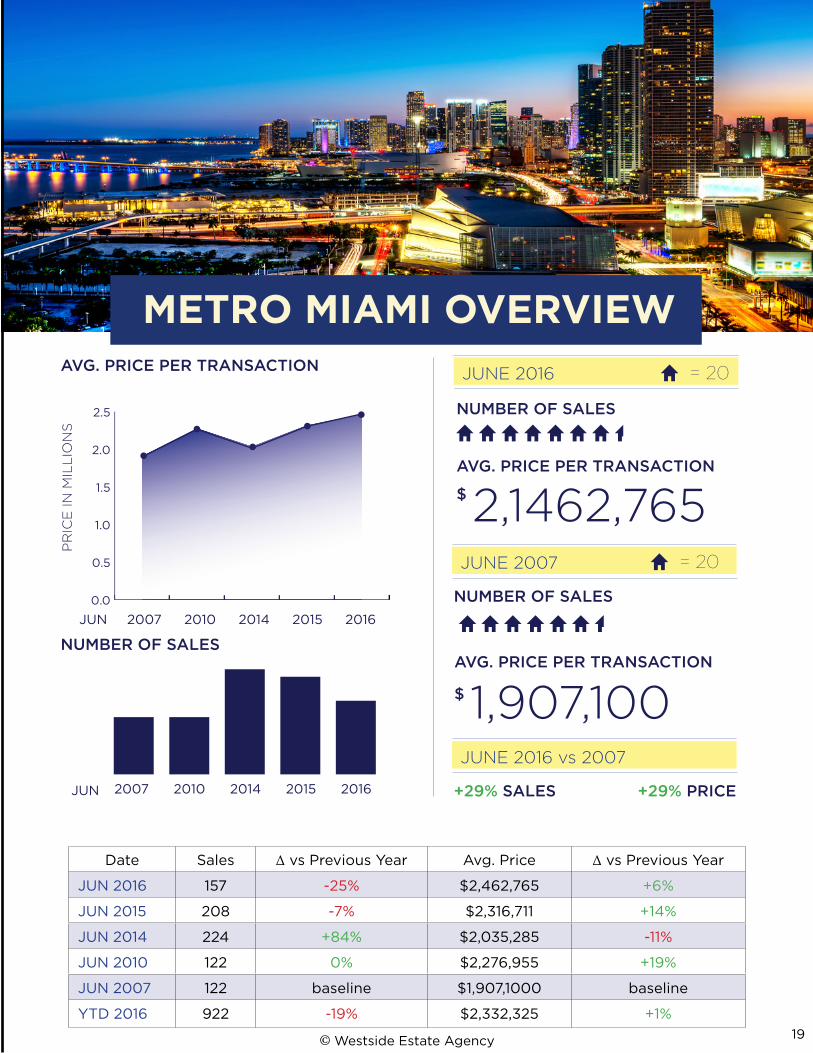
miAmi mArket view
Metro MiaMi overviewavg. PriCe Per TransaCTion
number of sales
number of sales
number of sales
June 2016
June 2007
H H H H H H H H
avg. PriCe Per TransaCTion
2,1462,765$
H H H H H H H
avg. PriCe Per TransaCTion
1,907,100$
+29% sales
June 2016 vs 2007
+29% PriCe
Pr
ice
in
mil
lio
ns
H = 20
Jun
Jun
H = 20
© Westside estate Agency
date sales Δ vs previous year Avg. price Δ vs previous year
Jun 2016 157 -25% $2,462,765 +6%
Jun 2015 208 -7% $2,316,711 +14%
Jun 2014 224 +84% $2,035,285 -11%
Jun 2010 122 0% $2,276,955 +19%
Jun 2007 122 baseline $1,907,1000 baseline
ytd 2016 922 -19% $2,332,325 +1%
2007 2010 2014 2015 2016
2007 2010 2014 2015 2016
0.0
0.5
1.0
1.5
2.0
2.5

20
2007 2010 2014
Year to Date saLes of properties of $1M or More
zip Code sales Average price sales Δ vs ‘07 Average price Δ vs ‘07 sales Δ vs ‘10 Average price Δ vs ‘10
90210 42 $4,912,692 56 33% $4,512,171 -8% 110 96% $5,370,368 19%
90211 5 $1,685,000 8 60% $1,584,875 -6% 14 75% $1,815,000 15%
90069 23 $2,460,391 23 0% $2,049,913 -17% 53 130% $3,731,179 82%
90077 18 $4,613,561 27 50% $1,696,889 -63% 40 48% $8,244,688 386%
90046 35 $2,105,213 53 51% $984,481 -53% 99 87% $1,742,919 77%
90265 41 $5,859,634 34 -17% $4,428,088 -24% 67 97% $3,193,418 -28%
90272 47 $3,385,638 64 36% $2,142,492 -37% 115 80% $3,499,904 63%
90024 16 $2,082,875 12 -25% $1,928,750 -7% 34 183% $5,776,578 199%
90049 41 $3,124,939 70 71% $2,155,193 -31% 87 24% $3,371,922 56%
90025 8 $1,009,625 15 88% $1,058,333 5% 18 20% $1,307,472 24%
90402 16 $2,946,375 26 63% $2,413,712 -18% 30 15% $4,227,783 75%
90005 3 $1,096,667 6 +100% $1,001,333 -9% 13 +117% $1,354,154 +35%
90027 25 $1,245,545 25 0% $1,039,020 -17% 57 128% $1,507,816 45%
90064 36 $1,205,097 43 19% $1,030,256 -15% 85 98% $1,426,574 38%
90291 29 $1,168,741 36 24% $1,012,597 -13% 73 103% $1,780,218 76%
90292 4 $1,947,000 8 100% $1,553,250 -20% 18 125% $1,996,978 29%
miami 736 $1,947,945 536 -27% $2,020,543 +4% 1187 +121% $2,256,710 +12%

21
2015 Δ 2007 vs 20162016
Year to Date saLes of properties of $1M or More
sales Δ vs ‘14 Average price Δ vs ‘14 sales Δ vs ‘15 Average price Δ vs ‘15 sales Average price
136 24% $6,794,566 27% 141 4% $5,858,851 -14% 236% 19%
17 21% $2,291,794 26% 13 -24% $2,202,346 -4% 160% 31%
74 40% $3,949,155 6% 78 5% $4,071,990 3% 239% 66%
61 53% $7,479,598 -9% 56 -8% $5,393,366 -28% 211% 17%
142 43% $1,860,642 7% 148 4% $1,747,188 -6% 323% -17%
108 61% $5,159,983 62% 114 6% $4,573,188 -11% 178% -22%
133 16% $3,616,362 3% 136 2% $3,312,160 -8% 189% -2%
29 -15% $2,842,638 -51% 53 83% $3,200,589 13% 231% 54%
131 51% $3,845,499 14% 135 3% $3,513,592 -9% 229% 12%
31 72% $1,371,792 5% 41 32% $1,405,500 2% 413% 39%
37 23% $4,038,324 -4% 53 43% $4,548,698 13% 231% 54%
20 54% $2,224,700 64% 19 -5% $1,708,220 -23% 533% 56%
72 26% $1,553,006 3% 86 19% $1,634,715 5% 244% 31%
73 -14% $1,457,677 2% 107 47% $1,688,894 16% 197% 40%
87 19% $1,880,282 6% 89 2% $1,901,872 1% 207% 63%
15 -17% $2,365,333 18% 18 20% $2,140,472 -10% 350% 10%
1144 -4% $2,314,923 +3% 922 -19% $2,332,325 +1% +55% +19%

22
Believe it or not, los AnGeles is A BArGAin
i often read reports about real estate so that weA can advise our clientele appropriately. most of the available information applies to all market segments and the nation as a whole. However, i recently came across two reports which clearly indicated that, as expensive as los Angeles seems to be, it is a bargain relative to other metropolitan areas around the country.
the most recent standard and Poor’s/case-shiller 20 city Home index states that the sale price index increased by 5.4% year-to-year in April following a 5.5% gain in march and that home values are just 9.6% below the historic peak of 2007. shrinking inventories, a healthy job market, and historically low interest rates have helped maintain strong demand. the number of total listings has decreased by 5.7% from one year ago. Additionally, home prices rose in All 20 major housing markets, with Boston, charlotte, Denver, Dallas, Portland, san Francisco and seattle reaching record highs. notice that there was no mention of los Angeles in these record increases.
the mark company tracks west coast condominium trends, and they recently reported that the average sale price of new condos measured as price per square foot is as follows: san Francisco $1303; seattle $801; los Angeles $780. the results are similar regarding the sales price of resale condos price per sq ft: san Francisco $1072; seattle $652; los Angeles $564.
Given this data, Angelenos should feel very comfortable with our place in the market. Don’t be afraid to buy.
stephen shapiroCo-Founder, Westside Estate Agency
a message from Weacompare los Angeles real estate Brokerages

23
westside estate Agency is defined by the values
and the vision of its two founders, stephen
shapiro and kurt rappaport. in 1998, stephen
shapiro and kurt rappaport were two of the
most well-known, highly compensated realtors
in los Angeles. still, they felt there had to be a
better way to meet the very high expectations
and individual needs of their high-net worth
clientele.
it wasn’t long before the two began making
plans for a different kind of brokerage. A real
estate agency committed to putting client
service first, and completely satisfying the
needs and desires of each client. in the words of
stephen shapiro, “negotiations conducted with
intelligence and integrity result in what we call
the ‘triple win.’ Great results for the buyer, the
seller, and weA.”
in 1999, shapiro and rappaport opened westside
estate Agency with a focus on the most
expensive and prestigious homes and estates
in the prime westside areas of los Angeles. in
2007, weA opened its malibu office to service
that world famous community. today, weA has
a clientele without parallel, at the pinnacle of the
business, financial, technology and entertainment
industries generating billions in sales and the
highest average price per sale in the industry.
the company added its miami, Florida location in
early 2015.
working hand-in-hand with their commitment to
tailored service has been the agency’s industry
leading application of technology. weA has been
at the forefront in the category for its technology
use, from being the first to implement a fully
integrated network computing system to the first
to use scanning technology, cloud technology,
e-signatures and paperless filing to provide
better service to clients. weA continues to stay
on the cutting-edge of innovation, keeping a
pulse on and implementing new technologies as
soon as they’re available.
stephen and kurt have assembled a team of
full-time real estate pros, known for expertise,
experience, integrity and discretion. each
agent possesses an in-depth knowledge of the
inventory and current market conditions; our
clients turn to us for candid insights into current
market value, the sales potential of properties
and marketing strategies for our current and
prospective clients.
of course, weA has retained its independence, in
the face of widespread acquisition by a handful
of impersonal agencies. remaining independent
means we answer to our clients, instead of a
corporate headquarters thousands of miles
away. it means we don’t need to worry about a
conglomerate’s bottom-line or using an in-house
escrow or title company; rather, we’re free to
focus on getting the best and doing the best for
each client.
in practical terms, this translates into efficiency
and responsiveness. making the most of every
minute by showing just the homes, in just the
neighborhoods, that meet our clients’ criteria.
Quite frequently, we’re even able to offer new
properties not yet on the market.
Finally, it means weA’s agents have a direct
conduit to the top. unlike the non-owner
operated, robo brokerages, our principals
play a role in, and keep an eye on every weA
transaction. in sense, every weA client is also a
client of stephen’s and kurt’s. which only make
sense, as it’s with these two that the weA story
began.
suCCess Built on superior mArket knoWledge. And understAnding our Clients.

24
Beverly Hills office
Westside estate Agency210 north Canon drive Beverly Hills, CA 90210
tel: (310) [email protected]
malibu office
Westside estate Agency23410 Civic Center Way malibu, CA 90265
tel: (310) [email protected]
Contact us
miami office
Westside estate Agency 2100 ponce de leon Blvd 7th floorCoral gables, fl 33134
tel: (305) [email protected]