watershed characterization report the black river watershed management plan
TRANSCRIPT

Watershed Characterization Reportfor the
The Black River Watershed Management Plan
This document was prepared for the New York State Department of State Divisionof Coastal Resources with funds provided under Title 11 of the Environmental Protection Fund.

TABLE OF CONTENTSBlack River Watershed Management Plan
CHARACTERIZATION REPORT
1.1. INTRODUCTION.................................................................................................................... 1
1.2. STUDY AREA DELINEATION.................................................................................................... 2
1.2.1. The Watershed ................................................................................................................ 21.2.2. Subwatersheds................................................................................................................. 2
1.3. PLANNING CONSIDERATIONS ............................................................................................... 3
1.3.1. Development Trends........................................................................................................ 31.3.2. Regional Planning............................................................................................................. 7
1.4. PHYSICAL CHARACTERISTICS OF THE WATERSHED............................................................... 8
1.4.1. Land Use and Land Cover................................................................................................. 81.4.2. Topography ................................................................................................................... 161.4.3. Hydrology ..................................................................................................................... 181.4.4. Natural Resources .......................................................................................................... 29
1.5. IMPAIRMENTS AND THREATS............................................................................................... 46
1.5.1. Introduction................................................................................................................... 461.5.2. Threats to the Black River Watershed............................................................................... 46
ENDNOTES ....................................................................................................................................... 53

TABLE OF CONTENTSBlack River Watershed Management Plan
CHARACTERIZATION REPORT
List of Tables and Figure*
Table 1. Communities of the Black River Watershed Page 2Table 2. Subwatersheds of the Black River Watershed Page 3Table 3. Historic and Projected Population for Watershed Counties Page 4Table 4. Historic and Projected Population for Watershed and Subwatersheds Page 5Table 5. Projected Population and Urban Area Change, 2000 to 2020 Page 6Table 6. Projected Land Cover Change, 2001 to 2020 Page 7Table 7. Black River Watershed Land Use Page 9Table 8. Land Use Type Descriptions Page 10Table 9. NYSDEC Lands Page 12Table 10.Land Cover, Black River Watershed, 2001 Page 12Table 11.Land Cover Type Descriptions Page 13Table 12.Land Cover Change, 1992 to 2001 Page 14Table 13.Soil Hydrologic Group Page 16Table 14.Elevations Page 17Table 15.Climate Data, 1971 to 2000 Page 18Table 16.Average Annual Precipitation by Subwatershed Page 19Table 17.Discharge and Recurrence Intervals Page 20Table 18.Discharges for Selected Recurrence Intervals Page 21Table 19.Annual Mean Flow Page 22Table 20.Steep Slopes Page 23Table 21.Wetland Habitats Page 25Table 22.Aquifers Page 27Table 23.Class A and AA Streams Page 28
Figure 1. Change to Urban Land Areas, 1992 to 2001 Page 15
* Please note additional Tables and all Maps are included in a supplemental document, entitled “Black RiverWatershed Management Plan Characterization Report Appendices.”
BLACK RIVER WATERSHED MANAGEMENT PLAN
CHARACTERIZATION REPORT
Page 1THEACADEMYOF NATURALSCIENCES
THEACADEMYOF NATURALSCIENCES
1.1. INTRODUCTION
The Black River Watershed Characterization Report examines the existing conditions of the Black Riverwatershed, incorporating summaries of the physical conditions of the natural and built environments. Thecharacter of the watershed has undergone a myriad of changes over the last century, some beneficial and somedetrimental, with many implications to the physical environment. The Characterization Report looks at howshifts in key industry sectors, agricultural practices, changes to population centers, development patterns, andtechnology have, and will likely continue to, impact the natural resources and water quality within thewatershed.
The Black River Watershed Characterization Report includes the following key components:
Identification and discussion of watershed boundaries, at both the watershed and the subwatershedlevel;Physical characteristics of the watershed including land use and cover, topography, hydrology, andnatural resources;Planning considerations which may have implications on the watershed including population trends,build-out potentials, and related regional planning efforts; and,Water quality characteristics, including impairments and threats.

BLACK RIVER WATERSHED MANAGEMENT PLAN
CHARACTERIZATION REPORT
Page 2THEACADEMYOF NATURALSCIENCES
THEACADEMYOF NATURALSCIENCES
1.2. STUDY AREA DELINEATION
1.2.1. The Watershed
The Black River drains approximately 1.2 million acres of the western slopes of the AdirondackMountains and the eastern edge of the Tug Hill Plateau before emptying into Lake Ontario nearWatertown (see Map 1). The Adirondack portion of the watershed is drained, for the most part, by twolarge watercourses – the Beaver River and the Moose River – and several smaller tributaries (e.g.,Independence River, Otter Creek, Woodhull Creek). The Tug Hill region of the Black Riverwatershed, however, is characterized predominantly by numerous small tributaries flowing over steepslopes.i As a whole, there are approximately 4,000 miles of rivers and streams within the watershed,as well as more than 500 lakes and ponds covering approximately 35,000 acres.
Traversed by this 1.2 million acre watershed are portions of five counties – Hamilton County,Herkimer County, Jefferson County, Lewis County, and Oneida County – and their associated cities,towns, and villages (see Map 2). In all, one city (Watertown), 37 towns, and 18 villages are wholly orpartially located within the Black River watershed:
Table 1. Communities of the Black River Watershed
1.2.2. Subwatersheds
Subwatersheds are those areas from which groundwater and surface water drain and contribute to theflow of a larger watershed or drainage basin. Nineteen subwatersheds comprise the Black Riverwatershed (see Map 3). Table 1 provides a list of the subwatersheds, as well as the size, relativepercent cover, and HUC-11 (Hydrologic Unit Boundary) identification numbers for each. Developedby the U.S. Geological Survey (USGS), hydrologic unit boundaries provide a hierarchical method fordelineating and identifying drainage basins to ensure a working, seamless dataset across community
Hamilton County Herkimer County Jefferson County Lewis County Oneida CountyTown of Arietta Town of Ohio City of Watertown Town of Croghan Town of AvaTown of Inlet Town of Russia Town of Brownville Town of Denmark Town of BoonevilleTown of Lake Pleasant Town of Webb Town of Champion Town of Greig Town of ForestportTown of Long Lake Town of Hounsfield Town of Harrisburg Town of RemsenTown of Morehouse Town of Le Ray Town of Lewis Town of SteubenVillage of Speculator Town of Pamelia Town of Leyden Village of Booneville
Town of Rutland Town of LowvilleTown of Watertown Town of LyonsdaleTown of Wilna Town of MartinsburgTown of Worth Town of MontagueVillage of Black River Town of New BremenVillage of Brownville Town of PinckneyVillage of Carthage Town of TurinVillage of Deferiet Town of WatsonVillage of Dexter Town of West TurinVillage of Glen Park Village of CastorlandVillage of Herrings Village of ConstablevilleVillage of West Carthage Village of Copenhagen
Village of CroghanVillage of LowvilleVillage of Lyons FallsVillage of Port LeydenVillage of Turin

BLACK RIVER WATERSHED MANAGEMENT PLAN
CHARACTERIZATION REPORT
Page 3THEACADEMYOF NATURALSCIENCES
THEACADEMYOF NATURALSCIENCES
lines. Each watershed is assigned a unique hydrologic unit code according to its size and location, withthe larger 8-digit sub-basins (e.g., the Black River watershed) subdivided into smaller 11-digitsubwatersheds (e.g., the 19 subwatersheds within the Black River watershed).
Table 2. Subwatersheds of the Black River Watershed
SUBWATERSHED HUC
IDENTIFICATION NO.
ACRES PERCENT OFTOTAL LAND
Beaver Creek 04150101150 98,761 8.1%
Crystal Creek 04150101130 17,085 1.4%
Cummings Creek 04150101030 14,212 1.2%
Deer River 04150101170 62,270 5.1%
Fish Creek 04150101080 14,966 1.2%
Independence River 04150101110 61,074 5.0%
Lower Black River 04150101190 39,532 3.2%
Lower Black Middle River 04150101180 51,985 4.3%
Middle Black River 04150101160 81,353 6.7%
Middle Branch Moose River --- 94,880 7.8%
Mill Creek 04150101120 22,512 1.8%
Moose River 04150101070 46,711 3.8%
Otter Creek 04150101090 42,181 3.5%
South Branch Moose River 04150101050 135,713 11.1%
Stillwater Reservoir 04150101140 109,992 9.0%
Sugar River 04150101040 44,732 3.7%
Upper Middle Black River 04150101100 102,016 8.4%
Upper Black River 04150101020 115,439 9.5%
Woodhull Creek 04150101010 62,661 5.1%
BLACK RIVER WATERSHED 04050101 1,218,075 100%
Source: 11- Digit Hydrologic Unit Boundary GIS Data Layer, NYSDEC
1.3. PLANNING CONSIDERATIONS
1.3.1. Development Trends
POPULATION CHARACTERISTICS
Planning for the future requires a clear understanding of both current conditions and recent trends. Anunderstanding of trends allows community leaders to make informed decisions about future policiesand land use decisions. An important trend to consider is population growth or decline.
Population growth is an important indicator of watershed health – too much growth can strainresources within the watershed and may result in an increase in both point and non-point sourcepollution. Additionally, associated increases in housing developments, roads, shopping areas, andcommercial and industrial facilities increases the amount of impervious surface and often results in theremoval of native vegetation, resulting in increased occurrences of flooding. Population growth,coupled with limited land use regulation, can also lead to rural sprawl, which reduces critical habitat

BLACK RIVER WATERSHED MANAGEMENT PLAN
CHARACTERIZATION REPORT
Page 4THEACADEMYOF NATURALSCIENCES
THEACADEMYOF NATURALSCIENCES
areas, wetlands, and riparian corridors that in many instances act as filtration systems and provideprotection for the waterbodies.
A review of population density maps for the watershed from 1990 to 2000 shows where populationshifts have occurred (Maps 4 and 5). While the population density of Herkimer and Hamilton Countieshas remained the same, with less than 10 people per square mile, Lewis County has seen an increasein population densities in a number of key areas. The population densities of the Independence River,Otter Creek, Fish Creek, and Moose River subwatersheds have experienced population densityincreases from under 10 people per square mile to between 10 and 50 people per square mile. Otherincreases to population density have also occurred in the areas immediately outside the Town ofLowville. In contrast, farther outlying areas of Lowville, including portions of the Deer River and MillCreek subwatersheds, have seen their population densities decrease to under 10 people per squaremile, suggesting a population shift closer to the County seat.
Today, a majority of the Black River watershed’s population is concentrated within the Black Rivervalley (see Map 5). In the earliest days of settlement within the region, development occurred alongthe river valley as this was the primary transportation corridor along the Black River Canal system,connecting the river and the communities along it with the Erie Canal to the south and Watertown tothe north. In addition to commerce and transport, the Black River also provided opportunities forhydropower in certain locations and the fertile floodplain offered prime agricultural lands.
As previously noted, five counties are traversed by the Black River watershed – Hamilton, Herkimer,Jefferson, Lewis, and Oneida. To gain an understanding of the watershed’s population trends, historicand projected population data was investigated. Data collected from the Cornell University Programon Applied Demographics (see Table 3), the total population of these five counties is projected todecrease by almost seven percent from 2000 to 2020 (Year 2020 is the full build-out date for thisplan). Additionally, although Jefferson County is expected to gain in total population from 2000 to2020, it is projected that the County will actually begin to depopulate beginning in 2015 andcontinuing into 2020. The sparsely populated Hamilton County, located entirely within theAdirondack Park, is expected to lose almost 15 percent of its population from 2000 to 2020.
Table 3. Historic and Projected Population for Watershed Counties
YEARCOUNTY
2000 2005 2010 2015 2020
PERCENT CHANGE(1990 to 2020)
Hamilton 5,379 5,196 5,055 4,843 4,576 -14.9%
Herkimer 64,427 63,597 62,346 60,622 58,491 -9.2%
Jefferson 111,738 115,536 116,157 115,722 114,717 2.7%
Lewis 26,944 26,506 26,168 25,594 24,797 -8.0%
Oneida 235,469 233,969 226,880 219,490 211,544 -10.2%
TOTALS 445,957 446,809 438,616 428,286 416,145 -6.7%
Source: Cornell University Program of Applied Demographics
To determine the approximate year 2000 population for each subwatershed, data was collected fromthe U.S. Census Bureau at the block group level. Block group population data was then applied to theappropriate subwatershed using a weighted average based on the percent of a given block groupwithin each subwatershed. Subsequent to calculation of subwatershed populations for year 2000,county-level rates of population change were determined and applied to each subwatershed todetermine the projected population for year 2020. The results of this analysis are provided in Table 4.

BLACK RIVER WATERSHED MANAGEMENT PLAN
CHARACTERIZATION REPORT
Page 5THEACADEMYOF NATURALSCIENCES
THEACADEMYOF NATURALSCIENCES
Table 4. Historic and Projected Population for Black River Watershed and Subwatersheds
POPULATIONSUBWATERSHED
2000 2020
POPULATIONCHANGE
(2000 to 2020)
PERCENT CHANGE(2000 to 2020)
Beaver Creek 2,674 2,460 -214 -8.0%
Crystal Creek 1,013 932 -81 -8.0%
Cummings Creek 544 489 -55 -10.1%
Deer River 1,816 1,672 -144 -7.9%
Fish Creek 309 284 -25 -8.1%
Independence River 657 604 -53 -8.1%
Lower Black River 26,285 26,986 701 2.7%
Lower Black Middle River 11,156 11,396 240 2.2%
Middle Black River 7,284 6,704 -580 -8.0%
Middle Branch Moose River 1,155 1,036 -119 -10.3%
Mill Creek 1,066 981 -85 -8.0%
Moose River 892 820 -72 -8.1%
Otter Creek 550 506 -44 -8.0%
South Branch Moose River 426 371 -55 -12.9%
Stillwater Reservoir 307 271 -36 -11.7%
Sugar River 2,030 1,858 -172 -8.5%
Upper Middle Black River 5,499 5,033 -466 -8.5%
Upper Black River 3,278 2,948 -330 -10.1%
Woodhull Creek 766 689 -77 -10.1%
BLACK RIVER WATERSHED 67,707 66,040 -1,667 -2.5%
Source: U.S. Census Bureau; Cornell University Program of Applied Demographics
While the raw population numbers provide an indication of the current and projected populationlevels within the watershed, more important is population change as it is indicative of potential futureimpacts to each subwatershed. As is depicted in Table 3, several interesting population trends areoccurring within the watershed study area. First, the population of the entire watershed is projected todecrease by approximately 1,667 people, or 2.5 percent. Most of this loss will occur in threesubwatersheds, all of which are located in the heavily populated areas of the Black River valley(predominantly in Lewis County):
The Middle Black River subwatershed;The Upper Middle Black River subwatershed; andThe Upper Black River subwatershed.
Only two subwatersheds are projected to increase in population by 2020 – the Lower Black River andLower Middle Black River subwatersheds. Both subwatersheds are located predominantly in JeffersonCounty, in the vicinity of the Village of Carthage, the City of Watertown, and Fort Drum.
BUILD-OUT ANALYSIS
Build-out analysis was used to evaluate potential future development intensities and patterns withinthe Black River watershed, as well as the 19 subwatersheds, at Year 2020. As previously noted,

BLACK RIVER WATERSHED MANAGEMENT PLAN
CHARACTERIZATION REPORT
Page 6THEACADEMYOF NATURALSCIENCES
THEACADEMYOF NATURALSCIENCES
development intensities and patterns can play a significant role in water quality and overall watershedhealth. Thus, evaluating potential future development impacts is a crucial step in defining anddeveloping the appropriate tools to improve and maintain ecosystem health.
For the purposes of this analysis, build-out refers to the amount of land cover classified as urban in2020. A detailed discussion and explanation of land classifications can be found in Table 11. Note thaturban lands are defined as all developed areas, from high intensity areas where people reside or workin high numbers, to open areas with a mixture of some constructed materials and vegetation in theform of lawn grasses and does not necessarily refer to urban city development.
The analysis was based on the projected populations for each of the subwatersheds and therelationship between population change and amount of land classified as urban. The first step in thisanalysis was to determine the change in lands classified as urban from 2001 to 2020 based on theprojected change in population for those same years (see Table 5).
Table 5. Projected Population and Urban Area Change, 2000 to 2020
SUBWATERSHED POPULATIONCHANGE (2000-2020)
URBAN ACRESCHANGE (2000-2020)
Beaver Creek -214 -151
Crystal Creek -81 -23
Cummings Creek -55 1
Deer River -144 -84
Fish Creek -25 30
Independence River -53 3
Lower Black River 701 722
Lower Black Middle River 240 282
Middle Black River -580 -500
Middle Branch Moose River -119 -60
Mill Creek -85 -27
Moose River -72 -15
Otter Creek -44 11
South Branch Moose River -55 1
Stillwater Reservoir -36 20
Sugar River -172 -111
Upper Middle Black River -466 -391
Upper Black River -330 -261
Woodhull Creek -77 -20
BLACK RIVER WATERSHED -1,667 -573
Once the change in urban area was calculated for each subwatershed, this value was applied to theland cover values for 2001. As the total area for each subwatershed cannot change, any change to theamount of land classified as urban must result in changes to the remaining land cover types (e.g.,forest, agriculture). To determine how the remaining land cover types changed as a result of changesin the amount of land classified as urban, rates of change were calculated for each cover type for eachsubwatershed for years 1992 to 2001. These rates were then used to determine the projected landcover values for year 2020 for the entire Black River watershed, as well as the 19 subwatersheds.Table 10 provides the projected land cover values for year 2020 for the Black River watershed.
BLACK RIVER WATERSHED MANAGEMENT PLAN
CHARACTERIZATION REPORT
Page 7THEACADEMYOF NATURALSCIENCES
THEACADEMYOF NATURALSCIENCES
Table 6. Projected Land Cover Change, 2001 to 2020
LAND COVER TYPE TOTAL ACRES(2001)
TOTAL ACRES(2020)
ACRESCHANGE
PERCENTCHANGE
Open water 45,874 45,861 -13 0.0%
Agriculture 142,335 142,473 138 0.1%
Urban 20,806 20,233 -573 -2.8%
Barren Land 1,665 1,664 -1 0.0%
Forest 699,546 699,948 402 0.0%
Grassland / Shrub 95,528 95,528 0 0.0%
Wetlands 212,320 212,367 48 0.1%
Total 1,218,075 1,218,075 -- --
Source: 2001 National Land Cover Data, Multi-Resolution Land Characteristics (MRLC) Consortium
Although the watershed as a whole is projected to lose more than 570 acres of urban/developed areafrom 2001 to 2020, eight of the nineteen subwatersheds are projected to realize an increase in theamount of lands classified as urban within their drainage basins:
Lower Black River subwatershed – 722 acre increase (9.9 percent increase)Lower Middle Black River subwatershed – 282 acre increase (7.7 percent increase)Fish Creek subwatershed – 30 acre increase (187.5 percent increase)Stillwater Reservoir subwatershed – 20 acre increase (32.3 percent increase)Otter Creek subwatershed – 11 acre increase (34.4 percent increase)Independence River subwatershed – 3 acre increase (20 percent increase)Cummings Creek subwatershed – 1 acre increase (2.5 percent increase)South Branch Moose River subwatershed – 1 acre increase (0.4 percent increase)
1.3.2. Regional Planning
REGIONAL PLANNING AGENCIES
In addition to the 61 units of government within the watershed, the study area also falls within thepurview of three regional planning bodies:
The Tug Hill Commission;The Adirondack Park Agency; andThe Fort Drum Regional Liaison Organization.
Originally established in 1972 as a temporary body, the Tug Hill Commission (THC) was created toenable local governments, private organizations, and individuals to shape the future of the Tug HillRegion. The non-regulatory THC provides technical assistance to 62 local governments, economicdevelopment organizations, and other local groups in the areas of land use planning, communityeconomic development, and natural resource management. The THC also provides training andinformation for local officials through workshops and issues papers on a variety of topics.
The Adirondack Park Agency (APA) was created in 1971 by the State Legislature to develop andadminister long-range plans for both public and private lands within the Adirondack Park. The primarypurpose of the APA is to insure conservation, protection, preservation, development and use of theunique scenic, aesthetic, wildlife, recreational, open space, historic, ecological and natural resources ofthe Park. Additionally, the APA is responsible for developing long-range park policy that takes into

BLACK RIVER WATERSHED MANAGEMENT PLAN
CHARACTERIZATION REPORT
Page 8THEACADEMYOF NATURALSCIENCES
THEACADEMYOF NATURALSCIENCES
consideration the needs of the entire state. In contrast to the Tug Hill Commission, the APA is aregulatory body that strives to ensure that current and projected future pressures on the park’sresources are provided for in a land use plan that recognizes matters of local concern, as well as thoseof the surrounding region and New York State.
The Fort Drum Regional Liaison Organization (FDRLO) fills a range of roles including the promotionand integration of Fort Drum activity with community and business development outside the base(since its creation, the FDRLO has sponsored numerous studies to define how Fort Drum cancomplement the region’s economy, ranging from the Fort Drum economic impact update to militaryhousing in the community, and even including joint-use airport options). Most recently, the FDRLOconducted a study to identify and explore ways to improve the quality of jobs in the North Country byleveraging opportunities associated with national changes in how the military procures contracts andservices from private business.
REGIONAL PLANNING INITIATIVES
There is currently an unprecedented number of planning efforts underway within the Black RiverWatershed, ranging from local municipal projects to larger regional-based initiatives. Theimplementation of these initiatives could have implications on the watershed and should beconsidered and monitored to determine what potential impacts may be, and how they may bemitigated. In addition to over fifty locally-led municipal projects ranging from Main Street plans toinfrastructure improvements to recreation planning, there are a series of regional planning initiativesoccurring, at least in part, within the watershed study area:
Black River Blueway TrailFort Drum Growth Management InitiativeFour Town Comprehensive PlanLewis County Comprehensive PlanMaple Ridge Wind FarmRoute 28 Corridor Revitalization StudyWatertown to Black River Recreational TrailOld Forge to Maine Canoe TrailBlack River Scenic BywayOlympic Scenic BywayMaple Traditions Scenic BywayAdirondack Scenic BywayTOBIE Trail ExtensionRACOG Land Use Review and Comprehensive Plan
Planning documents relevant to the watershed study area will be reviewed and considered moreclosely in latter phases of the Management Plan process.
1.4. PHYSICAL CHARACTERISTICS OF THE WATERSHED
1.4.1. Land Use and Land Cover
Land use refers to how the land is used, often has a political dimension, and is primarily defined at theparcel level (i.e., only one use is assigned to each parcel).ii Land use categories consist of generaldescriptions such as residential and commercial, as well as more detailed information including thetype of residential or commercial use (e.g., single-family residential or highway commercial.)Landcover, however, describes both the vegetative and man-made features that characterize a particulararea and reflects “the climate, topography, soils, geology, and other environmental features that have

BLACK RIVER WATERSHED MANAGEMENT PLAN
CHARACTERIZATION REPORT
Page 9THEACADEMYOF NATURALSCIENCES
THEACADEMYOF NATURALSCIENCES
made various types of land use possible, and shaped settlement patterns and current economicactivities”.iii Land cover is determined based on the interpretation of aerial photography and is notconstrained by parcel boundaries (i.e., one parcel could consist of multiple cover types). Examples ofland cover types include forest, urban, or wetland, all of which can be further divided into moredetailed subcategories (e.g., deciduous forest versus evergreen forest). Both land use and land coverare primary drivers affecting water quality, exerting considerable influence on the chemical, physical,and biological characteristics of waterbodies. iv Agricultural land uses, as well as the built environment,often produce non-point source pollution (e.g., sediments, nutrients) through runoff, which negativelyimpacts water quality and results in changes in aquatic community structure and degradation of streambiota. Additionally, the infiltration rate for rainwater and snowmelt (i.e., the rate at which the soil isable to absorb water) is determined according to land cover and the amount of impervious surface,with higher infiltration rates typically associated with natural land cover types (e.g., forest, grassland).Removing natural land cover types diminishes the soil’s ability to absorb nutrients and trap sediments,resulting in increased amounts of pollution washing into surface waterbodies. Thus, understandingland use and land cover, particularly how these factors change over time, is critical to assessingregional ecosystem impacts and developing the tools necessary to protect watershed health. v
LAND USE
More than 53,000 parcels comprise the Black River watershed (see Map 6 and Table 7). The mostpredominant uses, in terms of total acreage, are those parcels classified as Wild, Conservation, Forest,& Parks, comprising almost 60 percent (722,347 acres) of the total watershed land area (see Table 8for a description of each land use category). Additionally, of these more than 700,000 acres,approximately 82 percent (590,821 acres) are located within the Adirondack Park Blue Line. Alsoworth noting is the considerable amount of land classified as State Owned Forest Lands –approximately 55.7 percent (400,339 acres) of all Wild, Conservation, Forest, & Parks lands, or 32.7percent of all land within the watershed. In terms of water quality, forested watersheds typicallyproduce some of the highest quality water in the nation.vi Deep-rooted trees and their complex rootsystems stabilize the soil, thus decreasing erosion, particularly along riparian areas. Trees also reducerunoff through the interception of rainfall and enhancement of the evaporative process (i.e, directevaporation or evapotranspiration).vii
Table 7. Black River Watershed Land Use
LAND USE CLASSIFICATION NUMBER OFPARCELS
PERCENT OFTOTAL
TOTAL ACRES PERCENTCOVER
Agriculture 3,076 5.7% 172,066 14.1%
Residential 28,353 52.6% 185,490 15.2%
Vacant 11,607 21.5% 84,767 7.0%
Commercial 2,178 4.0% 5,247 0.4%
Recreation and Entertainment 198 0.4% 6,642 0.5%
Community Services 705 1.3% 6,426 0.5%
Industrial 188 0.3% 4,138 0.3%
Public Services 634 1.2% 11,595 1.0%
Wild, Conservation, Forest and Parks 4,820 8.9% 722,347 59.3%
No Data 2,186 4.1% 19,358 1.6%
TOTAL 53,945 100% 1,218,075 100%
Source: Property Parcel GIS Data provided by Hamilton, Herkimer, Jefferson, Lewis, and Oneida Counties
BLACK RIVER WATERSHED MANAGEMENT PLAN
CHARACTERIZATION REPORT
Page 10THEACADEMYOF NATURALSCIENCES
THEACADEMYOF NATURALSCIENCES
As previously noted, 19 subwatersheds comprise the larger Black River watershed. Of these 19subwatersheds, five have less than 20 percent of their land classified as Wild, Conservation, Forest, &Parks:
Lower Black River subwatershed – 1.4 percent (545 acres)Mill Creek subwatershed – 4.3 percent (976 acres)Lower Middle Black River subwatershed – 6.9 percent (3,574 acres)Sugar River subwatershed – 12.1 percent (5,402 acres)Middle Black River subwatershed – 13.4 percent (10,908 acres)
Additionally, five of the 19 subwatersheds have more than 80 percent of their land classified as Wild,Conservation, Forest, & Parks (note that these five subwatersheds are predominately located within theAdirondack Park and comprise approximately 50 percent of all lands classified as Wild, Conservation,Forest, & Parks):
South Branch Moose River subwatershed – 97.2 percent (131,963 acres)Otter Creek subwatershed – 93.5 percent (39,436 acres)Moose River subwatershed – 90.0 percent (42,028 acres)Stillwater Reservoir subwatershed – 86.5 percent (95,091 acres)Woodhull Creek subwatershed – 80.1 percent (50,176 acres)
Table 8. Land Use Type Descriptions
Source: Property Classification Codes, NYS Office of Real Property Services(http://www.orps.state.ny.us/assessor/manuals/vol6/ref/prclas.htm)
Residential uses, comprising approximately 15 percent (185,490 acres) of the watershed, are primarilydistributed along the periphery of the agricultural belt that follows the Black River, as well as adjacentto and within the watershed’s numerous villages and hamlets. Some of the densest areas of residentialdevelopment, however, are located in the northwest portion of the watershed in Carthage andWatertown. Residential land uses range from low-density single-family homes on large lots in rural
Agriculture Property used for the production of crops or livestock
ResidentialProperty used for human habitation. Living accommodations such as hotels,motels, and apartments are in the Commercial category
VacantProperty that is not in use, is in temporary use, or lacks permanentimprovement
CommercialProperty used for the sale of goods and/or services, including hotels, motels,and apartments
Recreation & Entertainment Property used by groups for recreation, amusement, or entertainment
Community Services Property used for the well being of the community
IndustrialProperty used for the production and fabrication of durable and nondurableman-made goods
Public Services Property used to provide services to the general public
Wild, Forested, Conservation Lands & PublicParks
Reforested lands, preserves, and private hunting and fishing clubs

BLACK RIVER WATERSHED MANAGEMENT PLAN
CHARACTERIZATION REPORT
Page 11THEACADEMYOF NATURALSCIENCES
THEACADEMYOF NATURALSCIENCES
areas to high-density multi-family apartment buildings in more urban areas, with an average residentialparcel size of 6.4 acres.
Approximately 40 percent of all residential land use occurs in five subwatersheds, of which four arelocated within, or along the periphery of the Black River valley:
Middle Branch Moose River subwatershed – 24,415 acres (25.7 percent of subwatershedland area)Lower Middle Black River subwatershed – 17,185 acres (33.1 percent of subwatershedland area)Independence River subwatershed – 16,016 acres (26.2 percent of subwatershed landarea)Lower Black River subwatershed – 12,004 acres (30.4 percent of subwatershed land area)Crystal Creek subwatershed – 4,672 acres (27.3 percent of subwatershed land area)
This has important implications for watershed health as the use of septic tanks, sewage disposalsystems, fertilizers and pesticides for lawn care, and runoff from driveways and parking lots inresidential areas can all negatively affect water quality. viii
Agricultural lands make up the third largest category of uses, with more than 172,000 acres (14.1percent) located within the Black River watershed. As depicted in Figure 5, agriculture uses areconcentrated primarily within the Black River valley, from the Lewis-Oneida County line northwest toLake Ontario. Of the approximately 172,000 acres of agricultural use, almost half (43.4 percent, or74,761 acres) is within the Middle Black River and Upper Middle Black River subwatersheds. Aspreviously noted, agricultural land uses produce nonpoint source pollution in the form of soil erosionand sedimentation, nutrients, and pesticides. Irrigation practices associated with agriculture can alsonegatively impact water quality.
Thus, in terms of water quality, three subwatersheds comprise a considerable portion of their land inagricultural uses:
Mill Creek subwatershed – 75.4 percent (16,980 acres)Middle Black River subwatershed – 57.7 percent (46,938 acres)Sugar River subwatershed – 43.6 percent (19,524acres)
Almost one-half (79,973 acres) of all agriculture practiced within the watershed is directly related tolivestock and its associated products This has important watershed management implications as theplacement of livestock farming operations can severely impact water quality. Most livestock-relatedagriculture (53.5 percent or 42,778 acres) occurs in three of the nineteen subwatersheds:
Middle Black River subwatershed – 21,864 acres (26.9 percent of subwatershed)Upper Middle Black River subwatershed –12,935 acres (12.7 percent of subwatershed)Mill Creek subwatershed – 7,979 acres (35.4 percent of subwatershed)
Worth additional note is the amount of land within the Black River watershed owned, or under themanagement of the New York State Department of Environmental Conservation (NYSDEC) (see Map 7and Table 9). Almost 470,000 acres (38.5 percent) of the watershed comprises NYSDEC lands, mostof which are located within the Adirondack Park. More specifically, Forest Preserve-Wild Forest andForest Preserve-Wilderness make up the largest share of NYSDEC lands at 418,897 acres, or 89.6percent of all NYSDEC lands. Wilderness lands are those areas of state land “having a primevalcharacter, without significant improvement or protected and managed so as to preserve, enhance andrestore, where necessary, its natural conditions”.ix Wild Forests, however, allow for a higher degree of
BLACK RIVER WATERSHED MANAGEMENT PLAN
CHARACTERIZATION REPORT
Page 12THEACADEMYOF NATURALSCIENCES
THEACADEMYOF NATURALSCIENCES
human use than do wilderness lands while retaining an essentially wild character. Appendix 2, Table 1provides a detailed breakdown of land uses by subwatershed.
Table 9. NYSDEC Lands
DEC LAND CLASSIFICATION ACRES
Administrative 1
Fishing Access 60
Forest Preserve 1,624
Forest Preserve – Intensive Use 1,085
Forest Preserve – Primitive 211
Forest Preserve – Wild Forest 260,111
Forest Preserve – Wilderness 159,786
State Forest 41,793
Waterway Access 34
Wildlife Management 3,733
TOTAL 468,437
Source: DEC Lands GIS Data Layer, NYSDEC
LAND COVER
Using data provided by the Multi-Resolution Land Characteristics (MRLC) Consortium (an associationof nine federal agencies), land cover types from 2001 were mapped for the Black River watershed. Asdepicted in Map 8, seven general land cover types comprise the watershed – open water, agriculture,urban, barren land, forest, grassland/shrub, and wetlands. Much of the watershed’s agriculturalproduction is limited to the Black River valley, while urban development occurs in small nodesthroughout the valley and in areas immediately adjacent to the Black River. Forested and wetlandareas, however, occur primarily within the Adirondack Park Blue Line, as well as towards the higherelevations of the Tug Hill Plateau.
Table 10. Land Cover, Black River Watershed, 2001
LAND COVER TYPE TOTALACRES
PERCENTCOVER
Open Water 45,874 3.8%
Agriculture 142,335 11.7%
Urban 20,806 1.7%
Barren Land (rock, sand,clay) 1,665 0.1%
Forest 699,546 57.4%
Grassland / Shrub 95,528 7.8%
Wetlands 212,320 17.4%
Open Water 1,218,075 100%
Source: 2001 National Land Cover Data, Multi-Resolution Land Characteristics (MRLC) Consortium
Based on the data provided in Table 5, forest comprises almost 700,000 acres and is the single largestland cover type in the watershed (57.4 percent of total area). Wetland and agricultural areas are the

BLACK RIVER WATERSHED MANAGEMENT PLAN
CHARACTERIZATION REPORT
Page 13THEACADEMYOF NATURALSCIENCES
THEACADEMYOF NATURALSCIENCES
next largest cover types, comprising approximately 212,320 acres (17.4 percent) and 142,335 acres(11.7 percent), respectively. Areas classified as urban account for only 1.7 percent, or 20,806 acres, ofland in the Black River watershed.
At the subwatershed level, the Lower Black River subwatershed has both the highest rate of urban area(18.5 percent or 7,308 acres) and the lowest rate forest cover (16.5 percent or 6,507 acres), while theSouth Branch Moose River subwatershed contains more than 103,000 acres of forest cover, or 76.5percent of its total land area.
Table 11. Land Cover Type Descriptions
Source: 2001 National Land Cover Data, Multi-Resolution Land Characteristics (MRLC) Consortium
Appendix 2, Table 2 provides a detailed breakdown of land cover types by subwatershed.
Land Cover Change, 1992 to 2001In addition to mapping Black River watershed land cover types for 2001, MRLC data was also used todetermine changes to land cover from 1992 to 2001. As with population, examining how land coverchanges over time can provide a better understanding of the potential future impacts facing thewatershed. Note that each land cover category both lost and gained acreage from 1992 to 2001. Forexample, one farm that allows its lands to revert to a more natural vegetative state would result in theloss of agricultural land within the watershed, while one farm that converts forest to agriculture wouldresult in the gain of agricultural land within the watershed. The resulting net acres of change is acombination of these losses and gains. Table 12 provides a summary of the acres lost, acres gained,and net change for each category.
Open Waterall areas of open water, generally with less than 25 percent cover or vegetation or soilcomprise this cover type
Agriculture
this represents areas of grasses, legumes, or grass-legume mixtures planted for livestockgrazing or the production of seed or hay crops, typically on a perennial cycle, as well asareas used for the production of annual crops, such as corn, soybeans, vegetables,tobacco, and cotton, and also perennial woody crops such as orchards and vineyards.Pasture/hay or area crop vegetation accounts for greater than 20 percent of totalvegetation
Urban
this represents all developed areas, from high intensity areas where people reside or workin high numbers, to open areas with a mixture of some constructed materials andvegetation in the form of lawn grasses and impervious surfaces less than 20 percent oftotal cover
Barren Landbarren areas of bedrock, desert pavement, scarps, talus, slides, volcanic material, glacialdebris, sand dunes, strip mines, gravel pits and other accumulations of earthen material.Generally, vegetation accounts for less than 15 percent of total cover
Forest all areas dominated by trees generally greater than 5 meters tall, and greater than 20percent of total vegetation cover comprise this cover type
Grassland/Shrub
this includes areas dominated by shrubs; less than 5 meters tall with shrub canopytypically greater than 20 percent of total vegetation, including true shrubs, young trees inan early successional stage or trees stunted from environmental conditions. This categoryalso includes areas dominated by grammanoid or herbaceous vegetation, generally greaterthan 80% of total vegetation. These areas are not subject to intensive management suchas tilling, but can be utilized for grazing
Wetlands
areas where forest or shrub land vegetation accounts for greater than 20 percent ofvegetative cover, or where perennial herbaceous vegetation accounts for greater than 80percent of vegetative cover, and the soil or substrate is periodically saturated with orcovered with water
BLACK RIVER WATERSHED MANAGEMENT PLAN
CHARACTERIZATION REPORT
Page 14THEACADEMYOF NATURALSCIENCES
THEACADEMYOF NATURALSCIENCES
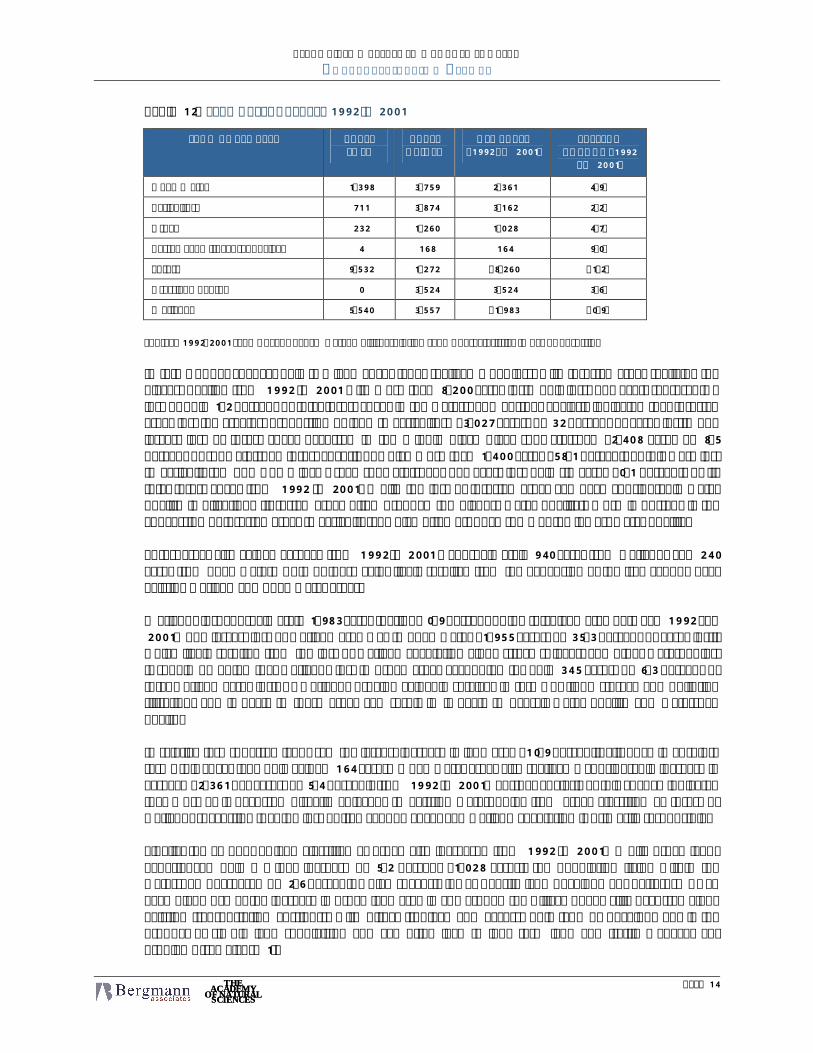
Table 12. Land Cover Change, 1992 to 2001
LAND COVER TYPE ACRESLOST
ACRESGAINED
NET ACRES(1992 TO 2001)
PRESENTCHANGE (1992
TO 2001)
Open Water 1,398 3,759 2,361 4.9%
Agriculture 711 3,874 3,162 2.2%
Urban 232 1,260 1,028 4.7%
Barren Land (rock, sand, clay) 4 168 164 9.0%
Forest 9,532 1,272 -8,260 -1.2%
Grassland / Shrub 0 3,524 3,524 3.6%
Wetlands 5,540 3,557 -1,983 -0.9%
Source: 1992-2001 Land Cover Change Data, Multi-Resolution Land Characteristics (MRLC) Consortium
In terms of net change, only two land cover types realized a net loss, with forested areas realizing thebiggest decline from 1992 to 2001 with more than 8,200 acres lost. This loss, however, represents aloss of only 1.2 percent of total forest cover in the watershed. Further analysis indicated that forestedareas lost the greatest proportion of land to agriculture (3,027 acres, or 32 percent of acres lost). Thelargest loss of forest cover occurred in the Middle Black River subwatershed (2,408 acres or 8.5percent of subwatershed forest cover), of which more than 1,400 acres (58.1 percent) of this were lostto agriculture. The Cummings Creek subwatershed, however, lost only six acres (0.1 percent) of itstotal forest cover from 1992 to 2001. While the loss of forested areas can have considerable waterquality implications (forested areas often produce the highest water quality), more important is theconversion of forested areas to agriculture, which often produce some of the lowest water quality.
Forest areas also gained acreage from 1992 to 2001 – approximately 940 acres from wetlands and 240acres from open water. Both of these gains likely resulted from the expansion of the tree canopy overexisting wetland and open water areas.
Wetlands lost approximately 1,983 acres (net), or 0.9 percent of the total land area between 1992 and2001. The largest loss of wetland area was to open water (1,955 acres, or 35.3 percent of acres lost),which likely resulted from the loss of wetland vegetation along streams, lakes, and other waterbodies.It should be noted that wetlands lost to urban areas accounted for only 345 acres, or 6.3 percent oftotal wetland acres lost. As wetlands provide valuable services in terms of flood storage and pollutionfiltration, any impacts to these areas can result in impacts to overall water quality and watershedhealth.
In relative terms, barren lands saw the largest increase in land area (10.9 percent), although in absoluteterms this cover type only gained 164 acres. Open water areas also realized a considerable increase inacreage (2,361 net acres, or 5.4 percent) from 1992 to 2001. Further analysis of this change indicatedthat most of it occurred directly adjacent to existing waterbodies from areas classified as forest orwetland, suggesting that the loss of tree canopy cover and wetland vegetation is primarily responsible.
Finally, the amount of land classified as urban also increased from 1992 to 2001. While urban landsexperienced only a minor increase of 5.2 percent (1,028 acres), the population living within thewatershed decreased by 2.6 percent, which suggests lower density land development patterns. As anexample, much of the increase in urban land area in and around the Village of Lowville occurred alongexisting transportation corridors, with direct frontage and access. This type of development is theproduct of simple land subdivision and can often lead to long term land and traffic managementproblems (see Figure 1).
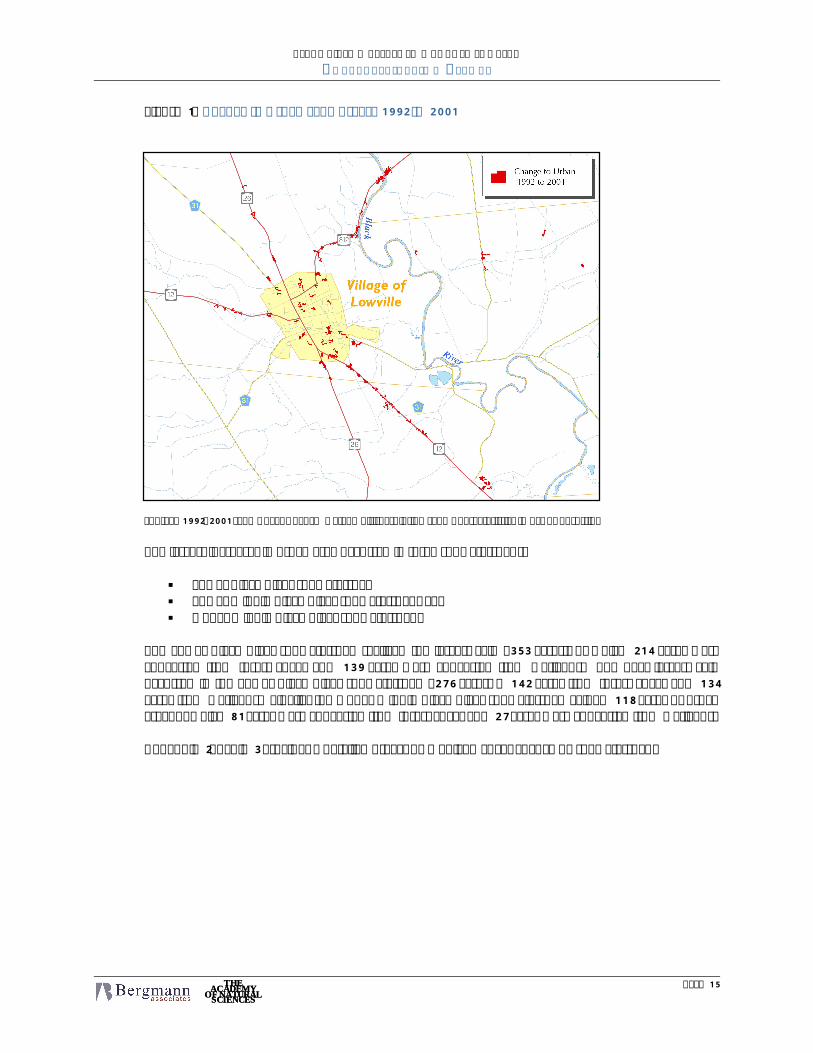
BLACK RIVER WATERSHED MANAGEMENT PLAN
CHARACTERIZATION REPORT
Page 15THEACADEMYOF NATURALSCIENCES
THEACADEMYOF NATURALSCIENCES
Figure 1. Change to Urban Land Areas, 1992 to 2001
Source: 1992-2001 Land Cover Change Data, Multi-Resolution Land Characteristics (MRLC) Consortium
The largest increases in urban area occurred in three subwatersheds:
Lower Black River subwatershedLower Middle Black River subwatershed; andUpper Middle Black River subwatershed.
The Lower Black River subwatershed realized the largest gain (353 acres), of which 214 acres wereconverted from forest cover and 139 acres were converted from wetlands. The next largest gainoccurred in the Lower Black River subwatershed (276 acres) – 142 acres from forest cover and 134acres from wetlands. Finally, the Upper Middle Black River subwatershed gained 118 acres of urbanarea, of which 81 acres were converted from forest cover and 27 acres were converted from wetlands.
Appendix 2, Table 3 provides a detailed breakdown of land cover change by subwatershed.
BLACK RIVER WATERSHED MANAGEMENT PLAN
CHARACTERIZATION REPORT
Page 16THEACADEMYOF NATURALSCIENCES
THEACADEMYOF NATURALSCIENCES
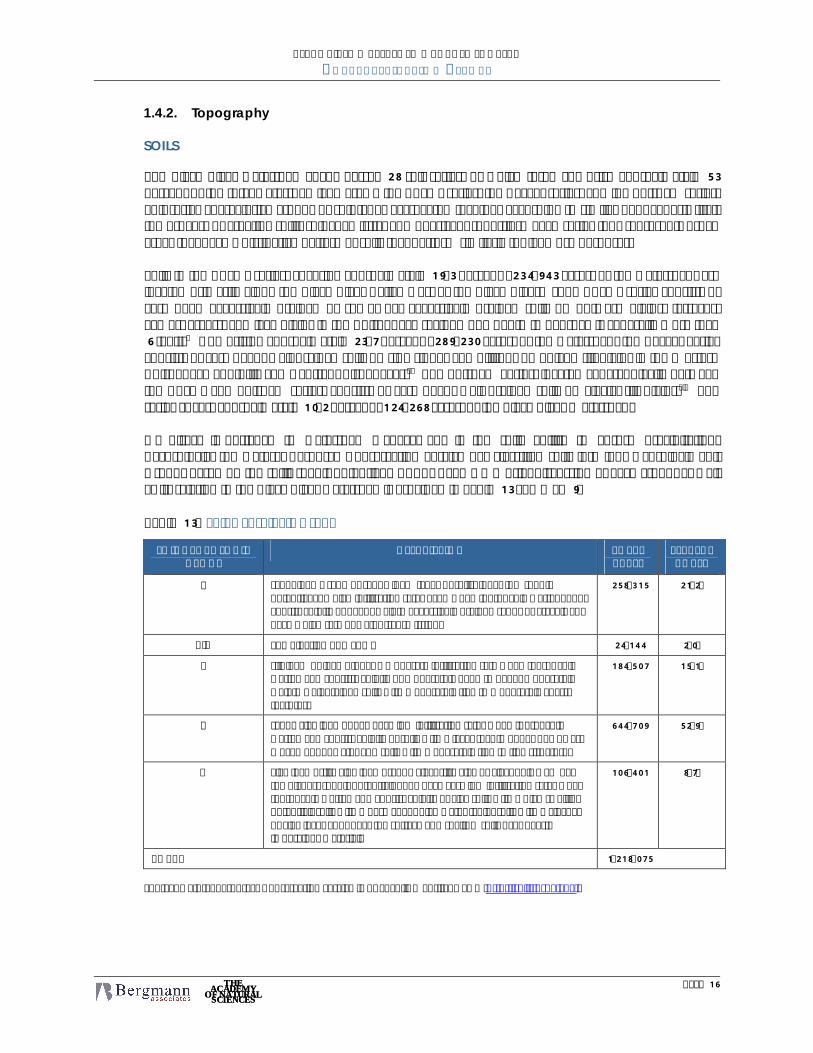
1.4.2. Topography
SOILS
The Black River watershed encompasses 28 soil series, of which three comprise approximately 53percent of the total watershed land area – the Adams series, the Becket series, and the Potsdam series.Soil series characterize groups of soil types aggregated together according to similar pedogenesis (i.e.,the process of creating soil), soil chemistry, and physical properties. Each series thus represents broadareas that have a distinctive pattern of soils that perform similarly for land use purposes.
Soils in the Adams series, covering approximately 19.3 percent (234,943 acres) of the watershed, arelocated primarily along the Black River Valley west of the Black River. “The Adams series consists ofvery deep excessively drained or somewhat excessively drained soils on outwash plains, terraces,kames, eskers, and lake plains in the Adirondack region. The depth to bedrock is generally more than6 feet.”x Comprising approximately 23.7 percent (289,230 acres) of the watershed, the Becket Seriesconsists of very deep, well drained soils on side slopes and hilltops on upland till plains in the WesternAdirondack Foothills and Central Adirondacks.xi The Potsdam Series, located geographically betweenthe Adams and Potsdam series, consists of very deep, well drained soils on glacial till plains.xii Theseries covers approximately 10.2 percent (124,268 acres) of the Black River Watershed.
Of direct importance to watershed management is the soils ability to absorb precipitation.Accordingly, the Natural Resource Conservation Service has classified soils into four Hydrologic SoilGroups based on the soil's runoff potential – A, B, C, and D. A brief discussion of each group, as wellas its relation to the Black River watershed is provided in Table 13 and Map 9.
Table 13. Soil Hydrologic Group
SOIL HYDROLOGICGROUP
DESCRIPTION TOTALACRES
PERCENTCOVER
A sand, loamy sand or sandy loam types of soils. It has low runoffpotential and high infiltration rates even when thoroughly wetted. Theyconsist chiefly of deep, well to excessively drained sands or gravels andhave a high rate of water transmission.
258,315 21.2%
A/D combination of A and D 24,144 2.0%
B silt loam or loam. It has a moderate infiltration rate when thoroughlywetted and consists chiefly or moderately deep to deep, moderatelywell to well drained soils with moderately fine to moderately coarsetextures.
184,507 15.1%
C sandy clay loam. They have low infiltration rates when thoroughlywetted and consist chiefly of soils with a layer that impedes downwardmovement of water and soils with moderately fine to fine structure.
644,709 52.9%
D clay loam, silty clay loam, sandy clay, silty clay or clay. This HSG hasthe highest runoff potential. They have very low infiltration rates whenthoroughly wetted and consist chiefly of clay soils with a high swellingpotential, soils with a permanent high water table, soils with a claypanor clay layer at or near the surface and shallow soils over nearlyimpervious material.
106,401 8.7%
TOTAL 1,218,075
Source: Natural Resources Conservation Service (NRCS) Soils Website, USDA (http://soils.usda.gov/)

BLACK RIVER WATERSHED MANAGEMENT PLAN
CHARACTERIZATION REPORT
Page 17THEACADEMYOF NATURALSCIENCES
THEACADEMYOF NATURALSCIENCES
ELEVATIONS
The Black River watershed comprises a wide range of topographies, from generally flat and rolling hillsto steep slopes and rocky outcroppings (see Map 10). Elevations within the watershed range fromapproximately 246 feet above mean sea level to 3,771 feet above mean sea level, with the meanelevation approximating 1,534 feet above mean sea level. Maximum, minimum, and mean elevationsfor each of the 19 subwatersheds are presented in Table 14.
Table 14. Elevations
ELEVATION (feet)SUBWATERSHED
MINIMUM MAXIMUM MEAN
Beaver Creek 720 2,271 349
Crystal Creek 724 1,367 1,034
Cummings Creek 1,021 1,877 1,415
Deer River 720 1,986 1,592
Fish Creek 741 1,662 1,300
Independence River 728 2,351 1,594
Lower Black River 246 1,101 515
Lower Black Middle River 529 1,250 807
Middle Black River 718 1,701 921
Middle Branch Moose River 1,496 2,929 1,918
Mill Creek 727 1,982 1,414
Moose River 799 2,245 1,458
Otter Creek 731 2,355 1,531
South Branch Moose River 1,496 3,771 2,161
Stillwater Reservoir 1,656 2,829 1,894
Sugar River 910 2,032 1,482
Upper Middle Black River 730 2,113 1,310
Upper Black River 1,040 2,704 1,649
Woodhull Creek 1,127 2,404 1,689
BLACK RIVER WATERSHED 246 3,771 1,534
Source: Digital Elevation Models, U.S. Geological Survey
In terms of watershed protection, steep slopes can affect water quality as these areas have a greatertendency for erosion than more gently sloping areas. As is depicted on Map 11, most areas comprisingsteep slopes are located within the Adirondack Park Blue Line, in Hamilton and Herkimer Counties. Asmaller area of steep slopes also occurs towards the upper reaches of the Black River, in the vicinity ofLyons Falls, as the river valley narrows towards the southern portion of Lewis County.
BLACK RIVER WATERSHED MANAGEMENT PLAN
CHARACTERIZATION REPORT
Page 18THEACADEMYOF NATURALSCIENCES
THEACADEMYOF NATURALSCIENCES
1.4.3. Hydrology
CLIMATE
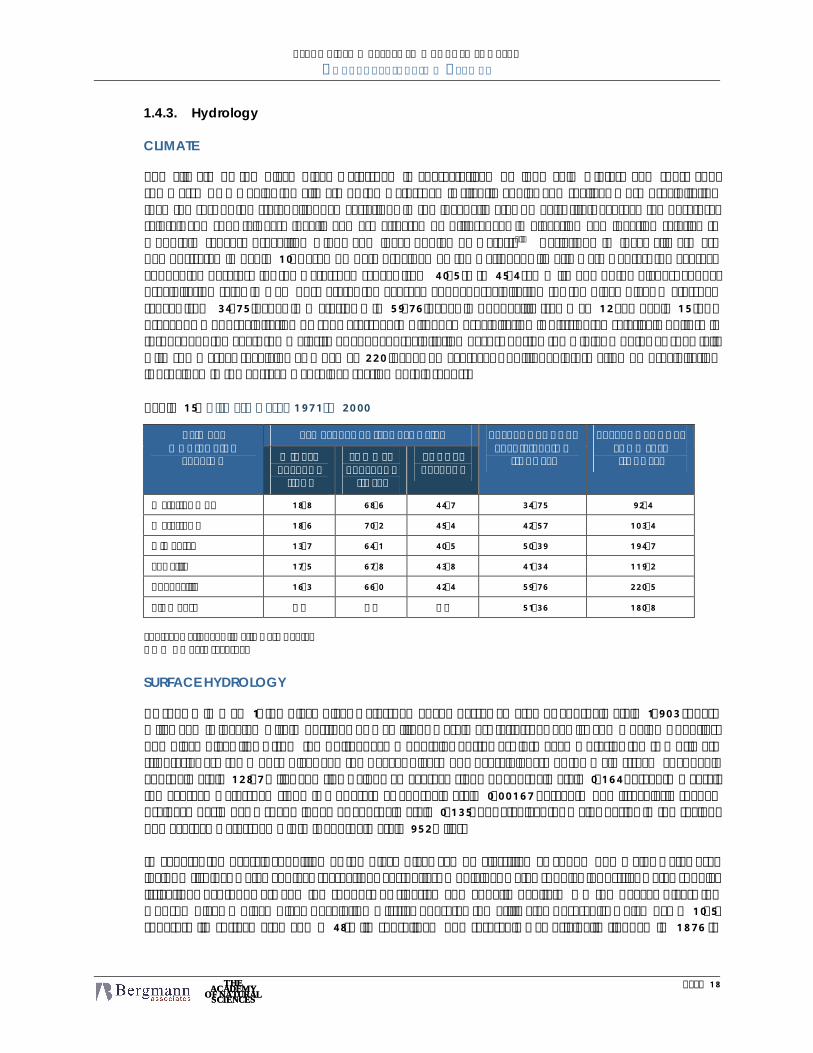
The climate of the Black River watershed is characterized by long cold winters and short coolsummers. As a whole, the climate of the watershed is slightly cooler and realizes more precipitationthan the rest of the state, although variations in the local climates do exist (i.e., average temperature,rainfall and snowfall vary locally and are affected by differences in elevation and location relative tomountain ranges, prevailing wind, and local bodies of water).xiii Variations in local climate aredemonstrated in Table 10. Based on data provided by the National Climatic Data Center, the averageannual temperature for the watershed ranges from 40.5 °F to 45.4 °F. With one of the highest annualprecipitation rates in New York State, the average annual precipitation for the Black River Watershedranges from 34.75 inches in Watertown to 59.76 inches in Booneville (see Map 12 and Table 15 for abreakdown of precipitation by subwatershed). Although precipitation is distributed relatively uniformlythroughout the year, the majority of annual precipitation occurs during the winter months as snowfall,with some areas receiving as much as 220 inches on average. Additional information on precipitationis provided in the Surface Hydrology section of this report.
Table 15. Climate Data, 1971 to 2000
TEMPERATURE (FAHRENHEIT)CLIMATEMONITORING
STATION WINTERAVERAGE
(JAN)
SUMMERAVAERAGE
(JULY)
ANNUALAVERAGE
AVERAGE ANNUALPRECIPITATION
(INCHES)
AVERAGE ANNUALSNOWFALL(INCHES)
Watertown AP 18.8 68.6 44.7 34.75 92.4
Watertown 18.6 70.2 45.4 42.57 103.4
Old Forge 13.7 64.1 40.5 50.39 194.7
Lowville 17.5 67.8 43.8 41.34 119.2
Bonneville 16.3 66.0 42.4 59.76 220.5
Big Moose NA NA NA 51.36 180.8
Source: National Climatic Data CenterNA = No data recorded
SURFACE HYDROLOGY
As shown in Map 1, the Black River watershed encompasses an area of approximately 1,903 squaremiles and is located within portions of Hamilton, Herkimer, Jefferson, Lewis, and Oneida Counties.The Black River flows from the Adirondack Mountains northwest into Lake Ontario; the two primarytributaries are the Moose River and the Beaver River. The overall length of the main stream channel isapproximately 128.7 miles and flows along an average slope of approximately 0.164 percent. Overallthe average watershed slope is moderate at approximately 0.00167 percent. The irregularly shapeddrainage basin has a shape index of approximately 0.135, not atypical for major basins in the region.The average watershed width is approximately 952 miles.
In general the overall condition of the Black River can be classified as good. The major water usesinclude fishing, water contact recreation, aesthetics, municipal water supply, industrial water supply,irrigation, hydropower, and the support of riparian and aquatic habitat. On the Beaver River, theHudson River – Black River Regulating District operates the Stillwater Reservoir, which has a 10.5-square-mile surface area and a 48-mile shoreline. The reservoir was originally flooded in 1876 to

BLACK RIVER WATERSHED MANAGEMENT PLAN
CHARACTERIZATION REPORT
Page 19THEACADEMYOF NATURALSCIENCES
THEACADEMYOF NATURALSCIENCES
facilitate the logging industry by allowing logs to be floated down the Beaver River. Currently, theprimary purpose of the reservoir is flood control for the Black River valley.On the Moose River, the Regulating District operates the Fulton Chain of Lakes via dams at Old Forgeand Sixth Lake. The combined storage capacity of these reservoirs is over forty billion gallons.Together, this network of dams and reservoirs has greatly reduced flooding and remains the source ofwater flow integral to the hydroelectric generating projects and industrial operations in Jefferson,Lewis, and Herkimer Counties. The Regulating District also owns and maintains a dam at Hawkinsvilleon the Black River in Oneida County. Other significant hydropower projects on the Black Riverinclude those operated by Brookfield Renewable Power at Beebee Island, Niagara Mohawk PowerCorporation in Jefferson County, and Black River Limited Partnership in Lewis County.
Table 16. Average Annual Precipitation by Subwatershed
SUBWATERSHED AVERAGE ANNUALPRECIPITATION (inches)
Beaver Creek 43.5
Crystal Creek 42.0
Cummings Creek 53.3
Deer River 56.3
Fish Creek 45.0
Independence River 45.0
Lower Black River 38.0
Lower Black Middle River 42.4
Middle Black River 41.4
Middle Branch Moose River 48.2
Mill Creek 52.6
Moose River 45.1
Otter Creek 45.0
South Branch Moose River 53.4
Stillwater Reservoir 46.2
Sugar River 55.7
Upper Middle Black River 50.9
Upper Black River 55.0
Woodhull Creek 55.0
BLACK RIVER WATERSHED 48.7
Source: NYS Average Annual Precipitation GIS Data Layer, Spatial ClimateAnalysis Service, Oregon State University; USDA - NRCS National Waterand Climate Center
As shown in Map 12 and Table 16, mean annual precipitation across the watershed ranges from a highof 65 inches to a low of 35 inches. The low of 35 inches is limited to a very small portion of thewatershed downstream from Watertown. The high of 65 inches actually occurs at two differentlocations. One location is near the eastern-most watershed boundary in Hamilton County and theother location is near the watershed boundary southwest of Lowville in Lewis County. The aerialdistribution of the precipitation is a function of the topographic relief and the general eastward-to-northeastward movement of storms. The watershed has a fairly uniform distribution of precipitationduring the year, with no distinct rainy or dry season.
BLACK RIVER WATERSHED MANAGEMENT PLAN
CHARACTERIZATION REPORT
Page 20THEACADEMYOF NATURALSCIENCES
THEACADEMYOF NATURALSCIENCES
At the subwatershed level, the mean annual precipitation varies from a low of 38.0 inches in theLower Black River to a high of 56.3 inches in Deer River. The mean annual precipitation exceeds 50inches in a total of eight of the subwatersheds, including Cummings Creek, Deer River, Mill Creek,South Branch Moose River, Sugar River, Upper Middle Black River, Upper Black River, and WoodhullCreek. The eight subwatersheds encompass some 46 percent of the total watershed area.
The average annual snowfall over much of the watershed exceeds 100 inches. Each year, at leastsome of the snowpack remains unmelted in mid-March. At that time, as much as 10 inches ofequivalent rainfall can lie stored in the snowpack. Thus, the greatest potential for flooding occursduring the spring, when substantial, relatively warm rains can cause rapid snow melting and producesignificant runoff. As such, nearly half of the average annual runoff occurs from mid-February throughmid-May. More local flooding generally occurs from summer thunderstorms in the smaller drainagecatchments.
Table 17 summarizes the maximum known discharge and recurrence interval for six locations acrossthe watershed according to data compiled and reported by the USGS. The drainage areas at the sixlocations range from 1.66 square miles to a maximum of 1,864 square miles. The maximum dischargeranges from 312 cubic feet per second up to 55,500 cubic feet per second. The recurrence intervalsrange from 50 years to more than 500 years.
Table 17. Discharge and Recurrence Intervals
LOCATION COUNTY DRAINAGEAREA
RECORDPERIOD
DATE DISCHARGE RECURRENCEINTERVAL
Black River nearBoonville
Oneida 304 1911-2007 04-18-82 12,800 >50
Moose River atMcKeever
Herkimer 363 1902-1970
1985-2007
06-03-47 18,700 >100
Independence River atDonnattsburg
Lewis 88.7 1928-2007 12-30-84 9,420 >100
Beaver River atCroghan
Lewis 291 1930-2007 05-21-69 5,100 50
Deer River at DeerRiver
Lewis 94.8 1930-1999 12-29-84 17,200 100
Black River atWatertown
Jefferson 1,864 1921-2007 01-10-98 55,500 >500
Throughout the twentieth century, the Black River watershed has experienced a number of significantflood events, most notably in 1969, 1982, 1984, and 1998. The flood of June 3, 1947 on the MooseRiver at McKeever was the result of a dam failure. From other rather limited historic information, asignificant flood event also occurred on April 23, 1869. On that date, a maximum discharge of 39,700cubic feet per second was reached on the Black River at Watertown. This discharge has a recurrenceinterval of approximately twenty-five years. It is interesting to note that significant floods haveoccurred within the watershed before detailed measurements were taken and systematic records werekept.

BLACK RIVER WATERSHED MANAGEMENT PLAN
CHARACTERIZATION REPORT
Page 21THEACADEMYOF NATURALSCIENCES
THEACADEMYOF NATURALSCIENCES
Table 18. Discharges for Selected Recurrence Intervals
LOCATION 2-YEAR 10-YEAR 25-YEAR 50-YEAR 100-YEAR 500-YEAR
Black River near Boonville 5,720 9,030 10,900 12,500 14,100 18,400
Moose River at McKeever 7,600 11,600 13,600 15,200 16,800 20,800
Independence River atDonnattsburg
2,090 3,780 4,880 5,820 6,880 9,890
Deer River at Deer River 5,420 9,850 12,600 14,800 17,200 23,700
Black River at Watertown 21,700 31,500 36,600 40,500 44,800 54,500
Table 18 presents the peak discharges in cubic feet per second at six locations for selected recurrenceintervals. It should be noted that peak flood stage may be affected by ice cover, ice jams, debris, andother obstructions in the affected channel. For any given recurrence interval, the discharge per unitarea is highly variable. For example, the unit discharge for the 2-year flood varies from approximately10 cubic feet per second to more than 57 cubic feet per second per square mile. Likewise, the unitdischarge for the 100-year flood varies from approximately 23 to more than 180 cubic feet per secondper square mile. The smaller runoff rates apply to the lower, downstream portion of the watershed,while the highest rates generally apply to the uppermost portions of the watershed as they are subjectto higher amounts of rainfall and snowfall.
Based on a preliminary analysis of data from water years 1920 through 2007, the annual mean flow ofthe Black River at Watertown is approximately 4,212 cubic feet per second. This is equivalent toapproximately 30.7 inches of runoff annually. The highest annual mean of 6,392 cubic feet persecond is from the 1976 water year, which is more than 51 percent greater than the long term annualmean. The smallest annual mean flow of 2,579 cubic feet per second is from the 1931 water year andis nearly 39 percent less than the long term annual mean. Thus, it is evident that considerablevariability exists in the annual mean flow from year to year. The annual seven-day minimum flow is637 cubic feet per second, recorded on August 15, 1923. Similar statistics are available for otherselected locations in the watershed. Preliminary estimates of the annual mean flow at the mouth ofeach subwatershed is summarized in Table 19.

BLACK RIVER WATERSHED MANAGEMENT PLAN
CHARACTERIZATION REPORT
Page 22THEACADEMYOF NATURALSCIENCES
THEACADEMYOF NATURALSCIENCES
Table 19. Annual Mean Flow
SUBWATERSHED SIZE(in acres)
ANNUAL MEAN FLOW(cubic feet per second)
Beaver River 98,761 350
Crystal Creek 17,085 60
Cummings Creek 14,212 50
Deer River 62,270 220
Fish Creek 14,966 53
Independence River 61,074 216
Lower Black River 39,532 140
Lower Middle Black River 51,985 184
Middle Black River 8,153 29
Middle Branch Moose River 94,880 335
Mill Creek 22,512 80
Moose River 46,711 165
Otter Creek 42,181 149
South Branch Moose River 135,713 479
Stillwater Reservoir 109,992 388
Sugar River 44,732 158
Upper Middle Black River 102,016 360
Upper Black River 115,439 408
Woodhull Creek 62,661 221
It should be noted that the New York State Canal Corporation exercises the right to withdraw all but80 cubic feet per second from the Black River in Oneida County. The limit is intended to protect thedownstream fishery. The water is withdrawn from the Alder Pond Reservoir and transported via theForestport Feeder Canal into the Erie Canal during the navigation season from May 1 throughNovember 1. Because less depth is required during the non-navigation season, the allowablewithdrawal is all but 140 cubic feet per second. Thus, during that non-navigation season, thewithdrawals are 60 cubic feet per second smaller that they are during the navigations season.
STEEP SLOPES
As a rule, steep slopes are more erosive than flatter slopes. In considering erosive potential, slopesgreater than 8 percent are considered to be steep; slopes greater than 15 percent are considered to bevery steep. Table 20 summarizes the relative presence of steep slopes within the subwatersheds (alsosee Map 11). Note that the areas of steep slopes presented in Table 20 do not include areas ofexposed bedrock. Slightly less than one third of the entire Black River watershed has steep slopes. Thesubwatersheds having the most steep slopes include Middle Branch Moose River, South Branch MooseRiver, and Stillwater Reservoir, all situated along the easternmost portion of the watershed. Thereforeit could be identified that these three subwatersheds have the most erosion potential. Conversely, thesubwatersheds with the fewest steep slopes include Deer River, Lower Black River, Lower MiddleBlack River, Middle Black River, and Mill Creek. These five subwatersheds have the least erosionpotential.
BLACK RIVER WATERSHED MANAGEMENT PLAN
CHARACTERIZATION REPORT
Page 23THEACADEMYOF NATURALSCIENCES
THEACADEMYOF NATURALSCIENCES
Table 20. Steep Slopes
STEEP SLOPES
SUBWATERSHED SIZE (acres)8 TO 15 PERCENT
(acres)> 15 PERCENT
(acres)STEEP SLOPE
TOTALS (acres)
PERCENT OFSUBWATERSHED
Beaver River 98,761 20,271 14,486 34,757 35.2
Crystal Creek 17,085 3,569 1,720 5,289 31.0
Cummings Creek 14,212 2,520 1,462 3,982 28.0
Deer River 62,270 5,012 1,904 6,916 11.1
Fish Creek 14,966 2,098 1,190 3,288 22.0
Independence River 61,074 12,539 10,458 22,998 37.7
Lower Black River 39,532 2,821 1,903 4,725 12.0
Lower Middle Black River 51,985 4,256 2,363 6,619 12.7
Middle Black River 81,353 8,398 3,009 11,407 14.0
Middle Branch Moose River 94,880 18,017 24,407 42,424 44.7
Mill Creek 22,512 2,151 668 2,819 12.5
Moose River 46,711 7,799 5,015 12,814 27.4
Otter Creek 42,181 8,818 7,324 16,141 38.3
South Branch Moose River 135,713 27,526 37,234 64,760 47.7
Stillwater Reservoir 109,992 22,374 25,818 48,192 43.8
Sugar River 44,732 6,142 2,215 8,357 18.7
Upper Middle Black River 102,016 13,970 10,174 24,143 23.7
Upper Black River 115,439 21,790 16,489 38,279 33.2
Woodhull Creek 62,661 12,500 7,978 20,478 32.7
BLACK RIVER WATERSHED 1,218,075 202,571 175,817 378,388 31.1
Source: Digital Elevation Models, U.S. Geological Survey
WETLANDS
Wetlands, defined in terms of their physical geography, are those areas located at the interfacebetween terrestrial and aquatic ecosystems and comprise a wide range of hydrologic and vegetativeconditions. Generally, wetland hydrology varies from periodically to permanently inundated, orsaturated to the soil surface for a certain time period during the growing season. Wetland vegetation ispredominantly comprised of species that are tolerant of anaerobic soil conditions resulting frominundation (i.e., hydrophytes) and includes both woody and non-woody plants.

BLACK RIVER WATERSHED MANAGEMENT PLAN
CHARACTERIZATION REPORT
Page 24THEACADEMYOF NATURALSCIENCES
THEACADEMYOF NATURALSCIENCES
In addition to providing food and habitat for a wide range of plant and animal species, wetlands alsocontribute to water quality. By impeding drainage flow from developed land, wetlands can filter outpollutant- and sediment-laden run-off prior to it entering streams, thus improving water quality. xiv
Riparian wetlands located along streams and rivers also provide valuable flood protection, acting asstorage basins and reducing the amount of downstream flow. This temporary storage of water resultsin decreased runoff velocities, reduced flood peaks, and delayed distribution of stormflows, all whichcause tributaries and main channels to peak at different times.xv In some instances it has been foundthat wetlands provide more cost-effective flood control than man-made measures such as reservoirs ordikes.xvi
To ensure consistency throughout this analysis, MLRC land cover (2001) data was used to determinethe amount of wetlands present in the Black River watershed, as well as the 19 subwatersheds (seeMap 13). This data set provides coverage information for two wetland classifications:
Woody Wetlands – areas where forest or shrubland vegetation accounts for 25 to 100 percentof the cover and the soil or substrate is periodically saturated with or covered with water; andEmergent Herbaceous Wetlands – areas where perennial herbaceous vegetation (e.g., grasses,sedges) accounts for 75 to 100 percent of the cover and the soil or substrate is periodicallysaturated with or covered with water.
As is indicated in Table 21, approximately 17 percent (212,319 acres) of the Black River watershedcomprises wetland habitats, of which the majority are forested (95.5 percent, or 202,869 acres).Within the Black River watershed, three subwatersheds comprise less than 10 percent of their totalland area in wetlands:
Mill Creek subwatershed – 4.5 percent (1,012 acres)Sugar River subwatershed – 7.1 percent (3,156 acres)Crystal Creek subwatershed – 7.8 percent (1,333 acres)
At the opposite extreme, the Deer River subwatershed contains approximately 17,090 acres ofwetlands, or 27.4 percent of its total land area. Many of these wetland areas are located in the upperreaches of the watershed, away from the agricultural and urban development associated with the BlackRiver valley. Four additional subwatersheds also comprise more than 20 percent of their total landarea in wetlands (these four subwatersheds are located predominately within the Adirondack Park):
Stillwater Reservoir subwatershed – 24.5 percent (26,918 acres)Middle Branch Moose River subwatershed – 24.0 percent (22,728 acres)Independence River subwatershed – 23.8 percent (14,517 acres)Woodhull Creek subwatershed – 21.7 percent (13,626 acres)
BLACK RIVER WATERSHED MANAGEMENT PLAN
CHARACTERIZATION REPORT
Page 25THEACADEMYOF NATURALSCIENCES
THEACADEMYOF NATURALSCIENCES
Table 21. Wetland Habitats
WETLAND ACRESSUBWATERSHED TOTAL ACRES
FORESTED EMERGENT TOTAL
WETLANDPERCENT COVER
Beaver Creek 98,761 14,309 365 14,674 14.9%
Crystal Creek 17,085 1,312 21 1,333 7.8%
Cummings Creek 14,212 2,481 10 2,491 17.5%
Deer River 62,270 16,544 546 17,090 27.4%
Fish Creek 14,966 2,119 10 2,129 14.2%
Independence River 61,074 14,012 505 14,517 23.8%
Lower Black River 39,532 4,346 391 4,737 12.0%
Lower Black Middle River 51,985 7,049 804 7,853 15.1%
Middle Black River 81,353 9,094 724 9,818 12.1%
Middle Branch Moose River 94,880 21,654 1,074 22,728 24.0%
Mill Creek 22,512 1,001 11 1,012 4.5%
Moose River 46,711 6,184 157 6,341 13.6%
Otter Creek 42,181 5,688 105 5,793 13.7%
South Branch Moose River 135,713 23,469 796 24,625 17.9%
Stillwater Reservoir 109,992 24,496 2,422 26,918 24.5%
Sugar River 44,732 3,101 55 3,156 7.1%
Upper Middle Black River 102,016 11,377 431 11,808 11.6%
Upper Black River 115,439 21,249 781 22,030 19.1%
Woodhull Creek 62,661 13,384 242 13,626 21.7%
BLACK RIVER WATERSHED 1,218,075 202,869 9,450 212,319 17.4%
Source: 2001 National Land Cover Data, Multi-Resolution Land Characteristics (MRLC) Consortium
FLOODPLAINS
Flooding, a natural and recurring event, results from heavy or continuous rainfall that exceeds the soil’sabsorptive capacity and the flow capacity of rivers and streams.xvii Once these capacities are exceeded(usually every 1 to 3 years), the waterway overflows its banks and spills into adjacent low-lying areas.Floodplains are these adjacent low-lying areas that are most subject to recurring inundation.
In terms of water quality and watershed management, floodplains provide a number of communalbenefits and, as experience has shown, can be far more effective than many man-made structures(e.g., floodwalls, stream channelization) in reducing downstream flood peaks. First, floodplainsprovide flood and erosion control by storing and slowly releasing floodwaters, thus reducing the depthand velocity of flooding. Floodplain vegetation can also positively impact water quality, trappingsediments and capturing pollutants before they are carried off downstream. Floodplains also providegroundwater recharge by storing floodwaters and promoting aquifer infiltration.
Floods, and floodplains, are generally defined according to their statistical frequency of occurrence.For example, a “100-year floodplain” is an area that is subject to a one percent or greater chance offlooding in any given year. Depending on the degree of risk desired for a given analysis, any otherstatistical frequency of a flood event may be selectedxviii For the purposes of this analysis, 100-year and500-year floodplains were evaluated.
BLACK RIVER WATERSHED MANAGEMENT PLAN
CHARACTERIZATION REPORT
Page 26THEACADEMYOF NATURALSCIENCES
THEACADEMYOF NATURALSCIENCES
To determine the locations of floodplains within the Black River watershed, Flood Insurance RateMaps (FIRMs) were acquired from the Federal Emergency Management Agency (FEMA) for the three ofthe five counties traversed by the watershed – Herkimer, Jefferson, and Lewis (see Map 14). At thistime FEMA has not yet created FIRMs for the majority of Lewis or Hamilton Counties and the data thatdoes exist is not in digital format; thus, floodplains were not mapped for these two counties.
GROUNDWATER
Groundwater is often a much misunderstood resource. It provides a source for drinking water to one-quarter of New Yorkers and half of all Americans. Groundwater may be found nearly everywhere onthe planet at depths ranging from near or at the surface to very deep below the surface. When rainfalls to the ground, some of it runs off down slope into streams, lakes, and other bodies of water.Some of the water is taken up by plants and some of it becomes caught in puddles and evaporates.The remaining water, however, seeps into the ground through the underlying soil material. As watercontinues its downward journey through the unsaturated zone (ie. the upper part of the soil layer thatdoes not completely fill with water), the water moves through the interconnected spaces between thesoil particles or through the fissures in rock until it reaches the saturated zone, located below the watertable, where it becomes groundwater.
An aquifer is a geologic formation or stratum containing groundwater in its void spaces and pores thatmay be removed economically and used as a source of water supply. Generally, two types of aquifersexist –confined and unconfined aquifers. Confined aquifers are those groundwater storage areassandwiched between two layers of impermeable materials (e.g., clay) that impede the flow of waterinto and out of the aquifer. These aquifers are also known as artesian aquifers. Unconfined aquifers,however, do not possess an upper confining layer and are instead bounded by the water table. Assuch, these types of aquifers, especially those located near the surface, are particularly vulnerable tocontamination.xix
As shown in Map 15, aquifers are distributed across the watershed and occur to some degree in eachsubwatershed. Table 22 summarizes the extent of both confined and unconfined aquifers within eachsubwatershed. It is interesting to note that the single confined aquifer is roughly rectangular in shape.It is just over a mile wide and extends approximately 16 miles underneath the Black River channel andfloodplain, predominantly in portions of the Middle Black River and Upper Middle Black Riversubwatersheds.

BLACK RIVER WATERSHED MANAGEMENT PLAN
CHARACTERIZATION REPORT
Page 27THEACADEMYOF NATURALSCIENCES
THEACADEMYOF NATURALSCIENCES
Table 22. Aquifers
SUBWATERSHED CONFINEDAQUIFERS(in acres)
UNCONFINEDAQUIFERS(in acres)
Beaver River 144 55,132
Crystal Creek 217 14,040
Cummings Creek - 11,192
Deer River - 4,949
Fish Creek - 10,415
Independence River 17 39,326
Lower Black River - 8,119
Lower Middle Black River - 17,572
Middle Black River 6,943 22,204
Middle Branch Moose River - 32,812
Mill Creek 63 3,856
Moose River - 28,712
Otter Creek - 25,719
South Branch Moose River - 47,758
Stillwater Reservoir - 31,203
Sugar River - 10,936
Upper Middle Black River - 43,903
Upper Black River - 35,121
Woodhull Creek - 32,539
Total Black River 11,143 475,508
Source: Unconsolidated Aquifers GIS Data Layer, NYSDEC
Generally, the more productive aquifers consist of unconsolidated deposits of sands and gravels thatoccupy the larger river valleys or lake plains and terraces. Groundwater in these aquifers occurs underwater-table (unconfined) or under artesian (confined) conditions. Municipalities, industries, farms, andindividuals historically have built over these aquifers as they typically form relatively flat areas that aresuitable for development and often offer an ample supply of groundwater. Such development,coupled with the relatively high permeability of the alluvial deposits (i.e., soil or sediments depositedby a river or other running water) and the shallow depth to the water table, makes these aquifershighly susceptible to contamination from point sources of pollution such as landfills and petroleumstorage tanks, as well as nonpoint sources of pollution from both urban and agricultural land uses.
Bedrock formations may also provide a significant source of groundwater supply and are typically lesssusceptible to contamination. Bedrock aquifers generally are deeper than their confined/unconfinedcounterparts and, therefore, may require more energy to remove groundwater. Moreover, the moreproductive aquifers tend to be the more shallow alluvial deposits underlying streams, rivers,floodplains, and lake plains and terraces. These aquifers generally are capable of producing from 10 to100 or more gallons of water per minute. As shown, the aquifers occupy approximately 486,651 acresor 40 percent of the total watershed area.

BLACK RIVER WATERSHED MANAGEMENT PLAN
CHARACTERIZATION REPORT
Page 28THEACADEMYOF NATURALSCIENCES
THEACADEMYOF NATURALSCIENCES
WATER SUPPLY
Traditionally, water supply has come from two primary sources – surface water and groundwater. Interms of surface water, the New York State Water Quality Standards Program, administered by theNYSDEC, is responsible for classifying surface waters for their best use, including water supply,swimming, boating, fishing, and shellfishing. Specific to water supply, both Class A and Class AA arepotentially suitable for municipal water supply. Class A and AA waters are those waters that canprovide a source of water supply for drinking, culinary or food processing purposes, primary andsecondary contact recreation, and fishing. Map 16 depicts the NYSDEC use classifications for surfacestreams, while the lengths of streams designated as Class A and Class AA are summarized bysubwatershed in Table 23.
It should be noted that not all of the subwatersheds contain streams classified as Class A or Class AA.The Middle Branch Moose River subwatershed, with 75.2 miles, by far has the most miles of streamdesignated as Class A and Class AA. The Upper Black River subwatershed has 14.1 miles, the nexthighest length of Class A or Class AA streams. These subwatersheds may be suitable for municipalwater supply. The Middle Black River, Mill Creek, and Otter Creek subwatersheds have no Class A orClass AA streams. The Black River watershed as a whole contains 114.7 miles of Class A streams and31.8 miles of Class AA streams.
Table 23. Class A and AA Streams
SUBWATERSHED CLASS A STREAMS(miles)
CLASS AA STREAMS(miles)
TOTALS(miles)
PERCENT OF ALLSTREAMS
Beaver River - 2.2 2.2 0.7%
Crystal Creek 0.9 2.4 3.3 7.4%
Cummings Creek 3.9 - 3.9 7.4%
Deer River 5.7 - 5.7 2.3%
Fish Creek 3.7 - 3.7 7.1%
Independence River 1.3 1.1 2.4 1.2%
Lower Black River 4.0 - 4.0 3.9%
Lower Middle Black River 2.2 - 2.2 2.0%
Middle Black River - - - -
Middle Branch Moose River 65.5 9.7 75.2 21.7%
Mill Creek - - - -
Moose River - 2.4 2.4 1.4%
Otter Creek - - - -
South Branch Moose River 7.3 - 7.3 1.3%
Stillwater Reservoir 4.8 0.01 4.8 1.2%
Sugar River 1.2 0.5 1.7 1.0%
Upper Middle Black River - 10.8 10.8 3.2%
Upper Black River 11.6 2.5 14.1 3.8%
Woodhull Creek 2.5 - 2.5 1.1%
Total Black River 114.7 31.8 146.5 3.6%
Source: Water Quality Classifications GIS Data Layer, NYSDEC
BLACK RIVER WATERSHED MANAGEMENT PLAN
CHARACTERIZATION REPORT
Page 29THEACADEMYOF NATURALSCIENCES
THEACADEMYOF NATURALSCIENCES
Depending upon a number of factors, including both water quantity and water quality, other streamsalso may be suitable for municipal water supply. For example, streams that are not too polluted andhave sufficient flows may be suitable for municipal water supply.
Map 18 depicts the assigned use classification for the other surface water bodies in the watershed.Class A designates suitability for municipal water supply. A total of 130.5 acres of water bodies in thewatershed are designated Class A, of which 112.0 acres occur in the Independence Riversubwatershed and 18.5 acres occur in the Middle Branch Moose River subwatershed.
Groundwater is also a significant source of water supply in the watershed. Much of the withdrawalscurrently are in the unconsolidated alluvial aquifers situated along the river valleys which are capableof producing from 10 to 100 or more gallons per minute.
A potential, rather non-traditional source of future water supply is stormwater reuse. Known as thebeneficial use of stormwater, reuse consists of storing stormwater runoff for future uses, such aslandscape irrigation, firefighting, aesthetics, recreation, or other grey water uses (grey water is definedas non-industrial wastewater from domestic processes such as dish washing, laundry, and bathing).Grey water may be used for any non-potable use. Typically, stormwater is stored in lakes and ponds,tanks, cisterns, rain barrels, or some combination of facilities.
1.4.4. Natural Resources
ECOZONES AND VEGETATION
The Black River watershed is located in the rural and remote North Country region of New York Stateand is situated east of Lake Ontario between the Tug Hill Plateau and the Adirondack Mountains.Covering more than 10,000 square miles, this heavily forested region exhibits a variety of ecologicalconditions related to differences in climate, topography, dominant vegetation, land cover, soil,geology, and hydrology. These regional differences have been classified into distinct ecological zones(ecozones); the Black River watershed encompasses seven ecozones (there are 25 recognized zones innorthern New York) – the Black River Valley, Central Adirondacks, Central Tug Hill, Eastern OntarioPlain, Tug Hill Transition, Western Adirondack Foothills, and the Western Adirondack Transition (seeMap 18).xx
Black River ValleyThis zone consists of low-elevation lands along the floodplain of the Black River and the lower portionsof its tributaries. Much of the valley is underlain by limestone. Limestone terraces are well-developedalong the western side of the valley.xxi A number of rare plant species occur in limestone fens in thisvicinity. The igneous rocks which form the Adirondacks occur along the river channel and much of theeastern side of the valley. Parts of the valley have thick sand deposits formed as glacial outwash. Thevalley is characterized by its intensive agricultural use, in contrast to abandoned and second-growthagricultural areas of the Tug Hill Transition zone to the west and the Adirondack Transition zone to theeast. xxii Much of the Lower Black River, Lower Middle Black River, Upper Middle Black River, andSugar and Mill Creek subwatersheds are in this zone, as well as lower portions of the Deer River,Crystal Creek, Beaver River, and Moose River subwatersheds.
Central AdirondacksThis zone consists of portions of the Adirondack Mountains and the associated valley areas. The areaconsists of various coniferous communities at higher elevations and mixed forests at lower elevations.The area is also characterized by numerous lakes, ponds, and wetlands. The igneous bedrock of thezone leads to low soil fertility and contributes to the formation of acidic bog communities. The highproportion of public ownership in this area is one of its defining characteristics. xxiii In the Black River

BLACK RIVER WATERSHED MANAGEMENT PLAN
CHARACTERIZATION REPORT
Page 30THEACADEMYOF NATURALSCIENCES
THEACADEMYOF NATURALSCIENCES
basin, most of the Stillwater, Middle Branch Moose River, South Branch Moose River and Upper BlackRiver subwatersheds are in this zone, as well as upper portions of the Independence, Otter, andWoodhull Creek drainages. Several biotic communities are characteristic of higher-elevation areas inthe Adirondacks (i.e., above approximately 3,000 feet). The Black River basin has little area of thesehigher elevations, with small areas on Little Moose Mountain within the South Branch Moose Riversubwatershed and Wakeley Mountain (elevation 3,760 feet) at the boundary between the Black River(South Branch Moose River) and Raquette River drainages.
Central Tug HillThe Tug Hill Plateau, formed of sandstones over shale, ranges from approximately 1,500 to 1,900 feetin elevation. The plateau is characterized by high snowfall. The flat terrain and relatively impermeablesoils lead to extensive wetland areas. The basic forest vegetation of the plateau is mixed hardwoodsand conifers. The plateau also supports agriculture. Much of the plateau drains to the west and southof the Black River basin, but the upper Deer River also lies within the plateau. The headwaters ofseveral creeks in the Middle Black River subwatershed (e.g., Whetstone Creek and Roaring Creek) andof Sugar Creek also reach the central plateau.
Eastern Ontario Plain (subtype of the Great Lakes plain)In the Black River basin, virtually all areas in this zone are in the Lower Black River subwatershed. Thiszone consists of low elevations over limestone bedrock along the Lake Ontario shore. While hardwoodforests historically covered much of this area, it now contains large amounts of agricultural land, largelyas pastures for the dairy industry. Grasslands and shrublands support several rare species, such asHenslow’s sparrow and loggerhead shrike. The Lower Black River subwatershed also includes theprimary urban area in the basin – Watertown and its surrounding communities. The underlyinglimestone bedrock supports unusual communities, such as limestone pavement communities (alvars), aglobally-rare group of communities formed on flat areas of exposed, cracked limestone bedrock. Alvarcommunities occur around Lake Ontario, with one site known within the basin containing calcareouslimestone barrens and limestone woodlands. The limestone bedrock also contains caves that supportseveral rare bat species. The mouth of the Black River, along with Black River Bay, is considered asignificant waterfowl conservation area because of its importance as a wintering area.
Tug Hill TransitionThis zone consists of areas along the edges of the Tug Hill Plateau. Many of its climatic and ecologicalcharacteristics are intermediate between those of the Central Tug Hill Plateau and adjacent zones(Lake Ontario Plains and Black River Valley). However, erosion of ravines (e.g., Whetsone Gulf, DeerRiver gorge) by creeks are characteristic of the transition zone. These gulfs support a variety of unusualcommunities, such as those associated with wet cliff-faces, talus slopes, and ravine bottoms.
Western Adirondack FoothillsThis zone consists of lower, more rolling hills along the western edge of the Adirondacks. Although itdoes not contain the high elevation communities of the central Adirondacks, it supports many similarcommunities, as well as extensive areas of northern hardwood forests. In the Black River basin, most ofthe Woodhull, Otter, Independence, Moose, Fish, Cummings, and Beaver subwatersheds are in thiszone, as well as substantial parts of the Upper Black River, South Branch Moose River, and MiddleBranch Moose River subwatersheds.
Western Adirondack TransitionThis zone forms a narrow band between the Western Adirondack Foothills and Black River Valley andis transitional between these zones. This zone is characterized by sandy, low-nutrient soils, ultimatelyderived from glacial outwash deposits. In the Black River valley, much of this area consists ofabandoned agricultural areas (i.e., “sand farms”). Many of these areas were actively reforested with amix of pine species after acquisition by the state. Extensive parts of the Upper Black River and Crystal

BLACK RIVER WATERSHED MANAGEMENT PLAN
CHARACTERIZATION REPORT
Page 31THEACADEMYOF NATURALSCIENCES
THEACADEMYOF NATURALSCIENCES
Creek subwatersheds are in this zone, as well as parts of all the lower east bank tributaries of the BlackRiver (i.e., Beaver, Fish, Independence, Cummings, Moose, Otter and Woodhull subwatersheds).
The NYSDEC has also developed a classification system for biotic communities based on plant andanimal occurrences, which are correlated with local environmental conditions. Communities aredefined for terrestrial habitats, palustrine habitats (largely wetland and riparian areas), and lacustrine(lake) and riverine habitats. Some of these communities cover large areas, while others typically occurin small areas of appropriate conditions. For example, much of the basin was originally covered innorthern hardwood forests (i.e., beech [Fagus grandifolia] and sugar maple [Acer saccharum] are typicaldominants) and coniferous forests (spruce [Picea spp.] and balsam fir [Abies balsamea] are typicaldominants), with a number of other communities in wetlands, floodplains, outwash plains, cliffs andother local habitats. Communities include a variety of natural successional stages, as well as human-maintained communities such as agricultural, suburban, and industrial areas. Some communities, suchas the northern hardwood forest, occur in appropriate habitats throughout the basin, while others aretypically small, uncommon, and limited to different parts of the basin. The New York Heritage Programmaps certain of these ecological communities, many of which support unusual flora and fauna.
FISH AND WILDLIFE
Fish Occurrences
Much of the information regarding historical fish occurrence in the Black River drainage basin is theresult of extensive sampling conducted in 1932.xxiv Subsequent sampling has been done by theNYSDEC, Cornell University, the American Museum of Natural History, and the Adirondack LakeSurvey Corporation (ALSC). In particular, in 2007, NYSDEC completed a review of fishes of thedrainage based on new sampling and a review of historic data.xxv
As the Black River drainage was glaciated as recently as 8,000 to 10,000 years agoxxvi, fish occurrenceis related to both opportunities for colonization and by local habitat and water quality characteristics.The early colonization of basin waterbodies resulted from two general routes. The first route was ofmainly northern fishes that were able to move from glacial refugia to formerly glaciated areas by way ofpost-glacial lakes and drainage patterns that no longer exist. This group includes coldwater species likelake trout (Salvelinus namaycush), which has been restricted to cold lakes, as well as species like brooktrout , which eventually occurred in appropriate habitats throughout the drainage. The second route ofcolonization is characterized by upriver movements from Lake Ontario. This route opened later andmany species were blocked by upstream barriers. As a result, a number of species historically occurredmainly below Watertown or a little farther upstream. Several species that are found in Lake Ontario(including Black River Bay) have not been recorded in the river. Forty-two native species have beentabulated in the drainage upstream of the mouth, plus seven species found only at the mouth(Greeley). All of these were collected in recent sampling, although two species (American eel [Anguillarostrata] and finescale dace [Phoxinus neogaeus]) were captured in such small numbers that they wereconsidered essentially extirpated (Carlson). In addition to species found only near the mouth of theriver, a number of other native species were captured at or otherwise known from only a few sites:
Grass pickerel (Esox americanus vermicultatus);Brassy minnow (Hybognathus hankinsoni);Eastern silvery minnow (H. regius);Blacknose shiner (Notropis heterolepis);Mimic shiner (Notropis volucellus);Stonecat (Noturus flavus);Johnny darter (Etheostoma nigrum);Logperch (Percina caprodes);

BLACK RIVER WATERSHED MANAGEMENT PLAN
CHARACTERIZATION REPORT
Page 32THEACADEMYOF NATURALSCIENCES
THEACADEMYOF NATURALSCIENCES
Round whitefish (Prosopium cylindraceum); andSummer sucker (Catostomus utuwana).
Two additional native species were discovered in the recent sampling.
The opening of the Black River Canal provided an additional path for immigration of fish from theMohawk drainage into the Black River upstream of Watertown. At least one species, the satinfin shiner(Cyprinella analostana), probably entered the drainage via the canal. In addition, a number of specieshave been introduced into the drainage, many of which are native to New York. Some of these arefound downstream in the Lake Ontario drainage, (e.g., lake whitefish [Coregonus clupeiformis],hornyhead chub [Nocomis biguttatus], green sunfish [Lepomis cyanellus]), while others are found in theMohawk Drainage, as well as many mid-Atlantic drainages (e.g., margined madtom [Noturus insignis]).Others are exotic to the region, such as brown trout (Salmo trutta) and common carp (Cyprinus carpio),which are native to Europe, and the rainbow trout (Oncorhynchus mykiss), sockeye salmon (O. nerka)and chinook salmon (O. tshawytscha), which are native to western North America. Additionally, manyspecies have been introduced upstream of barriers into parts of the drainage where they were notnative (e.g., the Atlantic salmon [Salmo salar], central mudminnow [Umbra limi], fallfish [Semotiluscorporalis], northern hog sucker [Hypentelium nigricans], channel catfish [ctalurus punctatus], bandedkillifish [Fundulus diaphanous], bluegill [Lepomis macrochirus], black crappie [Pomoxis nigromaculatus],and walleye [Sander vitreum]). The native range of some sport species in the drainage, such as chainpickerel (Esox niger), smallmouth bass (Micropterus dolomieu), and largemouth bass (M. salmoides), ispoorly known. Many of these species were introduced as sport species, while others may have beenintroduced as bait bucket releases. Some species, such as fallfish (Semotilus corporalis) and walleye(Sander vitreum) are now relatively common in the main stem of the Black River.
Introductions of fish species have had major effects on lakes. Many lakes originally contained a fishfauna that included brook trout (Salvelinus fontinalis), suckers (Catostomus spp.), slimy sculpin (Cottuscognatus), and various species of minnow such as northern redbelly dace (Chrosomus eos) . Speciessuch as yellow perch (Perca flavescens), pumpkinseed [check] (Lepomis gibbosus), golden shiner(Notemigonus crysoleucas) and smallmouth bass (Micropterus dolomieu) are now common in manylakes, with decreases in the abundance of the formerly-common species. Walleye, largemouth bass,rainbow smelt (Osmerus mordax), and northern pike have also been widely introduced into lakes inthe drainage basin.
Appendix 2, Table 24 provides a breakdown of fish records by subwatershed. Many of these arecoincident with the subwatersheds used in this plan, although subwatersheds within the Moose River(Middle Branch, South Branch, and Moose) subwatersheds were not broken out and different divisionsof the main Black River drainage were used. These records depict 32 and 45 species in the two lowerreaches of the Black River, 25 to 35 species in the larger, more-heavily sampled subwatersheds(Beaver, Moose, Mill, and Deer), and 11 to 18 species in smaller, less-heavily sampled subwatersheds.Few or no samples were taken in the Stillwater Reservoir, Fish Creek, and Cummings Creeksubwatersheds.
The Lower Black River subwatershed is notable for occurrence of species not found upstream ofDexter or Watertown, such as sea lamprey (Petromyzon marinus), lake sturgeon (Acipenser fulvescens),longnose gar (Lepisosteus osseus), bowfin (Amia calva), gizzard shad (Dorosoma cepedianum), quillback(Carpiodes carpio), white perch (Morone americana), sockeye salmon, and chinook salmon. As notedabove, many species once restricted to the lower part of the drainage are now more widelydistributed. Philomel Creek, a tributary of the Black River located in the Lower Black Riversubwatershed, has characteristics similar to other Lake Ontario streams and contains, or did containspecies several rare species such as brassy minnow and finescale dace.
BLACK RIVER WATERSHED MANAGEMENT PLAN
CHARACTERIZATION REPORT
Page 33THEACADEMYOF NATURALSCIENCES
THEACADEMYOF NATURALSCIENCES
The Black River from Lyons Falls to Carthage, located in the Lower Middle, Middle, and Upper MiddleBlack River subwatersheds, provides low gradient riverine habitat for a number of species. In addition,swamps, wetlands, and ditches within the floodplain of the river provide spawning and nursery areasfor chain pickerel, northern pike, and probably burbot (Lota lota). Within the overall Black River basin,the common carp and spottail shiner Notropis hudsonius) are found primarily in the main stem. Theburbot occurs in the Black River and associated tributary mouths; burbot have also been reported nearthe mouth of the Black River. Walleye and smallmouth bass are important recreational species. Chainpickerel and northern pike have fluctuated in relative abundance, with chain pickerel more commonin recent surveys.xxvii The eastern silvery minnow has also been recorded only in the Black River (aboveCarthage and below Dexter), and the satinfin shiner occurs mainly in the Black River and lower partsof tributaries.
A few species were found only or mainly in streams draining the Tug Hill Plateau (e.g., in Deer River,Mill Creek, and Sugar Creek). These include blacknose shiner (found at one site in Deer Creek andknown from other Tug Hill tributaries outside the Black River drainage), pearl dace (Margariscusmargarita), and redside dace (Clinostomus elongatus).
Several species, such as fathead minnow (Pimephales promelas), bluntnose minnow (P. notatus),tesselated darter (Etheostoma olmstedi), brown bullhead (Amieurus nebulosus), and longnose dace(Rhinichthys cataractae) are found mainly in small streams at lower elvevations, which would includetributaries of the various Black River subwatersheds, as well as the lower parts of most of the othersubwatersheds. The tesselated darter and longnose may occur at moderate elevations (e.g., greaterthan 1,500 feet).
A variety of species are widespread in areas of the Adirondacks not impacted by acidification or flowregulation. These include brook trout (Salvelinus fontinalis), brown trout (which has replaced brooktrout in many areas), cutlip minnow (Exoglossum maxillingua), common shiner (Luxilus cornutus), andcreek chub (Semotilus atromaculatus). The longnose sucker (Catostomus catostomus) is a coldwaterspecies that was widespread in the Adirondacks and other streams in the drainage. It is less commonnow, although it occurs in the Adirondacks and a few other streams. The lake chub (Couesiusplumbeus) was also widespread in the Adirondacks, although recent records are mainly from theUpper Black River and Woodhull Creek subwatersheds. The lake chub is less sensitive to acidificationthan many other species.
Many shallow ponds and lake shallows contain species similar to their associated river and streamsystems. These areas, however, have been heavily affected by the introduction of sport and otherspecies and by acidification. The lake trout (Salvelinus nemaycush) typically occurs in deep, cold lakesin the region. It is still found in many lakes, though populations in some areas are sustained byhatchery supplementation. The round whitefish was known in more lakes in the Black River watershedthan any other New York watershed. Currently, Little Moose Lake has a native population and roundwhitefish have been introduced into four other lakes. A heritage (i.e., native) strain of brook trout wasidentified in Horn Lake. Genetic analyses of brook trout in other areas may reveal other sites withheritage strains. The NYSDEC has developed an initiative to identify, protect, and manage brook troutstains in the state. Other local races of brook trout may have been extirpated or swamped byhybridization with stocked trout.
Reptiles and Amphibians
New York State conducted a herpetological atlas project that mapped reptile and amphibian presenceon topographic maps coincident with USGS 7.5' topographic sheets. Occurrence of species within theBlack River drainage can be determined from these maps, although the precise occurrence of speciesin or near the boundaries of the drainage cannot be distinguished.
BLACK RIVER WATERSHED MANAGEMENT PLAN
CHARACTERIZATION REPORT
Page 34THEACADEMYOF NATURALSCIENCES
THEACADEMYOF NATURALSCIENCES
A few species occur throughout the drainage – redback salamander (Plethodon cinereus), green frog(Rana clamitans), bullfrog (Rana catesbiana), spring peeper (Hyla crucifer), American toad (Bufoamericanus), and common garter snake (Thamnophis sirtalis). Among the remaining fish species thereexists a general elevational gradient of occurrence in the Black River drainage basin. A number ofspecies, such as the chorus frog, northern water snake (Nerodia sipedon), brown snake (Storeriadekayi), smooth green snake (Opheodrys vernalis), and eastern milk snake (Lampropeltus triangulumtriangulum) occur primarily in lower areas along the Black River. The northern dusky salamander(Desmognathus fuscus), mountain dusky salamander (D. ochrophaeus), and mink frog (Ranaseptentrionalis) occur mainly at higher elevations in the Adirondacks or on the Tug Hill Plateau. Themink frog is a northern species that is found in Canada, northern New England, the Adirondacks, andthe Tug Hill Plateau. It occurs on the edge of the Black River drainage on the Tug Hill Plateau andthere are records of the mink frog in several blocks in the eastern part of the drainage.
Several species of frog and salamander breed in shallow ponds. Survival is highest in ponds without fishand in vernal ponds, which are dry for much of the year and provide important habitats for thesespecies. Recruitment from ponds with fish is much lower. Due to the greater area of ponds with fish,however, these ponds can contribute significantly to the maintenance of these species. Tadpoles ofgreen frog and bull frog are apparently distasteful to fish and these species occur commonly in streamsand lakes with fish.
Mammals
Local faunal information on mammals was obtained from The Mammals of the Tug Hill Plateau, NewYork and Adirondack Mammals.xxviii, xxix State harvest records also provide information on sport and furspecies.xxx As with most of the faunal groups, mammal distributions reflect ecological conditionsshaped by climate, geology and topography, and modified by existing land use and vegetationalsuccession from former land uses. Many species of mammals were locally extirpated and currentdistribution reflects the dynamics of recolonization. The abundance and distribution of some species,such as moose (Alces alces) and fisher, continues to change.
Resulting from intensive fur trapping efforts, beaver (Castor canadensis) was extirpated through most ofthe northeastern United States. By 1640, beavers were extirpated from virtually all of New YorkState.xxxi In 1900, a few beaver occurred in the Adirondacks outside of the Black River drainage.Beavers were re-introduced to several locations from 1902 to 1910, including areas around the Fultonlakes, Big Moose Lake and the South Branch of the Moose River. In response to reintroduction efforts,beavers have expanded into the entire drainage basin. Beaver trapping was reinstated in 1924 and theharvest has generally increased since, with large fluctuations in catch. Beaver have major effects onvegetation and aquatic habitats; beaver dams increase shallow pond habitats and may affectsedimentation and channel erosion. As a result, the extirpation and re-introduction of beavers is likelyto have had major effects on other organisms. Moose, for example, was extirpated from the state bythe middle of the 19th Century. From 1935 to 1980, there were occasional records of moose in theAdirondacks, presumably of individuals wandering from populations in Canada and New England.With the increase in the beaver population, more moose habitat has been created within the basin,which has potentially resulted in an ever increasing moose population (moose have been recorded at anumber of sites in Hamilton, Herkimer, and Lewis Counties).
White-tailed deer (Odocoileus virginianus) are found throughout the drainage and deer hunting is beeneconomically important to the region. Deer populations increased along with early successionalvegetation in the Adirondacks following logging of mature forests. This increase, combined with rarityor extirpation of deer outside the Adirondacks, made the area famous as a deer hunting destination.Up to about 1970, deer harvest rates (i.e., the number of deer taken per square mile) were higherinside the Adirondacks than out. Since then, maturation of forests has decreased deer populations

BLACK RIVER WATERSHED MANAGEMENT PLAN
CHARACTERIZATION REPORT
Page 35THEACADEMYOF NATURALSCIENCES
THEACADEMYOF NATURALSCIENCES
within the Adirondacks, while populations outside have increased due to deer management, land use,and possibly climate change. Recent deer harvests (1986 to 2000), however, have been greater outsidethe park than within. Despite the increase in deer harvest in Jefferson and Lewis Counties, harvestrates are still lower than those in the southern part of the state.xxxii
Historically within the basin, carnivorous mammals were killed for fur and to reduce losses of livestockand game species. Mountain lion and gray wolf were last recorded in New York in 1894 and 1899,respectively. Fisher and marten were reduced to small areas in the central Adirondacks and the specieswere provided State protection in the 1930's. Since then, both species have increased in numbers.While the fisher prefers extensive areas of forest, it can use a variety of forest types and has expandedwidely in southern Canada, New York, and New England. Coyotes have also expanded into thenortheast, becoming established in northern New York by about 1950 and now widely established inthe region.
As with most of the faunal groups, there are differences in distribution of mammals between the lowerelevations (Black River valley) and higher elevations (Tug Hill Plateau and Adirondacks). For example,the opossum, gray fox, southern flying squirrel, gray squirrel, and Eastern cottontail occur primarily atlower elevations. The first two of these are relatively recent immigrants to the region. In addition tosome of the mammals discussed above, bobcat, water shrew, northern flying squirrel, and rock voleoccur primarily at higher elevations.
Birds
Breeding bird surveys were conducted from 1980 to 1985 and from 2000 to 2005, providing recentstatus and trend information.xxxiii The breeding bird surveys are conducted by volunteers in relativelysmall blocks. Occurrence in blocks is classified as confirmed, probable, or possible. Each block surveyis not exhaustive, with more rare species potentially not being detected. The surveys supplementextensive general and regional studies of species present in the drainage. Additional information onwintering birds is available from Christmas Bird Counts. As with many groups, the distribution ofbreeding birds follows the general zonation of the region, ranging from the river mouth and Black Rivervalley through to the Central Adirondacks and Tug Hill Plateau. These distributional patterns reflectboth climatic and topographic variation, as well as current land uses. Agricultural areas, primarilylocated in the Black River valley, now support a variety of open country birds.
Several general distributional patterns of breeding bird populations can be identified within the BlackRiver drainage basin. Approximately 20 species are found throughout the drainage, includingcommon, resident woodland birds (e.g., Downy woodpecker, Black-capped chickadee, White-breasted nuthatch, Blue jay, summer residents of deciduous forests (e.g., Red-eyed vireo), Scarlettanager, Rose-breasted grosbeak, least flycatcher, and several species of warblers), and commoneastern birds such as the Eastern robin, Common yellowthroat, and Song sparrow. An additional 20species may breed only or mainly near the mouth of the Black River, most of which are marsh-breeders (pied-billed grebe, several herons, Canada goose, ducks, coots, rail, and marsh wren). Blue-winged, golden-winged and prairie warblers prefer low, open woods and shrublands. Severalpredominately southern species, such as red-bellied woodpecker, Eastern mockingbird, and orchardoriole, occur along the edge of Lake Ontario; the range of these species has expanded northward andthese species may have colonized the drainage relatively recently. Due to the narrowness of the BlackRiver drainage at its mouth, it’s possible that many of species may breed just outside the drainage (e.g.,in marshes around Black River Bay).
Approximately 25 species of birds breed primarily along the Black River valley from its mouthupstream. Most of these species are typical of agricultural areas, grasslands, savannahs, and earlysuccessional habitats. This group includes hawks (e.g., Northern harrier, Red-tailed hawk), several
BLACK RIVER WATERSHED MANAGEMENT PLAN
CHARACTERIZATION REPORT
Page 36THEACADEMYOF NATURALSCIENCES
THEACADEMYOF NATURALSCIENCES
swallows, several sparrows, killdeer, Eastern bluebird, horned lark, bobolink, Eastern meadowlark, andbrown-headed cowbird. An additional 20 to 25 species occur frequently throughout much of thewestern part of the drainage (including much of the Black River valley and Tug Hill Plateau), but areuncommon to rare in the eastern part of the drainage. Some of these species may be absent frommuch of the Adirondacks, while others may be absent only from the eastern-most part of the drainage.
In contrast to these groups found mainly in the western or lower elevation portions of the drainage,many species are widespread in the Adirondacks and Tug Hill Plateau and much less frequent orabsent in the Black River mouth and valley. Most of these species (e.g., winter wren , Swainsonsthrush, brown creeper, red-breasted nuthatch, and several species of warblers) are typical of northern,coniferous woods. A few (e.g., parula warbler and broad-winged hawk) occur in wooded areasthroughout the eastern US. Another group of northern species occur almost entirely in theAdirondacks, including some waterbirds (e.g., Ring-necked duck). This group also includes borealspecies, which occur only in the higher mountains of New England and in the Adirondacks. Because oftheir limited range in the region, apparent declines in several species, and likely sensitivity to climatechange, these species are of considerable conservation interest. Several of these are classified asSpecies of Special Concern in New York State (see below for a more detailed discussion ofendangered, threatened, and rare species). This group includes the spruce grouse, gray jay, borealchickadee, black-backed woodpecker, three-toed woodpecker, Bicknell’s thrush, blackpoll warbler,and rusty blackbird. New York State has designated an Adirondack Sub-alpine Forest BirdConservation Area (BCA), comprising Adirondack peaks over 2,800 feet in elevation with dense(stunted or early successional) balsam fir and/or red spruce vegetation, to sustain Adirondackpopulations of the Bicknell’s thrush, as well as Swainson’s thrush and Blackpoll warbler. WakelyMountain, on the edge of the Black River drainage, is specifically included in this area. The status ofother potentially qualifying sites in the drainage (e.g., Big Moose Mountain) that are not specificallylisted is unclear. The main goal of the BCA is to sustain the wilderness quality of these areas, providesuitable habitat for the bird species of concern, and facilitate recreation where it is compatible with theaforementioned objectives. Some known areas for the boreal birds in the Black River basin areincluded in New York State forests, such as the Moose River Plains.
A few species share different distributional patterns than those previously discussed. Several species(e.g., white-throated sparrow, pine wabler, northern waterthrush, and mourning warbler) occurprimarily on the Tug Hill Plateau and within the central Black River valley and parts of the AdirondacksTransition zone (the white-throated sparrow breeds in the Adirondacks, as well).This pattern mayreflect preferences of these species for early successional thickets, woods, and pine forests. Thesehabitats may be most common in abandoned agricultural areas and pine reforestation areas in thecentral part of the drainage basin.
Breeding records of Yellow-throated vireo and Goshawk occur mainly on the Tug Hill Plateau. Threespecies of ducks (Common merganser, American black duck, and wood duck) were recorded mainlynear the mouth of the river and in the Adironacks, presumably reflecting occurrence of suitableriverine and pond habitats. A number of other species were recorded only a few times (oftenunconfirmed breeding records), so definitive statements about distribution cannot be made.
ENDANGERED, THREATENED, AND RARE SPECIES
To ensure the continued viability of certain species of fish, wildlife, and plants, federal and state lawshave been enacted that identify and manage species threatened with extinction. In New York State,these species are classified as either endangered, threatened, or species of special concern:
Endangered species include “any species of fish, shellfish, crustacea, wildlife or plantdesignated by NYSDEC that are native species in imminent danger of extirpation or

BLACK RIVER WATERSHED MANAGEMENT PLAN
CHARACTERIZATION REPORT
Page 37THEACADEMYOF NATURALSCIENCES
THEACADEMYOF NATURALSCIENCES
extinction in New York; or are listed as endangered by the USFWS in 50 C.F.R. §§ 17.11-17.12”.xxxiv
Threatened species include “any fish, shellfish, crustacea, wildlife or plant species that arenative species likely to become an endangered species within the foreseeable future inNY; or are listed as threatened by the USFWS in 50 C.F.R. Part 17.11-17.12”.xxxv
Species of Special Concern are those species that “warrant attention and considerationbut current information, collected by the department, does not justify listing these speciesas either endangered or threatened”.xxxvi
Notes on some of the endangered, threatened, and species of special concern are included below.
Endangered Species
Round Whitefish (Prosopium cylindraceum). The round whitefish has endangered status in New YorkState. The round whitefish has been extirpated from many lakes in the watershed. A native populationoccurs in Little Moose Lake, and the species has been introduced into four other lakes.
Short-eared owl (Asio flammeusi). The short-eared owl is endangered in New York. The breeding birdatlas shows one site for short-eared owl, probably just outside the Black River drainage. The Heritagedatabase shows one site in the Lower Black River subwatershed.
Golden eagle. The golden eagle has endangered status in New York State, although it is consideredextirpated as a breeding bird in the State. The last known nesting area was in the Black River drainage.
Black tern.The black tern is endangered in New York State. Black terns breed in marshes aroundeastern Lake Ontario. Black River Bay is listed as a site for the species, but the Black River drainage isnot considered habitat for the species.
Indiana Bat (Myotis sodalist). The Indiana bat is endangered in New York State. Although knowledgeof its distribution is limited, data provided by the NYS Natural Heritage Program identifies four sites inthe Lower Black River subwatershed.
Loggerhead shrike (Lanius ludovicianus). The loggerhead shrike is endangered in New York State.There are records of the loggerhead shrike in the Lower Black River and Upper Middle Black Riversubwatersheds of the drainage. The loggerhead shrike occurs in grasslands or fields with some shrubsor in open shrublands. The decrease of the shrike in the Northeastern United States has beenattributed to the loss of grasslands and early successional habitats and more intensive farming practiceswhich decrease shrubby cover near agricultural areas. No loggerhead shrikes were reported within thedrainage in the latest breeding bird survey.
Threatened Species
Lake sturgeon (Acipenser fulvescens). The lake sturgeon is threatened in New York State. The lakesturgeon occurs in the mouth of the Black River up to the Dexter Dam. The Black River was aspawning site for lake sturgeon, and recent observations of sturgeon in rapids in the Black Riverindicate that the sturgeon probably still spawns in the river.
Blandings turtle (Emys blandingi). This turtle has threatened status in New York State. The New YorkNatural Heritage Program lists a potential site of occurrence in the Lower Black River and/or the LowerMiddle Black River subwatersheds. The herpetology atlas shows two records in or near the LowerBlack River subwatershed; one of these is probably the same area as the Heritage program site.

BLACK RIVER WATERSHED MANAGEMENT PLAN
CHARACTERIZATION REPORT
Page 38THEACADEMYOF NATURALSCIENCES
THEACADEMYOF NATURALSCIENCES
Species of Special Concern
Brook trout (Salvelinus fontinalis). A heritage brook trout strain has been identified in Horn Lake.Other heritage strains may exist in the the drainage.
Summer sucker (Catostomus utuwana). The summer sucker was described as a distinct species from atributary of Big Moose Lake. It was subsequently considered to be a form of white sucker. Recentstudies indicate that it is a distinct species. The species is known from Squaw Lake and tributarystreams. The species is endemic to the Adirondacks. As such, it is a major conservation priority for theBlack River drainage. However, until its redescription is published, it cannot receive formal state orFederal designation as an endangered or threatened species.
Burbot (Lota lota). The burbot is present in the Black River between Carthage and Lyons Falls. Theburbot also occurs in Lake Ontario. The burbot is not listed as a species of concern in New York State.However, the burbot’s life history and requirement of relatively large, low gradient, cool water makesit vulnerable to climate warming. Riverine populations are at particular risk, and Pennsylvania haslisted the inland populations of burbot. The burbot also has special status in Connecticut.
Bluespotted salamander (Ambystoma jeffersonianum). The bluespotted salamander is a species ofspecial concern in New York State. There are a few records in the herpetology atlas near the mouth ofthe Black River.
Wood turtle (Clemys insculpta). The wood turtle is a species of special concern in New York State. Theherpetology atlas shows about six records scattered throughout the Black River drainage.
Common loon (Gavia immer). Common loons occur on a number of lakes in the Adirondacks. Majorconcerns for the common loon are acidification (eliminating fish prey in lakes), bioaccumulation ofmercury, lake level fluctuations, and ingestion of lead (on breeding and wintering grounds).
Bicknell’s thrush (Catharus bicknelli). Bicknell’s thrush breeds in shrubby spruce-fir forests mostlyabove 2,900 feet in elevation. It occurs in Maine, the White Mountains of New Hampshire, the GreenMountains of Vermont, and in the Adirondacks. There is one record of Bicknell’s thrush on or justacross the boundary of the South Branch Moose River subwatershed.
Golden-winged warbler (Vermivora chrysoptera). The golden-winged warbler inhabits shrubbyhabitats in the northeastern US. Its abundance has decreased with the decrease of early successionalhabitats. The blue-winged warbler has expanded its range into that of the golden-winged warblerduring the last century. Genetic swamping of golden-winged warbler due to hybridization with theblue-winged warbler is considered a major cause of its decrease in areas which still contain suitablehabitat.
INVASIVE PLANTS AND ANIMALS
Invasive plants and animals pose a threat to native species and ecosystems by predation, competition,disease transmission, and hybridization. Invasive species may be resistant to diseases that are highlyvirulent to native species and may actually be carriers of these diseases. For example, several importantdiseases of native trees have been introduced by cultivation of closely related non-native species.Hybridization between native and non-native taxa (i.e., varieties, other closely related species.) mayhave demographic and genetic effects on species.
BLACK RIVER WATERSHED MANAGEMENT PLAN
CHARACTERIZATION REPORT
Page 39THEACADEMYOF NATURALSCIENCES
THEACADEMYOF NATURALSCIENCES
Terminology
A variety of terms, such as invasive, exotic, and alien, are in common use for non-native species, oftenwith overlapping or contradictory meanings. The following meanings are used in this report:
Non-native. A general term for a taxon that does not occur naturally in a region. A large number ofnon-native species have been established for a relatively long time. For example, many Europeanplants arrived with early modern settlement of the area and are now common, familiar elements ofmany ecological communities. Nonindigenous is considered synonymous with non-native.
Exotic. A taxon introduced from outside North America.
Adventive. A taxon that is non-native, but which has immigrated into the region without directintroduction. However, introduction may be facilitated by human activities (e.g., dispersal along roadsand railroad tracks) and establishment may be favored by human-caused changes in habitat.
Invasive. The New York State Invasive Species Task Force defines an invasive species as one that is “1)Non-native to the ecosystem under consideration; and 2) whose introduction causes or is likely tocause economic or environmental harm or harm to human health.”xxxvii While many species are clearlyinvasive in terms of distribution, there is subjectivity in classification of less dominant non-nativespecies.
Non-Native Species
Most discussions of invasives focus on species, but forms at lower levels (e.g., subspecies, varieties,races) may have impacts on native conspecifics and non-native forms may have different ecologicaleffects. For example, the common reed (Phragmites australis) is a native species, naturally occurringalong marsh edges. A European genotype of common reed, however, is considered invasive, formingdense, mono-specific stands in a variety of damp habitats.xxxviii The Canada goose (Branta canadensis) isnative to New York, but didn’t breed in the state until introduction of non-migratory forms in the1930's and 1940's.xxxix Resident Canada geese may become nuisances, with significant effects onriparian vegetation and aquatic ecosystems.
Eradication of well-established, non-native species is often difficult or essentially impossible. Localcontrol of these species may be done where they have the greatest ecological or economic effects.Prevention of introduction or early eradication of potentially-occurring species may be feasible. Anumber of aquatic plants and animals colonize new waterbodies by being held in residual water (e.g.,bilge water, etc.) or attached to boats, trailers, or other equipment. Thorough cleaning and drying ofequipment can prevent such transport and is critical in reducing spread of several species. A numberof species, including fish, crayfish and earthworms, have been introduced via bait bucket release, anddisease may be transmitted by bait fish.
Newly introduced exotic species are typically not included in standard regional floras and faunas, andthe taxonomic status of newly-encountered forms is often uncertain. Ranges of many non-nativespecies can change rapidly. As a result, websites of several agencies are important in providinginformation on identification, impacts and control techniques. These include:
The National Invasive Species Council (USDA):http://www.invasivespeciesinfo.gov/
New York Sea Grant, Aquatic Invasive Species:http://www.nysgextension.org/ans/anspages/NYSGAIS.htm
BLACK RIVER WATERSHED MANAGEMENT PLAN
CHARACTERIZATION REPORT
Page 40THEACADEMYOF NATURALSCIENCES
THEACADEMYOF NATURALSCIENCES
USGS nonindigenous aquatic species:http://nas.er.usgs.gov/
Adirondack Park Invasive Plant Program:http://www.adkinvasives.com/
New York State Invasive Species Task Force: final report athttp://www.dec.ny.gov/docs/wildlife_pdf/istfreport1105.pdf
National Biological Information Infrastructure invasive species node:http://invasivespecies.nbii.gov/index.html
Exotic Species
A large number of exotic species occur in the Black River drainage basin. The range of taxa, fromdiseases to vertebrates, indicates the wide range of potential impacts from invasive species. Thefollowing are a few that are particularly significant to this watershed management plan:
Purple loosestrife (Lythrum salicare). Purple loosestrife has escaped from cultivation and becomeinvasive over much of the northeastern United States. Purple loosestrife can be a dominant plant inmany wetland communities. The ecological importance of wetlands and occurrence of many rare,native species in wetlands increases the potential damage of the species and also impedes the use ofherbicide control. Biological control of purple loosestrife has been developed and successfully used inthe northeast (e.g., Connecticut and Illinois). There have been a number of studies concerning theecological impacts of purple loosestrife, demonstrating mixed effects.xl, xli, xlii
There is evidence that native generalist herbivorous insects feed on purple loosestrife, which mayreduce its invasiveness.
Giant hogweed (Heracleum mantegazzianum). Giant hogweed was introduced as an ornamental plantand has become established in New York State, including the Black River drainage area. It is capable offorming dense cover in riparian areas where it may shade native species and increase bank erosion.Sap of giant hogweed causes photodermatitis in people. Cutting is usually ineffective at controllinggiant hogweed and increases risk of skin contact with sap. Giant hogweed is on the US Federal noxiousplant list. The NYS Department of Agriculture and Markets maintains a Giant Hogweed Hotline (1-800-554-4501, extension 72087) and posts information on giant hogweed athttp://www.agmkt.state.ny.us/nys_ghw_broch.pdf.
Garlic mustard (Allalaria petiolaris). Garlic mustard is a biennial herb which can achieve high densities,particularly in disturbed situations. It has chemical (allelopathic) effects on other plant species. Garlicmustard is known along roads in several areas of the Black River drainage in the Adirondack Park.xliii
Japanese knotweed (Polygonum cuspidatum). Japanese knotweed is a perennial herb which hasspread from cultivation throughout the northeastern US and Canada. It forms dense patches, whichspread vegetatively, and it can also spread by seeds.xliv Japanese knotweed forms a large rhizome.These rhizomes can form numerous new shoots, and the rhizome can regrow from fragments. As aresult, cutting or hand removal is usually ineffective, and herbicide control has been the most effectivecontrol technique. Japanese knotweed can dominate riparian zones and occurs in more uplandhabitats, as well as along road and railroad banks. Japanese knotweed was one of the more commonexotics along roads in the Black River drainage area.xlv

BLACK RIVER WATERSHED MANAGEMENT PLAN
CHARACTERIZATION REPORT
Page 41THEACADEMYOF NATURALSCIENCES
THEACADEMYOF NATURALSCIENCES
Common reed (Phragmites australis). The exotic genotype of the common reed can form dense,monospecific stands in marsh areas and other damp areas. It is often considered to form poor cover forwaterfowl and other organisms and to reduce density of native aquatic plants. Most studies of impactsof common reed have been done in freshwater and brackish tidal marshes (Fell, et al. 2003, Lathrop,et al. 2003, Weis and Weis 2003).xlvi, xlvii, xlviii These studies have found that marshes dominated bycommon reed still support aquatic biodiversity and ecological functions. However, the common reedmay reduce the complexity of topography of the marsh surface, which could have significant effects onmarsh ecology. Common reed is difficult to control, and herbicide may be the most effectivetechnique. Common reed has been documented in settled areas in the Adirondacks. xlix
Common buckthorn (Rhamnus cathartica). Common buckthorn is a tree or shrub native to Eurasia. Itis widely established in the northeast, including the Black River drainage. It often occurs on alkalinesoils of a variety of moisture conditions.l It has also been noted that the Canadian Shield may be abarrier to its occurrence in the north.li Therefore, it may be an important invasive in the Black Rivervalley, but is unlikely to become invasive in the Adirondacks as recent efforts identified buckthornsfound buckthorns (Rhamnus cathartica and/or R. frangula) only in the northwest corner of the Park.lii
European water milfoil (Myriophyllum spicatum). This milfoil is an aquatic plant which has becomewidely established throughout the northeastern US, including New York State. It forms very densepatches which interfere with boat traffic and may affect native plants, such as the state-threatenedFarwell’s watermilfoil, and aquatic animals. It is tracked by the Adirondack Park Invasive PlantProgram. It has been found in several lakes in the Fulton Chain, and the Fulton Chain of LakesOrganization has been co-ordinating survey and removal efforts. These efforts use divers and pumps toreduce fragmentation of plants, which is a primary means of colonization of the plant.
Honeysuckles. The fly honeysuckle (Lonicera morrowii) and Tartarian honeysuckle (L. tatarica) haveescaped cultivation and become widely established. Recent efforts identified one or both species to beamong the most widely distributed exotic species in the western Adirondacks.liii
Sport fishes. As discussed in the section on fishes of the Black River drainage, a number of specieshave been introduced for sport species. Species such as brown and rainbow trout have beenintroduced from outside the drainage, while many species occurred in parts of the drainage and havebeen spread within the drainage. Introductions of species such as smallmouth bass and yellow perchhave had huge impacts on the fish faunas of lakes. Introduction of brook trout may have obliteratednative races of the species.
A number of invasive species occur in the Great Lakes. Several of these occur in Lake Ontario and mayoccur in the lower part of the river. These species could potentially be transported into upper parts ofthe drainage.
Zebra mussel (Dreissena polymorpha). The zebra mussel was introduced to the Great Lakes via ballastwater and has spread into a number of river and lake systems. Zebra mussels can clog water intakesand can overgrow native mussels. Zebra mussels are filter feeders and they have had huge effects onaquatic systems by removing phytoplankton and increasing benthic detrital material. The filtering hasincreased water clarity in places but has also affected aquatic food webs. Zebra mussels can be spreadby boats, either as adults or juveniles attached to boats and trailers, or as larvae contained in bilgewater or live well water.
Quagga mussel (Dresseina bugensis or D. rostriformis bugensis). The quagga mussel was alsoapparently introduced via ballast water into the Great Lakes. The quagga mussel was probablyintroduced after the zebra mussel and has not spread as extensively. However, it is expected to
BLACK RIVER WATERSHED MANAGEMENT PLAN
CHARACTERIZATION REPORT
Page 42THEACADEMYOF NATURALSCIENCES
THEACADEMYOF NATURALSCIENCES
replace zebra mussels in many areasliv. Quagga mussels have similar impacts as zebra mussels. Quaggamussels occur in Lake Ontario.
Round goby (Neogobius melanostomus or Apolonnia melanostomus). Round goby was introduced intothe Great Lakes by 1990. Impacts include predation on native fishes and other organisms, competitionwith native species for food, cover and nesting areas (especially sculpins Cottus) and predation on fisheggs, including those of smallmouth bass. It is preyed on by smallmouth bass, so interactions betweenbass and goby are complex. Round gobies are susceptible to viral hemorragic septicemia virus (VHSV)and could spread the disease to predatory smallmouth bass.lv Round gobies have been found in BlackRiver Bay near the mouth of the Black River.lvi
Fishhook waterflea (Cercopagus pengoi) and spiny waterflea (Bythotrephes longimanus). Both ofthese species occur in Lake Ontario. These species are predatory zooplanktors that compete with fishfor zooplankton and disrupt aquatic food webs. They can also be nuisance species, clogging fishinglines.
The European frog bit (Hydrocharis morsus-ranae) is an aquatic plant which is established along theshores of Lake Ontario.
The tubenose goby (Proterorhinus marmoratus) and ruffe (Gymnocephalus cernuus) are Eurasian fisheswhich are established in the Great Lakes and could potentially spread into Lake Ontario.
Other Invasives
A number of other invasive species have the potential to colonize the Black River drainage basin. Theranges of many of these species have been expanding and the Black River drainage would likelyprovide adequate conditions for their establishment.
Hemlock woolly adelgid (Adelges tsugae) is an insect that infects hemlocks, which is an important treein the Black River drainage. The woolly adelgid has caused massive mortality of hemlocks in areaswhere it has occurred. Currently, control can only be done locally on a stand or few trees, so thatprotection of hemlock throughout the region is infeasible. An adelgid predator has been released inNew York, but biological control is currently ineffective. The hemlock woolly adelgid is common inparts of southern New York and has been detected in Rochester.lvii
The Rusty crayfish (Orconectes rusticus) has been introduced into the Upper Susquehanna and theHudson River drainages. In many areas, native crayfish have disappeared after invasion of rustycrayfish. Rusty crayfish grows to a size where it is invulnerable to most fish predators, so it can reachlarge densities and have significant effects on macrophytes and other organisms.
Didymo (Didymosphenia geminata) Didymo is a diatom that forms thick mats on river substrates. It hashad major impacts on rivers (e.g., in New Zealand) and has been found in the Delaware River systemin New York, including the East Branch, Batten Kill, West Branch and main stem. It is thought thatdidymo has been spread primarily by movement of boats and anglers’ gear such as waders and boots.Didymo cannot stand complete drying, but can remain alive for long periods in moist gear. Thoroughdrying and/or cleaning of gear is considered the best way to prevent spread of Didymo. ThePennsylvania Fish and Boat Commission provides information on Didymo athttp://www.fish.state.pa.us/water/habitat/ans/didymo/faq_didymo.htm.
Viral hemorragic septicemia virus (VHSV). VHSV is a viral disease now known to be endemic inmarine and anadromous fish in both the Atlantic and Pacific Oceans. It caused large fish kills in LakeOntario, other Great Lakes, the St. Lawrence River, and some inland lakes (e.g., Lake Oneida) from
BLACK RIVER WATERSHED MANAGEMENT PLAN
CHARACTERIZATION REPORT
Page 43THEACADEMYOF NATURALSCIENCES
THEACADEMYOF NATURALSCIENCES
2005 to 2007. It has been found in a variety of freshwater species in the Great Lakes. Muskellunge,freshwater drum, yellow perch, gizzard shad , emerald shiner, and round goby were most affected,with smaller numbers of deaths of Chinook salmon, walleye, white bass, redhorse, lake whitefish,smallmouth bass, bluegill, black crappie, burbot, and northern pike.lviii, lix, lxA total of 25 fish specieshave been identified with VHSV, with differences in symptoms, progression of the disease andmortality.lxi VHSV is not known to affect humans and handling or consumption of infected fish is notconsidered a health or wildlife risk. Management of movement of fish, including transport and sale ofbaitfish, has been instituted to control the spread of the disease. Population-level effects of the fishmotalities are currently unknown. For example, large mortalities of freshwater drum in Lake Ontariowere not matched with decreases in abundance of drum in subsequent years. Conversely, it isestimated that half of the mature muskellunge in the Thousand Islands section of the St. LawrenceSeaway died from the disease.lxii
The emerald ash borer (Agrilus planipennis) was first discovered in Ohio, Michigan and Ontario(Canada) in 2002 and could have huge effects on regional forests.lxiii
Sudden oak death (Phytophthora ramorum) is a disease that affects oaks and a variety of other broad-leaved trees and shrubs, such as Rhododendron and Viburnum. It may be spread through thehorticultural trade.
Pale swallow-wort (Vincetoxicum rossicum). Pale swallow-wort is a perennial vine that can form large,dense infestations. It prefers limestone soils and therefore potentially occurs in the lower Black Rivervalley. No occurrences in the Black River drainage have been located, but the pale swallow-wortoccurs in Jefferson County, with known sites only a few miles from the drainage (e.g., at the ChaumontBarrens). The Cornell Cooperative Extension of Jefferson County is tracking this species and recordsmay be reported at 315-788-8450.
Non-Native Species
A number of other non-native species have been recorded within the drainage. These species haveimpacted in other areas and could become invasive. These include the mute swan (Cygnus olor),which has bred near the mouth of the river. The Adirondack volunteer invasive survey recordedseveral non-native plants in relatively low frequency, such as Russian/Olive autumn (Eleagnus species)and black locust (Robinia pseudoacacia).lxiv Earthworms have recolonized slowly following glaciation,and native earthworms are rare or absent throughout many glaciated areas. Non-native earthwormshave been widely introduced by anglers and possibly by horticulture. Some non-native earthwormsconsume humus and have had huge effects on soil conditions following introduction. Earthwormsoccur locally in the Black River drainage (e.g., around fishing camps and popular fishing areas).Controls on selling non-native earthworms may diminish movement, although many anglers may digtheir own earthworms and bring them from outside the drainage.
There has been considerable investigation of factors affecting the establishment and invasiveness ofnon-native species to predict potential invasiveness of horticultural species, prioritize control of exoticspecies, and develop regional control strategies. Many species have spread widely followingintroduction and restriction of introduction (e.g., controls on flushing of ballast water) and dispersal(e.g., controls on use of live bait, and promotion of cleaning and drying of boating and fishingequipment) may be the most effective techniques for widely invasive species. Land disturbance maypromote establishment of many weedy plant species. However, the local fauna and flora may beadapted to the local disturbance regime, so that fire, drought, flooding, etc., may have more significanteffects on non-native than native species and serve to control the establishment of non-native species.Development of biological controls has been effective on some species, but the effort involved inproducing safe, effective biological control restricts it to the most widespread and damaging non-native
BLACK RIVER WATERSHED MANAGEMENT PLAN
CHARACTERIZATION REPORT
Page 44THEACADEMYOF NATURALSCIENCES
THEACADEMYOF NATURALSCIENCES
species. For many non-native species, control (e.g., through mechanical removal or pesticides) ratherthan eradication is the only practical approach. Finally, climate change is anticipated to have largeeffects on the spread of non-native species. For example, a large number of invasive species areimportant in areas south of the Black River drainage, and these species may continue to expandnorthward with climate change.
KEY HABITATS AND RESOURCES
The previous sections describe ecological characteristics of the Black River drainage. This sectionsummarizes these sections with respect to important ecological resources, which will form the focus formanagement and restoration.
Adirondack Mountains and foothills
The Adirondacks represent one of the largest undeveloped areas in the northeastern United States. Asignificant portion of the Adirondacks is located within the Black River drainage, which allows for themaintenance of a mosaic of ecological communities, reflecting both inherent environmental variability(e.g., moisture, elevation, etc.) and different successional stages. A number of species of plants andanimals depend on early successional stages of vegetation, while others prefer mature vegetation. TheAdirondacks support a variety of ecological communities that are uncommon elsewhere in the UnitedStates, particularly several northern (boreal) upland and wetland communities. These communitiessupport uncommon species of animals such as the suite of boreal birds. One species, the summersucker, is endemic to the Adirondacks and the Black River drainage comprises a significant portion ofits total range. The large extent of forest is important to a number of species, such as fisher and broad-winged hawk. The Adirondacks support an array of recreational activities, ranging from wildernesshiking and boating through summer and permanent residence on area lakes. The region providesopportunities for a variety of lake, stream, and river fishing, as well as hunting and trapping for anumber of game and fur species. The Adirondacks are headwaters for a number of streams and arehydrologically important for regional water storage, supply, and hydropower. Rivers and lakes of theAdirondacks provide a variety of recreational boating experiences. The lower Moose River is anationally-known whitewater river.
Tug Hill Plateau
The Tug Hill Plateau represents a second large area of largely undeveloped land. The Plateau providesmany of the ecological and economic benefits of the Adirondacks. While this area supports some ofthe same northern fauna as the Adirondacks, differences in climate, geology, and hydrology lead todifferences in the occurrence of species and communities. For example, the Plateau is less susceptibleto acidification than the Adirondacks. Additionally, the gulfs formed by tributary creeks support anumber of uncommon plant communities and provide unique recreational opportunities.
Mainstem Black River and Valley
The central portion of the Black River provides a large, undammed section of river. The continuousstretch of river is important to migratory fish species such as burbot and the river supports a variety ofother game and nongame fish species. Floodplain swamps within the valley are an important habitat,providing food and cover for a variety of fish and other organisms. The Black River valley containsuncommon plant communities, such as calcareous wetlands, which support rare species of plants andother organisms. These areas also provide hunting and trapping opportunities.

BLACK RIVER WATERSHED MANAGEMENT PLAN
CHARACTERIZATION REPORT
Page 45THEACADEMYOF NATURALSCIENCES
THEACADEMYOF NATURALSCIENCES
Unforested upland Habitats
The Black River valley, including the lower valley, also contain grasslands and shrubland habitats. Manyof these are culturally produced, (e.g., by dairy farming), while others, such as limestone pavementbarrens, are controlled by soil, bedrock and moisture conditions. Many shrublands representsuccessional stages resulting from abandoned farms. Several rare plant species occur in these habitats.The importance of these habitats to a number of species of birds is well-established, and these habitatsare important to a number of other taxa, as well. Many of these species have declined in thenortheastern United States as a result of changing agricultural and land cover trends.
Lower Black River
The lower Black River is home to regionally important fisheries (e.g., walleye, steelhead and salmonruns). The mouth of the river serves as an important area for nongame fish, as well, including lakesturgeon spawning areas. The Black River gorge is a well-known whitewater run because of its level ofdifficulty, unique characteristics, and summer flows.
Wetland habitats
The Black River drainage contains a variety of wetlands, including calcareous fens, peatlands, andfloodplain swamps. These habitats support a variety of rare plants and animals. Along with marshesalong the Black River Bay, wetlands in the drainage provide important breeding and wintering habitatfor a variety of species of waterbirds. Areas near the mouth of the river are important as both breedingand wintering areas, while ponds and wetlands in the rest of the drainage, including the Tug HillPlateau, the Black River floodplain, and the Adirondacks, are important nesting areas for variousspecies.
Caves
The limestone bedrock of the Black River valley contain caves, which provide habitat for severalspecies, including the Federally-endangered Indiana Bat.
BLACK RIVER WATERSHED MANAGEMENT PLAN
CHARACTERIZATION REPORT
Page 46THEACADEMYOF NATURALSCIENCES
THEACADEMYOF NATURALSCIENCES
1.5. IMPAIRMENTS AND THREATS
1.5.1. Introduction
The Black River drainage area has been affected by a number of ecological impacts associated withsettlement, agriculture, logging, and industrial development. Effects include erosion and streamsedimentation, nutrient inputs and eutrophication, hydrological change and stream channelmodification, fires, river damming and dewatering, and contamination by pesticides and industrialwastes. While many of the historic impacts are still evident through the recycling of environmentalcontaminants between the atmosphere and watersheds, these environmental challenges wereaddressed by dedication of the Adirondack Park and land preservation, and a series of Federal andState regulations including the Clean Air Act and the Clean Water Act.
Under authority of the Clean Air Act and the U.S. Environmental Protection Agency, the NYSDECmonitors waterbodies of the state, determines impairments with respect to defined uses, identifiespriority waterbodies for remediation, and develops plans for attainment of designated uses.
Priority waterbodies have been identified by the NYSDEC in 1996, 2006, and 2008, including waterquality impacts and sites identified for development of total daily maximum load (TMDL) regulationsunder section 303d.lxv, lxvi The NYSDEC also samples water chemistry and macroinvertebrates as part ofthe Rotating Integrated Basin Studies, which alternate annually among regions, providing regularassessments of each basin – the Black River was most recently assessed during 2002 and 2003.lxvii
1.5.2. Threats to the Black River Watershed
The following sections highlight some of the significant current threats to the Black River drainagebasin. These sections draw on the NYSDEC assessment documents, as well as extensive literature onthe various issues.
ACIDIFICATION
The geology of the Adirondacks and their location with respect to acid deposition, acid rain, and drydeposition of sulfate and nitrate makes them highly susceptible to acidification. The bedrock andrelatively thin soils, mainly derived from glacial tills, provides little buffering, leading to soft water withlow acid neutralizing capacity (ANC). In the late 1980's, the Adirondack Lake Survey Corporationmonitored water chemistry and ecological conditions of a number of lakes and ponds in theAdirondacks. Many of these were acid-impacted, and a number of small ponds, many in the BlackRiver drainage, had high acidity (low pH). Fish species vary in their sensitivity to acidification. Speciesthat commonly occur in areas of natural, organic acidity, such as chain pickerel, are relatively tolerant,as are some species typical of small, soft water lakes and streams (e.g, brook trout). Aluminumbecomes more bioavailable in conditions of inorganic acidity, and aluminum toxicity is an importantimpact in acidified waters. For example, brook trout reproduction may fail due to aluminum toxicity ofearly life stages even where adults are able to survive. Fish community composition was stronglyaffected by acidification and a number of ponds had no fish. A number of lakes on the 2006 303(d) listin the Black River drainage are classified as impaired because of acid effects. Since most are small,however, the relative acreage affected by acidification is less than that of the fewer, but larger lakesimpaired by fish consumption advisories. Individual acid-impaired lakes are no longer listed separatelyin the 2006 Priority Waterbody List (PWL), since impairment will be addressed on a regional, ratherthan a lake-by-lake basis. Several lakes, including Brook Trout Lake and Big Moose Lake, both in theBlack River drainage, have been extensively studied with respect to acidification. In general, depositionof sulfates has decreased following control under the Clean Air Act, although deposition of nitrates hasincreased.lxviii, lxixThe severity of acidification has decreased in many Adirondack lakes, with decreases in
BLACK RIVER WATERSHED MANAGEMENT PLAN
CHARACTERIZATION REPORT
Page 47THEACADEMYOF NATURALSCIENCES
THEACADEMYOF NATURALSCIENCES
sulfate, nitrate, and monomeric aluminum, as well as increases in pH and ANC.lxx For example,conditions in Brook Trout Lake have changed and brook trout have been restocked (Farrell, et al.2008). Studies in Brook Trout and other lakes have indicated a complex pattern of recovery, withsome biological groups lagging behind apparent changes in water chemistry. While fish populationrecovery in Adirondack lakes has been monitored, the extent of recovery was difficult to assess due agreatly affected fish composition resulting from subsequent introductions of fishes.lxxi (Daniels et al.(2008)
While acidification of lakes and ponds has received a great deal of attention, streams have also beenaffected by acidification.lxxii From 2003 to 2005, the USGS, in cooperation with the NYSDEC, ALSCand the NYS Energy Research and Development Authority studied water chemistry andmacroinvertebrate communities in a number of streams in the Black and Oswegatchie drainages in theWestern Adirondacks.lxxiii Approximately 200 streams with little upstream pond and lake inputs werestudied. In addition to measuring ANC, they measured base-cation surplus (BCS), since this was moreclearly related to concentrations of inorganic aluminum. They found an average of 38 percent ofstreams had a BCS less than zero, corresponding to 31 percent of streams with aluminumconcentrations of levels toxic to brook trout. A much higher percentage (56 percent) of streams hadlow BCS during high stream-flow events. They estimated that 446 miles of streams in the region wouldbe vulnerable to acidification, excluding assessment of 1,916 miles of inaccessible streams which werenot included in the study design. Seven rivers and streams are listed as acid-impaired in the 2006303(d) list (North Branch Moose River, Bald Mountain Brook, Seventh Lake Inlet, Buck Creek,Wheeler Creek, Bradley Brook, and Cellar Brook), with suspected impacts on other streams (e.g.,Independence River).
Acidification also affects terrestrial communities. High elevation coniferous forests, for example, areaffected by acidification.lxxiv Additionally, studies specific to the region found low recent regenerationof sugar maple in western Adirondack forests and suggested depletion of soil calcium due toacidification as the most likely cause.lxxv Calcium depletion may also affect abundance of birds byreducing the abundance of terrestrial invertebrates that provide calcium necessary for egg-laying.lxxvi
Ultimately, recovery from acidification effects depends on decreasing acidic inputs and is expected totake a long time. Additionally, due to the nature of acidification, reduction of acidic inputs is aregulatory and technological issue best dealt with at the national level. As a result, NYSDEC’s strategyfor remediation involves participation in efforts to reduce acidic inputs, along with monitoring andassessment to determine continued effects and recovery.
CONTAMINANTS
Fish consumption advisories affect a number of lakes in the Black River drainage area. Sixteen lakes inthe drainage are on the state 2006 303(d) list as a result of mercury consumption advisories. New YorkState has general fish advisories for all state waters due to the occurrence of contaminants throughoutthe state, including the Stillwater Reservoir and Big Moose Lake. Because of the larger average size ofthese contaminant-affected waterbodies, the proportion of acreage affected by contaminants isdisproportionate to the number of sites. Additionally, the Western Adirondacks have been identifiedas a hotspot of mercury bioaccumulation in the Northeastern U.S. based on measured concentrationsin yellow perch and common loon.lxxvii
Mercury, a toxic element that can threaten the health of both people and wildlife, enters ecosystemsby a variety of point and nonpoint sources. In undeveloped areas, atmospheric deposition is theprimary source of mercury. Deposition of mercury has increased from historical levels as a result ofpower plant emissions and other industrial sources (e.g., cement plants and landfills). Most depositionconsists of inorganic mercury, which does not bioaccumulate readily. Bacterial methylation forms
BLACK RIVER WATERSHED MANAGEMENT PLAN
CHARACTERIZATION REPORT
Page 48THEACADEMYOF NATURALSCIENCES
THEACADEMYOF NATURALSCIENCES
methylmercury, which is readily accumulated in food chains. Levels of mercury in fish reflect levels ofmercury inputs, geochemical factors affecting methylation, and the trophic structure of waterbodies.Mercury methylation appears to be particularly active in deep lakes with fluctuating oxic-anoxic zonesand in systems with extensive wetlands and dissolved organic carbon (DOC), conditions that arepresent in many Adirondack lakes. Because of the long-range transport of atmospheric mercury andthe environmental factors affecting methylation, mercury bioaccumulation may be especially severe inotherwise relatively undisturbed ecosystems. Mercury bioaccumulation is not closely related to lipid(i.e., fat) content, but is higher in older, fish-eating fish. In addition to affecting mercury levels in fishwithin the basin, transport of mercury by the river is a significant source of mercury entering LakeOntario. Neurological impairment during development is a primary human health issue for mercury,and different risk levels have been developed for both high risk groups (e.g., children, women of child-rearing age) and lower risk groups. Assessments of high risk groups indicate effects at relatively lowamounts of mercury intake, which can be exceeded by frequent consumption of most species offreshwater fish. As a result, general advisories have been developed for all state fish.
As with acidic deposition, recovery ultimately depends on reduction of atmospheric inputs, which is anational regulatory and technological issue. As a result, the primary response to mercury contaminationis monitoring concentrations in fish and promulgation of consumption advisories.
One lake, Fourth Lake, has fish consumption advisories based on DDT concentrations. The source ofthe DDT is unknown, but remediation efforts are underway (NYSDEC 2006a). Although DDT is nolonger used in the US, DDT or its breakdown products DDE and DDD (the three together are referredto as DDX) persist in area ecosystems. DDX contamination in fish can result from sedimentcontamination from historical pesticide applications.
Approximately 43 miles of the lower Black River are classified as impaired due to priority organiccontaminants (with other impairments as well). Kelsey Creek is listed as impaired due to PCBconcentrations. Like DDT, PCBs are no longer used, but are present from historical uses. PCBs wereused in transformers and PCB contamination may come from railroads, electrical facilities, or otherindustrial uses. In addition to point sources, PCBs can cycle through ecosystems by volatilization andsubsequent wet or dry deposition.
Contaminant effects on groundwater resources have been identified as a significant issue in the BlackRiver drainage (NYSDEC 2006a), resulting from historic industrial discharges, hazardous waste sites,and pesticide application.
SEWAGE INPUTS
The input of sewage into local waterbodies can pose both human and ecosystem health risks. Nutrientinputs from sewage can lead to eutrophication and oxygen depletion, with effects on algae,macrophytes, and aquatic fauna. Treatment of sewage from larger communities has reducedeutrophication issues associated with these sources, although failing septic systems still representsignificant issues. Replacement of septic systems by municipal sewer systems is financially prohibitive inmany areas.lxxviii Identification of failing septic systems (e.g., by dye studies) has been conducted byorganizations such as the Fulton Chain of Lakes Association. Agricultural land uses represent anotherlarge source of nutrient inputs (see below). Combined sewer overflows (e.g., Watertown) are also listedas a source of impairment for the lower Black River.
Many natural and synthetic chemicals may be concentrated and introduced into waterbodies viasewage. Many chemicals are not removed by sewage treatment and may present problems even inareas with no regulatory sewage issues. Endocrine disruption of fish, for example, has been linked tothe release of hormone mimics into local waterways from birth control or from plant compounds
BLACK RIVER WATERSHED MANAGEMENT PLAN
CHARACTERIZATION REPORT
Page 49THEACADEMYOF NATURALSCIENCES
THEACADEMYOF NATURALSCIENCES
released below pulp and paper plants. Release of anti-microbial chemicals may affect microbialprocessing in receiving waters. These issues are generally poorly known and no information has beenlocated on their occurrence in the Black River drainage.
AGRICULTURE
The Black River basin water quality report lists the following agricultural impacts as significant in theBlack River drainage, many resulting from poor agricultural practices:
Nutrient and silt/sediment inputs from agricultural runoff;Livestock access to streams, resulting in damage to riparian vegetation, bank erosion, andnutrient inputs;Improper manure application;Lack of silate leachate control;Inputs from manure or milkhouse wastewater treatment facilities;Intensive cropping near streams with inadequate riparian buffers;Fertilizer and pesticide application without approved pesticide/nutrient management plans. lxxix
Agricultural impacts are listed for over one-quarter of the Priority Waterbody List rivers in the drainagearea, including tributaries of Mill Creek.lxxx, lxxxi, lxxxii, lxxxiii Unlike effects of acidic and mercury deposition,many of these effects can be controlled at the local level. For example, in 2005, the New York StateAgricultural Non-point Source Abatement & Control Program awarded grants for several projects in theBlack River watershed in Jefferson County to implement best management practices on combinedanimal feed operations (CAFO’s).
Potential impacts from agricultural practices were highlighted by the major fish kill in the Black Rivernear Lowville, resulting from a spill of liquid manure. On August 10, 2005, several million gallons ofmanure entered the river through a drainage ditch following rupture of a wall of the manure holdinglagoon, resulting in depletion of dissolved oxygen and increases in ammonia. Mortality resulted fromoxygen depletion, with progressive mortality as the manure traveled downstream, resulting in anestimated loss of 375,000 fish over 20 to 24 miles of river. Many species of fish were killed, includingwalleye, northern pike, smallmouth bass, rock bass, minnows and darters. Carp and bullheadappeared to be unaffected, as were fish in tributaries and floodplain waterways.
INVASIVE SPECIES
Invasive species can affect human health (e.g., West Nile virus) and wildlife health (e.g., West Nilevirus, VHSV), displace native species through competition, predation, interbreeding, diseasetransmission or habitat destruction, modify food chains (e.g., zebra mussels), change nutrientbiogeochemistry and contaminant pathways, and increase streambank erosion. Significant andpotentially significant invasive species in the Black River drainage are discussed above.
The section on invasives discussed VHSV as a pathogen with potential effects on the fish fauna of theBlack River drainage. A number of other diseases have recently become important locally or nationally.These include West Nile virus (affecting birds, humans, and other mammals), chronic wasting disease(which affects deer), largemouth bass virus, and Chytridiomycosis (a fungal disease that affectsamphibians). Transmission of diseases and susceptibility of hosts depends on a variety of factors,including health and immune function of the host (which may be affected by contaminants, crowding,etc.), contact between hosts and native or exotic organisms carrying diseases, and increases inpotential for long- and short- range dispersal of diseases.
BLACK RIVER WATERSHED MANAGEMENT PLAN
CHARACTERIZATION REPORT
Page 50THEACADEMYOF NATURALSCIENCES
THEACADEMYOF NATURALSCIENCES
CLIMATE CHANGE
Climate change is expected to change temperature and the pattern and timing of precipitation.Climate change will have extensive ecological effects, including decrease and possible extirpation ofnorthern species and immigration and increase of southern species, including exotic, potentially-invasive species. The effects on any taxon will depend both on its temperature and moisturerequirements and the sensitivity of its habitat to climate change. Sugar maple, for example, is projectedto be much more heavily affected by climate change than eastern hemlock, which often occurs inshaded ravines. Changes in the extent and duration of ice cover on lakes and streams will have largeeffects on these systems by changing the amount of production and lake turnover patterns.
FLOW REGULATION
Flow regulation may be carried out for water storage, for flood control, and to deliver hydroelectricpower at times of demand. Flow regulation may create lake conditions upstream of dams that supportaquatic organisms, but changes in base flows, peak flows, and the timing of flow variation can haveextreme impacts on the downstream biota. Hydroelectric power is generated by the Black, Moose andBeaver Rivers. In 1996, a settlement was made concerning operations of Beaver River Dams(excepting Stillwater). The settlement provided minimum flows for fish in river bypasses downstream ofdams, as well as other provisions for increasing recreational use of the river.
NATURAL DISTURBANCES
Several notable short-term disturbances in the Black River drainage have affected ecological conditionsover large areas in the basin.lxxxiv In November, 1950, a large cyclonic storm blew down large numbersof trees in the Adirondacks. Some of the largest areas of impact were in the Beaver and Moose Riverdrainages. It affected a variety of tree species and was most damaging on north and east-facing hills.lxxxv
Following the storm, salvage logging was done, with new roads built into wilderness areas to providelogging access. On July 15, 1995, an intense storm created bursts of strong winds, blowing downtrees.lxxxvi Much of the damage was north and east of the Black River drainage, but parts of the drainagewere affected.
EXTERNAL FACTORS
The effects of acidification, mercury, and invasive species, whose sources are primarily located outsidethe drainage, are discussed above. The drainage is affected by other influences that originate outside ofthe basin and are therefore largely outside local control. Migratory organisms are also strongly affectedby conditions in other parts of their range. The American eel, for example, has been functionallyextirpated in the Black River drainage, which was likely caused by dam blockage and various sourcesof mortality throughout its life stages. Many breeding birds of the drainage winter in the Southern US,the Caribbean, Central America, and/or South America. Decreases in winter habitat has beenconsidered a major threat to many species wintering in the tropics and conditions on US wintering ormigration areas could also threaten some species.
FLOODPLAINS
According to FEMA’s Community Status Book, fifty-five of the communities located partially or entirelywithin the watershed are enrolled in the National Flood Insurance Program (NFIP). Only the Town ofMontague is not. Eleven of the 55 communities, according to their effective Flood Insurance Studies,are entirely located within Zone C, meaning that there are no Special Flood Hazard Areas (SFHAs).Most all of the original Flood Insurance Rate Maps in these communities, prepared in the mid-1980s,are over 20 years old.

BLACK RIVER WATERSHED MANAGEMENT PLAN
CHARACTERIZATION REPORT
Page 51THEACADEMYOF NATURALSCIENCES
THEACADEMYOF NATURALSCIENCES
All communities enrolled in the NFIP have adopted zoning codes in the form of floodplain overlaydistricts, where NFIP regulations apply that are intended to assure compliance with NFIP requirements.Typically, a Floodplain Development Permit is issued by the local community to assure that projectsconstructed within SFHAs meet these requirements. Projects that are proposed to be located withinSFHAs are subject to the NFIP regulations and the associated zoning provisions in the Zoning Code.All new construction and substantial improvements should:
Be designed (or modified) and adequately anchored to prevent floatation, collapse, or lateralmovement of the structure resulting from hydrodynamic and hydrostatic loads, including theeffects of buoyancy; [44 CFR Part 60.3(a) (3) (i)]
Be constructed with materials resistant to flood damage. This would include assuring thatsurfacing materials can resist the expected velocities; [44 CFR Part 60.3(a) (3) (ii)]
Be constructed by methods and practices that minimize flood damages; [44 CFR Part 60.3(a)(3) (iii)];
Be constructed with electrical, and other services facilities that are designed and/or located soas to prevent water from entering or accumulating within the components during conditionsof flooding. [44 CFR Part 60.3(a) (3) (iv)]
Prohibit any significant encroachments, including fill, new construction, substantialimprovements, and other development within the adopted regulatory floodway. [44 CFR Part60.3(d) (3)]; and
Not increase the base (100-year) flood elevation by more than 1.0 feet. 44CFR Part 60.3 (c)(13) .
Projected urban land use development pressures will occur primarily along the valleys of the LowerBlack River, Middle Black River, Fish Creek, Stillwater, Otter Creek, Independence River, CummingsCreek an the South Branch Moose River watersheds. Since development pressures will be mostprevalent in floodplain areas, where development costs are lower, and since many of the FISs are over20 years old, inclusion of Black River watershed counties (Hamilton, Herkimer, Lewis, Jefferson andOneida) in FEMA’s Map Modernization Program would be an important step towards assuring thatfloodplains are developed in a manner that minimizes future flood damages.
STORMWATER MANAGEMENT
Development projects generally change an area from natural vegetation to impervious areas, such asroofs, roads, and parking areas. This change can produce a change in runoff patterns downstream ofthe development. The increased runoff can also contain pollutants from roadway and parking areasurfaces. Such an increase in runoff could cause accelerated erosion downstream of a development.The increase in pollutants could flow into wetland areas, streams, lakes and rivers downstream anddecrease the quality of these water bodies.
The regulatory tool used in New York State for assuring that development projects neither significantlychange stormwater runoff patterns nor significantly increase pollutant loadings is the NYSDEC SPDESGeneral Permit for Stormwater Discharges from Construction Activity (Permit No GP-0-08-001).Actions that disturb more than one acre of land require coverage under this permit (or an individualpermit from the US EPA). Requirements for this coverage include the development of an Erosion andSediment Control Plan (E&SCP) and a Stormwater Pollution Prevention Plan (SWPPP). The SWPPPrequires that additional runoff be controlled, and that the Water Quality Volume (WQV) be treated inaccordance with New York State standards. The Stormwater Management Practices (SMP’s) specified

BLACK RIVER WATERSHED MANAGEMENT PLAN
CHARACTERIZATION REPORT
Page 52THEACADEMYOF NATURALSCIENCES
THEACADEMYOF NATURALSCIENCES
by New York typically used to treat the WQV are generally effective at removing 80 to 85 percent ofpollutants.
In addition to construction activities, discharges from Municipal Separate Storm Sewer Systems (MS4s)in Urbanized or Additionally Designated Areas are also regulated, and must be authorized inaccordance with a permit for stormwater discharges from MS4s. According to NYSDEC, there are noMS4s located within the Black River Watershed. Thus, there is presently no means to regulateseparate storm sewer systems in the Black Creek Watershed.

BLACK RIVER WATERSHED MANAGEMENT PLAN
CHARACTERIZATION REPORT
Page 53THEACADEMYOF NATURALSCIENCES
THEACADEMYOF NATURALSCIENCES
ENDNOTES
i The 2004 Black River Basin Waterbody Inventory and Priority Waterbodies List, Bureau of Watershed Assessment and ResearchDivision of Water, NYS Department of Environmental Conservation, May 2007 (http://www.dec.ny.gov/docs/water_pdf/pwlblck07.pdf)ii A Guide to Land-Use and Land-Cover Change (LUCC), Alex de Sherbinin, Columbia University Socioeconomic Data and ApplicationsCenter, September 2002 (http://sedac.ciesin.columbia.edu/tg/guide_frame.jsp?rd=LU&ds=1)iii The USGS Land Cover Institute Fact Sheet, U.S. Geological Survey, January 2006(http://landcover.usgs.gov/documents/LCI%20factsheet.pdf)iv Stream Health Rankings Predicted by Satellite Derived Land Cover Metrics, Marcia N. Snyder, Scott J. Goetz, and Robb K. Wright, Journalof the American Water Resources Association (JAWRA), June 2005(http://www.whrc.org/resources/published_literature/pdf/Snyderetal.JAWRA.05.pdf)v National Land Cover Database 2001 Factsheet, The Multi-Resolution Land Characteristics (MLRC) Consortium(http://www.mrlc.gov/pdf/nlcd_fact_sheet_2001.pdf)vi Water Quality on Forest Lands , U.S. Forest Service, April 2008 (http://www.fs.fed.us/rm/value/forest_water_quality.html)vii Forest Land Cover Effects on Water Quality, Institute of Water Research, Michigan State University, January 1997(http://www.iwr.msu.edu/edmodule/water/wtrfrm19.htm)viii Urban land Use Effects on Water Quality, Institute of Water Research, Michigan State University, January 1997(http://www.iwr.msu.edu/edmodule/water/wtrfrm20.htm)ix New York's Forest Preserve , New York State Department of Environmental Conservation, 2008 (http://www.dec.ny.gov/lands/4960.html)x Soil Survey of Oneida County, New York, U.S. Department of Agriculture Natural Resources Conservation Service, in partnership withCornell University, 2008xi Ibidxii Soil Survey of St. Lawrence County, New York, U.S. Department of Agriculture Natural Resources Conservation Service, in partnershipwith Cornell University, 2005xiii Watershed Protection for Adirondack Wetlands: A Demonstration-Level GIS Characterization of Subcatchments of the Oswegatchie/BlackRiver Watershed, K.M.Roy, R.P.Curran, J.W.Barge, D.M.Spada (New York State Adirondack Park Agency), D.J.Bogucki, E.B.Allen (StateUniversity of New York at Plattsburgh), and W.A.Kretser (Adirondack Lakes Survey Corporation), February 1996(http://www.apa.state.ny.us/Research/OB2/Reports/Ob1final.htm)xiv Wetlands and Wtaer Quality, North Carolina Cooperative Extension Service, Publication Number: AG 473-7, June 1996(http://www.bae.ncsu.edu/programs/extension/evans/ag473-7.html)xv Technical Aspects of Wetlands: Wetland Hydrology, Water Quality, and Associated Functions, National Water Summary on WetlandResources, U.S Geological Survey, March 1997 (http://water.usgs.gov/nwsum/WSP2425/hydrology.html)xvi Ibidxvii Primer on Natural Hazard Management in Integrated Regional Development Planning: Chapter 8 – Floodplain Definition and FloodHazard Assessment, Organization of American States, Department of Sustainable Development, 1991(http://www.oas.org/dsd/publications/Unit/oea66e/ch08.htm)xviii Ibidxix Groundwater Primer, Purdue University College of Engineering,, 1997(http://cobweb.ecn.purdue.edu/~epados/ground/src/confined2.htm)xx The Ecological Zones of Northern New York, G.B. Will, R.D. Stumvoll, R.F. Gotie, and E.S. Smith, New York Fish and Game JHournal,NYS Department of Environmental Conservation, Volume 29, No. 1, January 1982xxi A Biological Survey of the Oswegatchie and Black River Systems, J.R. Greeley, 1932. New York Biological Survey No. 6. State of NewYork Conservation District, Supp. to 21st annual report, 1931. 344 ppxxii The Ecological Zones of Northern New York, G.B. Will, R.D. Stumvoll, R.F. Gotie, and E.S. Smith, New York Fish and Game JHournal,NYS Department of Environmental Conservation, Volume 29, No. 1, January 1982xxiii Ibidxxiv A Biological Survey of the Oswegatchie and Black River Systems, J.R. Greeley, 1932. New York Biological Survey No. 6. State of NewYork Conservation District, Supp. to 21st annual report, 1931. 344 ppxxv Fishes of the Black River Watershed, Survey Update, D.M. Carlson, February 2007.xxvi Comprehensive Wildlife Conservation Strategy (CWCS) Plan, NYS Department of Environmental Conservation(http://www.dec.ny.gov/docs/wildlife_pdf/nathist.pdf)xxvii Fishes of the Black River Watershed, Survey Update, D.M. Carlson, February 2007.xxviii The Mammals of the Tug Hill Plateau, New York, P.F. Connor, 1966, Bull. 406 New York State Museum and Science Service. 82 pp.xxix Adirondack Mammals. D.A. Saunders, no date, State University of New York, College of Environmental Science and Forestry. 216 pp.xxx The Adirondack Atlas: A Geographic Portrait of the Adirondack Park, J.Jenkins and A. Keal, 2004, Wildlife Conservation Society. 274 pp.xxxi Adirondack Mammals. D.A. Saunders, no date, State University of New York, College of Environmental Science and Forestry. 216 pp.xxxii The Adirondack Atlas: A Geographic Portrait of the Adirondack Park, J.Jenkins and A. Keal, 2004, Wildlife Conservation Society. 274 pp.xxxiii New York State Breeding Bird Atlas 2000 [Internet]. 2000 - 2005. Release 1.0. Albany (New York): New York State Department ofEnvironmental Conservation. [updated 2007 Jun 11; cited 2008 Aug 13]. http://www.dec.ny.gov/animals/7312.html.xxxiv As defined by 6 NYCRR § 182.2(g) and 193.3(b)xxxv As defined by 6 NYCRR § 182.2(h) and 193.3(c)
BLACK RIVER WATERSHED MANAGEMENT PLAN
CHARACTERIZATION REPORT
Page 54THEACADEMYOF NATURALSCIENCES
THEACADEMYOF NATURALSCIENCES
xxxvi As defined by 6 NYCRR § 182.2(i)xxxvii Final Report of the Invasive Species Task Force, Invasive Species Task Force (ISTF), 2005. New York State Department of EnvironmentalConvervation and the New York State Department of Agriculture and Markets. Albany, NY. 146 pp.xxxviii Cryptic Invasion by a Non-native Genotype of the Common Reed, Phragmites australis, into North America, K.Saltonstall, 2002. Proc.Nat. Acad. Sci.: 99(4):2445-2449.xxxix The Atlas of breeding birds in New York State, R.F. Andrle and J.R. Carroll, 1988, Cornell University Press, Ithaca. 551 pp.xl Is purple loosestrife (Lythrum salicaria) an invasive threat to freshwater wetlands? Conflicting evidence from several ecological metrics. E.J.Farnsworth and D.R. Ellis, 2001, Wetlands 21(2):199-209.xli Wetland Vegetation Before and After Experimental Purple Loosestrife Removal, J.A. Morrison, 2002, Wetlands. 22(1):159-169.xlii Avian use of purple loosestrife dominated habitat relative to other vegetation types in a Lake Huron wetland complex, M.B. White, H.H.Prince, and R.R. Cox, Jr. 1999. Wilson Bull. 111(1):105-114.xliii Volunteer Monitoring of Nonindigenous Invasive Plant Species in the Adirondack Park, New York, USA, W.T. Brown, M.E. Krasny, and N.Schoch, 2001, Natural Areas J. 21:189-196.xliv Seed germinability and its seasonal onset of Japanese knotweed (Polygonum cuspidatum), M.R. Bram and J. N. McNair, 2004, 52(5):759-767.xlv Volunteer Monitoring of Nonindigenous Invasive Plant Species in the Adirondack Park, New York, USA, W.T. Brown, M.E. Krasny, and N.Schoch, 2001, Natural Areas J. 21:189-196.xlvi Comparison of fish and macroinvertebrate use of Typha angustifolia, Phragmites australis, and treated Phragmites marshes along the lowerConnecticut River, P.E. Fell, R.S. Warren, J.K. Light, R.L. Rawson, Jr., and S.M. Fairley, 2003, Estuaries 26(2B):534-551.xlvii Does Phragmites expansion alter the structure and function of marsh landscapes? Patterns and processes revealed, R.G. Lathrop, L.Windham, and P. Montesano, 2003, Esturaries 26(2B):423-435.xlviii Is the invasion of the common reed, Phragmites australis, into tidal marshes of the eastern US an ecological disaster? J.S.Weis and P.Weis, 2003, Mar. Poll. Bull. 46:816-820.xlix Volunteer Monitoring of Nonindigenous Invasive Plant Species in the Adirondack Park, New York, USA, W.T. Brown, M.E. Krasny, and N.Schoch, 2001, Natural Areas J. 21:189-196.l Rhamnus cathartica: Native and naturalized distribution and habitat preferences, J S Kurylo, K.S. Knight, J.R. Stewart, and A.G. Endress,2007, Journal of the Torrey Botanical Society 134: 420-430.li Ibidlii Volunteer Monitoring of Nonindigenous Invasive Plant Species in the Adirondack Park, New York, USA, W.T. Brown, M.E. Krasny, and N.Schoch, 2001, Natural Areas J. 21:189-196.liii Ibidliv Dreissena rostriformis bugensis Fact Sheet, USGS Nonindigenous Aquatic Species Database, A.J. Benson, M.M. Richardosn, and E.Maynard, March 2008 (http://nas.er.usgs.gov/queries/FactSheet.asp?speciesID=95)lv Round goby mediated viral distribution and impacts to smallmouth bass in the St. Lawrence River, G. Eckerlin, J. Farrell, P. Bowser, and G.Groocock, 2008, Annual Meeting of the American Fisheries Society, Ottawa, Canada, 17-21 August, 2008.lvi Fishes of the Black River Watershed, Survey Update, D.M. Carlson, February 2007.lvii Final Report of the Invasive Species Task Force, Invasive Species Task Force (ISTF), 2005. New York State Department of EnvironmentalConvervation and the New York State Department of Agriculture and Markets. Albany, NY. 146 pp.lviii Viral Hemorrhagic Septicemia Virus (VHSV): Development of improved detection methodologies and viral stability at variousenvironmental conditions, K.Garver, L. Hawley, and S. Edes, 2008, Annual Meeting of the American Fisheries Society, Ottawa, Canada, 17-21 August, 2008.lix Emergence of Viral Hemorrhagic Septicemia Virus among populations of wild fish in the Great Lakes Region of the United States andCanada, J. Winton, 2008. Annual Meeting of the American Fisheries Society, Ottawa, Canada, 17-21 August, 2008.lx Facts on Viral Hemorrhagic Septicemia (VHS), Wisconsin Department of Natural Resources, April 2008(http://dnr.wi.gov/fish/vhs/vhsfacts.html)lxi Emergence of Viral Hemorrhagic Septicemia in the Great Lakes basin: lessons learned and effectiveness of surveillance strategies, M. Faisal.and R. Kim, 2008, Annual Meeting of the American Fisheries Society, Ottawa, Canada, 17-21 August, 2008.lxii Die-off of muskellunge (Esox masquinongy) in the Upper St. Lawrence River caused by Viral Haemorrhagic Septicaemia, 2005-2007impacts and consequences, J. Casselman, T. Lusk, J. Farrell, and C. Lake, 2008, Annual Meeting of the American Fisheries Society, Ottawa,Canada, 17-21 August, 2008.lxiii Final Report of the Invasive Species Task Force, Invasive Species Task Force (ISTF), 2005. New York State Department of EnvironmentalConvervation and the New York State Department of Agriculture and Markets. Albany, NY. 146 pp.lxiv Volunteer Monitoring of Nonindigenous Invasive Plant Species in the Adirondack Park, New York, USA, W.T. Brown, M.E. Krasny, and N.Schoch, 2001, Natural Areas J. 21:189-196.lxv New York State Water Quality 305b Report, New York State Department of Environmental Conservation (NYSDEC), 2006(http://www.dec.ny.gov/docs/water_pdf/305breport2006.pdf.)lxvi The New York State 2006 Section 303(d) List of Impaired Waters Requiring a TMDL/Other strategy, New York State Department ofEnvironmental Conservation (NYSDEC), 2006. (http://www.dec.ny.gov/docs/water_pdf/303dlist06.pdf)lxvii The Black River Drainage Basin, sampling years 2002-2003. New York State Department of Environmental Conservation (NYSDEC),Rotating Integrated Basin Studies, Water Quality Assessment Program, New York Statewide Waters Monitoring Program, 2006, 90 pp.lxviii Response of surface water chemistry to reduced levels of acid precipitation: comparison of trends in two regions of New York, USA, D.A.Burns, M.R. McHale, C.T. Driscoll, and K.M. Roy, 2005, Hydrological processes 20(7):1611-1627.
BLACK RIVER WATERSHED MANAGEMENT PLAN
CHARACTERIZATION REPORT
Page 55THEACADEMYOF NATURALSCIENCES
THEACADEMYOF NATURALSCIENCES
lxix Changes in the chemistry of lakes in the Adirondack region of New York following declines in acidic deposition, C.T. Driscoll, K.M..Driscoll, K.M. Roy, and J. Dukett, 2007, Applied Geochemistry 22(6):1181-1188.lxx Ibidlxxi Assessing Changes in Fish Assemblages in Adirondack Lakes, R. Daniels, R. Bombard, J. Sutherland, and C. Boylen, 2008, NortheasternNatural History Conference, April 17-18, 2008, Albany, NY.lxxii Acid Rain in the Adirondacks: A Time of Change!, K. Roy, W. Kretser, H. Simonin, and E. Bennett, 2000, Adirondack J. Env. Studies.Spring/summer 2000:26-32.lxxiii Effects of acid rain on the chemistry of Western Adirondack streams in 2003-2005. Wet and Dry deposition measurements : Do we havethe total picture?, G.B.Lawrence, K.M. Roy, B.P. Baldigo, H.A. Simonin, S.B. Capone, J.W. Sutherland, S.A. Nierzwicki-Bauer, and C.R.Boylen, 2007, Abstracts of the Meeting of the National Acid Deposition Program, Boulder, CO, 10-13 September, 2007. p 30.lxxiv Acid Rain in the Adirondacks: A Time of Change!, K. Roy, W. Kretser, H. Simonin, and E. Bennett, 2000, Adirondack J. Env. Studies.Spring/summer 2000:26-32.lxxv Hardwood regeneration failure in the Adirondacks. Preliminary studies of Incidence and Severity, J. Jenkins, 1997, Working Paper no. 9.Wildlife Conservation Society. 60 pp.lxxvi Adverse effects of acid rain on the distribution of the wood thrush Hylocichla mustelina in North America, R.S. Haines, K.V. Rosenberg,J.D. Lowe, S.E. Barker, and A.A. Dhondt, 2002, Proc. Nat. Acad. Sci. 99(17):11235-11240.lxxvii Biological Mercury Hotspots in the Northeastern United States and Southeastern Canada, D.C Evers, Y. Han, C.T. Driscoll, N.C.Kamman, M.W. Goodale, K.F. Lambert, T.M. Holsen, C.Y. Chen, T.A. Clair, and T. Butler, 2007, BioScience 57(1):29–43lxxviii New York State Water Quality 305b Report, New York State Department of Environmental Conservation (NYSDEC), 2006(http://www.dec.ny.gov/docs/water_pdf/305breport2006.pdf.)lxxix Ibidlxxx Ibidlxxxi The New York State 2006 Section 303(d) List of Impaired Waters Requiring a TMDL/Other strategy, New York State Department ofEnvironmental Conservation (NYSDEC), 2006. (http://www.dec.ny.gov/docs/water_pdf/303dlist06.pdf)lxxxii The 2004 Black River Basin Waterbody Inventory and Priority Waterbodies List, Bureau of Watershed Assessment and ResearchDivision of Water, NYS Department of Environmental Conservation, May 2007 (http://www.dec.ny.gov/docs/water_pdf/pwlblck07.pdf)lxxxiii The draft New York State 2008 Section 303(d) List of Impaired Waters Requiring a TMDL/Other strategy, New York State Department ofEnvironmental Conservation (NYSDEC), 2008 (http://www.dec.ny.gov/docs/water_pdf/303dlistdraft08.pdf)lxxxiv An Adirondack Chronology, G Chilson, C. George, R. Tucker, and T. Wheeler, 2003, Association for the Protection of the Adirondacks.157 pp.lxxxv The Adirondack Atlas; A Geographic Portrait of the Adirondack Park, J. Jenkins and A. Teal, 2004, Wildlife Conservation Society,Syracuse University and The Adirondack Museum. 275 pp.lxxxvi Ibid