miles river watershed characterizationdnr.maryland.gov/waters/documents/wras/miles_char.pdfmiles...
TRANSCRIPT
Miles River Watershed Characterization
April 2006
In Support of Talbot County’s Watershed Restoration Action Strategy for Miles River Watershed
DEPARTMENT OF THE ENVIRONMENT
Montgomery Business Park Center
1800 Washington Boulevard, Suite 540 Baltimore MD 21230-1718
Product of the Maryland Department of the Environment In Partnership with Talbot County
TABLE OF CONTENTS
CONTRIBUTORS............................................................................................................. iii LIST OF MAPS AND TABLES ....................................................................................... iii LIST OF APPENDICES.................................................................................................... iv
Appendix A: Rare, Threatened, and Endangered Species. ............................................ iv Appendix B: Green Infrastructure. ................................................................................ iv
ACRONYMS...................................................................................................................... v INTRODUCTION .............................................................................................................. 1
Watershed Planning Background.................................................................................... 1 Miles River WRAS Project............................................................................................. 1 Purpose of the Characterization ...................................................................................... 1 More Sources of Information.......................................................................................... 2
WATER QUALITY............................................................................................................ 2 Designated Uses For Streams ......................................................................................... 2 Use Impairments ............................................................................................................. 3
Bacteria ....................................................................................................................... 3 Nutrients and Suspended Sediments........................................................................... 3 Total Maximum Daily Loads...................................................................................... 3
Water Quality Monitoring............................................................................................... 4 Overview..................................................................................................................... 4 MDE Shellfish Certification Division ........................................................................ 5 Synoptic Survey.......................................................................................................... 5 Stream Corridor Assessment (SCA) ........................................................................... 5 Maryland Biological Stream Survey (MBSS)/Stream Waders................................... 5 Talbot County Creekwatchers..................................................................................... 6
Groundwater ................................................................................................................... 6 Point Sources .................................................................................................................. 7 Fish Blockages ................................................................................................................ 7
LIVING RESOURCES AND HABITAT .......................................................................... 9 Fish and Fisheries ........................................................................................................... 9
Yellow Perch............................................................................................................... 9 White Perch............................................................................................................... 10 Fish Consumption Advisories................................................................................... 10 Shellfish .................................................................................................................... 11 Maryland Biological Stream Survey (MBSS) .......................................................... 12
Sensitive Species........................................................................................................... 13 Chesapeake Bay Critical Area Act ............................................................................... 13 Submerged Aquatic Vegetation .................................................................................... 14
LANDSCAPE................................................................................................................... 14 Land Use / Land Cover ................................................................................................. 14 Protected Lands............................................................................................................. 15
Public Lands.............................................................................................................. 15
i
Private Lands ............................................................................................................ 15 Rural Legacy............................................................................................................. 15
Soils............................................................................................................................... 15 Green Infrastructure ...................................................................................................... 16 Large Forest Blocks ...................................................................................................... 16 Wetlands ....................................................................................................................... 17
Wetland Functions .................................................................................................... 17 Wetland Categories................................................................................................... 18 Tracking Wetlands .................................................................................................... 19
Floodplains.................................................................................................................... 19 Shoreline and Sea Level Rise ....................................................................................... 20 Stream Buffers .............................................................................................................. 20
Benefits of Stream Buffers........................................................................................ 20 Land Use Adjacent to Streams.................................................................................. 20
RESTORATION TARGETING TOOLS......................................................................... 21 Stream Corridor Assessment......................................................................................... 21 Synoptic Survey and MBSS.......................................................................................... 21 Agricultural Conservation Programs ............................................................................ 21 Fish Blockage Removal ................................................................................................ 21 Stream Buffer Restoration ............................................................................................ 22 Headwater Streams ....................................................................................................... 22 Optimizing Water Quality Benefits by Combining Priorities....................................... 22 Wetland Restoration...................................................................................................... 23
POTENTIAL BENCHMARKS FOR WRAS GOAL SETTING..................................... 23 Water Quality Standards and TMDLs .......................................................................... 23 Chesapeake 2000 Agreement........................................................................................ 24 Water Quality Improvement Act of 1998 ..................................................................... 25
REFERENCES ................................................................................................................. 26
ii
CONTRIBUTORS
Local Martin Sokolich, Talbot County Office of Planning & Zoning. State and Federal Maryland Department of Natural Resources (MDNR): Lynn Davidson, Ken Shanks. Maryland Department of the Environment (MDE): Denise Clearwater, Joseph Beaman, Niles Primrose, and Kathy Brohawn. Primary Authors and Editors: Kathleen Ellis, Rita Bruckler, Danielle Lucid, MDE; Ken Shanks, MDNR (Green Infrastructure and other contributions).
LIST OF MAPS AND TABLES Map 1 Location 2 WRAS Project Area 3 Water Monitoring and Marinas 4 MDE Permits 5 Sensitive Species 6 Submerged Aquatic Vegetation 7 Land Use/Land Cover 8 Protected Lands 9 Soils Important for Watershed Planning 10 Large Block Forest 11 Wetlands and Floodplains 12 LU/LC at Streams’ Edge Table 1 Status and Trends for a Monitoring Site in the Eastern Bay. 2 MDE Permits. 3 Miles River Fish and Shellfish Toxics Screen. 4 Miles River White Perch Consumption Criteria. 5 Oyster Harvest from the Miles River. 6 Maryland Land Use Distribution for Miles River Watershed. 7 Wetland Functions. 8 Wetland Types in the Miles River Watershed.
iii

LIST OF APPENDICES Appendix A: Rare, Threatened, and Endangered Species. Appendix B: Green Infrastructure.
iv
ACRONYMS
303(d) list – List of impaired waters BIBI – Benthic Index of Biotic Integrity BMP – Best Management Practices C2K – Chesapeake 2000 Agreement COMAR – Code of Maryland Regulations CREP - Conservation Reserve Enhancement Program CRP - Conservation Reserve Program CwiC - Chesapeake 2000 Watershed Commitments EPA – Environmental Protection Agency EQIP - Environmental Quality Incentive Program FIBI – Fish Index of Biotic Integrity FIDS - Forest interior dwelling species GIS – Geographic Information Systems IBI – Index of Biotic Integrity MACS - Maryland Agricultural Cost-Share program MBSS – Maryland Biological Stream Survey MDE – Maryland Department of the Environment MDNR – Maryland Department of Natural Resources MGS – Maryland Geological Survey MPN – Most Probable Number NPDES - National Pollution Discharge Elimination System RTE – Rare, Threatened or Endangered species SAV – Submerged Aquatic Vegetation SCA – Stream Corridor Assessment STORET - STOrage and RETrieval TMDL – Total Maximum Daily Load USGS – United States Geological Survey WRAS – Watershed Restoration Action Strategy WSSC - Non-Tidal Wetland of Special State Concern
v
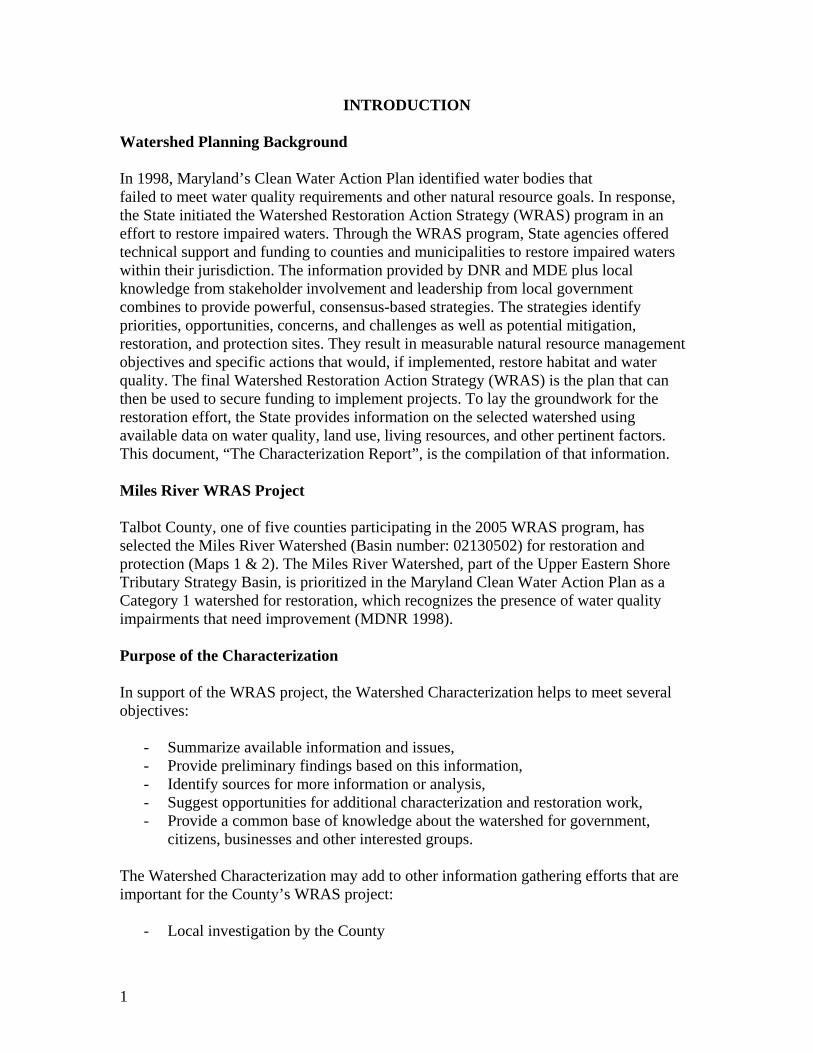
INTRODUCTION Watershed Planning Background In 1998, Maryland’s Clean Water Action Plan identified water bodies that failed to meet water quality requirements and other natural resource goals. In response, the State initiated the Watershed Restoration Action Strategy (WRAS) program in an effort to restore impaired waters. Through the WRAS program, State agencies offered technical support and funding to counties and municipalities to restore impaired waters within their jurisdiction. The information provided by DNR and MDE plus local knowledge from stakeholder involvement and leadership from local government combines to provide powerful, consensus-based strategies. The strategies identify priorities, opportunities, concerns, and challenges as well as potential mitigation, restoration, and protection sites. They result in measurable natural resource management objectives and specific actions that would, if implemented, restore habitat and water quality. The final Watershed Restoration Action Strategy (WRAS) is the plan that can then be used to secure funding to implement projects. To lay the groundwork for the restoration effort, the State provides information on the selected watershed using available data on water quality, land use, living resources, and other pertinent factors. This document, “The Characterization Report”, is the compilation of that information. Miles River WRAS Project Talbot County, one of five counties participating in the 2005 WRAS program, has selected the Miles River Watershed (Basin number: 02130502) for restoration and protection (Maps 1 & 2). The Miles River Watershed, part of the Upper Eastern Shore Tributary Strategy Basin, is prioritized in the Maryland Clean Water Action Plan as a Category 1 watershed for restoration, which recognizes the presence of water quality impairments that need improvement (MDNR 1998). Purpose of the Characterization In support of the WRAS project, the Watershed Characterization helps to meet several objectives:
- Summarize available information and issues, - Provide preliminary findings based on this information, - Identify sources for more information or analysis, - Suggest opportunities for additional characterization and restoration work, - Provide a common base of knowledge about the watershed for government,
citizens, businesses and other interested groups.
The Watershed Characterization may add to other information gathering efforts that are important for the County’s WRAS project:
- Local investigation by the County
1
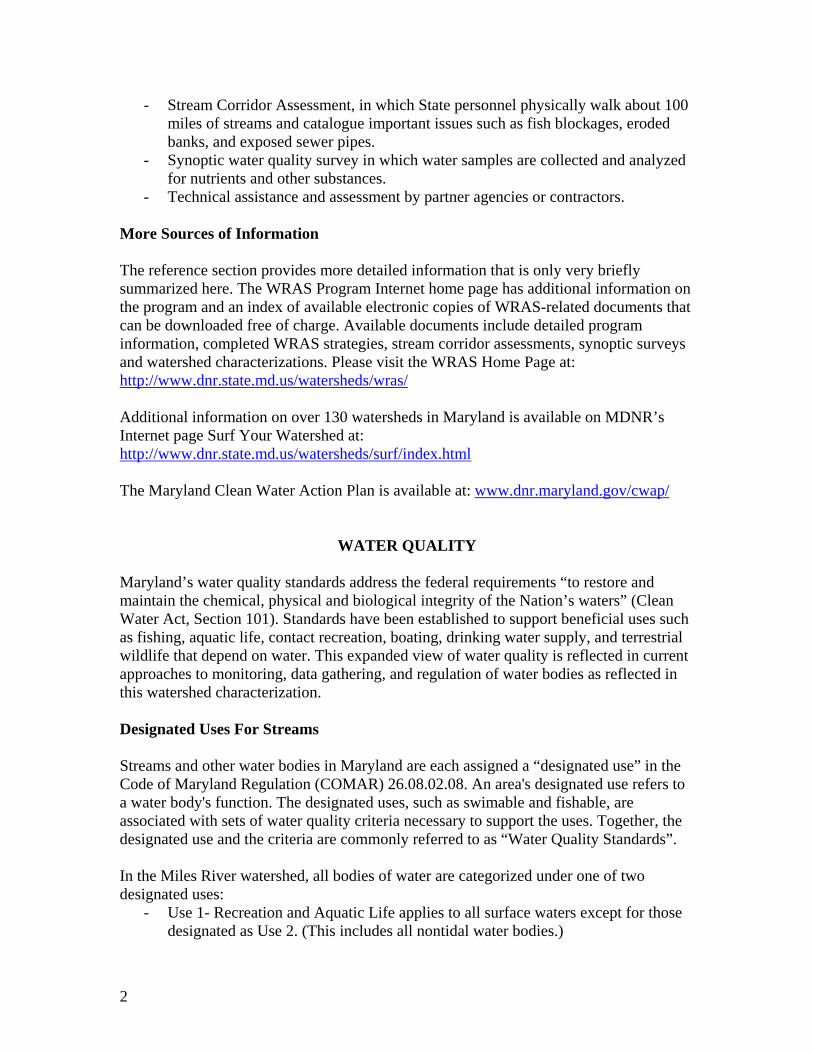
- Stream Corridor Assessment, in which State personnel physically walk about 100 miles of streams and catalogue important issues such as fish blockages, eroded banks, and exposed sewer pipes.
- Synoptic water quality survey in which water samples are collected and analyzed for nutrients and other substances.
- Technical assistance and assessment by partner agencies or contractors. More Sources of Information The reference section provides more detailed information that is only very briefly summarized here. The WRAS Program Internet home page has additional information on the program and an index of available electronic copies of WRAS-related documents that can be downloaded free of charge. Available documents include detailed program information, completed WRAS strategies, stream corridor assessments, synoptic surveys and watershed characterizations. Please visit the WRAS Home Page at: http://www.dnr.state.md.us/watersheds/wras/ Additional information on over 130 watersheds in Maryland is available on MDNR’s Internet page Surf Your Watershed at: http://www.dnr.state.md.us/watersheds/surf/index.html The Maryland Clean Water Action Plan is available at: www.dnr.maryland.gov/cwap/
WATER QUALITY Maryland’s water quality standards address the federal requirements “to restore and maintain the chemical, physical and biological integrity of the Nation’s waters” (Clean Water Act, Section 101). Standards have been established to support beneficial uses such as fishing, aquatic life, contact recreation, boating, drinking water supply, and terrestrial wildlife that depend on water. This expanded view of water quality is reflected in current approaches to monitoring, data gathering, and regulation of water bodies as reflected in this watershed characterization. Designated Uses For Streams Streams and other water bodies in Maryland are each assigned a “designated use” in the Code of Maryland Regulation (COMAR) 26.08.02.08. An area's designated use refers to a water body's function. The designated uses, such as swimable and fishable, are associated with sets of water quality criteria necessary to support the uses. Together, the designated use and the criteria are commonly referred to as “Water Quality Standards”. In the Miles River watershed, all bodies of water are categorized under one of two designated uses:
- Use 1- Recreation and Aquatic Life applies to all surface waters except for those designated as Use 2. (This includes all nontidal water bodies.)
2
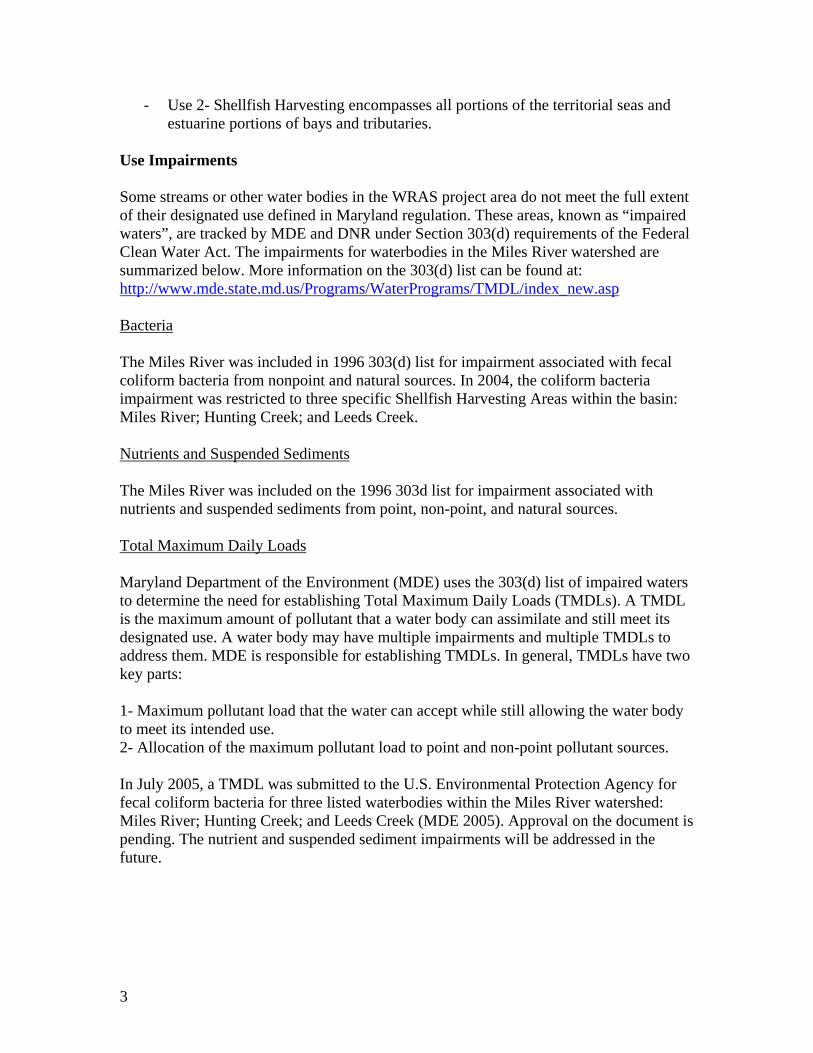
- Use 2- Shellfish Harvesting encompasses all portions of the territorial seas and estuarine portions of bays and tributaries.
Use Impairments Some streams or other water bodies in the WRAS project area do not meet the full extent of their designated use defined in Maryland regulation. These areas, known as “impaired waters”, are tracked by MDE and DNR under Section 303(d) requirements of the Federal Clean Water Act. The impairments for waterbodies in the Miles River watershed are summarized below. More information on the 303(d) list can be found at: http://www.mde.state.md.us/Programs/WaterPrograms/TMDL/index_new.asp Bacteria The Miles River was included in 1996 303(d) list for impairment associated with fecal coliform bacteria from nonpoint and natural sources. In 2004, the coliform bacteria impairment was restricted to three specific Shellfish Harvesting Areas within the basin: Miles River; Hunting Creek; and Leeds Creek. Nutrients and Suspended Sediments The Miles River was included on the 1996 303d list for impairment associated with nutrients and suspended sediments from point, non-point, and natural sources. Total Maximum Daily Loads Maryland Department of the Environment (MDE) uses the 303(d) list of impaired waters to determine the need for establishing Total Maximum Daily Loads (TMDLs). A TMDL is the maximum amount of pollutant that a water body can assimilate and still meet its designated use. A water body may have multiple impairments and multiple TMDLs to address them. MDE is responsible for establishing TMDLs. In general, TMDLs have two key parts: 1- Maximum pollutant load that the water can accept while still allowing the water body to meet its intended use. 2- Allocation of the maximum pollutant load to point and non-point pollutant sources. In July 2005, a TMDL was submitted to the U.S. Environmental Protection Agency for fecal coliform bacteria for three listed waterbodies within the Miles River watershed: Miles River; Hunting Creek; and Leeds Creek (MDE 2005). Approval on the document is pending. The nutrient and suspended sediment impairments will be addressed in the future.
3
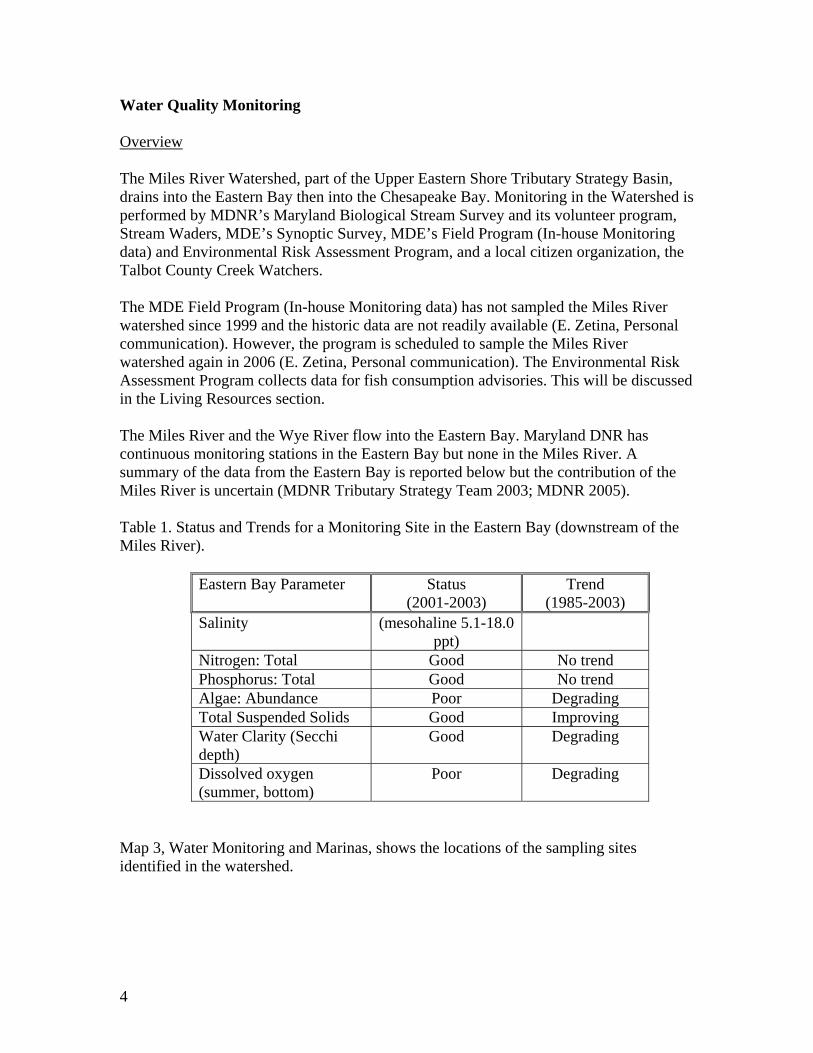
Water Quality Monitoring Overview The Miles River Watershed, part of the Upper Eastern Shore Tributary Strategy Basin, drains into the Eastern Bay then into the Chesapeake Bay. Monitoring in the Watershed is performed by MDNR’s Maryland Biological Stream Survey and its volunteer program, Stream Waders, MDE’s Synoptic Survey, MDE’s Field Program (In-house Monitoring data) and Environmental Risk Assessment Program, and a local citizen organization, the Talbot County Creek Watchers. The MDE Field Program (In-house Monitoring data) has not sampled the Miles River watershed since 1999 and the historic data are not readily available (E. Zetina, Personal communication). However, the program is scheduled to sample the Miles River watershed again in 2006 (E. Zetina, Personal communication). The Environmental Risk Assessment Program collects data for fish consumption advisories. This will be discussed in the Living Resources section. The Miles River and the Wye River flow into the Eastern Bay. Maryland DNR has continuous monitoring stations in the Eastern Bay but none in the Miles River. A summary of the data from the Eastern Bay is reported below but the contribution of the Miles River is uncertain (MDNR Tributary Strategy Team 2003; MDNR 2005). Table 1. Status and Trends for a Monitoring Site in the Eastern Bay (downstream of the Miles River).
Eastern Bay Parameter Status
(2001-2003) Trend
(1985-2003) Salinity (mesohaline 5.1-18.0
ppt)
Nitrogen: Total Good No trend Phosphorus: Total Good No trend Algae: Abundance Poor Degrading Total Suspended Solids Good Improving Water Clarity (Secchi depth)
Good Degrading
Dissolved oxygen (summer, bottom)
Poor Degrading
Map 3, Water Monitoring and Marinas, shows the locations of the sampling sites identified in the watershed.
4
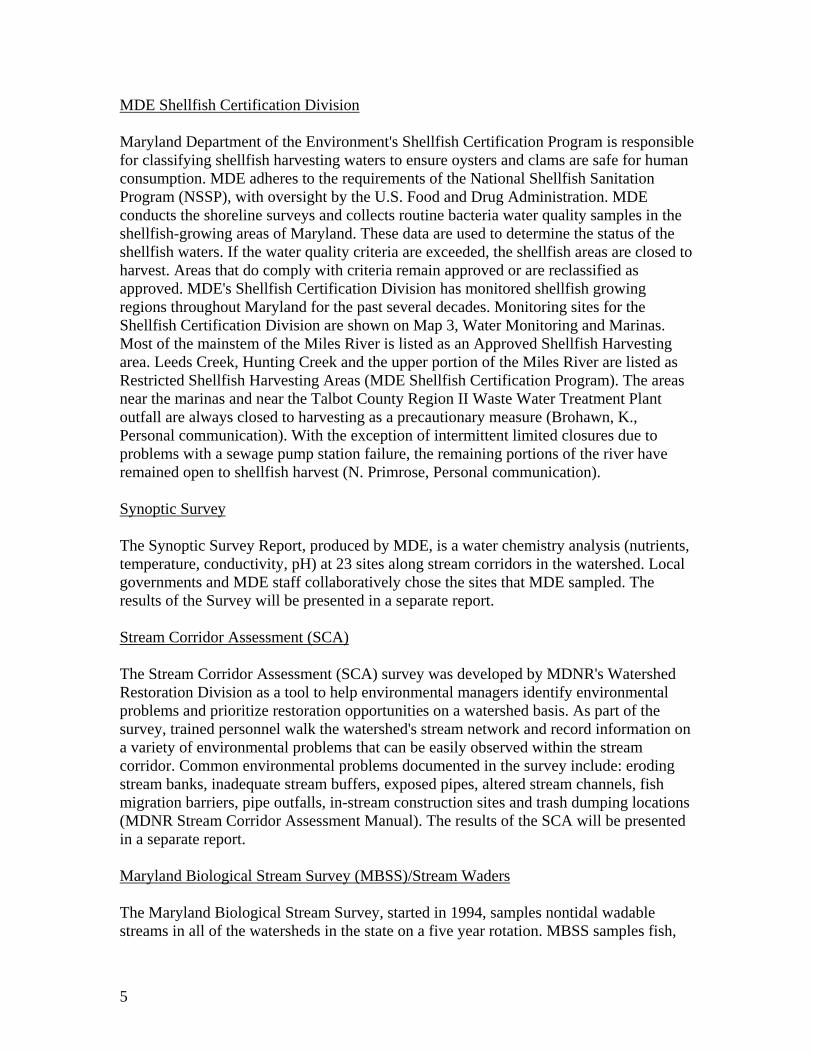
MDE Shellfish Certification Division Maryland Department of the Environment's Shellfish Certification Program is responsible for classifying shellfish harvesting waters to ensure oysters and clams are safe for human consumption. MDE adheres to the requirements of the National Shellfish Sanitation Program (NSSP), with oversight by the U.S. Food and Drug Administration. MDE conducts the shoreline surveys and collects routine bacteria water quality samples in the shellfish-growing areas of Maryland. These data are used to determine the status of the shellfish waters. If the water quality criteria are exceeded, the shellfish areas are closed to harvest. Areas that do comply with criteria remain approved or are reclassified as approved. MDE's Shellfish Certification Division has monitored shellfish growing regions throughout Maryland for the past several decades. Monitoring sites for the Shellfish Certification Division are shown on Map 3, Water Monitoring and Marinas. Most of the mainstem of the Miles River is listed as an Approved Shellfish Harvesting area. Leeds Creek, Hunting Creek and the upper portion of the Miles River are listed as Restricted Shellfish Harvesting Areas (MDE Shellfish Certification Program). The areas near the marinas and near the Talbot County Region II Waste Water Treatment Plant outfall are always closed to harvesting as a precautionary measure (Brohawn, K., Personal communication). With the exception of intermittent limited closures due to problems with a sewage pump station failure, the remaining portions of the river have remained open to shellfish harvest (N. Primrose, Personal communication). Synoptic Survey The Synoptic Survey Report, produced by MDE, is a water chemistry analysis (nutrients, temperature, conductivity, pH) at 23 sites along stream corridors in the watershed. Local governments and MDE staff collaboratively chose the sites that MDE sampled. The results of the Survey will be presented in a separate report. Stream Corridor Assessment (SCA) The Stream Corridor Assessment (SCA) survey was developed by MDNR's Watershed Restoration Division as a tool to help environmental managers identify environmental problems and prioritize restoration opportunities on a watershed basis. As part of the survey, trained personnel walk the watershed's stream network and record information on a variety of environmental problems that can be easily observed within the stream corridor. Common environmental problems documented in the survey include: eroding stream banks, inadequate stream buffers, exposed pipes, altered stream channels, fish migration barriers, pipe outfalls, in-stream construction sites and trash dumping locations (MDNR Stream Corridor Assessment Manual). The results of the SCA will be presented in a separate report. Maryland Biological Stream Survey (MBSS)/Stream Waders The Maryland Biological Stream Survey, started in 1994, samples nontidal wadable streams in all of the watersheds in the state on a five year rotation. MBSS samples fish,
5

benthic macroinvertebrates, water chemistry and habitat. An index of biointegrity (IBI) is calculated for fish and benthic macroinvertebrates. The IBI score is a quantitative rating of the health of the fish or benthic macroinvertebrate assemblage found at each site. The survey is based on a probabilistic stream sampling approach where random selections are made from all sections of streams in the state that can physically be sampled. The approach supports statistically-valid population estimation of variables of interest (e.g., largemouth bass densities, miles of streams with degraded physical habitat, etc.) (MDNR MBSS). In 2000, MBSS started a volunteer program, Stream Waders, to increase the density of samples taken in sub-watersheds of about 8 sq. miles. Stream Waders sample in the same watersheds as the MBSS program but sample only benthic macroinvertebrates. In the 2000-2004 cycle of the MBSS, two sites in the Miles River watershed were sampled. The Fish Index of Biotic Integrity (FIBI) was poor for both locations, Hunting Creek and an unnamed tributary of Potts Mill Creek. However, the Benthic IBI was good at Potts Mills Creek and the dissolved oxygen level was 8.4 milligrams per liter (mg/L). The Benthic IBI was poor at Hunting Creek and the dissolved oxygen was 2.2 mg/L (MDNR MBSS Searchable Database). In 2005, MBSS and Stream Waders sampled in the Miles River watershed. MBSS will present their data in a separate report along with all previous MBSS/Stream Waders data for this watershed. More information on the MBSS/Stream Waders programs can be found at: http://www.dnr.state.md.us/streams/mbss/index.html Talbot County Creekwatchers A volunteer organization, the Talbot County Creekwatchers, has a sampling program in the County that includes the Miles River watershed. Their sites are shown on Map 3 marked as Private Groups/Local Subdivision (as the data are listed in STORET). In 2001 and 2002 they found low dissolved oxygen concentrations (< 5 mg/L) in 5% of their samples. In 2003, 8.9% of the samples from the Miles River watershed had low dissolved oxygen (Talbot County Creekwatchers, 2004). Groundwater Most of the water needs in Queen Anne's and Talbot Counties come from the Coastal Plain aquifers (about 77 percent in 1997) (Drummond, 2001). Because of its excellent water quality and wide extent, the Aquia aquifer is probably the most important. The Aquia aquifer is shallow in the vicinity of the Chesapeake Bay and water levels have declined below sea level. This has caused problems with brackish-water intrusion in some parts of the aquifer (Drummond, 2001). Elevated chloride concentrations were detected in water from the Aquia aquifer in western Talbot County but a wide spread problem was not apparent (Drummond, 2001). Although Easton is just outside of the Miles River watershed, the Town’s water use might influence water levels and salt water intrusion in the aquifers under the watershed. Easton Utilities oversees and maintains the water supply for the Town of Easton. Easton
6
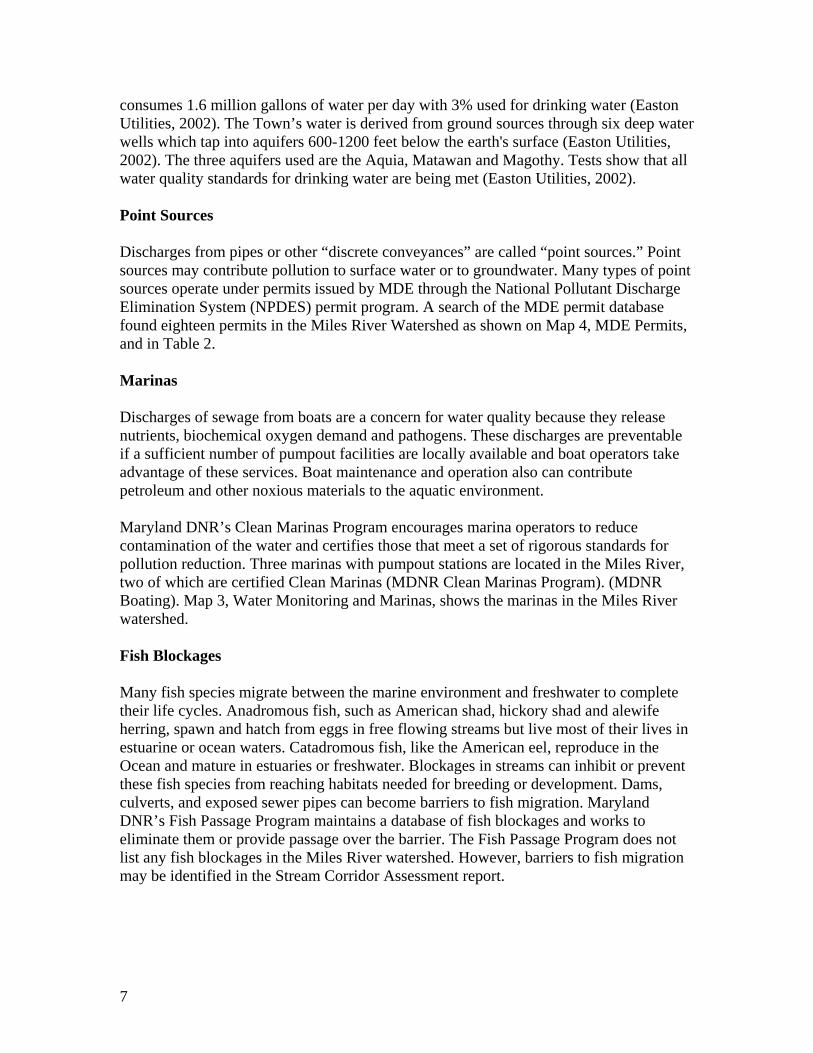
consumes 1.6 million gallons of water per day with 3% used for drinking water (Easton Utilities, 2002). The Town’s water is derived from ground sources through six deep water wells which tap into aquifers 600-1200 feet below the earth's surface (Easton Utilities, 2002). The three aquifers used are the Aquia, Matawan and Magothy. Tests show that all water quality standards for drinking water are being met (Easton Utilities, 2002). Point Sources Discharges from pipes or other “discrete conveyances” are called “point sources.” Point sources may contribute pollution to surface water or to groundwater. Many types of point sources operate under permits issued by MDE through the National Pollutant Discharge Elimination System (NPDES) permit program. A search of the MDE permit database found eighteen permits in the Miles River Watershed as shown on Map 4, MDE Permits, and in Table 2. Marinas Discharges of sewage from boats are a concern for water quality because they release nutrients, biochemical oxygen demand and pathogens. These discharges are preventable if a sufficient number of pumpout facilities are locally available and boat operators take advantage of these services. Boat maintenance and operation also can contribute petroleum and other noxious materials to the aquatic environment. Maryland DNR’s Clean Marinas Program encourages marina operators to reduce contamination of the water and certifies those that meet a set of rigorous standards for pollution reduction. Three marinas with pumpout stations are located in the Miles River, two of which are certified Clean Marinas (MDNR Clean Marinas Program). (MDNR Boating). Map 3, Water Monitoring and Marinas, shows the marinas in the Miles River watershed. Fish Blockages Many fish species migrate between the marine environment and freshwater to complete their life cycles. Anadromous fish, such as American shad, hickory shad and alewife herring, spawn and hatch from eggs in free flowing streams but live most of their lives in estuarine or ocean waters. Catadromous fish, like the American eel, reproduce in the Ocean and mature in estuaries or freshwater. Blockages in streams can inhibit or prevent these fish species from reaching habitats needed for breeding or development. Dams, culverts, and exposed sewer pipes can become barriers to fish migration. Maryland DNR’s Fish Passage Program maintains a database of fish blockages and works to eliminate them or provide passage over the barrier. The Fish Passage Program does not list any fish blockages in the Miles River watershed. However, barriers to fish migration may be identified in the Stream Corridor Assessment report.
7
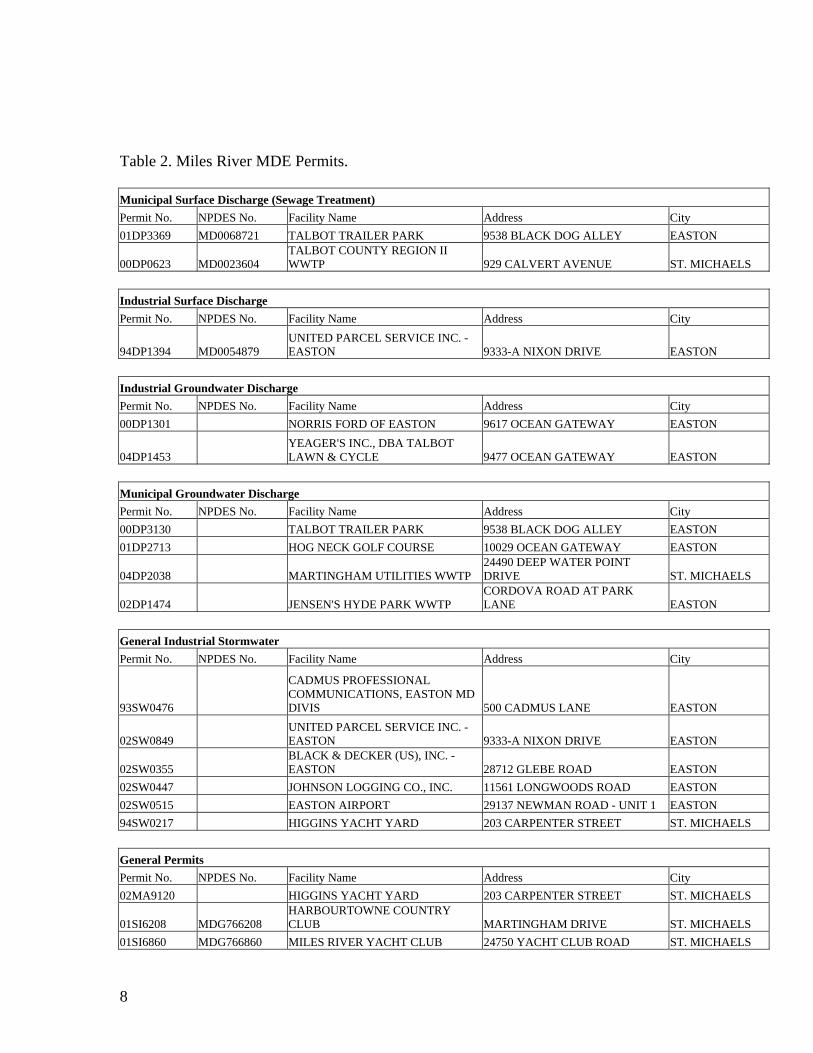
Table 2. Miles River MDE Permits. Municipal Surface Discharge (Sewage Treatment) Permit No. NPDES No. Facility Name Address City 01DP3369 MD0068721 TALBOT TRAILER PARK 9538 BLACK DOG ALLEY EASTON
00DP0623 MD0023604 TALBOT COUNTY REGION II WWTP 929 CALVERT AVENUE ST. MICHAELS
Industrial Surface Discharge Permit No. NPDES No. Facility Name Address City
94DP1394 MD0054879 UNITED PARCEL SERVICE INC. - EASTON 9333-A NIXON DRIVE EASTON
Industrial Groundwater Discharge Permit No. NPDES No. Facility Name Address City 00DP1301 NORRIS FORD OF EASTON 9617 OCEAN GATEWAY EASTON
04DP1453 YEAGER'S INC., DBA TALBOT LAWN & CYCLE 9477 OCEAN GATEWAY EASTON
Municipal Groundwater Discharge Permit No. NPDES No. Facility Name Address City 00DP3130 TALBOT TRAILER PARK 9538 BLACK DOG ALLEY EASTON 01DP2713 HOG NECK GOLF COURSE 10029 OCEAN GATEWAY EASTON
04DP2038 MARTINGHAM UTILITIES WWTP 24490 DEEP WATER POINT DRIVE ST. MICHAELS
02DP1474 JENSEN'S HYDE PARK WWTP CORDOVA ROAD AT PARK LANE EASTON
General Industrial Stormwater Permit No. NPDES No. Facility Name Address City
93SW0476
CADMUS PROFESSIONAL COMMUNICATIONS, EASTON MD DIVIS 500 CADMUS LANE EASTON
02SW0849 UNITED PARCEL SERVICE INC. - EASTON 9333-A NIXON DRIVE EASTON
02SW0355 BLACK & DECKER (US), INC. - EASTON 28712 GLEBE ROAD EASTON
02SW0447 JOHNSON LOGGING CO., INC. 11561 LONGWOODS ROAD EASTON 02SW0515 EASTON AIRPORT 29137 NEWMAN ROAD - UNIT 1 EASTON 94SW0217 HIGGINS YACHT YARD 203 CARPENTER STREET ST. MICHAELS General Permits Permit No. NPDES No. Facility Name Address City 02MA9120 HIGGINS YACHT YARD 203 CARPENTER STREET ST. MICHAELS
01SI6208 MDG766208 HARBOURTOWNE COUNTRY CLUB MARTINGHAM DRIVE ST. MICHAELS
01SI6860 MDG766860 MILES RIVER YACHT CLUB 24750 YACHT CLUB ROAD ST. MICHAELS
8
LIVING RESOURCES AND HABITAT Living resources, including all the animals, plants and other organisms require water to survive. They and their habitats are intimately connected to water quality and availability. Living resources respond to changes in water and habitat conditions in ways that help us interpret the status of water bodies and the effects of watershed conditions. In some cases, water quality is measured in terms of its ability to support specific living resources like trout or shellfish. Information on living resources is presented here to provide a gauge of water quality and habitat conditions in the watershed. It is also a potential measure of efforts to manage water quality and watersheds for the living resources that depend on them. In this document, we will provide an overview of the status of living resources in the Miles River watershed. Current assessments of the biological condition of the non-tidal streams will be provided by MDNR’s Maryland Biological Stream Survey in a separate report. A list of rare, threatened and endangered (RTE) species for the Miles River watershed can be found in Appendix A (MDNR Natural Heritage Program). In addition, Maryland Department of Natural Resources’ Natural Heritage Program has a list of Rare, threatened and endangered species sorted by county: http://www.dnr.state.md.us/wildlife/espaa.asp Fish and Fisheries Yellow Perch Yellow perch (Perca flavescens) are generally freshwater fish, but in Maryland, yellow perch have adapted to the estuarine waters of Chesapeake Bay. Historically, yellow perch have been reported in all of the major tributaries and streams of Maryland’s part of the Chesapeake Bay watershed (MDNR Fisheries, Yellow Perch Fact Sheet).
“Yellow perch populations in Chesapeake Bay are generally stable or increasing, although the river specific nature of yellow perch stocks makes determining stock status difficult. Systems in the upper Bay still have substantial populations and spawning runs. However, tributaries in the middle and lower Bay are experiencing depressed populations, with little or no spawning runs. Historically, these systems had large populations of yellow perch. Environmental factors including increased sedimentation from improper land use, decreased spawning habitat caused by stream blockages, and the interaction of metals and acid rain, may be to blame for these declines and may also adversely affect the reproductive success of these stocks (MDNR Fisheries, Yellow Perch Fact Sheet).”
9
The Yellow Perch Fisheries Management Plan was adopted in 2002 to prevent overfishing and to restore spawning stocks in certain areas. In the Miles River, a recreational fishery is open but the area is closed to commercial fishing (MDNR Fisheries, Yellow Perch Status Report). Current fishing regulations can be found at: http://www.dnr.state.md.us/fisheries/regulations/nontidalregs.html White Perch White perch (Morone americana) are semi-anadromous relatives of the striped bass and one of the most abundant fish in the Chesapeake Bay. They migrate from estuarine waters to tidal fresh and slightly brackish waters to spawn from April to June (MDNR Fisheries, White Perch Fact Sheet). Currently, no management plan exists for white perch in the Chesapeake Bay. The management strategy consists of a size limit for the commercial fishery but the recreational fishery has no size or creel limit (MDNR Fisheries, White Perch Fact Sheet). Current recreational fishing regulations can be found at: http://www.dnr.state.md.us/fisheries/regulations/recregchrt.html White perch commercial landing have been increasing State-wide since 1993 (H. Speir, MDNR Fisheries, Personal communication). Landings were 939,484 pounds in 1993 and 1,363,408 pounds in 2004 (H. Speir, MDNR Fisheries, Personal communication). Much of this harvest is taken as by-catch in fisheries for other species (MDNR Fisheries, White Perch Fact Sheet). In the Miles River, commercial landings have gone from 670 pounds in 1998 to 75,258 pounds in 2004 (H. Speir, MDNR Fisheries, Personal communication). Fish Consumption Advisories Almost all fish have traces of mercury or PCBs. Maryland Department of the Environment is responsible for determining how much of a given species caught in Maryland’s waters can be safely consumed. Striped Bass (Rockfish) have advisories for the Chesapeake Bay and its tributaries. In addition, small and largemouth bass have advisories for all rivers and streams Statewide (MDE Fish Consumption Advisories). Fish Consumption Advisories by species for the entire State can be found at: http://www.mde.state.md.us/CitizensInfoCenter/FishandShellfish/home/index.asp . The Miles River has not been considered a hot spot for toxic chemicals, thus very limited sampling has been done in the area. Data from a sample of oysters (Crassostrea virginica) collected in October, 2000 near Newcomb, and a sample of white perch (Morone americana) collected in August, 2003 near Doncaster below the Rt. 370 bridge tested for PCBs is shown below in Table 3. The concentrations found translate to consumption criteria well below advisory levels (Table 4) (J. Beaman Personal communication).
10
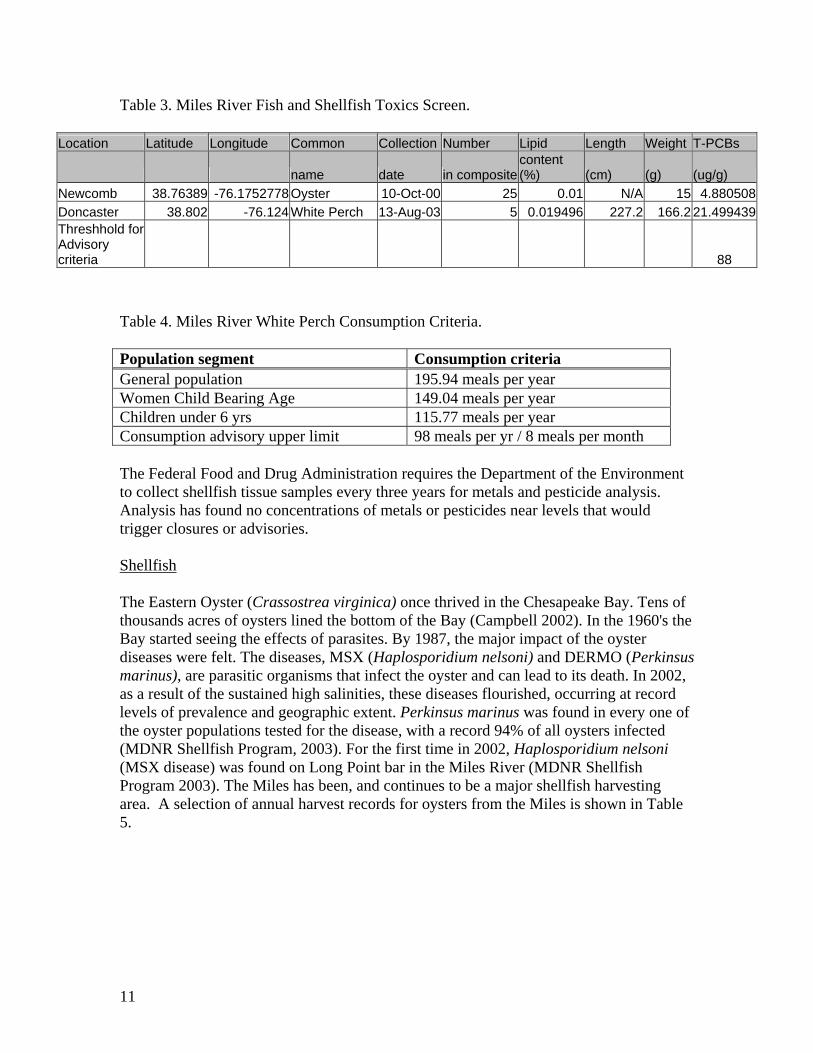
Table 3. Miles River Fish and Shellfish Toxics Screen.
Location Latitude Longitude Common Collection Number Lipid Length Weight T-PCBs
name date in compositecontent (%) (cm) (g) (ug/g)
Newcomb 38.76389 -76.1752778 Oyster 10-Oct-00 25 0.01 N/A 15 4.880508Doncaster 38.802 -76.124 White Perch 13-Aug-03 5 0.019496 227.2 166.2 21.499439Threshhold for Advisory criteria 88
Table 4. Miles River White Perch Consumption Criteria. Population segment Consumption criteria General population 195.94 meals per year Women Child Bearing Age 149.04 meals per year Children under 6 yrs 115.77 meals per year Consumption advisory upper limit 98 meals per yr / 8 meals per month The Federal Food and Drug Administration requires the Department of the Environment to collect shellfish tissue samples every three years for metals and pesticide analysis. Analysis has found no concentrations of metals or pesticides near levels that would trigger closures or advisories. Shellfish The Eastern Oyster (Crassostrea virginica) once thrived in the Chesapeake Bay. Tens of thousands acres of oysters lined the bottom of the Bay (Campbell 2002). In the 1960's the Bay started seeing the effects of parasites. By 1987, the major impact of the oyster diseases were felt. The diseases, MSX (Haplosporidium nelsoni) and DERMO (Perkinsus marinus), are parasitic organisms that infect the oyster and can lead to its death. In 2002, as a result of the sustained high salinities, these diseases flourished, occurring at record levels of prevalence and geographic extent. Perkinsus marinus was found in every one of the oyster populations tested for the disease, with a record 94% of all oysters infected (MDNR Shellfish Program, 2003). For the first time in 2002, Haplosporidium nelsoni (MSX disease) was found on Long Point bar in the Miles River (MDNR Shellfish Program 2003). The Miles has been, and continues to be a major shellfish harvesting area. A selection of annual harvest records for oysters from the Miles is shown in Table 5.
11
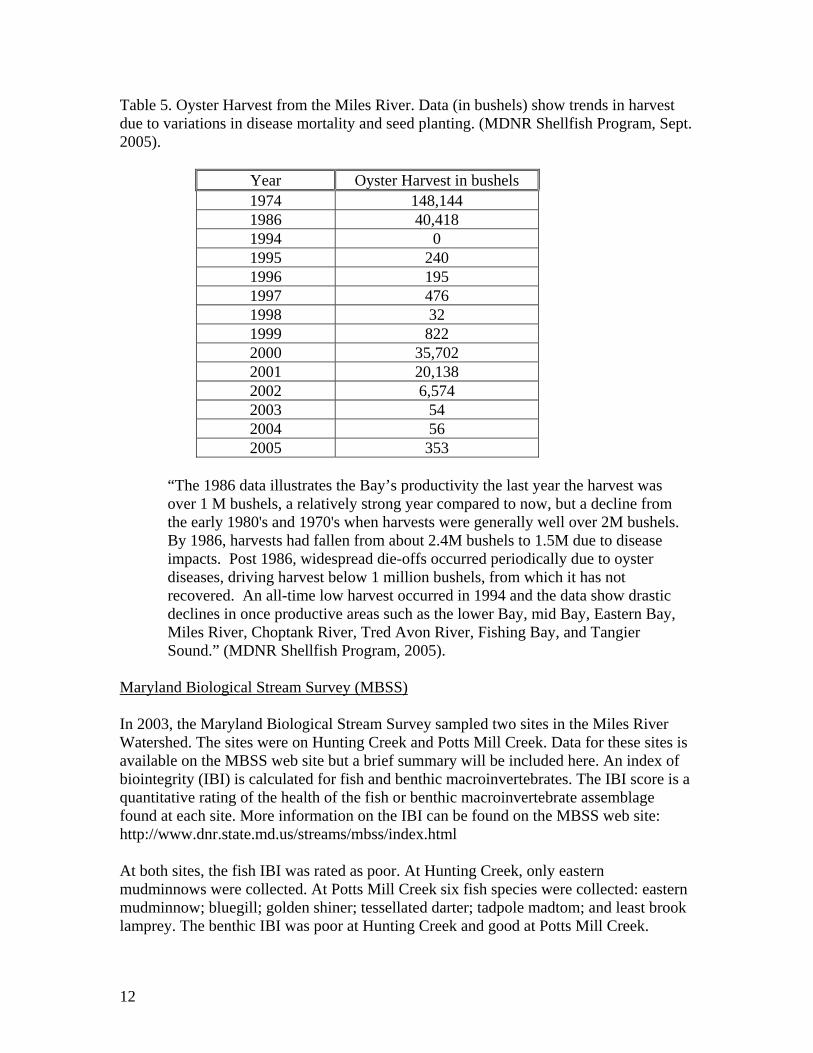
Table 5. Oyster Harvest from the Miles River. Data (in bushels) show trends in harvest due to variations in disease mortality and seed planting. (MDNR Shellfish Program, Sept. 2005).
Year Oyster Harvest in bushels 1974 148,144 1986 40,418 1994 0 1995 240 1996 195 1997 476 1998 32 1999 822 2000 35,702 2001 20,138 2002 6,574 2003 54 2004 56 2005 353
“The 1986 data illustrates the Bay’s productivity the last year the harvest was over 1 M bushels, a relatively strong year compared to now, but a decline from the early 1980's and 1970's when harvests were generally well over 2M bushels. By 1986, harvests had fallen from about 2.4M bushels to 1.5M due to disease impacts. Post 1986, widespread die-offs occurred periodically due to oyster diseases, driving harvest below 1 million bushels, from which it has not recovered. An all-time low harvest occurred in 1994 and the data show drastic declines in once productive areas such as the lower Bay, mid Bay, Eastern Bay, Miles River, Choptank River, Tred Avon River, Fishing Bay, and Tangier Sound.” (MDNR Shellfish Program, 2005).
Maryland Biological Stream Survey (MBSS) In 2003, the Maryland Biological Stream Survey sampled two sites in the Miles River Watershed. The sites were on Hunting Creek and Potts Mill Creek. Data for these sites is available on the MBSS web site but a brief summary will be included here. An index of biointegrity (IBI) is calculated for fish and benthic macroinvertebrates. The IBI score is a quantitative rating of the health of the fish or benthic macroinvertebrate assemblage found at each site. More information on the IBI can be found on the MBSS web site: http://www.dnr.state.md.us/streams/mbss/index.html At both sites, the fish IBI was rated as poor. At Hunting Creek, only eastern mudminnows were collected. At Potts Mill Creek six fish species were collected: eastern mudminnow; bluegill; golden shiner; tessellated darter; tadpole madtom; and least brook lamprey. The benthic IBI was poor at Hunting Creek and good at Potts Mill Creek.
12
Sensitive Species Sensitive species are generally recognized as being the plants or animals that are most at risk in regards to their ability to maintain healthy population levels. Perhaps the most widely known are the State and Federally-listed Endangered or Threatened animals such as the bald eagle and Delmarva fox squirrel. In addition to animals such as these however, both the United States Fish and Wildlife Service and the Maryland DNR work through their respective Federal and State programs to protect a wide variety of declining non-game animals, rare plants, and the unique natural communities that support them. For the purposes of watershed restoration, it is important to account for the known or potential habitat for sensitive species. Protecting or expanding these habitats helps to conserve biodiversity and is an effective component of a watershed restoration program. DNR’s Wildlife and Heritage Service identifies important areas for sensitive species conservation in different ways. Several sensitive species overlays are used by the State of Maryland to delineate habitat associated with these species. One overlay is the Sensitive Species Project Review areas which are buffered areas enclosing ecologically significant areas (areas that harbor or could potentially harbor rare, threatened or endangered species). Map 5, Sensitive Species, shows the general locations of sensitive species conservation areas in the Miles River watershed. There are broadly applied State and Federal laws and regulations that address “takings” of listed species. In addition, many counties have incorporated safeguards for areas associated with sensitive species into their project and permit review processes as well as adopting specific ordinances in some cases to protect them. In all instances, property owners are encouraged to seek advice on protecting the sensitive species/habitat within their ownership. Property owners and other citizens can help protect sensitive species by obtaining advise from DNR Natural Heritage. Maryland Department of Natural Resources’ Natural Heritage Program has provided a list of rare, threatened and endangered (RTE) species for the Miles River watershed which can be found in Appendix A. In addition, a list of RTE for each county is available at: http://www.dnr.state.md.us/wildlife/espaa.asp Chesapeake Bay Critical Area Act The Chesapeake Bay Critical Area Act, passed in 1984, designated as “Critical Areas” all lands within 1,000 feet of tidal waters or adjacent tidal wetlands (MDNR Critical Area Commission). The lands contained within this area are subject to development guidelines that attempt to minimize the impacts of development and to preserve valuable natural resources. The local jurisdiction has the duty to enforce its local regulations in these areas but the law also created a statewide Critical Area Commission to oversee the development and implementation of local land use programs in the Critical Areas. Map 5, Sensitive Species, shows the Critical Areas within the Miles River watershed. More information on Critical Areas can be found at: http://www.dnr.state.md.us/criticalarea/
13
Submerged Aquatic Vegetation The well-defined link between water quality and submerged aquatic vegetation (SAV) distribution/abundance make SAV communities good barometers of the health of estuarine ecosystems. SAV is important as an indicator of water quality, provides food for many species and it is a critical nursery habitat for many estuarine species (MDNR Bay Grasses). Map 6 shows SAV acreage in the Miles River from 1987 to 2003. Only 1987, 1997 and 2003 are shown on the map for clarity. In 1987, 1992, and 1997 there were 505 acres, 363 acres and 993 acres of SAV, respectively. However, in 2002 coverage dropped to 131 acres. 2001 and 2002 were drought years causing low flow and reduced run-off. In some parts of the Bay this led to improved water clarity and an increase in SAV. In some tributaries, it caused an increase in salinity and a decline in SAV. This might account for the drop in acreage in 2002 in the Miles River. In 2003, Hurricane Isabel took a toll on the SAV all across the Bay and coverage in the Miles dropped to 13 acres (MDNR News Release, 2003).
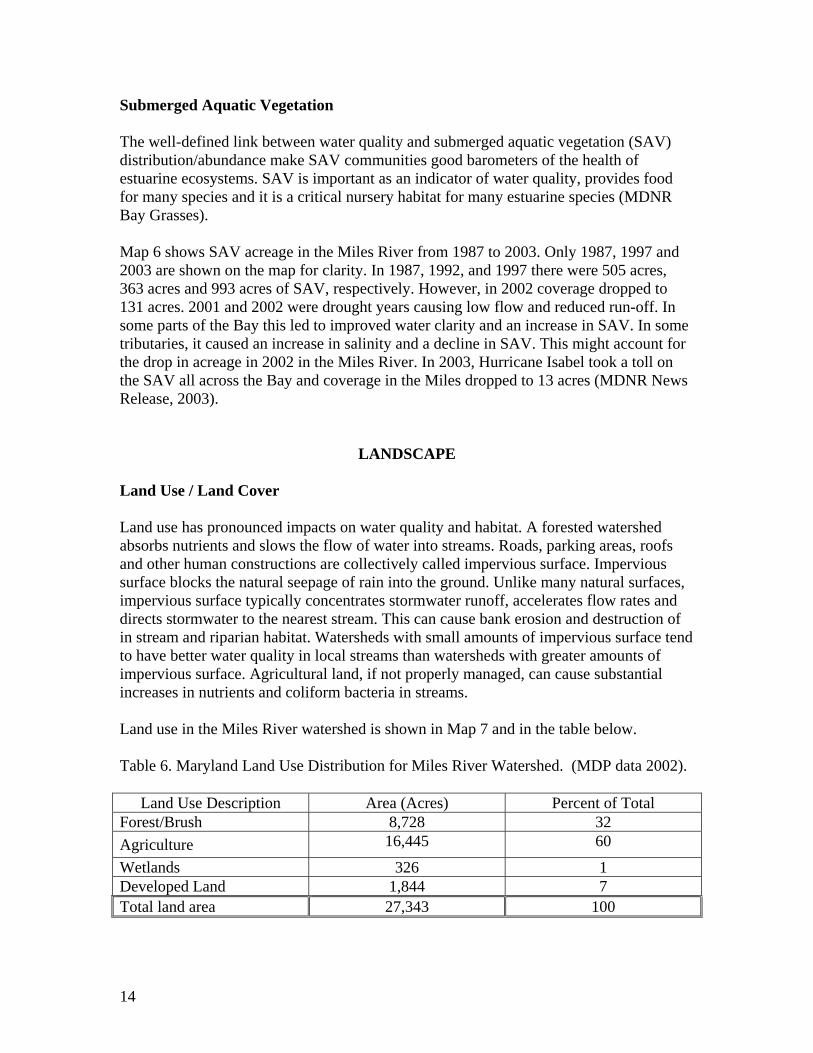
LANDSCAPE Land Use / Land Cover Land use has pronounced impacts on water quality and habitat. A forested watershed absorbs nutrients and slows the flow of water into streams. Roads, parking areas, roofs and other human constructions are collectively called impervious surface. Impervious surface blocks the natural seepage of rain into the ground. Unlike many natural surfaces, impervious surface typically concentrates stormwater runoff, accelerates flow rates and directs stormwater to the nearest stream. This can cause bank erosion and destruction of in stream and riparian habitat. Watersheds with small amounts of impervious surface tend to have better water quality in local streams than watersheds with greater amounts of impervious surface. Agricultural land, if not properly managed, can cause substantial increases in nutrients and coliform bacteria in streams. Land use in the Miles River watershed is shown in Map 7 and in the table below. Table 6. Maryland Land Use Distribution for Miles River Watershed. (MDP data 2002).
Land Use Description Area (Acres) Percent of Total
Forest/Brush 8,728 32 Agriculture 16,445 60
Wetlands 326 1 Developed Land 1,844 7 Total land area 27,343 100
14
Protected Lands As used in the context of watershed protection and restoration, “protected land” includes any land with some form of long-term limitation on conversion to urban/developed land use. This protection may be in various forms: public ownership for natural resource or low impact recreational intent, private ownership where a third party acquired the development rights or otherwise acquired the right to limit use through the purchase of an easement, etc. The extent of “protection” varies greatly from one circumstance to the next. Therefore, for some protected land, it may be necessary to explore the details of land protection parcel-by-parcel through the local land records office to determine the true extent of protection. For purposes of watershed management, an understanding of existing protected lands can provide a starting point in prioritizing potential protection and restoration activities. In some cases, protected lands may provide opportunities for restoration projects because owners of these lands may value natural resource protection or enhancement goals. More information on watershed protection can be found in: The Practice of Watershed Protection (Schueler and Holland 2000). Map 8, Protected Lands, shows the status of protected lands in the Miles River watershed. Some land parcels may be affected by more than one type of protection. For example, government-owned parkland may also have a conservation easement on it. Public Lands Talbot County holds 344 acres of land or 1% of total land area in the Miles River watershed. There are no State or Federal parks are in the watershed. Private Lands On private land, the largest protected land category is conservation easements occupying 3,225 acres (Map 8). Agricultural easements cover 1,052 acres. The total area of easements in the Miles River watershed is 4,277 acres or 16% of the total land area. Rural Legacy There is no MDNR Rural Legacy area in the Miles River watershed. However, Talbot County has established an Agricultural District in order to encourage protection of agricultural lands. Soils Soil type and moisture conditions greatly affect how land may be used and the potential for vegetation and habitat on the land. Soil conditions are also one determining factor for water quality in streams and rivers. Soils are an important factor to incorporate in targeting projects aimed at improving water quality or habitat.
15
Local soil conditions vary greatly from site to site. Soils data were provided by the U.S. Department of Agriculture and the Maryland Department of Natural Resources. A summary of this information is shown for the WRAS watershed in Map 9, Soils.
- Overall, about 32% (8,804 acres) of the watershed is prime agricultural soil that does not require drainage or irrigation. Less than 1% (122 acres), requiring either drainage or irrigation, is also potentially prime agricultural soil.
- Nearly 12,833 acres exhibit hydric characteristics. Hydric soils adjacent to
streams or wetlands may offer opportunities for restoration of natural vegetated buffers or wetlands that could intercept nitrogen moving in groundwater before it reaches surface waters.
Green Infrastructure The Maryland DNR has mapped a Statewide network of ecologically important lands across the State called “Green Infrastructure”. This network is comprised of large blocks of important natural resource lands called hubs and corridors that connect the hubs. These areas are primarily large blocks of contiguous forest but also include wetlands and other naturally vegetated lands. These lands provide significant environmental benefits, such as cleaning the air, filtering and cooling water, and storing and cycling nutrients. Appendix B provides a detailed assessment of the Green Infrastructure in the Miles River watershed. Large Forest Blocks Forest interior dwelling species (FIDS) require large blocks of forest habitat with relatively little influence by species from open areas or humans. FIDS habitat is a forest block at least 50 acres in size with at least 10 acres of forest interior (forest edge is at least 300 feet away). High quality FIDS habitat is either mature hardwood or mixed hardwood-pine forest at least 100 acres in size of which forest interior habitat comprises at least 25% of the total forest area. This habitat also must contain one or more of the following:
- Contiguous forest acreage of greater than 500 acres; - Riparian forest bordering a perennial stream or river and, on average, at least 600
feet in width; - At least one highly area-sensitive species or Black-and-white Warbler, as a
probable or confirmed breeder; - Mature river terrace, ravine, or cove hardwoods, located at least 300 feet from the
nearest forest edge; - At least 5 contiguous acres of old growth forest (as defined in the 1989 MD
Department of Natural Resources report "Old Growth Forest Ecosystems") located at least 300 feet from the nearest forest edge (MDNR Forest Service 2003).
16
The forest interior assessment map differs from the Green Infrastructure assessment in that forest interior areas are more numerous and more widely distributed because the forest interior size threshold is lower (MDNR web site). Map 10, Large Block Forest Habitat, shows that the Miles River watershed contains 1,621 acres of high quality FIDS habitat which makes up 19% of the total forest area. Other FIDS habitat occupies 3,881 acres (44%) and other forest land comprises 3,224 acres (37%) (MDNR, Natural Heritage Program and MDP 2002). Wetlands The U.S. Army Corps of Engineers and the U.S. Environmental Protection Agency define wetlands as follows (EPA Office of Wetlands, Oceans and Watersheds web site):
“Wetlands are areas that are inundated or saturated by surface or ground water at a frequency and duration sufficient to support, and that under normal circumstances do support, a prevalence of vegetation typically adapted for life in saturated soil conditions. Wetlands generally include swamps, marshes, bogs, and similar areas.”
The Coastal Plain Province likely has the highest diversity of emergent estuarine and palustrine (fresh water) wetland communities relative to other Maryland physiographic regions because the area has both tidal and nontidal freshwater marshes. Wetlands are most abundant in the Coastal Plain due to the low topographic relief and high ground water table characteristic of the region. Wetland Functions The State of Maryland Nontidal Wetlands Protection Act of 1989 designates statutory wetland functions which are summarized in Table 7 from the MDE Wetlands web site and Tiner and Burke (1995).
17
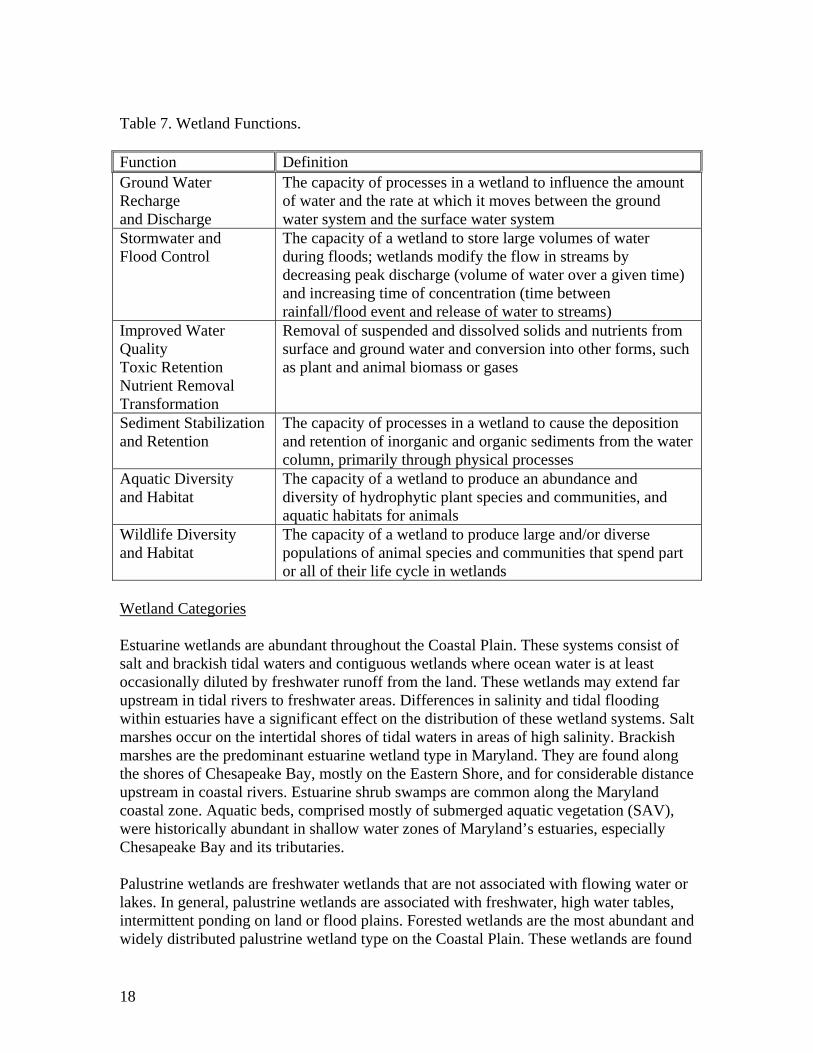
Table 7. Wetland Functions. Function Definition Ground Water Recharge and Discharge
The capacity of processes in a wetland to influence the amount of water and the rate at which it moves between the ground water system and the surface water system
Stormwater and Flood Control
The capacity of a wetland to store large volumes of water during floods; wetlands modify the flow in streams by decreasing peak discharge (volume of water over a given time) and increasing time of concentration (time between rainfall/flood event and release of water to streams)
Improved Water Quality Toxic Retention Nutrient Removal Transformation
Removal of suspended and dissolved solids and nutrients from surface and ground water and conversion into other forms, such as plant and animal biomass or gases
Sediment Stabilization and Retention
The capacity of processes in a wetland to cause the deposition and retention of inorganic and organic sediments from the water column, primarily through physical processes
Aquatic Diversity and Habitat
The capacity of a wetland to produce an abundance and diversity of hydrophytic plant species and communities, and aquatic habitats for animals
Wildlife Diversity and Habitat
The capacity of a wetland to produce large and/or diverse populations of animal species and communities that spend part or all of their life cycle in wetlands
Wetland Categories Estuarine wetlands are abundant throughout the Coastal Plain. These systems consist of salt and brackish tidal waters and contiguous wetlands where ocean water is at least occasionally diluted by freshwater runoff from the land. These wetlands may extend far upstream in tidal rivers to freshwater areas. Differences in salinity and tidal flooding within estuaries have a significant effect on the distribution of these wetland systems. Salt marshes occur on the intertidal shores of tidal waters in areas of high salinity. Brackish marshes are the predominant estuarine wetland type in Maryland. They are found along the shores of Chesapeake Bay, mostly on the Eastern Shore, and for considerable distance upstream in coastal rivers. Estuarine shrub swamps are common along the Maryland coastal zone. Aquatic beds, comprised mostly of submerged aquatic vegetation (SAV), were historically abundant in shallow water zones of Maryland’s estuaries, especially Chesapeake Bay and its tributaries. Palustrine wetlands are freshwater wetlands that are not associated with flowing water or lakes. In general, palustrine wetlands are associated with freshwater, high water tables, intermittent ponding on land or flood plains. Forested wetlands are the most abundant and widely distributed palustrine wetland type on the Coastal Plain. These wetlands are found
18
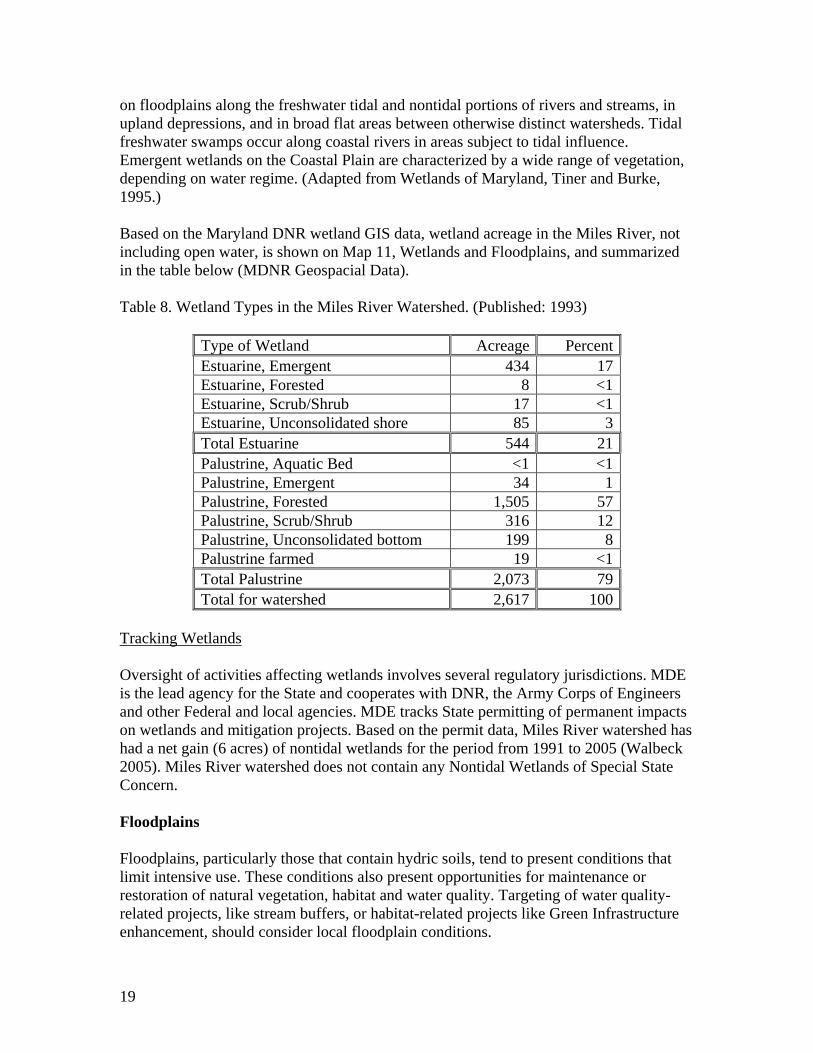
on floodplains along the freshwater tidal and nontidal portions of rivers and streams, in upland depressions, and in broad flat areas between otherwise distinct watersheds. Tidal freshwater swamps occur along coastal rivers in areas subject to tidal influence. Emergent wetlands on the Coastal Plain are characterized by a wide range of vegetation, depending on water regime. (Adapted from Wetlands of Maryland, Tiner and Burke, 1995.) Based on the Maryland DNR wetland GIS data, wetland acreage in the Miles River, not including open water, is shown on Map 11, Wetlands and Floodplains, and summarized in the table below (MDNR Geospacial Data). Table 8. Wetland Types in the Miles River Watershed. (Published: 1993)
Type of Wetland Acreage Percent Estuarine, Emergent 434 17 Estuarine, Forested 8 <1 Estuarine, Scrub/Shrub 17 <1 Estuarine, Unconsolidated shore 85 3 Total Estuarine 544 21 Palustrine, Aquatic Bed <1 <1 Palustrine, Emergent 34 1 Palustrine, Forested 1,505 57 Palustrine, Scrub/Shrub 316 12 Palustrine, Unconsolidated bottom 199 8 Palustrine farmed 19 <1 Total Palustrine 2,073 79 Total for watershed 2,617 100
Tracking Wetlands Oversight of activities affecting wetlands involves several regulatory jurisdictions. MDE is the lead agency for the State and cooperates with DNR, the Army Corps of Engineers and other Federal and local agencies. MDE tracks State permitting of permanent impacts on wetlands and mitigation projects. Based on the permit data, Miles River watershed has had a net gain (6 acres) of nontidal wetlands for the period from 1991 to 2005 (Walbeck 2005). Miles River watershed does not contain any Nontidal Wetlands of Special State Concern. Floodplains Floodplains, particularly those that contain hydric soils, tend to present conditions that limit intensive use. These conditions also present opportunities for maintenance or restoration of natural vegetation, habitat and water quality. Targeting of water quality-related projects, like stream buffers, or habitat-related projects like Green Infrastructure enhancement, should consider local floodplain conditions.
19
Map 11 shows that the 100-year floodplains cover about 3,029 acres in the Miles River watershed. The 100-year floodplain extends the full length of the Miles River well inland from the shore of the Bay. Floodplains, particularly those that contain hydric soils, tend to present conditions that limit intensive use. These conditions also present opportunities for maintenance or restoration of natural vegetation, habitat and water quality. Targeting of water quality-related projects, like stream buffers, or habitat-related projects like Green Infrastructure enhancement, should consider local floodplain conditions. Shoreline and Sea Level Rise Natural shoreline provides important habitat for fish, shellfish, horseshoe crabs, and birds. Structural shoreline stabilization practices, such as bulkheads and riprap, prevent encroachment from sea level rise that would have resulted in new tidal wetlands (MDE 2006). The average rate of sea level rise along Maryland’s coastline has been 3-4 mm/yr, or approximately one foot per century. Such rates are nearly twice those of the global average (1.8 mm/year), a result probably due to substantial land subsidence (Johnson 2000). Stream Buffers Benefits of Stream Buffers Natural vegetation in stream riparian zones, particularly forest, provides numerous valuable environmental benefits:
- Reducing surface runoff, - Preventing erosion and sediment movement, - Using nutrients for vegetative growth and moderating nutrient entry into the
stream, - Moderating temperature, particularly reducing warm season water temperature, - Providing organic material (decomposing leaves) that are the foundation of
natural food webs in stream systems, - Providing overhead and in-stream cover and habitat, - Promoting high quality aquatic habitat and diverse populations of aquatic species.
Land Use Adjacent to Streams The Miles River watershed has about 96 miles of streams. Map 12, Land Use/Land Cover at Streams Edge, shows the general land use adjacent to these streams using computerized GIS. This method of assessing land use at stream’s edge can be used in the absence of field data collected by stream corridor assessment. Miles River has 96 miles of streams with 39 miles of land adjacent to stream covered by forest, wetlands and brush; 16 miles covered by development; and 41 miles covered by agricultural land. Thirty-six miles of agricultural land are on hydric soil which are potentially good areas for wetland restoration.
20
RESTORATION TARGETING TOOLS
Stream Corridor Assessment Using the Stream Corridor Assessment, valuable information can be compiled to assist in targeting restoration activities. This information will complement existing watershed-related information and may explain cause and effect relationships between what is occurring in the watershed and how those activities are impacting the stream systems. Trained teams walk along streams to identify and document potential problems and restoration opportunities such as pipe outfalls, fish blockages, pond sites, and exposed pipes. MDE will provide a report for County use. The SCA manual can be found at: http://www.dnr.state.md.us/streams/stream_corridor.html Synoptic Survey and MBSS Based on Synoptic Survey sampling in the Miles River watershed, MDE staff reported on water quality in non-tidal streams to supplement knowledge of local conditions. Based on selected parameters (dissolved oxygen, nitrogen, phosphorus, pH, conductivity, temperature), the survey findings will help identify problem areas and relative conditions among local streams. It will also help rank subwatersheds by their nutrient load contributions to the river. For the same 2005 sampling sites, the MBSS survey results describe the benthic organism populations in non-tidal streams as a gauge of water quality and habitat conditions. MDNR’s report of 2005 findings will include assessment of water quality, benthic organism populations and the potential relationships that may be drawn from the data. Agricultural Conservation Programs The Talbot County Soil Conservation District works with farmers and landowners in the development of Soil Conservation and Water Quality plans that recommend best management practices that will prevent nutrient and sediment impact on surface and ground water. Some of the conservation practices that can be used are grassed waterways, riparian herbaceous and riparian forested buffers, conservation cover, cover crops, shallow water wildlife areas and grade stabilization structures. The Maryland Agricultural Cost-Share program (MACS), the Conservation Reserve Program (CRP and CREP) and the Environmental Quality Incentive Program (EQIP) are some of the state and federal programs promoted and administered by the Soil Conservation District. Farmers in the watershed who are already using good management practices that benefit water quality could provide examples to promote adoption of similar practices by other farmers. Fish Blockage Removal Many fish species need to move from one stream segment to the next in order to maintain healthy resilient populations. Blockages in streams can inhibit or prevent many fish
21
species from moving up stream to otherwise viable habitat. To help prioritize stream blockages for mitigation or removal, the DNR Fish Passage Program maintains a database of significant blockages to fish movement. The Fish Passage Program does not list any fish blockages in the Miles River watershed (MDNR Fisheries, Fish Passage Program). The Stream Corridor Assessment might identify potential fish blockage problems. Some blockages to fish movement may be structural components of stream gauging weirs, farm ponds, drainage ditches, etc. If a blockage is found to be in this category, circumstances like requirements for drainage control function and public or landowner needs are considered in determining the potential for a restoration project. Stream Buffer Restoration Natural vegetation in stream riparian zones act as stream buffers that can provide numerous valuable environmental benefits such as reducing surface runoff, preventing erosion, and providing overhead cover and habitat. Headwater Streams Headwater streams are the smallest and most numerous in Maryland watersheds and, unlike larger streams, they intercept all of the surface runoff within the watersheds that they drain. Also, these streams at the "top" of the watershed are the type and size that are most affected by development. In addition, for many watersheds, headwater streams drain the majority of the land within the entire watershed; therefore, stream buffers restored along headwater streams tend to have greater potential to intercept nutrients and sediments than stream buffers placed elsewhere. The nutrient removal function of buffering headwater streams and their associated springheads provides water supply benefits. In targeting stream buffer restoration projects, giving higher priority to headwater streams is one approach to optimizing nutrient and sediment retention. Restoring headwater stream buffers can also provide habitat benefits that can extend downstream of the project area. Forested headwater streams provide important organic material, like decomposing leaves, which “feed” the stream’s food web. They also introduce woody debris that enhances in-stream physical habitat. The potential for riparian forest buffers to significantly influence stream temperature is greatest in headwater regions. These factors, in addition to positive water quality effects, are key to improving aquatic habitat. Optimizing Water Quality Benefits by Combining Priorities Strategic targeting of stream buffer restoration projects may promote many different potential benefits. To maximize multiple benefits, site selection and project design need to incorporate numerous factors. For example, finding a site with a mix of attributes like those in the following list could result in the greatest control of non-point source pollution and enhancement to living resources: – land owner willingness / incentives – marginal land use in the riparian zone
22
– headwater stream – hydric soils – selecting appropriate woody/grass species – adjacent to existing wetlands / habitat Additionally, selecting restoration projects that are likely to produce measurable success is an important consideration in prioritizing projects for implementation. In the early stages of a watershed restoration program, measurable water quality improvement can be one of the strongest ways to demonstrate project success. In general, targeting restoration projects to one or a few selected tributaries or small watersheds will tend to offer the greatest probability of producing measurable water quality improvement. Wetland Restoration Wetlands serve important environmental functions such as erosion control, habitat and nursery areas for many organisms and nutrient uptake/recycling. However, most watersheds in Maryland have significantly fewer wetland acres today than in the past. This loss due to draining, filling, etc. has led to habitat loss and negative water quality impacts in streams and in the Chesapeake Bay. Reversing this historic trend is an important goal of wetland restoration. Staff from MDE’s Waterways and Wetlands Program and WRAS can provide assistance to local governments in targeting wetland restoration efforts.
POTENTIAL BENCHMARKS FOR WRAS GOAL SETTING Several programs designed to manage water quality and/or living resources have existing or proposed goals that are relevant to setting goals for the Miles River Watershed Restoration Action Strategy (WRAS). The goals from these other programs tend to overlap and run parallel to potential interests for developing WRAS goals. Therefore, to assist in WRAS development, selected goals from other programs are included here as points of reference. Water Quality Standards and TMDLs Water quality standards represent minimum legal goals for managing the physical, chemical and biological integrity of the Nation's waters. Achieving these standards will necessitate the restoration and protection of habitat and living resources within the watershed. In order to meet water quality standards, Total Maximum Daily Loads (TMDLs) have been established for pollutants in many impaired waterbodies. TMDLs represent pollutant loading goals. In watershed management plans designed to implement TMDL goals, Best Management Practices (BMPs) are often included. BMPs are management practices (such as nutrient management) or structural practices (such as terraces) designed to reduce the quantities of pollutants. Thus, water quality standards, TMDLs,
23
and BMPs reflected in implementation plans provide a set of benchmarks, which are linked together via a systematic water quality management framework. Existing water quality impairments, water quality goals, and loading goals for the Miles River are documented in the TMDL(s) for that waterbody. Watershed plans should focus on implementation actions that have a high likelihood of improving these specific water quality impairments. Chesapeake 2000 Agreement The Chesapeake 2000 Agreement (C2K) includes several significant commitments pertaining to local watershed management planning and implementation. These are the load reduction goals for nitrogen and phosphorus, and the watershed management planning goal. The C2K Agreement called for the refinement of water quality standards in the Bay, and the assignment of nutrient load reductions to each major tributary. The Agreement also called for the revision of Tributary Strategy implementation plans to "achieve and maintain the assigned loading goals." This process is analogous to the process by which TMDLs have been established at a more refined geographic scale. Thus, watershed management plans that strive for either goal are ensured to complement the other. The goal in the C2K Agreement that is directly related to the development of watershed management plans and action strategies is:
“By 2010, work with local governments, community watershed groups and watershed organizations to develop and implement locally supported watershed management plans in two-thirds of the Bay watershed covered by this Agreement. These plans would address the protection, conservation and restoration of stream corridors, riparian buffers and wetlands for the purposes of improving habitat and water quality, with the collateral benefits for optimizing flow and water supply (Chesapeake 2000 Agreement).”
Four common elements of watershed management planning were adopted by the Chesapeake Bay Program member jurisdictions to be applied Bay-wide. Those elements support the WRAS components that were also identified as common Bay-wide criteria for watershed management planning. The four approved C2K Agreement watershed-planning elements are as follows: 1. Does the plan “address the protection, conservation and restoration of stream corridors, riparian forest buffers and wetlands?” Each watershed management plan needs to be based on site-specific assessments of natural resources within the watershed. At a minimum, the assessment will evaluate the condition of stream corridors, riparian buffers and wetlands within the watershed.
24
2. Does the plan reflect the goals and objectives of “improving habitat and water quality?” The plan should reflect the issues that the stakeholders feel are important, and, at a minimum, exhibit a benefit to habitat and water quality within the watershed. The goals should be based on priority issues identified by the watershed assessment. 3. Chesapeake 2000 Watershed Commitments (CWiC) Criteria #3-- Does the plan identify implementation mechanisms? Capacity to implement the plan will be demonstrated by identifying: - What are the specific management actions? - What are the resources necessary for implementation? - Who will implement the plan? - When will the actions be implemented? 4. Does the plan have demonstrated local support? Every effort should be made to demonstrate a diversity of local support. At a minimum, local governments, community groups and watershed organizations should be encouraged to participate in developing and implementing the watershed management plan. Water Quality Improvement Act of 1998 The Water Quality Improvement Act of 1998 presents many challenges for agriculture in Maryland. It represents a major change in our approach to controlling agricultural nutrient pollution. The Act requires nutrient management plans for both nitrogen and phosphorus for virtually all Maryland farms. The Maryland Agricultural Water Quality Cost-Share (MACS) Program offers cost-share assistance for the development of nutrient management plans. The Manure Transport Program helps poultry, dairy, beef and other livestock producers cover the costs of transporting excess manure identified by their nutrient management plans off their farms. Implementation of projects assisted by this funding has the potential to move nutrients to sites where they are needed and reduce nutrient input to Maryland’s waters (University of Maryland 1998; Maryland Department of Agriculture 2003).
25
REFERENCES Beaman, J. Personal communication. MDE Technical and Regulatory Services Administration. Brohawn, K. Personal communication. MDE Technical and Regulatory Services Administration, Shellfish Certification Division. Campbell, Eric. 2002. Oyster Restoration in Maryland. MDNR Fisheries Service. http://www.dnr.state.md.us/fisheries/recreational/articles/oysterrestoration.html Chesapeake 2000 Agreement: http://www.chesapeakebay.net/agreement.htm Code of Maryland Regulations (COMAR). http://www.dsd.state.md.us/comar/ Drummond, D.D., 2001. Hydrogeology of the Coastal Plain Aquifer System in Queen Anne's and Talbot Counties, Maryland, with Emphasis on Water-Supply Potential and Brackish-Water Intrusion in the Aquia Aquifer. Maryland Geological Survey Report of Investigations No. 72, 141 p. http://www.mgs.md.gov/hydro/qatalindex.html Easton Utilities Commission. 2002. Water Quality 2002 Consumer Report. http://www.eastonutilities.com/pdfs/WaterQualityReport02.pdf Environmental Protection Agency (EPA) Office of Wetlands, Oceans and Watersheds: http://www.epa.gov/owow/wetlands/facts/fact11.html Johnson, Zoe Pfahl. 2000. A Sea Level Rise Response Strategy for the State of Maryland. Prepared for MDNR. 49 Pgs. http://www.dnr.state.md.us/bay/czm/sea_level_rise.html Maryland Department of Agriculture. 2003. Making Nutrient Management Work. Nutrient Management Program, 2003 Annual Report. http://www.mda.state.md.us/pdf/nmar03.pdf MDE Fish Consumption Advisories: http://www.mde.state.md.us/CitizensInfoCenter/FishandShellfish/home/index.asp MDE Searchable database for the 303(d) List: http://www.mde.state.md.us/Programs/WaterPrograms/TMDL/Maryland%20303%20dlist/303d_search/ MDE Shellfish Certification Division: http://www.mde.state.md.us/CitizensInfoCenter/FishandShellfish/harvesting_notices/index.asp
26
MDE. 1996. Maryland’s 303(d) lists: 1996 303(d) List of Water Quality Limited Basin Segments and 2004 List of Impaired Surface Waters [303(d) List]. http://www.mde.state.md.us/ MDE. 2005. Total Maximum Daily Loads of Fecal Coliform for Restricted Shellfish Harvesting Areas in Miles River and Leeds Creek and a Water Quality Analysis of Fecal Coliform for Hunting Creek of the Miles River Basin in Talbot County, Maryland. http://www.mde.state.md.us/assets/document/Miles%20River_050905_pn.pdf MDE. 2006. Priority Areas for Wetland Restoration, Preservation, and Mitigation in Maryland (draft). Denise Clearwater, Nontidal Wetlands and Waterways Division. MDNR. 1998. Maryland Clean Water Action Plan. http://www.dnr.state.md.us/cwap/cwap.htm MDNR Bay Grasses: http://www.dnr.state.md.us/bay/sav/about.asp MDNR Boating: http://www.dnr.state.md.us/boating/pumpout/centraleasternshore.html MDNR’s Clean Marinas Program. http://www.dnr.maryland.gov/boating/cleanmarina/ MDNR Critical Area Commission: http://www.dnr.state.md.us/criticalarea/ MDNR Fisheries: http://www.dnr.state.md.us/fisheries/recreational/articles/tidalbass.html http://www.dnr.state.md.us/fisheries/regulations/tidal_nontidal/Southern/hoghole_tobacco1a.jpg MDNR Fisheries, Fish Passage Program: http://www.dnr.state.md.us/fisheries/articles/fishpassage02.html MDNR Fisheries, Tidal Recreational Fishing Regulations: http://www.dnr.state.md.us/fisheries/regulations/recregchrt.html MDNR Fisheries, Yellow Perch Fact Sheet: http://www.dnr.state.md.us/fisheries/education/yellowperch/yperch.html MDNR Fisheries, Yellow Perch Status Report: http://www.dnr.state.md.us/fisheries/recreational/WPYP/YPstatus.html MDNR Fisheries, White Perch Fact Sheet: http://www.dnr.state.md.us/fisheries/education/whiteperch/wperch.html
27
MDNR Forest Service, 2003. Maryland’s Strategic Forest Lands Assessment. http://www.dnr.state.md.us/forests/download/sfla_report.pdf MDNR Geospacial Data: http://dnrweb.dnr.state.md.us/gis/data/data.asp MDNR MBSS home page: http://www.dnr.state.md.us/streams/mbss/index.html MDNR MBSS on-line database: http://mddnr.chesapeakebay.net/mbss/search.cfm MDNR Natural Heritage Program: http://www.dnr.state.md.us/wildlife/espaa.asp MDNR News Release. 2003. “DNR announces good news about SAV but cautions much more progress needed.” http://www.dnr.state.md.us/dnrnews/pressrelease2003/092503a.html MDNR Shellfish Program, 2003. Maryland Oyster Population Status Report, 2002 Fall Survey. http://www.dnr.state.md.us/fisheries/oxford/publications/md_oyster_population_status_report.pdf MDNR Shellfish Program, September 2005. Oyster Harvest Data. (Data provided by Chris Judy). MDNR Stream Corridor Assessment Manual: http://www.dnr.state.md.us/streams/stream_corridor.html MDNR Stream Waders database: http://mddnr.chesapeakebay.net/mbss/streamwaders.cfm MDNR Stream Waders Program and publications: http://www.dnr.state.md.us/streams/mbss/mbss_volun.html MDNR Tributary Strategies Team. 2003. Upper Eastern Shore: Basin Overview, November 2003. http://www.dnr.state.md.us/bay/tribstrat/upper_east/up_east_shore.pdf Status and trends: http://www.dnr.state.md.us/bay/tribstrat/upper_east/ue_status_trends.html#nitrogen MDNR. 2005. Maryland Tributary Strategy Upper Eastern Shore Basin Summary Report for 1985-2003 Data. January 2005 http://dnr.maryland.gov/bay/tribstrat/basin_summary_ues_012505.pdf MDP, 2002: Land Use/Land Cover for Maryland.
28
www.mdp.state.md.us Primrose, Niles. Personal communication. MDE Technical and Regulatory Services Administration. Speir, Harley. Personal communication. MDNR Fisheries Service. Talbot County Creekwatchers. 2004. Talbot County Creekwatchers Water Quality Monitoring Report, 2001-2003. Tiner, R. W. and D. G. Burke. 1995. Wetlands of Maryland. Maryland Department of Natural Resources, Annapolis, MD and U.S. Fish and Wildlife Service, Hadley, MA. Cooperative National Wetlands Inventory Report. University of Maryland, College of Agriculture and Natural Resources. 1998. A Citizen’s Guide to the Water Quality Improvement Act of 1998. http://www.agnr.umd.edu/waterquality/CitizWQ.html Walbeck, David. 2005. Regulated wetland impact data for the period between 1991 and 2005. Maryland Department of the Environment. Wetlands and Waterways Program. Baltimore, MD. Zetina, Elinor. Personal communication. MDE Technical and Regulatory Services Administration.
29
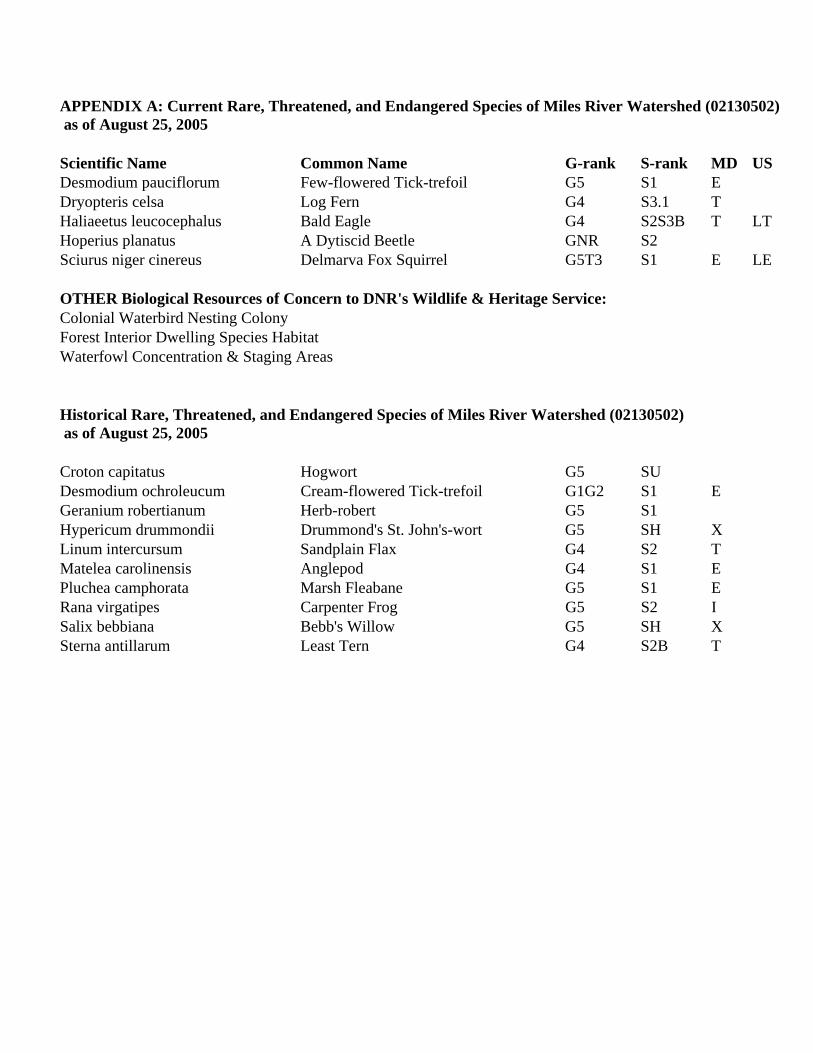
APPENDIX A: Current Rare, Threatened, and Endangered Species of Miles River Watershed (02130502) as of August 25, 2005 Scientific Name Common Name G-rank S-rank MD US Desmodium pauciflorum Few-flowered Tick-trefoil G5 S1 E Dryopteris celsa Log Fern G4 S3.1 T Haliaeetus leucocephalus Bald Eagle G4 S2S3B T LT Hoperius planatus A Dytiscid Beetle GNR S2 Sciurus niger cinereus Delmarva Fox Squirrel G5T3 S1 E LE OTHER Biological Resources of Concern to DNR's Wildlife & Heritage Service: Colonial Waterbird Nesting Colony Forest Interior Dwelling Species Habitat Waterfowl Concentration & Staging Areas Historical Rare, Threatened, and Endangered Species of Miles River Watershed (02130502) as of August 25, 2005 Croton capitatus Hogwort G5 SU Desmodium ochroleucum Cream-flowered Tick-trefoil G1G2 S1 E Geranium robertianum Herb-robert G5 S1 Hypericum drummondii Drummond's St. John's-wort G5 SH X Linum intercursum Sandplain Flax G4 S2 T Matelea carolinensis Anglepod G4 S1 E Pluchea camphorata Marsh Fleabane G5 S1 E Rana virgatipes Carpenter Frog G5 S2 I Salix bebbiana Bebb's Willow G5 SH X Sterna antillarum Least Tern G4 S2B T
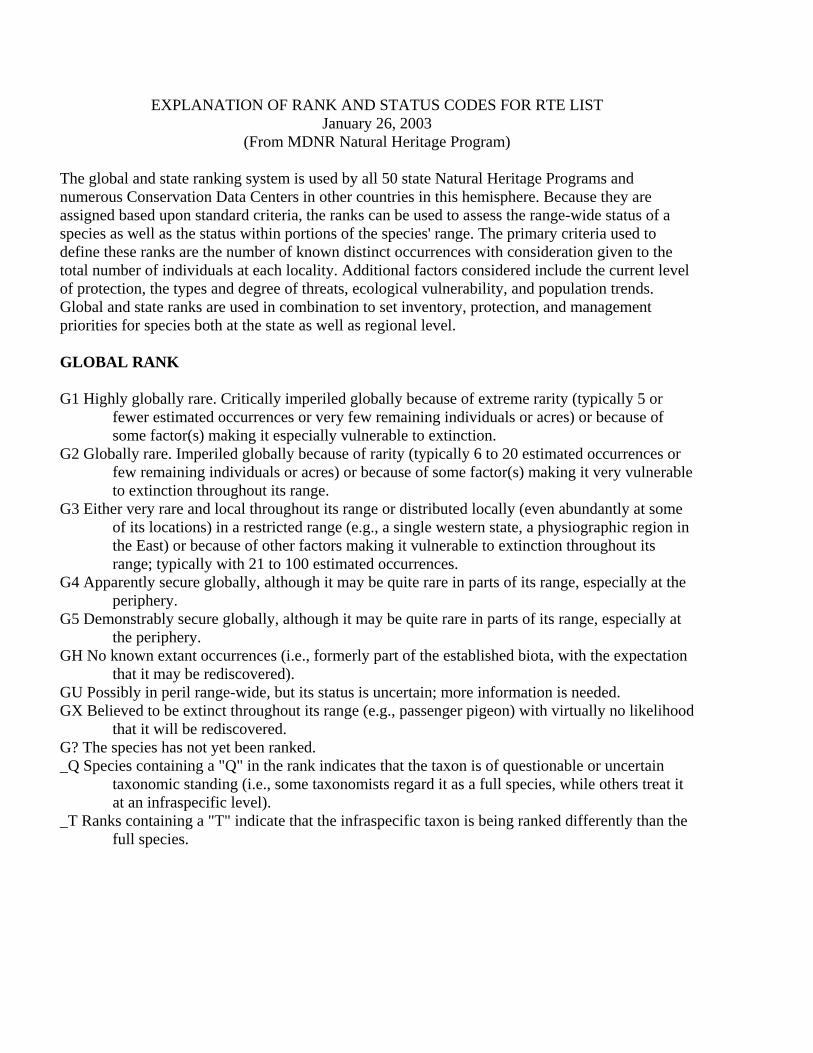
EXPLANATION OF RANK AND STATUS CODES FOR RTE LIST January 26, 2003
(From MDNR Natural Heritage Program)
The global and state ranking system is used by all 50 state Natural Heritage Programs and numerous Conservation Data Centers in other countries in this hemisphere. Because they are assigned based upon standard criteria, the ranks can be used to assess the range-wide status of a species as well as the status within portions of the species' range. The primary criteria used to define these ranks are the number of known distinct occurrences with consideration given to the total number of individuals at each locality. Additional factors considered include the current level of protection, the types and degree of threats, ecological vulnerability, and population trends. Global and state ranks are used in combination to set inventory, protection, and management priorities for species both at the state as well as regional level. GLOBAL RANK G1 Highly globally rare. Critically imperiled globally because of extreme rarity (typically 5 or
fewer estimated occurrences or very few remaining individuals or acres) or because of some factor(s) making it especially vulnerable to extinction.
G2 Globally rare. Imperiled globally because of rarity (typically 6 to 20 estimated occurrences or few remaining individuals or acres) or because of some factor(s) making it very vulnerable to extinction throughout its range.
G3 Either very rare and local throughout its range or distributed locally (even abundantly at some of its locations) in a restricted range (e.g., a single western state, a physiographic region in the East) or because of other factors making it vulnerable to extinction throughout its range; typically with 21 to 100 estimated occurrences.
G4 Apparently secure globally, although it may be quite rare in parts of its range, especially at the periphery.
G5 Demonstrably secure globally, although it may be quite rare in parts of its range, especially at the periphery.
GH No known extant occurrences (i.e., formerly part of the established biota, with the expectation that it may be rediscovered).
GU Possibly in peril range-wide, but its status is uncertain; more information is needed. GX Believed to be extinct throughout its range (e.g., passenger pigeon) with virtually no likelihood
that it will be rediscovered. G? The species has not yet been ranked. _Q Species containing a "Q" in the rank indicates that the taxon is of questionable or uncertain
taxonomic standing (i.e., some taxonomists regard it as a full species, while others treat it at an infraspecific level).
_T Ranks containing a "T" indicate that the infraspecific taxon is being ranked differently than the full species.
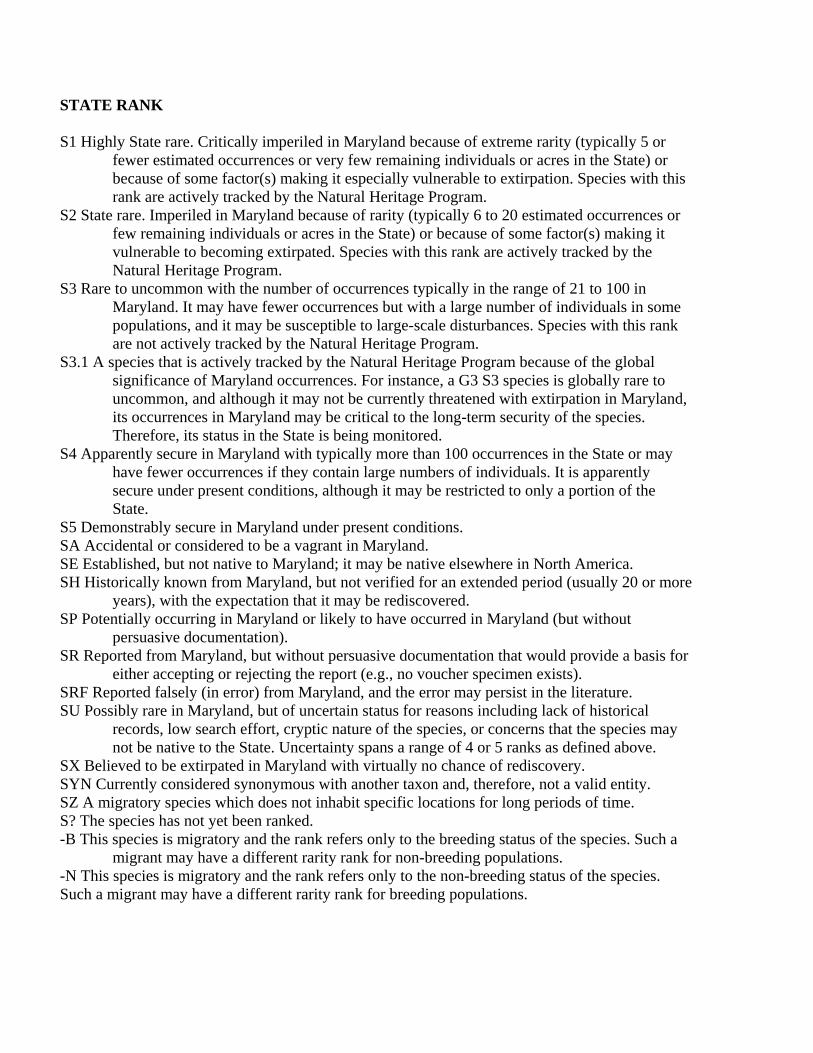
STATE RANK S1 Highly State rare. Critically imperiled in Maryland because of extreme rarity (typically 5 or
fewer estimated occurrences or very few remaining individuals or acres in the State) or because of some factor(s) making it especially vulnerable to extirpation. Species with this rank are actively tracked by the Natural Heritage Program.
S2 State rare. Imperiled in Maryland because of rarity (typically 6 to 20 estimated occurrences or few remaining individuals or acres in the State) or because of some factor(s) making it vulnerable to becoming extirpated. Species with this rank are actively tracked by the Natural Heritage Program.
S3 Rare to uncommon with the number of occurrences typically in the range of 21 to 100 in Maryland. It may have fewer occurrences but with a large number of individuals in some populations, and it may be susceptible to large-scale disturbances. Species with this rank are not actively tracked by the Natural Heritage Program.
S3.1 A species that is actively tracked by the Natural Heritage Program because of the global significance of Maryland occurrences. For instance, a G3 S3 species is globally rare to uncommon, and although it may not be currently threatened with extirpation in Maryland, its occurrences in Maryland may be critical to the long-term security of the species. Therefore, its status in the State is being monitored.
S4 Apparently secure in Maryland with typically more than 100 occurrences in the State or may have fewer occurrences if they contain large numbers of individuals. It is apparently secure under present conditions, although it may be restricted to only a portion of the State.
S5 Demonstrably secure in Maryland under present conditions. SA Accidental or considered to be a vagrant in Maryland. SE Established, but not native to Maryland; it may be native elsewhere in North America. SH Historically known from Maryland, but not verified for an extended period (usually 20 or more
years), with the expectation that it may be rediscovered. SP Potentially occurring in Maryland or likely to have occurred in Maryland (but without
persuasive documentation). SR Reported from Maryland, but without persuasive documentation that would provide a basis for
either accepting or rejecting the report (e.g., no voucher specimen exists). SRF Reported falsely (in error) from Maryland, and the error may persist in the literature. SU Possibly rare in Maryland, but of uncertain status for reasons including lack of historical
records, low search effort, cryptic nature of the species, or concerns that the species may not be native to the State. Uncertainty spans a range of 4 or 5 ranks as defined above.
SX Believed to be extirpated in Maryland with virtually no chance of rediscovery. SYN Currently considered synonymous with another taxon and, therefore, not a valid entity. SZ A migratory species which does not inhabit specific locations for long periods of time. S? The species has not yet been ranked. -B This species is migratory and the rank refers only to the breeding status of the species. Such a
migrant may have a different rarity rank for non-breeding populations. -N This species is migratory and the rank refers only to the non-breeding status of the species. Such a migrant may have a different rarity rank for breeding populations.
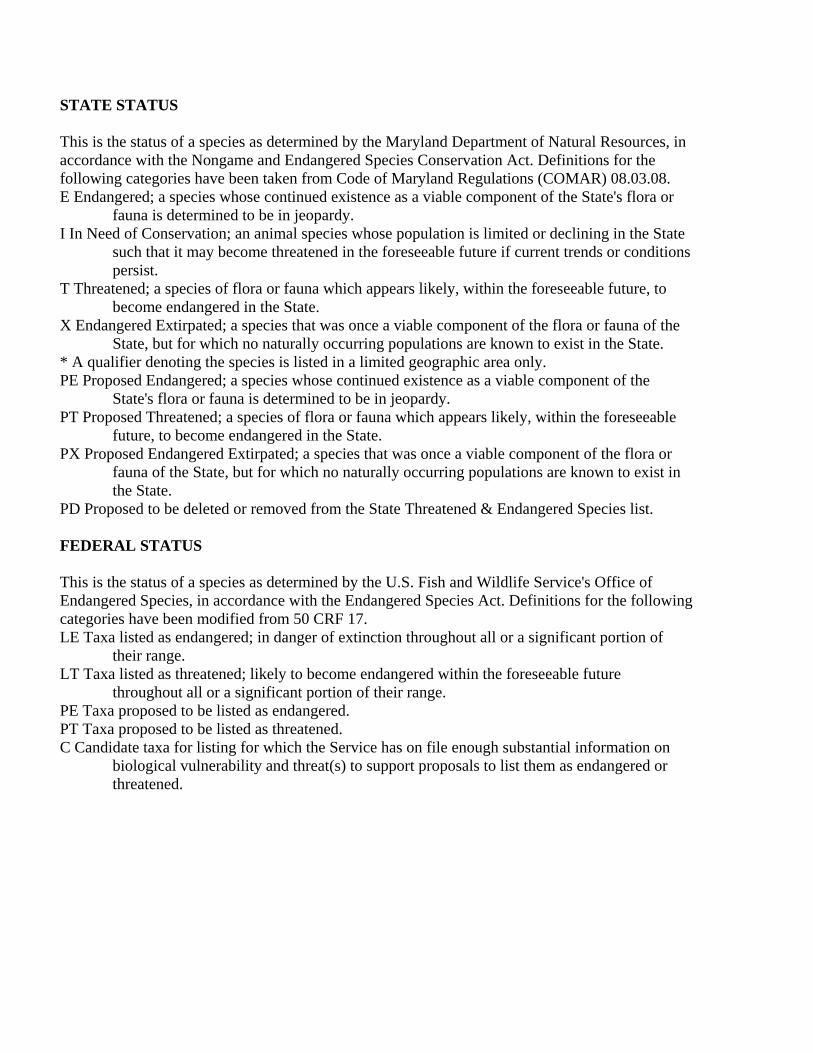
STATE STATUS This is the status of a species as determined by the Maryland Department of Natural Resources, in accordance with the Nongame and Endangered Species Conservation Act. Definitions for the following categories have been taken from Code of Maryland Regulations (COMAR) 08.03.08. E Endangered; a species whose continued existence as a viable component of the State's flora or
fauna is determined to be in jeopardy. I In Need of Conservation; an animal species whose population is limited or declining in the State
such that it may become threatened in the foreseeable future if current trends or conditions persist.
T Threatened; a species of flora or fauna which appears likely, within the foreseeable future, to become endangered in the State.
X Endangered Extirpated; a species that was once a viable component of the flora or fauna of the State, but for which no naturally occurring populations are known to exist in the State.
* A qualifier denoting the species is listed in a limited geographic area only. PE Proposed Endangered; a species whose continued existence as a viable component of the
State's flora or fauna is determined to be in jeopardy. PT Proposed Threatened; a species of flora or fauna which appears likely, within the foreseeable
future, to become endangered in the State. PX Proposed Endangered Extirpated; a species that was once a viable component of the flora or
fauna of the State, but for which no naturally occurring populations are known to exist in the State.
PD Proposed to be deleted or removed from the State Threatened & Endangered Species list. FEDERAL STATUS This is the status of a species as determined by the U.S. Fish and Wildlife Service's Office of Endangered Species, in accordance with the Endangered Species Act. Definitions for the following categories have been modified from 50 CRF 17. LE Taxa listed as endangered; in danger of extinction throughout all or a significant portion of
their range. LT Taxa listed as threatened; likely to become endangered within the foreseeable future
throughout all or a significant portion of their range. PE Taxa proposed to be listed as endangered. PT Taxa proposed to be listed as threatened. C Candidate taxa for listing for which the Service has on file enough substantial information on
biological vulnerability and threat(s) to support proposals to list them as endangered or threatened.

APPENDIX B
Green Infrastructure
Green Infrastructure Assessment Miles River Watershed
August 2005
Maryland Department of Natural Resources
Introduction The Miles River watershed is entirely within Talbot County, Maryland. Large blocks of natural resource lands across the Miles River watershed, as well as across the County and the State of Maryland, provide valuable water quality and habitat benefits. These areas are primarily large blocks of contiguous forest but also include wetlands and other naturally vegetated lands. In general, actions taken to prevent conversion to other land uses, to avoid forest fragmentation, and to restore forest in areas that have been cleared will contribute significantly to maintaining and improving water quality in this watershed and to conserving Maryland’s biodiversity. To assist in protection and tracking of natural resource areas that are important at the landscape scale, Maryland Department of Natural Resources (DNR) mapped a statewide network of ecologically important lands collectively called “Green Infrastructure.” This Green Infrastructure provides the bulk of the state's natural support system. It delivers ecosystem services, such as cleaning the air, filtering and cooling water, storing and cycling nutrients, conserving and generating soils, pollinating crops and other plants, regulating climate, protecting areas against storm and flood damage, and maintaining hydrologic function. Green Infrastructure, as defined by DNR represents natural resource conditions on the ground. In general, the Green Infrastructure network is comprised of large blocks of ecologically important natural resource lands called hubs and corridors that link the hubs. Hubs contain one or more of the following:
- Areas containing sensitive plant or animal species; - Large blocks of contiguous interior forest (at least 250 contiguous acres, plus the
300 foot transition zone); - Wetland complexes with at least 250 acres of unmodified wetlands; - Streams or rivers with aquatic species of concern, rare coldwater or blackwater
ecosystems, or important to anadromous fish, and their associated riparian forest and wetlands; and
- Conservation areas already protected by public (primarily DNR or the federal government) and private organizations like The Nature Conservancy or Maryland Ornithological Society.
For more information on how Maryland’s Green Infrastructure was identified and previously published reports that reflect conditions in the 1990s, see www.dnr.maryland.gov/greenways/ Local Findings Across Maryland, new development, land management changes and other on-the-ground activities are changing Green Infrastructure in measurable ways compared to conditions in the 1990s when it was originally identified. Until a fully updated Green Infrastructure assessment can be performed to comprehensively account for these changes, an interim approach has been devised to gauge current conditions in the Green Infrastructure. The
interim approach employs the Green Infrastructure boundaries for hubs and corridors, as defined in DNR’s original analysis, like cookie cutters on Maryland Department of Planning 2002 land use data. The boundaries of the hubs and corridors serve as benchmarks to gauge expansion or contraction of the Green Infrastructure area. This approach acknowledges land use changes that have occurred within Maryland’s Green Infrastructure since it was initially identified. The map Green Infrastructure – 2002 shows several findings for the Miles River watershed:
- Naturally vegetated land, including forest and wetlands, covers about one third of the Green Infrastructure hubs and about one quarter of the corridors.
- Agriculture encompasses about one quarter of the hubs and nearly one third of the corridors.
- Development accounts for 4% of the hubs and 8% of the corridors. - Overall for the watershed area, these findings suggest that connectivity and
integrity of the Green Infrastructure network is limited because land that is not naturally vegetated (agriculture and development) covers nearly a third of the hubs and covers about two-fifths of the corridors.
Change Over Time Using the same approach described for 2002 data, the existing Green Infrastructure hub and corridor boundaries are applied like cookie cutters on Maryland Department of Planning 1973 land use data. This approach is employed based on the assumption that at least as much Green Infrastructure was present in these areas two or three decades prior to the original Green Infrastructure assessment. However, this approach cannot account for loss of an entire Green Infrastructure hub or corridor that may have occurred between the early 1970s and the middle 1990s. The map Green Infrastructure 1973 – Miles River Watershed depicts local conditions are they existing nearly 30 years prior to the data for 2002. By comparing the land use differences within the hub and corridor boundaries for 1973 and 2002, an estimate of land use change in the hubs and corridors for over nearly 30 years can be generated. Several findings from the comparison are summarized below.
- In hubs, naturally vegetated land, including forest and wetlands, lost about 334 acres between 1973 and 2002. During this time period, agriculture and development both increased from about 24% in aggregate to about 30%. This change suggests that the collective natural values of the hubs have been reduced.
- In corridors, naturally vegetated land declined about 265 acres during this time. In addition, agriculture lost about 119 acres. Development increased about 474 acres. This change in land use suggests that the connection between Green Infrastructure hubs has been reduced and that the rural character of the corridors is also being lost.
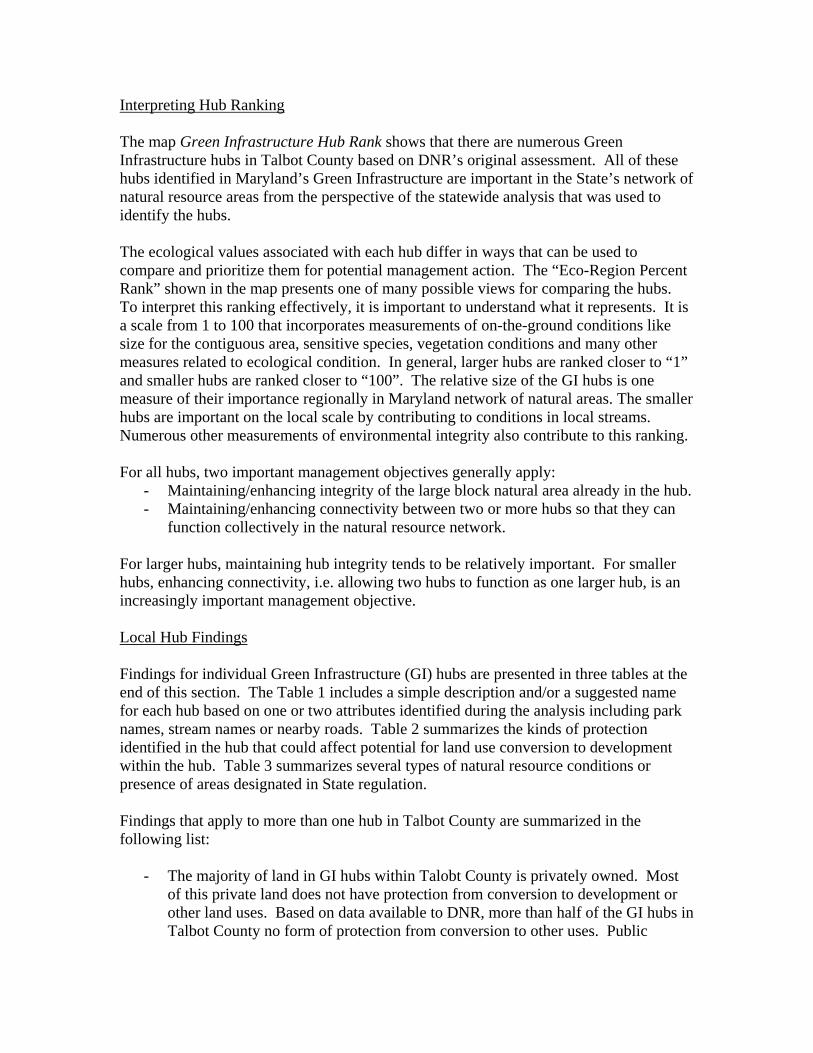
Interpreting Hub Ranking The map Green Infrastructure Hub Rank shows that there are numerous Green Infrastructure hubs in Talbot County based on DNR’s original assessment. All of these hubs identified in Maryland’s Green Infrastructure are important in the State’s network of natural resource areas from the perspective of the statewide analysis that was used to identify the hubs. The ecological values associated with each hub differ in ways that can be used to compare and prioritize them for potential management action. The “Eco-Region Percent Rank” shown in the map presents one of many possible views for comparing the hubs. To interpret this ranking effectively, it is important to understand what it represents. It is a scale from 1 to 100 that incorporates measurements of on-the-ground conditions like size for the contiguous area, sensitive species, vegetation conditions and many other measures related to ecological condition. In general, larger hubs are ranked closer to “1” and smaller hubs are ranked closer to “100”. The relative size of the GI hubs is one measure of their importance regionally in Maryland network of natural areas. The smaller hubs are important on the local scale by contributing to conditions in local streams. Numerous other measurements of environmental integrity also contribute to this ranking. For all hubs, two important management objectives generally apply:
- Maintaining/enhancing integrity of the large block natural area already in the hub. - Maintaining/enhancing connectivity between two or more hubs so that they can
function collectively in the natural resource network. For larger hubs, maintaining hub integrity tends to be relatively important. For smaller hubs, enhancing connectivity, i.e. allowing two hubs to function as one larger hub, is an increasingly important management objective. Local Hub Findings Findings for individual Green Infrastructure (GI) hubs are presented in three tables at the end of this section. The Table 1 includes a simple description and/or a suggested name for each hub based on one or two attributes identified during the analysis including park names, stream names or nearby roads. Table 2 summarizes the kinds of protection identified in the hub that could affect potential for land use conversion to development within the hub. Table 3 summarizes several types of natural resource conditions or presence of areas designated in State regulation. Findings that apply to more than one hub in Talbot County are summarized in the following list:
- The majority of land in GI hubs within Talobt County is privately owned. Most of this private land does not have protection from conversion to development or other land uses. Based on data available to DNR, more than half of the GI hubs in Talbot County no form of protection from conversion to other uses. Public
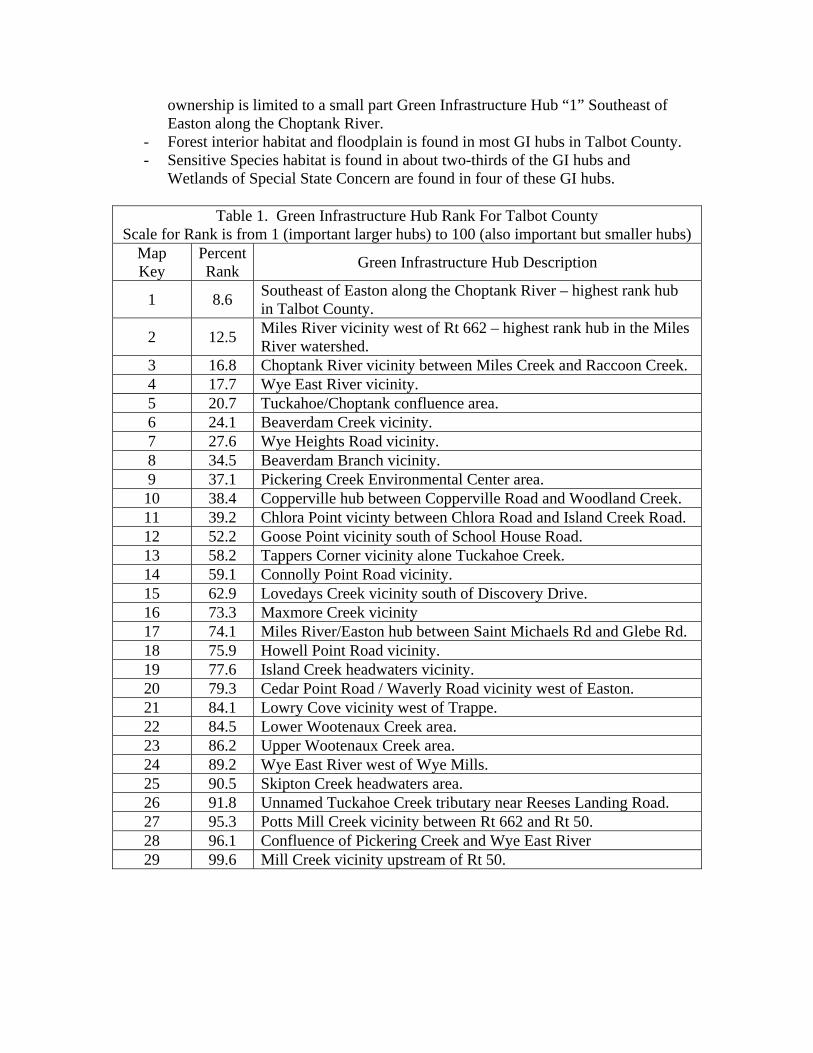
ownership is limited to a small part Green Infrastructure Hub “1” Southeast of Easton along the Choptank River.
- Forest interior habitat and floodplain is found in most GI hubs in Talbot County. - Sensitive Species habitat is found in about two-thirds of the GI hubs and
Wetlands of Special State Concern are found in four of these GI hubs.
Table 1. Green Infrastructure Hub Rank For Talbot County Scale for Rank is from 1 (important larger hubs) to 100 (also important but smaller hubs)
Map Key
Percent Rank Green Infrastructure Hub Description
1 8.6 Southeast of Easton along the Choptank River – highest rank hub in Talbot County.
2 12.5 Miles River vicinity west of Rt 662 – highest rank hub in the Miles River watershed.
3 16.8 Choptank River vicinity between Miles Creek and Raccoon Creek. 4 17.7 Wye East River vicinity. 5 20.7 Tuckahoe/Choptank confluence area. 6 24.1 Beaverdam Creek vicinity. 7 27.6 Wye Heights Road vicinity. 8 34.5 Beaverdam Branch vicinity. 9 37.1 Pickering Creek Environmental Center area. 10 38.4 Copperville hub between Copperville Road and Woodland Creek. 11 39.2 Chlora Point vicinty between Chlora Road and Island Creek Road. 12 52.2 Goose Point vicinity south of School House Road. 13 58.2 Tappers Corner vicinity alone Tuckahoe Creek. 14 59.1 Connolly Point Road vicinity. 15 62.9 Lovedays Creek vicinity south of Discovery Drive. 16 73.3 Maxmore Creek vicinity 17 74.1 Miles River/Easton hub between Saint Michaels Rd and Glebe Rd. 18 75.9 Howell Point Road vicinity. 19 77.6 Island Creek headwaters vicinity. 20 79.3 Cedar Point Road / Waverly Road vicinity west of Easton. 21 84.1 Lowry Cove vicinity west of Trappe. 22 84.5 Lower Wootenaux Creek area. 23 86.2 Upper Wootenaux Creek area. 24 89.2 Wye East River west of Wye Mills. 25 90.5 Skipton Creek headwaters area. 26 91.8 Unnamed Tuckahoe Creek tributary near Reeses Landing Road. 27 95.3 Potts Mill Creek vicinity between Rt 662 and Rt 50. 28 96.1 Confluence of Pickering Creek and Wye East River 29 99.6 Mill Creek vicinity upstream of Rt 50.
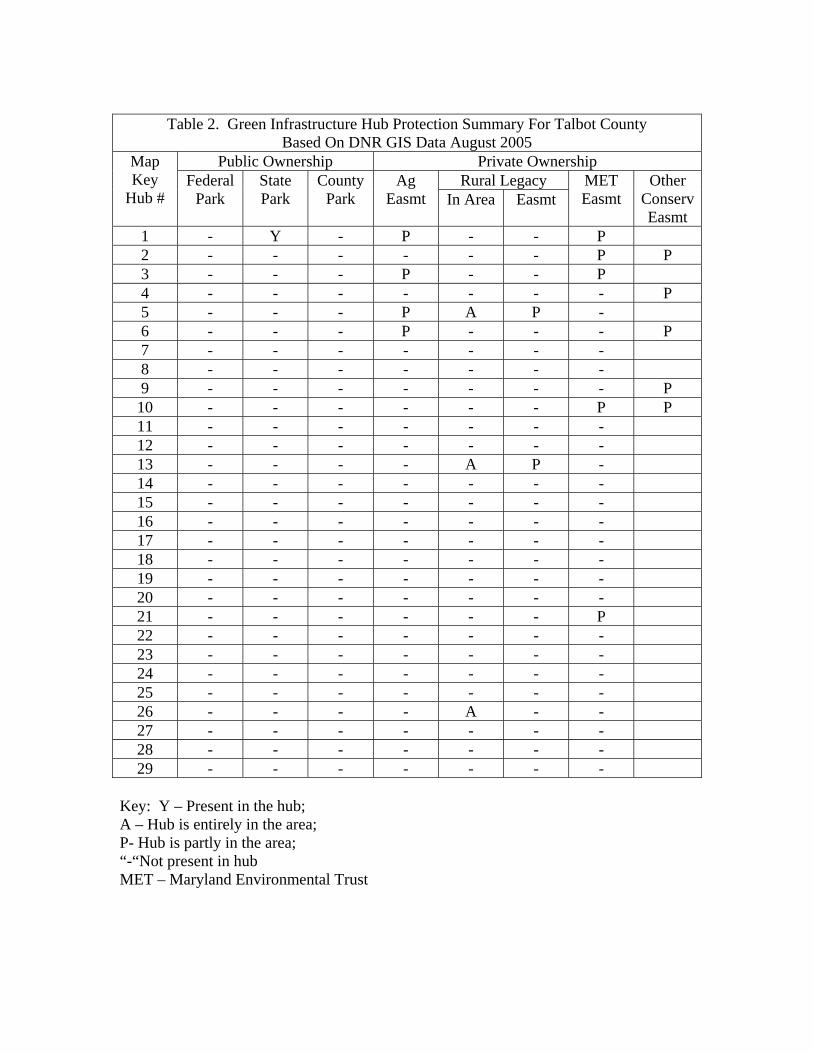
Table 2. Green Infrastructure Hub Protection Summary For Talbot County
Based On DNR GIS Data August 2005 Public Ownership Private Ownership
Rural Legacy Map Key
Hub # Federal
Park State Park
County Park
Ag Easmt In Area Easmt
MET Easmt
Other ConservEasmt
1 - Y - P - - P 2 - - - - - - P P 3 - - - P - - P 4 - - - - - - - P 5 - - - P A P - 6 - - - P - - - P 7 - - - - - - - 8 - - - - - - - 9 - - - - - - - P 10 - - - - - - P P 11 - - - - - - - 12 - - - - - - - 13 - - - - A P - 14 - - - - - - - 15 - - - - - - - 16 - - - - - - - 17 - - - - - - - 18 - - - - - - - 19 - - - - - - - 20 - - - - - - - 21 - - - - - - P 22 - - - - - - - 23 - - - - - - - 24 - - - - - - - 25 - - - - - - - 26 - - - - A - - 27 - - - - - - - 28 - - - - - - - 29 - - - - - - -
Key: Y – Present in the hub; A – Hub is entirely in the area; P- Hub is partly in the area; “-“Not present in hub MET – Maryland Environmental Trust
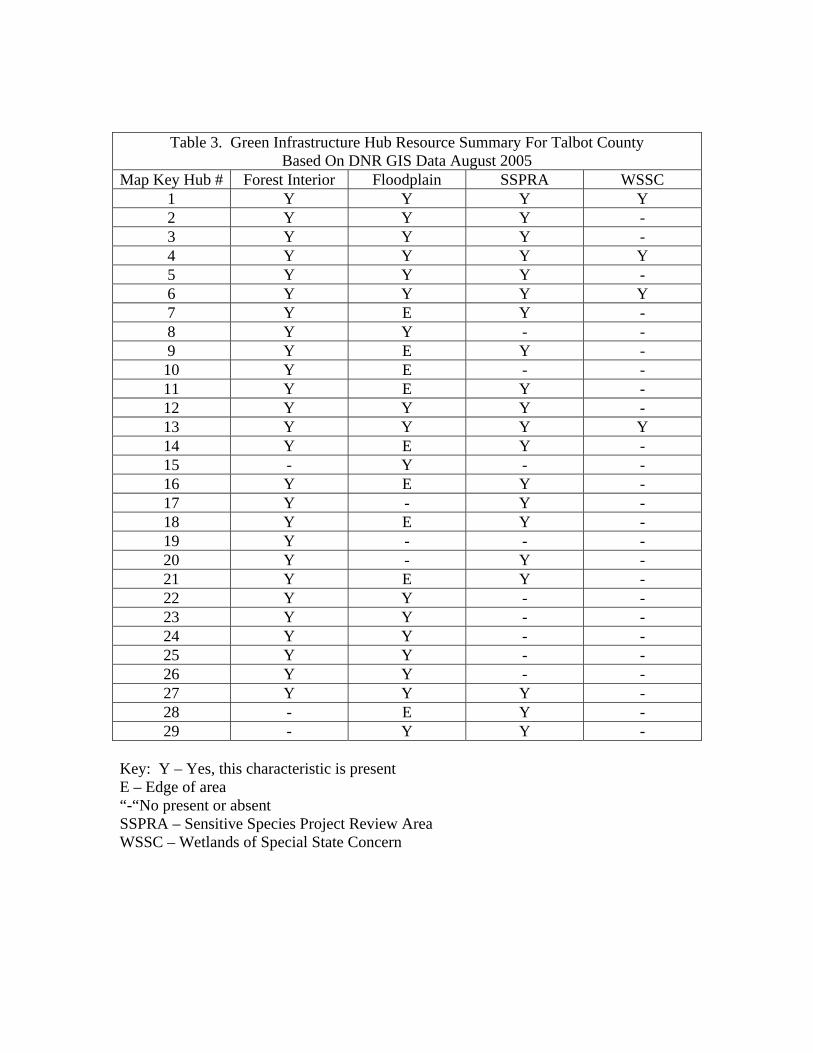
Table 3. Green Infrastructure Hub Resource Summary For Talbot County Based On DNR GIS Data August 2005
Map Key Hub # Forest Interior Floodplain SSPRA WSSC 1 Y Y Y Y 2 Y Y Y - 3 Y Y Y - 4 Y Y Y Y 5 Y Y Y - 6 Y Y Y Y 7 Y E Y - 8 Y Y - - 9 Y E Y - 10 Y E - - 11 Y E Y - 12 Y Y Y - 13 Y Y Y Y 14 Y E Y - 15 - Y - - 16 Y E Y - 17 Y - Y - 18 Y E Y - 19 Y - - - 20 Y - Y - 21 Y E Y - 22 Y Y - - 23 Y Y - - 24 Y Y - - 25 Y Y - - 26 Y Y - - 27 Y Y Y - 28 - E Y - 29 - Y Y -
Key: Y – Yes, this characteristic is present E – Edge of area “-“No present or absent SSPRA – Sensitive Species Project Review Area WSSC – Wetlands of Special State Concern
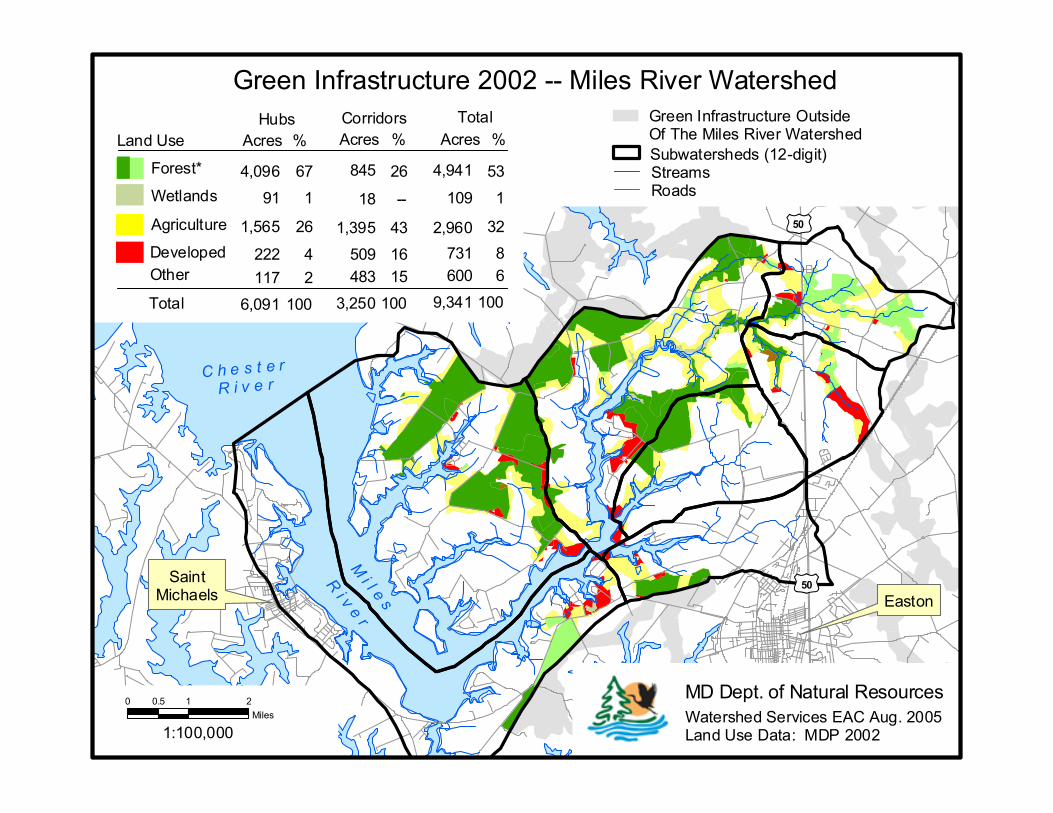
1:100,0000 1 20.5
Miles
C h e s t e rR i v e r
£¤50
MD Dept. of Natural ResourcesWatershed Services EAC Aug. 2005Land Use Data: MDP 2002
Easton
M i l e s
R i v e r
SaintMichaels £¤50
Green Infrastructure 2002 -- Miles River Watershed
DevelopedAgriculture
Forest*
Total
2221,565
4,096
6,091
Land Use Acres
426
67
100
%Hubs
509
845
3,250
Acres
1643
26
100
%Corridors
Other 117 2 483 15
1,395731
4,941
9,341
Acres
832
53
100
%Total
600 6
2,960Wetlands 91 1 --18 1109
Subwatersheds (12-digit)StreamsRoads
Green Infrastructure OutsideOf The Miles River Watershed
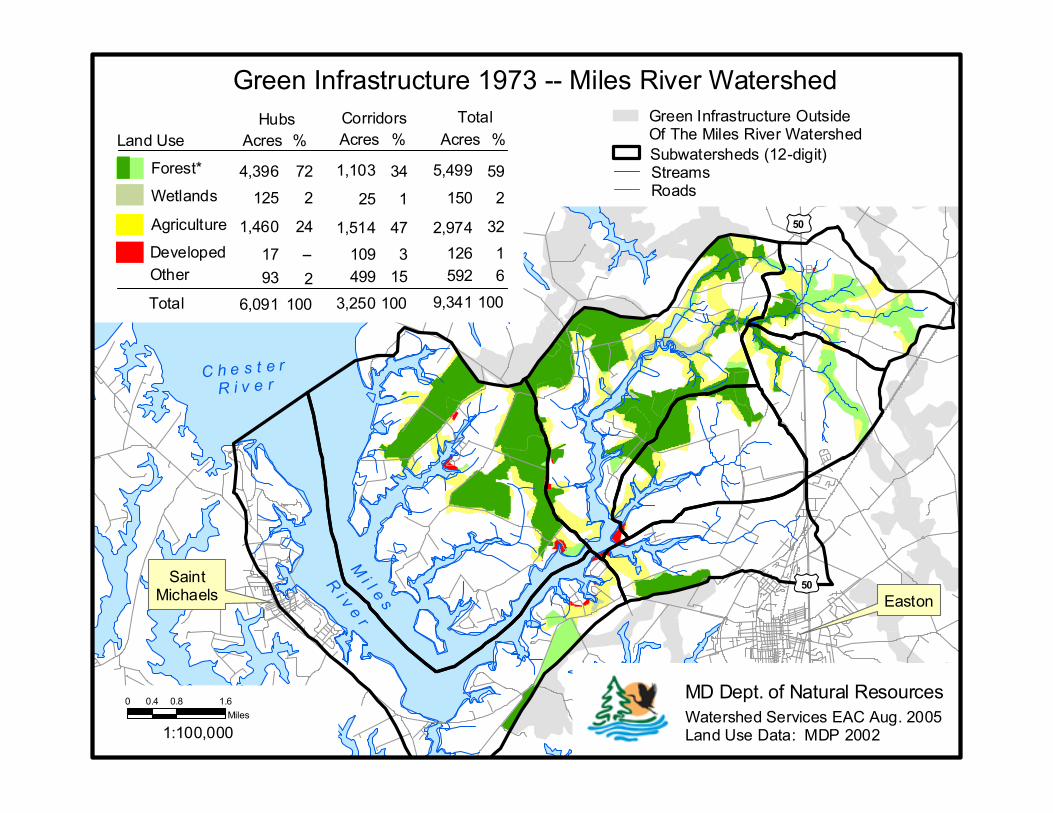
1:100,0000 0.8 1.60.4
Miles
C h e s t e rR i v e r
£¤50
MD Dept. of Natural ResourcesWatershed Services EAC Aug. 2005Land Use Data: MDP 2002
Easton
M i l e s
R i v e r
SaintMichaels £¤50
Green Infrastructure 1973 -- Miles River Watershed
DevelopedAgriculture
Forest*
Total
171,460
4,396
6,091
Land Use Acres
--24
72
100
%Hubs
109
1,103
3,250
Acres
347
34
100
%Corridors
Other 93 2 499 15
1,514126
5,499
9,341
Acres
132
59
100
%Total
592 6
2,974Wetlands 125 2 125 2150
Subwatersheds (12-digit)StreamsRoads
Green Infrastructure OutsideOf The Miles River Watershed
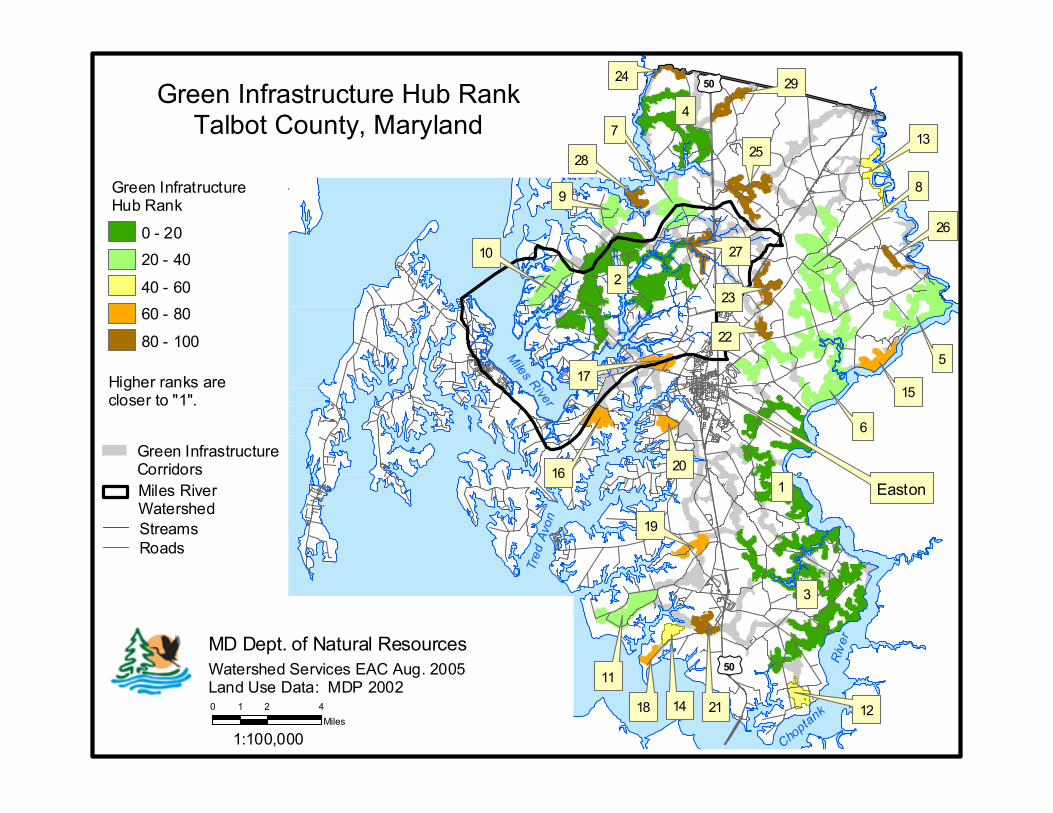
1:100,0000 2 41
Miles
£¤50MD Dept. of Natural ResourcesWatershed Services EAC Aug. 2005Land Use Data: MDP 2002
Easton
£¤50Green Infrastructure Hub RankTalbot County, Maryland
Higher ranks arecloser to "1".
Miles RiverWatershedStreamsRoads
Green InfrastructureCorridors
1
2
3
4
5
6
7
89
10
1112
13
14
15
16
17
18
19
20
21
22
23
24
25
2627
28
29
Green InfratructureHub Rank
0 - 2020 - 4040 - 6060 - 8080 - 100
Choptank
River
Miles RiverTre
d Avo
n
Miles River Watershed Characterization Maps
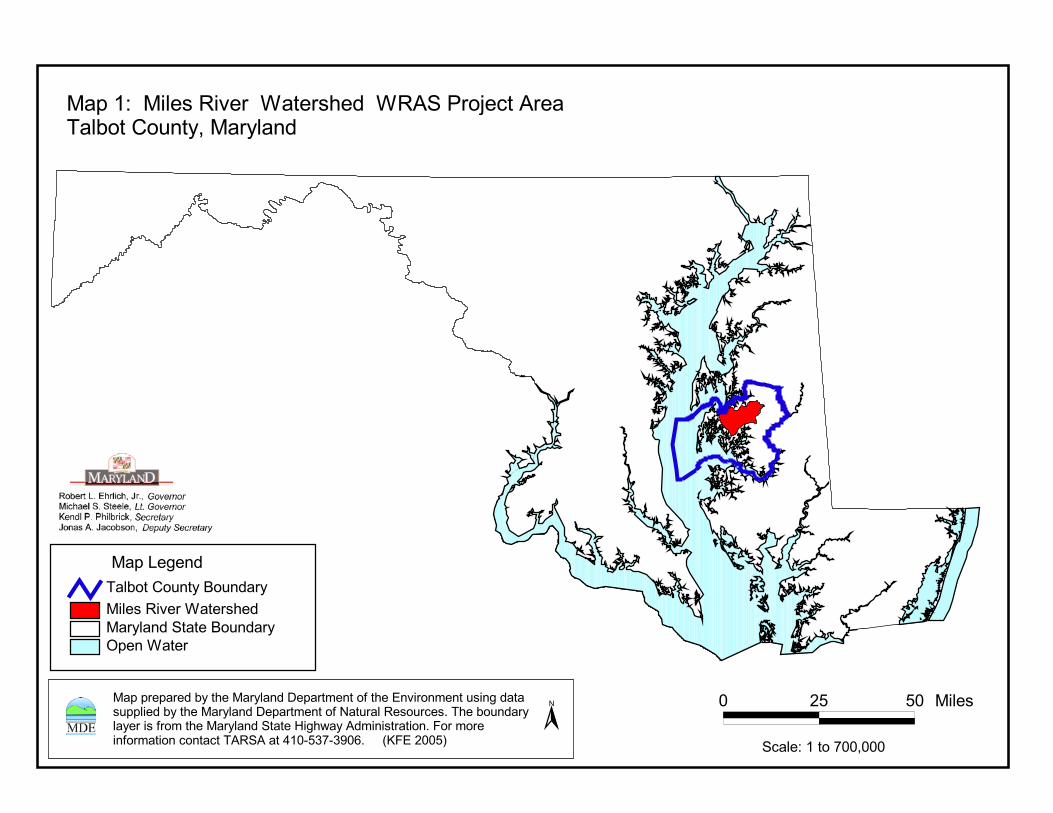
��������������������������� �������������������������������������������������������� ������������������������������������������������������������������������������������������ ��������������������������������!"#$%&'$&(#)������*+ ��,##%-
�
.����/����������������0�������������������/������������1�����0�����������2�����
����"3���������������/��������/����4��5�������������1����6���������
�����3�"���'##6###
# ,% %# �����
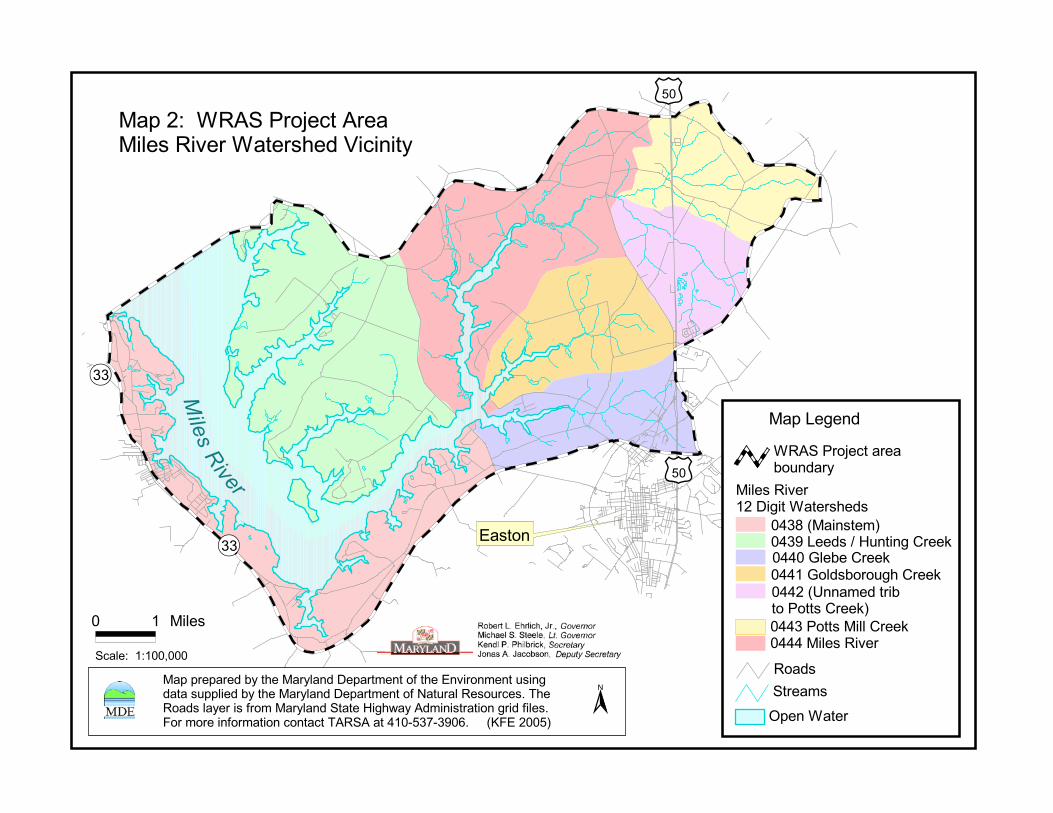
�����������
����
���� ������
����
������� ������������������������������������������������
����� ��� �������
� � ����
������������� �!�������������
�����"������
#��������
�����������������$�%�����
��&�!���
�'�(�)������"*�'�+�&�����,�-%����!�.���/�''��0��$��.���/�''��0����$���%!��.���/�''��)1���"������$���������.���/*�''������������.���/�'''�����������
���������$�������������� ����"�����2������������"����%���!������%�����$�������������� ����"�����2�3��%��������%����4�5�����������������2��"���������������-�!�6�����"������������!����2����47���"������2��"��������������5��������'��8��98�+�:4�����);7������*
3
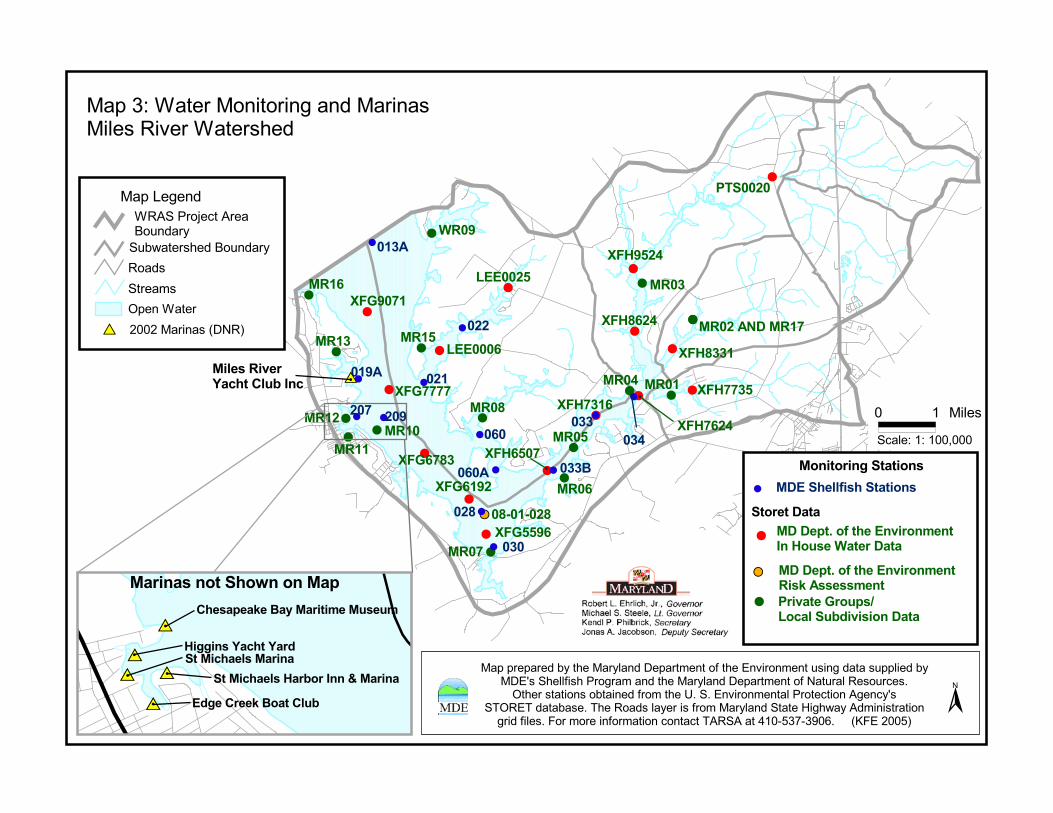
��
�
�
� ��
�
�
�
�
�
�
�
�
� �
�
�
�
�
��
��
�
�
�
�
�
�
�
�
��
�
� �
�
�
�
�
�
�
�
�
� �
����
���� ���
���
���
���
���
����
���
����
�� ���
�������
�� ����
���
������
������
�����
�������
������
�������
�������
�������
��������������
�������
��������
����
����
����
������������
����
����
���� ����
����
����
���
����
������������ �!"#$%&�'�()�*+$ �
�
������
�
����
������
�������������� �������
��������
���������������� �������
��������������
�� �������������� !�"
��#$�%$�%��&���
� % ��#�
����'$������������������������������#����(���������
���������������������#���� ���������)����*�(�����������������������#������ *+����##)�����������������������#���� ���������)�!�����#�������,����������������������)�������-,��,�*�(��������#��������������+�
�.��*.��������,�.��������#�������)��������#���������/��������������������������)�#�,�0���������)���������������.��������1%�23'42'5�6,������70*����3"
!
&,!�&��#&#� �����-&.�,/�&%���+ �!,+0�+&�
*+��,(����#&�!��#&#�� �����-&.�,/�&%���+ �!,+0�+&
���1�������0�+&� �!� #&���!,(-�2
�,$#�� ()3� ���,+��#&#
� ���� %���/��%� &#&�,+��,+�&,!�+4� &#&�,+�
��
��
������
�
'%��#-�#1���#5��#!�&�0���(��(0
���44�+��"#$%&�"#!3
�
&���$%#�����#!�+#� &���$%#�����#!),!�*++�6��#!�+#
� �34��'!��1��,#&�'�()
�#!�+#��+,&� %,7+�,+��#-
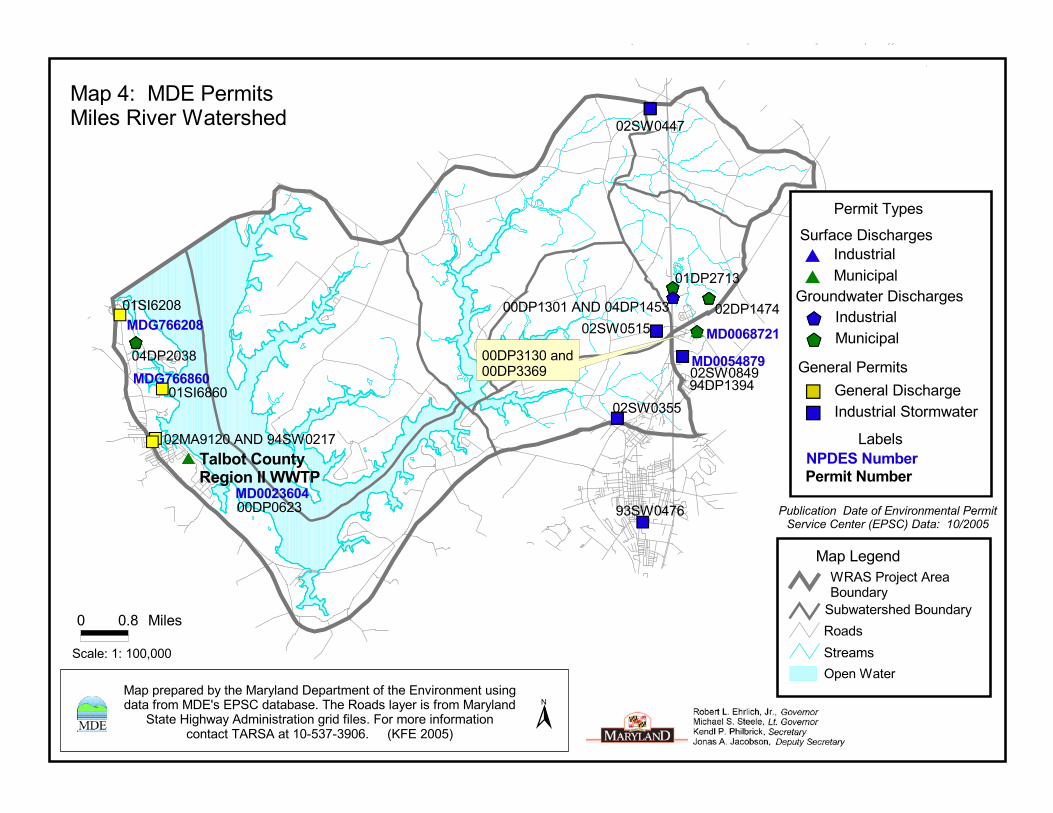
������
�
��
��
��
����
��
����
��
����
��
����
��
���
��
��
����
��
�����
��
�����
����
��
��������
����������������
��������
��������
��������� ��������
������
���������� �����������������
��������
��������
�������
��������
�������
���������� ���������
�������
��������
������
�������
�������������������
������������������������ �
�������������������������
�� �!�"���
����#��$%����#&�����������
�����'#( ��������
���)�*��*����+���
� �,� �-)�#
�� ��*����.����'-�#�-)�#��-/��������#&��
�� � �� �����$���&������)������ ���'�����0��&��.�/-���'�����#-�"�����0��'���.1#�.��2�����$�#�,�3&������#�)�����-#�0��'�����)���
������4-"&%�����'-�-#����-���"�-��0-)�#,�5���'����-�0��'��-����������3����������6��6���,�����785.�����9
� ����#��-�)� ���-�- �)
�� ����#��-�)��� ���-�- �)�
�� :�����)��-#�&��"���� ����#��-�)�����'%�����
���0�����-#�&��"�#
:�����%������-#�&��"�#
:�����)����'-�#
���'-��3� �#
��� ���!� ���!��"#�!� ���
!�$�)#
��������������� ����������������������������������������������
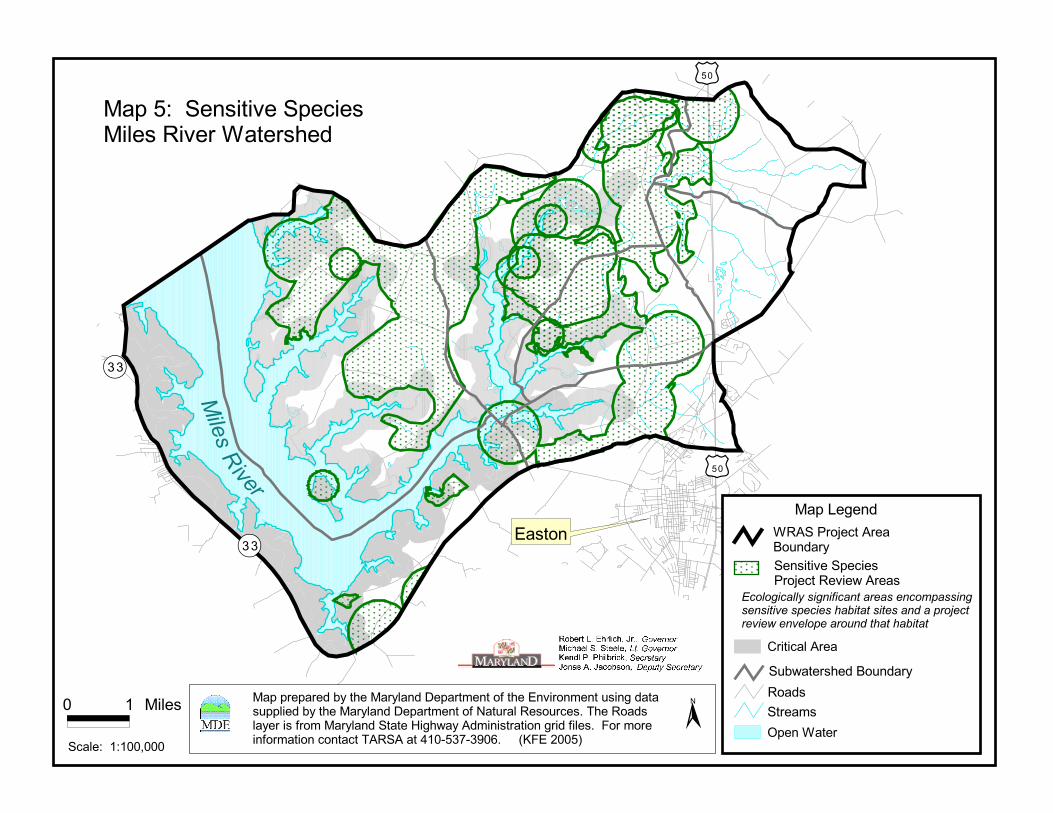
������� ����
����
����
����
����
������
���������� � ������� ��� ����� �������������
���������������
� � � ��� ���������������������������������
����������
�� ��!��"���� ��������������� � ������� ��!��"������� ��� ����
����#�$���
%� � ���� ���
����� ����������� ��� �� ������� ����������������������� ��� �������� ��� ����������������������� �������� ��� ��� �
�����������������������������&�����������'�������� ���������� �$���������� �������������������&�����������'�(����������������)�*�������������� ��'�������������������+ $����� �� � ����� ���$� ��' ���)��,������� �'����� �����������* �� ����-��./0./1�2)�����34,��5��6
(
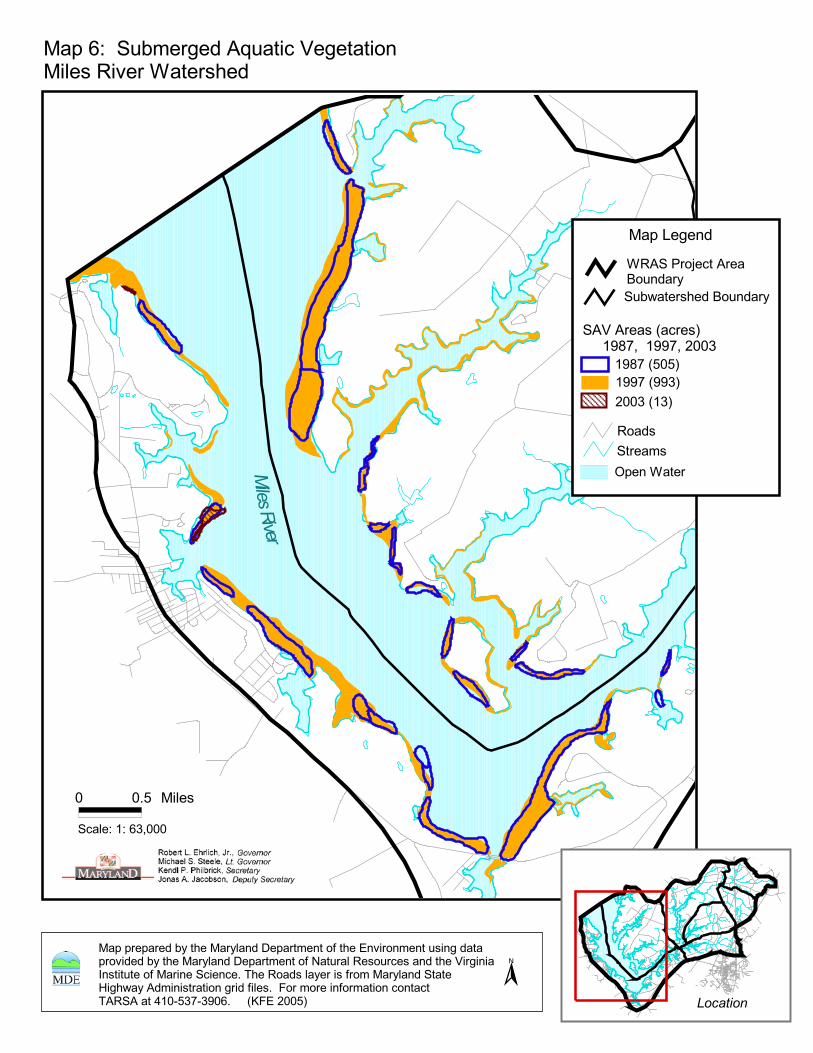
�����������
�����������
��� �����
����������� �������
���� ������� �����������
���� ����
�� ! �"�"����! �����
��# ����� ������� �� !$ ���!$ ����
%�� &�'��
�� ��
%�� () ������'� �*���+� #�'����+��%+,�� �+-�� ��������
%�� ������� �� ��� %���,�� .��������� �/ ��� 0�-+������� ��+�' ������-+� �� ��� %���,�� .��������� �/ 1�����, ��������� �� ��� #+�'+�+�2���+���� �/ %��+�� ��+����3 4�� ���� ,���� +� /��� %���,�� �����5+'���� ��+�+�����+�� '�+ /+,��3 6�� ���� +�/�����+�� �������4���� �� 7��8"�!8���(3 �960 ���"�
1
� �3" %+,��
���,�) �) (�$���
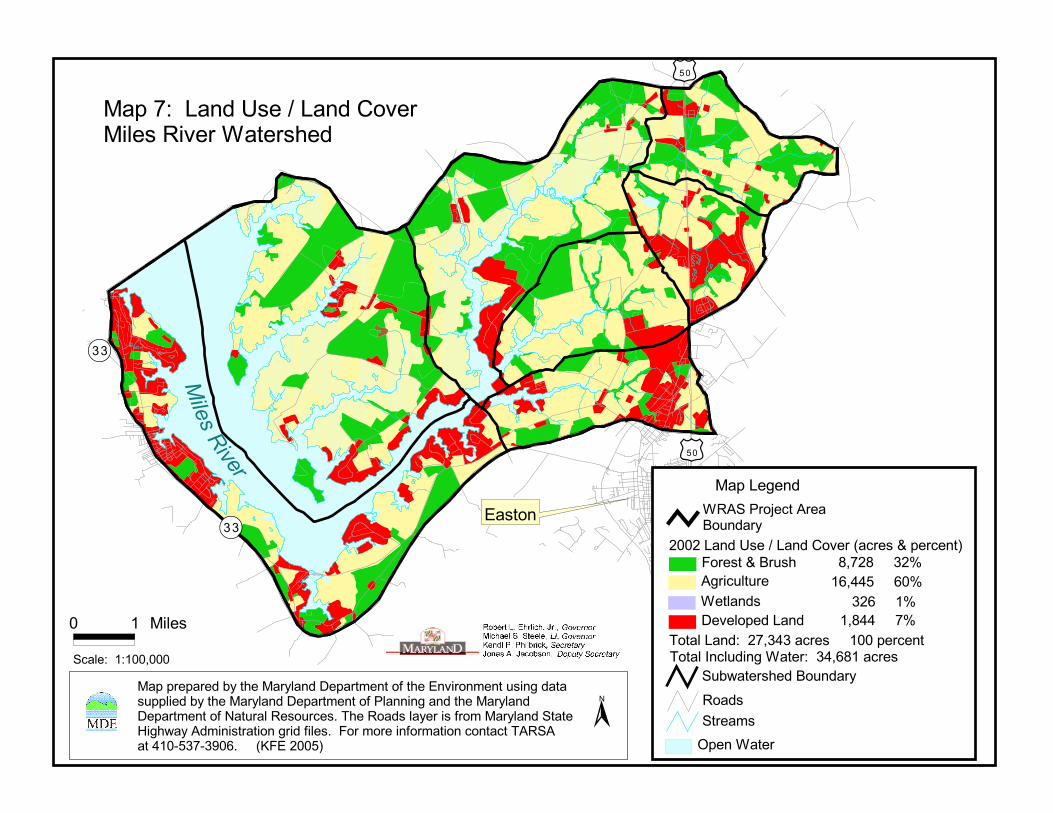
������
����������� ����
����
����
����
����������� ������������������������������������
���������������
� � �����
��������������� ���������!������"
#���������
��$��%��&����$���!������"
������'���
(��(������ ����������������)������*��������+,������*�!����
-���������������������$'���������
.�����������(�/0/����������������������
.�����1�������'��������/0�23�������
3�(3�����/(4�2�005�����2�4
/(2������4��300�����4
��������������"��������"�����-�����������6���������������������'���������������"��������"�����-�����������6�%������'������������"����-�����������6�7����������������8�.�����������"������6�������"����������9�'� �"�$��������������'����6����8��,����������6�����������������.$��$���0��:5/:/;�28�����)<,��(��5+
7
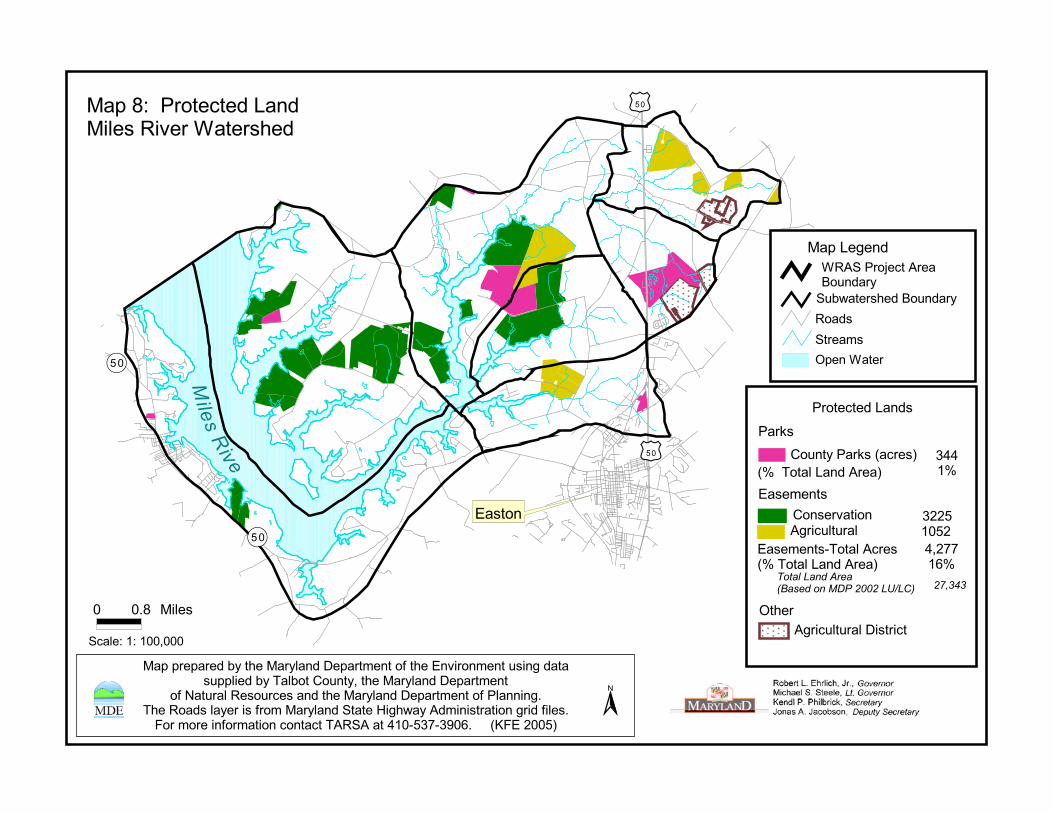
����������
����������
����
����
����
������ ���������������
���������
������������������������
���������������
�������� !
"# �$���
���#���������������$����$%�����������
������������������������&����������'�����%$���������$�����������$����(�����)�����!�����������&���������
�'*�����������������������������&����������'�����$��"(������������$�'���������������+$��������$�$�����$����$�'$���",������$�'�����$���������(�����-� ./01.02 3"45,�6 /7
*
���8�
���$��������
)��������8�4�����7
)�����%��$��� /6
0--�949(������������7
-!611�39
066/���������
���������.(���������49(������������7
��������������
��������$��������&$���$��
������ ������������� ���������������� ������
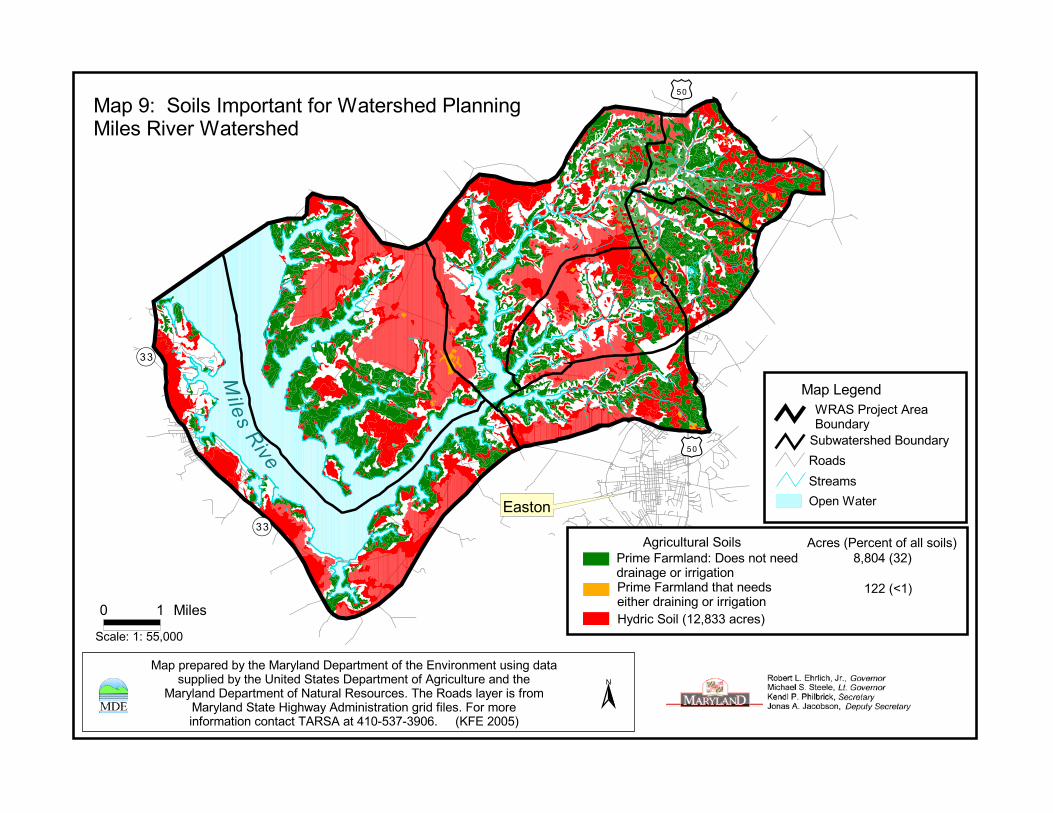
����� �����
������
����
����
����
���������� ���������������
���������
������������������������
���������������
������� !"""
" � �#���
$!$"%&'()��#��*��������+�������������#������#��#���#��
,���#��#�&�(!$''�����)
���#���������#�� �����&��������-�����#��)
��#��*�����������������#�������#�#����#��#���#��
�((&.�)
������������������������+����������-�����/#���������#�����������#�������0�#��������+����������-���#�������������
��������+����������-1���������������23������������#�-���������������,#��������#�#�����#����#�-#���2*������#�-�����#���������3�����%�"4 '54'6"72&8*�("" )
1
���6��#��9��������-����������������#���#����#/�����������
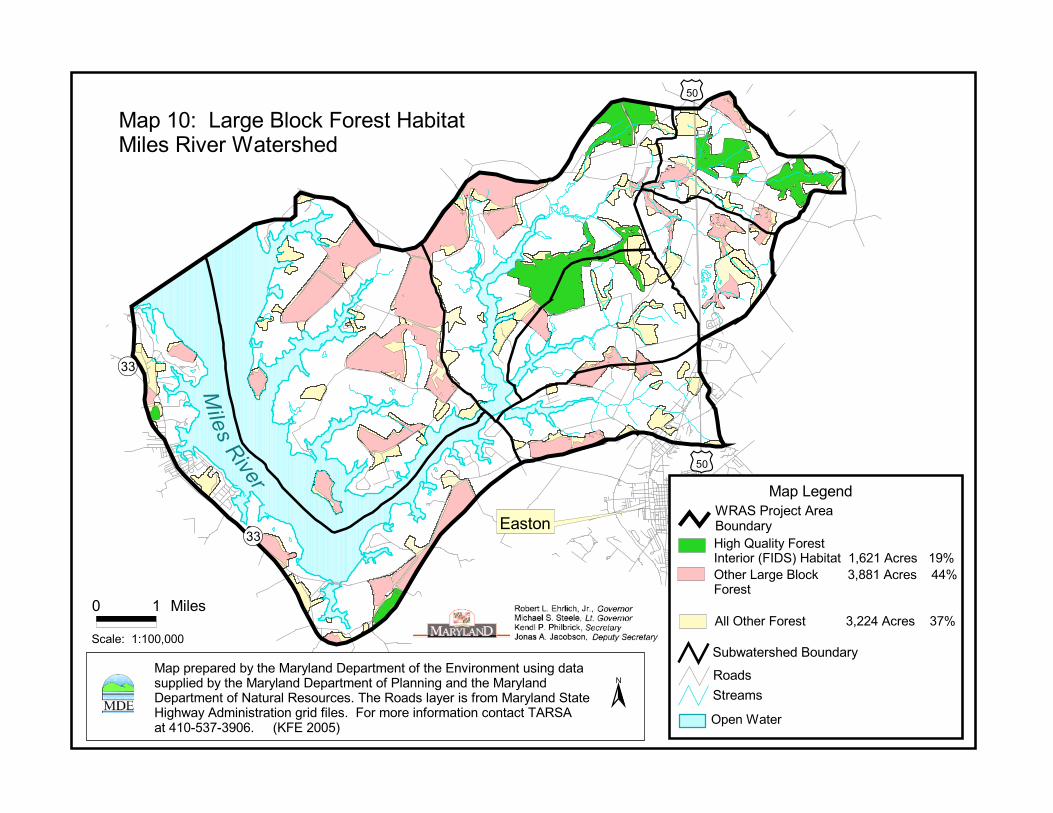
�����������
����
����
����
����������
���� ������������������������������������������������
����� �������!�"�����������!����#
$��������
��%��&��'����%�����!����#
��������
�����(!����#�������)��������*�)+�,�����������-./��%��������01$�������������������������-22��%��������331������
%���$�����������������������-//3�%���������41����� ��� ���-���
� � ����
����������#�������#�����+���� �����5������������ ����!����������!������#�������#�����+���� �����5�&������������������#����+���� �����5�6��!��������!����7�8�����������#������5�� ���#��������������"�#�%� �����������������5����7������ ������5�� ��������������8%��%���3��9��49�0�.7�����*:���/���,
6
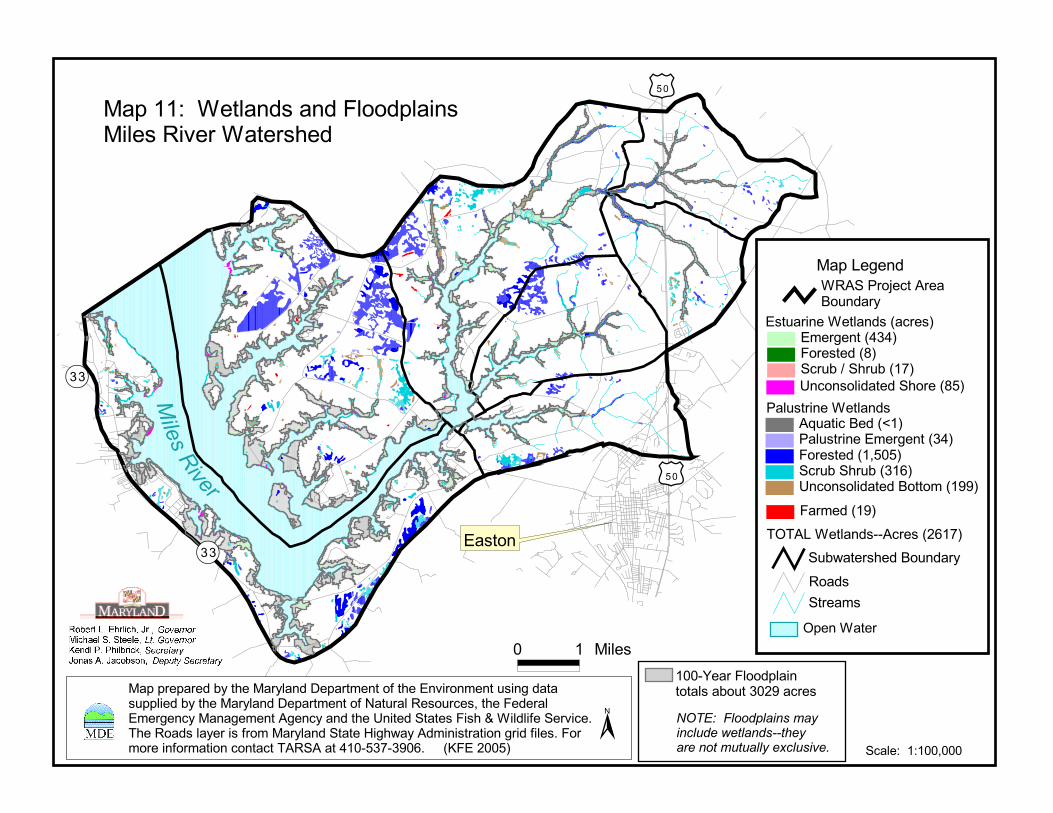
������
����
����
����
����
�����������
��������� ���������� ���� ������ ������������������
���������������������������������
����������
������� �������������� !"
��������#"
$%�����������&"'� ������������(�����)*"����������+!,!"�������������)-"������� ���������������##"
'� ����������� ����
.�.$/���� ����00$������1-2"
��$��'��3����$�����������
����/�(���
������������� �����������"����(�����*)*"���������� "������4��������2"
, �� ��
�� ������������������������������������������������������������������
,,05����� ���� �������� ��������),1#������������������������������ ����6�����������7���������������������(�����
���� ��������������� ����6�����������7�8����� ����������+����������� ����(���������(������$(��������������������������������9��� � �7���������:.��������� ��������7�������� ����������;�(�����$��������������(����7� ��:�����������7�����������������.$��$����*,0!)20)#,-:������<���1,,!"
8
��� ���,,+,,,
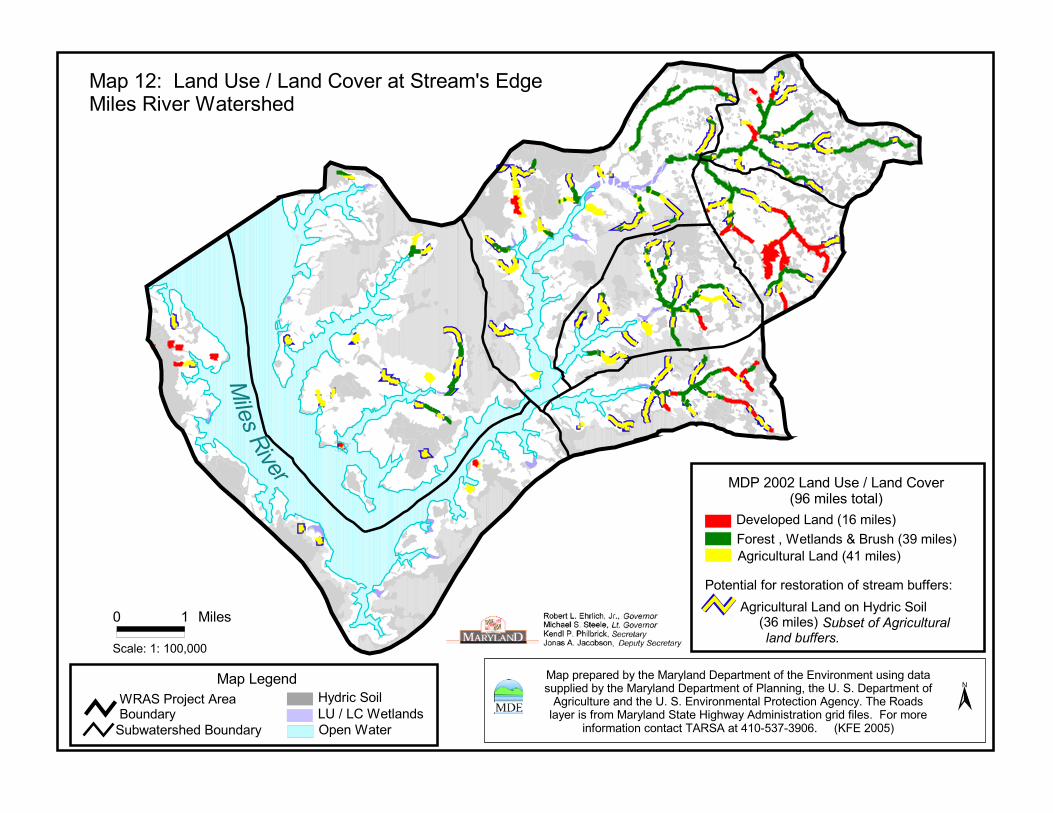
� � �����
��������������
� �����������������������������������������������������������
�����������
� � �� ���� !�������!����"� ��������#�����������������$��������$ ����� !�������!����"� ��������#�%�������������&��&�"� ��������#'����$��$�����������&��&��������������%����������'����!&�(��������!������#������!���������)���*!�'������������������#����&��+�������
��#���������������('��'���,��-./0-/1�2&�����34+�����.5
6
'����$��$�������3,�������5+����������������7�8�$���3/1������5
�"%�������������������������312�����������5
"����� �������3�2������5
'����$��$����������)!��������������3/2������5�������������������� ������������
������������
%��������#���������������#������� $##���
��'��%��9����'��8�$���!�$ *��������8�$���!
� �������)!������������������������: �������