waters solutions for dmpk and biomarker analysis · asms 2011 denver, colorado stephen mcdonald...
TRANSCRIPT

©2011 Waters Corporation 1
Waters Solutions for DMPK and Biomarker Analysis
Waters User MeetingASMS 2011
Denver, Colorado
Stephen McDonald
©2011 Waters Corporation 2
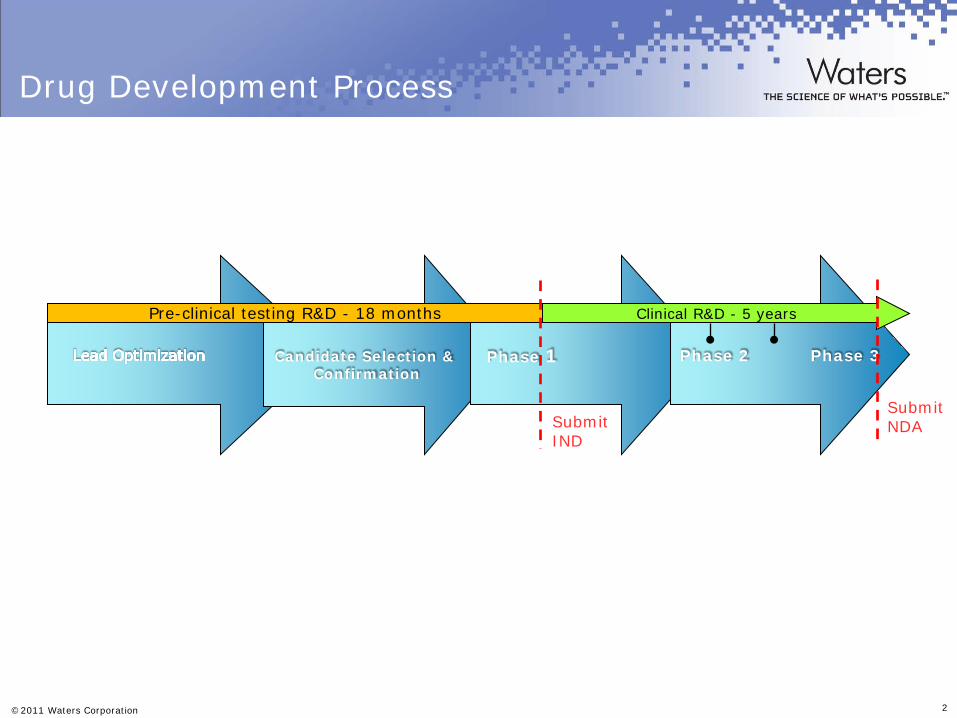
Candidate Selection &Confirmation
Phase 1 Phase 2 Phase 3
Pre-clinical testing R&D - 18 months Clinical R&D - 5 years
Drug Development Process
Submit NDASubmit
IND

©2011 Waters Corporation 3
Candidate Selection &Confirmation
Phase 1 Phase 2 Phase 3
Pre-clinical testing R&D - 18 months Clinical R&D - 5 years
Submit IND
Instrument Needs
Submit NDA
High throughputMedium/High sensitivity assays
Simple validation required
Moderate throughput Highest sensitivity assayFull validation required
High throughput Medium/High sensitivity assay
Full validation required
QTof
Quad
©2011 Waters Corporation 4
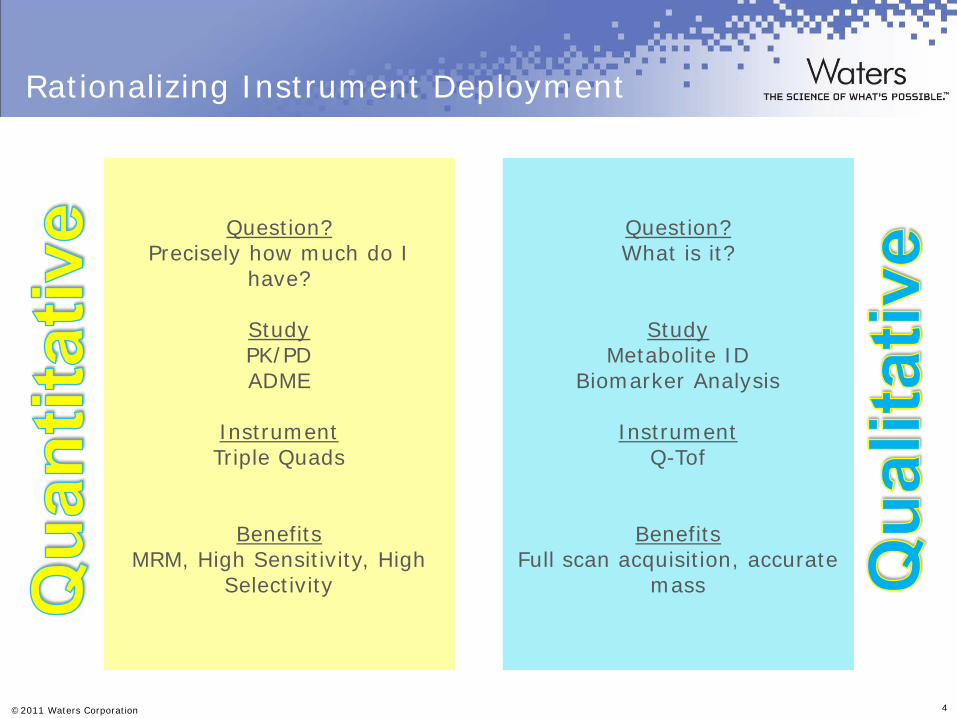
Rationalizing Instrument Deployment
Question?Precisely how much do I
have?
StudyPK/PDADME
InstrumentTriple Quads
BenefitsMRM, High Sensitivity, High
Selectivity
Question?What is it?
StudyMetabolite ID
Biomarker Analysis
InstrumentQ-Tof
BenefitsFull scan acquisition, accurate
mass

©2011 Waters Corporation 5
Rationalizing Instrument Deployment
Question?What is it and how much of it is there?
StudiesMet ID for MIST
Identifying metabolites in a PK studyBiomarker studies where performing in vivo analysis
Exploit mutual benefits but only where it makes
sense

©2011 Waters Corporation 6
Drug Metabolism
PK/PD & ADME
Toxicity (non-GLP)

©2011 Waters Corporation 7
ng/mL-0.0 5.0 10.0 15.0 20.0 25.0 30.0 35.0 40.0 45.0 50.0
Respo
nse
-0
20
40
60
80
100
Ideal Scenario for Discovery DMPK
All peaks detected
Quantify with Linear Response
No Method Development
Fast analysis
No need for expert users
Identify all metabolites

©2011 Waters Corporation 8
The tools that power the discovery DMPK solution

©2011 Waters Corporation 9
Nefazodone MSE Analysis
©2011 Waters Corporation 10
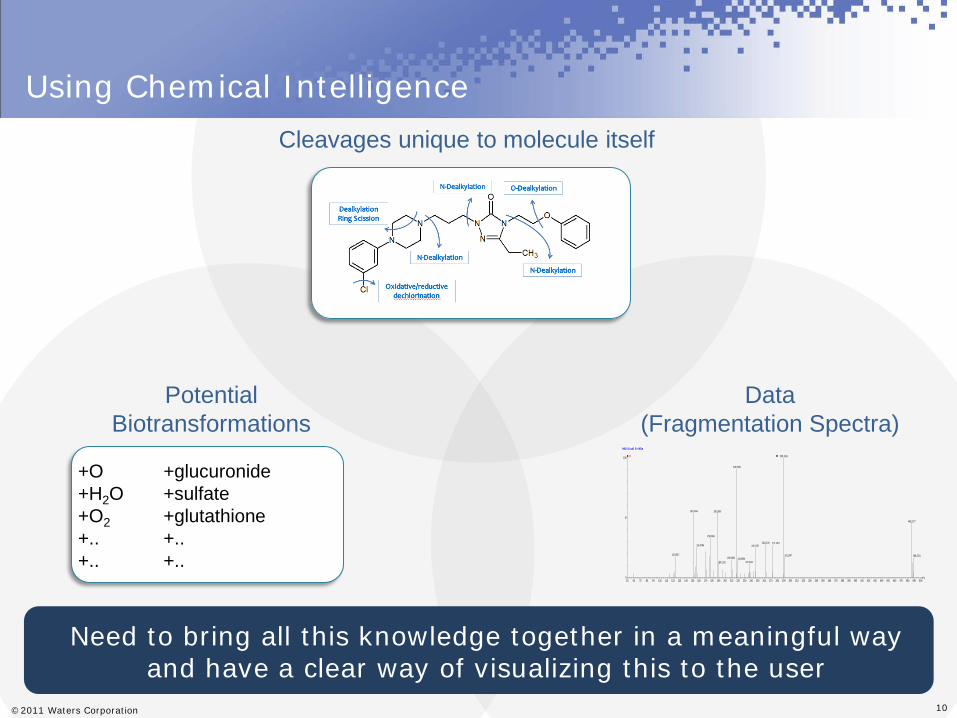
Cleavages unique to molecule itself
PotentialBiotransformations
+O +glucuronide+H2O +sulfate+O2 +glutathione+.. +..+.. +..
Data(Fragmentation Spectra)
H60 10 µM, S+ MSe
m/z50 60 70 80 90 100 110 120 130 140 150 160 170 180 190 200 210 220 230 240 250 260 270 280 290 300 310 320 330 340 350 360 370 380 390 400 410 420 430 440 450 460 470 480 490 500
%
0
100 x10 290.1516
218.0939
152.0834
124.0517
188.1090
178.0996
156.0786
209.0862189.1125
262.1190246.1251
219.0956237.1141
272.1407
486.2277
291.1547 488.2251
Need to bring all this knowledge together in a meaningful wayand have a clear way of visualizing this to the user
Using Chemical Intelligence

©2011 Waters Corporation 11
Applying Chemical Intelligence

©2011 Waters Corporation 12
Where Is My Hydroxylation?

©2011 Waters Corporation 13
Automated Localization of Biotransformation

©2011 Waters Corporation 14
Accurate Mass Quantification of Nefazodone @ 50pg/mL in Plasma
0.2
Time1.00 2.00 3.00 4.00 5.00 6.00 7.00 8.00 9.00 10.00 11.00
%
0
100260_19_6_004 1: TOF MS ES+
260.16953
6.52
0.48
0.45
0.43
0.27
2.68
1.990.98
0.92
0.65 1.491.24 1.92
2.50
2.35
3.69
2.88
2.953.39
4.783.98
4.354.69
6.236.15
5.835.645.37
7.15
6.83
11.4211.39
8.85
7.53
8.147.80 8.33 8.71
9.43
9.1811.27
10.059.73 10.2310.85
11.48
11.52
11.60
11.71
11.78
11.95

©2011 Waters Corporation 15
Time3.50 3.60 3.70 3.80 3.90 4.00 4.10 4.20 4.30 4.40 4.50
%
0
100
3.50 3.60 3.70 3.80 3.90 4.00 4.10 4.20 4.30 4.40 4.50
%
0
100 260.163.69
3.49
3.95
4.11 4.21
260.16 0.05Da3.94
Accurate Mass To Detect Peak in Complex matrix
1Da Window
50mDa Window
Nominal Mass
Accurate Mass

©2011 Waters Corporation 16
Linear Response Over 4 Orders of Magnitude
Sensitivity in the 50pg/mL range
Fast data acquisition for narrow UPLC peaks
Linear response > 4 orders of magnitide
ng/mL-0.0 5.0 10.0 15.0 20.0 25.0 30.0 35.0 40.0 45.0 50.0
Res
pons
e
-0
20
40
60
80
100

©2011 Waters Corporation 17
Fragment Ions: MSE Elevated Energy Data
116.1071
183.0810
260.1651
157.0647
m/z50 60 70 80 90 100 110 120 130 140 150 160 170 180 190 200 210 220 230 240 250 260 270 280 290 300
%
0
100 1.07e260.1645
116.1071
74.060872.0814
56.0506
59.0698
98.0968
86.0968
104.1074
183.0803
157.0647
117.1104153.0702
142.9403118.1137
165.0702
168.0571
182.0732
184.0743
218.1175207.9989185.0771 258.1132242.1552
264.2688
265.2719301.1508
297.2391284.1238

©2011 Waters Corporation 18
Calibration Lines Using Fragment Ion and Precursor Ion
Compound name: propranolol high energyCorrelation coefficient: r = 0.999660, r^2 = 0.999319Calibration curve: 0.0285934 * x + 12.0348Response type: External Std, AreaCurve type: Linear, Origin: Exclude, Weighting: 1/x, Axis trans: None
pg/mL-0 20000 40000 60000 80000 100000
Res
pons
e
-0
500
1000
1500
2000
2500
Compound name: propranolol high energyCorrelation coefficient: r = 0.997492, r^2 = 0.994991Calibration curve: 0.0204225 * x + -0.136933Response type: External Std, AreaCurve type: Linear, Origin: Exclude, Weighting: 1/x, Axis trans: None
pg/mL-0 20000 40000 60000 80000 100000
Resp
onse
-0
200
400
600
800
1000
1200
1400
1600
1800
2000
m/z = 116.107 (10mDa)
m/z = 183.081 (10mDa) LLOQ = 500pg/mL
LLOQ = 500pg/mL

©2011 Waters Corporation 19
Accessible Quantitative Analysis

©2011 Waters Corporation 20
ADME Profiling In Drug Discovery
Sample Formatting
• Perform ADME (stability, solubility etc)
Method Development
• Generate LC/MS/MS methods
Run Samples• Run standards and samples
Quantify• Quantify samples
Data Generation
• Calculate data - solubility, stability, protein binding etc.
Report Results• Rank samples and report to project team

©2011 Waters Corporation 21
ADME with Xevo TQ(S)
• Fast, robust method development to high throughput screening
ACQUITY UPLC®
• MRM sensitivity
Xevo® TQ(S)
• Drive efficiency and Productivity
Software

©2011 Waters Corporation 22
Fast p450 Screening by UPLC/MS/MS & Xevo TQ-MS
7.8 sec
28 sec
1. acetaminophen2. 1-hydroxybufuralol3. 4-hydroxymephytoin4. 7-hydroxy Coumarin5. 4-hydroxytolbutamide6. 1-hydroxymidazolam
1 2 3 4 5 6
Time 60 min Control
Time 60 min 0.1 µM
Time 60 min 1.0 µM
Time 60 min 10 µM
UPLC and Xevo TQ facilitates rapid analysis with resolution between all the p450 probe
substrates
P450 inhibition and induction testing allows drug – drug interactions and potential
metabolic issues to be identified and eliminated

©2011 Waters Corporation 23
Fully A
uto
mated
by Q
uan
Optim
ize
High Throughput Quantitative Analysis Xevo TQ and QuanOptimize™
Acquire Quantification Data
Generate Quantification Method
Sample Plate Preparation(ROBOTICS)
Data Process and Generate Report
Build MRM method (inc internal standard)
Optimise MRM transitionCone Voltage and Collision Energy

©2011 Waters Corporation 24
OpenQuan - Open Access Optimization and Quantitation
LoginUser name, job ID,
Select QuanMethod
Set by admin
Submit Optimisation ListImport or cut-and-
paste
Submit Acquisition ListImport or cut-and-
paste
Position SamplesIndicted by Login screen
FinishResults by e-mail or print
Next user

©2011 Waters Corporation 25
Handling of Multiple Assay Resultswith ProfileLynx
DATA PROCESSING AND REPORT GENERATION
ProfileLynx
Solubility Browser
Microsomal Stability Browser
pH Stability Browser LogP/LogD Browser
Other Assays Supported - Protein Binding (plate or column) - Membrane Permeability(PAMPA, Caco-2, etc.) - Chromatographic Hydro-phobicity Index (CHI) - Immobilized Artificial Membrane
•The ProfileLynx™ Results Browsers contains up to 3 sections:
1.Results Table 2.Chromatogram 3.Calibration Curve
•Pass/Fail indicator column and user selected high-lighted flags allow fast review of the data.
•Chromatogram is interac-tive for manual integra-tion if needed.

©2011 Waters Corporation 26
ProfileLynx View by Experiment
Single browser to review all experiments
©2011 Waters Corporation 27
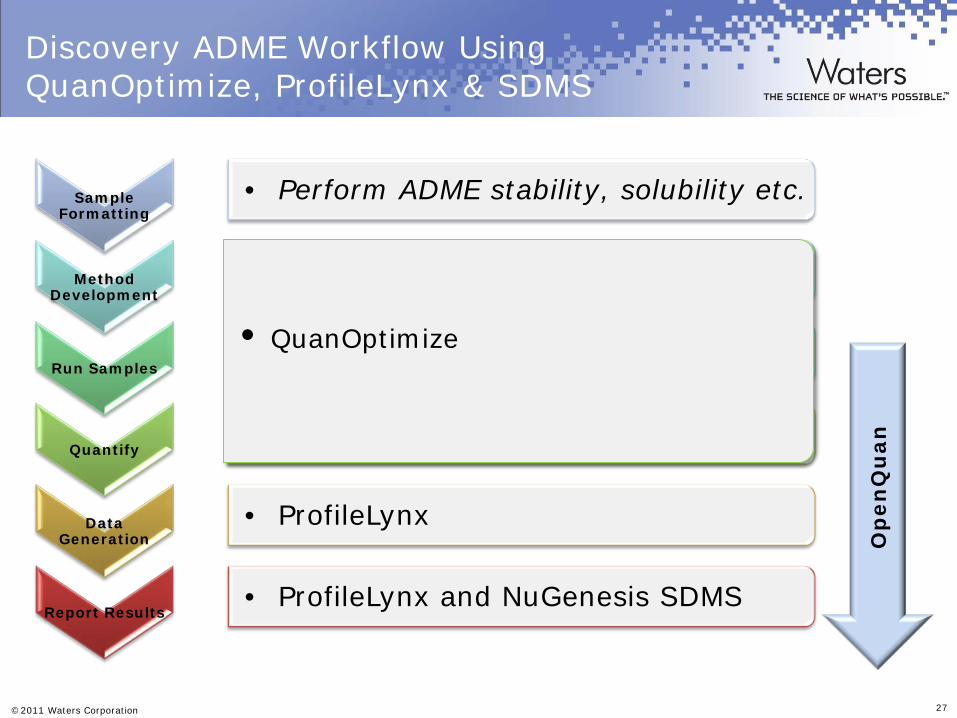
Sample Formatting
• Perform ADME stability, solubility etc.
Method Development
• QuanOptimize
Run Samples• QuanOptimize
Quantify• QuanOptimize
Data Generation
• ProfileLynx
Report Results• ProfileLynx and NuGenesis SDMS
Discovery ADME Workflow Using QuanOptimize, ProfileLynx & SDMS
Op
en
Qu
an
• QuanOptimize

©2011 Waters Corporation 28
Candidate Selection &Confirmation Phase 1
14C Structure ID
GLP Toxicity 28 days/2 species
Drug-Drug Interaction
Repeated dose toxicity
Metabolism
Single dose toxicity

©2011 Waters Corporation 29
Micro Sampling
Low Exposure Drugs
Sensitivity Needs Increasing
Inhaled Products
pg/mL sensitivity common place
Low sample volumes from mice / tail bled rats
Dried blood spot samples

©2011 Waters Corporation 30
Ele
ctri
c Fi
eld
Diffuse Ion
Cloud
Maximising signal
Maximising robustness
Designed to deal with problems associated with a larger sampling orifice

©2011 Waters Corporation 31
SYNAPT G2-S

©2011 Waters Corporation 32
Synapt G2-S Quantitation
Compound name: PropanololCorrelation coefficient: r = 0.999771, r^2 = 0.999542Calibration curve: 1.9722 * x + 0.318197Response type: Internal Std ( Ref 1 ), Area * ( IS Conc. / IS Area )Curve type: Linear, Origin: Exclude, Weighting: 1/x, Axis trans: None
Conc-0 5 10 15 20 25 30 35 40 45 50 55 60 65 70 75 80 85 90 95 100
Res
pons
e
-0
20
40
60
80
100
120
140
160
180
Blank
2.5pg/mL
2.5pg/mL – 25ng/mL
30x improvement in exact mass sensitivity

©2011 Waters Corporation 33
G2-S Sensitivity – Product Ion MSE
10µM
1µM
100nM
10nM
Confident Structural elucidation can be performed down to 1000-fold dilutions using non-directed MSE fragmentation spectra
©2011 Waters Corporation 34
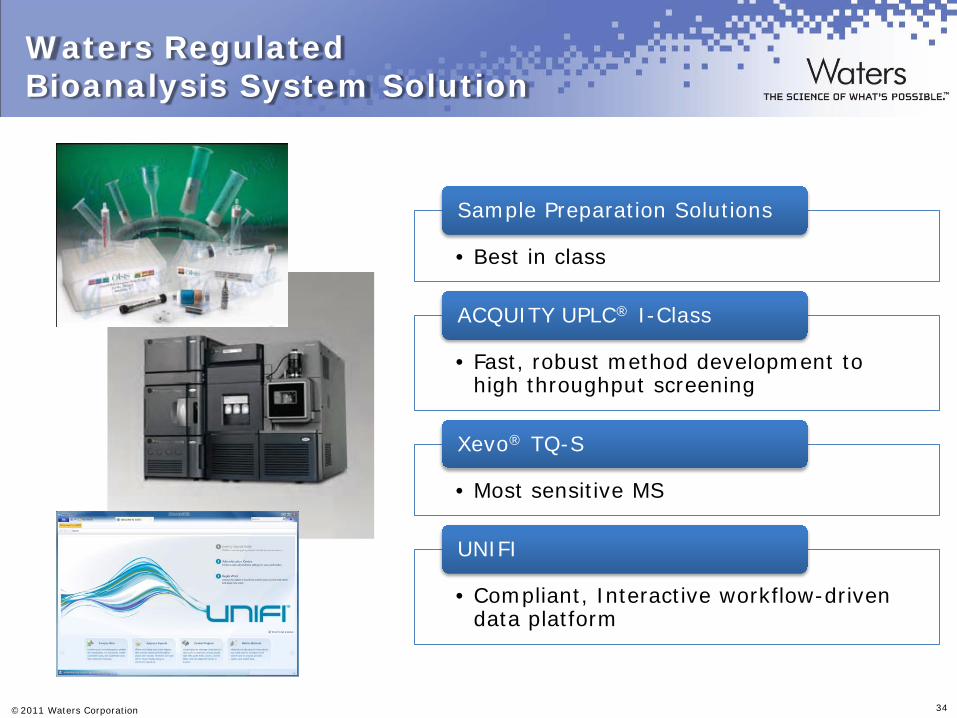
Waters RegulatedBioanalysis System Solution
• Best in class
Sample Preparation Solutions
• Fast, robust method development to high throughput screening
ACQUITY UPLC® I-Class
• Most sensitive MS
Xevo® TQ-S
• Compliant, Interactive workflow-driven data platform
UNIFI

©2011 Waters Corporation 35
Ultra High Sensitivity?
Time0.25 0.50 0.75 1.00 1.25 1.50 1.75 2.00 2.25 2.50 2.75
%
0
1000.83
Time0.25 0.50 0.75 1.00 1.25 1.50 1.75 2.00 2.25 2.50 2.75
%
0
100
2fg of
Verapamil Time
0.25 0.50 0.75 1.00 1.25 1.50 1.75 2.00 2.25 2.50 2.75
%
0
100
0.83
Solvent
Blank
0.1fg
6 replicates
RSD<20%
UPLC/MRM of Verapamil (solvent standard) using an
ACQUITY prepared for trace analysis
220 Zeptomoles

©2011 Waters Corporation 36
10ul loop injection 0.5pg/ul Verapamil in human plasma/ACN_2
Time0.50 0.55 0.60 0.65 0.70 0.75 0.80 0.85 0.90 0.95 1.00 1.05 1.10 1.15 1.20 1.25
%
0
100TC8_100721_1135 MRM of 1 Channel ES+
455 > 165 (Verapamil)2.66e7
0.83
Assay Robustness
Verapamil, 0.5pg/µL spiked into supernatant from 2:1
ACN:Plasma protein precipitation.
10µL injections
ACQUITY BDH 2.1x 50
Plasma injection 1
Plasma injection 2000
Plasma injection 4000
>4000 on column injections
RSD of peak areas < 5%

©2011 Waters Corporation 37
Metabolites In Safety Testing
‘In general, these metabolites are ofinterest if they account for plasma
levels >10% of total systemic exposure to drug related material, measured as area
under the curve (AUC) at steady state.’

©2011 Waters Corporation 38
Simultaneous MRM and Full Scan Detection
MRM of Parent
Full Scan of Metabolites
Metabolites

©2011 Waters Corporation 39
List of Potential Metabolites from Text
File
MS Source and Analyzer
Conditions
iMRM Method
Spectra of Parent Automatically Obtained from
MassLynx
Select Metabolites from list of probable
transformations
Identify Product Ions From Parent
Compound
Calculate MRMs and Write MS Method File
MSMS of Parent Compound
Automatic Product Ion Selection
Develop Theoretical MRMs to Investigate
©2011 Waters Corporation 40
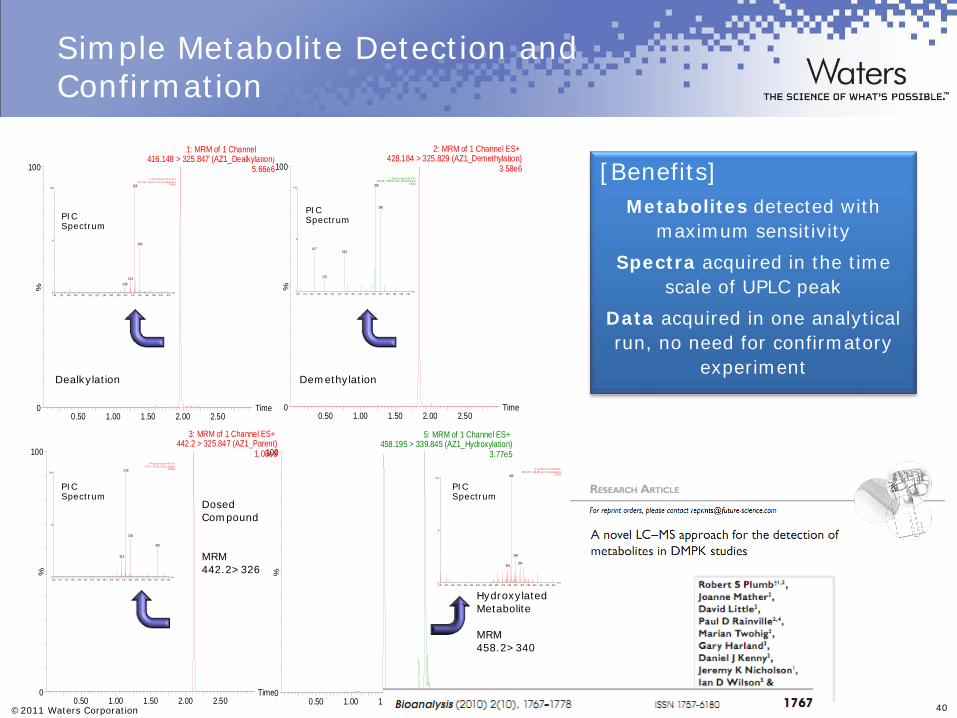
[Benefits]Metabolites detected with
maximum sensitivity
Spectra acquired in the time scale of UPLC peak
Data acquired in one analytical run, no need for confirmatory
experiment
Simple Metabolite Detection and Confirmation
Time0.50 1.00 1.50 2.00 2.50
%
0
100
18_4_022 5: MRM of 1 Channel ES+ 458.195 > 339.845 (AZ1_Hydroxylation)
3.77e5
m/ z1 00 12 0 1 40 1 60 18 0 2 00 2 20 24 0 2 60 28 0 30 0 3 20 34 0 36 0 3 80 40 0 42 0 4 40 46 0
%
0
1 00
18 _4 _0 23 3 ( 2. 07 8) 5: Pro du ct I on s o f 4 58 ES+45 8. 19 5 > 3 39 .84 5 (AZ1_ Hyd ro xyla tion )
1.9 2e 5326
315
340
354
m/ z1 00 12 0 14 0 16 0 18 0 2 00 2 20 2 40 26 0 28 0 30 0 3 20 3 40 3 60 38 0 40 0 42 0 44 0 4 60
%
0
1 00
18 _4 _0 25 5 ( 2. 14 0) 3: Pro du ct I on s o f 4 42 ES+44 2.2 > 32 5. 84 7 ( AZ1_ Par en t)
8.9 8e 6326
313
340
425
Time0.50 1.00 1.50 2.00 2.50
%
0
100
18_4_025 3: MRM of 1 Channel ES+ 442.2 > 325.847 (AZ1_Parent)
1.08e8
Time0.50 1.00 1.50 2.00 2.50
%
0
100
18_4_022 1: MRM of 1 Channel ES+ 416.148 > 325.847 (AZ1_Dealkylation)
5.66e6
m/ z1 00 1 20 14 0 16 0 1 80 20 0 22 0 2 40 2 60 28 0 30 0 3 20 340 36 0 3 80 4 00 42 0
%
0
1 00
18 _4 _0 23 4 ( 1. 97 6) 1: Pro du ct I on s o f 4 16 ES+4 16 .1 48 > 32 5. 84 7 ( AZ1 _D ea lkyla tion )
5.5 6e 5326
313298
340
Time0.50 1.00 1.50 2.00 2.50
%
0
100
18_4_022 2: MRM of 1 Channel ES+ 428.184 > 325.829 (AZ1_Demethylation)
3.58e6
m /z10 0 12 0 140 1 60 1 80 20 0 22 0 24 0 260 2 80 3 00 3 20 34 0 36 0 380 4 00 4 20
%
0
1 00
18_ 4_ 023 3 (1 .87 1) 2 : Pro du ct I ons of 428 ES+42 8.1 84 > 3 25 .82 9 ( AZ1 _De me thy la tio n)
3. 92 e4326
147235
176
340
Dealkylation Demethylation
Dosed Compound
MRM 442.2>326
HydroxylatedMetabolite
MRM 458.2>340
PIC Spectrum
PIC Spectrum
PIC Spectrum
PIC Spectrum

©2011 Waters Corporation 41
Work-flow Oriented System Solutions
Increasing Regulatory Demands
Quality and Consistency of Results
Evolving Analytical Demands

©2011 Waters Corporation 42
Single Platform
Multiple Techniques
Elegant &Simple
Secure &Compliant
FutureProof
Unites our end-to-end system
solution
One software forChromatography
& MS
Workflow based design adjusts to roles and capabilities of
users
Compliant and validatedfor your
environment
Will grow with your needs
UNIFI:Scientific Information System

©2011 Waters Corporation 43
Supporting StudiesCandidate Selection &Confirmation
Phase 1 Phase 2 Phase 3
Submit IND
Submit NDA
Supporting Studies
Pharmacology, Biomarker
Repeated dose toxicity
Single dose toxicity
Metabolism

©2011 Waters Corporation 44
Ion Mobility Separation

©2011 Waters Corporation 45
An added dimension of separation with Synapt HDMSE

©2011 Waters Corporation 46
Metabolomic Biomarker Analysis
Targeted Chemspider search with >22 million compounds

©2011 Waters Corporation 47
Global Lipid Profiling

©2011 Waters Corporation 48
0
5
10
15
20
25
30
35
40
45
50
Nor
mal
ized
Con
c (n
g pe
r sa
mpl
e)x
1000
0
MTC
MTln3
Absolute quantitation of TCA Cycle intermediates with internal standards
Targeted Metabolite Biomarker Analysis

©2011 Waters Corporation 49
Peptide Biomarker Analysis
Amyloid β0.1 ng/mLOasis (MCXµ-elution),
UPLC,Xevo TQ-S
Sensitive,Robust, meets
assay requirements
Evolving analytical demands

©2011 Waters Corporation 50
Drug Development Process
Xevo TQ(S) MS
Synapt G2-S
Xevo G2 QTof
Drug Metabolism
Candidate Selection &Confirmation
Phase 1 Phase 2 Phase 3
Pre-clinical testing R&D - 18 months Clinical R&D - 5 years
PK/PD & ADME
Toxicity (non-GLP)
14C Structure ID
GLP Toxicity 28 days/2 species
Drug-Drug Interaction
Repeated dose toxicity
Submit IND
Pharmacology, Biomarker
Dose Ranging Study
PK/PD
Metabolism
Proof of Concept
Single dose toxicity
Submit NDA

©2011 Waters Corporation 51
Questions?
Thank You