evaluation of admet predictortm in early discovery dmpk
TRANSCRIPT
1
1. Title Page.
Evaluation of ADMET PredictorTM in early discovery DMPK project
work
Anna-Karin Sohlenius-Sternbeck and Ylva Terelius
Previous address: Medivir AB, P.O Box 1086, SE-141 22 Huddinge, Sweden (A.S., Y.T.)
Present address: Research Institutes of Sweden, RISE, SE-151 36 Södertälje, Sweden (A.S.)
and ADMEYT AB, SE-179 62 Stenhamra, Sweden (Y.T.)
This article has not been copyedited and formatted. The final version may differ from this version.DMD Fast Forward. Published on November 8, 2021 as DOI: 10.1124/dmd.121.000552
at ASPE
T Journals on M
arch 20, 2022dm
d.aspetjournals.orgD
ownloaded from
2
2. Running Title Page.
a) Running Title: ADMET PredictorTM in early discovery DMPK project work
b) Corresponding author: Anna-Karin Sohlenius-Sternebeck, Research Institutes of
Sweden, RISE, SE-151 36 Södertälje, Sweden. Email: [email protected];
Telephone number: +46 70 309 63 49
c) Number of text pages: 23
Number of tables: 9 (including Supplemental Tables 1 to 4)
Number of figures: 5
Number of references: 20
Number of words in the Abstract: 249
Number of words in the Introduction: 778
Number of words in the Discussion: 1365
d) List of nonstandard abbreviation:
ABBA, apical to basolateral and basolateral to apical; ADME, absorption, distribution,
metabolism, excretion; ANN, artificial neural network; AP, ADMET PredictorTM; CLint, in
vitro intrinsic clearance; CYP, cytochrome P450; DMPK, drug metabolism and
pharmacokinetics; GF, GF120918 (Elacridar); HLM, human liver microsomes; HPLC, high
performance liquid chromatography; MAE, mean absolute error; Peff, effective jejunal
permeability; Papp, apparent permeability; P-gp, P-glycoprotein; PK, pharmacokinetic; PKPD,
pharmacokinetic-pharmacodynamic; QSAR quantitative structure-activity relationship;
QSPR, quantitative structure–property relationship; RMSE, root mean square error.
This article has not been copyedited and formatted. The final version may differ from this version.DMD Fast Forward. Published on November 8, 2021 as DOI: 10.1124/dmd.121.000552
at ASPE
T Journals on M
arch 20, 2022dm
d.aspetjournals.orgD
ownloaded from

3
3. Abstract.
A dataset consisting of measured values for LogD, solubility, metabolic stability in human
liver microsomes (HLM) and Caco-2 permeability was used to evaluate the prediction models
for lipophilicity (S+LogD), water solubility (S+Sw_pH), metabolic stability in HLM
(CYP_HLM_Clint), intestinal permeability (S+Peff) and P-gp substrate identification (P-gp
substrate) in the software ADMET PredictorTM (AP) from Simulations Plus. The dataset
consisted of a total of 4794 compounds, with at least data from metabolic stability
determinations in HLM, from multiple discovery projects at Medivir. Our evaluation shows
that the global AP models can be used for categorization of high and low values based on
predicted results for metabolic stability in HLM and intestinal permeability, and to give good
predictions of LogD (R2=0.79), guiding the synthesis of new compounds and for prioritzing in
vitro ADME experiments. The model seems to overpredict solubility for the Medivir
compounds, however. We also used the in-house datasets to build local models for LogD,
solubility, metabolic stability and permeability by using artificial neural network (ANN)
models in the optional ModelerTM module of AP. Predictions of the test sets were performed
with both the global and the local models and the R2 value for linear regression for predicted
versus measured HLM CLint based on logarithmic data was 0.72 for the in-house model and
0.53 for the AP model. The improved predictions with the local models are likely explained
both by the specific chemical space of the Medivir dataset and lab specific assay conditions
for parameters which require biological assay systems.
This article has not been copyedited and formatted. The final version may differ from this version.DMD Fast Forward. Published on November 8, 2021 as DOI: 10.1124/dmd.121.000552
at ASPE
T Journals on M
arch 20, 2022dm
d.aspetjournals.orgD
ownloaded from

4
4. Significance Statement.
AP is useful early in projects for predicting and categorizing LogD, metabolic stability and
permeability, to guide the synthesis of new compounds and for prioritizing in vitro ADME
experiments. The building of local in-house prediction models with the optional AP Modeler
Module can give improved prediction success since these models are built on data from the
same experimental setup and can also be based on compounds with similar structures.
This article has not been copyedited and formatted. The final version may differ from this version.DMD Fast Forward. Published on November 8, 2021 as DOI: 10.1124/dmd.121.000552
at ASPE
T Journals on M
arch 20, 2022dm
d.aspetjournals.orgD
ownloaded from

5
5. Visual abstract.
See separate image file.
This article has not been copyedited and formatted. The final version may differ from this version.DMD Fast Forward. Published on November 8, 2021 as DOI: 10.1124/dmd.121.000552
at ASPE
T Journals on M
arch 20, 2022dm
d.aspetjournals.orgD
ownloaded from
6
6. Introduction.
In vivo drug disposition is dependent on the interactions between the drug and the body.
During the drug discovery phase, chemical synthesis is guided towards potent compounds
with physicochemical and ADME (absorption, distribution, metabolism and excretion)
properties that allow the drug to reach effective concentrations at the target (Ballard et al.,
2012; Sohlenius-Sternbeck et al., 2016). Also, compounds should show low toxicity (Kramer
et al., 2007). Early characterization and understanding of the properties of new chemical
entities facilitate the further optimization of a chemical series toward a new drug candidate.
Reliable in silico prediction tools for ADME properties can help decision making in the
early phase of drug discovery, even before experimental data is available (van de
Waterbeemd, 2003; Moda, 2008; Wang et al., 2015; Alqahtani, 2017; Kazmi et al., 2018;
Stålring et al., 2018). With such tools, the chemical design and synthesis can be prioritised
and focus on compounds with the best potential to show desired properties later in vivo. The
building of quantitative structure-activity /quantitative structure–property relationships
(QSAR/QSPR) models is highly dependent on the quality of the training set data (Gleeson
and Montanari, 2012). Moreover, metabolism, distribution and excretion involve multi-
mechanistic processes which make the building of in silico models challenging.
The use of a commercial software for predictions of chemical and ADMET properties is
convenient, since such tools can be used with virtual compounds and do not require any user
data while measured data is needed for local model building. However, in the commercial
models, the chemical space of the local compounds may not be covered. It is also likely that
commercial models are built on datasets from multiple sources with dissimilarities in the
experimental setup. For many assays, the experimental variability between different
laboratories is substantial (Hayeshi, 2008; Liu, 2015), which often makes it desirable to build
This article has not been copyedited and formatted. The final version may differ from this version.DMD Fast Forward. Published on November 8, 2021 as DOI: 10.1124/dmd.121.000552
at ASPE
T Journals on M
arch 20, 2022dm
d.aspetjournals.orgD
ownloaded from

7
in-house local models. A local model would also better cover the chemical space of in-house
compounds, especially within a project/project series with similar structures, and the user can
have control over the training set. However, when building in-house models, a big enough
training set with good quality data covering the chemical space, is needed. For these reasons,
large pharmaceutical companies have their own dedicated modelers responsible for building
in-house project specific QSAR/QSPR models.
Several commercial softwares or online prediction tools are available for ADME, PK,
PKPD, DDI (drug-drug interactions) and toxicity predictions. We have previously
successfully used GastroPlusTM from Simulations Plus as part of a strategy to identify risks
for DDI in drug discovery (Sohlenius-Sternbeck et al., 2018). ADMET PredictorTM (AP) from
SimulationsPlus Inc is a commercially available software for prediction of physical chemistry,
ADME and toxicity parameters from compound structures. In this work, we used a dataset
with experimental in-house data to evaluate whether the global models in the commercially
available AP software can be used as tools in early drug discovery (before in-house data is
available). The parameters predicted were water solubility, lipophilicity, metabolic stability in
human liver microsomes (HLM), permeability and whether a compound will be a substrate
for P-gp. Included in the study were 4794 compounds in the Medivir database with metabolic
stability data in HLM. The dataset consists of compounds from multiple discovery projects at
Medivir and it comprises mainly protease inhibitors and nucleoside analogues which may not
be well represented in the training set for the global models. We evaluated the AP models for
LogD (S+LogD), water solubility (S+S_pH), metabolic stability in HLM (CYP_HLM_Clint),
permeability (S+Peff) and P-gp substrate (Yes/No) by comparing predicted values with
experimental results.
This article has not been copyedited and formatted. The final version may differ from this version.DMD Fast Forward. Published on November 8, 2021 as DOI: 10.1124/dmd.121.000552
at ASPE
T Journals on M
arch 20, 2022dm
d.aspetjournals.orgD
ownloaded from
8
The ADMET ModelerTM tool is an optional module in AP and can be used to build local
and/or project specific models based on QSAR/QSPR and by using chemical descriptors
obtained with the AP software. The module is licensed separately and can be used without
extensive knowledge in modelling. With the ADMET Modeler ModuleTM, local ANN models
for Log D, solubility, metabolic stability and permeability were built using the Medivir
dataset, and the models were tested on in-house compounds as well as on commercially
available reference compounds. The outcome of the local in-house models was compared
with the outcome of the global AP models. A good training set is required for a predictive
outcome and the larger and the more similar the structures in the training set the better the
predictive outcome, but we have previously built local models for projects in Lead
Optimization phase based on training sets of about 20 similar compounds from a single
compound series. These were useful and predictive for the next round of synthesis but had to
be rebuilt often as the results were used to improve the structures, moving away from the
training set structures (unpublished results).
This article has not been copyedited and formatted. The final version may differ from this version.DMD Fast Forward. Published on November 8, 2021 as DOI: 10.1124/dmd.121.000552
at ASPE
T Journals on M
arch 20, 2022dm
d.aspetjournals.orgD
ownloaded from
9
7. Materials and Methods.
Chemicals
All chemicals were of analytical grade and obtained from commercial suppliers.
Characteristics of the Medivir dataset
The vast majority of the compounds in the Medivir dataset had a purity ≥ 95% according to
HPLC analysis (no compound had a purity ≤ 80%). Compounds observed to be chemically
unstable or poorly soluble during the experiments were removed (i.e., 78 compounds). The
distribution of molecular weight (of the remaining 4794 compounds) and measured LogD
(1198 compounds) for the Medivir compounds are shown in Figure 1A and B, respectively.
There were 2236 zwitterions, 1888 bases, 623 acids, 44 neutrals and 3 compounds with mixed
pKa values in the dataset. Most of the acids were weak with pKa values above 7 (only 52
acids had a pKa below 5). Also, most of the bases were week bases with pKa below 7 (only
385 bases had a pKa above 8).
Predictions of ADME properties
Predictions of ADME properties were made using the ADMET PredictorTM software, here
called AP (version 9.5, SimulationsPlus Inc, Lancaster, CA; http://www.simulations-
plus.com), and the chemical structures were defined by SMILES. The software models for
LogD (S+LogD), water solubility (S+Sw_pH, i.e., solubility at a certain chosen pH, here pH
7.4), metabolic stability (CYP_HLM_Clint), effective jejunal permeability (S+Peff) as well as
P-gp substrate identification were evaluated using the Medivir dataset.
Moreover, in-house local models were built on training sets from the Medivir dataset,
using artificial neural network ensembles (ANNE) in the optional ADMET ModelerTM
module (Modeler). The Modeler uses an early stopping technique, in which the interplay
between the model complexity and quality of output are taken into account to avoid the
This article has not been copyedited and formatted. The final version may differ from this version.DMD Fast Forward. Published on November 8, 2021 as DOI: 10.1124/dmd.121.000552
at ASPE
T Journals on M
arch 20, 2022dm
d.aspetjournals.orgD
ownloaded from

10
generation of an overtrained model. The in-house models for solubility, HLM CLint and Caco-
2 permeability were based on logarithmic data. A training set that represented approximately
75-80% of the measured values was used for each parameter, and the remaining 20-25% was
used as a test set to evaluate the model. The test sets were selected in the ADMET ModelerTM
module based on Kohonen mapping (Yan and Gasteiger, 2003). The test sets were also
evaluated in the corresponding ADMET PredictorTM software global models. Each model was
rebuilt at least four times and the deviation for each statistical parameter (see the statistical
section) was around 10% or less between the models. Tables and figures show data from one
representative model for each assay.
Determination of LogD
Determination of LogD was performed for Medivir by GVK Biosciences Limited
(Hyderabad, India). LogD was determined by measuring the partition coefficient between
water and octanol at pH 7.4. Fifteen µL of test compound stock solution (10 mM in DMSO)
was added to 500 µL octanol in 3 replicates and vortexed for 10 min on a plate shaker at 1200
rpm. 500 µL 10 mM phosphate buffer, pH 7.4, was added and the mixture vortexed for
another hour at 1200 rpm. The samples were allowed to settle for 20 min and then centrifuged
at 4000 rpm for 30 min at room temperature for complete phase separation and analysed by
HPLC-UV absorbance.
Determination of kinetic solubility
Kinetic solubility measurements were also performed at GVK Biosciences Limited
(Hyderabad, India). A stock solution of 10 mM compound in DMSO was added to 10 mM
phosphate buffered saline, pH 7.4, to give a final compound concentration of 100 µM in 10
mM phosphate with 1% DMSO. After a period of vigorous vortexing, the precipitate was
removed by vacuum filtration. No correction for non-specific binding was performed. The
compound concentration in the resulting filtrate was determined by HPLC-UV absorbance.
This article has not been copyedited and formatted. The final version may differ from this version.DMD Fast Forward. Published on November 8, 2021 as DOI: 10.1124/dmd.121.000552
at ASPE
T Journals on M
arch 20, 2022dm
d.aspetjournals.orgD
ownloaded from

11
The kinetic solubility assay could not generate solubilities above 100 µM since that was the
final concentration added in the assay. Thus, higher solubilities were reported as > 100 µM.
Determination of permeability
Permeability in Caco-2 cells (Artursson et al., 2001) was assayed at Medivir or at GVK
Biosciences Limited (Hyderabad, India) using the same assay setup (also evaluated with
reference compounds) as described below. Caco-2 cells, at passage number 36, were used in
the transport experiments. The cells were purchased from American Type Culture Collection
(Middlesex, UK). Caco-2 cells were seeded in 96 well plates (12000 cells/well) and cultured
for 21 days on cell culture transwell inserts (Transwell). The integrity of the cell monolayer
was determined using Lucifer yellow measured in an Envision multilabel Reader at Ex/Em
428/535 nm. Trans epithelial electrical resistance (TEER) was also measured to determine the
integrity of the cell barrier. The TEER value was above 230 ohms × cm2 in all experiments.
The permeability of the test compound (at 10 µM) over a Caco-2 cell monolayer from
the apical to the basolateral compartment (A to B) was investigated in duplicates over a
period of 120 minutes. Hank's Balanced salt solution (HBSS), pH 6.5, containing 25 mM
morpholino ethane sulfonic acid (MES) was used as apical buffer, and HBSS, pH 7.4,
containing 25 mM hydroxy ethyl piperazine ethane sulfonic acid (HEPES) and 1% bovine
serum albumin (BSA) as basolateral buffer. The test compound (10 µM) in apical buffer was
added to the apical well. Incubation was performed at 37oC, and the plates were kept shaking
at approximately 150 rpm. At time point 30 min, an aliquot of basolateral sample was
collected and replenished with same volume of basolateral buffer. At 120 min, samples were
collected from basolateral and apical chamber. The donor samples were diluted with
basolateral buffer (1:1, v/v) and the receiver samples were diluted with apical buffer (1:1,
v/v). Possible efflux of test compound was investigated by blocking the MDR1 and BCRP
efflux pumps in the A to B assay using 5µM GF120918 (Elacridar).
This article has not been copyedited and formatted. The final version may differ from this version.DMD Fast Forward. Published on November 8, 2021 as DOI: 10.1124/dmd.121.000552
at ASPE
T Journals on M
arch 20, 2022dm
d.aspetjournals.orgD
ownloaded from

12
In ABBA experiments, the bidirectional permeability of test compound (at 10 µM)
through a Caco-2 cell monolayer from the apical to the basolateral compartment and from the
basolateral to the apical compartment was investigated in duplicate samples over a period of
120 minutes. HBSS, pH 7.4, containing 25 mM HEPES was used as buffer in the ABBA
experiments. The test compound (10 µM) in ABBA buffer was added to apical wells (A-B
experiment) and to basolateral wells (B-A experiment). Aliquots were collected and treated in
the same manner as described above.
All samples were precipitated with four volumes acetonitrile, containing losartan as
internal standard, and vortexed for 5 min at 1000 rpm, followed by centrifugation at 4000 rpm
for 10 min. Aliquots of the supernatants were analyzed by LC-MS/MS (see below).
The apparent permeability was calculated as follows:
𝑃𝑎𝑝𝑝 =𝑑𝑄
𝑑𝑡⁄
𝐶0×𝐴 Equation 1
Where C0 is the donor concentration at time 0 and A is the surface area and dQ/dt is
the total amount of test compound transported across the cells per unit time.
Estimated +GF/-GF ratios of >1.5 and efflux ratios >2 were considered as an
indication of efflux, based on validation using a set of reference P-gp substrates (Giacomini et
al., 2010).
Determination of CLint
Determination of the intrinsic clearance, CLint, in HLM was performed at Medivir or at GVK
Biosciences Limited (Hyderabad, India) using identical assay setup (also evaluated with
reference compounds) as described below. Pools of HLM from 50 donors (mixed genders)
This article has not been copyedited and formatted. The final version may differ from this version.DMD Fast Forward. Published on November 8, 2021 as DOI: 10.1124/dmd.121.000552
at ASPE
T Journals on M
arch 20, 2022dm
d.aspetjournals.orgD
ownloaded from
13
were purchased from XenoTech, LLC (Kansas City, US) and stored at -80oC. The
microsomes were diluted in 100 mM phosphate buffer, pH 7.4. The final concentrations were
1 µM test compound and 0.5 mg microsomal protein per mL. Duplicate samples were pre-
incubated for 10 min at 37°C before starting the reactions by the addition of NADPH to a
final concentration of 1 mM (the total incubation volume was 250 µL). The incubations were
stopped by the removal of aliquots (25 µL) at 0, 5, 15, 30 and 45 minutes to 96-well plates on
ice containing 200 µL of stop solution to precipitate proteins. The stop solution, ice-cold
acetonitrile, contained losartan (100 nmol/L) as an analytical internal standard. Samples were
left on ice for at least 30 minutes to precipitate the microsomal proteins before removing the
precipitate by centrifugation for 20 min at 2250 g. Aliquots of the supernatants were analysed
by LC-MS/MS (see below).
The CLint values were obtained from the disappearance curves where the substrate
concentration was plotted against the time. The concentration of each test compound in the
incubation was fitted to a first-order elimination equation
C = C0 e-kt, Equation 2
where C is the measured concentration at time t, C0 is the concentration at time 0 and k is the
elimination constant. Curve fit was performed after natural logarithm transformation of the
concentration data.
Intrinsic clearance was calculated as follows:
CLint = k V Equation 3
where V is the volume of the microsomal incubation.
The AP model for metabolic stability in microsomes (CYP_HLM_Clint) is based on the free
concentration in the incubation. Since the measured CLint values are based on total
This article has not been copyedited and formatted. The final version may differ from this version.DMD Fast Forward. Published on November 8, 2021 as DOI: 10.1124/dmd.121.000552
at ASPE
T Journals on M
arch 20, 2022dm
d.aspetjournals.orgD
ownloaded from

14
concentrations and the fraction unbound in microsomes was not known, the predicted values
obtained using the AP model were converted to total as follows:
𝑇𝑜𝑡𝑎𝑙 𝐶𝐿𝑖𝑛𝑡 = 𝑈𝑛𝑏𝑜𝑢𝑛𝑑 𝐶𝐿𝑖𝑛𝑡 × (𝑆 + 𝑓𝑢𝑚𝑖𝑐) Equation 4
where S+fumic is the predicted fraction unbound in the microsomal incubation (AP model).
The S+fumic model is largely based on a publication by Austin et al. (2002).
Bioanalysis
The test compounds in the CLint and permeability assays were quantified by LC/MS-MS
(Sciex AB, Stockholm, Sweden or Shimadzu, India), in principle as described by Sohlenius-
Sternbeck et al. (2010). The compounds were detected in positive or negative electrospray
multiple reaction monitoring mode. Optimizations (parent ion and fragment determination,
declustering potentials and collision energy) had been performed in advance.
Quality controls
Since the different assays were run in early screening, project compounds were run in 1 or 2
separate experiments. Reference compounds were always included in the different
experiments as quality controls and to confirm reproducibility over time and between the
Medivir and GVK Bio laboratories. Ketoconazole, metoprolol and propranolol were used as
quality controls in every LogD experiment, since the LogD range of these compounds covers
the LogD for most Medivir compounds. Albendazole and diethylstilbestrol were used as
quality controls for solubility since these compounds cover the low concentration range (≤ 10
µM) applied in most in vitro ADME assays, and flurbiprofen was chosen as a quality control
for high solubility. Atenolol, digoxin and propranolol were used as permeability quality
controls, since these compounds cover the low to high permeability range. Digoxin and
quinidine were used as quality controls for efflux in every Caco-2 + GF experiment and in
every ABBA experiment. As a quality control in all HLM experiments each experiment
This article has not been copyedited and formatted. The final version may differ from this version.DMD Fast Forward. Published on November 8, 2021 as DOI: 10.1124/dmd.121.000552
at ASPE
T Journals on M
arch 20, 2022dm
d.aspetjournals.orgD
ownloaded from
15
included incubations containing a cocktail of probe substrates for human drug-metabolizing
enzymes, i.e., phenacetin (for CYP1A2), diclofenac (CYP2C9), bufuralol (CYP2D6) and
midazolam (CYP3A4). Criteria for rejecting an experiment was based on whether data was
outside two standard deviations of the Manhattan mean. Only project data from accepted
experiments were used. For quality control data obtained in the different assays see
Supplemental Tables 1A-E.
Bin categorization
Bin categorization was performed to evaluate the solubility, metabolic stability and
permeability predictions. For solubility, bin A contained compounds with poor solubilities (<
10 µM) that might precipitate in the in vitro assays and bin D “good” solubilities (>90 µM,
close to the added final concentration in the assay), which should suffice for most discovery
studies except safety studies. Two other bins were created for practical reasons since some in
vitro assays at Medivir were performed at up to 50 µM.
In early discovery, we did not apply strict cut-offs for CLint values, since the compounds
are often improved in the optimization phase. A HLM CLint value less than 15 µL/min/mg,
was considered stable enough (bin A) to be of interest. A CLint value higher than 50
µL/min/mg can be considered to predict a low bioavailability over the liver, but since there is
a fairly large uncertainty in the predictions, we raised the cut-off for bin D to > 80
µL/min/mg. Predicted values between 15 and 80 µL/min/mg were arbitrarily divided into 2
bins to differentiate between closer to “stable” (15-30 µL/min/mg, bin B) and closer to
“unstable” (30-80 µL/min/mg, bin C).
The measured Papp values were also divided into 4 categories, A-D (<2, 2-5, 5-10
and >10 × 10-6 cm/s) and the corresponding categories A-D used for Peff predictions were <1,
This article has not been copyedited and formatted. The final version may differ from this version.DMD Fast Forward. Published on November 8, 2021 as DOI: 10.1124/dmd.121.000552
at ASPE
T Journals on M
arch 20, 2022dm
d.aspetjournals.orgD
ownloaded from

16
1-2, 2-3 and >3 (10-4 cm/s). The bin borders were set based on historic inhouse data for
reference compounds.
Statistics
The root-mean-square error, RMSE, was calculated as a measure of the error of a model
according to the equation below.
𝑅𝑀𝑆𝐸 = √∑ (𝑃𝑟𝑒𝑑𝑖𝑐𝑡𝑒𝑑−𝑂𝑏𝑠𝑒𝑟𝑣𝑒𝑑)2𝑁𝑖=1
𝑁 Equation 5
Where N is the number of compounds in the dataset.
The mean absolute error, MAE, was calculated as a measure of the mean absolute difference
between predicted and observed data according to the equation below.
𝑀𝐴𝐸 =∑ 𝑎𝑏𝑠(𝑃𝑟𝑒𝑑𝑖𝑐𝑡𝑒𝑑−𝑂𝑏𝑠𝑒𝑟𝑣𝑒𝑑)𝑁
𝑖=1
𝑁 Equation 6
Criteria for accepting an experiment
The mean ± SD values for each quality control, obtained from at least 12 independent
measurements, were used to define whether or not an experiment could be accepted. An
experiment was rejected if data was outside two standard deviations of the Manhattan mean.
Confusion tables for calculation of precision, sensitivity, specificity and accuracy
For the 2×2 confusion tables based on P-gp “Yes/No” and Caco-2 Papp or ABBA, the
precision, sensitivity, specificity and accuracy were calculated, where TY is predicted True
“Yes”, TN is predicted True “No”, FY is predicted False “Yes” and FN is predicted False
“No”.
This article has not been copyedited and formatted. The final version may differ from this version.DMD Fast Forward. Published on November 8, 2021 as DOI: 10.1124/dmd.121.000552
at ASPE
T Journals on M
arch 20, 2022dm
d.aspetjournals.orgD
ownloaded from

17
Precision (or predictive value) is the proportion of predicted “Positives” that are true
“Positives”:
𝑃𝑟𝑒𝑐𝑖𝑠𝑖𝑜𝑛 =𝑃𝑟𝑒𝑑𝑖𝑐𝑡𝑒𝑑 𝑇𝑌
(𝑃𝑟𝑒𝑑𝑖𝑐𝑡𝑒𝑑 𝑇𝑌+𝑃𝑟𝑒𝑑𝑖𝑐𝑡𝑒𝑑 𝐹𝑌) Equation 7
Sensitivity (or recall) is the proportion of actual “Positives” that were correctly predicted:
𝑆𝑒𝑛𝑠𝑖𝑣𝑖𝑡𝑦 =𝑃𝑟𝑒𝑑𝑖𝑐𝑡𝑒𝑑 𝑇𝑌
(𝑃𝑟𝑒𝑑𝑖𝑐𝑡𝑒𝑑 𝑇𝑌 + Predicted FN) Equation 8
Specificity is the proportion of actual “Negatives” that were correctly predicted:
𝑆𝑝𝑒𝑐𝑖𝑓𝑖𝑐𝑖𝑡𝑦 =𝑃𝑟𝑒𝑑𝑖𝑐𝑡𝑒𝑑 𝑇𝑁
(𝑃𝑟𝑒𝑑𝑖𝑐𝑡𝑒𝑑 𝑇𝑁+𝑃𝑟𝑒𝑑𝑖𝑐𝑡𝑒𝑑 𝐹𝑌) Equation 9
Accuracy is the proportion of data that was correctly predicted:
𝐴𝑐𝑐𝑢𝑟𝑎𝑐𝑦 =(𝑃𝑟𝑒𝑑𝑖𝑐𝑡𝑒𝑑 𝑇𝑌+𝑃𝑟𝑒𝑑𝑖𝑐𝑡𝑒𝑑 𝑇𝑁)
(𝑃𝑟𝑒𝑑𝑖𝑐𝑡𝑒𝑑 𝑇𝑌+𝑃𝑟𝑒𝑑𝑖𝑐𝑡𝑒𝑑 𝑇𝑁+𝑃𝑟𝑒𝑑𝑖𝑐𝑡𝑒𝑑 𝐹𝑌+𝑃𝑟𝑒𝑑𝑖𝑐𝑡𝑒𝑑 𝐹𝑁) Equation 10
For the 4×4 confusion tables for the 3 models built with 4 categories (solubility, metabolic
stability and permeability), precision (predictive value) and sensitivity (recall) were calculated
for each bin. The F1-score for each bin is the harmonic mean of precision and recall, i.e.,
𝐹1 − 𝑠𝑐𝑜𝑟𝑒 =2×𝑝𝑟𝑒𝑐𝑖𝑠𝑖𝑜𝑛×𝑟𝑒𝑐𝑎𝑙𝑙
(𝑝𝑟𝑒𝑐𝑖𝑠𝑖𝑜𝑛+𝑟𝑒𝑐𝑎𝑙𝑙) Equation 11
The bin sizes, for the total data set as well as for the test set for each model, are shown in
Table 1. Since we had unbalanced categories, we also used the Weighted F1 for overall
“accuracy”, which takes the weighted mean of the individual F1-scores, considering the
number of values in each measured category, i.e. the sum of the F1-scores for each measured
category times the number of compounds in that category divided by the total number of
compounds in the dataset.
This article has not been copyedited and formatted. The final version may differ from this version.DMD Fast Forward. Published on November 8, 2021 as DOI: 10.1124/dmd.121.000552
at ASPE
T Journals on M
arch 20, 2022dm
d.aspetjournals.orgD
ownloaded from

18
Weighted F1 = ((F1A × measured cpds𝐴) + (F1𝐵 × measured cpds𝐵) +
(F1C × measured cpdsC) + (F1D × measured cpdsD)) / (measured cpdsA +
measured cpdsB + measured cpdsC + measured cpdsD) Equation 12
8. Results.
LogD predictions
The total number of compounds with measured LogD was 1198. Figure 2A shows the
S+LogD, predicted by the global model provided in AP, versus the observed LogD for all
compounds. The R2 value was 0.79 (See also Table 2). A local, in-house model, based on a
training set (911 compounds) from the Medivir data was built using the AP Modeler module,
and Figure 2B shows the predicted LogD versus the observed LogD when this local model
was used for the 287 compounds in the test set. The same test set was also predicted with the
global AP model, S+LogD (Figure 2C). The R2 values, when performing linear regression for
the predicted values versus the measured values for the test set, using the S+LogD and the in-
house LogD model were 0.79 and 0.89, respectively (Table 2).
Solubility predictions
The total number of compounds with measured solubility was 2778. The measured
solubilities were divided into 4 categories, A-D (<10, 10-50, 50-90 and >90 µM) and the
same categories were used for binning the predictions and a 4×4 confusion table constructed.
55% of all measured values were in the highest category, i.e., >90 µM, and 21% in the lowest
category, i.e., <10 µM (Table 1). When using the global AP model for all 2778 compounds,
<3% (i.e., 69 compounds) had a predicted solubility of <10 µM (Table 1). Almost 82% of all
compounds were predicted to have a solubility >90 µM. However, 56% of all compounds
This article has not been copyedited and formatted. The final version may differ from this version.DMD Fast Forward. Published on November 8, 2021 as DOI: 10.1124/dmd.121.000552
at ASPE
T Journals on M
arch 20, 2022dm
d.aspetjournals.orgD
ownloaded from

19
were correctly predicted, when taking all categories into consideration, and many were close
to the border between the categories (Table 3).
A training set consisting of 2087 of the compounds was used to build an in-house local
solubility model using the AP Modeler module. The remaining 691 compounds were the test
set. 71 of the 101 compounds (70%) that had a measured solubility <10 µM were also
predicted to be poorly soluble (<10 µM, See Figure 3B and Table 3). Only 12% of the highly
soluble (>90 µM) compounds were predicted to have solubility >90 µM but 73% were
predicted to have a fairly high solubility (50-90 µM, See Figure 3B).
Table 2 summarizes the statistics for the linear regression for the plot of predicted
versus measured solubility based on logarithmic data for these compounds. The R2 value was
0.59 for the in-house model and lower for the AP model (i.e., 0.20 for the test set and 0.26
when using all compounds). The Precision (Predictive value), Sensitivity (Recall) and F1-
score (per bin) for the categories and the overall accuracy (and Weighted F1) for all models
are presented in Table 3. With the global model, the precision (or predictivity) was similar for
bin A (low solubility, <10 µM) and bin D (high solubilities, >90 µM) with values between
0.54 and 0.68 when using all compounds or just the test set, indicating that the test set was
representative. Also, both precision and sensitivity were similar for bins B and C using the
global model, and the F1 score was around 0.8 for bin D and below >0.15 for Bins A-C. With
the in-house model, the precision for low solubility compounds was 0.77 and for high
solubility it was 0.91. The sensitivity was 0.70 for low solubility compounds but only 0.12 for
high solubility compounds with the in-house model. Also, the F-score was high (0.74) for low
solubility compounds and low for high solubility compounds (0.21). A total of 32% were
correctly predicted with the category boundaries chosen. When using the global model for the
same test set, only 7% of the poorly soluble compounds but 93% of the highly soluble
This article has not been copyedited and formatted. The final version may differ from this version.DMD Fast Forward. Published on November 8, 2021 as DOI: 10.1124/dmd.121.000552
at ASPE
T Journals on M
arch 20, 2022dm
d.aspetjournals.orgD
ownloaded from

20
compounds were correctly predicted. Thus, 59% of all test compounds were correctly
predicted (Table 3).
Predictions of metabolic stability in human liver microsomes
The AP global CYP_HLM_Clint model is based on the unbound concentrations, and these
values were therefore converted to total CLint (see Materials and Methods) to compare with
the measured values for total CLint. The total number of compounds with measured HLM
CLint was 4794. The measured CLint values were divided into 4 categories, A-D (<15, 15-30,
30-80 and >80 µL/min/mg) and the same categories were used for binning the predictions. A
4×4 confusion table was constructed. Around 40% (i.e., 1923 compounds) of the total number
of compounds had a measured CLint value >80 µL/min/mg (bin D) and 28% (i.e., 1332
compounds) had a low CLint value, category A (Table 1). Of the 1332 compounds measured
to be stable (CLint < 15 µL/min/mg), 40% were correctly predicted (Figure 4A). Of the 973
compounds (20% of all compounds) with a predicted CLint <15 µL/min/mg, 55% were also
stable when measured, while around 18% of the compounds were measured to be unstable
(i.e., CLint >80 µL/min/mg) in the assay. Overall, 37% of all compounds were correctly
predicted (Table 3).
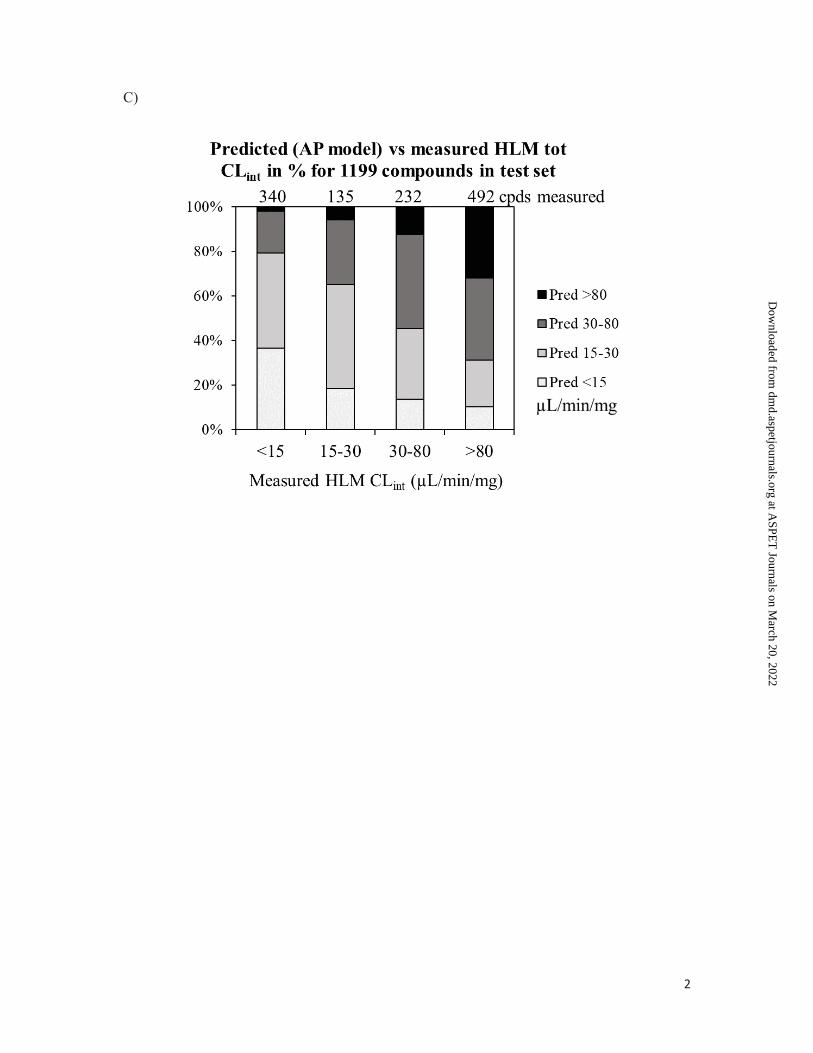
A training set consisting of 3595 of the compounds was used to build an in-house, local
metabolic stability model, which was evaluated using the remaining 1199 compounds (i.e.,
the test set). Of the 340 compounds with measured high stability, 59% were correctly
predicted (Figure 4B). 87% of the compounds with a predicted CLint >80 µL/min/mg had a
measured value in the same range. Of the compounds with a predicted low CLint (i.e., <15
µL/min/mg), 85% had a measured low CLint, and less than 0.5% had a measured CLint >80
µL/min/mg. Overall, 64% of the compounds in the test set were correctly predicted. When
using the global AP model for predictions with the same test set, 37% of the compounds were
This article has not been copyedited and formatted. The final version may differ from this version.DMD Fast Forward. Published on November 8, 2021 as DOI: 10.1124/dmd.121.000552
at ASPE
T Journals on M
arch 20, 2022dm
d.aspetjournals.orgD
ownloaded from
21
correctly predicted (Table 3 and Figure 4C). The prediction success is summarized in Table 2,
demonstrating that the in-house model had a higher R2 value (i.e., 0.71) than the global model
(i.e., around 0.5 regardless if using all compounds or the test set).
The CYP_HLM_Clint model and the in-house CLint model were also used to predict
CLint for a set of commercially available compounds with in-house measured data (the results
are listed in Supplemental Table 2). The prediction success is shown in Table 4,
demonstrating that the in-house model had a higher R2 value (i.e., 0.51) than the global model
(i.e., 140).
Permeability
The total number of compounds with measured Caco-2 Papp was 2586. Since the main AP
software does not have a Caco-2 model, permeabilities were predicted with the global AP
S+Peff model and compared with the measured Caco-2 values. The Membrane PlusTM or
GastroPlusTM software, both from Simulations Plus, could be used to predict Papp values. We
did not have access to these in this study. The local Caco-2 Papp model was built in the AP
Modeler module using inhouse Papp data only.
When using all the compounds, 72% of the compounds with a measured Papp value of
≤2 ×10⁻⁶ cm/s had a predicted Peff value of <1×104 cm/s as shown in Figure 5A and Table 3.
Of the compounds with a predicted human effective permeability in jejunum, S+Peff, of
<1×104 cm/s, 64% demonstrated a measured apparent permeability in Caco-2, Papp, of ≤2 ×10-
6 cm/s (Table 3). 43% of the compounds were correctly predicted using the AP Peff model and
these categories.
A training set consisting of 2070 compounds was used to build an in-house, Caco-2 Papp
model, which was evaluated using the remaining 516 compounds. Table 2 summarizes the
statistics for the linear regression for the plot of predicted versus measured Caco-2 Papp based
This article has not been copyedited and formatted. The final version may differ from this version.DMD Fast Forward. Published on November 8, 2021 as DOI: 10.1124/dmd.121.000552
at ASPE
T Journals on M
arch 20, 2022dm
d.aspetjournals.orgD
ownloaded from
22
on logarithmic data. The R2 value was 0.61 for the in-house model (a R2 value for the global
model could not be obtained since the global model provides a Peff value). 89% of the
compounds in the test set with a predicted Papp ≤ 2×10⁻⁶ cm/s had a measured value in the
same range (Table 3). Of the compounds with a predicted high Papp (i.e., >10 ×10-6 cm/s),
69% also had a measured high Papp. The in-house model predicted 61 % of the test set
correctly. When the global Peff model was used to predict Caco-2 Papp categories for the test
set, 47% were correctly predicted based on the bin categorisation. The sensitivity with both
models was around 0.7 for low permeability compounds but lower for high permeability
compounds.
The in-house model was also used to predict Papp for a set of commercially available
reference compounds with in-house measured data (Supplemental Table 3). Table 4 shows
that the R2 for the regression (based on logarithmic data) was 0.78 (See Supplemental Table 4
for analysis of variance).
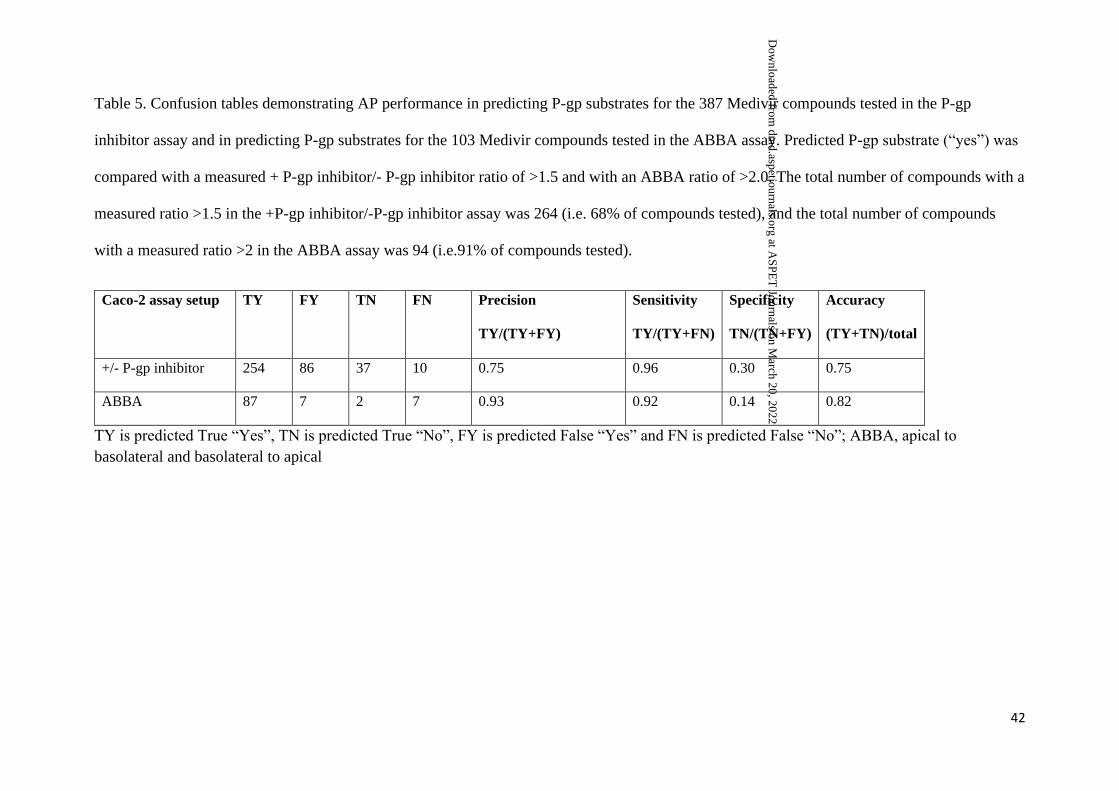
The prediction of P-gp substrates was also investigated. Predicted P-gp substrate (“yes”)
was compared with a +/- P-gp inhibitor ratio of >1.5 in the Caco-2 assay, and with an ABBA
ratio of >2.0 (Table 5). The precision, sensitivity, specificity and accuracy of these predictions
were 75%, 96%, 30% and 75%, respectively when compared with the P-gp inhibitor ratio, and
93%, 92%, 14% and 82%, respectively, when compared with the ABBA ratio.
This article has not been copyedited and formatted. The final version may differ from this version.DMD Fast Forward. Published on November 8, 2021 as DOI: 10.1124/dmd.121.000552
at ASPE
T Journals on M
arch 20, 2022dm
d.aspetjournals.orgD
ownloaded from

23
9. Discussion.
In the present study, the evaluations of the global ADME PredictorTM (AP) models for LogD,
water solubility, metabolic stability in HLM and intestinal permeability were performed with
experimental data from a total of 4794 Medivir compounds (not all compounds had measured
data for all parameters). Also, in-house local models were built by using artificial neural
network (ANN) models in the optional ModelerTM module of AP. For each parameter,
approximately 75-80% of the Medivir data was used as a training set and the remaining
compounds were used as a test set. With the global model, the test set and total dataset for
each parameter gave similar precision and sensitivity, indicating that the test sets were
representative.
Of the AP global models tested in this study, the S+LogD model demonstrated the best
agreement with observed data (Table 2). This is likely explained by good agreement in assay
output across laboratories, since the assay setup for the octanol-water partition assay is
straightforward and not dependent on any biological test systems. The prediction success was
somewhat better with the in-house local LogD model compared to the global model (Table 2).
Solubility is an important parameter for the bioavailability of drugs. Different methods
are used for measuring solubility, e.g., thermodynamic solubility, kinetic solubility and dried
DMSO solubility (Alelyunas et al., 2009; Saal and Petereit, 2012). Predictions of solubility
are challenging since it is difficult to obtain consistent data for model building. In this work
we used a set of in-house data obtained with a kinetic solubility assay performed at pH 7.4,
based on 10 mM compounds in DMSO stock solutions, relevant for most early screening
assays where compounds with solubility values below 10 µM may precipitate. Unless high
therapeutic concentrations will be needed, solubilities >90 µM should be sufficient for
preclinical assays and studies (even though high doses in safety studies in vivo may still be
challenging). However, this solubility will not be relevant for other formulations in later
This article has not been copyedited and formatted. The final version may differ from this version.DMD Fast Forward. Published on November 8, 2021 as DOI: 10.1124/dmd.121.000552
at ASPE
T Journals on M
arch 20, 2022dm
d.aspetjournals.orgD
ownloaded from

24
phases. Our data set was unbalanced, with a majority of compounds having high solubility.
Only a small proportion (<3%) predicted solubility below 10 µM using the global model,
even though the dataset contained 21% compounds with low solubility. Moreover, most
compounds with a low measured solubility had a high predicted solubility value using the
global AP model. Thus, the S+S_pH (at pH 7.4) model was not very useful for filtering out
the poorly soluble compounds for in vitro DMPK for the Medivir dataset. However,
approximately 56% of the compounds were still predicted correctly, due to the large
proportion of compounds with high solubility.
The prediction success for low solubility compounds was improved when the in-house
local model was used. The global model overpredicted solubility and the in-house local model
was better at identifying the low solubility compounds which could cause assay problems but
underpredicted highly soluble compounds (see F1-scores, Table 3). However, with a majority
of compounds having high solubility, the total number of correctly predicted compounds was
lower for the in-house model than for the global model (Figure 3B and weighted F1 in Table
3).
Later in drug development it will be important with more accurate solubility
measurements in relevant formulations and biological matrices. In AP, the solubility can be
predicted at different pHs and also in some biologically relevant matrices such as FaSSGF,
FaSSIF and FeSSIF which, if low, can help to explain one major reason for poor oral
bioavailability in vivo.
Early screening of metabolic stability in HLM is routinely performed in drug discovery,
since the metabolism of a compound will affect its overall pharmacokinetics (Sohlenius-
Sternbeck et al., 2016). The prediction success for high and low CLint compounds was
increased when the in-house local model was used. However, none of the prediction models
This article has not been copyedited and formatted. The final version may differ from this version.DMD Fast Forward. Published on November 8, 2021 as DOI: 10.1124/dmd.121.000552
at ASPE
T Journals on M
arch 20, 2022dm
d.aspetjournals.orgD
ownloaded from

25
predicted CLint accurately in the range between low and high metabolic stability and do not
give a reliable CLint value for scaling to in vivo but the models can be useful for
categorization of high and low metabolic stability. Predicted values in the range 15 to 30
µL/min/mg often had measured values <15 µL/min/mg (Figures 4A and B). This information
could still be useful for most early projects, when trying to design metabolically stable
compounds.
The AP and in-house models for metabolic stability were also tested with a set of
reference compounds. These are commercially available compounds and may have been part
of the training dataset for the AP global model. Nevertheless, the prediction outcome
demonstrated higher R2 for the in-house model compared to the AP model (Table 4), even
though the structures for the in-house training set was dissimilar to the reference compounds.
This may be due to experimental assay conditions being the same for the reference
compounds and the in-house compounds in the training set, while the data for the training set
in the AP global model may have come from several different experimental setups.
Intestinal permeability measurements are important for the understanding of absorption
and bioavailability of oral drugs. The Caco-2 cell line is commonly used to measure apparent
intestinal permeability and to give an indication of human absorption (Artursson et al., 2001).
However, the permeability in Caco-2 cells is highly dependent on the experimental conditions
(Hayeshi, 2008). There was no Caco-2 model available in the main AP software. However,
Simulations Plus has prediction models in GastroPlusTM and Membrane PlusTM. In this work
we used the global AP Peff model to predict measured Caco-2 Papp values. Predicted Peff values
of 1 and 3.0×10⁻⁴ cm/s could be used as cut-offs for low and high permeability respectively.
However, it is difficult to use predicted values between 1 and 3.0×10⁻⁴ cm/s to convert to
specific Caco-2 Papp values or to predict the absolute absorption in vivo for moderate values.
In early discovery, the model could still be used to indicate very low and high permeability
This article has not been copyedited and formatted. The final version may differ from this version.DMD Fast Forward. Published on November 8, 2021 as DOI: 10.1124/dmd.121.000552
at ASPE
T Journals on M
arch 20, 2022dm
d.aspetjournals.orgD
ownloaded from
26
compounds. The in-house Papp model showed improved predictions for the test set, compared
to the AP Peff model, for low permeabilities (Table 3). The global model showed somewhat
lower precision for low permeability compounds. Both the global Peff model and the in-house
Papp model could be useful tools to identify structures with likely low permeability, for the
Medivir compounds, and to guide design and synthesis of more permeable compounds.
The in-house model for permeability was also tested with a set of commercial reference
compounds, demonstrating similar prediction outcome as for the Medivir dataset with an R2
value of 0.73 (Table 4).
The AP model for P-gp substrate identification was evaluated based on measured values
of effect of P-gp inhibition and efflux ratio in ABBA. The P-gp model identified a large
proportion of the compounds that were also shown to be P-gp substrates in the in vitro assays,
giving high sensitivity and accuracy in confusion tables (see Table 5). However, chemical
series with compounds that were P-gp substrates were overrepresented in the study (68%),
and the reason for the low specificity number can be explained by the low number of negative
data in the dataset.
Our evaluation shows that the global AP models can be used for rough categorization of
high and low values in early discovery, based on predicted results for metabolic stability in
HLM and Peff permeability, and to give accurate predictions of Log D, guiding the synthesis
of new compounds and for prioritizing in vitro ADME experiments. The model seems to
overpredict solubility for Medivir compounds, however. It can be useful to also look at pH-
and matrix-dependent solubility models in AP. Local in-house prediction models built with
the optional AP Modeler Module can improve predictions. As more data is generated, the in-
house models will likely have to be rebuilt, when structures move away from the initial
training set.
This article has not been copyedited and formatted. The final version may differ from this version.DMD Fast Forward. Published on November 8, 2021 as DOI: 10.1124/dmd.121.000552
at ASPE
T Journals on M
arch 20, 2022dm
d.aspetjournals.orgD
ownloaded from

27
Predictions of advantageous ADME properties should trigger further experimental
evaluations. There is often a trade off with efficacy and toxicity so, if in vitro efficacy is
promising, selected compounds with poor predicted properties should be experimentally
tested in ADMET assays to confirm the predictions and be balanced against potency, toxicity,
predicted dose and dosing regimen. Depending on the specific project criteria, such as
indication, dose and intended dosing regimen, a project can, of course, accept compounds
with some poor properties.
This article has not been copyedited and formatted. The final version may differ from this version.DMD Fast Forward. Published on November 8, 2021 as DOI: 10.1124/dmd.121.000552
at ASPE
T Journals on M
arch 20, 2022dm
d.aspetjournals.orgD
ownloaded from

28
10. Acknowledgement.
We thank Dr Fredrik Öberg, Chief Scientific Officer at Medivir AB, for allowing us to use
these data.
This article has not been copyedited and formatted. The final version may differ from this version.DMD Fast Forward. Published on November 8, 2021 as DOI: 10.1124/dmd.121.000552
at ASPE
T Journals on M
arch 20, 2022dm
d.aspetjournals.orgD
ownloaded from

29
11. Authorship Contributions.
Participated in research design: Sohlenius-Sternbeck, Terelius
Performed data analysis: Sohlenius-Sternbeck, Terelius
Wrote the manuscript: Sohlenius-Sternbeck, Terelius
Financial disclosure: No author has an actual or perceived conflict of interest with the
contents of this article.
This article has not been copyedited and formatted. The final version may differ from this version.DMD Fast Forward. Published on November 8, 2021 as DOI: 10.1124/dmd.121.000552
at ASPE
T Journals on M
arch 20, 2022dm
d.aspetjournals.orgD
ownloaded from
30
12. Referenses
Alelyunas YW, Liu R, Pelosi-Kilby L, and Shen, C (2009) Application of a Dried-DMSO
rapid throughput 24-h equilibrium solubility in advancing discovery candidates. Eur J Pharm
Sci 37: 172–182.
Alqahtani S (2017) In silico ADME-Tox modeling: progress and prospects. Expert Opin Drug
Metab Toxicol 13: 1147–1158.
Artursson P, Palm K, and Luthman K (2001) Caco-2 monolayers in experimental and
theoretical predictions of drug transport. Adv Drug Deliv Rev 46: 27-43.
Austin RP, Barton P, Cockroft SL, Wenlock MC, and Riley RJ (2002) The influence of
nonspecific microsomal binding on apparent intrinsic clearance, and its prediction from
physicochemical properties. Drug Metab Dispos 30: 1497-1503.
Ballard P, Brassil P, Bui KH, Dolgos H, Petersson C, Tunek A, and Webborn PJH (2012) The
right compound in the right assay at the right time: an integrated discovery DMPK strategy.
Drug Metab Rev 44: 224-252.
Giacomini KM, Huang SM, Tweedie DJ, Benet LZ, Brouwer KL, Chu X, Dahlin A, Evers R,
Fischer V, Hillgren KM, Hoffmaster KA, Ishikawa T, Keppler D, Kim RB, Lee CA, Niemi
M, Polli JW, Sugiyama Y, Swaan PW, Ware JA, Wright SH, Yee SW, Zamek-Gliszczynski
MJ, and Zhang L (2010). Membrane transporters in drug development. Nat Rev Drug Discov
9: 215-236.
Gleeson MP, and Montanari D (2012) Strategies for the generation, validation and application
of in silico ADMET models in lead generation and optimization. Expert Opin on Drug Metab
Toxicol 8: 1435-1446.
Hayeshi R, Hilgendorf C, Artursson P, Augustijns P, Brodin B, Dehertogh P, Fisher K,
Fossati L, Hovenkamp E, Korjamo T, Masungi C, Maubon N, Mols R, Müllertz A,
Mönkkönen J, O’Driscoll C, Oppers-Tiemissen HM, Ragnarsson EGE, Rooseboom M, and
Ugnell AL. Comparison of drug transporter gene expression and functionality in Caco-2 cells
from 10 different laboratories (2008) Eur J of Pharm Sci 35: 383–396.
This article has not been copyedited and formatted. The final version may differ from this version.DMD Fast Forward. Published on November 8, 2021 as DOI: 10.1124/dmd.121.000552
at ASPE
T Journals on M
arch 20, 2022dm
d.aspetjournals.orgD
ownloaded from

31
Kramer JA, Sagartz JE and Morris DL (2007) The application of discovery toxicology and
pathology towards the design of safer pharmaceutical lead candidates. Nat Rev Drug Discov
6: 636–649.
Liu R, Schyman P, and Wallqvist A (2015) Critically assessing the predictive power of QSAR
models for human liver microsomal stability. J Chem Inf Model 55: 1566–1575.
Kazmi SR, Jun R, Yu M-S, Jung C, and Na D (2019) In silico approaches and tools for the
prediction of drug metabolism and fate: A review. Comput Biol Med 106: 54-64.
Moda TL, Torres LG, Carrara AE, and Andricopulo AD (2008) PK/DB: database for
pharmacokinetic properties and predictive. Bioinformatics 24: 2270-2271.
Saal C, and Petereit AC (2012) Optimizing solubility: Kinetic versus thermodynamic
solubility temptations. Eur J Pharm Sci 47: 589–595.
Sohlenius-Sternbeck AK, Afzelius L, Prusis P, Neelissen J, Hoogstraate J, Johansson
J, Floby E, Bengtsson A, Gissberg O, Sternbeck J, and Petersson C (2010) Evaluation of the
human prediction of clearance from hepatocyte and microsome intrinsic clearance for 52 drug
compounds. Xenobiotica 40: 637-649.
Sohlenius-Sternbeck AK, Janson J, Bylund J, Baranczewski P, Breitholtz-Emanuelsson A, Hu
Y, Tsoi C, Lindgren A, Gissberg O, Bueters T, Briem S, Juric S, Johansson J, Bergh M, and
Hoogstraate J (2016) Optimizing DMPK Properties: Experiences from a Big Pharma DMPK
Department. Curr Drug Metab 17: 253-270.
Sohlenius-Sternbeck AK, Meyerson G, Hagbjörk AL, Juric S, and Terelius Y (2018) A
strategy for early-risk predictions of clinical drug-drug interactions involving the
GastroPlusTM DDI module for time-dependent CYP inhibitors. Xenobiotica 48: 348-356.
Stålring J, Sohlenius-Sternbeck AK, Terelius Y, and Parkes K (2018) Confident application
of a global human liver microsomal activity QSAR. Future Med Chem 10: 1575-1588.
Wang Y, Xing J, Xu Y, Zhou N, Peng J, Xiong Z, Liu X, Luo X, Luo C, Chen K, Zheng M,
and Jiang H (2015) In silico ADME/T modelling for rational. Q Rev Biophys 48: 488-515.
van de Waterbeemd H, and Gifford E (2003) ADMET in silico modelling: Towards
prediction paradise? Nat Rev Drug Discov 2: 192-204.
This article has not been copyedited and formatted. The final version may differ from this version.DMD Fast Forward. Published on November 8, 2021 as DOI: 10.1124/dmd.121.000552
at ASPE
T Journals on M
arch 20, 2022dm
d.aspetjournals.orgD
ownloaded from

32
Yan A, and Gasteiger J (2003) Prediction of Aqueous Solubility of Organic Compounds by
Topological Descriptors. QSAR Comb Sci 22: 821-829.
This article has not been copyedited and formatted. The final version may differ from this version.DMD Fast Forward. Published on November 8, 2021 as DOI: 10.1124/dmd.121.000552
at ASPE
T Journals on M
arch 20, 2022dm
d.aspetjournals.orgD
ownloaded from

33
13. Footnotes
This work received no external funding.
This article has not been copyedited and formatted. The final version may differ from this version.DMD Fast Forward. Published on November 8, 2021 as DOI: 10.1124/dmd.121.000552
at ASPE
T Journals on M
arch 20, 2022dm
d.aspetjournals.orgD
ownloaded from

34
14. Figure Legends.
Figure 1. Characteristics of the Medivir dataset (4794 compounds) demonstrated by
histograms showing A) the distribution of molecular weight, and B) the distribution of
measured LogD (1198 compounds),
Figure 2. Predicted LogD versus measured LogD using A) the global S+LogD model (AP
model) for all 1198 compounds with measured values, B) the in-house (local) model for the
test set (287 compounds), and C) the S+LogD model for the test set.
Figure 3. Predicted solubility versus measured solubility in 4 categories using A) the global
S+S_pH model at pH 7.4 (AP model) for all 2778 compounds with measured values, B) the
in-house (local) model for the test set (691 compounds), and C) the global S+S_pH model for
the test set. For each bin, the number of compounds with predicted solubility in the specified
range is presented as percentage of total compounds in the bin. Note that for the S+S_pH
model the solubility was converted from mg/ml to µM.
Figure 4. Predicted CLint versus measured CLint in 4 categorises using A) the global
CYP_HLM_Clint model (AP model), versus measured total HLM CLint for all 4794
compounds with measured values, B) the in-house (local) model for the test set (1199
compounds), and C) the global CYP_HLM_Clint model for the test set. For each bin, the
number of compounds with predicted CLint in the specified range is presented as percentage
of total compounds in the bin. Note that the predicted CLint from the CYP_HLM_Clint was
converted to total CLint) using the predicted S+fumic (global AP model).
This article has not been copyedited and formatted. The final version may differ from this version.DMD Fast Forward. Published on November 8, 2021 as DOI: 10.1124/dmd.121.000552
at ASPE
T Journals on M
arch 20, 2022dm
d.aspetjournals.orgD
ownloaded from

35
Figure 5. Predicted intestinal permeability (Peff or Papp) versus measured Caco-2 Papp in 4
categorises using A) the S+Peff model (AP model) for all 2586 compounds with measured
Papp values, and B) the in-house (local) model for the test set (516 compounds), and C) the
S+Peff model for the test set. For each bin, the number of compounds with predicted Peff or
Papp in the specified range is presented as percentage of total compounds in the bin.
This article has not been copyedited and formatted. The final version may differ from this version.DMD Fast Forward. Published on November 8, 2021 as DOI: 10.1124/dmd.121.000552
at ASPE
T Journals on M
arch 20, 2022dm
d.aspetjournals.orgD
ownloaded from

36
15. Tables.
Table 1. Bin size for the datasets. The measured solubilities were divided into 4 categories, A-D (<10, 10-50, 50-90 and >90 µM) and the same
categories were used for binning the predictions. The measured CLint values were divided into 4 categories, A-D (<15, 15-30, 30-80 and >80
µL/min/mg) and the same categories were used for binning the predictions. The measured Papp values were divided into 4 categories, A-D (<2, 2-
5, 5-10 and >10 x 10-6 cm/s) and the corresponding categories A-D used for Peff predictions were <1, 1-2, 2-3 and >3 (10-4 cm/s).
This article has not been copyedited and formatted. The final version may differ from this version.DMD Fast Forward. Published on November 8, 2021 as DOI: 10.1124/dmd.121.000552
at ASPE
T Journals on M
arch 20, 2022dm
d.aspetjournals.orgD
ownloaded from

37
Parameter predicted Model
Data-
set
Tot
cpds
Tot correctly
predicted
Predicted bin size Measured bin size
Bin A Bin B Bin C Bin D Bin A Bin B Bin C Bin D
Solubility (µM)
AP All 2778 1553 69 241 201 2267 582 319 340 1537
AP Test 691 410 13 46 47 585 101 78 92 420
local Test 691 221 92 140 404 55 101 78 92 420
Metabolic stability
HLM CLint
(µL/mg/min)
AP All 4794 1779 973 1586 1444 791 1332 598 941 1923
AP Test 1199 442 231 385 382 201 340 135 232 492
local Test 1199 766 235 236 309 419 340 135 232 492
Permeability
Caco-2 Papp
(10-6 cm/s)
AP, Peff All 2586 1114 1072 856 341 317 962 306 399 919
AP, Peff Test 516 245 220 154 72 70 204 61 78 173
local, Papp Test 516 317 166 90 87 173 204 61 78 173
AP = ADMET PredictorTM; CLint = in vitro intrinsic clearance; Peff = effective jejunal permeability; Papp = apparent permeability
This article has not been copyedited and formatted. The final version may differ from this version.DMD Fast Forward. Published on November 8, 2021 as DOI: 10.1124/dmd.121.000552
at ASPE
T Journals on M
arch 20, 2022dm
d.aspetjournals.orgD
ownloaded from

38
Table 2. Prediction outcome for the AP models and the in-house models for compounds in the Medivir dataset.
Assay
Total
number of
compounds
Number of
compounds in
training set
Number of
compounds
in test set
AP model (all
compounds)
AP model (test set)
In-house model (test set)
RMSE MAE R2 RMSE MAE R2 RMSE MAE R2
LogD 1198 911 287 0.771 0.589 0.785 0.757 0.585 0.790 0.488 0.349 0.888
Solubility* 2778 2087 691 1.261 1.075 0.260 1.229 1.055 0.202 0.388 0.247 0.593
HLM CLint* 4794 3595 1199 0.566 0.454 0.531 0.574 0.462 0.498 0.327 0.250 0.717
Caco-2 permeability* 2586 2070 516 NA NA NA NA NA NA 0.370 0.265 0.614
*Model based on logarithmic data
AP = ADMET PredictorTM; HLM = human liver microsomes; MAE = mean absolute error; RMSE = root mean square error
This article has not been copyedited and formatted. The final version may differ from this version.DMD Fast Forward. Published on November 8, 2021 as DOI: 10.1124/dmd.121.000552
at ASPE
T Journals on M
arch 20, 2022dm
d.aspetjournals.orgD
ownloaded from

39
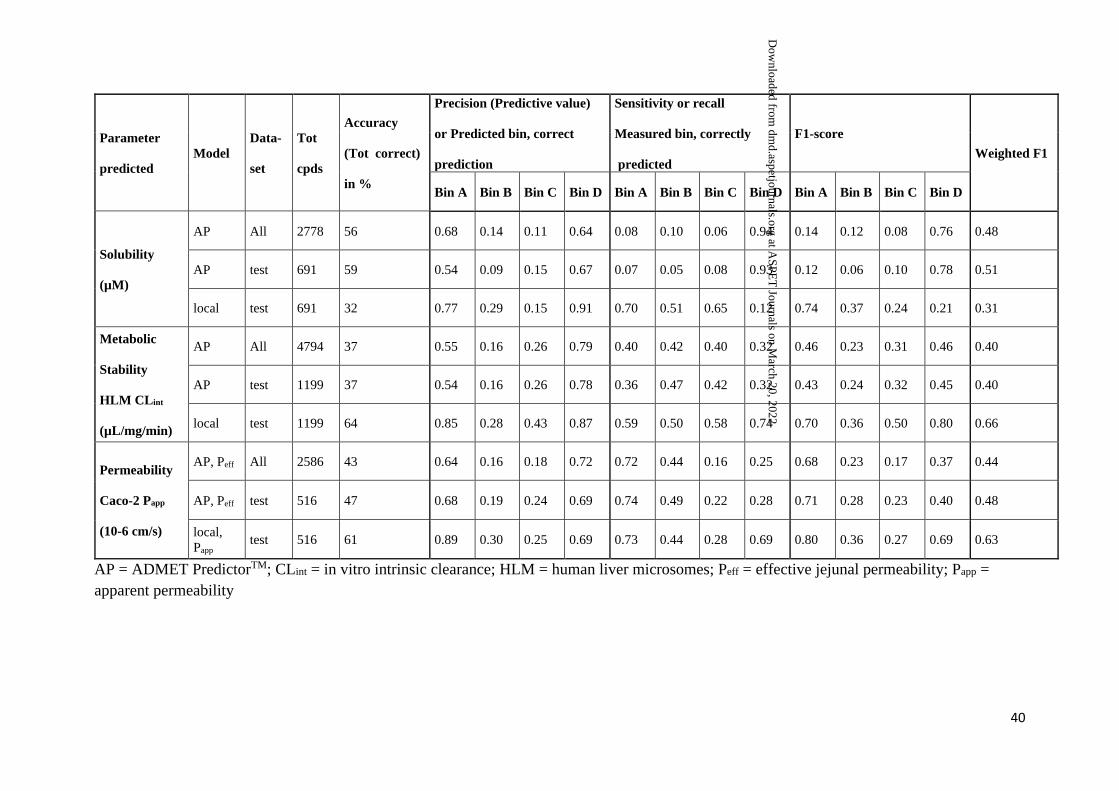
Table 3. Precision, sensitivity and F1-score for each bin as well as overall accuracy and weighted F1 for the global models with the total datasets
and for the in-house and global models with the test sets.
The measured solubilities were divided into 4 categories, A-D (<10, 10-50, 50-90 and >90 µM) and the same categories were used for binning
the predictions. The measured CLint values were divided into 4 categories, A-D (<15, 15-30, 30-80 and >80 µL/min/mg) and the same categories
were used for binning the predictions. The measured Papp values were divided into 4 categories, A-D (≤2, 2-5, 5-10 and >10 x 10-6 cm/s) and the
corresponding categories A-D used for Peff predictions were <1, 1-2, 2-3 and >3 (10-4 cm/s).
This article has not been copyedited and formatted. The final version may differ from this version.DMD Fast Forward. Published on November 8, 2021 as DOI: 10.1124/dmd.121.000552
at ASPE
T Journals on M
arch 20, 2022dm
d.aspetjournals.orgD
ownloaded from
40
Parameter
predicted
Model
Data-
set
Tot
cpds
Accuracy
(Tot correct)
in %
Precision (Predictive value)
or Predicted bin, correct
prediction
Sensitivity or recall
Measured bin, correctly
predicted
F1-score
Weighted F1
Bin A Bin B Bin C Bin D Bin A Bin B Bin C Bin D Bin A Bin B Bin C Bin D
Solubility
(µM)
AP All 2778 56 0.68 0.14 0.11 0.64 0.08 0.10 0.06 0.94 0.14 0.12 0.08 0.76 0.48
AP test 691 59 0.54 0.09 0.15 0.67 0.07 0.05 0.08 0.93 0.12 0.06 0.10 0.78 0.51
local test 691 32 0.77 0.29 0.15 0.91 0.70 0.51 0.65 0.12 0.74 0.37 0.24 0.21 0.31
Metabolic
Stability
HLM CLint
(µL/mg/min)
AP All 4794 37 0.55 0.16 0.26 0.79 0.40 0.42 0.40 0.32 0.46 0.23 0.31 0.46 0.40
AP test 1199 37 0.54 0.16 0.26 0.78 0.36 0.47 0.42 0.32 0.43 0.24 0.32 0.45 0.40
local test 1199 64 0.85 0.28 0.43 0.87 0.59 0.50 0.58 0.74 0.70 0.36 0.50 0.80 0.66
Permeability
Caco-2 Papp
(10-6 cm/s)
AP, Peff All 2586 43 0.64 0.16 0.18 0.72 0.72 0.44 0.16 0.25 0.68 0.23 0.17 0.37 0.44
AP, Peff test 516 47 0.68 0.19 0.24 0.69 0.74 0.49 0.22 0.28 0.71 0.28 0.23 0.40 0.48
local,
Papp test 516 61 0.89 0.30 0.25 0.69 0.73 0.44 0.28 0.69 0.80 0.36 0.27 0.69 0.63
AP = ADMET PredictorTM; CLint = in vitro intrinsic clearance; HLM = human liver microsomes; Peff = effective jejunal permeability; Papp =
apparent permeability
This article has not been copyedited and formatted. The final version may differ from this version.DMD Fast Forward. Published on November 8, 2021 as DOI: 10.1124/dmd.121.000552
at ASPE
T Journals on M
arch 20, 2022dm
d.aspetjournals.orgD
ownloaded from

41
Table 4. Prediction outcome for CLint in HLM and Caco-2 with the AP models and the in-house models for commercially available reference
compounds with in-house measured data (See Supplemental Tables 2 and 3).
Assay
Number of
compounds
AP model In-house model
RMSE MAE R2 RMSE MAE R2
Human liver microsomal CLint 75 0.454 0.333 0.140 0.313 0.247 0.512
Caco-2 permeability 26 NA NA NA 0.333 0.265 0.782
Analysis based on logarithmic data.
NA: Not available since the ADMET PredictorTM (AP) model predicted effective jejunal permeability (Peff), not apparent permeability (Papp)
This article has not been copyedited and formatted. The final version may differ from this version.DMD Fast Forward. Published on November 8, 2021 as DOI: 10.1124/dmd.121.000552
at ASPE
T Journals on M
arch 20, 2022dm
d.aspetjournals.orgD
ownloaded from
42
Table 5. Confusion tables demonstrating AP performance in predicting P-gp substrates for the 387 Medivir compounds tested in the P-gp
inhibitor assay and in predicting P-gp substrates for the 103 Medivir compounds tested in the ABBA assay. Predicted P-gp substrate (“yes”) was
compared with a measured + P-gp inhibitor/- P-gp inhibitor ratio of >1.5 and with an ABBA ratio of >2.0. The total number of compounds with a
measured ratio >1.5 in the +P-gp inhibitor/-P-gp inhibitor assay was 264 (i.e. 68% of compounds tested), and the total number of compounds
with a measured ratio >2 in the ABBA assay was 94 (i.e.91% of compounds tested).
Caco-2 assay setup TY FY TN FN Precision
TY/(TY+FY)
Sensitivity
TY/(TY+FN)
Specificity
TN/(TN+FY)
Accuracy
(TY+TN)/total
+/- P-gp inhibitor 254 86 37 10 0.75 0.96 0.30 0.75
ABBA 87 7 2 7 0.93 0.92 0.14 0.82
TY is predicted True “Yes”, TN is predicted True “No”, FY is predicted False “Yes” and FN is predicted False “No”; ABBA, apical to
basolateral and basolateral to apical
This article has not been copyedited and formatted. The final version may differ from this version.DMD Fast Forward. Published on November 8, 2021 as DOI: 10.1124/dmd.121.000552
at ASPE
T Journals on M
arch 20, 2022dm
d.aspetjournals.orgD
ownloaded from

Figure 1.
A)
B)
This article has not been copyedited and formatted. The final version may differ from this version.DMD Fast Forward. Published on November 8, 2021 as DOI: 10.1124/dmd.121.000552
at ASPE
T Journals on M
arch 20, 2022dm
d.aspetjournals.orgD
ownloaded from

1
Figure 2.
A)
B)
This article has not been copyedited and formatted. The final version may differ from this version.DMD Fast Forward. Published on November 8, 2021 as DOI: 10.1124/dmd.121.000552
at ASPE
T Journals on M
arch 20, 2022dm
d.aspetjournals.orgD
ownloaded from

2
C)
This article has not been copyedited and formatted. The final version may differ from this version.DMD Fast Forward. Published on November 8, 2021 as DOI: 10.1124/dmd.121.000552
at ASPE
T Journals on M
arch 20, 2022dm
d.aspetjournals.orgD
ownloaded from

1
Figure 3.
A)
B)
This article has not been copyedited and formatted. The final version may differ from this version.DMD Fast Forward. Published on November 8, 2021 as DOI: 10.1124/dmd.121.000552
at ASPE
T Journals on M
arch 20, 2022dm
d.aspetjournals.orgD
ownloaded from

2
C)
This article has not been copyedited and formatted. The final version may differ from this version.DMD Fast Forward. Published on November 8, 2021 as DOI: 10.1124/dmd.121.000552
at ASPE
T Journals on M
arch 20, 2022dm
d.aspetjournals.orgD
ownloaded from

1
Figure 4.
A)
B)
This article has not been copyedited and formatted. The final version may differ from this version.DMD Fast Forward. Published on November 8, 2021 as DOI: 10.1124/dmd.121.000552
at ASPE
T Journals on M
arch 20, 2022dm
d.aspetjournals.orgD
ownloaded from
2
C)
This article has not been copyedited and formatted. The final version may differ from this version.DMD Fast Forward. Published on November 8, 2021 as DOI: 10.1124/dmd.121.000552
at ASPE
T Journals on M
arch 20, 2022dm
d.aspetjournals.orgD
ownloaded from

1
Figure 5.
A)
B)
This article has not been copyedited and formatted. The final version may differ from this version.DMD Fast Forward. Published on November 8, 2021 as DOI: 10.1124/dmd.121.000552
at ASPE
T Journals on M
arch 20, 2022dm
d.aspetjournals.orgD
ownloaded from

2
C)
This article has not been copyedited and formatted. The final version may differ from this version.DMD Fast Forward. Published on November 8, 2021 as DOI: 10.1124/dmd.121.000552
at ASPE
T Journals on M
arch 20, 2022dm
d.aspetjournals.orgD
ownloaded from