water vapor and cloud detection validation for aqua using raman lidars and aeri david whiteman,...
TRANSCRIPT
Water Vapor and Cloud Detection Water Vapor and Cloud Detection Validation for Aqua Using Raman Validation for Aqua Using Raman
Lidars and AERILidars and AERIDavid Whiteman, Belay Demoz
NASA/Goddard Space Flight Center
Zhien Wang, Chris Barnet, Wallace McMillan, Raymond Hoff, Igor Veselovskii, Felicita Russo
University of Maryland, Baltimore County/JCET
Gary J. JedlovecNASA/Marshall Space Flight Center, GHCC
Daniel H. DeSloverUniversity of Wisconsin/CIMSS
And thanks to
John Braun, Chris Rocken, Teresa VanHove, Larry Miloshevich, June Wang – UCAR
Barry Lesht – ANL
Rich Ferrare – NASA/LaRC

OutlineOutline
Overview of work performed to date NWS radiosonde conversion plans Raman Lidar introduction AFWEX water vapor measurements
– 4 water vapor lidars, Vaisala radiosonde, SW Chilled mirror, in-situ sensors, GPS, MWR
Raman Lidar calibration Lidar/retrieval comparisons
– “To tune or not to tune”– Clear and cloudy water vapor and temperature profiles versus 5 retrieval
schemes
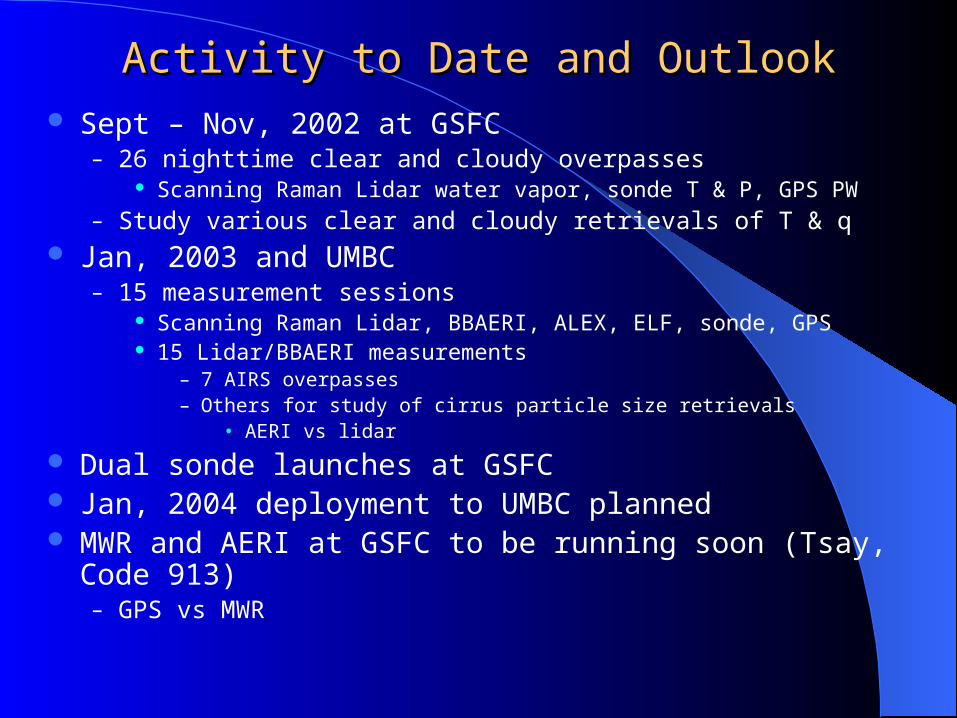
Activity to Date and OutlookActivity to Date and Outlook Sept – Nov, 2002 at GSFC
– 26 nighttime clear and cloudy overpasses Scanning Raman Lidar water vapor, sonde T & P, GPS PW
– Study various clear and cloudy retrievals of T & q Jan, 2003 and UMBC
– 15 measurement sessions Scanning Raman Lidar, BBAERI, ALEX, ELF, sonde, GPS 15 Lidar/BBAERI measurements
– 7 AIRS overpasses– Others for study of cirrus particle size retrievals
• AERI vs lidar
Dual sonde launches at GSFC Jan, 2004 deployment to UMBC planned MWR and AERI at GSFC to be running soon (Tsay, Code 913)
– GPS vs MWR

NWS Radiosonde ConversionNWS Radiosonde Conversion NWS announced that Sippican and Intermet will be
supplying radiosonde packages for operational launches over next 3 years– Vaisala and Sippican used formerly– Previous comparisons have found significant differences
Calibration Response at cold temperatures
The new sondes will be phased in and transfer functions between the previous sondes (Vaisala or Sippican) implemented– Smooth through glitches
Dual sonde (Intermet, Sippican) launches coming soon

Raman LidarRaman Lidar
Laser transmitter (UV better)– excites Raman scattering in
atmospheric species. Telescope receiver
– wavelength selection optics separate the wavelengths
Time gated data acquisition gives range information
Measurements– Water vapor mixing ratio– Aerosol backscatter, extinction,
depolarization– Liquid water mixing ratio– Many other things
0
= 351, 355 O2
N2
H O2
W avelength (nm )
Log
In
ten
sity
R ayleigh , M ie and R am an S ignals

Raman Lidar for water vapor measurementsRaman Lidar for water vapor measurements Advantages
– Based on scattering physics-> direct measurement of mixing ratio– Purely vertical profiles– No time lag, sensor contamination issues– Stable calibration has been demonstrated– Temperature sensitivity of Raman scattering well known, is a
small effect (<5%), and can be simulated (accepted Appl. Opt.)
Disadvantages– UT measurements only at night– Raman cross section not well known
Absolute calibration not difficult but will have uncertainties > 10%
),()(
)()( RL
H
H
zP
zPzTkzw

Scanning Raman Lidar (SRL), Sippican Radiosonde Scanning Raman Lidar (SRL), Sippican Radiosonde (T+P), SuomiNet GPS(T+P), SuomiNet GPS
GSFC site• North-largely forested, some open fields• South-suburban sprawl• Patuxent River, Chesapeake Bay, Potomac River

ARM FIRE Water Vapor Experiment (2000)ARM FIRE Water Vapor Experiment (2000)
0 1 2 3 40
1
2
3
4
5
6
7
8Dec 5, 2000, 0330 UT, AFWEX, ARM CART
SRL, 0330-0400 UT CARL, 0330-0400 UT 0329 UT Vaisala LASE, 0330-0400 UT (<0.05 deg) MPI DIAL, 0329-0339 UT
Alt
itud
e (k
m)
Water vapor mixing ratio (g/kg)1E-3 0.01 0.1 1 100
1
2
3
4
5
6
7
8
9
10
11
12
13Dec 5, 2000, 0330 UT, AFWEX, ARM CART
SRL, 0330-0400 UT CARL, 0330-0400 UT 0329 UT Vaisala LASE, 0330-0400 UT (<0.05 deg) MPI DIAL, 0329-0339 UT
Alt
itud
e (k
m)
Water vapor mixing ratio (g/kg)
Goal: characterize UT water vapor technologies (4 WV lidar, sondes, passive, in-situ)Location: ARM CART SGP site northern OK

AFWEX Dec. 5, 2000 06:38 UT
Water Vapor Mixing Ratio (g/kg)
Alt
itu
de
(km
)
0123456789
101112
0.01 0.10 1.00
LASECARLSRLVaisalaChilled MirrorSippican (VIZ)
Example Water Vapor Profile Comparison
• CART Raman (CARL) and Scanning Raman (SRL) Lidar profiles correspond to 10 minute averages• LASE profile corresponds to a 2 minute average centered over the SGP site.
Courtesy of Richard Ferrare – NASA/LaRC

% Difference (CART Raman Lidar - LASE)
Alt
itu
de (
km
)
<= 1(1,2](2,3](3,4](4,5](5,6](6,7](7,8](8,9]
(9,10](10,11](11,12]
-50 -40 -30 -20 -10 0 10 20 30 40 50
InitialWith overlap
correction
CART Raman Lidar
% Difference (GSFC Raman Lidar - LASE)
Alt
itu
de (
km
)
<= 1(1,2](2,3](3,4](4,5](5,6](6,7](7,8](8,9]
(9,10](10,11](11,12]
-50 -40 -30 -20 -10 0 10 20 30 40 50
GSFC Raman Lidar
% Difference (Vaisala sonde - LASE)
Alt
itu
de (
km
)
<= 1(1,2](2,3](3,4](4,5](5,6](6,7](7,8](8,9]
(9,10](10,11](11,12]
-50 -40 -30 -20 -10 0 10 20 30 40 50
Vaisala (corrected for calib.& temp. dep. calib. corr.)Vaisala (corrected for above + time lag)
Vaisala (uncorrected)Vaisala (scaled to MWR)
wetter than LASEdrier than LASE
Vaisala RS80H
% Difference (sensor - LASE)
Alt
itu
de (
km
)
<= 1(1,2](2,3](3,4](4,5](5,6](6,7](7,8](8,9]
(9,10](10,11](11,12]
-150 -100 -50 0 50 100 150
DC-8 In situDLHcryogenic
hygrometer
chilled mirror radiosonde
Sippican radiosonde
Summary of LASE Comparisons from AFWEX
Courtesy of Richard Ferrare – NASA/LaRC
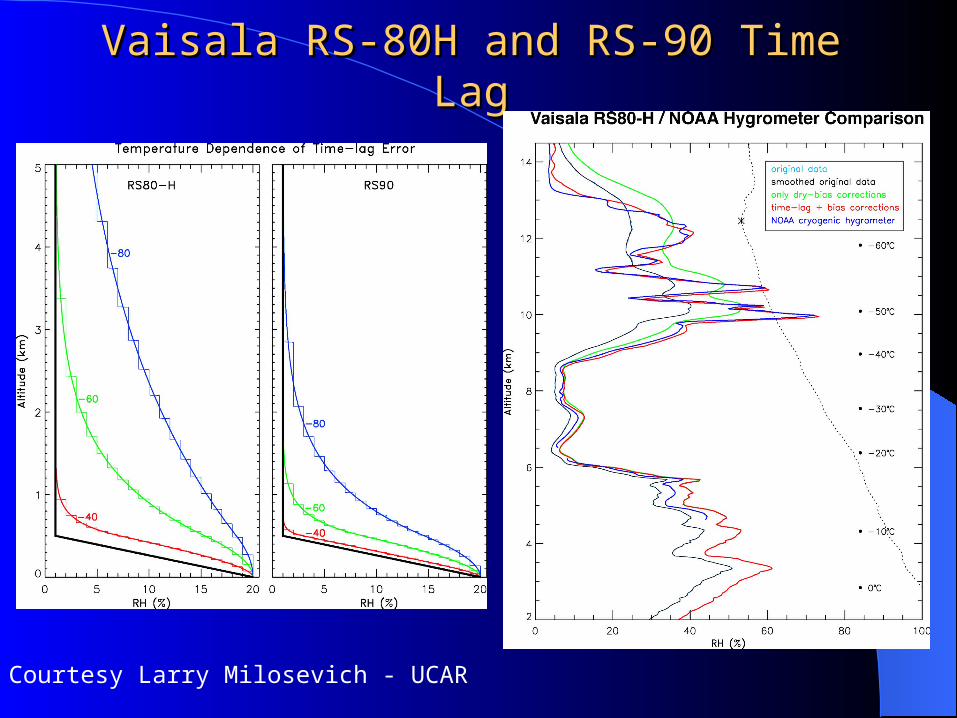
Vaisala RS-80H and RS-90 Time LagVaisala RS-80H and RS-90 Time Lag
Courtesy Larry Milosevich - UCAR

TPW ComparisonsTPW ComparisonsRS-80H and RS-90 vs MWR (SGP)RS-80H and RS-90 vs MWR (SGP)
RS-80H: ~2% dryer than MWR, ~5% standard deviationRS-90 : ~1% dryer than MWR, ~5% standard deviation
Courtesy Barry Lesht, ANL
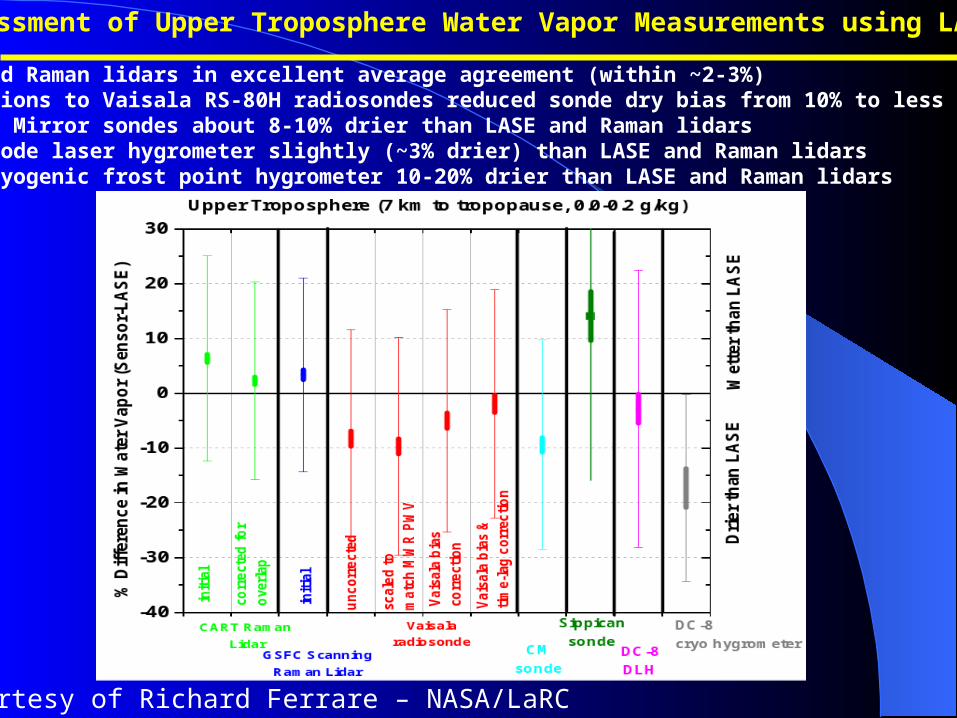
Assessment of Upper Troposphere Water Vapor Measurements using LASE
• LASE and Raman lidars in excellent average agreement (within ~2-3%)• Corrections to Vaisala RS-80H radiosondes reduced sonde dry bias from 10% to less than 5%• Chilled Mirror sondes about 8-10% drier than LASE and Raman lidars• DC-8 diode laser hygrometer slightly (~3% drier) than LASE and Raman lidars• DC-8 cryogenic frost point hygrometer 10-20% drier than LASE and Raman lidars
Courtesy of Richard Ferrare – NASA/LaRC

Raman water vapor lidar calibrationRaman water vapor lidar calibration
Comparison with respect to radiosonde profile– Normal radiosondes show variability and dry bias – Research radiosondes are promising
Need large enough sample to study variability of calibration
Comparison based on total column water – MWR scaling being performed at the SGP site– GPS provides a stable reference as well
large volume average implies numerous comparisons required to assess calibration constant
– Important to get the bottom part of the lidar profile correct ~5% of TPW can be in the bottom 250 meters SRL uses vertical and scanned lidar measurements along with 2 ground
sensors for composite profile
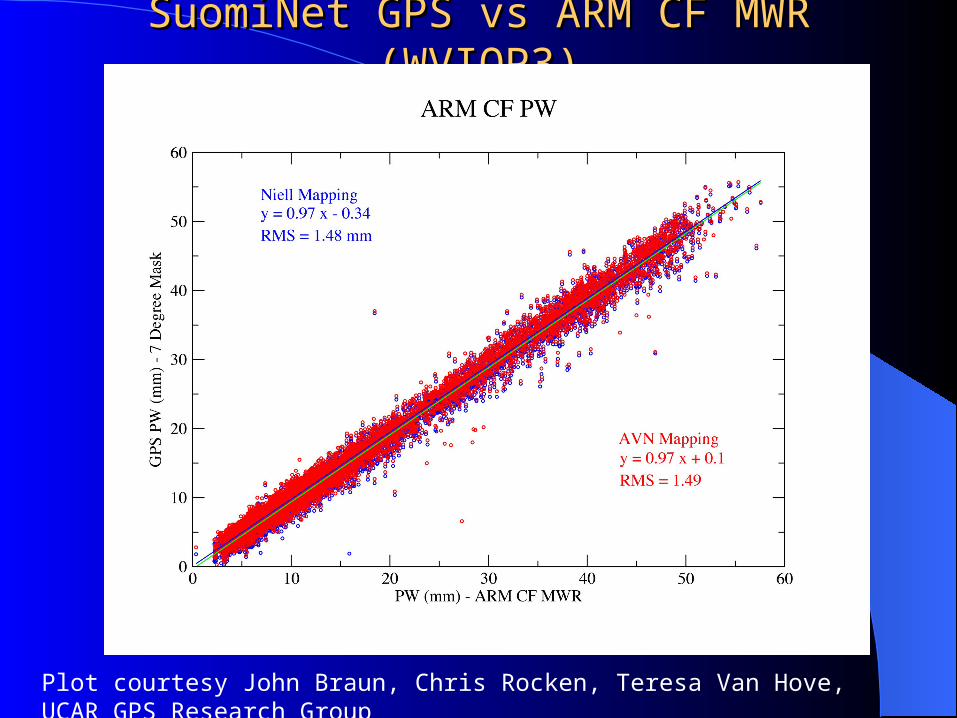
SuomiNet GPS vs ARM CF MWR (WVIOP3)SuomiNet GPS vs ARM CF MWR (WVIOP3)
Plot courtesy John Braun, Chris Rocken, Teresa Van Hove, UCAR GPS Research Group
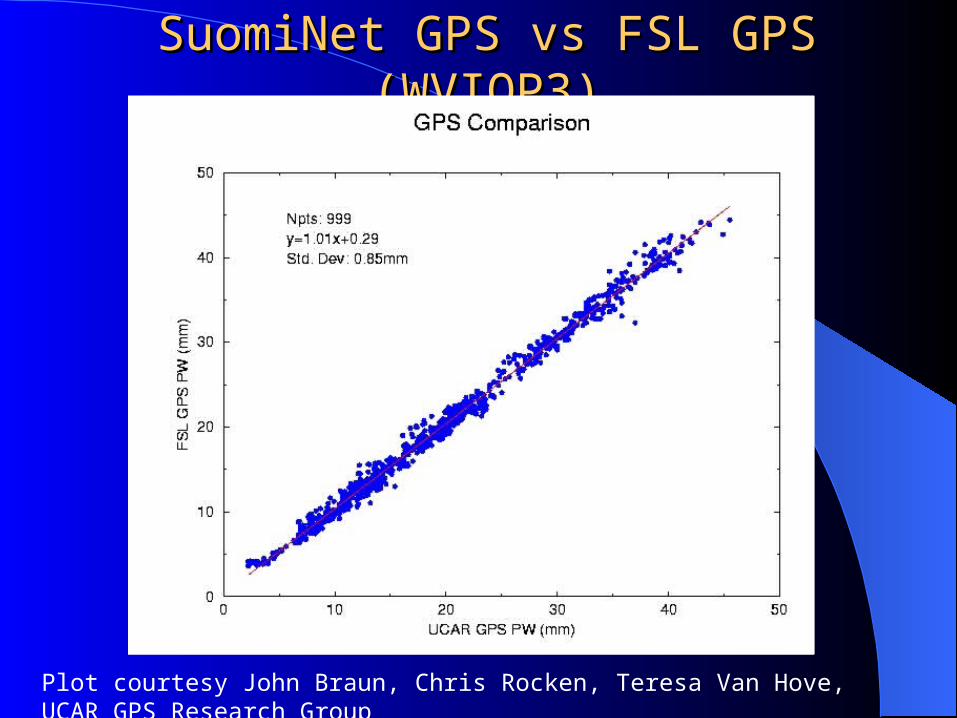
SuomiNet GPS vs FSL GPS (WVIOP3)SuomiNet GPS vs FSL GPS (WVIOP3)
Plot courtesy John Braun, Chris Rocken, Teresa Van Hove, UCAR GPS Research Group

SRL Calibration constant determined from SRL Calibration constant determined from GPS and SippicanGPS and Sippican
260 280 300 320 340 360
0.005
0.01
0.015 GPS x 309.374, 27.8469
275 300 325 350 375 400
0.002
0.004
0.006
0.008
0.01
0.012
0.014
VIZ x 338.188, 31.7734
SuomiNet GPS (PW) Sippican radiosonde(profile comparison ~1-2 km)
Sippican profile calibration ~6% moister, PW calibration ~15% moister

Chris Barnet’s retrieval “tweaks”Chris Barnet’s retrieval “tweaks”
Tune: T, E(n,m)=0
NoTune: T=0, E(n,m)=0
Covar: T=0, E(n,n)=(Obs-Calc(n))2
Covar_New: T=0, E(n,m) =(Obs-Calc(n)*Obs-Calc(m))
B50: T=0, E(n,n)=1/4 of Covar
TT EENN
TuneCalcObs
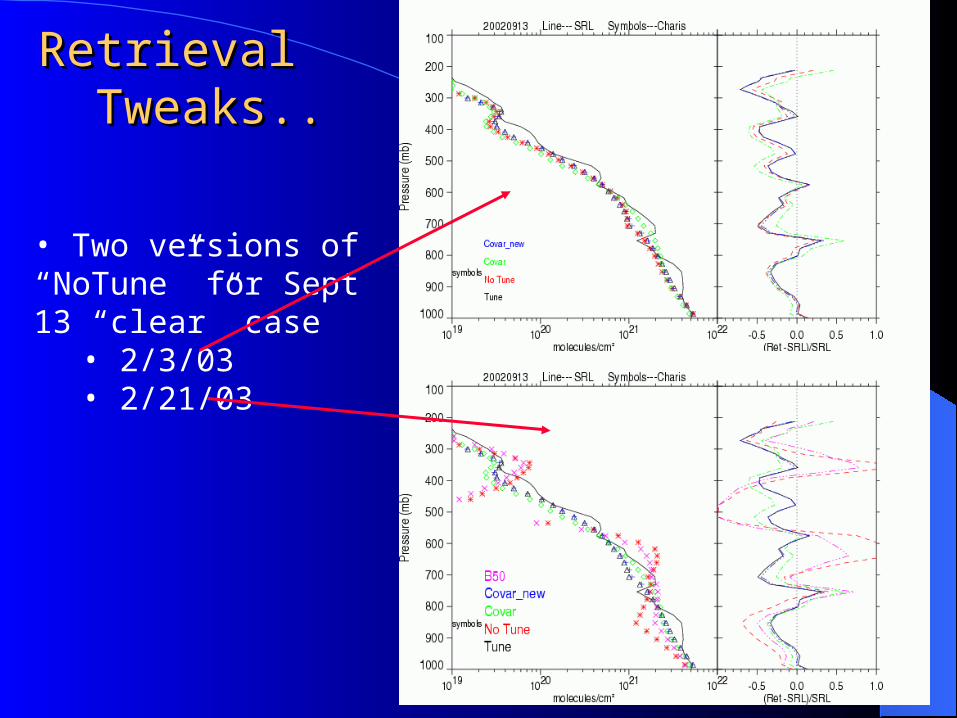
Retrieval Retrieval Tweaks..Tweaks..
• Two versions of “NoTune” for Sept 13 “clear” case
• 2/3/03• 2/21/03
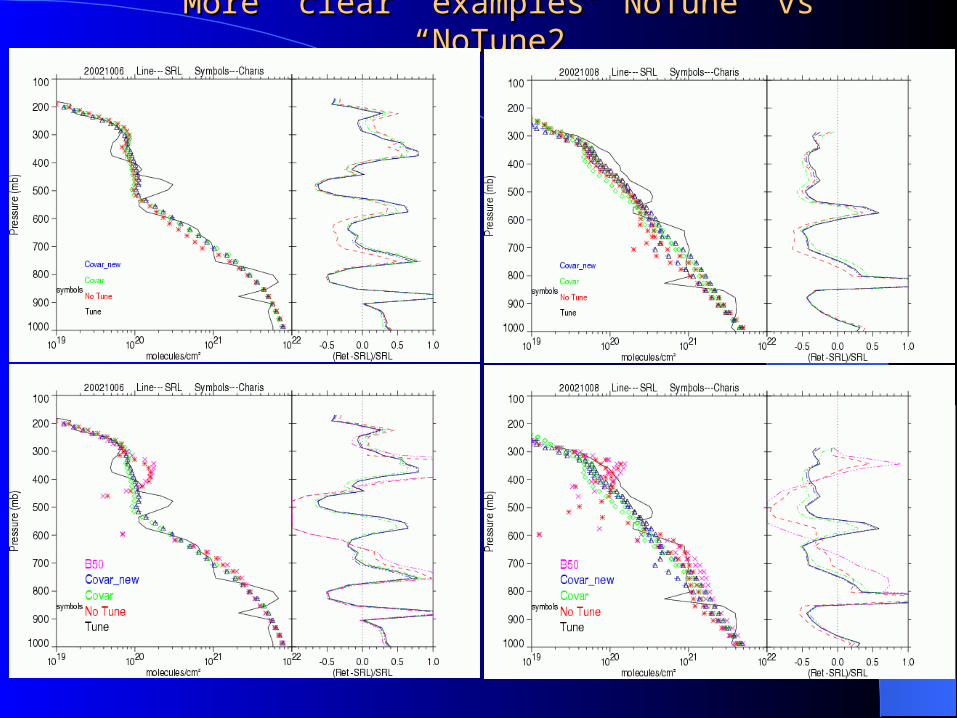
More “clear” examples “NoTune” vs “NoTune2”More “clear” examples “NoTune” vs “NoTune2”

More “clear” examples “NoTune” vs “Notune2” - IIMore “clear” examples “NoTune” vs “Notune2” - II

Some “Clear” Water Vapor ExamplesSome “Clear” Water Vapor Examples

Some “Cloudy” Water Vapor ExamplesSome “Cloudy” Water Vapor Examples

(a)
(b)

The September 14 CaseThe September 14 Case
Cirrus cloud scattering ratio Quick look plot - uncalibrated
A sharp increase in water vapor beneath cirrus cloud decks is common and can persist

SRL vs Aqua water vapor retrieval SRL vs Aqua water vapor retrieval (mean of 17)(mean of 17)
ret dry ret wet

SRL vs Aqua water vapor retrieval SRL vs Aqua water vapor retrieval (9 clear cases)(9 clear cases)
ret dry ret wet

SRL vs Aqua water vapor retrieval SRL vs Aqua water vapor retrieval (8 cloudy cases)(8 cloudy cases)
ret dry ret wet

Sippican vs Aqua Temperature Retrieval Sippican vs Aqua Temperature Retrieval (17 Cases)(17 Cases)
ret warm ret cold

Sippican vs Aqua Temperature Retrieval Sippican vs Aqua Temperature Retrieval (9 clear cases)(9 clear cases)
ret warm ret cold

Sippican vs Aqua Temperature Retrieval Sippican vs Aqua Temperature Retrieval (8 cloudy cases)(8 cloudy cases)
ret warm ret cold

(a)
(b)

Summary of PW comparisonsSummary of PW comparisons Total precipitable water comparisons Ret/SRL
– All: 0.97 – 1.02, Clear: 0.91 – 0.95, Cloudy: 1.01 – 1.07 All retrievals show the following general trends
– increase in moisture below 800-900 mb More rapid for cloudy cases than clear
– clear conditions ~5 - 15% dry bias with respect to SRL above 900 mb
– cloudy conditions generally good agreement (+2% to - 7%) with SRL above 900 mb wet bias (25 – 30%) between 270-460 mb due to missed structure below cloud layers
“Tune” and “Covar_New”– performed similarly in water vapor comparisons
Similar results can be obtained from damping as with tuning “No_Tune”
– shows significant oscillations in clear profiles (+/- 30 – 50%), large positive bias near the surface in cloudy profiles (40-50%)
“Covar” – showed the least positive bias (~25%) in the UT (270 – 460 mb)– Generally dryer than “Tune” by 1-7%

Summary of Temperature ComparisonsSummary of Temperature Comparisons Overall agreement of all retrievals within +/- 1K above 900
mb– NoTune2 up to 2K cold ~950 mb
All retrievals show temperatures decreasing between 850 – 950 mb (~1K), then abrupt increase below 950 mb (~3K)
Under both clear and cloudy conditions, warm bias between 250 – 600 mb of ~0.3 – 1.0K
Significant difference between clear and cloudy retrievals between 600 – 900 mb
– Clear retrievals ~0.5 – 1.0K colder “Tune” and “Covar_New”
– similar performance with the smallest overall biases “NoTune”
– Showed the largest deviations under most conditions “Covar”
– Showed largest warm bias in UT (~0.7 – 1.1 K)
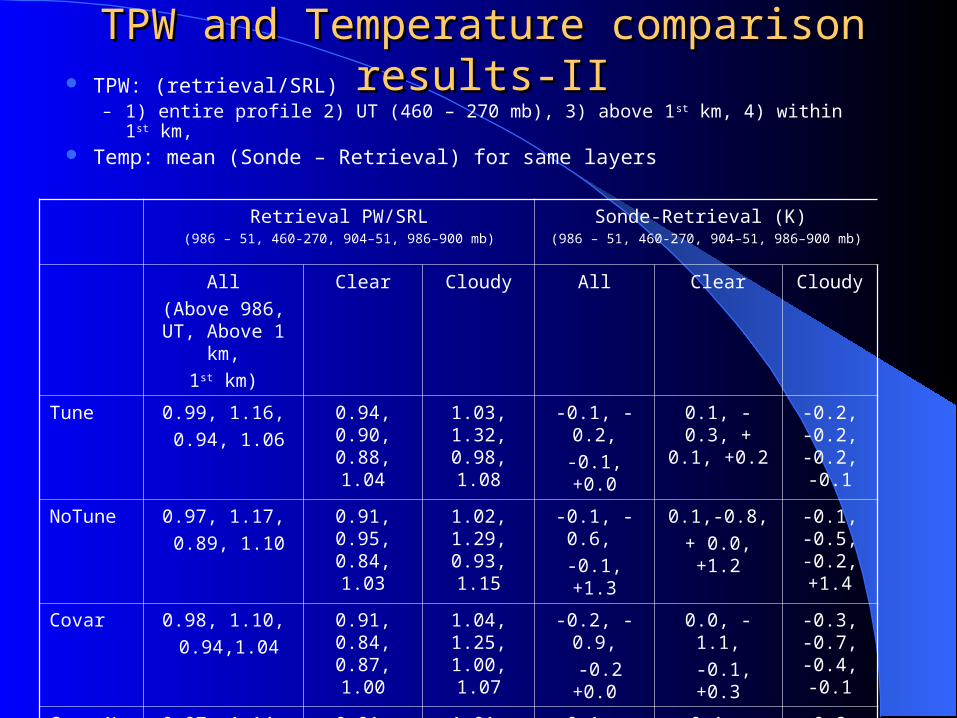
TPW and Temperature comparison results-IITPW and Temperature comparison results-II TPW: (retrieval/SRL)
– 1) entire profile 2) UT (460 – 270 mb), 3) above 1st km, 4) within 1st km, Temp: mean (Sonde – Retrieval) for same layers
Retrieval PW/SRL(986 – 51, 460-270, 904–51, 986–900 mb)
Sonde-Retrieval (K) (986 – 51, 460-270, 904–51, 986–900 mb)
All
(Above 986, UT, Above 1 km,
1st km)
Clear Cloudy All Clear Cloudy
Tune 0.99, 1.16,
0.94, 1.06
0.94, 0.90, 0.88, 1.04
1.03, 1.32, 0.98, 1.08
-0.1, -0.2,
-0.1, +0.0
0.1, -0.3, + 0.1, +0.2
-0.2, -0.2, -0.2, -0.1
NoTune 0.97, 1.17,
0.89, 1.10
0.91, 0.95, 0.84, 1.03
1.02, 1.29, 0.93, 1.15
-0.1, -0.6,
-0.1, +1.3
0.1,-0.8,
+ 0.0, +1.2
-0.1, -0.5, -0.2, +1.4
Covar 0.98, 1.10,
0.94,1.04
0.91, 0.84, 0.87, 1.00
1.04, 1.25, 1.00, 1.07
-0.2, -0.9,
-0.2 +0.0
0.0, -1.1,
-0.1, +0.3
-0.3, -0.7, -0.4, -0.1
CovarNew 0.97, 1.14,
0.92, 1.04
0.91, 0.89, 0.86, 1.01
1.01, 1.29, 0.97, 1.07
-0.1, -0.2,
-0.1 +0.3
+0.1, -0.4, +0.1, +0.4
-0.2, -0.2, -0.2, +0.2
B50 1.02, 1.15,
0.97, 1.10
0.95, 0.95, 0.90, 1.03
1.07, 1.28, 1.02, 1.14
-0.2, -0.9
-0.2, +0.3
-0.1, -1.2,
-0.1, +0.3
-0.3, -0.6, -0.3, +0.2

October 2, 2002 October 2, 2002 a “clear” case with a sharp increasea “clear” case with a sharp increase
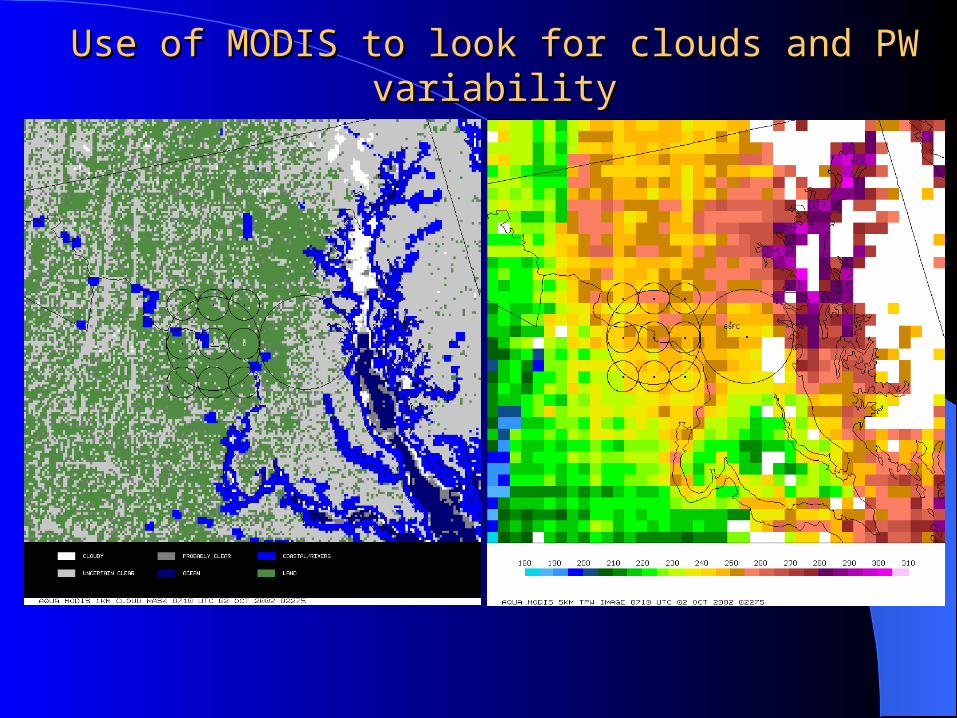
Use of MODIS to look for clouds and PW variabilityUse of MODIS to look for clouds and PW variability

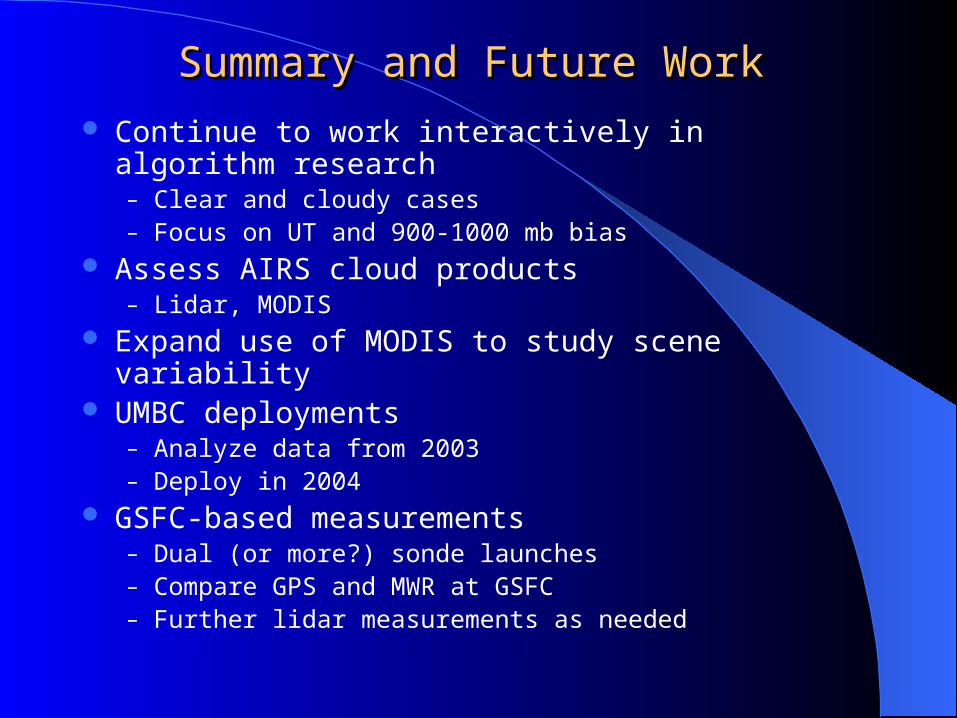
Summary and Future WorkSummary and Future Work
Continue to work interactively in algorithm research– Clear and cloudy cases– Focus on UT and 900-1000 mb bias
Assess AIRS cloud products– Lidar, MODIS
Expand use of MODIS to study scene variability UMBC deployments
– Analyze data from 2003 – Deploy in 2004
GSFC-based measurements – Dual (or more?) sonde launches– Compare GPS and MWR at GSFC– Further lidar measurements as needed

Revised Work Plan – July 2001Revised Work Plan – July 2001
L+3 to L+5– Perform validation measurements from mid-Atlantic
region during Aqua overpasses Raman Lidar water vapor/aerosols, radiosonde, GPS 26 successful measurements out of 40 possible
– Nighttime, angles > 40 degrees
Years 2 and 3– Deploy SRL to UMBC
correlated measurements of SRL, BBAERI, ALEX, radiosonde, GPS
Validation under presence of clouds Study particle size retrievals from ground based sensors

Temperature sensitivity of water vapor Raman scatteringTemperature sensitivity of water vapor Raman scattering(accepted by Appl. Opt.)(accepted by Appl. Opt.)
Simulated Raman water vapor spectrum (Avila et. al., 1999)
Simulated temperature correction curves for SRL and CARL water vapor
measurements

AFWEX (2000) Examples - IAFWEX (2000) Examples - I
0.0 0.5 1.0 1.5 2.0 2.5 3.00
1
2
3
4
5
6
7
8Nov 30, 2000, 0230 UT, AFWEX, ARM CART
SRL, 0230-0300 UT CARL, 0230-0300 UT 0230 UT Vaisala LASE, 0230-0300 UT (<0.05 deg) 0214 UT Chilled mirror (WFF)
Alt
itud
e (k
m)
Water vapor mixing ratio (g/kg)1E-3 0.01 0.1 1 100
1
2
3
4
5
6
7
8
9
10
11
12
13Nov 30, 2000, 0230 UT, AFWEX, ARM CART
SRL, 0230-0300 UT CARL, 0230-0300 UT 0230 UT Vaisala LASE, 0230-0300 UT (<0.05 deg) 0214 UT Chilled mirror (WFF)
Alt
itud
e (k
m)
Water vapor mixing ratio (g/kg)

Vaisala RS-80 H vs RS-90Vaisala RS-80 H vs RS-90
Courtesy June Wang - NCAR

Vaisala RS-80H and RS-90 – RH CorrectionsVaisala RS-80H and RS-90 – RH Corrections
Courtesy Larry Milosevich - UCAR
Estimate of the residual dry bias in RS-90s is 5-8% RH.

Sippican PW versus Sippican PW versus SuomiNet GPSSuomiNet GPS
Both slope of line and offset indicate Sippican moister– Sippican mean is 15%
moister than GPS

-50 -40 -30 -20 -10 0 10 20 30 40 500
1
2
3
4
5
6
7
8
9
10
11
12
13
SRL-MPI # poins used
SRL-MPI, 12/3,5,8,9,10, AFWEX
Alt
itud
e (k
m)
Water vapor mixing ratio difference (%)
0
1
2
3
4
5
6
7
8
9
10
11
12
13
-50 -40 -30 -20 -10 0 10 20 30 40 50
CARL-Vaisala, AFWEX, 12/3,5,7,8,9,10
CARL-Vaisala # points used
Water vapor mixing ratio difference (%)
Alt
itud
e (k
m)
0
1
2
3
4
5
6
7
8
9
10
11
12
-50 -40 -30 -20 -10 0 10 20 30 40 50
SRL-CARL, 12/3, 5, 7-10, AFWEX
SRL-CARL # of points
Water vapor mixing ratio difference (%)
Alt
itud
e (k
m)
0
1
2
3
4
5
6
7
8
9
10
11
12
-50 -40 -30 -20 -10 0 10 20 30 40 50
SRL-LASE, 12/5, 7, 9, 10, AFWEX
SRL-LASE # of points
Water vapor mixing ratio difference (%)A
ltit
ude
(km
)
0
1
2
3
4
5
6
7
8
9
10
11
12
-50 -40 -30 -20 -10 0 10 20 30 40 50
SRL-Vaisala, 12/3, 5, 7-10, AFWEX
SRL-Vaisala # of points
Water vapor mixing ratio difference (%)
Alt
itud
e (k
m)
0
1
2
3
4
5
6
7
8
9
10
11
12
-50 -40 -30 -20 -10 0 10 20 30 40 50
SRL-Chilled Mirror, 12/5, 7-10, AFWEX
SRL-Chilled Mirror # of points
Water vapor mixing ratio difference (%)
Alt
itud
e (k
m)

0 1 2 3 40
1
2
3
4
5
6
7
8Dec 5, 2000, 0330 UT, AFWEX, ARM CART
SRL, 0330-0400 UT CARL, 0330-0400 UT 0329 UT Vaisala LASE, 0330-0400 UT (<0.05 deg) MPI DIAL, 0329-0339 UT
Alt
itud
e (k
m)
Water vapor mixing ratio (g/kg)1E-3 0.01 0.1 1 100
1
2
3
4
5
6
7
8
9
10
11
12
13Dec 5, 2000, 0330 UT, AFWEX, ARM CART
SRL, 0330-0400 UT CARL, 0330-0400 UT 0329 UT Vaisala LASE, 0330-0400 UT (<0.05 deg) MPI DIAL, 0329-0339 UT
Alt
itud
e (k
m)
Water vapor mixing ratio (g/kg)

0 1 2 3 40
1
2
3
4
5
6
7
8Dec 5, 2000, 0630 UT, AFWEX, ARM CART
SRL, 0623-0652 UT CARL, 0630-0700 UT 0623 UT Vaisala LASE, 0630-0700 (<0.05 deg) 0610 UT Chilled Mirror (WFF)
Alt
itud
e (k
m)
Water vapor mixing ratio (g/kg)1E-3 0.01 0.1 1 100
1
2
3
4
5
6
7
8
9
10
11
12
13Dec 5, 2000, 0630 UT, AFWEX, ARM CART
SRL, 0623-0652 UT CARL, 0630-0700 UT 0623 UT Vaisala LASE, 0630-0700 (<0.05 deg) 0610 UT Chilled Mirror (WFF)
Alt
itud
e (k
m)
Water vapor mixing ratio (g/kg)

September 13September 13

September 20September 20

November 3November 3
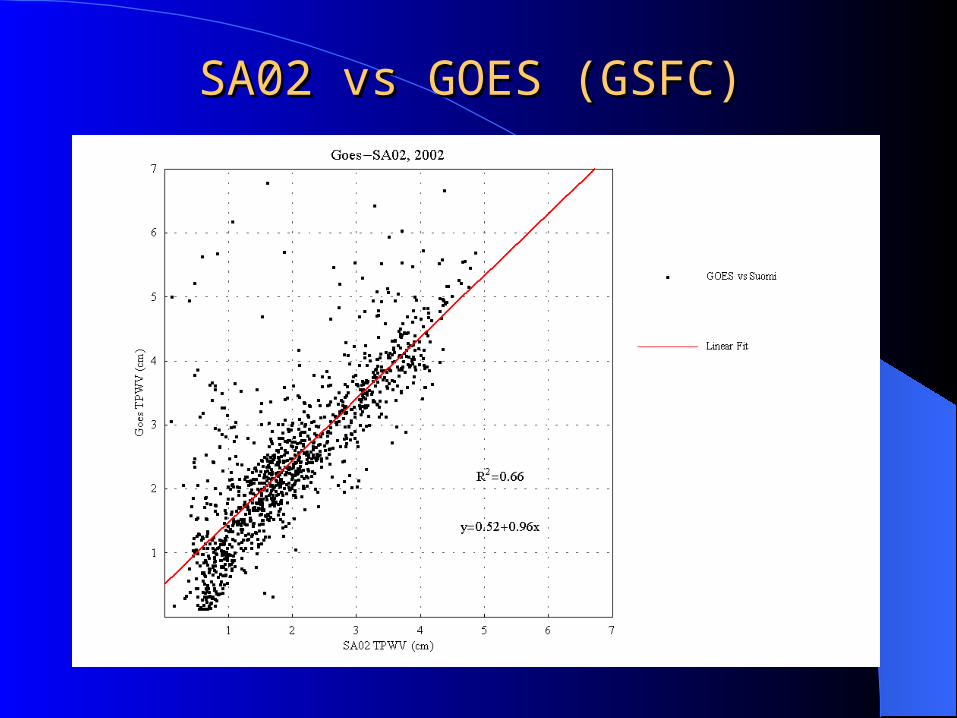
SA02 vs GOES (GSFC)SA02 vs GOES (GSFC)

SA02 vs MODIS – Near IR (GSFC)SA02 vs MODIS – Near IR (GSFC)

SA02 vs CIMEL (GSFC)SA02 vs CIMEL (GSFC)
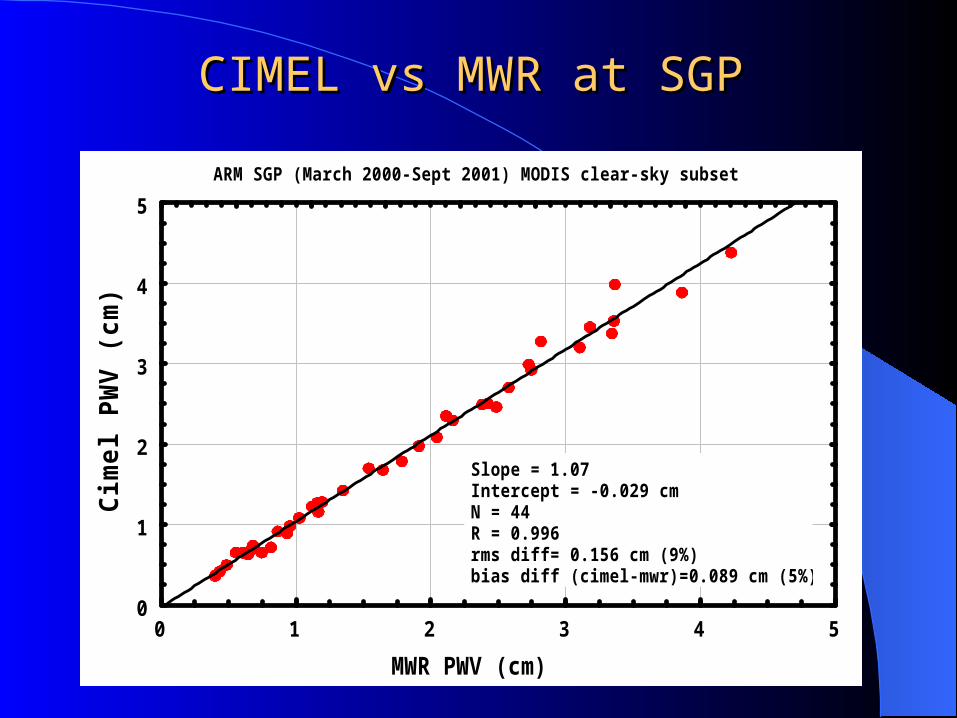
CIMEL vs MWR at SGPCIMEL vs MWR at SGP
ARM SGP (March 2000-Sept 2001) MODIS clear-sky subset
MWR PWV (cm)
Cim
el P
WV
(cm
)
0
1
2
3
4
5
0 1 2 3 4 5
Slope = 1.07Intercept = -0.029 cmN = 44R = 0.996rms diff= 0.156 cm (9%)bias diff (cimel-mwr)=0.089 cm (5%)

Good
Bad
“UT bad, mid OK”“mid trop bad”“bad”“mid trop a little bad”

% Difference (Vaisala sonde - LASE)
Alt
itu
de (
km
)
<= 1
(1,2]
(2,3]
(3,4]
(4,5]
(5,6]
(6,7]
(7,8]
(8,9]
(9,10]
(10,11]
(11,12]
-40 -30 -20 -10 0 10 20 30 40
Vaisala (corrected for calib.& temp. dep. calib. corr.)Vaisala (corrected for above + time lag)
Vaisala (uncorrected)Vaisala (scaled to MWR)
wetter than LASEdrier than LASE
LASE vs. Vaisala RS-80H Radiosondes• Uncorrected Vaisala sondes showed ~8-10% dry bias in upper troposphere• Scaling Vaisala sondes to match MWR PWV did not reduce dry bias in upper troposphere• Vaisala corrections for calibration and temp. dependent calibration reduced bias by 4-5%• Additional correction (Miloshevich) for time lag of Vaisala sondes further reduced bias by 2-3% Total of corrections to Vaisala radiosonde measurements reduced dry bias to less than 5%
Courtesy of Rich Ferrare – NASA/LaRC

LASE vs. DC-8 In situ sensors, Chilled Mirror and Sippican sondes In upper troposphere…
• Chilled Mirror sondes about 8-10% drier than LASE and Raman lidars
• DC-8 diode laser hygrometer slightly (~3% drier) than LASE and Raman lidars
• DC-8 cryogenic frost point hygrometer 10-20% drier than LASE and Raman lidars
% Difference (sensor - LASE)
Alt
itu
de
(km
)
<= 1(1,2](2,3](3,4](4,5](5,6](6,7](7,8](8,9]
(9,10](10,11](11,12]
-150 -100 -50 0 50 100 150
DC-8 In situDLHcryogenic
hygrometer
chilled mirror radiosonde
Sippican radiosonde
Courtesy of Rich Ferrare – NASA/LaRC

LASE vs. CART Raman Lidar (CARL)
• Initial (uncorrected) CARL profiles were 5-7% wetter than LASE in upper trop.• Correction for altitude dependence of CARL overlap reduced CARL values in upper trop. by ~4% LASE and CARL measurements generally within 5% on average for all altitudes
% Difference (CART Raman Lidar - LASE)
Alt
itu
de
(km
)
<= 1(1,2](2,3](3,4](4,5](5,6](6,7](7,8](8,9]
(9,10](10,11](11,12]
-50 -40 -30 -20 -10 0 10 20 30 40 50
InitialWith overlap
correction
CART Raman Lidar
Courtesy of Rich Ferrare – NASA/LaRC
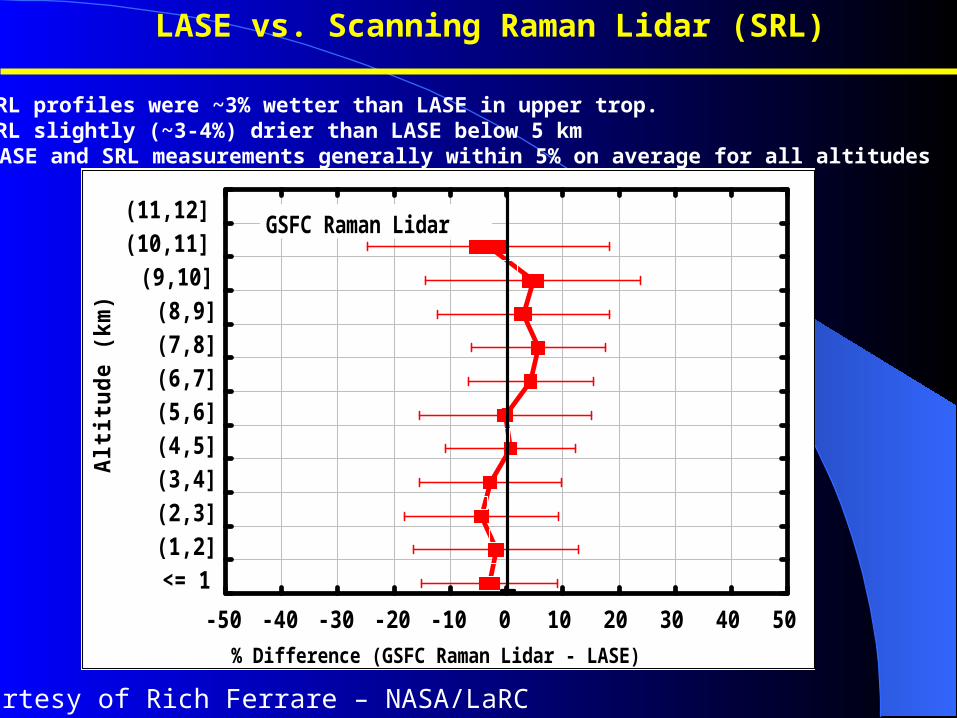
LASE vs. Scanning Raman Lidar (SRL)
• SRL profiles were ~3% wetter than LASE in upper trop.• SRL slightly (~3-4%) drier than LASE below 5 km LASE and SRL measurements generally within 5% on average for all altitudes
% Difference (GSFC Raman Lidar - LASE)
Alt
itu
de
(km
)
<= 1(1,2](2,3](3,4](4,5](5,6](6,7](7,8](8,9]
(9,10](10,11](11,12]
-50 -40 -30 -20 -10 0 10 20 30 40 50
GSFC Raman Lidar
Courtesy of Rich Ferrare – NASA/LaRC

AFWEX (2000) Examples - IIIAFWEX (2000) Examples - III
0 1 2 3 40
1
2
3
4
5
6
7
8Dec 5, 2000, 0630 UT, AFWEX, ARM CART
SRL, 0623-0652 UT CARL, 0630-0700 UT 0623 UT Vaisala LASE, 0630-0700 (<0.05 deg) 0610 UT Chilled Mirror (WFF)
Alt
itud
e (k
m)
Water vapor mixing ratio (g/kg)1E-3 0.01 0.1 1 100
1
2
3
4
5
6
7
8
9
10
11
12
13Dec 5, 2000, 0630 UT, AFWEX, ARM CART
SRL, 0623-0652 UT CARL, 0630-0700 UT 0623 UT Vaisala LASE, 0630-0700 (<0.05 deg) 0610 UT Chilled Mirror (WFF)
Alt
itud
e (k
m)
Water vapor mixing ratio (g/kg)

AFWEX(2000) AFWEX(2000) Examples – IVExamples – IV
0 1 2 3 4 50
1
2
3
4
5
6
7
8Dec 8, 2000, 0230 UT, AFWEX, ARM CART
SRL, 0228-0257 UT CARL, 0230-0300 UT 0228 UT Vaisala MPI DIAL, 0226-0236 UT
Alt
itud
e (k
m)
Water vapor mixing ratio (g/kg)1E-3 0.01 0.1 1 100
1
2
3
4
5
6
7
8
9
10
11
12
13Dec 8, 2000, 0230 UT, AFWEX, ARM CART
SRL, 0228-0257 UT CARL, 0230-0300 UT 0228 UT Vaisala MPI DIAL, 0226-0236 UT
Alt
itud
e (k
m)
Water vapor mixing ratio (g/kg)

AFWEX – Profile SummariesAFWEX – Profile Summaries
0
1
2
3
4
5
6
7
8
9
10
11
12
-50 -40 -30 -20 -10 0 10 20 30 40 50
SRL-CARL, 12/3, 5, 7-10, AFWEX
SRL-CARL # of points
Water vapor mixing ratio difference (%)
Alt
itud
e (k
m)
0
1
2
3
4
5
6
7
8
9
10
11
12
-50 -40 -30 -20 -10 0 10 20 30 40 50
SRL-Vaisala, 12/3, 5, 7-10, AFWEX
SRL-Vaisala # of points
Water vapor mixing ratio difference (%)
Alt
itud
e (k
m)
1) SRL/CARL agreement within +/- 5% from 1-10 km (no low channel in SRL). SRL tends toward being moister than CARL above 10km and below 2 km.
2) SRL/LASE shows moist bias of LASE in lowest 2 km, dry bias above 6 km.3) SRL/Vaisala show increasing dry bias of sonde above 5 km
0
1
2
3
4
5
6
7
8
9
10
11
12
-50 -40 -30 -20 -10 0 10 20 30 40 50
SRL-LASE, 12/5, 7, 9, 10, AFWEX
SRL-LASE # of points
Water vapor mixing ratio difference (%)
Alt
itud
e (k
m)

SRL vs Sippican Mean ComparisonSRL vs Sippican Mean Comparison

SRL vs Sippican (Sept. 5)SRL vs Sippican (Sept. 5)
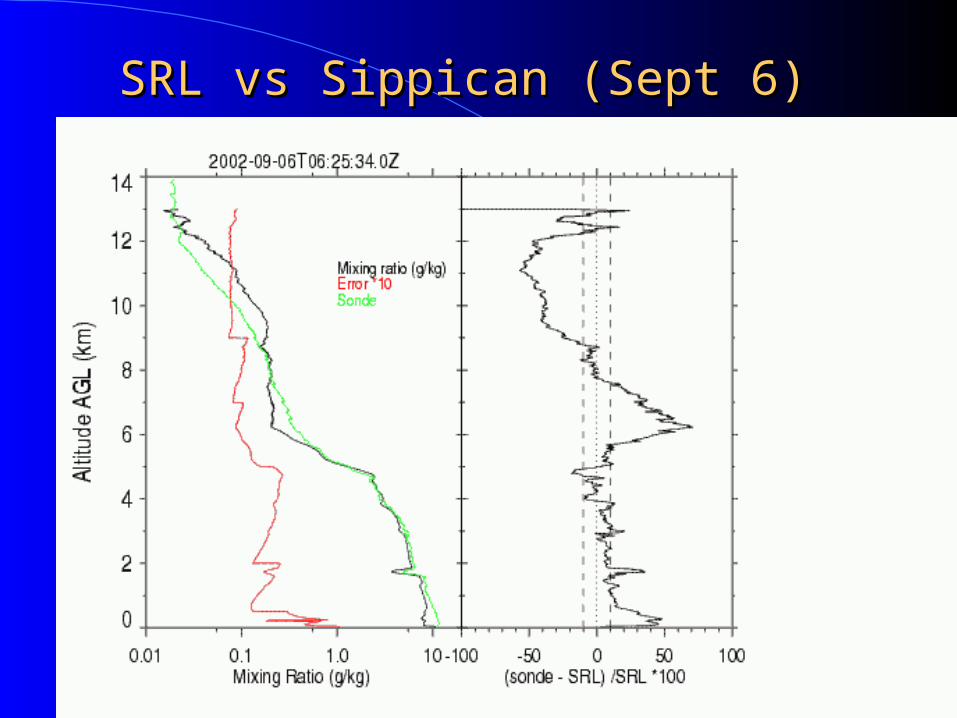
SRL vs Sippican (Sept 6)SRL vs Sippican (Sept 6)
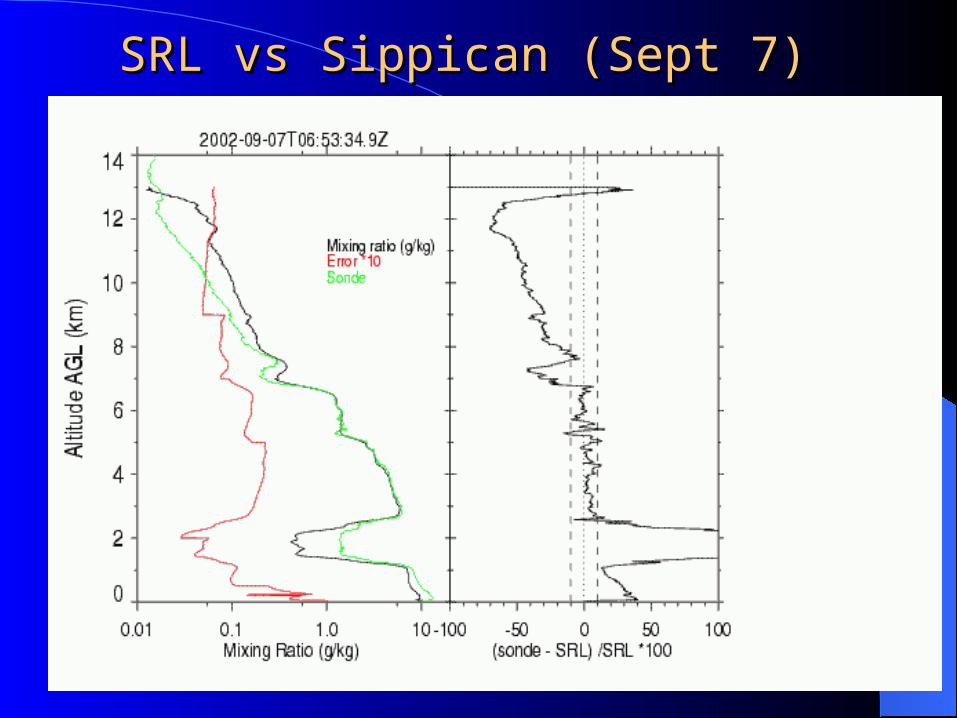
SRL vs Sippican (Sept 7)SRL vs Sippican (Sept 7)