measuring turbulence with lidars - windpower turbulence with lidars experiences from the technical...
TRANSCRIPT

Measuring Turbulence with Lidars
Experiences from the Technical University of Denmark, Wind Energy Department
A. Sathe
DTU Wind Energy

Outline
• Introduction
• Turbulence Measurements – Commercial Lidars
• Turbulence Measurements – WindScanners
• Summary
2 Risø DTU Lidar Turbulence 28.05.2015

Outline
• Introduction
• Turbulence Measurements – Commercial Lidars
• Turbulence Measurements – WindScanners
• Summary
2 Risø DTU Lidar Turbulence 28.05.2015

Outline
• Introduction
• Turbulence Measurements – Commercial Lidars
• Turbulence Measurements – WindScanners
• Summary
2 Risø DTU Lidar Turbulence 28.05.2015

Outline
• Introduction
• Turbulence Measurements – Commercial Lidars
• Turbulence Measurements – WindScanners
• Summary
2 Risø DTU Lidar Turbulence 28.05.2015

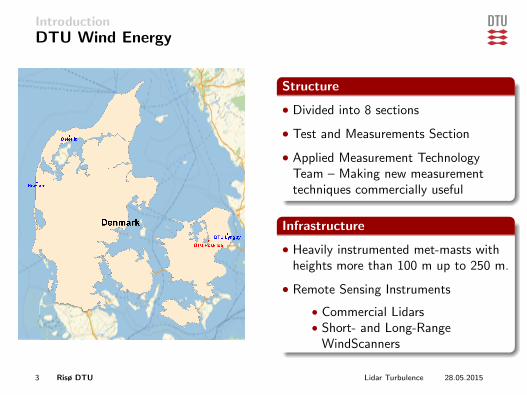
IntroductionDTU Wind Energy
Structure
• Divided into 8 sections
• Test and Measurements Section
• Applied Measurement TechnologyTeam – Making new measurementtechniques commercially useful
Infrastructure
• Heavily instrumented met-masts withheights more than 100 m up to 250 m.
• Remote Sensing Instruments
• Commercial Lidars• Short- and Long-Range
WindScanners
3 Risø DTU Lidar Turbulence 28.05.2015

IntroductionTest Site Details
Site Layout
northings[km]
eastings [km]446 447 448 449 450 451
6254
6255
6256
6257
NorthSea
NissumFjord
Bøvlingbjerg
main house
met mast
Høvsøre
Denmark
North
Sea
7oE 8oE 9oE 10oE 11oE 12oE 13oE 30’
55oN
30’
56oN
30’
57oN
30’
58oN
0 100 200 300 km
Met-Mast DetailsTen years of wind-power meteorology at Høvsøre 7
Figure 2. Sketch of the Høvsøre meteorological mast and its instrumentation
as those on the met mast. These measurements can be used to vertically191
‘extend’ those at the met mast, as for the rather homogeneous easterly192
winds the observations are not affected by the wakes of the turbines193
(Gryning et al., 2007; Pena et al., 2010c; Pena et al., 2010a; Pena et al.,194
2010b).195
Hovsore_paper.tex; 9/03/2015; 9:47; p.7
4 Risø DTU Lidar Turbulence 28.05.2015

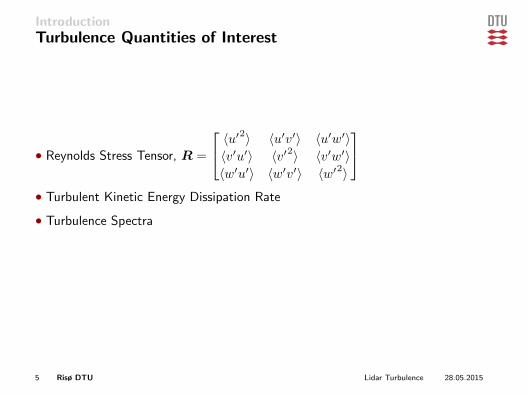
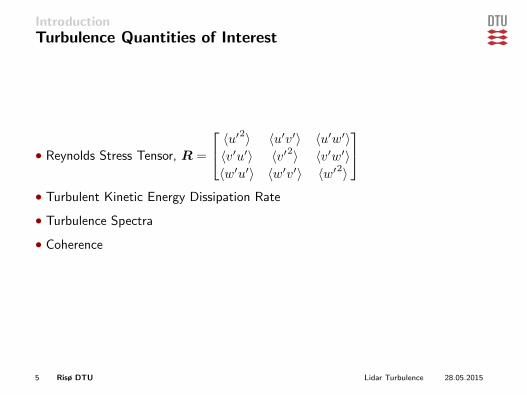
IntroductionTurbulence Quantities of Interest
• Reynolds Stress Tensor, R =
〈u′2〉 〈u′v′〉 〈u′w′〉〈v′u′〉 〈v′2〉 〈v′w′〉〈w′u′〉 〈w′v′〉 〈w′2〉
• Turbulent Kinetic Energy Dissipation Rate
• Turbulence Spectra
• Coherence
5 Risø DTU Lidar Turbulence 28.05.2015

IntroductionTurbulence Quantities of Interest
• Reynolds Stress Tensor, R =
〈u′2〉 〈u′v′〉 〈u′w′〉〈v′u′〉 〈v′2〉 〈v′w′〉〈w′u′〉 〈w′v′〉 〈w′2〉
• Turbulent Kinetic Energy Dissipation Rate
• Turbulence Spectra
• Coherence
5 Risø DTU Lidar Turbulence 28.05.2015

IntroductionTurbulence Quantities of Interest
• Reynolds Stress Tensor, R =
〈u′2〉 〈u′v′〉 〈u′w′〉〈v′u′〉 〈v′2〉 〈v′w′〉〈w′u′〉 〈w′v′〉 〈w′2〉
• Turbulent Kinetic Energy Dissipation Rate
• Turbulence Spectra
• Coherence
5 Risø DTU Lidar Turbulence 28.05.2015
IntroductionTurbulence Quantities of Interest
• Reynolds Stress Tensor, R =
〈u′2〉 〈u′v′〉 〈u′w′〉〈v′u′〉 〈v′2〉 〈v′w′〉〈w′u′〉 〈w′v′〉 〈w′2〉
• Turbulent Kinetic Energy Dissipation Rate
• Turbulence Spectra
• Coherence
5 Risø DTU Lidar Turbulence 28.05.2015
IntroductionTurbulence Quantities of Interest
• Reynolds Stress Tensor, R =
〈u′2〉 〈u′v′〉 〈u′w′〉〈v′u′〉 〈v′2〉 〈v′w′〉〈w′u′〉 〈w′v′〉 〈w′2〉
• Turbulent Kinetic Energy Dissipation Rate
• Turbulence Spectra
• Coherence
5 Risø DTU Lidar Turbulence 28.05.2015

IntroductionTurbulence Quantities of Interest
• Reynolds Stress Tensor, R =
〈u′2〉 〈u′v′〉 〈u′w′〉〈v′u′〉 〈v′2〉 〈v′w′〉〈w′u′〉 〈w′v′〉 〈w′2〉
• Turbulent Kinetic Energy Dissipation Rate
• Turbulence Spectra
• Coherence
5 Risø DTU Lidar Turbulence 28.05.2015

IntroductionCommercial Lidar Scanning Configurations
Conically Scanning
1006020x1 (m)-20
lidar
-60-100-100
-50
0
x2(m
)
50
40
20
60
0
80
100
100
x3(m
)
Doppler Beam Swinging
10050
x1 (m)0
lidar
-50-100
-100
-50
0
x2(m
)50
60
80
100
20
0
40
100
x3
(m)
6 Risø DTU Lidar Turbulence 28.05.2015

IntroductionCommercial Lidar Scanning Configurations
Conically Scanning
1006020x1 (m)-20
lidar
-60-100-100
-50
0
x2(m
)
50
40
20
60
0
80
100
100
x3(m
)
Doppler Beam Swinging
10050
x1 (m)0
lidar
-50-100
-100
-50
0
x2(m
)50
60
80
100
20
0
40
100
x3
(m)
6 Risø DTU Lidar Turbulence 28.05.2015

IntroductionCommercial Lidar Scanning Configurations
Conically Scanning
1006020x1 (m)-20
lidar
-60-100-100
-50
0
x2(m
)
50
40
20
60
0
80
100
100
x3(m
)
Doppler Beam Swinging
10050
x1 (m)0
lidar
-50-100
-100
-50
0
x2(m
)50
60
80
100
20
0
40
100
x3
(m)
6 Risø DTU Lidar Turbulence 28.05.2015
IntroductionMeasuring with WindScanners
Six-Beam Scanning
10050
x1 (m)0
lidar
-50-100
-100
-50
0
x2(m
)
50
80
100
40
20
0
60
100
x3
(m)
Triple Lidar System
10050
lidar1lidar1lidar1
x1 (m)0
lidar2lidar2lidar2
-50
lidar3lidar3lidar3
-100-100
-50
0
x2(m
)50
60
80
100
0
20
40
100
x3
(m)
7 Risø DTU Lidar Turbulence 28.05.2015

IntroductionMean Wind Speed Measurements
Commercial Lidar
usonic (m/s)0 2 4 6 8 10 12 14 16 18 20
ulidar
(m/s
)
0
2
4
6
8
10
12
14
16
18
20ulidar = 0:99 usonic
R2 = 0:99867
WindScanners
ucup (m/s)0 2 4 6 8 10 12 14 16
ulidar
(m/s
)
0
2
4
6
8
10
12
14
16
ulidar = 1 ucup
R2 = 0:99926
8 Risø DTU Lidar Turbulence 28.05.2015

IntroductionTurbulence Measurements
u0 2cup (m2=s2)0 0.5 1 1.5 2 2.5
u0
2lidar
(m2=s
2)
0
0.5
1
1.5
2
2.5 u0 2lidar = 0:69 u0 2cup
R2 = 0:93141
u0 2cup (m2=s2)0 0.2 0.4 0.6 0.8 1 1.2 1.4 1.6 1.8 2
u0
2lidar
(m2=s
2)
0
0.2
0.4
0.6
0.8
1
1.2
1.4
1.6
1.8
2
u0 2lidar = 0:66 u0 2cup
R2 = 0:79534
9 Risø DTU Lidar Turbulence 28.05.2015

Turbulence Measurements – Commercial LidarsContinuous Wave Lidar – e.g. ZephIR
Velocity Azimuth Display VAD
hu02ilidar=hu02isonic
0 0.2 0.4 0.6 0.8 1 1.2 1.4 1.6 1.8 2
heig
ht (
m)
30
40
50
60
70
80
90
100
110
unstableneutralstable
10 Risø DTU Lidar Turbulence 28.05.2015
1006020x1 (m)-20
lidar
-60-100-100
-50
0
x2(m
)
50
40
20
60
0
80
100
100
x3(m
)

Turbulence Measurements – Commercial LidarsPulsed Lidar – e.g. WindCube
Doppler Beam Swinging
hu02ilidar=hu02isonic
0 0.2 0.4 0.6 0.8 1 1.2 1.4 1.6 1.8 2
heig
ht (
m)
30
40
50
60
70
80
90
100
110unstableneutralstable
11 Risø DTU Lidar Turbulence 28.05.2015
10050
x1 (m)0
lidar
-50-100
-100
-50
0
x2(m
)
50
60
80
100
20
0
40
100
x3
(m)
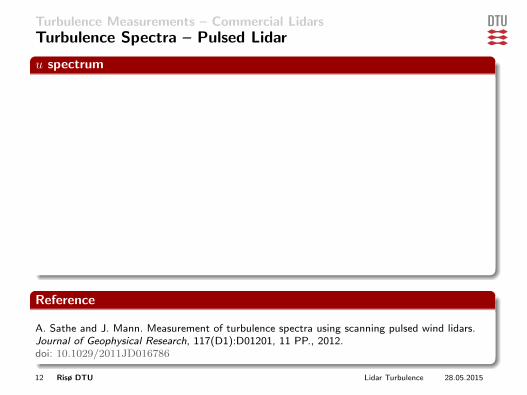
Turbulence Measurements – Commercial LidarsTurbulence Spectra – Pulsed Lidar
u spectrum
f (Hz)
10−3
10−2
10−1
10−2
10−1
k1 (m−1)
k1Fu(k
1)(m
2/s2)
10−3 10−2 10−1
Reference
A. Sathe and J. Mann. Measurement of turbulence spectra using scanning pulsed wind lidars.Journal of Geophysical Research, 117(D1):D01201, 11 PP., 2012.doi: 10.1029/2011JD016786
12 Risø DTU Lidar Turbulence 28.05.2015

Turbulence Measurements – Commercial LidarsOngoing Research To Correct Systematic Errors in TurbulenceMeasurements from Commercial Lidars
Model
SLEMT model – Systematic Lidar Error in Measuring Turbulence model
Project Goal
Devise a method using the ’SLEMT’ model such that they can be used asstandalone instruments to measure turbulence and estimate the uncertainty.
Reference
A. Sathe, J. Mann, J. Gottschall, and M S. Courtney. Can wind lidars measure turbulence?Journal of Atmospheric and Oceanic Technology, 28(7):853–868, 2011.doi: 10.1175/JTECH-D-10-05004.1
13 Risø DTU Lidar Turbulence 28.05.2015

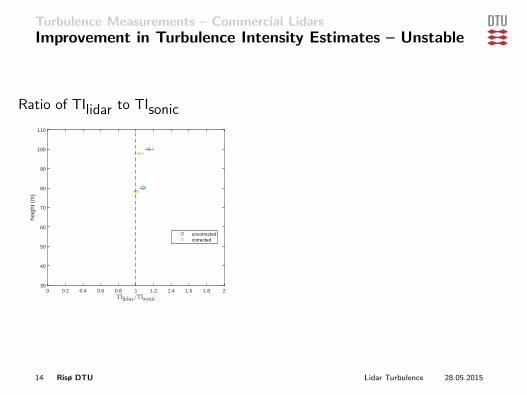
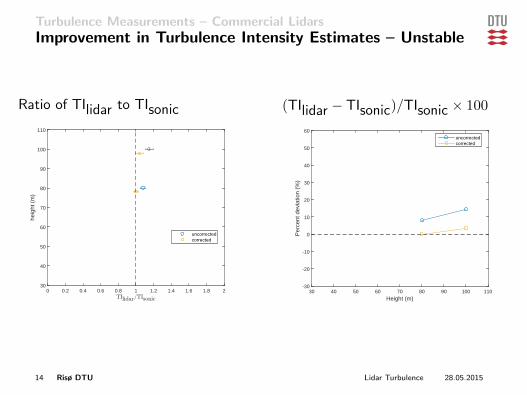
Turbulence Measurements – Commercial LidarsImprovement in Turbulence Intensity Estimates – Unstable
Ratio of TIlidar to TIsonic
TIlidar=TIsonic
0 0.2 0.4 0.6 0.8 1 1.2 1.4 1.6 1.8 2
heig
ht (
m)
30
40
50
60
70
80
90
100
110
uncorrectedcorrected
(TIlidar − TIsonic)/TIsonic × 100
Height (m)30 40 50 60 70 80 90 100 110
Per
cent
dev
iatio
n (%
)
-30
-20
-10
0
10
20
30
40
50
60uncorrectedcorrected
14 Risø DTU Lidar Turbulence 28.05.2015
Turbulence Measurements – Commercial LidarsImprovement in Turbulence Intensity Estimates – Stable
Ratio of TIlidar to TIsonic
TIlidar=TIsonic
0 0.2 0.4 0.6 0.8 1 1.2 1.4 1.6 1.8 2
heig
ht (
m)
30
40
50
60
70
80
90
100
110
uncorrectedcorrected
(TIlidar − TIsonic)/TIsonic × 100
Height (m)30 40 50 60 70 80 90 100 110
Per
cent
dev
iatio
n (%
)
-30
-20
-10
0
10
20
30
40
50
60uncorrectedcorrected
15 Risø DTU Lidar Turbulence 28.05.2015

Turbulence Measurements – WindScannersSix-Beam vs VAD Method
Six-Beam Method
u0 2cup (m2=s2)0 0.5 1 1.5 2 2.5
u0
2lidar
(m2=s
2)
0
0.5
1
1.5
2
2.5 u0 2lidar = 0:87 u0 2cup
R2 = 0:95732
Velocity Azimuth Display (VAD)Method
u0 2cup (m2=s2)0 0.5 1 1.5 2 2.5
u0
2lidar
(m2=s
2)
0
0.5
1
1.5
2
2.5 u0 2lidar = 0:69 u0 2cup
R2 = 0:93141
A. Sathe, J. Mann, N. Vasiljevic, and G. Lea. A six-beam method to measure turbulencestatistics using ground-based wind lidars.Atmospheric Measurement Techniques, 8(2):729–740, 2015.doi: 10.5194/amt-8-729-2015
16 Risø DTU Lidar Turbulence 28.05.2015
10050
x1 (m)0
lidar
-50-100
-100
-50
0
x2(m
)
50
80
100
40
20
0
60
100
x3
(m)
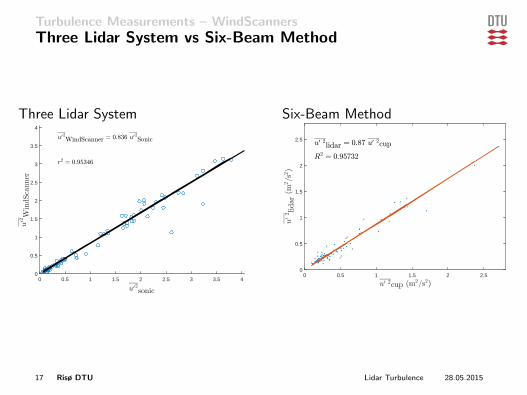
Turbulence Measurements – WindScannersThree Lidar System vs Six-Beam Method
Three Lidar System
u02sonic
0 0.5 1 1.5 2 2.5 3 3.5 4
u02W
indSca
nner
0
0.5
1
1.5
2
2.5
3
3.5
4
u02WindScanner = 0:836 u02
Sonic
r2 = 0:95346
Six-Beam Method
u0 2cup (m2=s2)0 0.5 1 1.5 2 2.5
u0
2lidar
(m2=s
2)
0
0.5
1
1.5
2
2.5 u0 2lidar = 0:87 u0 2cup
R2 = 0:95732
17 Risø DTU Lidar Turbulence 28.05.2015

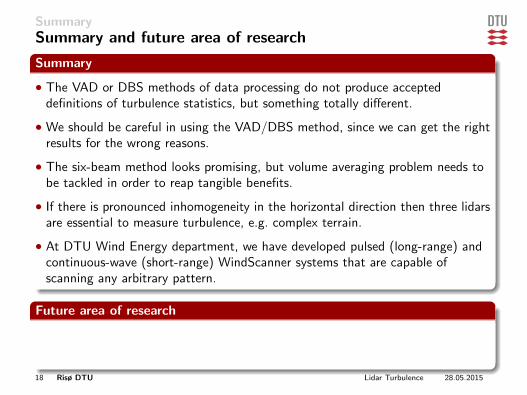
SummarySummary and future area of research
Summary
• The VAD or DBS methods of data processing do not produce accepteddefinitions of turbulence statistics, but something totally different.
• We should be careful in using the VAD/DBS method, since we can get the rightresults for the wrong reasons.
• The six-beam method looks promising, but volume averaging problem needs tobe tackled in order to reap tangible benefits.
• If there is pronounced inhomogeneity in the horizontal direction then three lidarsare essential to measure turbulence, e.g. complex terrain.
• At DTU Wind Energy department, we have developed pulsed (long-range) andcontinuous-wave (short-range) WindScanner systems that are capable ofscanning any arbitrary pattern.
Future area of research
• Tackling the probe-volume problem of lidars
• Measuring small-scale turbulence with lidars
18 Risø DTU Lidar Turbulence 28.05.2015

Thank [email protected]

A. Sathe and J. Mann. Measurement of turbulence spectra using scanningpulsed wind lidars. Journal of Geophysical Research, 117(D1):D01201,11 PP., 2012. doi: 10.1029/2011JD016786.
A. Sathe, J. Mann, J. Gottschall, and M S. Courtney. Can wind lidarsmeasure turbulence? Journal of Atmospheric and Oceanic Technology,28(7):853–868, 2011. doi: 10.1175/JTECH-D-10-05004.1.
A. Sathe, J. Mann, N. Vasiljevic, and G. Lea. A six-beam method tomeasure turbulence statistics using ground-based wind lidars.Atmospheric Measurement Techniques, 8(2):729–740, 2015. doi:10.5194/amt-8-729-2015.
19 Risø DTU Lidar Turbulence 28.05.2015