wind noise and atmospheric turbulence march 20, 2007
DESCRIPTION
Wind Noise and Atmospheric Turbulence March 20, 2007. NASA – Visible Earth, Madeira Island (visibleearth.nasa.gov). What is wind noise?. Not sound Very local pressure fluctuations Low frequency. How do windscreens work?. Long standing theory due to Phelps (1930’s) - PowerPoint PPT PresentationTRANSCRIPT

Wind Noise and Atmospheric Turbulence
March 20, 2007
NASA – Visible Earth, Madeira Island (visibleearth.nasa.gov)

What is wind noise?
• Not sound
• Very local pressure fluctuations
• Low frequency

How do windscreens work?
• Long standing theory due to Phelps (1930’s)
• Bernoulli equation holds:• At low frequencies velocity variations produce pressure fluctuations,
distributed just like the steady pressure• Pressure measured at the center is average of surface pressures
20 21 vpp
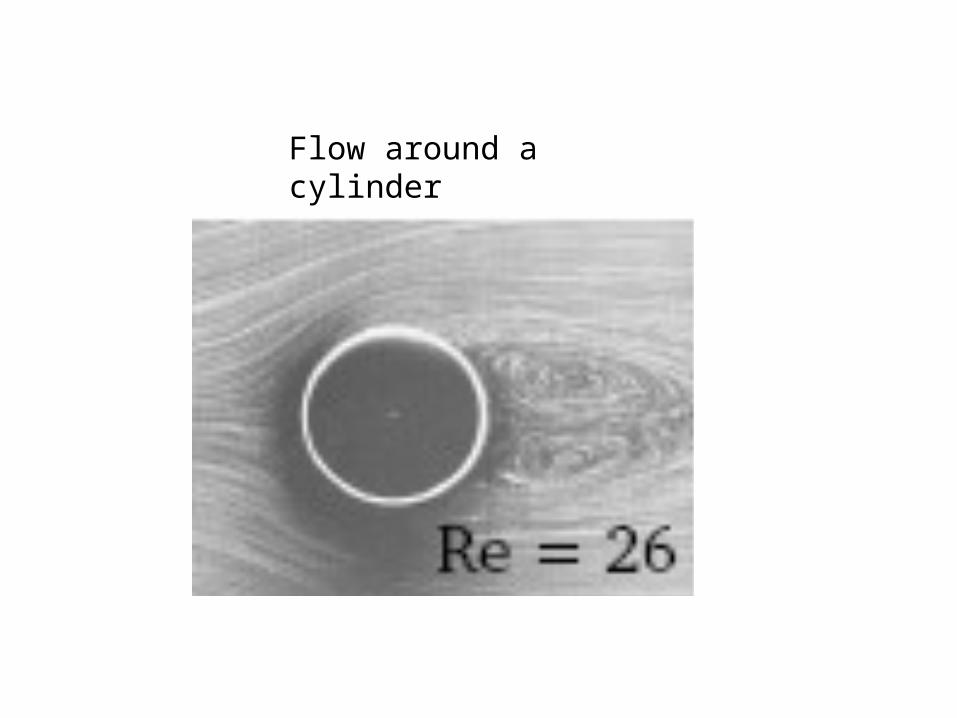
Flow around a cylinder
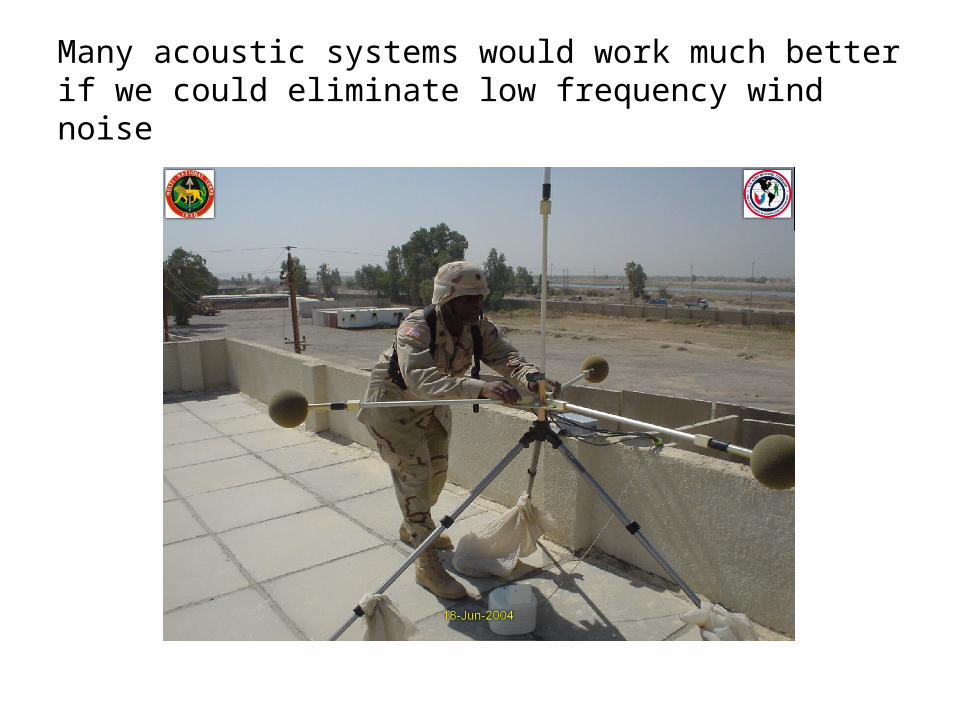
Many acoustic systems would work much better if we could eliminate low frequency wind noise

Elephant
http://fohn.net/elephant-pictures-facts/
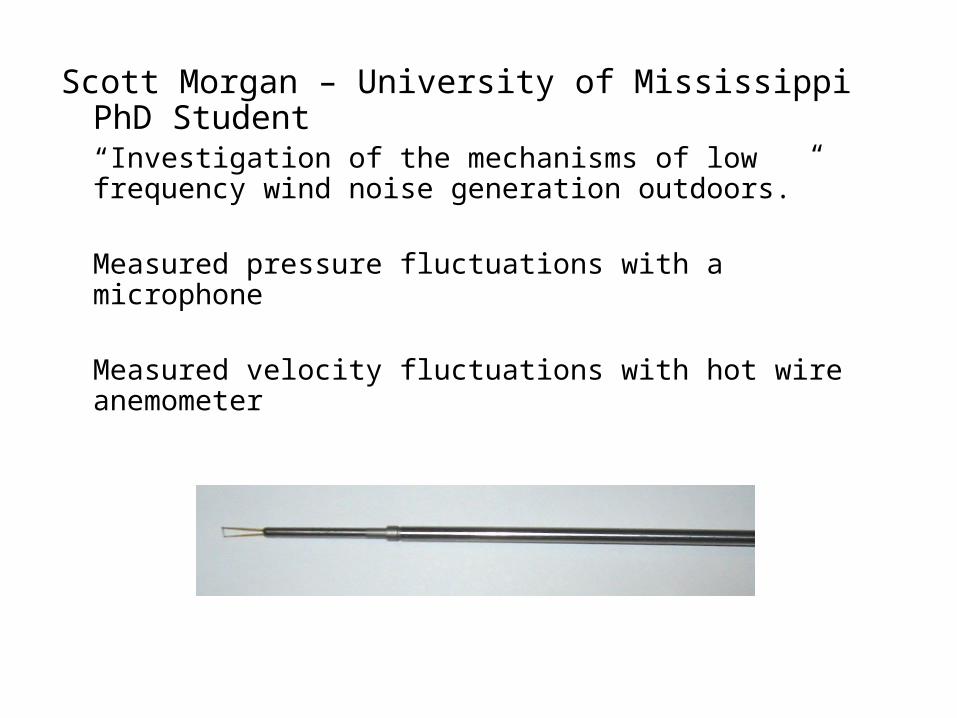
Scott Morgan – University of Mississippi PhD Student“Investigation of the mechanisms of low frequency wind noise generation outdoors.”
Measured pressure fluctuations with a microphone
Measured velocity fluctuations with hot wire anemometer

Wind velocity measurement along one direction
0 100 200 300 400 500 600 700 800 900-5
0
5
10
Time (s)
Vel
ocity
(m
/s)

Scott’s findings
• Found that the pressure fluctuations depend directly on the wind velocity fluctuations U and average wind speed V
• Wind noise depends on the wind screen and atmospheric turbulence

Atmospheric Turbulence
Now we need to understandMeteorology
and
Fluid Dynamics
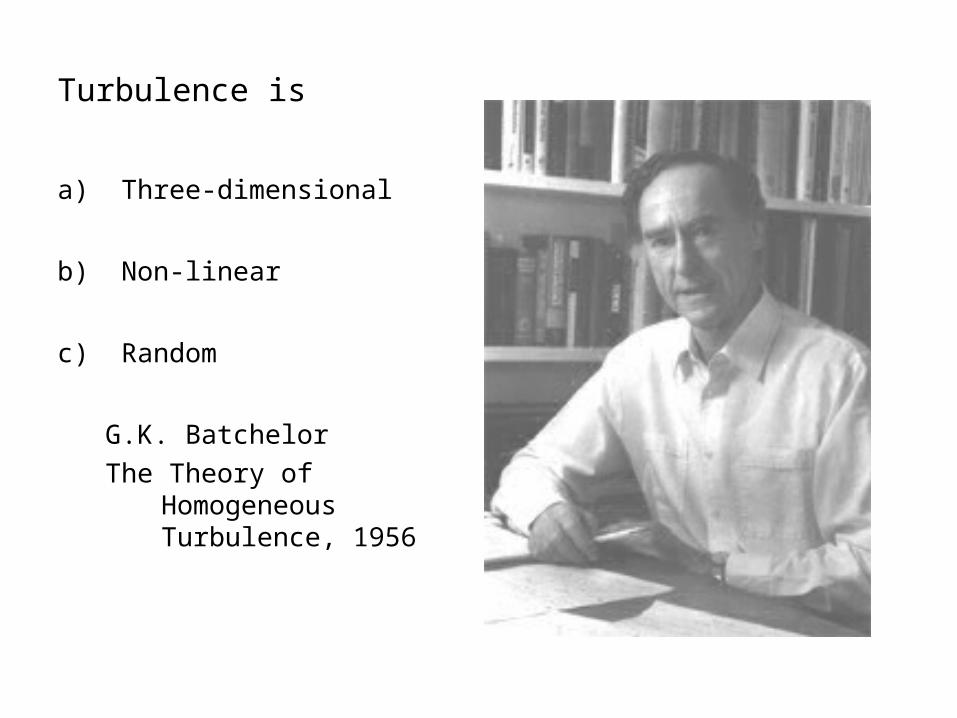
Turbulence is
a) Three-dimensional
b) Non-linear
c) Random
G.K. Batchelor
The Theory of Homogeneous Turbulence, 1956

Need additional mathematical tools to analyze atmospheric turbulence
Non-Linear and Random – Don’t get the same velocity field
when you repeat an experiment
I. Fourier analysis
II. Correlations

I. Fourier Analysis
Sine waves have two attributes, Frequency and Amplitude
0 500 1000 1500 2000-10
-5
0
5
10
Time
Period = 1/Frequency
Amplitude
Any
Wav
e A
mpl
itude
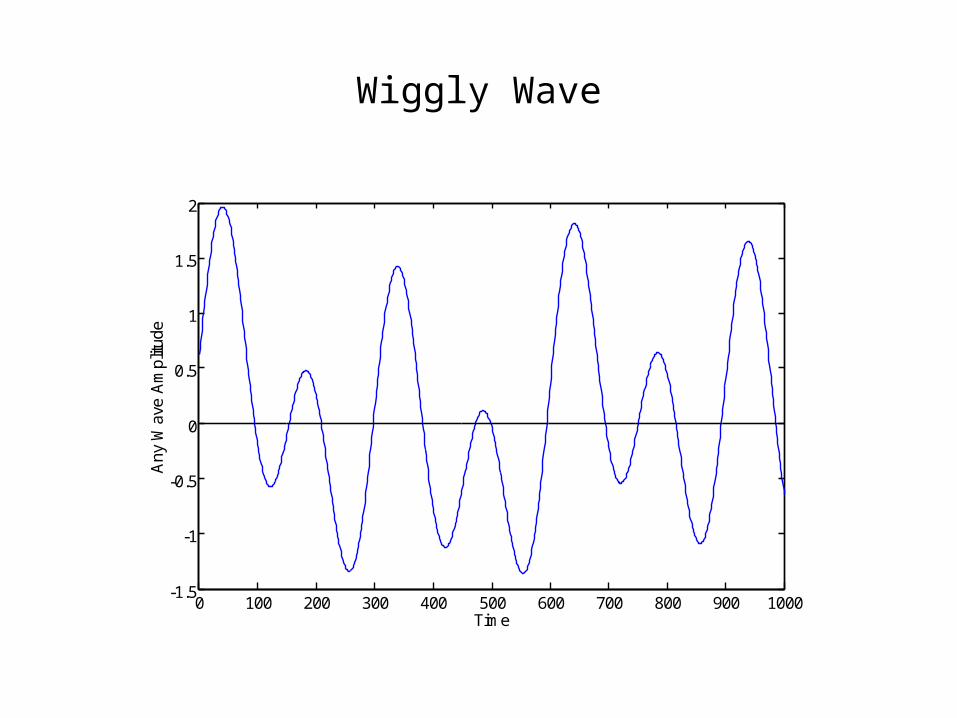
Wiggly Wave
0 100 200 300 400 500 600 700 800 900 1000-1.5
-1
-0.5
0
0.5
1
1.5
2
Time
Any
Wav
e A
mpl
itude

Fourier showed that any wave can be written as a sum of different sine waves
0 100 200 300 400 500 600 700 800 900 1000
-1
-0.5
0
0.5
1
Time
Am
plitu
de
0 100 200 300 400 500 600 700 800 900 1000-2
-1
0
1
2
Time
Am
plitu
de

Simple Fourier Spectrum

Apply Fourier analysis to atmospheric turbulence
0 100 200 300 400 500 600 700 800 900-5
0
5
10
Time (s)
Ve
loci
ty (
m/s
)
0 100 200 300 400 500 600 700 800 900-5
0
5
10
Time (s)
Ve
loci
ty (
m/s
)
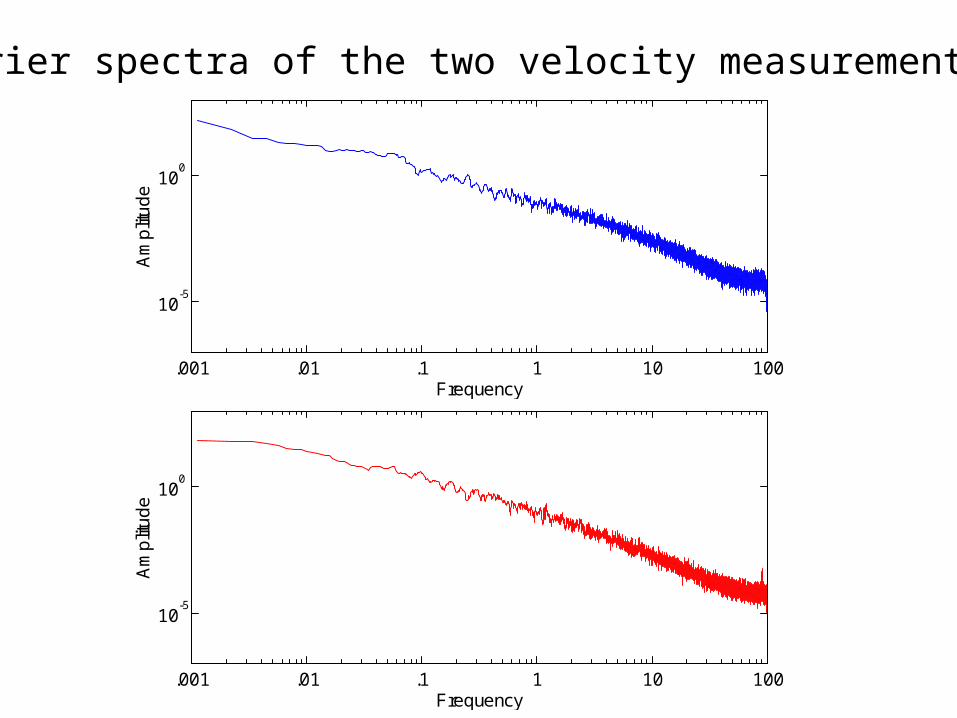
Two wind velocity measurements at the university airport taken approximately 30 min apart.
.001 .01 .1 1 10 100
10-5
100
Frequency
Am
plit
ud
e
.001 .01 .1 1 10 100
10-5
100
Frequency
Am
plit
ud
e
Fourier spectra of the two velocity measurements.

Atmospheric Turbulence
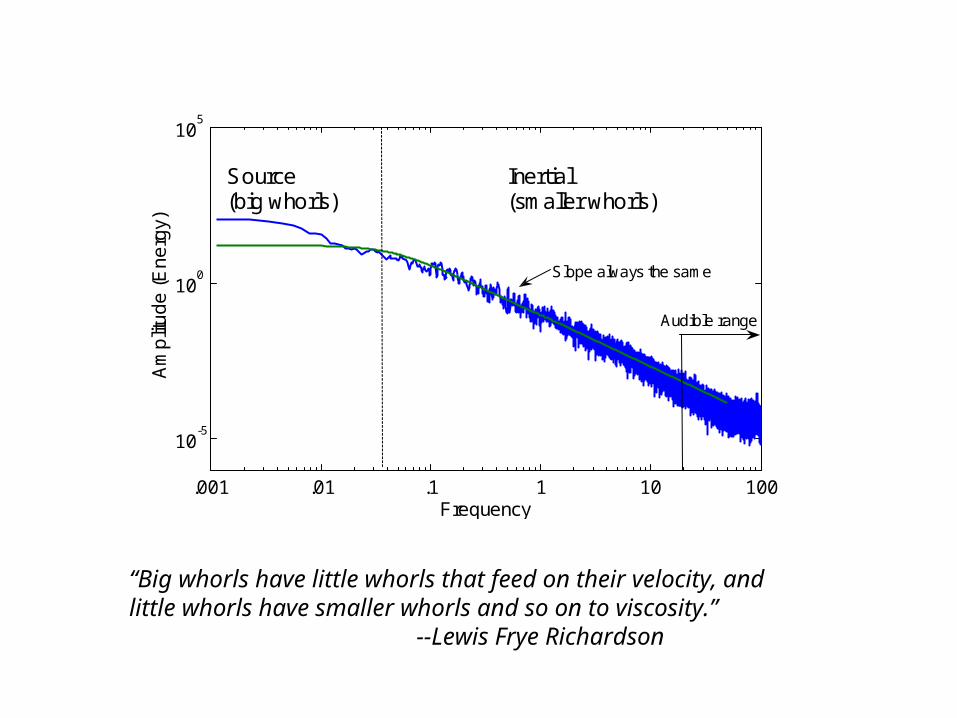
“Big whorls have little whorls that feed on their velocity, and little whorls have smaller whorls and so on to viscosity.”
--Lewis Frye Richardson
.001 .01 .1 1 10 100
10-5
100
105
Frequency
Am
plit
ud
e (
En
erg
y)Source(big whorls)
Inertial(smaller whorls)
Slope always the same
Audible range

II. Correlations
A correlation is a measure of how alike two velocity or pressure measurements are.
Rule:Corr = +1 Data sets have same shape
(can be different sizes)
Corr = 0.5 Some similarity
Corr = 0 Data sets randomly related
Corr = -1 Data sets have same shape, but inverted.

0 20 40 60 80 100-20
0
20
0 20 40 60 80 100-20
-10
0
10
0 20 40 60 80 100-5
0
5
10
0 20 40 60 80 100-5
0
5
10
Corr = ?
Corr = ?
Corr = ?
Corr = ?
Rules:
SameCorr = 1
Similar:Corr = 0.5
Random:Corr = 0.0
Inverted:Corr = -1
Let’s train your neural network
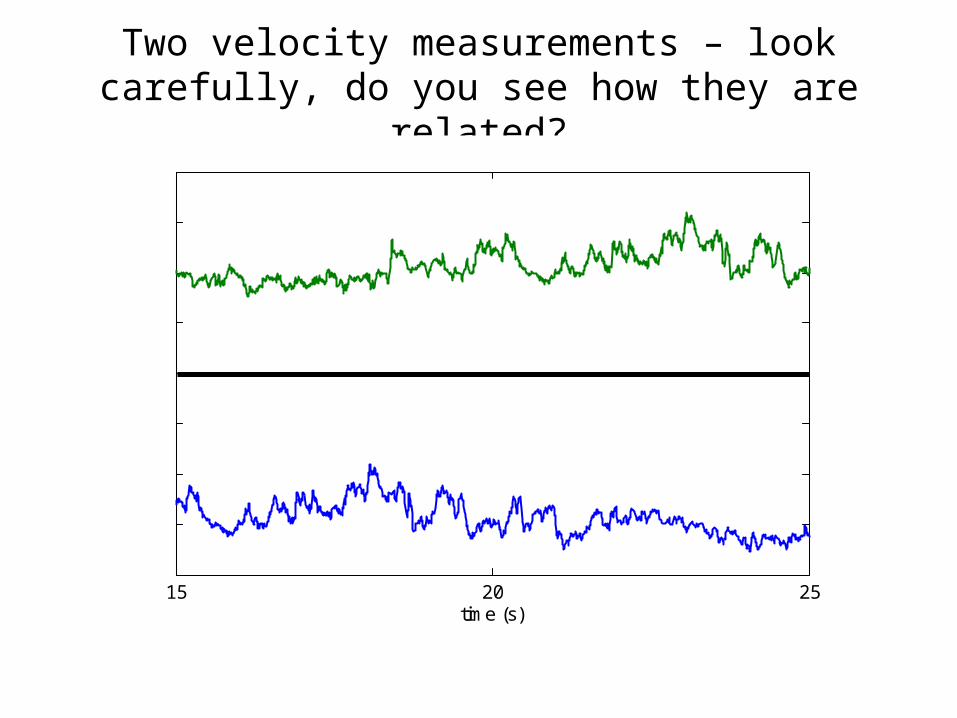
Two velocity measurements – look carefully, do you see how they are related?
15 20 25time (s)
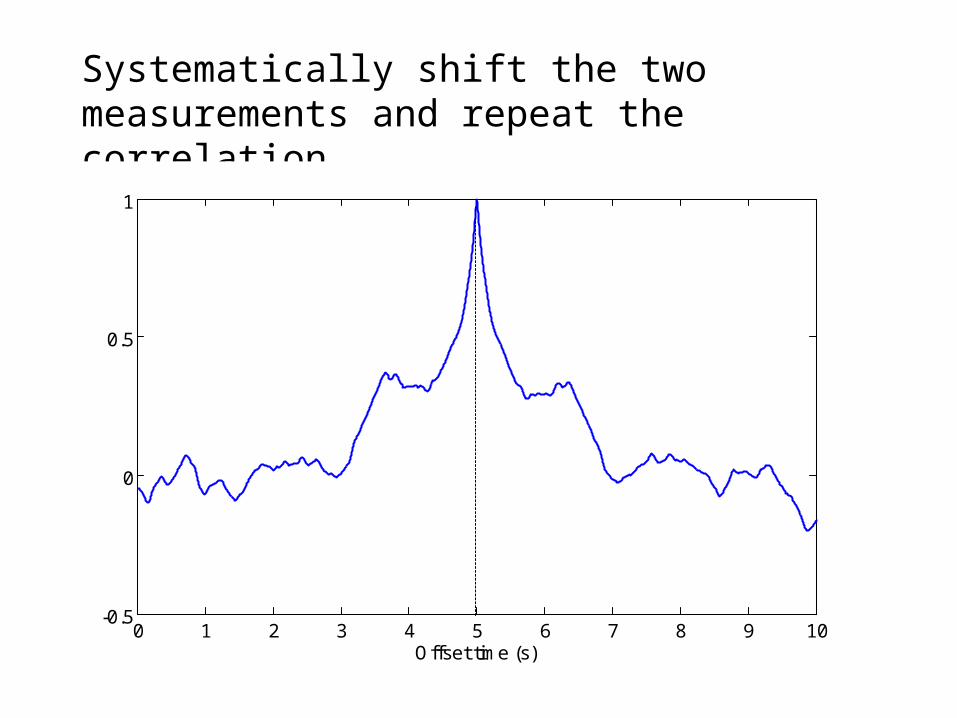
Systematically shift the two measurements and repeat the correlation.
0 1 2 3 4 5 6 7 8 9 10-0.5
0
0.5
1
Offset time (s)
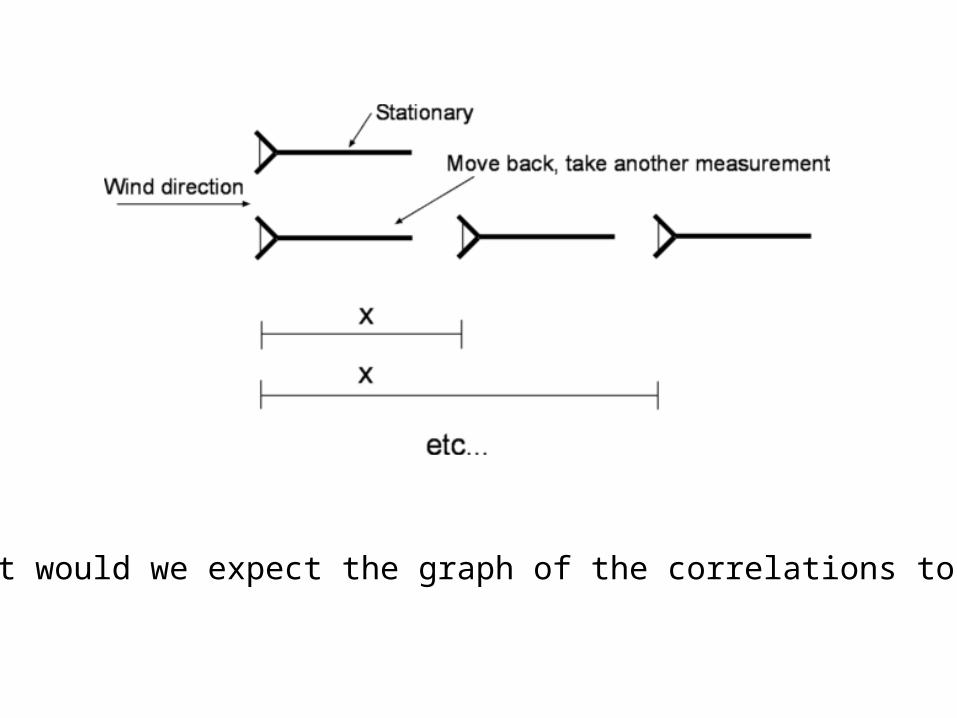
What would we expect the graph of the correlations to be?

Correlation versus Distance between two wind velocity measurements?
0 10 20 30 40 50 60 70-0.5
0
0.5
1
Distance (cm)
Co
rre
latio
n
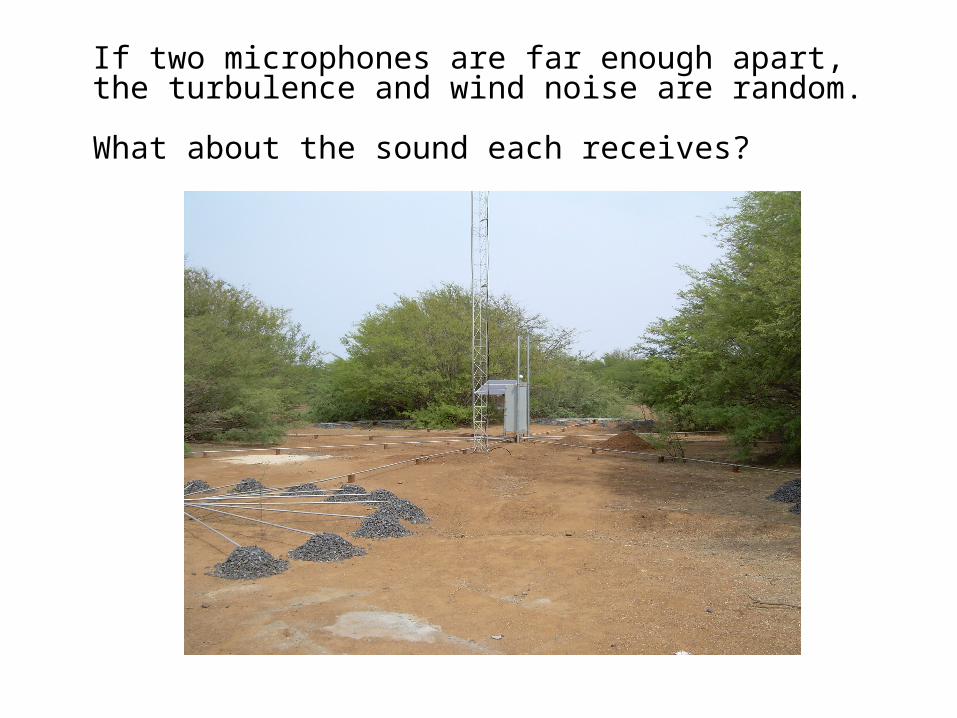
If two microphones are far enough apart, the turbulence and wind noise are random.
What about the sound each receives?

We’ve learned a lot from meteorologists about tools and classification of turbulence.
Meteorologists are interested in atmospheric turbulence because it transports:
-Pollutants-Heat-Water Vapor
But, pressure fluctuations are not important to them.
This leads us to Fluid Dynamics

General equation for incompressible flow
ji
ji
xx
uup
2
2
George uses mathematical Correlations and Fourier Transforms to predict the spectrum of the pressure given only the spectrum of the wind velocity, and compares to measurement.
Our Work! – We apply his methods to wind noise calculations outdoors and compare to measurements.
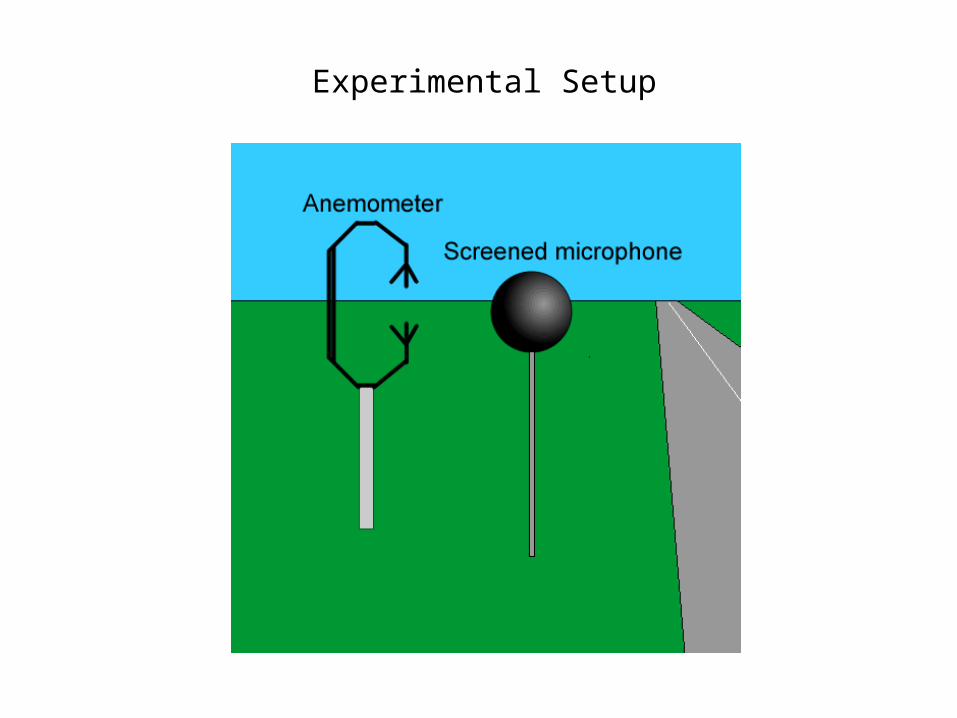
Experimental Setup

Measured wind velocity spectrumwith fit to the data
Measured pressure spectra with predictions
.001 .01 .1 1 10 10010
-10
10-5
100
105
Frequency
Win
d A
mp
litu
de
.1 1 10 100
10-5
100
Frequency
Pre
ssu
re A
mp
litu
de
Bare Microphone
Great big windscreen

What we’ve learned about windscreens
Recall that at low frequencies the pressure distributions should resemble the steady flow pressure distribution.
Front Middle Back
Ste
ady
Pre
ssur
e
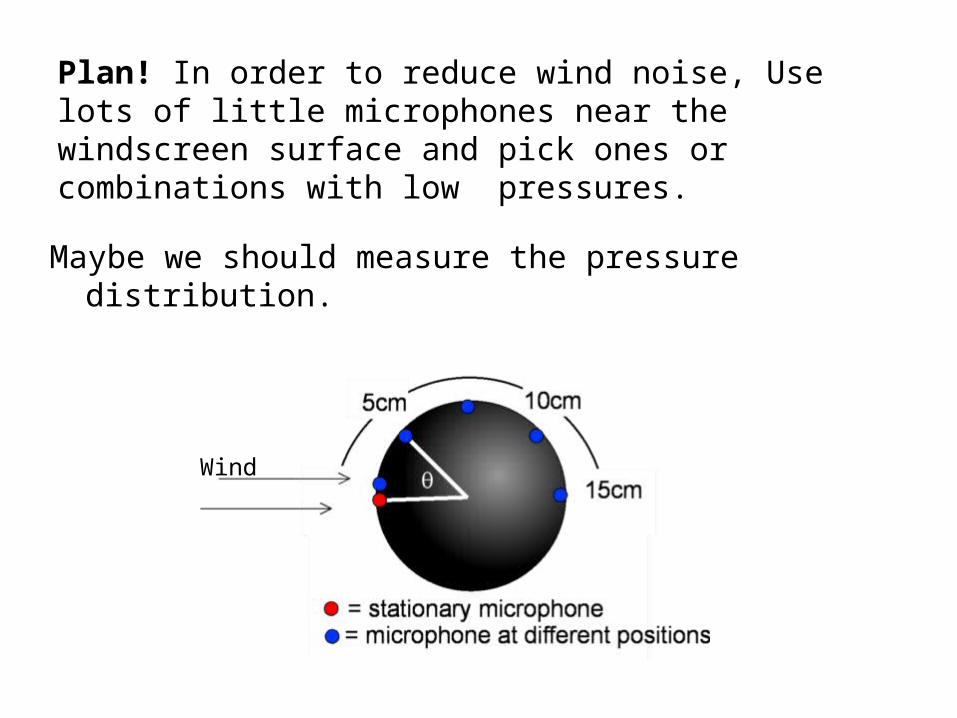
Plan! In order to reduce wind noise, Use lots of little microphones near the windscreen surface and pick ones or combinations with low pressures.
Maybe we should measure the pressure distribution.
Wind

If Phelps is right, what should the correlations look like?
0 5cm 10cm 15cm
0
Higher Velocity
Lower Velocity
Middle Velocity
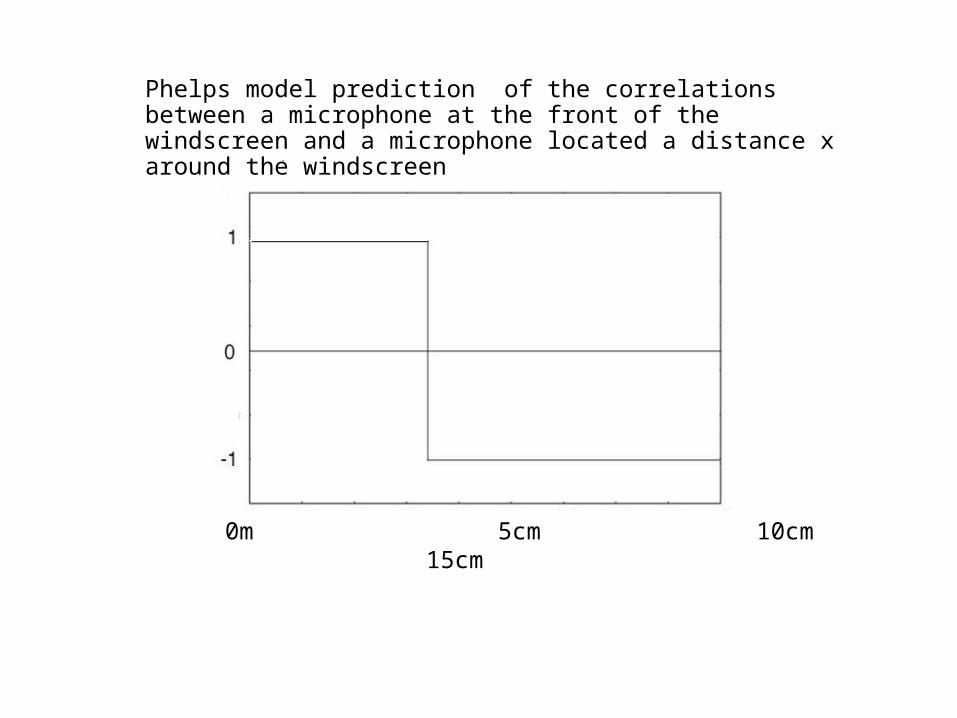
Phelps model prediction of the correlations between a microphone at the front of the windscreen and a microphone located a distance x around the windscreen
0m 5cm 10cm 15cm
0 50 100 150 200-0.5
0
0.5
1
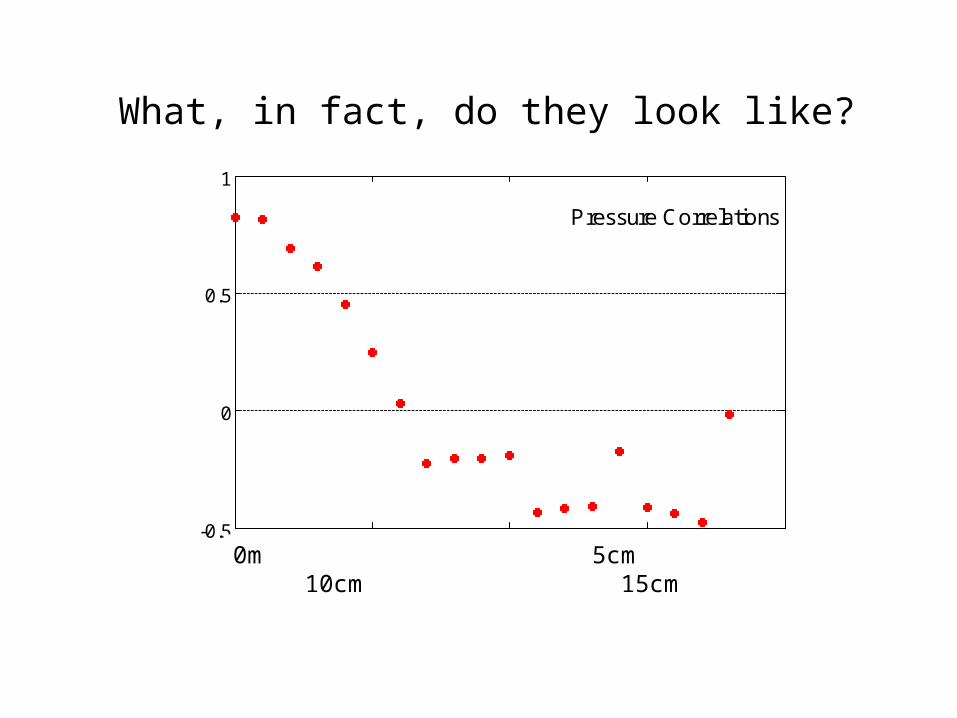
Pressure Correlations
What, in fact, do they look like?
0m 5cm 10cm 15cm
0 50 100 150 200-0.5
0
0.5
1
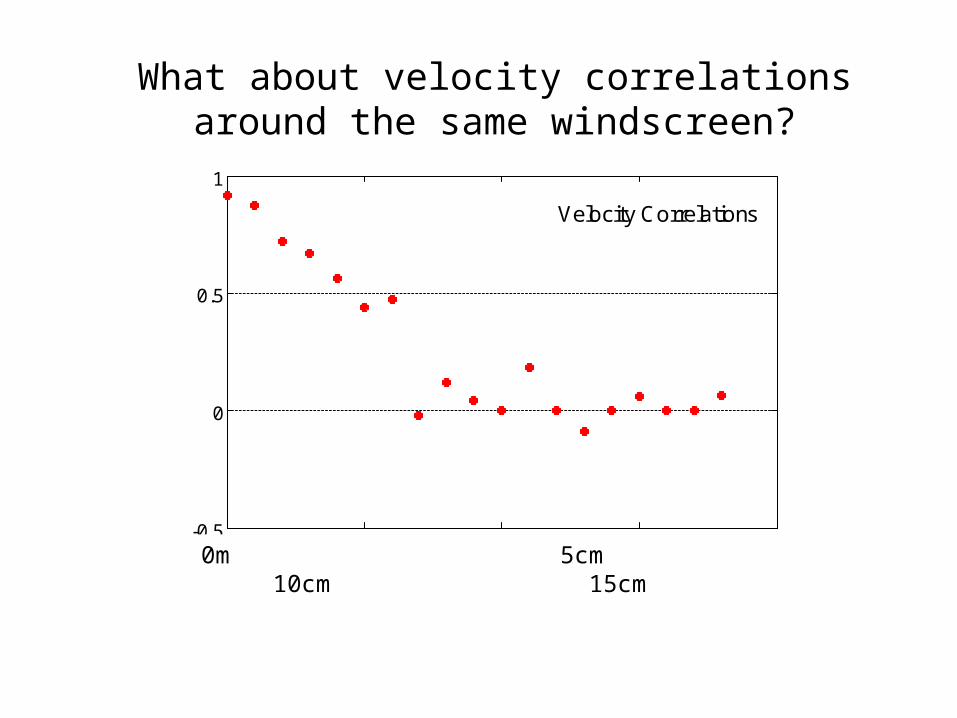
Velocity Correlations
0m 5cm 10cm 15cm
What about velocity correlations around the same windscreen?

.1 1 10 100
10-6
10-4
10-2
100
102
Frequency
Pre
ssu
re A
mp
litu
de
Our Prediction
New Understanding
We can predict the wind noise level of a smaller windscreen at low frequency based on the shorter correlation length.
Declare Victory!
• We can exploit the decorrelation for a better design
• But we would like to understand why.
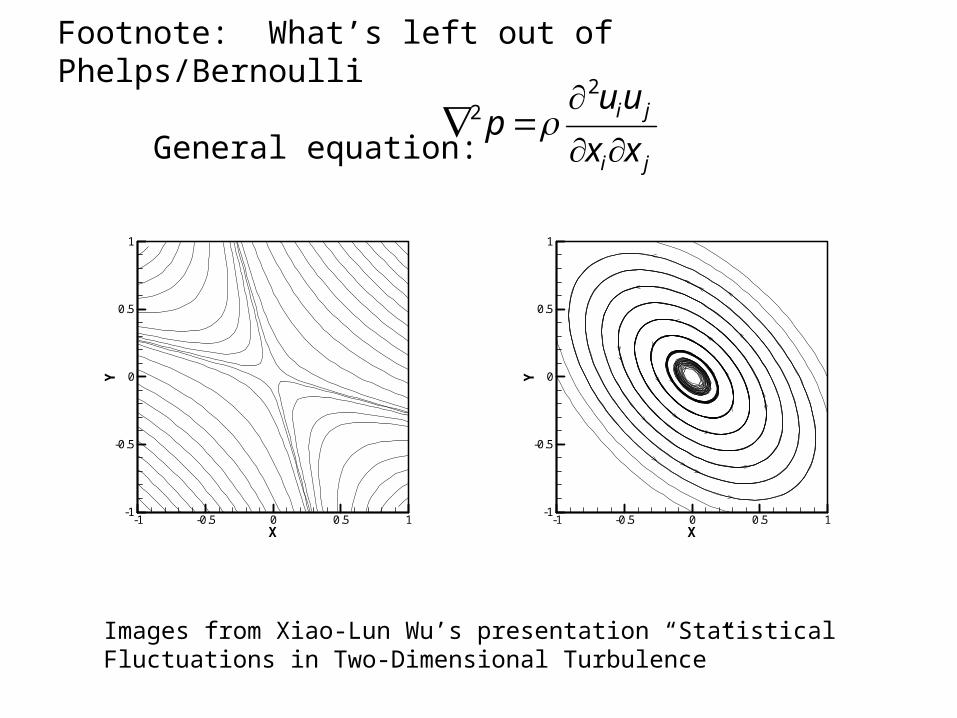
Footnote: What’s left out of Phelps/Bernoulli
General equation:
-1 -0.5 0 0.5 1X
-1
-0.5
0
0.5
1
Y
-1 -0.5 0 0.5 1X
-1
-0.5
0
0.5
1
Y
Images from Xiao-Lun Wu’s presentation “Statistical Fluctuations in Two-Dimensional Turbulence”
ji
ji
xx
uup
2
2

Conclusions
• Wind noise depends on state of the atmospheric turbulence.
• Can calculate lower limit to wind noise from measured wind velocity spectrum
• Can calculate wind noise in a bare microphone from measured velocity spectrum
• Can calculate the wind noise in a small wind screen from the measured wind velocity spectrum and the measured correlation length
• This method replaces the long standing Phelps model of low frequency wind noise reduction by small wind screens