water table mounding between subsoil drains
TRANSCRIPT

Gregorio Serafini
ENG450 Engineering Internship Final Report S1/2012
Water Table Mounding Between Subsoil Drains

JDA Water Table Mounding Between Subsoil Drains
J5122d 10 June 2012 i
DISCLAIMER
This document is published in accordance with and subject to an agreement between JDA Consultant
Hydrologists (“JDA”) and the client for whom it has been prepared (“Client”), and is restricted to those
issues that have been raised by the Client in its engagement of JDA. It has been prepared using the skill
and care ordinarily exercised by Consultant Hydrologists in the preparation of such documents.
Any person or organisation that relies on or uses the document for purposes or reasons other than those
agreed by JDA and the Client without first obtaining a prior written consent of JDA, does so entirely at
their own risk and JDA denies all liability in tort, contract or otherwise for any loss, damage or injury of
any kind whatsoever (whether in negligence or otherwise) that may be suffered as a consequence of
relying on this document for any purpose other than that agreed with the Client.
QUALITY ASSURANCE
JDA provides quality assurance through all aspects of the company operation and is
endorsed to AS/NZS ISO 9001:2000 Quality Assurance Accreditation, with third
party certification to Bureau Veritas Quality International.

JDA Water Table Mounding Between Subsoil Drains
J5122d 10 June 2012 ii
CONTENTS
1. ACKNOWLEDGMENTS 1
2. INTRODUCTION 2
3. REVIEW OF AVAILABLE LITERATURE 4
3.1 PAPER BY COCKS & HILLMAN (2007) 4
3.2 MURRAY DRAINAGE AND WATER MANAGEMENT PLAN (DOW, JUNE 2011) 4
3.3 BYFORD TOWNSITE DISTRICT WATER MANAGEMENT PLAN (DOW, SEPTEMBER 2008) 4
4. EXPERIMENTAL SITE DESCRIPTION CITY OF ARMADALE 5
4.1 SITE LOCATION 5
4.2 SURFACE GEOLOGY 5
4.3 CLIMATE 5
4.4 DRAIN CONSTRUCTION AND LAYOUT 5
5. DATA COLLECTED 2009 AND 2010 6
6. GROUNDWATER MODEL OF EXPERIMENTAL DATA 7
7. CALIBRATION OF MODEL 9
8. APPLICATION OF CALIBRATED MODEL TO DESIGN THE SUBSOIL DRAINAGE SYSTEM 11
8.1 PRE-DEVELOPMENT SCENARIO 11
8.2 POST-DEVELOPMENT SCENARIO 12
8.3 100 YEARS AVERAGE RECURRENCE INTERVAL 12
9. CONCLUSIONS 14
10. REFERENCES 15
LIST OF TABLES
1. Specific Yield Tables 2. Tuned Parameters 3. Average Recurrence Table for 1, 10, 50 and 100 years with 24 and 48 hours duration 4. Summary of Pre-Development and Post-Development Model Results
LIST OF FIGURES
1. Trial Site Location
2. Imported Fill at Trial Site
3. Generalised Surface Geology
4. Trial Layout
5. Apparatus modus operandi
6. Water Level Data in 2010 at Centreline between Parallel Drains P50S

JDA Water Table Mounding Between Subsoil Drains
J5122d 10 June 2012 iii
7. Water Level Data in 2010 at Regional Water Table Bore C50D
8. Perched Water Table Mounding 15/07/2010
9. Perched and Regional Water Table Contours 15/07/2010
10. MODFLOW Calibration Plot
11. 3D Plot MODFLOW Perched Water Table Calibration Mounding 12/07/2010
12. MODFLOW Post-Development Perched Water Table Mounding: Wet Year
13. 3D Plot MODFLOW Post-Development Perched Water Table Maximum Mounding: Wet Year
14. ARI Maximum Mounding from Calibrated Model for 1-10-50-100 years ARI and 24-48 hours duration
15. Rainfall Intensity Curves for 1-10-50-100 years ARI
16. Anketell BoM Rain Gauging Station Location Map APPENDIX ARI Tables for MODFLOW Rainfall Recharge/Input.
JDA Water Table Mounding Between Subsoil Drains
J5122d 10 June 2012 1
1. ACKNOWLEDGMENTS
The experimental data on which this paper is based were collected by JDA Consultants Hydrologists on
behalf of Peet Oakford Land Syndicate Ltd.
The drafting of this paper, conceptualisation, design, construction and ultimate calibration of the Modflow
analytical model have been mentored and supervised by two JDA Consultant Hydrologists senior
personalities: Dr Jim Davies and Alex Rogers, Managing Director/Principal Hydrologist and Senior
Engineering Hydrologist respectively.

JDA Water Table Mounding Between Subsoil Drains
J5122d 10 June 2012 2
2. INTRODUCTION
Perth is a rapidly growing city and the demand for urban land has been steadily increasing over recent
years (D.P.I., 2011) and the meeting of environmental legislations for storm-water management and
floodplain strategic management is the kernel around which a variety of skills and deep speculation
revolves.
Technological advancement and multi-variable calculus have made possible the ability to predict how a
given artefact will behave according to a defined series of variables in the environment within which the
apparatus is expected to perform its duty. This is to introduce the key role that modelling resembles within
the design process.
In geological terms, it is known with deposition that Perth is accommodated over a rather variegated
spectrum of soil types that ranges from sand, silt, clayey sand and clay. Due to this multi-faceted nature
there are no standard design guidelines for subsoil drainage systems at date. A calibrated mathematical
model can readily facilitate the design process and decision making thanks to its ability to provide
groundwater mounding height values for environments with different physical and hydrogeological
characteristics.
Subsoil drainage is used throughout the world to control shallow groundwater levels to facilitate land use
in both agricultural and urban development. The term subsoil implies that a buried pipe is used as
opposed to an open drain, usually where land values are high.
The primary mechanism by which subsoil drainage functions is the provision of an outlet from a slotted
pipe system such that groundwater can flow by gravity, according to Darcy’s law, towards the pipe thus
lowering groundwater levels.
Subsoil drainage is usually constructed in parallel or sub-parallel lines, so that the water table mounds
between the parallel drainage lines.
Critical parameters determining whether a subsoil drainage system operates as intended are: the soil
permeability, the volume of water to be drained in unit time and drain spacing.
On the Swan Coastal Plain subsoil drainage has been used in urban developments where the water table
has been shallow for decades, generally with success owing to the characteristically sandy soils and the
relatively low rainfall in the South West of Western Australia.
This paper describes a subsoil drainage experimental site in the City of Armadale, instrumented to
monitor water table mounding between a set of parallel subsoil drains in imported sand fill in 2009 and
2010.
The paper describes the data collected together with application of a suitable model to represent the
relevant components of water flux, and an application of that model to design the subsoil drainage
systems on the Swan Coastal Plain.
It is the contention of this paper that a properly designed and calibrated model is to foresee the rise and
decline of the perched water table under a given set of environmental conditions. Doing so, it will be
possible to implement the Best Practice Technique (BPT) while addressing the need to avoid the

JDA Water Table Mounding Between Subsoil Drains
J5122d 10 June 2012 3
oversizing of sand-fill requirements and consequent levitation of capital budget, maximise the security of
assets and obviate the violation of buildings’ structural integrity.
In terms of literature review, it has been deliberately decided to report references that are relevant to the
Western Australia scenario solely: this is justified by the unique morpho-geological arrangement of the
Swan Coastal Plain; in fact, overseas regulators for urban development may enforce building codes,
approval schemes and land sub-divisional requirements that are not parallel to the Australian decisional
criteria for such practices.
JDA Water Table Mounding Between Subsoil Drains
J5122d 10 June 2012 4
3. REVIEW OF AVAILABLE LITERATURE
3.1 PAPER BY COCKS & HILLMAN (2007) The paper confirms that complications arising from the clayey nature of Guildford Formation and the
subsequent perching water table in sand-fill areas need to be addressed with a bouquet of technical
solutions rather than using a monothematic approach. In fact, solutions comprise the use of passive
conveying systems of runoff water from roofed and paved areas into the local authority drainage system,
placement of a sand fill layer to rise above the expected maximum water level, and provide a grade to the
clay layer before placing sand fill to allow natural groundwater flow under the force of gravity toward an
appropriately designed subsoil drainage system (Cocks et al., 2007).
Due to the very low hydraulic conductivity of clay, a perched water table is expected to form within the
layer of imported sand layer, and there is no disguising the fact that over the time its occurrence can pose
a real threat to the structural integrity of road pavements and, moreover, to urban constructions due to
rising damp.
Finally, depending upon local settings, Cocks et al. suggests a sand-fill layer thickness that ranges
between 0.8 m and 1.2 m, a coadjutant artefact that is typically required for residential development over
the Guildford Formation. This figure has been estimated while considering the interaction between the
two main ontological characteristics of the soil profile: drainage and site classification.
3.2 MURRAY DRAINAGE AND WATER MANAGEMENT PLAN (DoW, June 2011) This document presents a comprehensive set of guidelines on how water in the plan area should be
managed in response to a proposed development project. In regards to groundwater management
solutions, the manual contains conceptual principles that recognise the importance of protecting water
quality and quality, urban amenities and infrastructure integrity for public health and safety.
Since subsoil drains are primarily used for guaranteeing the integrity of public and private assets, they are
accepted as a vector to maintain a Controlled Groundwater Level (CGL) as long as there is technical
evidence they will not adversely impact surrounding wetlands and receiving watercourses;
3.3 BYFORD TOWNSITE DISTRICT WATER MANAGEMENT PLAN (DoW, September 2008) The topography of the Byford locality is characterised by the presence of three primary soil types: Ridge
Hill Colluvium, Guildford Clay and Bassendean Sand. The installation of subsoil drains and imported
sand-fill have been accepted as a measure to conserve a Controlled Groundwater Level on Guidford
Clay. If the natural surface is less than 1.2 m above maximum groundwater level subsoil drains should be
installed at (and not lower) CGL in order to satisfy clearance requirements for approval of proposed
developments.

JDA Water Table Mounding Between Subsoil Drains
J5122d 10 June 2012 5
4. EXPERIMENTAL SITE DESCRIPTION CITY OF ARMADALE
4.1 Site Location The City of Armadale is hosting the trial site which is located approximately 30km south-east of the Perth
CBD, Western Australia. The Study Area comprises a total surface of 8000 m2.The location plan is shown
in Fig. 1 and Fig. 2.
4.2 Surface Geology The site location together with its geological features belongs to the Guildford Formation which consists
predominantly of grey and brown clays and silts that were deposited as coalescing alluvial fans in a
piedmont setting at the foot of the Darling Scarp (Gozzard, 2005), as shown in Fig. 3.
4.3 Climate The climate is characterised by hot, dry summers and cool, wet winters.
Rainfall data has been sourced from the nearest BOM’s rain gauging station in Anketell (Site No. 009258)
as the rainfall data consistently mirrors the trace groundwater level obtained from the bore data loggers.
Due to the aforementioned observation, the rainfall data from Anketell Station has been used for the
model calibration. A location map is proposed on Fig. 16.
In our attempt to appraise the validity of this technological solution and to appreciate the mounding’s
dynamics, it has been decided to calibrate and run the model on the wet season solely; in fact, the period
of interest goes from 1st March to 31st October 2010.
4.4 Drain Construction and Layout The formal supplier of the subsoil drains is StormTech® which provided two units consisting of a linked
line of arched polypropylene chambers laid in a gravel envelope, emplaced in excavated trenches.
The chambers have an external width of 864mm and height of 406mm [StormTech SC-310 chambers].
Two units of 100m lengths of drain were installed 80m apart, both aligned north-south to discharge into
Park Avenue. Specifically, inverts of the western upstream and downstream ends are 26.0mAHD and
25.9mAHD respectively. Corresponding inverts for the eastern drain are 25.9mAHD and 25.8mAHD. The
base of the sand-fill is between 25.8mAHD and 25.9mAHD, thus the drains were successfully laid at the
interface between the sand-fill and the underlying Guildford Formation.
Currently the sand-fill ground level ranges between a minimum of 27.5mAHD and a maximum of
28.0mAHD. For the modus operandi and Trial Site Layout please refer to Fig. 4 and Fig. 5 respectively.

JDA Water Table Mounding Between Subsoil Drains
J5122d 10 June 2012 6
5. DATA COLLECTED 2009 AND 2010
The installation of the two drains occurred in mid-2009, hence direct rainfall measurement for the current
year was not feasible. However, to ensure maximum homogeneity and transparency for both data
gathering and further monitoring, JDA deliberately decided to rely on the BOM’s rain gauging station
located some 10.0 km from the study area. This decision has been supported by observing that the daily
totals since 5 August 2009 indicate that rainfall data at both Anketell and Oakford sites are very similar.
During the first year of the trial (i.e. 2009) adverse externalities were not absent; in fact, Park Avenue was
wholly inundated from 6 July 2009 to 1 September causing a limited access to the monitoring
instrumentation; to address this complication, Park Avenue has been drained to allow measurements of
the StormTech drain performances at the end of the wet period. On September the receiving basin had to
be de-silted to maintain the water level in park Avenue beneath the StormTech drain inverts.
Measurements ceased for the whole dry season and then resumed at the beginning of the 2010 wet
season. Once again, in this year of observation there have been a couple of minor technical difficulties:
On 23rd July 2010, a sand bund clogged the free flow of water from Park Avenue onto
neighbouring property. The bund was removed shortly after its discovery.
On the 18th August 2010, the outlets drain at Park Avenue was found to be occluded by a bunch
of dead vegetation debris (i.e. tree trunks, branches, sand and wooden planks), probably the
result of a puerile game action.
Since the above inconvenient situations have been readily addressed by JDA’s staff, the integrity of the
data gathering process has not been compromised.
In summary, the StormTech drains have not experienced any significant blockage that would have led to
an insufficiently representative data set.
For the scope of this paper, readings from the P50S monitoring bore equipped with continuous data
logger have been used (Fig. 6), the observation period goes from the 1st of March to 31st of October 2010.
For comparison Fig. 7 shows water level data for a control bore C50D slotted in the Guildford Formation
measuring the regional water table.
It can be seen that these water levels are several meters below the perched water table in the sand-fill
layer.
Fig. 9 shows contours of the perched and regional water table on 15 July 2010 when the perched water
table was at its highest. Fig. 9 also showcases the regional groundwater level to be approximately 22
mAHD, compared with the perched water table approximately at 26.5 mAHD.
Fig. 8 evinces contours on the date of maximum perched water table mounding on 15 July 2010.

JDA Water Table Mounding Between Subsoil Drains
J5122d 10 June 2012 7
6. GROUNDWATER MODEL OF EXPERIMENTAL DATA
In this context we specifically refer to groundwater as the sub-surface water that occurs beneath the
water table in soils and geologic formations that are fully saturated.
Due to the porous nature of soil and thanks to the Earth gravitational field, water can easily move within
subsoil fields according to the laws of fluid mechanics. The velocity with which water will move is dictated
by some physical key properties such as porosity and both vertical and horizontal hydraulic conductivity;
these parameters are specific of the soil type; hence, they are not unique or categorically representative.
Porosity can be described in mathematical terms simply as the ratio between the volume of the voids
[mass unit] and the total volume of the sample [mass unit]:
n = Vvoid/VTot [0<n<1]
Hydraulic conductivity is a very specific value which is representative of the soil type. It is an indication of
how well water can move through the porous media. For simplification, equations have been transcribed
in its general form, as follow:
Q [m3/t] = - K [m/s]
][][
mlmh A [m2] [Eqn. 1]
t
h
T
S
z
h
y
h
x
h
2
2
2
2
2
2
[Eqn. 2]
Eqn. 1 is also known as Darcy’s Law which is valid on a macroscopic level with gradient equal to 1,
whereas Eqn. 2 represents the same relationship on a microscopic level. The latter returns the hydraulic
head field at any point on a horizontal plane through the horizontal aquifer at any time. In fact, the solution
is the form of h(x, y, z).
In Eqn. 1, Q is a volumetric flow-rate, K is the hydraulic conductivity, ∆h is the head difference, ∆l is the
length of the interested section, and A is the area of the cross-section.
In Eqn. 2, S is denoted as the product between the soil specific yield (i.e. Sy) and the saturated aquifer
thickness (i.e. k), whereas T is the result of the product between the soil transmissivity (i.e. Ty) and
saturated aquifer thickness.
The relationship between porosity and hydraulic conductivity is governed by the change of water flow
direction on the three directions (x, y, z) which is what MODFLOW will be computing.
Of equal importance is the specific yield which relates to the volumetric fraction of the bulk aquifer volume
that the aquifer will yield when all the water is allowed to drain out of it under the forces of gravity. As
shown in Table 1, literature suggests a specific yield for sandy soils ranging between 0.15 and 0.35.

JDA Water Table Mounding Between Subsoil Drains
J5122d 10 June 2012 8
Table 1: Unconsolidated Deposits
Sy (%)
Material Min Avg Max
Clay 0 2 5
Sandy Clay (mud) 3 7 12
Silt 3 18 19
Fine Sand 10 21 28
Medium Sand 15 26 32
Coarse Sand 20 27 35
Gravelly Sand 20 25 35 (Johnson, 1967)
MODFLOW is a digital tool for the modelling of groundwater flow in a variety of scenarios that might
encompass pumping, injection wells and liquid pollutant diffusion.
Thanks to the software’s adaptability, it was possible to recreate the study area with an appreciable
degree of accuracy: the model is made by 2 main layers each of which represent the two main soil types
on the field (i.e. fine imported sand-fill and underlying clay from Guildford Formation respectively).
Dimensions are: [100 cell x 80 cell] with cell size of [1 m x 1 m], counting a total of 8000 active cells which
perfectly mirror the real lot size (i.e. 8000 m2).
JDA Water Table Mounding Between Subsoil Drains
J5122d 10 June 2012 9
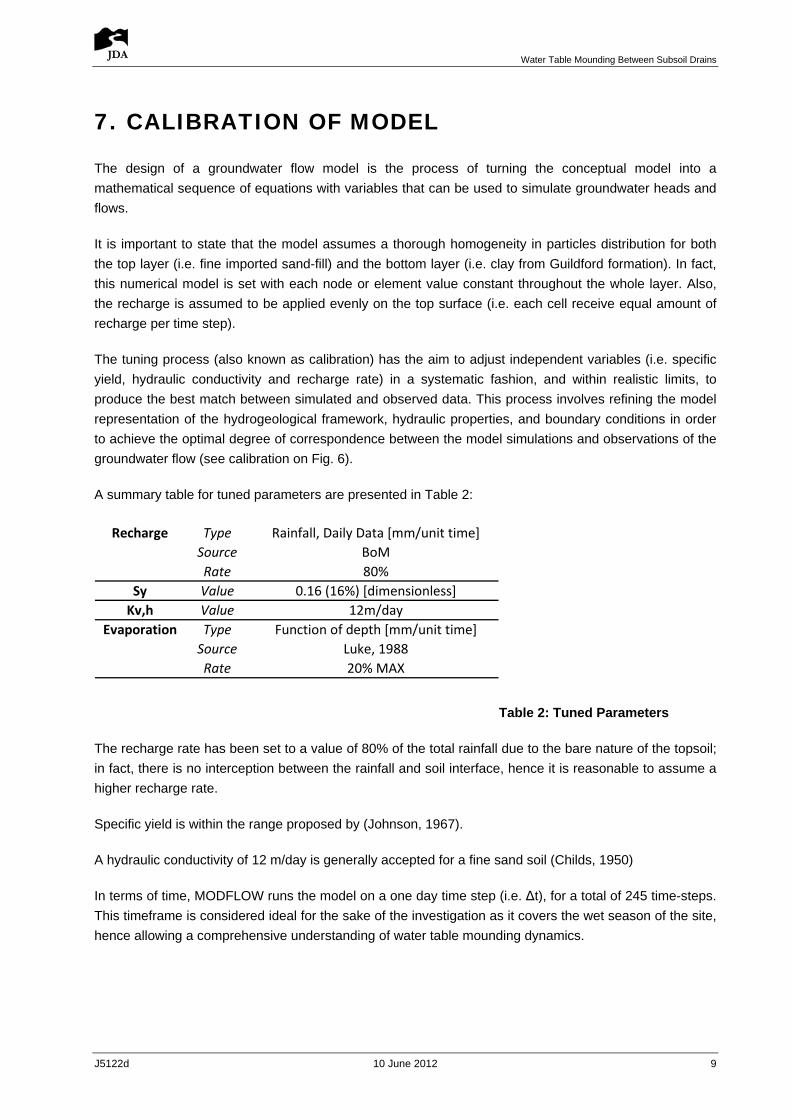
7. CALIBRATION OF MODEL
The design of a groundwater flow model is the process of turning the conceptual model into a
mathematical sequence of equations with variables that can be used to simulate groundwater heads and
flows.
It is important to state that the model assumes a thorough homogeneity in particles distribution for both
the top layer (i.e. fine imported sand-fill) and the bottom layer (i.e. clay from Guildford formation). In fact,
this numerical model is set with each node or element value constant throughout the whole layer. Also,
the recharge is assumed to be applied evenly on the top surface (i.e. each cell receive equal amount of
recharge per time step).
The tuning process (also known as calibration) has the aim to adjust independent variables (i.e. specific
yield, hydraulic conductivity and recharge rate) in a systematic fashion, and within realistic limits, to
produce the best match between simulated and observed data. This process involves refining the model
representation of the hydrogeological framework, hydraulic properties, and boundary conditions in order
to achieve the optimal degree of correspondence between the model simulations and observations of the
groundwater flow (see calibration on Fig. 6).
A summary table for tuned parameters are presented in Table 2:
Recharge Type Rainfall, Daily Data [mm/unit time]
Source BoM
Rate 80%
Sy Value 0.16 (16%) [dimensionless]
Kv,h Value 12m/day
Evaporation Type Function of depth [mm/unit time]
Source Luke, 1988
Rate 20% MAX
Table 2: Tuned Parameters
The recharge rate has been set to a value of 80% of the total rainfall due to the bare nature of the topsoil;
in fact, there is no interception between the rainfall and soil interface, hence it is reasonable to assume a
higher recharge rate.
Specific yield is within the range proposed by (Johnson, 1967).
A hydraulic conductivity of 12 m/day is generally accepted for a fine sand soil (Childs, 1950)
In terms of time, MODFLOW runs the model on a one day time step (i.e. ∆t), for a total of 245 time-steps.
This timeframe is considered ideal for the sake of the investigation as it covers the wet season of the site,
hence allowing a comprehensive understanding of water table mounding dynamics.

JDA Water Table Mounding Between Subsoil Drains
J5122d 10 June 2012 10
A useful tool in MODFLOW Model is the Water Budget which computes a total water balance for the user-
selected zone of the grid.
On maximum mounding time step, the water budget for the two sub-zones that include the two subsoil
drains returns a discharge rate of 24.0 m3/day per unit.
In order to evaluate the accountability of the model, it is recommended to compare the modelled flow-rate
with Darcy’s low (i.e. Eqn. 1), for this particular case:
K = 12 m/day
i = [Max mounding height – subsoil drain elevation] / [distance between the max mounding and subsoil
drain] = [26.75 mAHD – 26.0 mAHD] / 40 m = 0.0185 which corresponds to a gradient of 1:54
A = total area of the subsoil drain and since every MODFLOW cell has a dimension of 1 x 1 m and given
a total subsoil drain length of 100 m = 1 m2/cell x 100 cells = 100 m2
Hence the theoretical discharge according to Darcy’s Law,
Q = [12 m/day] x [0.0185] x [100m2] = 22.2 m3/day.
The calculated theoretical flow rate is 7.5% lower than the modelled one. This is probably due to the fact
that Darcy’s Law assumes laminar flow and constant viscosity of water.
Overall the model mirrors the theoretical flow rate with an accuracy of 92.5% which can be regarded as
satisfactory for the scope of this investigation.

JDA Water Table Mounding Between Subsoil Drains
J5122d 10 June 2012 11
8. APPLICATION OF CALIBRATED MODEL TO DESIGN THE SUBSOIL DRAINAGE SYSTEM
8.1 Pre-Development Scenario As previously introduced, on a civil perspective the StormTech Trial site has not yet been developed. This
is the main reason because the calibration of the model against recorded data, together with a recharge
rate of 80%, can be regarded as a pre-development scenario. According to the model, maximum subsoil
water table mounding occurred on the 12th of July 2010 at a height of 26.74 mAHD.
As shown in Fig. 6, the modelled data does not perfectly match the observations. This can be simply
explained by the fact that recharge has not been directly measured on-site; in fact, as previously
announced, the Anketell rain gauging station has been used to source rainfall data and the assumption is
that rainfall pattern on the trial site mirrors the one recorded at the observation station. Anketell’s highly
accurate data notwithstanding, the station is located 10 km from the trial site causing an inherent lack of
accuracy given by the fact that rainfall patterns are spatially specific: the probability of recording equal
magnitude of rainfall recharges across two 10 km spaced sites is very low.
At this stage, and as part of the calibration process, it is eminently important to evaluate the accuracy of
the modelled data. In order to do so, two options are available:
• Quantitative approach: use the Pearson product moment of correlation; this refers to a statistical
measure of how well a data population (i.e. the model output) approximates real data points (i.e. data
logged at bore P50S); alternatively, the value expresses the nature of the linear correlation between the
two populations of data. When applied, the mathematical function returns a single value which is
comprised within the range that goes from 0 to 1: values close to 1 are indicative of a strong linear
relationship whereas values close to 0 indicate a weak linear relationship.
• Qualitative approach: Create a scatter plot by interpolating the modelled data in the y’s axis and
the logged real data in the x’s axis.
As the accountability of one method should not be considered as absolute, both methods have been
used:
Observed data (i.e. sourced from the P50S data logger) and modelled data (i.e. Modflow output data
array) have been used to create the x and y population respectively. The R-Squared function returned a
value of 0.94 which suggests that the model has mirrored observed data with 94% accuracy. For
graphical representation, please refer to Fig 6.
Fig 6 shows a clear linear trend with sporadic but not representative off-set values. The overall linear
trend suggests a strong relationship between the collected data and the output from Modflow. The 3D plot
of maximum water table mounding is shown in Fig. 11.

JDA Water Table Mounding Between Subsoil Drains
J5122d 10 June 2012 12
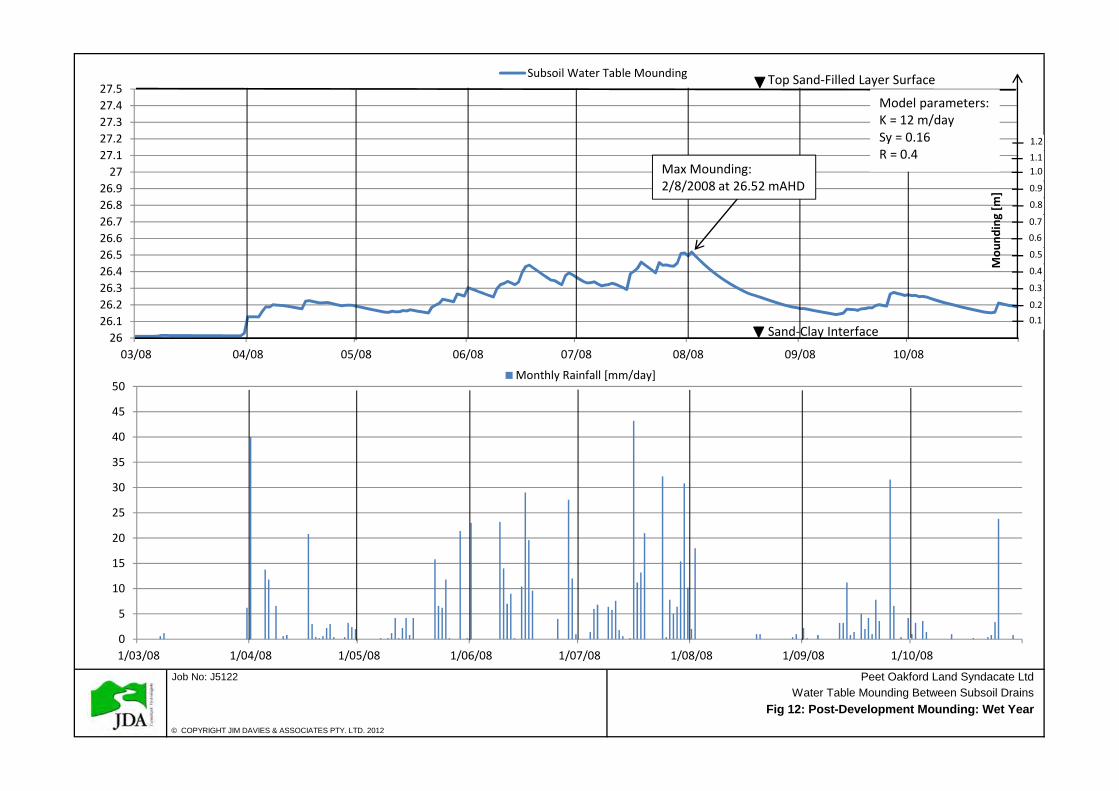
8.2 Post-Development Scenario It is well established that groundwater recharge rate under post-development environmental conditions is
significantly reduced due to the greater degree of rainfall interception by impervious surfaces and
vegetation. Also, best practice technique usually discourages the use of infiltration as a disposal vector
for storm water in sand-filled areas; in fact, infiltration of stormwater could exert excessive stress upon the
subsoil system which would subsequently result in a greater risk of breaching the structural integrity of
surrounding constructions due to an objectionably high perched water table.
A post-development scenario was created with the scope of modelling the subsoil water table mounding
with a recharge rate of 40% (i.e. 0.4 in MODFLOW) in the wettest year (i.e. 2008) ever recorded since
daily rainfall data was available from the Anketell rain gauging station. These parameters represent a
deliberate attempt to model the potential ‘worst case scenario’. Hydrogeological soil parameters are the
same as per the pre-development/calibration scenario. According to the model, and as shown in Fig. 12
and 13, the maximum subsoil water table mounding was experienced on the 2nd of August 2008 at a
height of 26.52 mAHD.
8.3 100 Years Average Recurrence Interval ARI is a statistical estimate of the average period in years between the occurrences of a flood of a given
size or larger. The ARI of a flood event gives no indication of when a flood of that size will occur again.
100 year ARI flood: this particular flood has a 1% chance of occurring in any one year and has a 50%
chance of being experienced at least once in a person’s lifetime. The 100 year ARI flood has been
generally adopted in Australia and overseas as the basis for floodplain management planning (DoW,
2000).
Rainfall intensity curves and subsequent model outputs are shown and plotted in Fig. 15 and Fig.14
respectively. Results for maximum water table mounding heights are summarised in Table 3. The amount
of rainfall for each duration period has been loaded into the calibrated Modflow model with a time step of
one hour which is consistent with the intensity curve time scale.
ARI rainfall intensities have been generated by the online Intensity Frequency Duration tool found on the
Bureau of Meteorology website according to the coordinates of the trial site.
Table 3: Average Recurrence Table for 1, 10, 50 and 100 years with 24 and 48 hours duration
ARI [years] Duration [hours] Applied Rainfall [mm] Max Mounding [m]
1 24
48
55.9
70.1
0.15
0.19
10 24
48
96.7
124.8
0.26
0.31
50 24 132.7 0.35

JDA Water Table Mounding Between Subsoil Drains
J5122d 10 June 2012 13
48 174.2 0.459
100 24
48
150
198.2
0.41
0.52
The above shows that the maximum mounding for the 100 years ARI with 48 hours event duration resulted in a maximum water table mounding of 0.52 m which is virtually the equivalent of the one estimated for the ‘wettest year’ scenario;

JDA Water Table Mounding Between Subsoil Drains
J5122d 10 June 2012 14
9. CONCLUSIONS
During the experimental period of winter 2010 the maximum perched water table mounding at centreline
between parallel subsoil drains (i.e. StormTech units) spaced 80 m apart was 0.68 m with bare sand pre-
development scenario.
Perched water table will form in sand-fill areas over clay formations.
Results for the pre-development and post-development scenarios are summarised in Table 4:
Table 4: Summary of Pre-Dev and Post-Dev model results
Scenario Recharge Tot. Rainfall Mar-Oct Maximum Mounding
Pre-Development 80% 537 mm [2010] 26.74 mAHD
Post-Development 40% 775.2 mm [2008] 26.52 mAHD
From Table 4 is possible to note that the maximum mounding for the post-development scenario is 30.8%
lower than the pre-development stage. Also, the total rainfall for 2008 (i.e. the wettest year since 2002) is
31% higher than 2010. This should show that the minimum requirement for sand-filled layer of 1.0 - 1.5 m
imposed by local governmental authorities should be subjected to further review in order to minimise
expenses for such practice. In fact, sand-filling operation costs are reverberated onto lot prices; hence, it
is now possible to discern that the optimisation of sand-fill requirements will cause a tangible price
reduction on a lot-scale without compromising the structural stability of private buildings, POSs or any
other structure in the domain.
The Modflow analytical model has been calibrated within realistic soil property values.
In order to augment model’s accountability, parameters should be empirically measured or estimated with
reasonable accuracy, they can assume the form of: distance between subsoil drains, hydraulic
conductivity of the soil, anisotropic or isotropic conditions, recharge rate and amount, evaporation rate,
transpiration rate, leakage and eventual seepage.
In an era of Global Financial Crisis and general economic instability, minimising building costs is
paramount. The use of a calibrated model will estimate the required imported sand-fill layer depth
according to local climate conditions, soil properties and regional rainfall intensities.
It is concluded that this set of data together with the calibrated groundwater model are the most promising
avenues for estimating perched water table mounding heights in sand-fill on Guildford Formation.

JDA Water Table Mounding Between Subsoil Drains
J5122d 10 June 2012 15
10. REFERENCES
Bureau of Meteorology, Average Pan Evaporation data, 2010.
Bureau of Meteorology, Daily Rainfall Data at Anketell Rain Gauging Station, 2010.
Childs E.C., The permeability of porous materials, 392 – 405, 1950.
Cocks G.C., M.O. Hillman, The Guildford Formation and its influence on Residential Construction, Coffey
Geo-technics, Australian Geomechanics Vol 42, No 3 September 2007.
D.P.I., Urban Growth Monitor report, Western Australia Planning Commission, Dec. 2011.
Department of Water, Water Facts 14, Floodplain Management, Water and River Commission, July 2000.
Department of Water, Byford Townsite District Water Management Plan, Western Australia, 2008.
Department of Western Australia, Murray Drainage and Water Management Plan, Department of Water,
June 2011.
Freeze A., J.A. Cherry, Groundwater, Prentice – Hall Inc, Englewood Cliffs, 1979.
Gozzard, A reinterpretation of the Guildford Formation, Paper presented to the Guildford Formation
Seminar run by Australian Geo-mechanics, Guildford, 2005.
Jonhson A.I., Specific yield – compilation of specific yield for various material. U.S. Geological Survery
Water Supply Paper 1662-D. 74p.

FIGURES

Data Source: DOLA CADASTRE, ArcGIS, JDA 2011
© COPYRIGHT JIM DAVIES & ASSOCIATES PTY. LTD. 2012
Figure 1: Trial Field Site Location
Job No. J5122

Data Source: ArcGIS Software, JDA 2011
© COPYRIGHT JIM DAVIES & ASSOCIATES PTY. LTD. 2012
Figure 2: Imported sand-fill at trial site
Job No: J5122
Trial Site on imported sand-fillN
200m

Data Source: Hydrogeologogy and Groundwater Resources of Perth Region Western Australia, Davidson W.A., 1995, pp 22
© COPYRIGHT JIM DAVIES & ASSOCIATES PTY. LTD. 2012
Figure 3: Generalised Surface Geology of the Perth Region
Job No. J5122
N
StormTech Trial Site

!( !(!( !( !(
!. !( !.!(
!( !(
!( !( !( !( !(
!(!.
!(C90
C50
P90
P20
C50D P50sP50d3
P90/38EP90/20EP90/20WP90/38W
P50/38EP50/20EP50/20WP50/38W
P20/38EP20/20EP20/20WP20/38W
Figure 4: Trial Layout
Legend
Stormtech Trial Bores!( Monitoring Bores
Shallow Bores With Data Logger!. P50/38W
!. P50S
Control Deep Bore!. C50D
±
Job No. J5122
© COPYRIGHT JIM DAVIES & ASSOCIATES PTY. LTD. 2012
0 20 40 60 80Meters
Scale:1:1,000
!!
!!
!!
!!
!!
!!
!!
!!
!!
2 x 100m StormTech Drains
40 m

© COPYRIGHT JIM DAVIES & ASSOCIATES PTY. LTD. 2012
Figure 5: Schematic of Trial Site
Job No: J5122
80 m
Guildford Formation Clay
StormTech Units
Sand Fill
Regional Water Table
P50/38W + Data Logger[Shallow]
P50S + Data Logger[Shallow]
Control Bore[Deep]
Unsaturated
Saturated
Unsaturated
Saturated
Perched Water Table
NB: not to scale

© COPYRIGHT JIM DAVIES & ASSOCIATES PTY. LTD. 2012
Figure 6: Water Level in 2010 at the center between parallel drains
Job No: J5122
0
10
20
30
40
50
60
03/2010 04/2010 05/2010 06/2010 07/2010 08/2010 09/2010 10/2010
Rainfall
[mm of rain/day]
26
26.1
26.2
26.3
26.4
26.5
26.6
26.7
26.8
26.9
27
27.1
27.2
27.3
27.4
27.5
03/2010 04/2010 05/2010 06/2010 07/2010 08/2010 09/2010 10/2010
mAHD
P50S Data Logger[gaps due to missing data]
MODFLOW K=12, Sy=0.16
Sand‐Clay Interface
Top Sand‐Filled Layer Surface
Mounding [m
]
0.1
0.2
0.3
0.4
0.5
0.6
0.7
0.8
0.9
1.0
1.1
1.2R‐Squared = 0.94
Max Mounding:12/07/2010 at 26.68 mAHD

© COPYRIGHT JIM DAVIES & ASSOCIATES PTY. LTD. 2012
Figure 7: Water level Data in 2010 at Regional Water Table Bore P50D3
Job No: J5122
0
10
20
30
40
50
60
1/03/2010 1/04/2010 1/05/2010 1/06/2010 1/07/2010 1/08/2010 1/09/2010 1/10/2010
Rainfall
[mm of rain/day]
20
21
22
23
24
25
26
27m
AH
DP50d3
Regional Water Table
Period Of Interest: March to October 2010

© COPYRIGHT JIM DAVIES & ASSOCIATES PTY. LTD. 2012
Figure 8: Perched Water Level Mounding 15/07/2010
Job No. J5122
N
Park Avenue
Invert 25.9
Invert 25.8
Invert 25.9
LegendBore
Water Levelcontour
26.17 Water level (m AHD)
P20/38W
P20/20WP20S P20/20E
P20/38E
P50/38W
P50/D3
P50S
P50/20E P50/38E
P90/20E P90/38E
C50S
C50D
C90S
0.16 0.49 0.57 0.62
0.64
0.63 0.31
0.56 0.59 0.22
Dra
in 1
Dra
in 2
0.60.4
0.77
0.59
0.1
0.60
P50/20W
P90/20WP90/38W
0.610.12
0.5P90S
0.340.14
0.5
0.4
0.19
0.30.2
0.3
0.20.
2
0.300.40
0.50
Invert 26.0
0.6
0.1
0.70

Data Source: nearmap.com (19 Sept 2010)
© COPYRIGHT JIM DAVIES & ASSOCIATES PTY. LTD. 2012
Figure 9: Perched and Regional Water-Table Contours 15/07/2010
Job No. J5122 N
26.0
26.5
26.0
26.5
26.5
26.5
26.5 26.5
26.0
T120
LegendMeasured Perched WT Level (mAHD)
Inferred Perched WT Level (mAHD)
DOW Monitor Bore
Measured Regional WT (mAHD)
Flow Direction (Perched G.W)
26.0
26.0
26.7
26.7
26.726.7
FILL LEVEL 27.5mAHD
22.1
21.9
22.0
REGIONAL G.W. FLOW DIRECTION

© COPYRIGHT JIM DAVIES & ASSOCIATES PTY. LTD. 2012
Job No: J5122
Figure 10: MODFLOW Model Calibration Plot
25.9
26
26.1
26.2
26.3
26.4
26.5
26.6
26.7
26.8
25.9 26 26.1 26.2 26.3 26.4 26.5 26.6 26.7 26.8
Model
Data Logger
P50S Data LoggerVS Modflow Model
22/03/2010 Daily Time Step

© COPYRIGHT JIM DAVIES & ASSOCIATES PTY. LTD. 2012
Fig 11: 3D MODFLOW Output for Pre-Dev Maximum Mounding 12/07/2010
Job No: J5122
25.525.625.725.825.926
26.126.226.326.426.526.626.726.826.927
26.9‐2726.8‐26.926.7‐26.826.6‐26.726.5‐26.626.4‐26.526.3‐26.426.2‐26.326.1‐26.226‐26.125.9‐2625.8‐25.925.7‐25.825.6‐25.725.5‐25.6
Max Mounding at 26.74 mAHD
Mounding Elevation[mAHD]
Sand‐Fill
Layer
Guildford
Form
ation
Clay
80 m
100 m
Please note:‐Maximum mounding occurred on stress period #134 which corresponds to 12/07/2010‐ Sand‐fill layer surface (i.e. 27.5 mAHD circa) not displayed for enhanced mounding stratification
© COPYRIGHT JIM DAVIES & ASSOCIATES PTY. LTD. 2012
Job No: J5122 Peet Oakford Land Syndacate LtdWater Table Mounding Between Subsoil Drains
Fig 12: Post-Development Mounding: Wet Year
26
26.1
26.2
26.3
26.4
26.5
26.6
26.7
26.8
26.9
27
27.1
27.2
27.3
27.4
27.5
03/08 04/08 05/08 06/08 07/08 08/08 09/08 10/08
Subsoil Water Table Mounding
0
5
10
15
20
25
30
35
40
45
50
1/03/08 1/04/08 1/05/08 1/06/08 1/07/08 1/08/08 1/09/08 1/10/08
Monthly Rainfall [mm/day]
Sand‐Clay Interface
Top Sand‐Filled Layer Surface
0.1
0.2
0.3
0.4
0.5
0.6
0.7
0.8
0.9
1.0
1.1
1.2
Mounding [m
]
Max Mounding:2/8/2008 at 26.52 mAHD
Model parameters:K = 12 m/daySy = 0.16R = 0.4

© COPYRIGHT JIM DAVIES & ASSOCIATES PTY. LTD. 2012
Job No: J5122
Fig 13: 3D MODFLOW Output for Post-Dev Maximum Mounding: Wet Year
Max Mounding at 26.51 mAHD
25.7
25.8
25.9
26
26.1
26.2
26.3
26.4
26.5
26.4‐26.5
26.3‐26.4
26.2‐26.3
26.1‐26.2
26‐26.1
25.9‐26
25.8‐25.9
25.7‐25.8
Mounding Elevation[mAHD]
Sand‐Fill
Layer
Guildford
Form
ation
Clay
80 m
100 m
Please note:‐Maximum mounding occurred on stress period #155 which corresponds to 2/08/2008‐ Sand‐fill layer surface (i.e. 27.5 mAHD circa) not displayed for enhanced mounding stratification
Max Mounding at 26.51 mAHD

© COPYRIGHT JIM DAVIES & ASSOCIATES PTY. LTD. 2012
Figure 14a: MODFLOW model for 1 yr ARI, 24 hrs event
Job No: J5122
Hours
26.1526.19
26.32 26.32 26.3418
26.44526.385
26.505
1yr24hrs
1yr48hrs
10yrs24hrs
10yrs48hrs
50yrs24hrs
50yrs48hrs
100yrs24hrs
100yrs48hrs
Max Mounding
mAHD
Hours
MODFLO
W Grid

© COPYRIGHT JIM DAVIES & ASSOCIATES PTY. LTD. 2012
Job No: J5122
Figure 14b: MODFLOW model for 1 yr ARI, 48 hrs event
Hours
26.1526.19
26.32 26.32 26.3418
26.44526.385
26.505
1yr24hrs
1yr48hrs
10yrs24hrs
10yrs48hrs
50yrs24hrs
50yrs48hrs
100yrs24hrs
100yrs48hrs
Max Mounding
mAHD
Hours
MODFLO
W Grid

© COPYRIGHT JIM DAVIES & ASSOCIATES PTY. LTD. 2012
Job No: J5122
Figure 14c: MODFLOW model for 10 yrs ARI, 24 hrs event
Hours
26.1526.19
26.32 26.32 26.3418
26.44526.385
26.505
1yr24hrs
1yr48hrs
10yrs24hrs
10yrs48hrs
50yrs24hrs
50yrs48hrs
100yrs24hrs
100yrs48hrs
Max Mounding
mAHD
Hours
MODFLO
W Grid

© COPYRIGHT JIM DAVIES & ASSOCIATES PTY. LTD. 2012
Job No: J5122
Figure 14d: MODFLOW model for 10 yrs ARI, 48 hrs event
Hours
26.1526.19
26.32 26.32 26.3418
26.44526.385
26.505
1yr24hrs
1yr48hrs
10yrs24hrs
10yrs48hrs
50yrs24hrs
50yrs48hrs
100yrs24hrs
100yrs48hrs
Max Mounding
mAHD
Hours
MODFLO
W Grid

© COPYRIGHT JIM DAVIES & ASSOCIATES PTY. LTD. 2012
Job No: J5122
Figure 14e: MODFLOW model for 50 yrs ARI, 24 hrs event
Hours
26.1526.19
26.32 26.32 26.3418
26.44526.385
26.505
1yr24hrs
1yr48hrs
10yrs24hrs
10yrs48hrs
50yrs24hrs
50yrs48hrs
100yrs24hrs
100yrs48hrs
Max Mounding
mAHD
Hours
MODFLO
W Grid

© COPYRIGHT JIM DAVIES & ASSOCIATES PTY. LTD. 2012
Job No: J5122
Figure 14f: MODFLOW model for 50 yrs ARI, 48 hrs event
Hours
26.1526.19
26.32 26.32 26.3418
26.44526.385
26.505
1yr24hrs
1yr48hrs
10yrs24hrs
10yrs48hrs
50yrs24hrs
50yrs48hrs
100yrs24hrs
100yrs48hrs
Max Mounding
mAHD
Hours
MODFLO
W Grid

© COPYRIGHT JIM DAVIES & ASSOCIATES PTY. LTD. 2012
Job No: J5122
Figure 14g: MODFLOW model for 100 yrs ARI, 24 hrs event
Hours
26.1526.19
26.32 26.32 26.3418
26.44526.385
26.505
1yr24hrs
1yr48hrs
10yrs24hrs
10yrs48hrs
50yrs24hrs
50yrs48hrs
100yrs24hrs
100yrs48hrs
Max Mounding
mAHD
Hours
MODFLO
W Grid

© COPYRIGHT JIM DAVIES & ASSOCIATES PTY. LTD. 2012
Job No: J5122
Figure 14h: MODFLOW model for 100 yrs ARI, 48 hrs event
26.1526.19
26.32 26.32 26.3418
26.44526.385
26.505
1yr24hrs
1yr48hrs
10yrs24hrs
10yrs48hrs
50yrs24hrs
50yrs48hrs
100yrs24hrs
100yrs48hrs
Max Mounding
mAHD
Hours
MODFLO
W Grid

© COPYRIGHT JIM DAVIES & ASSOCIATES PTY. LTD. 2011
Figure 15: Rainfall Intensity Curves for 1-10-50-100 years ARI
Job No: 5122

’;ANKETELL [BoM]
TRIAL SITE
Figure 16: Rain Gauging Station Location Map
±
Job No. J5122
© COPYRIGHT JIM DAVIES & ASSOCIATES PTY. LTD. 2012
0 500 1,000 1,500 2,000Meters
Scale:1:37,000

APPENDIX

1yr ARI [mm]
24hrs 1yr ARI 24hrs 40% Recharge
1yr ARI [mm]
48hrs 1 yr ARI 48hrs 40% Recharge Halved
1 55.92 0.139 0.007773 0.003109152 70.08 0.141 0.009881 0.003952512 0.001976256
2 55.92 0.264 0.014763 0.005905152 70.08 0.284 0.019903 0.007961088 0.003980544
3 55.92 0.087 0.004865 0.001946016 70.08 0.085 0.005957 0.00238272 0.00119136
4 55.92 0.071 0.00397 0.001588128 70.08 0.06 0.004205 0.00168192 0.00084096
5 55.92 0.046 0.002572 0.001028928 70.08 0.064 0.004485 0.001794048 0.000897024
6 55.92 0.07 0.003914 0.00156576 70.08 0.053 0.003714 0.001485696 0.000742848
7 55.92 0.037 0.002069 0.000827616 70.08 0.048 0.003364 0.001345536 0.000672768
8 55.92 0.056 0.003132 0.001252608 70.08 0.034 0.002383 0.000953088 0.000476544
9 55.92 0.031 0.001734 0.000693408 70.08 0.01 0.000701 0.00028032 0.00014016
10 55.92 0.036 0.002013 0.000805248 70.08 0.011 0.000771 0.000308352 0.000154176
11 55.92 0.026 0.001454 0.000581568 70.08 0.021 0.001472 0.000588672 0.000294336
12 55.92 0.022 0.00123 0.000492096 70.08 0.013 0.000911 0.000364416 0.000182208
13 55.92 0.019 0.001062 0.000424992 70.08 0.008 0.000561 0.000224256 0.000112128
14 55.92 0.016 0.000895 0.000357888 70.08 0.041 0.002873 0.001149312 0.000574656
15 55.92 0.014 0.000783 0.000313152 70.08 0.015 0.001051 0.00042048 0.00021024
16 55.92 0.012 0.000671 0.000268416 70.08 0.024 0.001682 0.000672768 0.000336384
17 55.92 0.01 0.000559 0.00022368 70.08 0.009 0.000631 0.000252288 0.000126144
18 55.92 0.006 0.000336 0.000134208 70.08 0.018 0.001261 0.000504576 0.000252288
19 55.92 0.009 0.000503 0.000201312 70.08 0.007 0.000491 0.000196224 0.000098112
20 55.92 0.003 0.000168 0.000067104 70.08 0.028 0.001962 0.000784896 0.000392448
21 55.92 0.005 0.00028 0.00011184 70.08 0.006 0.00042 0.000168192 0.000084096
22 55.92 0.009 0.000503 0.000201312 70.08 0.006 0.00042 0.000168192 0.000084096
23 55.92 0.005 0.00028 0.00011184 70.08 0.007 0.000491 0.000196224 0.000098112
24 55.92 0.007 0.000391 0.000156576 70.08 0.007 0.000491 0.000196224 0.000098112
Check 0.05592 0.022368 Check 0.07008 0.028032 0.028032

50yrs ARI [mm]
24hrs 50yrs ARI 24hrs 40% Recharge
50yrs ARI [mm]
48hrs 50yrs ARI 48hrs 40% Recharge Halved
132.72 0.116 0.015396 0.006158208 174.24 0.117 0.020386 0.008154432 0.004077216
132.72 0.212 0.028137 0.011254656 174.24 0.228 0.039727 0.015890688 0.007945344
132.72 0.074 0.009821 0.003928512 174.24 0.073 0.01272 0.005087808 0.002543904
132.72 0.064 0.008494 0.003397632 174.24 0.057 0.009932 0.003972672 0.001986336
132.72 0.048 0.006371 0.002548224 174.24 0.057 0.009932 0.003972672 0.001986336
132.72 0.067 0.008892 0.003556896 174.24 0.053 0.009235 0.003693888 0.001846944
132.72 0.04 0.005309 0.00212352 174.24 0.05 0.008712 0.0034848 0.0017424
132.72 0.056 0.007432 0.002972928 174.24 0.039 0.006795 0.002718144 0.001359072
132.72 0.037 0.004911 0.001964256 174.24 0.016 0.002788 0.001115136 0.000557568
132.72 0.041 0.005442 0.002176608 174.24 0.017 0.002962 0.001184832 0.000592416
132.72 0.033 0.00438 0.001751904 174.24 0.027 0.004704 0.001881792 0.000940896
132.72 0.029 0.003849 0.001539552 174.24 0.019 0.003311 0.001324224 0.000662112
132.72 0.026 0.003451 0.001380288 174.24 0.014 0.002439 0.000975744 0.000487872
132.72 0.023 0.003053 0.001221024 174.24 0.045 0.007841 0.00313632 0.00156816
132.72 0.021 0.002787 0.001114848 174.24 0.021 0.003659 0.001463616 0.000731808
132.72 0.019 0.002522 0.001008672 174.24 0.03 0.005227 0.00209088 0.00104544
132.72 0.016 0.002124 0.000849408 174.24 0.015 0.002614 0.00104544 0.00052272
132.72 0.011 0.00146 0.000583968 174.24 0.025 0.004356 0.0017424 0.0008712
132.72 0.015 0.001991 0.00079632 174.24 0.012 0.002091 0.000836352 0.000418176
132.72 0.005 0.000664 0.00026544 174.24 0.033 0.00575 0.002299968 0.001149984
132.72 0.009 0.001194 0.000477792 174.24 0.012 0.002091 0.000836352 0.000418176
132.72 0.016 0.002124 0.000849408 174.24 0.013 0.002265 0.000906048 0.000453024
132.72 0.01 0.001327 0.00053088 174.24 0.013 0.002265 0.000906048 0.000453024
132.72 0.012 0.001593 0.000637056 174.24 0.014 0.002439 0.000975744 0.000487872
Check 0.13272 0.053088 Check 0.17424 0.069696 0.069696

10yrs ARI [mm]
24hrs 10yrs ARI 24hrs 40% Recharge
10yrs ARI [mm]
48hrs 10yrs ARI 48hrs 40% Recharge Halved
96.72 0.139 0.013444 0.005377632 124.8 0.141 0.017597 0.00703872 0.00351936
96.72 0.264 0.025534 0.010213632 124.8 0.284 0.035443 0.01417728 0.00708864
96.72 0.087 0.008415 0.003365856 124.8 0.085 0.010608 0.0042432 0.0021216
96.72 0.071 0.006867 0.002746848 124.8 0.06 0.007488 0.0029952 0.0014976
96.72 0.046 0.004449 0.001779648 124.8 0.064 0.007987 0.00319488 0.00159744
96.72 0.07 0.00677 0.00270816 124.8 0.053 0.006614 0.00264576 0.00132288
96.72 0.037 0.003579 0.001431456 124.8 0.048 0.00599 0.00239616 0.00119808
96.72 0.056 0.005416 0.002166528 124.8 0.034 0.004243 0.00169728 0.00084864
96.72 0.031 0.002998 0.001199328 124.8 0.01 0.001248 0.0004992 0.0002496
96.72 0.036 0.003482 0.001392768 124.8 0.011 0.001373 0.00054912 0.00027456
96.72 0.026 0.002515 0.001005888 124.8 0.021 0.002621 0.00104832 0.00052416
96.72 0.022 0.002128 0.000851136 124.8 0.013 0.001622 0.00064896 0.00032448
96.72 0.019 0.001838 0.000735072 124.8 0.008 0.000998 0.00039936 0.00019968
96.72 0.016 0.001548 0.000619008 124.8 0.041 0.005117 0.00204672 0.00102336
96.72 0.014 0.001354 0.000541632 124.8 0.015 0.001872 0.0007488 0.0003744
96.72 0.012 0.001161 0.000464256 124.8 0.024 0.002995 0.00119808 0.00059904
96.72 0.01 0.000967 0.00038688 124.8 0.009 0.001123 0.00044928 0.00022464
96.72 0.006 0.00058 0.000232128 124.8 0.018 0.002246 0.00089856 0.00044928
96.72 0.009 0.00087 0.000348192 124.8 0.007 0.000874 0.00034944 0.00017472
96.72 0.003 0.00029 0.000116064 124.8 0.028 0.003494 0.00139776 0.00069888
96.72 0.005 0.000484 0.00019344 124.8 0.006 0.000749 0.00029952 0.00014976
96.72 0.009 0.00087 0.000348192 124.8 0.006 0.000749 0.00029952 0.00014976
96.72 0.005 0.000484 0.00019344 124.8 0.007 0.000874 0.00034944 0.00017472
96.72 0.007 0.000677 0.000270816 124.8 0.007 0.000874 0.00034944 0.00017472
Check 0.09672 0.038688 Check 0.1248 0.04992 0.04992

100yrs ARI [mm]
24hrs 100yrs ARI 40% Recharge
100yrs ARI [mm]
48hrs 100yrs ARI 48hrs 40% Recharge Halved
150 0.116 0.0174 0.00696 198.24 0.117 0.023194 0.009277632 0.00463882
150 0.212 0.0318 0.01272 198.24 0.228 0.045199 0.018079488 0.00903974
150 0.074 0.0111 0.00444 198.24 0.073 0.014472 0.005788608 0.0028943
150 0.064 0.0096 0.00384 198.24 0.057 0.0113 0.004519872 0.00225994
150 0.048 0.0072 0.00288 198.24 0.057 0.0113 0.004519872 0.00225994
150 0.067 0.01005 0.00402 198.24 0.053 0.010507 0.004202688 0.00210134
150 0.04 0.006 0.0024 198.24 0.05 0.009912 0.0039648 0.0019824
150 0.056 0.0084 0.00336 198.24 0.039 0.007731 0.003092544 0.00154627
150 0.037 0.00555 0.00222 198.24 0.016 0.003172 0.001268736 0.00063437
150 0.041 0.00615 0.00246 198.24 0.017 0.00337 0.001348032 0.00067402
150 0.033 0.00495 0.00198 198.24 0.027 0.005352 0.002140992 0.0010705
150 0.029 0.00435 0.00174 198.24 0.019 0.003767 0.001506624 0.00075331
150 0.026 0.0039 0.00156 198.24 0.014 0.002775 0.001110144 0.00055507
150 0.023 0.00345 0.00138 198.24 0.045 0.008921 0.00356832 0.00178416
150 0.021 0.00315 0.00126 198.24 0.021 0.004163 0.001665216 0.00083261
150 0.019 0.00285 0.00114 198.24 0.03 0.005947 0.00237888 0.00118944
150 0.016 0.0024 0.00096 198.24 0.015 0.002974 0.00118944 0.00059472
150 0.011 0.00165 0.00066 198.24 0.025 0.004956 0.0019824 0.0009912
150 0.015 0.00225 0.0009 198.24 0.012 0.002379 0.000951552 0.00047578
150 0.005 0.00075 0.0003 198.24 0.033 0.006542 0.002616768 0.00130838
150 0.009 0.00135 0.00054 198.24 0.012 0.002379 0.000951552 0.00047578
150 0.016 0.0024 0.00096 198.24 0.013 0.002577 0.001030848 0.00051542
150 0.01 0.0015 0.0006 198.24 0.013 0.002577 0.001030848 0.00051542
150 0.012 0.0018 0.00072 198.24 0.014 0.002775 0.001110144 0.00055507
Check 0.15 0.06 Check 0.19824 0.079296 0.079296

TEMPORAL PATTERNS (Percentages Per Period, taken from Australian Rainfall & Runoff Volume 2)For ARI <30yrs and ARI >30yrs
ZONE 8 SOUTH-WEST COAST DIVISION ZONE 8 SOUTH-WEST COAST DIVISION
0.5 1 3 6 12 24 48 72 96 120 0.5 1 3 6 12 24 48 72 96 120
16 3.9 12.8 9.1 13.8 13.9 14.1 33.1 14.1 10.8 16 4.3 11.9 9.1 11.4 11.6 11.7 27 11.7 9.925 7 29.2 18.3 27 26.4 28.4 16.7 28.4 30.8 24 7.3 24.2 16.1 21.6 21.2 22.8 14.4 22.8 25.133 16.8 18.3 4.2 8.5 8.7 8.5 10.5 8.5 17 30 16.1 16.1 5.4 7.3 7.4 7.3 9.5 7.3 14.79 12 4.9 30.6 4.3 7.1 6 7.8 6 8.1 10 11.6 5.9 25.3 4.4 6.4 5.7 7.5 5.7 7.911 23.2 6 12.9 6.7 4.6 6.4 5.4 6.4 6.8 12 21.7 6.8 12 6 4.8 5.7 5.9 5.7 7.16 10.1 9.4 6.4 5.5 7 5.3 6.9 5.3 4.8 8 10 9.3 6.9 5.2 6.7 5.3 7.1 5.3 5.6
8.9 7.4 4.3 4.2 3.7 4.8 2.7 4.8 6.3 9 7.9 5.3 4.6 4 5 3.5 5 6.95.7 3.9 5.3 4.9 5.6 3.4 4.3 3.4 3.8 6 5.1 6.1 4.8 5.6 3.9 5 3.9 4.74.8 2.4 3.3 3.7 3.1 1 1.3 1 1.1 5.2 3.7 4.6 4.2 3.7 1.6 2.1 1.6 23.1 3 2.3 1.6 3.6 1.1 1.7 1.1 1.5 3.5 4.2 3.5 2.3 4.1 1.7 2.5 1.7 2.52.6 1.7 1.9 1.8 2.6 2.1 2.1 2.1 2.4 3 2.9 3.1 2.5 3.3 2.7 2.9 2.7 3.41.9 1 1.4 1.4 2.2 1.3 0.3 1.3 0.9 2.3 2 2.6 2.1 2.9 1.9 0.9 1.9 1.7
3.1 1.9 0.8 0.7 0.8 1.9 3.6 2.6 1.4 1.4 1.4 2.92.7 1.6 4.1 0.5 4.1 3.1 3.3 2.3 4.5 1.2 4.5 4.12.3 1.4 1.5 0.6 1.5 0.7 2.9 2.1 2.1 1.4 2.1 1.52 1.2 2.4 3.4 2.4 2.7 1.9 3 4.2 3
1.2 1 0.9 1.1 0.9 1.9 1.6 1.5 1.9 1.50.9 0.6 1.8 0.9 1.8 1.6 1.1 2.5 1.6 2.50.4 0.9 0.7 0.7 0.7 1.5 1.2 1.21.1 0.3 2.8 2.8 1.8 0.5 3.3 3.31 0.5 0.6 0.6 1.7 0.9 1.2 1.2
0.7 0.9 0.6 0.6 1.2 1.6 1.3 1.30.7 0.5 0.7 0.7 1.3 1 1.3 1.30.5 0.7 0.7 0.7 0.9 1.2 1.4 1.4
100 100 100 100 100 100 100 100 100 100 100 100 100 100 100 100 100 100 100 100
ZONE 4 TIMOR SEA DIVISION ZONE 4 TIMOR SEA DIVISION
0.5 1 3 6 12 24 48 72 96 120 0.5 1 3 6 12 24 48 72 96 120
16 3.9 4.4 12.7 10.5 30.2 30.2 32.6 16 4.3 5.5 12.4 9.5 23.6 23.6 25.825 7 20.1 32.3 28.7 16.5 12.3 10.2 24 7.3 17.9 25.9 22.3 14.1 10.3 9.633 16.8 27.9 21.4 11.7 7.5 3.8 1.2 30 16.1 22.3 19.1 9.7 6.7 4.2 1.79 12 13.9 8.3 7 5.6 1.8 1 10 11.6 13.5 8.9 6.7 5.3 2.4 1.611 23.2 9.7 6.7 4.3 3.7 1 1 12 21.7 10.2 7.7 4.4 3.8 1.4 1.76 10.1 7.5 5 3.3 2.9 1 3.2 8 10 8.4 6.1 3.4 3.4 1.5 3.9
8.9 5.8 3.9 2.2 3.1 0.8 9.4 9 6.8 5.1 2.8 3.5 1.3 9.65.7 3.4 3 6 1.8 1 7 6 4.5 4.2 6 2.5 1.6 7.54.8 2.6 2.4 3.3 1.3 0.8 1.4 5.2 3.6 3.5 3.7 2.1 0.6 2.13.1 2.1 1.9 2.9 1.1 1.6 1.1 3.5 3.1 3 3.3 1.9 2.2 1.82.6 1.5 1.4 2.6 1.2 4.4 1.7 3 2.4 2.3 3.1 2 4.6 2.31.9 1.1 1 1.9 0.9 1.5 4.2 2.3 1.8 1.8 2.6 1.6 2.2 4.9
2.3 0.5 5.3 13.2 2.8 0.7 5.3 11.42.1 0.6 7.1 5.4 2.8 0.3 6.9 6.11.7 1 9.4 1.2 2.4 1.7 8.5 1.91.5 1.7 2.7 1.5 2.2 2.4 3.3 2.11.3 1.4 1.3 2.7 1.9 2.1 1.8 3.41.2 1.5 1.2 2 1.9 2.2 1.7 2.61.1 2.2 0.8 1.8 2.8 1.51 2.7 1 1.6 3.3 1.71 2.4 2 1.7 2.9 2.6
0.7 3.7 3.1 0.4 4 3.71 4.5 3.6 1.8 4.4 4.2
0.7 2 2.3 1.2 2.7 2.9
100 100 100 100 100 100 100 100 0 0 100 100 100 100 100 100 100 100 0 0
ZONE 5 WESTERN PLATEAU DIVISION ZONE 5 WESTERN PLATEAU DIVISION
0.5 1 3 6 12 24 48 72 96 120 0.5 1 3 6 12 24 48 72 96 120
16 3.9 8.5 11 12 31.3 32.9 40.1 16 4.3 8.9 10.6 9.5 23.9 25.1 31.325 7 30 33.1 28.1 13.9 13.1 13.8 24 7.3 23.6 26.1 21.1 11.4 10.6 11.733 16.8 19.9 19.2 7.9 3.3 7.6 8.7 30 16.1 17.4 16.9 6.5 3.9 6.4 89 12 13 8.4 4.5 10.5 6.5 6.6 10 11.6 12.4 8.9 4.4 9.3 6 6.611 23.2 7 7.1 7.1 6 5.2 6 12 21.7 7.9 8 6.4 5.6 5 6.46 10.1 5.6 5.5 4.8 4.8 5.1 4.3 8 10 6.8 6.7 4.4 4.7 5.4 4.9
8.9 4.5 4.3 4.4 4.3 4 3.1 9 5.8 5.6 4.7 4.5 4.4 3.75.7 3.6 3.4 3.9 3.4 3.3 2 6 5 4.7 4.4 3.7 3.8 2.64.8 2.8 2.3 3.4 2.9 2.6 2.5 5.2 4.1 3.6 4 3.5 3 3.13.1 2.2 2.8 3 2.1 2.2 1.7 3.5 3.4 4.1 3.7 2.7 2.6 2.32.6 1.7 1.6 2.3 2.4 1.6 1.5 3 2.8 2.6 3 3 2 21.9 1.2 1.3 2.6 1.9 1.8 1.4 2.3 1.9 2.2 3.3 2.6 2.1 2
1.6 1.6 1.4 1.4 2.4 2.2 1.8 2.32.1 1.5 1.2 1.4 2.9 2.2 1.5 2.41.3 1.1 1.2 1.4 1.9 1.6 1.6 2.51.8 0.7 1.2 1.4 2.7 1.1 1.7 2.71.1 1.3 1.2 1.4 1.7 1.9 1.9 2.81.2 1.3 1.1 1.3 1.8 2.1 2 2.71.9 1.1 1.1 2.7 1.8 2.11 0.7 1.2 1.5 1.2 21 0.9 1.2 1.6 1.7 2.11 1 1.1 1.7 1.7 2.21 1 1.1 1.8 1.8 2.31 1 1.1 1.9 1.9 2.4
100 100 100 100 100 100 100 100 0 0 100 100 100 100 100 100 100 100 0 0
ZONE 7 INDIAN OCEAN DIVISION ZONE 7 INDIAN OCEAN DIVISION
0.5 1 3 6 12 24 48 72 96 120 0.5 1 3 6 12 24 48 72 96 120
16 3.9 3.2 7.9 3.2 14.7 35.4 41 16 4.3 4.4 8.7 3.6 12.5 27.6 32.525 7 18.6 29.5 23.8 31.2 11.9 12.8 24 7.3 16.3 23.6 18.3 24.6 9.8 1133 16.8 26.8 12.4 14.9 5.6 6.3 8.1 30 16.1 21.3 11.9 12.4 5.8 5.3 7.59 12 12.9 18.6 3.6 9.5 5.8 5.2 10 11.6 12.3 16.4 3.8 8.7 5.3 5.511 23.2 9.4 8 1.9 6.6 4 7.4 12 21.7 9.6 8.1 2.7 6.4 4 7.36 10.1 6.2 3.1 0.9 5.1 4.5 4.2 8 10 7.2 4.3 1.4 5.6 4.3 4.7
8.9 2.6 2 2.7 4.1 4 3.2 9 3.7 3.1 3.1 4.6 4.3 3.75.7 4.9 2.6 4.7 1.8 2.3 1.8 6 6 3.8 4.8 2.5 2.6 2.34.8 7.8 4.7 11.4 2.2 2.7 1.5 5.2 8.6 5.8 10.2 3 3 2.43.1 4 5.9 8.2 3.4 2 1.5 3.5 5.2 6.9 7.7 4 2.4 2.52.6 2.1 3.9 6.1 1.6 1.6 1.5 3 3.1 5.1 6.1 2.3 2 2.61.9 1.5 1.4 2.6 0.8 3.2 2.5 2.3 2.3 2.3 3.2 0.6 3.6 3
2.3 0.3 1.8 2.1 2.9 0.3 2.2 2.72.1 1.2 1.4 1.6 2.8 2 1.9 2.11.6 2.5 1.5 1.6 2.3 3.3 2 2.41.8 1.4 1.4 1.3 2.7 2.1 2.1 2.51.2 1.1 1.4 1.3 1.9 1.9 2.2 2.71.3 0.3 1.4 1.4 2 0.3 2.4 2.61.5 0.4 1.4 2.3 0.5 1.10.9 1 1.1 1.5 1.8 2.20.8 0.7 1.1 1.4 1.2 2.41.1 1.3 1.2 0.7 2 2.40.9 2.9 1.3 1.6 3.6 2.40.5 0.3 1.3 0.6 0.4 2.5
100 100 100 100 100 100 100 100 0 0 100 100 100 100 100 100 100 100 0 0
Duration (hrs) Duration (hrs)
Duration (hrs) Duration (hrs)
Duration (hrs) Duration (hrs)
Duration (hrs) Duration (hrs)
JDA ConsultantHydrologists
ARI <30yrs ARI >30yrs
ARI <30yrs ARI >30yrs
ARI <30yrs ARI >30yrs
ARI <30yrs ARI >30yrs

Suite 1, 27 York St, Subiaco WA 6008 PO Box 117, Subiaco WA 6904
Ph: +61 8 9388 2436 Fx: +61 8 9381 9279
www.jdahydro.com.au