iron man gypsum amendment of subsoil drains to … · iron man gypsum amendment of subsoil drains...
TRANSCRIPT

Government of Western AustraliaDepartment of Water
Securing Western Australia’s water future
Report no. WST 78October 2016
Iron Man Gypsum amendment of subsoil drains to treat nutrients in urban groundwater discharge


Iron Man Gypsum amendment of subsoil drains to treat nutrients in urban groundwater discharge Report to the Department of Parks and Wildlife on the field trial in the Abingdon Development, Southern River
Securing Western Australia’s water future
Department of Water
Water science technical report series
Report no. 78
October 2016

Department of Water
168 St Georges Terrace
Perth Western Australia 6000
Telephone +61 8 6364 7600
Facsimile +61 8 6364 7601
National Relay Service 13 36 77
www.water.wa.gov.au
© Government of Western Australia
October 2016
This work is copyright. You may download, display, print and reproduce this material in unaltered form
only (retaining this notice) for your personal, non-commercial use or use within your organisation.
Apart from any use as permitted under the Copyright Act 1968, all other rights are reserved. Requests
and inquiries concerning reproduction and rights should be addressed to the Department of Water.
ISSN 1836-2869 (print)
ISSN 1836-2877 (online)
ISBN 978-1-925387-27-8 (print)
ISBN 978-1-925387-28-5 (online)
Recommended reference
Degens, BP & Shackleton, M 2016, Iron Man Gypsum amendment of subsoil drains to treat nutrients
in urban groundwater discharge, Water Science Technical Series, Report No. 78, Department of
Water, Western Australia.
Acknowledgements
The Department of Water thanks Debbie Besch, Krish Seewraj and Zoe Bainbridge for reviewing the
publication and providing useful comments that helped improve the work. Thanks also to Alex
Waterhouse for technical editing. Funding for this project was provided by the Department of Housing
and the State NRM office and administered by the Department of Parks and Wildlife, Rivers and
Estuaries Division (formerly Swan River Trust).
For more information about this report, contact
Manager, Water Science Branch.
Cover photograph: Stage 1 Site works April 2013
Disclaimer
This document has been published by the Department of Water. Any representation, statement,
opinion or advice expressed or implied in this publication is made in good faith and on the basis that
the Department of Water and its employees are not liable for any damage or loss whatsoever which
may occur as a result of action taken or not taken, as the case may be in respect of any
representation, statement, opinion or advice referred to herein. Professional advice should be
obtained before applying the information contained in this document to particular circumstances.
This publication is available at our website <www.water.wa.gov.au> or for those with special needs it can be made available in alternative formats such as audio, large print, or Braille.

Amendment of subsoil drains in an urban development Water Science Technical Report no. 78
Department of Water iii
Contents Contents ..................................................................................................................... iii
Summary ..................................................................................................................... v
1 Introduction.............................................................................................................. 1
2 Background ............................................................................................................. 2
2.1 Location, history and climate ............................................................................................ 2 2.2 Hydrological context ......................................................................................................... 2
3 Methods .................................................................................................................. 4
3.1 Design and installation ..................................................................................................... 4 3.2 Monitoring and evaluation of hydrology ............................................................................ 8 3.3 Evaluation of geotechnical properties ............................................................................ 11
4 Results .................................................................................................................. 12
4.1 Hydrogeology and hydrology ......................................................................................... 12 4.2 Background variation in groundwater quality ................................................................. 14 4.3 Groundwater interaction with subsoil drains ................................................................... 17 4.4 Quality of groundwater interacting with subsoil drains ................................................... 18 4.5 Geotechnical properties ................................................................................................. 24
5 Discussion ............................................................................................................. 26
5.1 Recommendations for amending subsoil drains ............................................................ 28 5.2 Recommended further work ........................................................................................... 29
Appendices ................................................................................................................ 30
Shortened forms ........................................................................................................ 45
References ................................................................................................................ 46

Water Science Technical Report no. 78 Amendment of subsoil drains in an urban development
iv Department of Water
Figures
Figure 1: Location of the subsoil amendment trial in the Abingdon development ................ 3 Figure 2: Cross-section view of amended soil placement with subsoil drains ..................... 5 Figure 3: Stockpile of IMG-amended sand fill (a) and excavator placement of the
amended soil (b) ................................................................................................. 5 Figure 4: Installation of the subsoil drainage in the amended soil zone with (a)
trenching and (b) geotextile lined aggregate ....................................................... 6 Figure 5: Layout of amended and control subsoil drains in the Abingdon development ...... 7 Figure 6: Overview of groundwater monitoring sites ............................................................ 9 Figure 7: Groundwater and drain monitoring points for amended and control drains ........ 10 Figure 8: Cross-section view of monitoring bore installation depths in relation to the
amended soil and subsoil drains....................................................................... 10 Figure 9: Groundwater contours for minimum groundwater levels prior to
development (2013) .......................................................................................... 12 Figure 10: Groundwater contours for minimum groundwater levels following
development and the first winter (summer 2014/15) ......................................... 13 Figure 11: Groundwater response after wetting up of the site during the first winter ......... 13 Figure 12: Total phosphorus in perimeter groundwater bores ........................................... 15 Figure 13: Soluble phosphorus (SRP) in perimeter groundwater bores ............................ 15 Figure 14: Total nitrogen in perimeter groundwater bores ................................................. 16 Figure 15: Chloride (reflecting salinity) in perimeter groundwater bores ............................ 16 Figure 16: Groundwater levels across the developed area with treated and control
drains ................................................................................................................ 17 Figure 17: Concentrations of sulfate in groundwater interacting with IMG-amended
soils (red points and lines) in relation to adjacent deep and shallow groundwater ...................................................................................................... 22
Figure 18: Testing apparatus ............................................................................................. 40 Figure 19: Measured hydraulic conductivity values for each stage .................................... 41 Figure 203: Measured EC for each stage and the tap (input) water values ....................... 42 Figure 214: Measured settlement for each stage .............................................................. 42
Tables
Table 1: Lengths of treated and control drains and associated monitoring points (as illustrated above) .................................................................................................. 7
Table 2: Chloride and dissolved iron in groundwater below (deep), within (IMG zone) and adjacent to (No-IMG fill) IMG-amended subsoils ......................................... 19
Table 3: Average total and dissolved phosphorus in groundwater below (deep), within (IMG zone) and adjacent to (Non-IMG fill) IMG-amended subsoils when groundwater was interacting with drains in 2014 ................................................ 20
Table 4: Average total and dissolved nitrogen fraction in groundwater below (deep), within (IMG zone) and adjacent to IMG-amended subsoils when groundwater was interacting with drains in 2014 ................................................ 21
Table 5: Nutrient concentrations and selected metals at subsoil drain discharge points during peak groundwater levels in September 2014 ................................ 23
Table 6: Summary results for geotechnical test results for IMG-amended and non-amended fill materials ......................................................................................... 24

Amendment of subsoil drains in an urban development Water Science Technical Report no. 78
Department of Water v
Summary Soil amendments placed around subsoil drains were evaluated as a treatment medium for soluble phosphorus (P) and organic nitrogen (N) in shallow groundwater beneath the Abingdon development, Southern River. The subsoil drains were constructed beneath sand fill brought onto the development to raise the ground surface above the shallow groundwater across the site. A bed of soil around three drains of 285 m total length was amended with a 10% blend of Iron Man Gypsum (IMG) and sand fill and compared with similarly constructed non-amended subsoil drains. Shallow monitoring bores constructed in nested arrangements were used to sample groundwater below, adjacent to and within the amended zones. This was complemented with monitoring of bores on the perimeter of the development before, during and after civil construction works. Discharge from the subsoil drains was also sampled during a single event.
Significant concentrations of nutrients were measured in shallow groundwater across the site before development, reflecting a complex pattern of historical local and up-gradient land-use effects on groundwater quality. Total P concentrations varied up to three orders of magnitude from less than 0.05 to 3.4 mg/L whereas total N varied over two orders of magnitude from 1.3 to 21 mg/L. Most variation was spatial though some concentrations also showed large seasonal patterns reflecting winter recharge and subsequent evapoconcentration. These nutrients were typically in a moderately saline, anoxic and acidic–slightly acidic aquifer environment.
Monitoring during the first winter of functioning showed that soluble P concentrations in groundwater interacting with the amended soils fell by up to 95% from concentrations ranging from 0.7 to 3 mg/L. This was concurrent with up to 60% of soluble organic N being removed. Similar patterns of nutrient removal were also evident in a sample of drain flows from the amended subsoils. Effects on soluble nutrients were also reflected in total P but not total N, mainly because lowered organic N concentrations were offset by increased nitrate leaching from the sand fill. After development, shallow groundwater also became fresher and more oxidised, with concurrent reductions in dissolved iron in the groundwater interacting with the subsoil drains.
Testing the geotechnical properties of the IMG-amended sands showed the soils to be similar to the standard sand fill in terms of permeability, compaction requirements and load strength. In addition, changes in permeability and settling of the amended soils were no different from the non-amended soils after extended leaching, removing all the soluble components of the amended sands.
Initial results indicate that amending subsoil drains with 10% IMG-sand mix beneath an urban development presents an effective treatment to remove dissolved nutrients such as soluble P and organic N in shallow groundwater discharging via subsoil drains. This treatment happens under conditions where the preliminary risks of clogging by fines or by iron precipitates are likely to be minimal.


Amendment of subsoil drains in an urban development Water Science Technical Report no. 78
Department of Water 1
1 Introduction The Department of Water has been funded by the Department of Housing and under the state government’s Swan Canning water quality improvement plan (SWQIP) to progress the use of soil amendments in urban settings. This recognises the role of the department in providing advice for urban development approvals and drainage improvements. Reducing nutrient losses from new developments is a key consideration in new residential and commercial developments. This includes the use of amendments incorporated with subsoils to treat groundwater discharge or infiltrated stormwater in new urban developments in areas with shallow watertables.
Historical agriculture and horticulture activities on the Bassendean Dune soil system have resulted in contamination of shallow groundwater largely because of the poor nutrient retention characteristics of the soils. This is reflected in nutrient contamination of groundwater (Gerritse et al. 1990; Appleyard 1995) and arises because of the low cation exchange capacity and adsorption characteristics of the highly leached sandy soils (He et al. 1998). Subsequent urban development on the Bassendean Dune systems can mobilise nutrients accumulated under historical land uses due to a combination of increased recharge and drainage systems to recharge stormwater and managed shallow groundwater (Barron et al. 2013).
Soil amendments have been identified as a management option that can have a significant influence on reducing the discharge of nutrients from urban and peri-urban areas of the Swan Coastal Plain with high watertables (Swan River Trust 2009). A review of potential amendments (Wendling & Douglas 2009) and assessment of these in lab-based column investigations (Wendling et al. 2010) identified a gypsum-iron-rich by-product of mineral sands processing as being suitable for removing dissolved phosphorus (P) and organic nitrogen (N) from surface water. This product is neutralised used acid effluent (NUA), more widely known as Iron Man Gypsum (IMG), produced during processing of mineral sands (Wendling & Douglas 2009). Field-scale trialling with comprehensive geochemical sampling and analysis of IMG blended with topsoil at a turf farm in the Ellen Brook catchment over four years found the material to be very effective at preventing dissolved P from leaching to groundwater and found no contaminants that might be a risk to the environment leaching from the blended soils (Douglas et al. 2012). The success of this trial formed the basis of trialling IMG blends to address nutrients in groundwater discharging to subsoil drains.
This project reports on the first year of results from a field-scale investigation trial of IMG-amended soils associated with subsoil drains in an urban development to treat discharge of groundwater left nutrient rich as a result of prior land use.

Water Science Technical Report no. 78 Amendment of subsoil drains in an urban development
2 Department of Water
2 Background
2.1 Location, history and climate
The trial was carried out in the Abingdon development, which is a stage of the Bletchley Park housing estate constructed by the Wallis Property Company in the southern Perth suburb of Southern River (Figure 1). The development is built on the Swan Coastal Plain, an area of gently undulating sand dunes between the Darling Escarpment and the Indian Ocean.
The area has been progressively developed for housing since the late 2000s after more than 40 years of agricultural use. Aerial photography indicates this began as low-density grazing in the early 1950s and steadily intensified into the 1970s with more drainage for winter access but remained relatively similar thereafter. The land to the north of the trial area was used for locally intensive activities (such as feed lotting of sheep and poultry production in the 1980s) that were unlikely to influence groundwater at the trial site because these were down-gradient.
2.2 Hydrological context
The development site is located in the Southern River catchment of the Canning River estuary. Surface water in the area drains locally via the Lander St drain which discharges to the Forrestdale main drain. In the lower reaches this drain becomes Forrestdale Creek which discharges to the Southern River. While the Forrestdale main drain was constructed in the 1940s, aerial photography indicates the Lander St drain was constructed much later, in the late 1960s.
The hydrogeology of the development site is dominated by the geology of the Bassendean Sand formation and underlying Ascot Formation. These constitute the superficial formations where Bassendean Sand in the area is typically medium to coarse grained, poorly sorted grey sand. Nearer the surface the formation includes frequent swamp deposits consisting of shallow peat, peaty sand and clays (Bourke & Paton, in prep). This is widespread in the Southern River area and noted in excavations across the site for the deep sewerage main. The Ascot Formation is located towards the base of the superficial formations and in this area typically contains coarse, shelly sands and silty sands (Bourke & Paton, in prep). The Bassendean Sand formation was interpreted from drilling logs for two production bores at the site (WIN database sites 23059746 and 23047080) to have a thickness of 25–27 m with the underlying Ascot Formation interpreted as having a thickness of 17–22 m. The superficial formation in the surrounding area is subcropped by the Leederville Formation mostly consisting of the thinning eastern edge of the Kardinya Shale and Pinjar Member (Davidson & Yu 2006).
The superficial aquifer lies within the Bassendean Sand and Ascot Formations, but the shallow hydrogeology is dominated by localised occurrences of iron cemented sands and clayey sands in the shallow Bassendean Sand. Regional superficial

Amendment of subsoil drains in an urban development Water Science Technical Report no. 78
Department of Water 3
aquifer groundwater flows in the area are in a north-easterly direction dominated by the regional influence of the northern part of Jandakot Mound (Davidson & Yu 2006).
Figure 1: Location of the subsoil amendment trial in the Abingdon development

Water Science Technical Report no. 78 Amendment of subsoil drains in an urban development
4 Department of Water
3 Methods
3.1 Design and installation
Iron Man Gypsum (IMG) was blended with sandy fill used in the Abingdon development selectively treating drains in a 9.1 ha subarea of the development. A 10% mix (vol/vol) of IMG and sand fill was specified for the encasing media for the subsoil drains. This was based on advice from Grant Douglas at CSIRO on a blend likely to be safe for the receiving environment and achieve removal of nutrients without compromising short-term permeability or long-term compaction. IMG is a fine, unconsolidated, poorly structured material with on average 80% gypsum which dissolves during the life of the material (Wendling et al. 2010).
IMG was provided in bulk by Iluka Resources Pty Ltd from stockpiles at their Capel operations for trial purposes only under an agreement between the Department of Water and Iluka. Over 70 tonnes (t) of IMG was trucked to site for the 298 m of amended drains reported here. The unblended IMG delivered to site was subsampled and characterised by analysis of major and minor elements by XRF and mineralogy by XRD (results in Appendix A). In general, the material was similar to that reported in previous work (Wendling et al. 2010, Douglas et al. 2012). Subsamples of the sand fill mixed with the IMG were also characterised for reference (Appendix A).
Achieving an even mix of IMG and sandy fill before placement in the subsoil was important. Mixing was best achieved in batches on a pre-prepared pad (generally 15 x 15 m). Fill was spread approximately 0.3 m thick over the pad with a front-end loader and topped with the appropriate volume of IMG to achieve the 10% vol/vol mix on a loader bucket basis (Figure 3). Calculations following the works found the amendment rate to be on average 0.2 t/m of subsoil drain but could range from 0.16 to 0.34 t/m depending on wet weight and variation in bulk density.
The best blending results were achieved by rotary hoeing the mixture with a tractor mounted machine with several passes followed by heaping, respreading and re-hoeing at least once to ensure even mixing throughout the whole stockpile. This was verified in the contractual process by on-site visits and photographic evidence of the blending. IMG was held on-site until required for blending with surface wetting to avoid dust issues during summer and autumn. Blending with high moisture content IMG brings a risk of poor mixing and balling of the material.
The amended sandy fill was placed to encase subsoil drains in a 2 m wide x 0.45 m deep bed (Figure 2). A trench was first excavated then backfilled with amended material and compacted with a batter bucket (Figure 3). A smaller narrow trench was excavated in the centre of the amended bed, lined with geotextile cloth and backfilled with crushed rock aggregate with the 0.2 m diameter subsoil drain with longitudinal slots seated within this (see Figure 2; Figure 4). Non-amended subsoil drains were constructed similarly to the amended drains, except for backfilling with the standard sand fill rather than the amended sand fill.

Amendment of subsoil drains in an urban development Water Science Technical Report no. 78
Department of Water 5
Figure 2: Cross-section view of amended soil placement with subsoil drains
Figure 3: Stockpile of IMG-amended sand fill (a) and excavator placement of the
amended soil (b)
Aggregate in geotextile wrap
0.4 (w) x 0.3 (d)
IMG-amended fill (10% v/v)
0.45 m
200 mm diam. subsoil drain (longitudinal slots)
AAMGL
300 mm limestone layer
2 m
0.15 m
Fill
Original soil
Excavation pit
(backfilled)
(a) (b)

Water Science Technical Report no. 78 Amendment of subsoil drains in an urban development
6 Department of Water
Figure 4: Installation of the subsoil drainage in the amended soil zone with (a)
trenching and (b) geotextile lined aggregate
The trial was laid out as a series of amended (treated) and non-amended (control) subsoil drains in sections covering a 9.1 ha subarea of the development (Figure 5). The overall layout of the drains was decided by the consulting engineers as part of the civil engineering design for the development with selection of treated and control sections based on recommendations from the Department of Water. As such, placement of the subsoil drains, maintenance pits and length of drained sections were constrained by location of road verges, other services (power, gas, communications, stormwater), surface elevations and connection of outflow points to regional drainage determined alignments. Design of the subsoil drainage was guided by the Abingdon urban water management plan (GHD 2012).
Selection of subsoil drain lines for treated and control sections were based on where drain discharge could be sampled and where there was no likely influence of stormwater backup. This was also decided by the timing of development stages to achieve the earliest installation. Short sections were targeted to minimise the effects of the large variation in groundwater quality across the site and enable better evaluation of processes taking place within the amended zones around the subsoil drains (Table 1). This excluded subsoil drain lines where both amended and non-amended drains discharged to a single line.
Construction for the trial was between April and October 2014 as required by the scheduling and progression of the other civil engineering works being done on-site to install roads, paths and power, water, communication and drainage services. This
(a) (b)

Amendment of subsoil drains in an urban development Water Science Technical Report no. 78
Department of Water 7
Figure 5: Layout of amended and control subsoil drains in the Abingdon development
Table 1: Lengths of treated and control drains and associated monitoring points (as illustrated above)
Treatment Street Treated length
(m)
Tonnes IMG used
StageDrain
monitoring points
Monitoring bores
Amended subsoil 1
Millway Ave 102 34.5 1C 2 5
Amended subsoil 2
Bradstocks Gr west
28 9.5 1B 1 3
Amended subsoil 3
Bradstocks Gr
east 168 27 2 1 5
Control subsoil 1
Ruskin Way 96 0 1B 2 5
Water Science Technical Report no. 78 Amendment of subsoil drains in an urban development
8 Department of Water
was preceded by placement and compaction of the sandy fill between December 2012 and February 2013 followed by construction of the deep sewerage main between February and May 2013. The latter involved excavating up to 8 m deep beneath Ruskin Way and Bradstocks Grove with subsequent dewatering and on-site infiltration for several months. High silt concentrations produced during dewatering created problems with infiltration immediately on the site, with much of the water later contained and recharged to the north-east near bore B3.
3.2 Monitoring and evaluation of hydrology
Hydrological monitoring focused on groundwater levels and quality as a basis for assessing fluxes and subsoil drain flows.
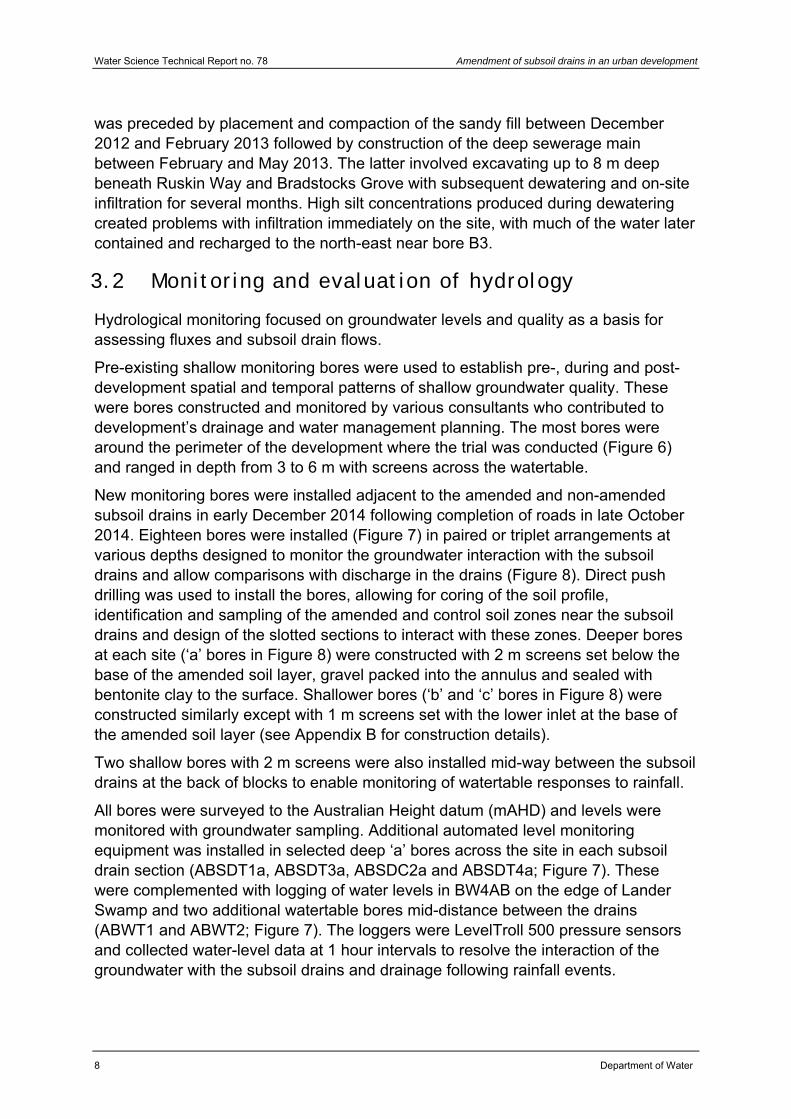
Pre-existing shallow monitoring bores were used to establish pre-, during and post-development spatial and temporal patterns of shallow groundwater quality. These were bores constructed and monitored by various consultants who contributed to development’s drainage and water management planning. The most bores were around the perimeter of the development where the trial was conducted (Figure 6) and ranged in depth from 3 to 6 m with screens across the watertable.
New monitoring bores were installed adjacent to the amended and non-amended subsoil drains in early December 2014 following completion of roads in late October 2014. Eighteen bores were installed (Figure 7) in paired or triplet arrangements at various depths designed to monitor the groundwater interaction with the subsoil drains and allow comparisons with discharge in the drains (Figure 8). Direct push drilling was used to install the bores, allowing for coring of the soil profile, identification and sampling of the amended and control soil zones near the subsoil drains and design of the slotted sections to interact with these zones. Deeper bores at each site (‘a’ bores in Figure 8) were constructed with 2 m screens set below the base of the amended soil layer, gravel packed into the annulus and sealed with bentonite clay to the surface. Shallower bores (‘b’ and ‘c’ bores in Figure 8) were constructed similarly except with 1 m screens set with the lower inlet at the base of the amended soil layer (see Appendix B for construction details).
Two shallow bores with 2 m screens were also installed mid-way between the subsoil drains at the back of blocks to enable monitoring of watertable responses to rainfall.
All bores were surveyed to the Australian Height datum (mAHD) and levels were monitored with groundwater sampling. Additional automated level monitoring equipment was installed in selected deep ‘a’ bores across the site in each subsoil drain section (ABSDT1a, ABSDT3a, ABSDC2a and ABSDT4a; Figure 7). These were complemented with logging of water levels in BW4AB on the edge of Lander Swamp and two additional watertable bores mid-distance between the drains (ABWT1 and ABWT2; Figure 7). The loggers were LevelTroll 500 pressure sensors and collected water-level data at 1 hour intervals to resolve the interaction of the groundwater with the subsoil drains and drainage following rainfall events.
Amendment of subsoil drains in an urban development Water Science Technical Report no. 78
Department of Water 9
Figure 6: Overview of groundwater monitoring sites
All bores (except ABWT1 and ABWT2) were pump sampled monthly for physical properties (pH, EC, temp, dissolved oxygen and redox potential), major ions (Na, Ca, K, Mg, Cl and SO4), total and dissolved nutrients (TN, TP, NOx, NH4, SRP and soluble organic N), dissolved organic C and trace elements (As, Ag, Al, Cd, Cr, Co, Cu, Fe, Hg, Mn, Mo, Ni, Se, Zn, Pb). Strontium was included as an additional element in the trial monitoring bores near the amended subsoils. As development and civil engineering works progressed, access to some bores became difficult and other bores, such as MW1 in 2013 and B2, were destroyed during 2014. Bore B5 was maintained during the development with access enabled by extending the top of casing with temporary PVC piping until final ground levels and works were completed.
Subsoil drain discharge from control and treated drains was also sampled on one occasion from the subsoil pits, where access was possible (Figure 7). Infrequent flows in the drains and building activities on site prevented regular sampling during the first year following construction.
Samples of the sandy fill, unblended IMG and IMG-amended sandy fill were also analysed for major and minor element concentrations by XRF.

Water Science Technical Report no. 78 Amendment of subsoil drains in an urban development
10 Department of Water
Figure 7: Groundwater and drain monitoring points for amended and control drains
Figure 8: Cross-section view of monitoring bore installation depths in relation to the amended soil and subsoil drains
IMG-fill blend (10% v/v)
0.45 m
200 mm diam. subsoil drain (longitudinal slots)
AAMGL
300 mm limestone layer
2 m
2 m
0.15 m
Original soil
Fill
a b c

Amendment of subsoil drains in an urban development Water Science Technical Report no. 78
Department of Water 11
3.3 Evaluation of geotechnical properties
The geotechnical properties of the amended fill sands were assessed in relation to non-amended sandy fill on bulk samples taken from the sites during staging of the development. Three blended batches of the amended fill were sampled in 20–50 kg lots from on-site stockpiles prior to placement with the subsoil drains and matched with non-amended fill used on-site. Geotechnical testing consisting of particle size distribution (AS 1289 3.6.1), optimum compaction density (AS 1289 5.2.1), load bearing capacity (California Bearing Ratio, AS 1289 6.1.1) and permeability (AS 1289 6.7.1) was undertaken using the NATA accredited services of Golder Associates (Appendix C).
Extended leaching tests were also conducted to assess the effects of extended leaching (more than 300 pore volumes) on the permeability and strength properties of bulk amended and non-amended sands. Tap water was leached through subsamples compacted into cores to a density similar to on-site compaction and leached while held under a load simulating the sand pressure over the amended sand in the field. Further details are provided in Appendix D.

Water Science Technical Report no. 78 Amendment of subsoil drains in an urban development
12 Department of Water
4 Results
4.1 Hydrogeology and hydrology
In the pre-development state, shallow groundwater was dominated by flow from the south to the north with an influence of the drainage system (Figure 9). Seasonally groundwater levels varied by 0.7 to 2.7 m with maximum levels generally reached in late August and minimum levels between February and May. During periods of high groundwater there was discharge to the Ballanup Drain running through the site.
Figure 9: Groundwater contours for minimum groundwater levels prior to development (2013)
After the civil works were completed, groundwater rose rapidly in the first few months, reaching maximum levels by early July (Figure 11). These levels reflected where groundwater began to flow into the subsoil drains constraining the maximum groundwater rise across the site. With the earthworks finished and the first winter’s rainfall, groundwater levels in the summer of 2014-15 remained mounded across the site relative to the pre-development state (Figure 10).

Amendment of subsoil drains in an urban development Water Science Technical Report no. 78
Department of Water 13
Figure 10: Groundwater contours for minimum groundwater levels following development and the first winter (summer 2014/15)
Figure 11: Groundwater response after wetting up of the site during the first winter

Water Science Technical Report no. 78 Amendment of subsoil drains in an urban development
14 Department of Water
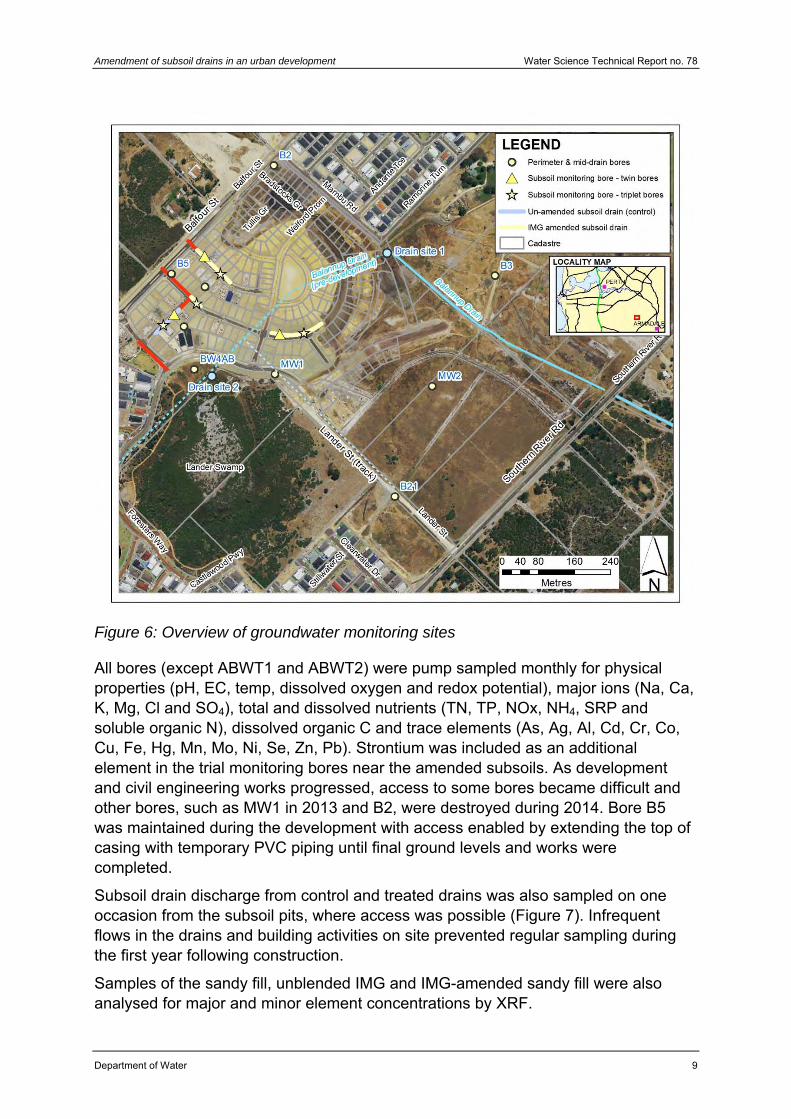
4.2 Background variation in groundwater quality
Water quality varied significantly in time and space across the development area over the two years of monitoring. Total phosphorus concentrations varied from less than 0.05 to 3.4 mg/L (Figure 12) whereas total nitrogen varied from 1.3 to 21 mg/L (Figure 14). The majority of the phosphorus was soluble inorganic P and its concentration varied from less than 0.05 to 2.8 mg/L (Figure 13). In contrast, nitrogen, dominated by soluble organic N, had concentrations that ranged from 0.4 to 8.4 mg/L with the balance dominated by ammonia. Oxidised forms of nitrogen such as nitrate were rare, occurring only near to where there was fill and dewatering recharge (e.g. at bore B5 adjacent to the developed area). The large spatial variation in water quality was unclear but probably relates to a combination of historical land-use activities and later up-gradient urbanisation. Water quality at B21 and to a lesser extent MW2 probably intersects the edge of the nutrient plume from the historical effluent disposal site up-gradient 700 m south-south-west of the site (DER contaminated sites database report for 1768 Furley Rd, Southern River).
Nutrient concentrations did not vary over time at some sites but varied significantly at others. There were large seasonal variations in total and soluble P concentrations with these doubling at B21 to the south-east, B3 to the north-east and B2 in the north-west (Figure 13). Similar variations in total N also were measured at sites B2 and B3 and B5 to the west and generally corresponded with variations in chloride concentrations for each bore (Figure 15), indicating seasonal recharge (dilution) and evaporation (concentration) controls on nutrient concentrations.
The effects of civil engineering works are evident at bore B3 on the up-gradient margin of the development area. Here, total nitrogen concentrations increased in winter–spring months (Figure 14) mostly because of rising nitrate exceeding more than 18 mg/L and comprising > 75% of total N. Shallow groundwater also became significantly fresher and remained so (Figure 15).
The effects of the development on groundwater quality in bores down-gradient of the site were not evident until the end of 2014, but are unlikely to be observed for some years because groundwater flow rates are in the order of 10s of metres per year. The influence of dewatering discharge from the site between March and May 2013 was evident at bore B3 with ponding and infiltrating water making groundwater fresher in August 2013 than at any other time during monitoring (Figure 15).
Amendment of subsoil drains in an urban development Water Science Technical Report no. 78
Department of Water 15
Figure 12: Total phosphorus in perimeter groundwater bores
Figure 13: Soluble phosphorus (SRP) in perimeter groundwater bores

Water Science Technical Report no. 78 Amendment of subsoil drains in an urban development
16 Department of Water
Figure 14: Total nitrogen in perimeter groundwater bores
Figure 15: Chloride (reflecting salinity) in perimeter groundwater bores

Amendment of subsoil drains in an urban development Water Science Technical Report no. 78
Department of Water 17
4.3 Groundwater interaction with subsoil drains
The subsoil drains flowed intermittently during the first 12 months of monitoring reflecting rapid wetting up of the site after construction, but with groundwater hydrology not yet stabilised. Automated water-level loggers recorded groundwater rise of 1 to 1.5 m between May and July with a flattening of the response after this reflecting level control by the subsoil drains (Figure 16). Groundwater levels intermittently rose above the base of the subsoil drains thereafter indicating intermittent flows after rain events after August (Figure 16). A sand blockage in the outlet of the control drain and treated drain on Bradstocks with bore resulted in water levels backing up above the base of the drains and higher groundwater levels in the bores at these sites (ABSDC2a and ABSDT3a).
Water levels across the site had a steep gradient of 0.8 m fall across the developed area from the south-west to the north-east (Figure 16) – between the Lander Swamp (bore BW4AB) through to bore ABWT2 at the back of the houses and groundwater levels near the subsoil drains (ABSDC1a, ABSDC2a, ABSDT3a). There was slight mounding within the development with water levels at the bore on the north-eastern edge (bore B5) slightly lower than in bores in the developed area.
Figure 16: Groundwater levels across the developed area with treated and control drains
0
5
10
15
20
25
30
35
40
45
20
20.2
20.4
20.6
20.8
21
21.2
21.4
21.6
21.8
22
Jan‐14 Feb‐14 Mar‐14 Apr‐14 May‐14 Jun‐14 Jul‐14 Aug‐14 Sep‐14 Oct‐14 Nov‐14 Dec‐14
Daily rainfall (m
m)
Groundwater level (mAHD)
Date
Gosnells Rainfall
Wetland margin bore
Mid‐Drain Bore #1
Control drain #2
Mid‐Drain bore #2
Treated Drain #1
Treated drain # 2
Lander swamp margin(BW4AB)
Mid drain(ABWT1)
Control drain(ABSDC2a)
Mid drain(ABWT2)
Treated drain(ABSDT3a)
Treated drain(ABSDT1a)
Control drain inverts

Water Science Technical Report no. 78 Amendment of subsoil drains in an urban development
18 Department of Water
4.4 Quality of groundwater interacting with subsoil drains
The groundwater within the developed area is generally more oxidised and fresher than pre-development and surrounding groundwater. The freshening happened during the first winter with the recharge of groundwater from the stormwater drainage system. Shallow groundwater became progressively fresher than deeper groundwater during the first winter, as shown by average chloride concentrations (Table 2). The shallowest 0.5 m of the groundwater had dissolved oxygen concentrations ranging from 1.4 to 4 mg/L, up to 8 times greater than deeper groundwater (0.3–0.9 mg/L). This also corresponded with less dissolved iron (Table 2) and higher nitrate than deeper groundwater, which was generally similar to that of the perimeter bores.
Groundwater had lower concentrations of several nutrients in the developed area than in the surrounding perimeter groundwater but higher inorganic N. Total P concentrations ranged < 0.005–0.72 mg/L with soluble P (SRP) similarly ranging from < 0.005 to 0.58 mg/L (Table 3). The lowest concentrations were consistently found in the parts of the development (control, amended 2, 4 and 5 in Table 3) where there had been extensive dewatering to install the deep sewerage main.
Total nitrogen concentrations in shallow groundwater were significantly greater than concentrations in deeper groundwater (Table 4) and surrounding perimeter bores. The greater concentration was attributed to greater nitrate and nitrate (NOx), which in deeper groundwater and surrounding bore was often below detection limits (< 0.01 mg/L). In contrast, concentrations of total nitrogen in the deeper groundwater beneath the developed area were generally similar to that of up-gradient groundwater (at BW4AB and B5). In shallow groundwater, the NOx concentrations varied between sampling events indicating that this originated as leachate from the soil fill with rainfall recharge.
Groundwater flow through the IMG-amended sand removed soluble P (SRP) and organic N prior to discharge to the subsoil drains where constructed to design. Soluble P was decreased by up to 97% in the groundwater in the IMG-amended soils compared with inflow groundwater (Table 3). Concentrations in most of the amended soil zones were between 0.014 mg/L and below detection (0.005 mg/L) following average inflow concentrations up to 0.58 mg/L. Poor and erratic removal of soluble P and organic N was evident in amended drain 3 (amended 3) on Bradstocks Grove where the IMG was poorly mixed with the sand fill.
Dissolved organic N concentrations were also decreased by the IMG-amended sand, but by up to 60% (Table 3). This did not result in a similar reduction in total N because of the large oxidised N (NOx) concentrations in shallow groundwater which is typically dominated by nitrate (NO3). There was little difference between the oxidised N concentrations in the amended and non-amended zones.

Table 2: Chloride and dissolved iron in groundwater below (deep), within (IMG zone) and adjacent to (No-IMG fill) IMG-amended subsoils
Treatment, location & bore set
Chloride (mg/L) Dissolved iron (Fe, mg/L)
Deep IMG zone Non-IMG fill Deep IMG zone Non-IMG fill
Control 1 – start
(ABSDC1) 125 90 100 38.5 0.32 0.68
Control 1 – mid
(ABSDC2) 55 50 No bore 5.80 0.57 0.57
Amended 1 – start
(ABSDT1) 25 35 15 5.50 0.20 2.05
Amended 1 – mid
(ABSDT2) 35 40 No bore 8.40 1.67 No bore
Amended 2 – mid
(ABSDT3) 70 40 45 0.24 0.02 0.03
Amended 3 – start
(ABSDT5) 30 20 No bore 0.74 0.14 No bore
Amended 3 – mid
(ABSDT4) 86 45 35 4.75 0.21 0.04

Table 3: Average total and dissolved phosphorus in groundwater below (deep), within (IMG zone) and adjacent to (Non-IMG fill) IMG-amended subsoils when groundwater was interacting with drains in 2014
Treatment & location Total P (mg/L) Dissolved P (SRP, mg/L)
Deep IMG zone Non-IMG fill Deep IMG zone Non-IMG fill
Control 1 – start
(ABSDC1) 0.013 0.008 0.047 < 0.005 < 0.005 < 0.005
Control 1 – mid
(ABSDC2) 0.019 0.040 No bore < 0.005 < 0.005 No bore
Amended 1 – start
(ABSDT1) 0.555 0.040 0.720 0.49 0.013 0.585
Amended 1 – mid
(ABSDT2) 0.03 0.021 No bore 0.011 0.014 No bore
Amended 2 – mid
(ABSDT3) 0.014 0.006 0.016 < 0.005 < 0.005 < 0.005
Amended 3 – start
(ABSDT5) < 0.005 0.005 No bore < 0.005 < 0.005 No bore
Amended 3 – mid
(ABSDT4) 0.040 0.016 0.010 0.025 0.01 < 0.005

Table 4: Average total and dissolved nitrogen fraction in groundwater below (deep), within (IMG zone) and adjacent to IMG-amended subsoils when groundwater was interacting with drains in 2014
Treatment & location
Total N (mg/L) NOx (mg/L) Soluble organic N (mg/L)
Deep IMG zone
Non-IMG fill
Deep IMG zoneNon-IMG
fill Deep
IMG zone
Non-IMG fill
Control 1 – start
(ABSDC1) 2.8 11.5 19.5 0.02 9.5 17.3 1.1 1.5 1.3
Control 1 – mid
(ABSDC2) 2.8 9.7 No bore 0.5 7.8 No bore 0.7 1.2 No bore
Amended 1 – start
(ABSDT1) 5.9 8.6 10.0 0.1 5.1 0.8 2.1 1.5 2.8
Amended 1 – mid
(ABSDT2) 9.8 7.8 No bore 3.7 5.1 No bore 3.4 1.4 No bore
Amended 2 – mid
(ABSDT3) 3.2 3.2 11.4 2.0 2.70 11.0 0.8 0.5 0.6
Amended 3 – start
(ABSDT5) 1.0 18.8 No bore 0.08 17.2 No bore 0.7 0.8 No bore
Amended 3 – mid
(ABSDT4) 4.2 15.5 20.0 1.1 15.0 16.9 1.5 0.4 1.3
Water Science Technical Report no. 78 Amendment of subsoil drains in an urban development
22 Department of Water
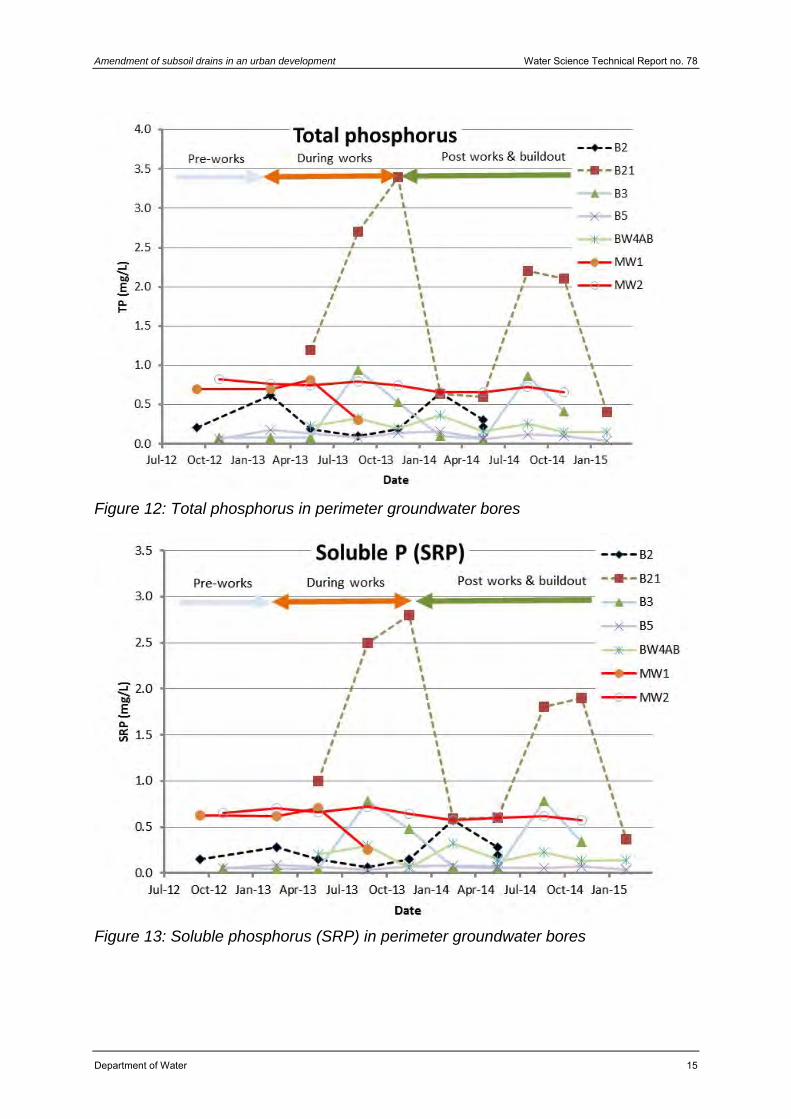
Shallow groundwater became more alkaline and enriched in calcium and sulfate following development. Groundwater pH ranged between 6.6 and 6.9 with an alkalinity of 360 to 640 mg CaCO3/L within the developed area compared with a pre-development pH of 4.0 to 6.7 and alkalinity of less than 120 mg CaCO3/L in the perimeter bores. This change also corresponded with much higher calcium and sulfate concentrations in the developed area. Concentrations of SO4 in groundwater interacting with IMG-amended subsoils (b bores) were typically similar to those in deeper (a bores) or shallow groundwater (c bores) in non-amended subsoils (Figure 17), although the Cl:SO4 ratio for all groundwater was consistently lower than rainfall indicating enrichment of SO4. This was probably because of ASS oxidation during the development process and was evident most clearly in bore B5. The Cl:SO4 ratio of groundwater in this bore decreased from near rainfall values of 2 to 5 pre-development to values < 0.8 post-development, indicating SO4 concentrations similar to and or exceeding Cl concentrations.
Figure 17: Concentrations of sulfate in groundwater interacting with IMG-amended soils (red points and lines) in relation to adjacent deep and shallow groundwater
The effects of the IMG amendment in reducing soluble P and organic N in subsoil drain discharge were evident in drain flows at peak groundwater levels (Table 5). Flow in amended drains generally had lower concentrations of these nutrient fractions compared with controls (non-amended drains). These were greatest in the later stages of the development (Amended 4) where concentrations of soluble P (SRP) were more than 100-fold less than the 3.6 mg P/L in control drains (Table 5). Dissolved organic N concentrations were also lower in the amended subsoil drains,
0
200
400
600
800
1000
1200
1400
1600
Jan‐14 Mar‐14 May‐14 Jul‐14 Sep‐14 Nov‐14 Jan‐15
SO4concentration (mg/L)
Date
T1a
T1b
T1c
T2a
T2b
T3a
T3b
T3c
Range of concentrationsin untreated subsoils (shaded area)

Amendment of subsoil drains in an urban development Water Science Technical Report no. 78
Department of Water 23
but to a lesser extent (Table 5). The effects of poor mixing of the IMG in the amended drains on Bradstocks Grove (amended 3) were also evident with higher soluble P and organic N concentrations compared with other treated drains.
Table 5: Nutrient concentrations and selected metals at subsoil drain discharge points during peak groundwater levels in September 2014
Drain Total P
Soluble P (SRP)
Total NSoluble organic
N NOx
Fe (total)
Soluble Mn
---------------------------- (mg/L) ---------------------------------------
Control 1 – Ruskin
(ABSDP5) 0.013 < 0.005 6.3 0.71 4.4 0.14 0.015
Amended 1 – Millway
(ABSDP1) 0.030 0.021 10.0 0.43 7.6 0.26 1.4
Amended 2 – Bradstocks (ABSDP3)
0.016 < 0.005 5.4 0.39 5.0 0.56 0.07
Amended 3 – Bradstocks (ABSDP6)
0.140 0.083 12.0 1.90 9.3 0.33 0.35
Control 4 – Stage 4
(ABSDP7 4.4 3.6 25.0 3.5 14.0 1.1 0.22
Amended 4 – Stage 4
(ABSDP8) 0.024 0.012 3.1 2.2 0.8 0.045 0.04
High concentrations of nitrate (> 4.4 mg/L) were discharged from all drains, reflecting the concentrations in the shallow groundwater. This contributed significantly to the much higher total nitrogen discharge from the drains (Table 5) than was detected in pre-development monitoring of groundwater in the perimeter bores (see Section 4.2). Concentrations of other relevant constituents, such as iron or manganese, in amended and non-amended drains were generally similar. Concentrations of trace elements such as Ag, Cd, Hg, Pb and Se for all groundwater and drain samples were below laboratory reporting limits of 0.001 mg/L and well below all environmental or human health guideline limits for non-potable water (Department of Environment Regulation 2014). Similarly, concentrations of As ranged between < 0.001 mg/L and

Water Science Technical Report no. 78 Amendment of subsoil drains in an urban development
24 Department of Water
0.037 mg/L, with similar ranges for Cr, Co, Mo, Ni and Zn. Higher concentrations were generally associated with the non-amended sites compared with the IMG-amended sites, with none exceeding guideline limits for risks to the environment (Department of Environment Regulation 2014).
4.5 Geotechnical properties
The amended sandy subsoils generally had similar properties to that of the non-amended sands with minor detectable differences being due to the slightly finer and clayey composition of the amended materials (Appendix C).
The percentage of fine particles (< 75 µm which includes silt and clay fractions) was higher in the amended materials than in the non-amended sands (Table 6). However, the modified maximum dry density (MDD) of each material was similar, ranging from 1.73 to 1.80 t/m3. This corresponds with an acceptable value for on-site compaction of 1.7 t/m3, being 95% of MDD.
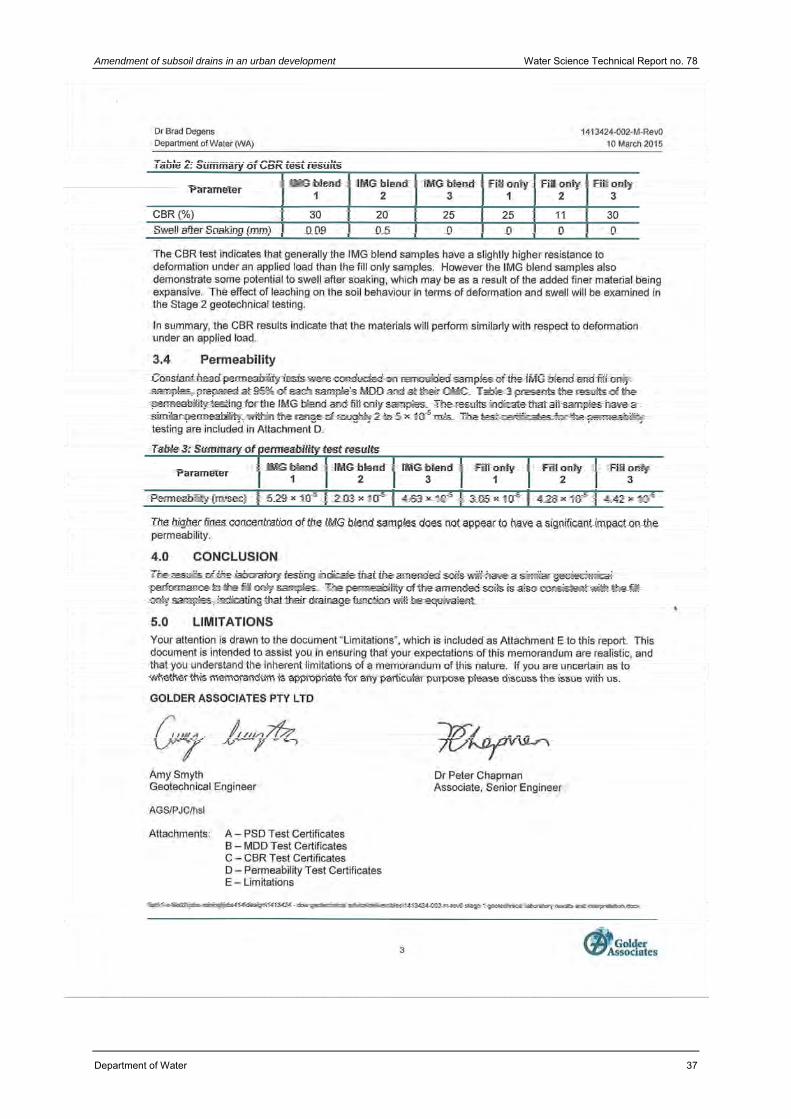
Load testing (using the CBR) indicated that amended sands have slightly greater resistance to deformation than non-amended sands under a load equivalent to the overburden sands at the site (Appendix C). The CBR of the amended sands ranged from 20 to 30% whereas the non-amended sands ranged from 11 to 30% (Table 6). The amended sands swelled slightly during testing, but this was also not significant.
Permeability tests of repacked soils found no difference between the amended and non-amended sands indicating no significant effect of the added fine materials on hydraulic properties.
Table 6: Summary results for geotechnical test results for IMG-amended and non-amended fill materials
IMG-amended sand fill Non-amended sand fill
Average Range1 Average Range1
Fines (% by weight < 75 µm)
7 6–8 3 2–3
Maximum dry density (MDD; t/m3)
1.77 1.74–1.80 1.75 1.73–1.77
CBR (%)2 25 20–30 22 11–30
Permeability (m/day) 3.4 1.8–4.6 3.4 2.6–3.8
1 Range for 3 independent samples from different mixed batches or fill deliveries to site
2 CBR = California Bearing Ratio which is the pressure required to penetrate a soil relative to a
standard material (California Limestone) where > 80% is crushed rock, soft soil < 10% and sands are
generally > 10%.

Amendment of subsoil drains in an urban development Water Science Technical Report no. 78
Department of Water 25
Extended leaching of IMG-amended soils (blends) with water resulted in changes in hydraulic conductivity and settling that were no different from non-amended (control) soils. Tap water was allowed to leach through subsamples of the mixed blends and fill soils used in the Abingdon development. The samples were compacted into cores to a density similar to the compaction used on the Abingdon site and leached while held under a load simulating the sand pressure over the amended drain in the field (see Appendix D for details).
The hydraulic conductivity increased in most IMG-amended and non-amended control soils during the first 200 pore volumes and stabilised thereafter with continued leaching (Appendix D). The increase ranged from 7 x 10⁻⁵ to 1.2 x 10⁻⁴ m/s (2 to 20 m/day) with final permeability of all samples exceeding 5.5 x 10⁻⁵ m/s (4.7 m/day) which was greater than the original test results.
All samples settled less than 4 mm during the testing with no difference between the IMG-amended and non-amended soils (Appendix D).
The tested leachates showed that most soluble materials in the IMG-amended soils were leached in the first 200 pore volumes (Appendix D). The electrical conductivity of the leachates from the IMG-amended soils were initially higher than that of the non-amended samples decreasing to a level similar to that of the non-amended samples after 150 pore volumes. The greater conductivity was also associated with raised concentrations of Ca and SO4 in the leachate in ratios corresponding with dissolution of gypsum from the IMG amendment (data not shown).

Water Science Technical Report no. 78 Amendment of subsoil drains in an urban development
26 Department of Water
5 Discussion IMG-amended subsoil drains were effective in treating soluble P (SRP) in groundwater in the first year following development, with additional benefits of reducing dissolved organic N concentrations. The 10% IMG amendment decreased soluble P concentrations in groundwater by up to 97% during the first 6 months of flows. The 0.5–3.5 mg soluble P/L in groundwater was lowered to < 0.015 mg soluble P/L resulting in subsoil drain flows of < 0.02 mg soluble P/L for the single flow event captured. Additional benefits were also seen in the reduction of dissolved nitrogen concentrations by more than 25% as a result of dissolved organic materials being adsorbed from the groundwater. Long-term P adsorption capacity of the IMG remains uncertain, but is likely to be more than four years if adsorption behaves as in previous trials (with 5% IMG in a topsoil; Douglas et al. 2012).
The performance of the IMG depended on ensuring that mixing and construction are according to design. Management controls during civil works are required to ensure that IMG is adequately mixed using a rotary hoe or equivalent before placement. Visual evidence of mixing has been used in the absence of on-site tests to verify that optimum mixing has been achieved. A suitably mixed batch is evident from the even brown colour seen when the IMG is uniformly distributed in the sand. Poor mixing using an excavator bucket prior to placement in one of the amended drain sections (amended drain 3 on Bradstocks Grove) resulted in very limited capacity to treat shallow groundwater interacting with the subsoil drains. The mix was mostly the same light yellow as the source sand and the IMG remained as irregular 2–10 mm clusters through the sand. The treatment’s effectiveness relies on even mixing of IMG through each batch of sand fill used for the amended subsoil drains as an uneven distribution risks untreated groundwater bypassing the IMG material rather than being forced to travel through and contact the material.
Factors such as the moisture content of the IMG at the time of mixing and mixing larger batches are likely to be important. Mixing IMG at high moisture content (as often occurs with material delivered or stockpiled in winter) requires significant energy to overcome ‘balling’ and poor incorporation. Similarly, if the material dries too much, significant energy is required to shatter and mix in the small hard clusters that form. Mixing larger batches may also result in unequal blending because of the larger area of spread for mixing on a pad and the greater risk of unequal incorporation through the batch. Larger batches in the order of more than 10 m3 should be blended using equipment where the IMG can be added progressively to each cubic metre of sand fill rather than added bucket by bucket to a large amount of sand fill.
The longevity of nutrient removal from groundwater by the IMG mix depends on how quickly the retention mechanisms are saturated or exhausted. Retention of soluble P (as phosphate) occurs by a combination of precipitation as calcium minerals (e.g. hydroxy-apatite) aided by gypsum dissolution and adsorption on fine grained iron oxide minerals (Douglas et al. 2012). Similarly, retention of dissolved organic N is likely to be by adsorption to iron oxides (Douglas et al. 2012). Column investigations indicated that the relative importance of the mechanisms changes during the life of

Amendment of subsoil drains in an urban development Water Science Technical Report no. 78
Department of Water 27
the IMG and is dependent on pH within the material. Dissolution of gypsum combined with higher pH conditions (generally pH > 7) in IMG mixes creates conditions for hydroxy-apatite precipitation and also exposes mineral surfaces to enable adsorption mechanisms.
The long-term stability of the iron oxide minerals and maintenance of higher pH is critical to continued retention of soluble P and organic N. The first year of monitoring indicated there is no risk of iron oxides being dissolved with generally oxidising conditions prevailing in the shallow groundwater. The base of the amended material remained submerged in shallow groundwater and it was clear that fresh, oxygenated recharge from soak wells and stormwater pits across the development increases the depth of the oxic groundwater zone in the shallow aquifer. The shallow groundwater within at least 1 m of the watertable was typically anoxic before the development in the perimeter bores with shallow inlets and persisted deeper in the aquifer following development as found in the deeper ‘a’ bores. Mixing of the oxic shallow groundwater with the deeper anoxic groundwater is likely with radial flow towards the subsoil drains but is not expected to create anoxic zones within the IMG-amended zone.
Groundwater pH in the amended zones varied 6.6–6.9 which is marginally below where retention of soluble P by precipitation as Ca-phosphate minerals may be less important. Preliminary calculations using the geochemical code PHREEQC indicated that groundwater within the IMG mix was not likely to precipitate Ca-phosphate minerals such as hydroxy-apatite unless the pH exceeds 7. This has previously been reported for other IMG mixes (Douglas et al. 2012). Blending with materials such as calcined magnesia to raise the pore-water pH above 7, as has been trialled previously (Douglas et al. 2012) could be considered for future blends to improve the P adsorption capacity of the material. Further analysis is required using geochemical modelling of the data to explore likely mechanisms of nutrient retention through the life of the IMG blend over at least 3–4 years.
Shallow groundwater across the site is influenced by the limestone bed placed beneath the sand fill and incorporated to treat disturbed ASS materials (where deep sewerage main was constructed). This has inadvertently resulted in buffering groundwater to more than pH 6.5, compared with pre-development groundwater, with neutralisation of ASS raising concentrations of calcium and sulfate. Limestone was used to primarily provide a working base for earth-moving equipment and trucks when the fill was brought to the site and it can be considered in other developments to improve water quality, particularly where pre-development low groundwater pH has developed from acid sulfate soil oxidation.
Previous modelling of shallow groundwater discharge from urban developments in the area indicates accelerated discharge of pre-development nutrients in groundwater for 2–4 years after development (Barron et al. 2013). While initial results indicate optimal performance of the amendment, a further 4 years of monitoring is necessary to confirm the continued reduction and retention of soluble P and dissolved organic N by the amended subsoils over the longer term and whether oxic groundwater conditions persist across the site to preserve the retained nutrients.

Water Science Technical Report no. 78 Amendment of subsoil drains in an urban development
28 Department of Water
Initial indications are that the IMG mix does not increase the risk of iron clogging. Little dissolved iron was found in the amended materials or surrounding shallow groundwater but concentrations were up to 10 times greater in deeper groundwater beneath the drains.
The drains flowed intermittently during the first 10 months of monitoring, reflecting rapid wetting up of the site after construction but the groundwater hydrology has yet to stabilise. Automated water-level loggers recorded groundwater rise of more than 1 m between May and July with intermittent flow following rain events after August.
Monitoring indicates that nitrogen concentrations, particularly nitrate, increase after development. The drains discharged up to 14 mg/L nitrate which came from shallow groundwater containing up to 25 mg/L and is probably leached from the fill materials. Recharge results in some of the nitrate reaching deeper groundwater in mid-winter but most is within a few metres of the watertable. IMG does not treat this and oxic conditions in the shallow groundwater do not promote conditions for nitrate removal by denitrification.
Large variations in nutrient concentrations across the site after development indicate broad blanket rather than strategic amendments and nutrient treatments are more appropriate. Variations result from previous land-use footprints and up-gradient nutrient contamination combined with the effects of civil engineering works (dewatering and backfilling for constructing deep sewerage) and recharge through the fill. Soluble P concentrations in groundwater varied more than 20-fold across the site following development. Dewatering for the deep sewerage line has probably exacerbated this, resulting in no soluble P remaining after development in some areas because the shallow groundwater removed was replaced by deeper lower P groundwater.
Geotechnical tests of the amended soils indicate these behave similarly to standard fill, even when subject to extended leaching to remove all soluble gypsum. The amended soils could be considered suitable for widespread incorporation into shallow sands beneath the fill with no risk of uneven settlement compromising house foundations, roads, pavements or any other surface structures.
5.1 Recommendations for amending subsoil drains
IMG blended with sand fill at 10% can be considered as an amendment for subsoil drains to address legacy soluble P and organic N in shallow groundwater interacting with the drains in urban developments.
Successful treatment with IMG blends depends significantly on ensuring effective blending with sand fill before placement and compaction to 95% maximum dry density.
IMG can be considered for use with shallow groundwater in areas where recharge to groundwater creates persistent oxic conditions in the shallow aquifer.

Amendment of subsoil drains in an urban development Water Science Technical Report no. 78
Department of Water 29
Sand fill amended with 10% IMG can be used as layers beneath sand fill with no risk of uneven settlement beneath house foundations, pavements or other surface structures.
Where shallow groundwater remains in an oxic state, IMG can be strategically blended with the base of the sand fill to address nutrient inputs beneath lawns and public open spaces.
5.2 Recommended further work
Continue monitoring trial bores focusing on the period when groundwater interacts with the subsoil drains to confirm the longevity and stability of the treatment media and confirm trends in groundwater quality.
Confirm P retention mechanisms in the amended materials by geochemical modelling of groundwater chemistry combined with coring and chemical analysis of amended materials.
Estimate the in-situ maximum P adsorption capacity of the IMG mix using mass balance and flux calculations when monitoring indicates saturation of the media.
Measure drain flows where it is possible to install narrow profile Doppler flow meters to assess treated fluxes in subsoil drains.
Explore options for a field assessment method that enables improved specification of the mixing of the IMG with sand fill.

Water Science Technical Report no. 78 Amendment of subsoil drains in an urban development
30 Department of Water
Appendices

Amendment of subsoil drains in an urban development Water Science Technical Report no. 78
Department of Water 31
Appendix A — IMG and sand fill characterisation
Mineral composition – Quantitative XRD analysis (% by weight)
Mineral Sand fill (n=6, 2 stages)
IMG (n=6, 2 batches)
10% IMG‐sand blend (n = 12, 2 batches)
Quartz 92–98 2–5 87–97
Kaolinite < 2% ND ND
Albite < 1 ND < 1
Orthoclase 1–5 ND 1–6
Calcite < 1 ND < 2
Dolomite < 1 ND ND
Gypsum & Bassanite ND 82–86 1–7
Magnetite/Maghemite ND 12–13 < 1
Major element analysis (% as oxide ) – XRF fused disc after oven drying 105 °C
Element (% as oxide) Sand fill
(n = 6, 2 stages)
IMG
(n = 6, 2 batches)
10% IMG‐sand blend
(n = 12, 2 batches)
SiO2 < 2 < 2 < 2
TiO2 0.2 1.5 0.2
Al2O3 1.6 0.4 1.6
Fe2O3 0.7 28 2
MnO 0 4.3 0.2
MgO 0.1 1.6 0.1
CaO 0.4 25 1.9
Na2O 0.1 0.2 0.1
K2O 0.6 0.1 0.6
P2O5 0 0.1 0
SO3 0 35 2.1

Water Science Technical Report no. 78 Amendment of subsoil drains in an urban development
32 Department of Water
Trace element analysis (ppm) – XRF pressed power after oven drying 105 °C
Element
Sand fill (n=6, 2 stages)
IMG (n=6, 2 batches)
IMG‐sand blend (n = 12, 2 batches)
Ag < 2 < 2 < 2
As 6 8 5
Ba 149 51 145
Bi 3 5 4
Br < 1 < 1 < 1
Cd 3 5 3
Ce 20 150 29
Co < 5 167 14
Cr 314 97 262
Cs 9 11 9
Cu 2 21 3
Ga 3 19 4
Ge 2 < 1 2
Hf < 7 < 7 < 7 I 8 < 7 < 7
La < 14 51 14
Mn 28 31176 2035
Mo 2 3 2
Nb 5 23 7
Nd < 9 43 < 9
Ni < 2 49 3
Pb 18 15 4
Rb 19 7 18
Sb 9 12 9
Sc < 4 < 4 4
Se < 2 2 < 2
Sm < 10 18 14
Sn 14 5 4
Sr 20 874 78
Ta < 6 < 6 < 6
Te < 6 < 6 < 6
Th 14 107 21
Tl 8 10 9
U 2 15 3
V 14 86 18
Y 3 19 4
Yb < 9 < 9 < 9
Zn 5 36 4
Zr 88 39 96

Appendix B — Details of constructed monitoring bores
Bore group ID
Bore label
Street location Drilled
Depth (m)
Total depth from TOC
(m)
TOC to top cover (m)
Screens (mbgl)
Geology of screened interval
ABSDT1
a
Millway Ave, Centre verge of block 1079
6 5.04 0.105 3.0–5.1 Bassendean Sand
b 2.8 2.68 0.1 1.7–2.7 Fill & IMG-Spearwood mix
c 2.8 2.73 0.08 1.7–2.7 Spearwood sand fill
ABSDT2 a
Millway Ave, Centre verge of block 1082
6 4.91 0.1 2.9–5 Bassendean Sand
b 3 2.88 0.115 1.9–2.9 Fill & IMG-Spearwood mix
ABSDT3
a
Bradstocks Grove, Centre verge of block
1055
6 5.58 0.075 3.5–5.6 Backfilled Bassendean Sand
b 3.2 3.17 0.065 2.2–3.2 Fill & IMG-Spearwood mix
c 3.2 3.125 0.065 2.2–3.2 Backfilled Bassendean Sand
ABSDT4
a Bradstocks Grove, Edge of stormwater raingarden on verge
of block 1180
6 4.53 0.135 2.5–4.6 Bassendean Sand
b 2.1 2.08 0.142 1.1–2.1 Fill & IMG-Spearwood mix
c 2.1 2.08 0.097 1.1–2.1 Spearwood sand fill
ABSDT5 a Bradstocks Grove,
Edge of stormwater raingarden on verge of blocks 1167/1182
6 5.22 0.135 3.1–5.2 Bassendean Sand
b 3 2.89 0.14 1.9–2.9 Fill & IMG-Spearwood mix
ABSDC1 a Ruskin Way, Centre 6 5.29 0.07 3.2–5.3 Backfilled Bassendean Sand

Bore group ID
Bore label
Street location Drilled
Depth (m)
Total depth from TOC
(m)
TOC to top cover (m)
Screens (mbgl)
Geology of screened interval
b verge of block 992
2.9 2.9 0.09 1.9–2.9 Backfilled Bassendean Sand
c 2.9 2.89 0.107 1.9–2.9 Backfilled Bassendean Sand
ABSDC2 a Ruskin Way, Centre
verge of block 990 6 5.5 0.06 3.5–5.6 Fill & backfilled Bassendean Sand
b 3.4 3.18 0.055 2.4–3.4 Spearwood sand fill
ABWT1 a Back of No. 76,
Castlewood Parkway 3.7 3.7 0.10 1.5–3.5 Fill & backfilled Bassendean Sand
ABWT2 a Back of lot 1056, no.10 Bradstocks
Grove 4.1 4.0 0.10 2.0–4.0 Fill & backfilled Bassendean Sand
Amendmen
Departmen
Appecomp
nt of subsoil drain
nt of Water
endix Cpared w
ns in an urban de
— Geowith sa
evelopment
otechnicnd fill
cal ass(Golde
essmenr Assoc
Water Scie
nt of IMciates)
ence Technical R
MG blen
Report no. 78
35
nds

Water Science Technical Report no. 78 Amendment of subsoil drains in an urban development
36 Department of Water
Amendment of subsoil drains in an urban development Water Science Technical Report no. 78
Department of Water 37

Water Science Technical Report no. 78 Amendment of subsoil drains in an urban development
38 Department of Water
Appendix D — Assessment of changes in geotechnical properties with extended leaching (by Golder Associates)

Amendment of subsoil drains in an urban development Water Science Technical Report no. 78
Department of Water 39
Dear Sir
INTRODUCTION The Department of Water (DoW) has engaged Golder Associates (Golder) to provide geotechnical advice on laboratory testing and the anticipated geotechnical behaviour of amended soils. The DoW has been funded under the State Government’s Fertiliser Partnership to progress the use of soil amendments in urban settings recognising the statutory role the department has in urban development approvals and drainage advice. The department is currently undertaking a trial of amended fill materials for use as subsoil drains. The use of amended fill aims to reduce nutrient discharge from new urban developments via the installed drainage.
The department has indicated that the amendment materials are a by-product of mineral sand production, known as Iron Man Gypsum (IMG) because these contain up to 13% iron oxide and 85% gypsum. The IMG is mixed with existing sand fill and the blend installed at a depth of ~2 m. This blend contains 3-7% gypsum by weight. A concern that has been raised by the department is the gypsum may dissolve and be leached from the amended soil over time, potentially losing up to 5% of the overall soil volume (i.e. the gypsum component of the amended soil).
This letter provides the results and interpretation of the second stage of geotechnical laboratory testing, carried out on a series of blended samples and control samples, to measure the potential loss of material and change in hydraulic conductivity due to dissolution of the gypsum through extended leaching. The first stage of laboratory testing, comprising geotechnical classification testing of the samples, is presented in our letter, reference 1413424-002-L-Rev0, dated 10 March 2015. Further testing on the samples collected as part of the Stage 2 geotechnical testing is planned by the DoW.
LABORATORY TESTING The objective of the Stage 2 testing was to identify the extent of leaching of the blended materials and any changes in geotechnical properties when water (in this case, Perth tap water) is passed through the materials. This was achieved through a modified constant head coefficient of permeability (hydraulic conductivity) test, which allowed for upward flow through the sample, which was carried out in general accordance with Australian Standard AS 1289 6.7.3.
Seven samples were tested in total: four blended samples and three control (sand) samples. Golder outlined a recommended approach in our letter reference 1413424-003-L-Rev0 dated 11 March 2015. The approach adopted was consistent with that recommended, with minor adjustments carried out in consultation with the department. The following approach was undertaken:
Each sample was placed in a cylindrical mould (258 mm diameter, ~250 mm height, containing a sample ~120 mm in height) capable of allowing continuous flow through the sample at constant head and under a load of ~40 kPa (equivalent to about 2 m), with capability to measure hydraulic conductivity at discrete stages. The configuration is shown in Figure D1.
23 July 2015
Document No. 1413424-004-L-Final
Dr Brad Degens Department of Water (WA) The Atrium 168 St Georges Terrace PERTH WA 6000
RESULTS AND INTERPRETATION OF STAGE 2 LABORATORY TESTING LEACHING BEHAVIOUR OF BLENDED FILL MATERIAL

Water Science Technical Report no. 78 Amendment of subsoil drains in an urban development
40 Department of Water
Dr Brad Degens 1413424-004-L-Final
Department of Water (WA) 23 July 2015
Figure 18: Testing apparatus
Each sample was placed at ~95% of the sample’s modified maximum dry density (MMDD), prepared at about the optimum moisture content (OMC), based on the Stage 1 laboratory testing.
The pore volume of each sample was calculated, based on the placed dry density and volume of the mould. This allowed the flow rate to be calculated to flush through 50 pore volumes over about 6 hours. The head applied to the sample was then adjusted to meet the flow rate requirements (~0.3 L/min or 5 × 10⁻⁶ m3/s, equivalent to a vertical flow velocity of about 1 × 10⁻⁴ m/s).
The hydraulic conductivity of the sample was measured after the sample was saturated over ~10 minutes, and then water was allowed to flow through the sample over a period of about 6 hours. At the end of flushing, the sample hydraulic conductivity and sample length (for settlement) were measured under the applied loading of ~40 kPa (equivalent to about 2 m of overburden) and a 1 L flushed water sample was collected. The electronic conductivity (EC) of the water was measured with a Hach HQ40D EC meter calibrated with two conductivity solutions (84 µs/cm and 2760 µs/cm, at 25°C). The TDS of the water used in the testing (Perth tap water) was also measured for comparison.
The process was completed until 300 pore volumes had been passed through the sample. At that point, preliminary results were provided to the DoW and an additional 50 pore volumes (one stage) was requested by the DoW.
Header Tank applying
Constant Head
Load Applied
Inflow from Header Tank
Overflow
Permeability Mould

Amendmen
Departmen
Dr Brad De
Departmen
The infointerpret
RESUL
The follo
The
Me
Me
Methe
Set
Flowhou
Table D
Sample
Blend 1
Blend 2
Blend 3
Blend 4
Control 1
Control 2
Control 3
Figure 19
nt of subsoil drain
nt of Water
egens
nt of Water (WA
rmation colleted results ar
LTS
owing informa
e pore volum
asured hydra
asured EC a
asured EC o tap water in
ttlement as a
w rate calcuurs.
1: Pore volu
e ID Pore
2
2
2
2
1 2
2 2
3 2
9: Measured h
ns in an urban de
A)
ected during re presented
ation was pro
me for each s
aulic conduc
at each pore
of tap water uncreased for
a percentage
lations, indic
umes for eac
Volume
2.2 L
2.0 L
2.1 L
2.0 L
2.0 L
2.1 L
2.1 L
ydraulic cond
evelopment
the laborato in subseque
ovided in spr
ample
ctivity at each
volume – se
used to test eControl 3.
e of sample le
cating the 50
ch sample
uctivity values
ry testing waent sections
readsheet fo
h pore volum
ee Figure D3
each sample
ength at eac
pore volume
s for each stag
as provided iof this letter.
orm for each
me – see Figu
.
e – included o
h pore volum
es were deliv
ge
Water Scie
n spreadshe
sample:
ure D2.
on Figure D3
me – see Figu
vered within t
ence Technical R
1413424-
2
eet form. The
3. Note: the
ure D4.
the timefram
Report no. 78
41
004-L-Final
3 July 2015
e
EC of
me of ~6

Water Scie
42
Dr Brad De
Departmen
Figure 20
Figure 21
nce Technical R
egens
nt of Water (WA
03: Measured
14: Measured
Report no. 78
A)
EC for each s
settlement for
stage and the
r each stage
tap (input) wa
Amendme
ater values
ent of subsoil dra
ains in an urban d
Departme
1413424-
2
development
ent of Water
004-L-Final
3 July 2015

Amendment of subsoil drains in an urban development Water Science Technical Report no. 78
Department of Water 43
Dr Brad Degens 1413424-004-L-Final
Department of Water (WA) 23 July 2015
DISCUSSION
Hydraulic Conductivity Results
The hydraulic conductivity values were generally in the range of 10-4 m/s to 10-5 m/s. At 50 pore volumes, the hydraulic conductivity values were generally consistent with the range of values measured in the Stage 1 testing. There was no significant difference in hydraulic conductivity noted between the blended samples and the control samples. However, there is a clear trend of increasing hydraulic conductivity for all samples up to about 200 pore volumes, after which the measured values appear to stabilise, with the exception of Control 3. Flushing of fine particles was observed during the initial stages of testing (first 50 pore volumes) and is likely to be a large contributor to the increase in hydraulic conductivity. Dissolution of materials would appear to have less of an influence, as the DoW has advised that the concentrations of major ions were all similar between the 50 and 350 pore volume samples.
The measured hydraulic conductivity values are in the order of 10-4 m/s by the end of the testing.
Electrical Conductivity Results
The EC results for the blended samples all show an elevated EC at 50 pore volumes, rapidly declining by 200 to 250 pore volumes, where the EC values levelled out and approached the EC of Perth tap water. Blends 2 to 4 generally had higher EC values at 50 pore volumes than Blend 1, which was closer to the control samples.
The control samples indicated no significant change in EC, except Control 3, which trended upwards due to an elevated EC in the Perth tap water for that particular sample. The elevated value was present for the Control 3 test only.
Settlement Results
The settlement results indicated a maximum settlement of ~3%, associated with Blend 2 and Control 2. Each of these samples settled ~4 mm during the testing. However, overall there was no significant difference in settlement noted between the blended samples and the control samples. The significance of the settlement would depend on the thickness of the drainage layer placed. It is recommended that appropriate advice is sought from the designers in regards to the potential settlement and the impact on infrastructure.
Visual observations during the testing indicated that a small amount of particles were washed from both the blend and control samples during the initial flushing. The settlement results reflect this, but also show settlement near the end of testing, possibly related to the dissolution of gypsum.
SUMMARY
The Stage 2 laboratory testing indicated no significant difference in hydraulic conductivity or settlement between the blended and control samples, but indicated an initially increasing trend in hydraulic conductivity for all samples tested that stabilised after more than 200 pore volumes. The EC measurements clearly showed a reduction in EC due to flushing, with the EC measurements approaching the EC of Perth tap water within 200 to 250 pore volumes.
The samples collected as part of the testing have been submitted to a laboratory on behalf of the DoW, for further chemical analysis to confirm the dissolved constituents. The results will be interpreted by the DoW separately.

Water Science Technical Report no. 78 Amendment of subsoil drains in an urban development
44 Department of Water
CLOSING REMARKS
We trust that this letter suitably summarised and interpreted the testwork carried out. Please do not hesitate to contact us if you require any further elaboration or clarification.
GOLDER ASSOCIATES PTY LTD
Dr Peter Chapman
Associate, Senior Engineer
PJC/MJM/hsl

Amendment of subsoil drains in an urban development Water Science Technical Report no. 78
Department of Water 45
Shortened forms CBR California bearing ratio
IMG Iron Man Gypsum, the common name for a gypsum and iron oxide rich material produced as a by-product of Iluka’s mineral sand refining
SRP Soluble reactive phosphorus being the free phosphate in water that passes through a 0.45 μm filter membrane
MDD Maximum dry density
TN Total Nitrogen
TP Total Phosphorus
XRD X-ray diffraction, a method for analysing crystalline minerals
XRF X-ray fluorescence, a method for quantifying the concentrations of elements within minerals and soils.

Water Science Technical Report no. 78 Amendment of subsoil drains in an urban development
46 Department of Water
References Appleyard, SJ 1995, ‘Impact of urban development on recharge and groundwater quality in a
coastal aquifer near Perth, Western Australia’, Hydrogeology Journal, vol. 3, pp. 65–75.
Barron, OV, Barr, AD & Donn, MJ 2013, ‘Evolution of nutrient export under urban development in areas affected by shallow watertable’, Science of the Total Environment, vol. 443, pp. 491–504.
Bourke, SA & Paton, A, in prep., Forrestdale Lake: Perth shallow groundwater systems investigation, Hydrogeological Record Series Report No. HG41, Department of Water, Perth.
Davidson, WA & Yu, X 2006, Perth regional aquifer modelling system (PRAMS) model development: Hydrogeology and groundwater modelling, Hydrogeological Record Series, Report No. HG20, Department of Water, Perth.
Department of Environment Regulation 2014, Assessment and management of contaminated sites: Contaminated sites guidelines, Department of Environment Regulation, Perth, Western Australia.
Douglas, G, Adeney, J, Johnston, K, Wendling, L & Coleman, S 2012, ‘Major element, trace element, nutrient, and radionuclide mobility in a mining by-product–amended soil’, Journal of Environmental Quality, vol. 41, pp. 1818–1834.
Gerritse, RG, Barber, C & Adeney, JA 1990, The impact of residential urban areas on groundwater quality: Swan Coastal Plain, Western Australia, CSIRO Water Resources Report Series No. 3, Division of Water Resources, Perth, WA.
GHD 2012, Urban water management plan for the Bletchley Park local water management strategy incorporating the Abingdon urban water management plan, Report for Wallis Property Co. by GHD Pty. Ltd.
He, JZ, Gilkes, RJ & Dimmock, GM 1998, ‘Mineralogical properties of sandy podzols on the Swan Coastal Plain, south-west Australia, and the effects of drying on their phosphate sorption characteristics’, Australian Journal of Soil Research, vol. 36, pp. 395–409.
Swan River Trust 2009, Swan Canning water quality improvement plan, Swan River Trust, Government of Western Australia, 212p.
Wendling, L & Douglas, G 2009, A review of mining and industrial by-product reuse as environmental amendments, CSIRO: Water for a Healthy Country National Research Flagship, August 2009, CSIRO: Perth, Western Australia, 66p.
Wendling, L, Douglas,G, Coleman, S, Yuan, Z & Klauber, C 2010, Investigation of mineral-based by-product reuse for the removal of nutrients and DOC from Swan Coastal Plain surface waters, CSIRO: Water for a Healthy Country National Research Flagship Report, May 2010, CSIRO: Perth, Western Australia, 81p.


8401 30 0314
Securing Western Australia’s water future
Department of Water168 St Georges Terrace, Perth, Western Australia
PO Box K822 Perth Western Australia 6842Phone: (08) 6364 7600
Fax: (08) 6364 7601www.water.wa.gov.au
technical series
10244 30 1016